Embed Size (px)
Citation preview

High Resolution Inspection of Carbon Fiber Materials by Eddy Current Techniques
Henning HEUER, Martin H. SCHULZE, Norbert MEYENDORF
a Fraunhofer Institute for Non Destructive Testing (IZFP) Maria Reiche Straße 2, Germany, 01109 Dresden
Abstract. Carbon fiber materials become more and more important for many applications. Unlike metal the technological parameters and certified quality control mechanisms for Raw Carbon Fiber Materials (RCF) have not yet been developed. There is no efficient and reliable testing system for in-line inspections and consecutive manual inspections of RCF and post laminated Carbon Fiber Reinforced Plastics (CFRP). Based upon the multi-frequency Eddy Current system developed at Fraunhofer IZFP, structural and hidden defects such as missing carbon fiber bundles, lanes, suspensions, fringes, missing sewing threads and angle errors can be detected. Using an optimized sensor array and intelligent image pre-processing algorithms, the complex impedance signal can be allocated to different carbon fiber layers. This technique enables the detection of defects in depths of up to 5 layers, including the option of free scale measuring resolution and testing frequency. Appropriate parameter lists for optimal error classifications are available. The dimensions of the smallest detectable flaws are in the range of a few millimeters. Algorithms and basic Eddy Current C-Scan processing techniques for carbon fiber material testing are described in this paper.
1 INTRODUCTION
Carbon fiber materials become increasingly important in many applications. Unlike metal, the technological parameters and certified quality control mechanisms have not yet been developed. There is no efficient and reliable testing system for in-line inspections, consecutive manual inspections of the Raw Carbon Fiber materials (RCF) or post laminated Carbon Fiber Reinforced Plastics (CFRP) currently available. Hidden defects that arise during production may have far-reaching consequences with high-risk of damage progression and even increased costs as products have to be discarded after machining. Typical defects (Figure 1[a] – [c]) are missing bundles, lanes caused by overlaying or fringes. For mono or bi-axial materials (two layers), surface inspection is currently realized by manual inspection or by an Automated Optical Inspection (AOI). However, some products require more than two layered materials, e.g. three-directional or up to five-directional materials will be used in many future applications. In order to guarantee the highest possible level of quality and reliability (aircraft or space application), new methods for the inspection of hidden RCF or CFRP layers are in demand.
2nd International Symposium on
NDT in Aerospace 2010 - Mo.2.A.3
License: http://creativecommons.org/licenses/by/3.0/
1
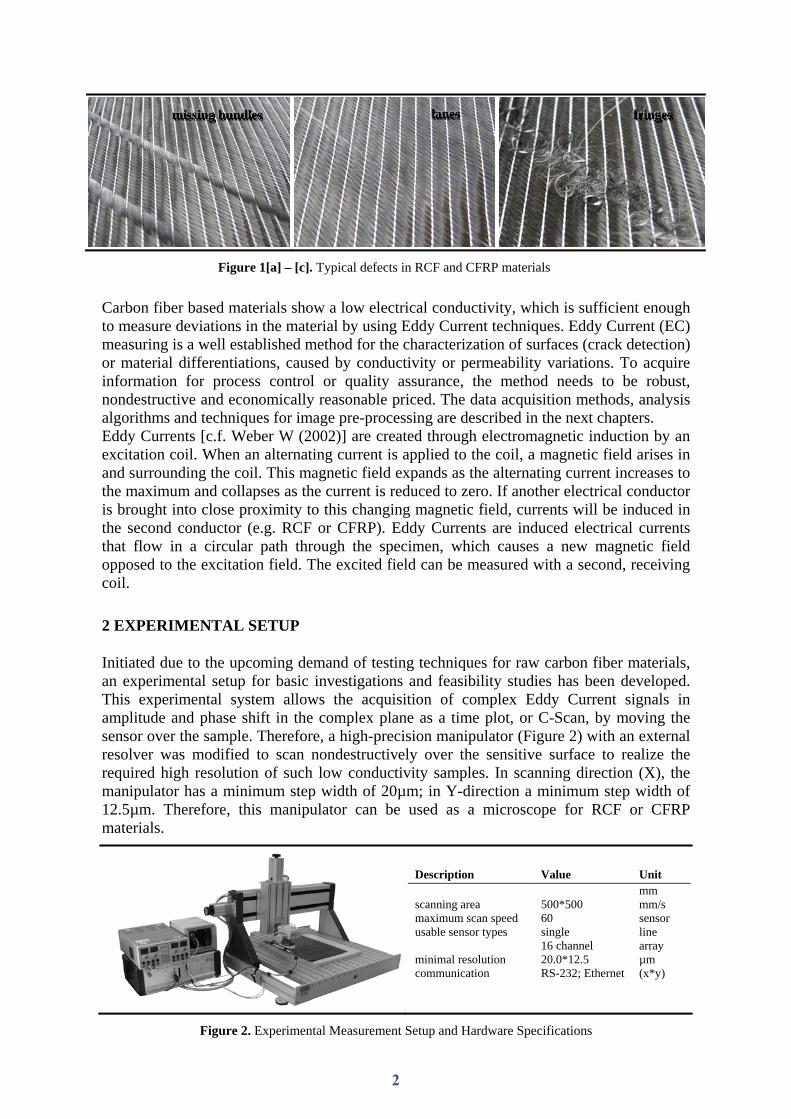
Figure 1[a] – [c]. Typical defects in RCF and CFRP materials
Carbon fiber based materials show a low electrical conductivity, which is sufficient enough to measure deviations in the material by using Eddy Current techniques. Eddy Current (EC) measuring is a well established method for the characterization of surfaces (crack detection) or material differentiations, caused by conductivity or permeability variations. To acquire information for process control or quality assurance, the method needs to be robust, nondestructive and economically reasonable priced. The data acquisition methods, analysis algorithms and techniques for image pre-processing are described in the next chapters. Eddy Currents [c.f. Weber W (2002)] are created through electromagnetic induction by an excitation coil. When an alternating current is applied to the coil, a magnetic field arises in and surrounding the coil. This magnetic field expands as the alternating current increases to the maximum and collapses as the current is reduced to zero. If another electrical conductor is brought into close proximity to this changing magnetic field, currents will be induced in the second conductor (e.g. RCF or CFRP). Eddy Currents are induced electrical currents that flow in a circular path through the specimen, which causes a new magnetic field opposed to the excitation field. The excited field can be measured with a second, receiving coil.
2 EXPERIMENTAL SETUP
Initiated due to the upcoming demand of testing techniques for raw carbon fiber materials, an experimental setup for basic investigations and feasibility studies has been developed. This experimental system allows the acquisition of complex Eddy Current signals in amplitude and phase shift in the complex plane as a time plot, or C-Scan, by moving the sensor over the sample. Therefore, a high-precision manipulator (Figure 2) with an external resolver was modified to scan nondestructively over the sensitive surface to realize the required high resolution of such low conductivity samples. In scanning direction (X), the manipulator has a minimum step width of 20µm; in Y-direction a minimum step width of 12.5µm. Therefore, this manipulator can be used as a microscope for RCF or CFRP materials.
Description Value Unit
scanning area maximum scan speed usable sensor types minimal resolution communication
500*500 60 single 16 channel 20.0*12.5 RS-232; Ethernet
mm mm/s sensor line array µm (x*y)
Figure 2. Experimental Measurement Setup and Hardware Specifications
mmmiiissssss iiinnnggg bbbuuunnndddllleeesss lllaaannneeesss fffrrriiinnngggeeesss
2

The sensors were developed by IFZP Dresden and are optimized for carbon materials. The position triggered Eddy Current system is combined with a multiplexer and a controller unit. The electronics are connected to a LabViewTM control interface via Ethernet, digital I/O ports and RS-232. This setup enables the scanning and measurement of any kind of plate samples as described in the introduction, using a custom-designed high-resolution sensor. The system shown in Figure 3[a] was constructed for a high variability. Different sensor types, such as absolute, differential and compensated sensors can be used for single sensor probing. The optimum single sensor prototype is a directional property sensor with a very high spatial resolution [c.f. Mook G (2008), Yashan A (2006)] due to its high focusing Point-Spread-Function (PSF). The applied sensor (Figure 3[b]) is an absolute half-transmission anisotropic type with a lateral pitch of 3.5mm and about 20 turns, which can be revolved in various measurement angles. The description of the lateral hardware resolution of such a sensor is difficult as its focusing point looks like the density function of a normal probability curve N(0,1). This means that even smallest conductivity and permeability variations like cracks of the affected interactive volume can cause in significant signal changes. Therefore, failures cannot be reliably measured in real-world dimensions and the description of the actual sensor resolution is complex. Fraunhofer IZFP is planning to build a test sample to measure this sensor property by reducing the distance between the two test defects placed close to each other. This space is a feature of the resolution capabilities of the sensor. In fact, anisotropic sensors [c.f. Wuliang Y (2009)] have a variation in resolution due to different measuring angles of the sensor and the use of frequencies in range from 100kHz up to 10MHz. Rotation of the sensor and static measurements with sensor specific sample angles of the RCF or CFRP, improve the separation of different layers enormously.
Figure 3[a]. Sensor mounting kit Figure 3[b]. anisotropic Single Sensor
This sensor principle was utilized to develop a sensor line optimized for carbon materials testing by Eddy Current with 16 individual sensor pairs to increase the measuring cycle speed by parallel measurement.
[[[aaa]]]
[[[bbb]]]
3
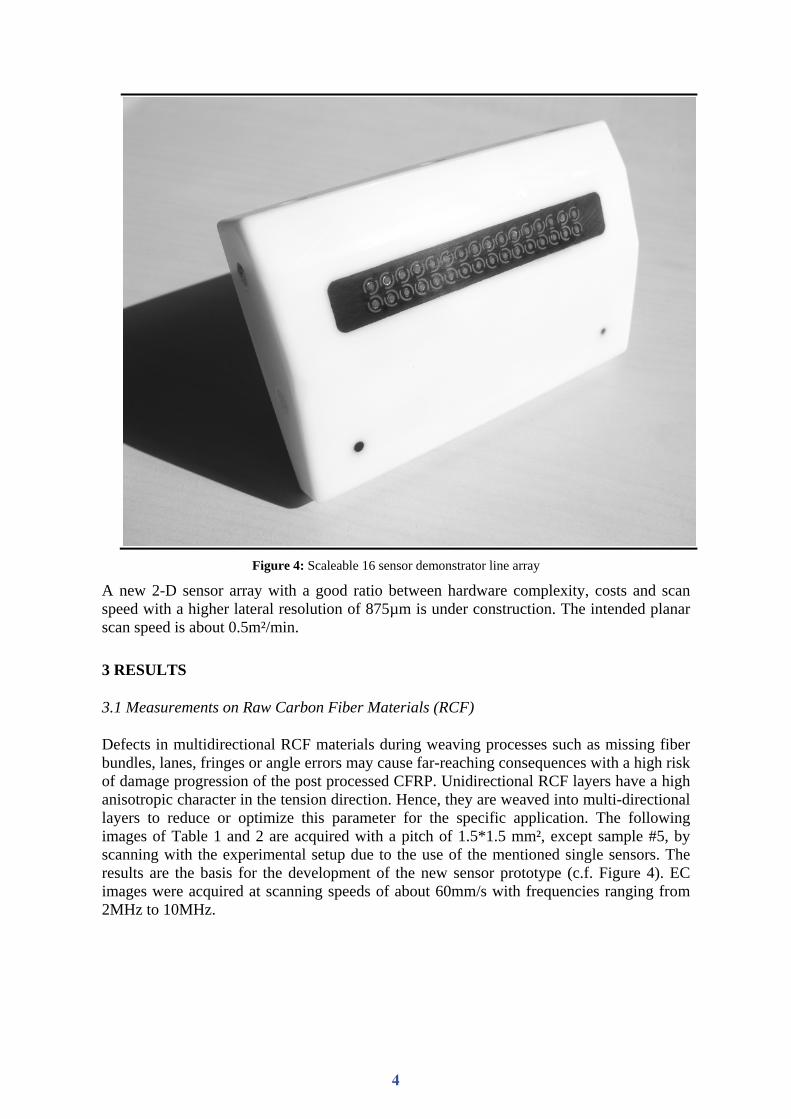
Figure 4: Scaleable 16 sensor demonstrator line array
A new 2-D sensor array with a good ratio between hardware complexity, costs and scan speed with a higher lateral resolution of 875µm is under construction. The intended planar scan speed is about 0.5m²/min.
3 RESULTS
3.1 Measurements on Raw Carbon Fiber Materials (RCF)
Defects in multidirectional RCF materials during weaving processes such as missing fiber bundles, lanes, fringes or angle errors may cause far-reaching consequences with a high risk of damage progression of the post processed CFRP. Unidirectional RCF layers have a high anisotropic character in the tension direction. Hence, they are weaved into multi-directional layers to reduce or optimize this parameter for the specific application. The following images of Table 1 and 2 are acquired with a pitch of 1.5*1.5 mm², except sample #5, by scanning with the experimental setup due to the use of the mentioned single sensors. The results are the basis for the development of the new sensor prototype (c.f. Figure 4). EC images were acquired at scanning speeds of about 60mm/s with frequencies ranging from 2MHz to 10MHz.
4

Table 1. RCF Samples #1, #3 and #4
Sample Picture (1st layer) Picture (3rd layer) EC image (front) EC image (rear)
#1
3 layer RCF with small tapered lanes (compare to Fig.1[b]) in the 1st and 3rd layer, four missing fiber bundles in the 3rd and one horizontal in the 2nd layer – Sample Size [mm]: 210*295
#3
3 layer RCF with 2 missing bundles and 2 lanes in the 1st layer, visible even in rear C-Scan, a small wave is well distinguished - Sample Size [mm]: 275*275
#4
EC image of 1st layer
not acquired
3 layer RCF with missing bundles in the 2nd non-visible layer - Sample Size [mm]: 265*275
Table 2. RCF Sample #5
To show the functionality of high resolution Eddy Current imaging, a so called microscopic Eddy Current image (sample #5) of sample #4 of the marked area was captured. The size of the square scan area is 50*50mm² at a resolution of 78,125µm in both directions. An image with 640*640 pixels is the result. The main defect (dark line from lower left to upper right) is shown very clearly. Also, the non or at most slightly conductive weaving treads are
Sample branded complex EC image of sample #4
#5
High resolution EC images. Even weaving threads are visible. Sample Size [mm]: 50*50
tapered lane
missing bundlesdefect in 2nd layer
lanes
missing bundles small wave
missing bundle high resolution
scan field
weaving threads
5
visible. The distance between the two is about 3,2mm. The angle orientation of the orthogonal fiber bundles can be gauged with the help of an AOI.
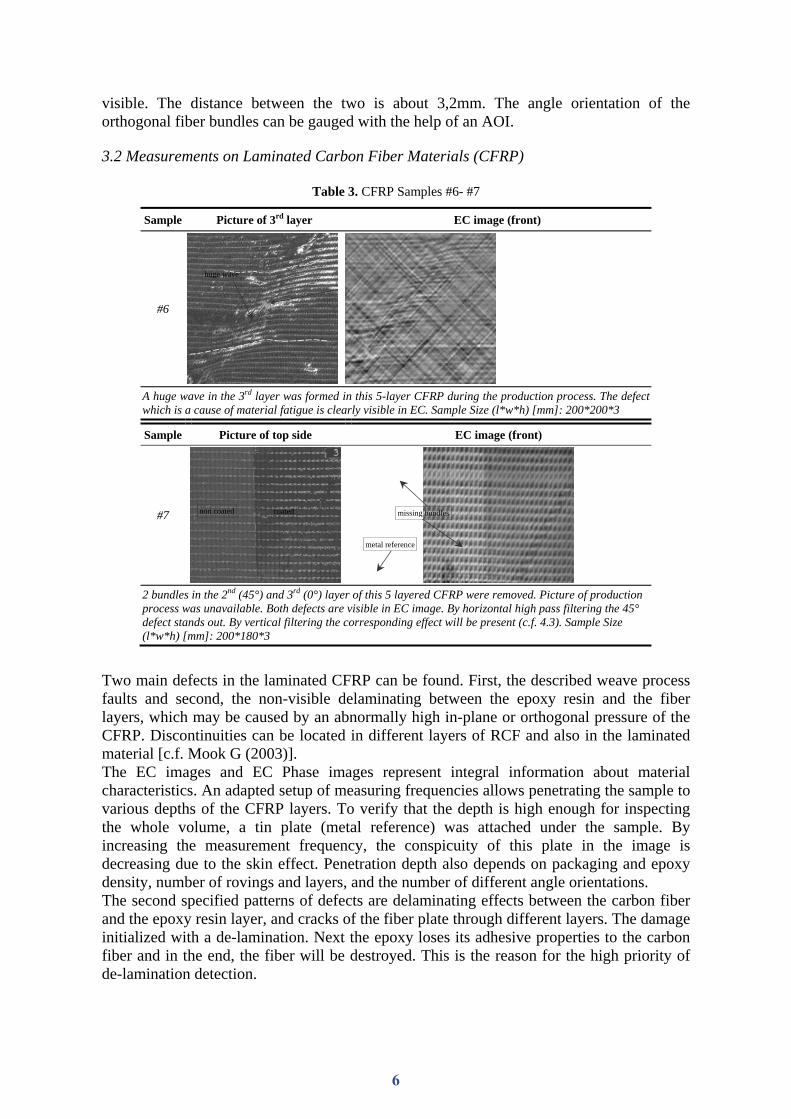
3.2 Measurements on Laminated Carbon Fiber Materials (CFRP)
Table 3. CFRP Samples #6- #7
Two main defects in the laminated CFRP can be found. First, the described weave process faults and second, the non-visible delaminating between the epoxy resin and the fiber layers, which may be caused by an abnormally high in-plane or orthogonal pressure of the CFRP. Discontinuities can be located in different layers of RCF and also in the laminated material [c.f. Mook G (2003)]. The EC images and EC Phase images represent integral information about material characteristics. An adapted setup of measuring frequencies allows penetrating the sample to various depths of the CFRP layers. To verify that the depth is high enough for inspecting the whole volume, a tin plate (metal reference) was attached under the sample. By increasing the measurement frequency, the conspicuity of this plate in the image is decreasing due to the skin effect. Penetration depth also depends on packaging and epoxy density, number of rovings and layers, and the number of different angle orientations. The second specified patterns of defects are delaminating effects between the carbon fiber and the epoxy resin layer, and cracks of the fiber plate through different layers. The damage initialized with a de-lamination. Next the epoxy loses its adhesive properties to the carbon fiber and in the end, the fiber will be destroyed. This is the reason for the high priority of de-lamination detection.
Sample Picture of 3rd layer EC image (front)
#6
A huge wave in the 3rd layer was formed in this 5-layer CFRP during the production process. The defect which is a cause of material fatigue is clearly visible in EC. Sample Size (l*w*h) [mm]: 200*200*3
Sample Picture of top side EC image (front)
#7
2 bundles in the 2nd (45°) and 3rd (0°) layer of this 5 layered CFRP were removed. Picture of production process was unavailable. Both defects are visible in EC image. By horizontal high pass filtering the 45° defect stands out. By vertical filtering the corresponding effect will be present (c.f. 4.3). Sample Size (l*w*h) [mm]: 200*180*3
huge wave
non coated coated
metal reference
missing bundles
6

Table 4. Delamination in CFRP
In sample #8, too high in-plane compressive forces were inducted into the 12 layer CFRP with the angle settings [c.f. Gros X E (1998)] of 2 x 90°/03°/120°/30°/150°/60°. The first six layers are visible in the complex C-Scan image. If there were defects as in sample #6 or #7, they would become visible. The sensor is not optimized for the required frequencies, which are suitable to detect deeper defects. In other words, the chaotic conductivity arrangements that are higher than the lift-off signal that appears by using lower measuring frequencies make it very complex to inspect these deeper areas. This explains why these layers and the real volume extension of the de-lamination might not be complete. Larger sensors with lower resolution but higher penetration depths at higher frequencies were effective (c.f. 3.3).
Sample Picture of Delamination EC image (front)
#8
De-lamination in a 12 layered CFRP combined with some inner material cracks. Signal Optimization due to the use of phase image analysis (c.f. 4.4). Sample Size (l*w*h) [mm]: 100*150*3
delamination
side view of crack
7
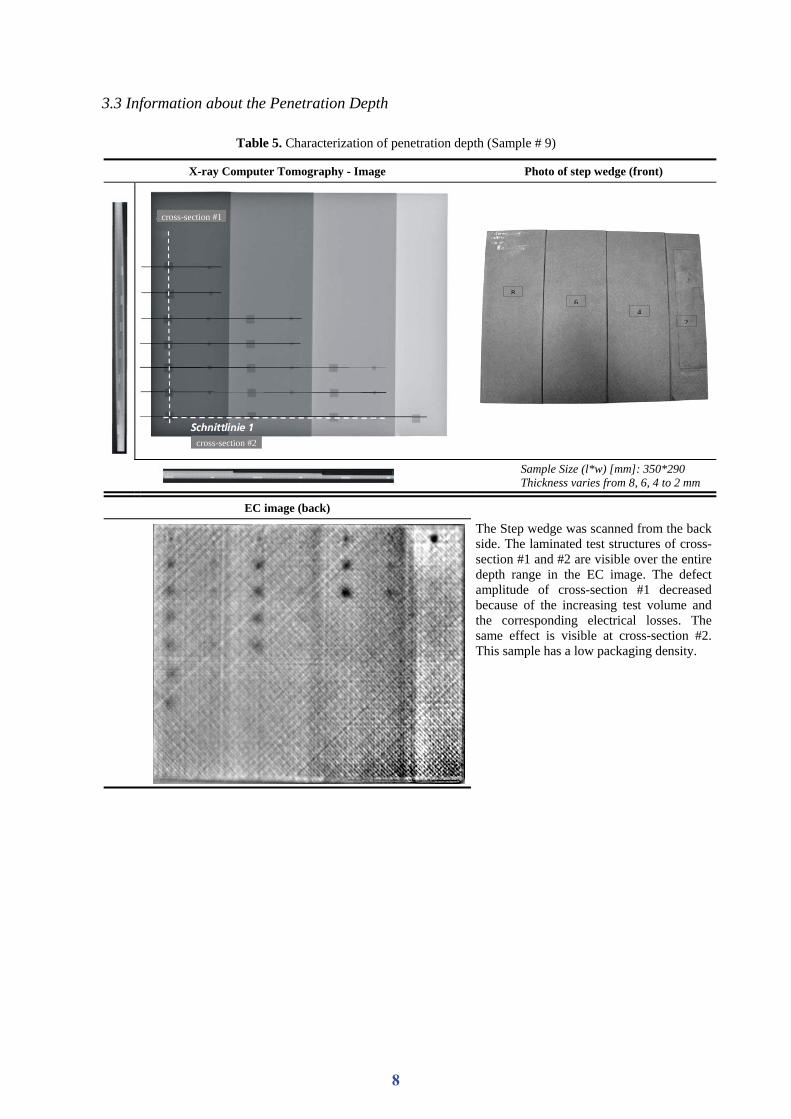
3.3 Information about the Penetration Depth
Table 5. Characterization of penetration depth (Sample # 9)
X-ray Computer Tomography - Image Photo of step wedge (front)
Sample Size (l*w) [mm]: 350*290 Thickness varies from 8, 6, 4 to 2 mm
EC image (back)
The Step wedge was scanned from the back side. The laminated test structures of cross-section #1 and #2 are visible over the entire depth range in the EC image. The defect amplitude of cross-section #1 decreased because of the increasing test volume and the corresponding electrical losses. The same effect is visible at cross-section #2. This sample has a low packaging density.
cross-section #1
cross-section #2
86
42
8
4 ANALYSIS METHODS
4.1 Signal Post Processing
The Eddy Current system has the capability to measure in a multi-frequency operation mode. All results in this paper are acquired in the single-frequency mode because no multi-frequency, two dimensional regression algorithms are yet implemented in the analysis software. This will be part of future work activities in combination with other algebraic calculations. It is anticipated that the signal to noise ratio will be enhanced with this improvement.
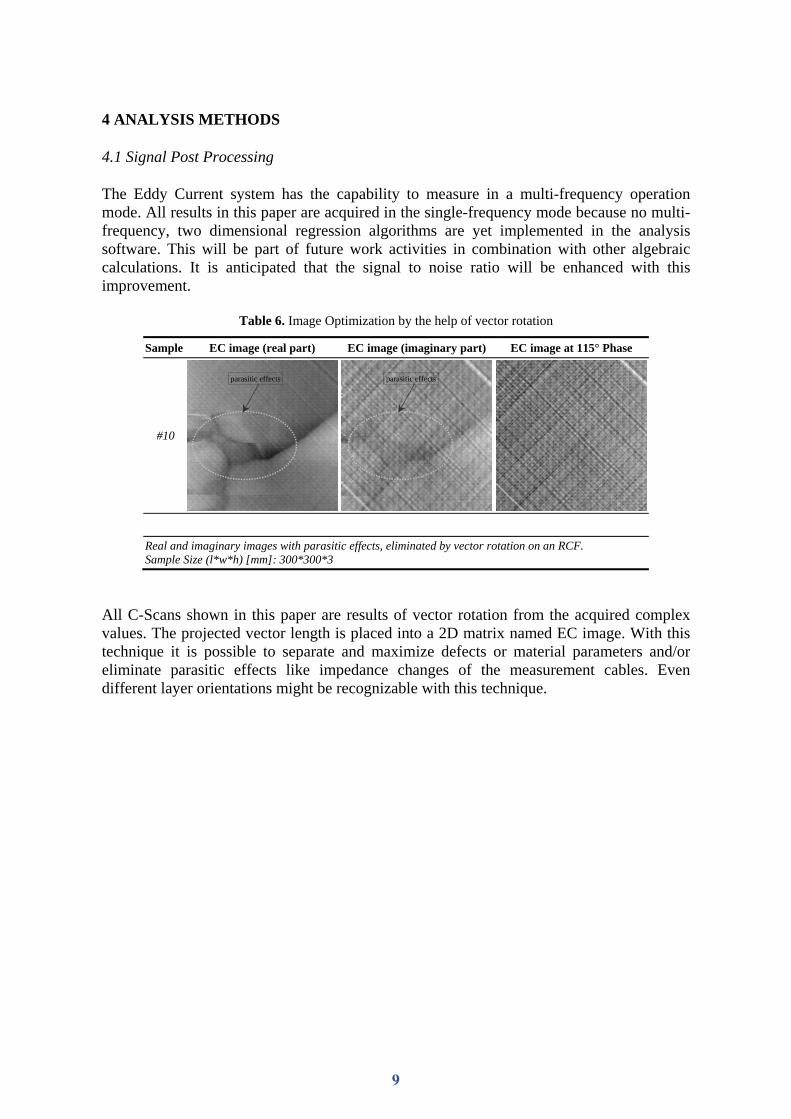
Table 6. Image Optimization by the help of vector rotation
All C-Scans shown in this paper are results of vector rotation from the acquired complex values. The projected vector length is placed into a 2D matrix named EC image. With this technique it is possible to separate and maximize defects or material parameters and/or eliminate parasitic effects like impedance changes of the measurement cables. Even different layer orientations might be recognizable with this technique.
Sample EC image (real part) EC image (imaginary part) EC image at 115° Phase
#10
Real and imaginary images with parasitic effects, eliminated by vector rotation on an RCF. Sample Size (l*w*h) [mm]: 300*300*3
parasitic effects parasitic effects
9

4.2 Value Limiting
Table 7. Image Optimization by value limiting
By reducing the range of complex values, a first error separation can be obtained. The second step in the analysis algorithm chain is image filtering.
4.3 Filtering and Fitting Functions
Table 8. Image Optimization by image filtering
The left EC image was filtered by applying a vertical high-pass filter of sample #7. This technique makes it possible to eliminate the horizontal missing bundle. The defect is clearly revealed. The right low-pass filtered EC image (sample #11) enhances the missing bundles and one fringe (round circle) after reduction of complex values. An optional polynomial fit can further optimize the data.
4.4 Phase Value C-Scan and Absolute Projection
By taking the phase information of the complex values into a 2-D matrix scaled from -180° to 180°, images results are obtained as shown in Table 9. Optional windowing of these values by value limiting can separate errors more efficiently (Image [a]).
Sample EC image at 295° Phase EC image with reduced range of values
#11
No Histogram
10

Table 9. Optimized error amplitudes by using EC Phase image analysis
By calculating the absolute values of the complex raw data, reversed measuring effects can be normalized. It should be noted that there is no practical application or special RCF or CFRP sample available for the implementation of this technique.
4.6 Sensor Angle Image Calculation
Algebraic correlation of EC images at different sensor angles can produce an image with better summary information. The resulting EC image shown in Table 10 is calculated as follows:
452545 IMAGEIMAGEIMAGERESULT
EC-Phase Images of Samples #5 [a], #6 [b] and #8 [c]
[[[aaa]]] [[[bbb]]] [[[ccc]]]
11

Table 10. EC images at different sensor angles
5 CONCLUSIONS
The uses of the described analysis techniques are the basic condition for an easy and fast digital image pre-processing and an in-line inspection process aimed with the scalable 875µm 2-D Array. Today, no commercial scanning test system is available on the market. Aviation and other lightweight industries are potential customers for such systems. Our goal is to build customized systems that meet individual industrial demands. For example, the immediate nondestructive testing of RCF produced by the RCF-Tape super imposer. A further potential application is an online scanner that can scan the RCF online during separation of each part on a cutting table.
EC images of Samples #9 and resulting calculated image
000°°° ---222555°°° ---444555°°° ---666555°°°
+++---999000°°° +++666555°°° +++444555°°° +++222555°°°
rrreeesssuuullltttiiinnnggg IIImmmaaagggeee
12

REFERENCES
[1] Gros X E, Ogi K, Takahashi K (1998) Eddy Current, Ultrasonic C-Scan and Acoustic Microscopy Testing of Delaminated Quasi-Isotropic CFRP Materials. A Case Study, Journal of Reinforced Plastics and Composites 1998 [2] Mook G, Pohl J, Michel F (2003) Non-destructive characterization of smart CFRP structures. Smart Materials and Structures 12 997–1004 - PII: S0964-1726(03)70305-X [3] Mook G, Michel F, Simonin, J (2008) Electromagnetic imaging using probe arrays. 17th World Conference on Nondestructive Testing 25-28 Oct 2008, Shanghai, China [4] Weber W (2002) Zerstörungsfreie Prüfung dickwandiger austenitischer Rohre und Rohrbögen mit fortschrittlicher Wirbelstromtechnik. Dissertation Universität Hannover, Hannover; 2002 [5] Wuliang Y, Withers P J, Sharma U, Peyton A J (2009) Noncontact Characterisation of Carbon-Fiber-Reinforced Plastics using Multifrequency Eddy Current Sensors. Instrumentation and Measurement, IEEE Transactions on, Volume: 58 P.738-743 [6] Yashan A (2008) Über die Wirbelstromprüfung und magnetische Streuflussprüfung mittels GMR-Sensoren. Dissertation am IZFP Saarbrücken 2008 [7] Yashan A, Bisle W, Meier T (2006) Inspection of Hidden Defects in Metal-Metal Joints of Aircraft Structures using Eddy Current Technique with GMR Sensor Array. In: 9th European Conference on NDT - ECNDT Berlin (25-29 Sep 2006), Paper Tu.4.4.4
13