Embed Size (px)
Citation preview

Annu. Rev. Fluid Met". 1994. 26: 137-68 Copyright © 1994 by Annual Reviews Inc. All rights reserved
HIGH RAYLEIGH NUMBER CONVECTION
Eric D. Siggia
Laboratory of Atomic and Solid State Physics, Cornell University, Ithaca, New York 14853-2501
KEY WORDS: turbulence, boundary layer, heat flux, plumes
1. INTRODUCTION
Turbulent convection exemplifies many of the startling aspects of turbulent flows that have been uncovered in the past two decades, but frequently exhibits a novel twist. Thus, as in the case of free shear flows, convection can organize into large-scale vortical structures, but these then react back in subtle ways on the boundary layers which ultimately sustain them. Thermal plumes are a coherent mode of heat transport, analogous to boundary layer bursts, yet their overall effect can be surprisingly close to the structureless predictions of mixing length theory. Convection cells are closed, which facilitates their experimental control, but fluctuations never exit and there is a dynamically determined bulk forcing. While the singlepass mode characteristic of wind tunnel experiments seems simpler, the convection cell is, in ways to be discussed, more constrained.
This review aims to familiarize the turbulence researcher with convergent lines of investigation in convection and also to remind those working in convection that turbulence is not a new subject. To situate convection within the gamut of other turbulent flows, let us by way of introduction contrast the directions in which convection has developed with research on the turbulent boundary layer.
From the onset of convection up to Rayleigh numbers Ra � 1 0 times critical, there is a great wealth of information about flow structures (which can be visualized from above), and their relative stabilities (Busse 198 1 ) . Turbulence, in the sense of many coupled modes, and not just sensitive dependence on initial conditions, can arise for low Ra in large aspect ratio
137 0066--41 89/94/0115-0137$05.00
Ann
u. R
ev. F
luid
Mec
h. 1
994.
26:1
37-1
68. D
ownl
oade
d fr
om w
ww
.ann
ualr
evie
ws.
org
Acc
ess
prov
ided
by
Uni
vers
ity o
f C
alif
orni
a -
San
Die
go o
n 04
/04/
21. F
or p
erso
nal u
se o
nly.

1 38 SIGGIA
systems where it reduces to modulations of the basic cellular patterns (Newell et al 1 993, Cross & Hohenberg 1 993). For Ra 1 02_1 0 3 times critical and beyond, the vertical structure of the flow becomes important and organized motions have received less attention. In conformity with turbulence usage, "high" Ra will be loosely defined by where power-law scaling applies. In this regime mixing length ideas have heavily influenced what is studied. For instance, the behavior of the heat flux with Ra has monopolized attention to a far greater �:xtent than the drag as a function of Reynolds number has dominated studies of the boundary layer. Both measurements are of direct technical importance but neither is local enough to reveal the details of the flow that are essential to advance phenomenological theory.
The recognition of thermal plumes as a coherent component of turbulent convection (Turner 1 973), predates most studies of boundary layer bursts; yet subsequent quantitative studies of plumes have languished by comparison. For instance, Lu & Willmarth (1973) have measured the Reynolds stress (the analogue of the heat flux), conditioned upon the values of the component fields to display the contribution from the bursts. There are no comparable measurements of the local heat flux conditioned on temperature and vertical velocity. As for the nucleation of plumes at the walls, and the relative roles of buoyancy and shear, our knowledge is mostly qualitative, in contrast to the many studies in boundary layers where bursts are triggered and followed downstream.
The salient new feature that has enlivened convection studies in the past 1 0 years, and prompted this review, is the coherent large-scale buoyancydriven circulation that in certain cases can persist to the highest Ra attained in the laboratory (� 1 0 14). This flow modifies, via its shear, the thermal boundary layer, which ultimately is responsible for the heat flux and the buoyancy, thereby posing a subtle self-consistency problem. An incidental consequence of this coupling is that the primitive theoretical tools extant are unable to select between two turbulent states (basically with and without shear), each of which appears internally consistent.
With the decision to review convection as a branch of turbulence comes the restriction to high Rayleigh numbers (and generally large Reynolds number also), and the focus on laboratory experiments in the Boussinesq limit. This is not to minimize the importance of geophysical problems and the recent successes in understanding solar convection (Spruit et al 1990). However, most progress in ordinary turbulence has been achieved through precisely controlled laboratory experiments and visualizations. Since, for the reasons alluded to, convection involves subtle competitions, laboratory investigations are essential, and the need for this review would not have arisen without them. Non-Boussinesq convection is not one problem but
Ann
u. R
ev. F
luid
Mec
h. 1
994.
26:1
37-1
68. D
ownl
oade
d fr
om w
ww
.ann
ualr
evie
ws.
org
Acc
ess
prov
ided
by
Uni
vers
ity o
f C
alif
orni
a -
San
Die
go o
n 04
/04/
21. F
or p
erso
nal u
se o
nly.

HIGH RA CONVECTION 1 39
many-the Earth's mantle, the Sun, and a fluid near its critical point are not easily treated together. Our viewpoint, however, does not have wholly exclusionary implications since convection experiments, extended to small scales where buoyancy is not of direct relevance, blend naturally into the subject of passive scalars in turbulence.
To organize our concepts and expectations, we begin with a section on theory and its limitations with an eye towards experiment, which remains the preeminent mode of inquiry in this field. Experimental results and technique are reviewed in Section 3, generally in order of decreasing Prandtl number and increasing shear effects. Attention is focused on the best measurements of a given quantity and no attempt is made at historical completeness. Section 4 summarizes numerical simulations which have mushroomed in response to recent experimental findings.
2. THEORETICAL BACKGROUND
2.1 Exact Results and Background
In this section we formally define the problem under consideration, extract several integral relations from the basic equations, and recall some general results from incompressible turbulence necessary for the sequel. Rigorous bounds on flow quantities are also collected here.
We will deal exclusively with the Boussinesq approximation (Tritton 1988, p. 188) for a fluid between rigid horizontal conducting plates across which a constant temperature difference is maintained and the heat flux is measured or visa versa. The lateral walls are insulating and rigid in the case of experiment, or possibly free slip or periodic in the case of simulations. Nondimensionalization is conventionally done by setting the depth d, thermal diffusivity K, and total temperature differences d, to one. The largest lateral dimension then becomes the aspect ratio A; the heat flux is given by the Nusselt number Nu (e.g. Nu = I for conduction); and the viscosity v, is replaced by the Prandtl number Pro The Boussinesq equations then read (gravity along i)
(o,v+v' Vv+ Vp)/Pr = V2v+RaBi
o,B+v'VB = V2(),
(2. l a)
(2. 1 b)
where () is the temperature equal to ± -! on the boundaries. The Rayleigh number Ra is gaAd3/Kv, where 9 is the gravitational acceleration and a the thermal expansion coefficient. The relevant length and velocity scales needed to define the Reynolds number Re will depend on context.
If an overbar denotes an average over a plane z = constant, and angular brackets a volume average, then (2.1 b) implies
Ann
u. R
ev. F
luid
Mec
h. 1
994.
26:1
37-1
68. D
ownl
oade
d fr
om w
ww
.ann
ualr
evie
ws.
org
Acc
ess
prov
ided
by
Uni
vers
ity o
f C
alif
orni
a -
San
Die
go o
n 04
/04/
21. F
or p
erso
nal u
se o
nly.

140 SIGGIA
Nu == vz{)-fMJ = «V{)2). (2.2)
The first equality, obtained by integrating over all z' < z, states that the heat flux is independent of z; the second, obtained by integrating the equation for �atlJ2 over the entire volume, gives the dissipation rate of temperature variance, i.e. So in the turbulence literature. The analogous equation for the balance between buoyant forcing and kinetic energy dissipation follows by averaging an equation for the time derivative of total energy, Ot(v2/2 - z{) Ra Pr), under stationary conditions,
(Nu-l)Ra = «VV)2). (2.3)
It should be emphasized that Equations (2.2) and (2.3) make no assumptions about any convectively driven flow.
Rigorous upper bounds on Nu(Ra) [or lower bounds on Ra(Nu)] have been derived by maximizing the defining expression for Nu over all v and () subject to incompressibility, (2.2), and (2.3). Since the techniques employed have been the subject of their own review (Howard 1972, Busse 1978), we merely state the results. For general Pr
Nu ::;; (Raj 1035) 1/2. (2.4a)
If Pr --t rt:) in (2. l a), then retaining only the piece of the pressure necessary to ensure incompressibility,
Nu::c:; 0.IS2RalJ3• (2Ab)
An interesting extension of this analysis was made by Howard ( 1990), who includes mean shear which puts a lower bound on Ra given Nu and the momentum flux '!" = ozvAz = 0) (supposing Vy = 0). Then for '!" > 8(Nu-l)2/Pr'/3 (among other cases), Howard finds
8 12 (Nu-l)Ra > _V_ "'
,3/2 Prl/2 - 3 '
which will prove relevant to what follows.
(2.5)
In the same context the empirically verified scaling relations for a turbulent boundary layer are needed and we collect the pertinent formulae here (Tennekes & Lumley 1 972, Hinze 1975). If we denote the friction velocity (, Pr) 1/2 by u* and define z* = Prju*, then
o ::;; z �; Zv zv�z«l,
(2.6a)
(2.6b)
Ann
u. R
ev. F
luid
Mec
h. 1
994.
26:1
37-1
68. D
ownl
oade
d fr
om w
ww
.ann
ualr
evie
ws.
org
Acc
ess
prov
ided
by
Uni
vers
ity o
f C
alif
orni
a -
San
Die
go o
n 04
/04/
21. F
or p
erso
nal u
se o
nly.

HIGH RA CONVECTION 141
where the viscous-buffer layer thickness, Zv � (7-12)z*, and u* is given implicity in terms of the large-scale Reynolds number as
u* = Pr Re/[2.51n (u*/Pr)+6.0l (2.7)
To the extent fluctuations away from the boundaries are homogeneous and isotropic, it will be useful in what follows to recall the von KarmanHowarth analysis (Landau & Lifshitz 1987, p. 139), which generalizes (2.3):
(v' Vv;(r)v;(O)/Pr+ Ra(vz(r)8(O) = (Vv;(r)Vv;(O) .
2.2 Mixing Length Theories (2.8)
Mixing length theory refers to a class of arguments in which the assumption of a single temperature and velocity scale as a function of distance to the nearest boundary is used to balance (2.1 a,b). While the applications to convection are well known and seemingly compelling, we will stress their limitations so as to lessen the surprise when other scaling laws arise.
Perhaps the most direct argument for the asymptotics of Nu(Ra, Pr) is that of Priestly (cf Spiegel 1971), who supposes that the heat flux is regulated by processes confined to the region near the horizontal plates, and in addition that the two boundary layers do not communicate. It follows that the spacing between the plates should not enter into the expression for the physical heat flux, (Kf1jd)Nu, so assuming Nu � f(Pr)Rct implies x = 3. A rather more dangerous argument further asserts f � Prl/3 based on the supposition that for small Pr the zero viscosity limit of Nu exists (Spiegel 1971). (One should not suppose, however, that for K -> 0 and Pr large, f � Pr- 1/3.)
These arguments are circumvented in one instance by the rather surprising experimental fact that a persistent mean flow can exist at high Ra, through which the boundary layers communicate. While this could not have been foreseen theoretically, the more careful mixing length treatment which follows strongly suggests that Nu � Ra 1/3 cannot be asymptotic, particularly from small Pr (Kraichnan 1962). The plate spacing is reintroduced into the problem via the Reynolds number and the invasion of the thermal boundary layers by the turbulent shear flow driven by the largest eddies.
A more thorough argument for x = 1 proceeds slightly differently depending on Prandtl number (Kraiehnan 1962). For Pr � 1, there will be a thermal boundary layer within which we can ignore the velocity. Its thickness [) is related to the heat flux via [) = 0.5/ Nu (half the temperature drop is across each boundary layer). If one imagines that the boundary layer thickens and then remains at the threshold for convection,
Ann
u. R
ev. F
luid
Mec
h. 1
994.
26:1
37-1
68. D
ownl
oade
d fr
om w
ww
.ann
ualr
evie
ws.
org
Acc
ess
prov
ided
by
Uni
vers
ity o
f C
alif
orni
a -
San
Die
go o
n 04
/04/
21. F
or p
erso
nal u
se o
nly.

1 42 SIGGIA
the 6-based Rayleigh number, Ra;; '" 103, or Ra/(l6 Nu3) '" 103 and Nu '" 0.05 Ra 1/3. [To infer whether this mechanism is operative, it is more revealing to compare Ra/(16 Nu3) with 103 than worry about small discrepancies in the cxponent.]
To estimate a characteristic velocity and temperature scale v(z), 8(z) for z > t5 (for smaller z one uses continuity and boundary conditions), two regimes are distinguished. Depending on whether the local Reynolds number zv(z)/ Pr is small oriarge, either the vi:>cous term "'V/Z2, or the advective term ",v2/(z Pr), balances the buoyant force in (2. l a). Estimating 8(z) generally as '" Nu/v(z) yields for the two cases respectively,
v '" (Ra Nu) 1/2Z,
v'" (RaNu Pr Z)I13.
(2.9a)
(2.9b)
For small Pr the boundary layer thickness is defined by where the Peelet number Peij = bv(b) '" 1 (actually'" 10 in experiments). The approximate equality of diffusive and convective fluxes at z '" b then implies Nu = 0.5/b - v(b). Since Reo - Pr- I is now large, we use (2.9b) for v(b) together with (jNu '" I to yield Nu '" v(S) '" (Ra Pr)I13.
In summary, the basic mixing length theory yields
Nu", 0.18(Ra Pr)1/3 Pr;5 0.1
Nu '" 0.066 Ra 1/3 Pr � 0.1. (2.10)
The first coefficient comes from Globe & Dropkin (1959) though there is some question whether a ! regime exists at low Pr (cf Rossby 1969, p. 321); the second is from Goldstein et al (1990) and is very close to the naive estimate Ra/(16 Nu3) '" 1 03.
Provided that the advection dominates V2v in the center of the cell in the Pr � 0.1 case, (2.9b) and (2.10) imply
Re '" 0.4 Ra4/9 Pr-2/3, (2.11 )
where Re is defined in terms of the cell depth and the rms vertical velocity in the center, and the numerical coefficient follows from either Garon & Goldstein ( 1973) or Tanaka & Miyata (1980), mutatis mutandis.
The Re scaling in (2. 1 1 ) permits us to check an important consistency condition for the Ral/3 regime-namely that the thickness of the viscous boundary layer set up by the large scales, Zv from (2.6-2.7), should exceed b '" 0.1 Ra-I/3. Since Zv scales as Ra-4/9 times logarithmic terms, ultimately it becomes smaller than b; which for Pr '" I (6) occurs for Ra � 10 18
(4 X 10²³). [Kraichnan (1962), extrapolating from less extensive data, found yet larger Ra for the crossover.]
For these truly asymptotic Ra, and Pr;S 0(1), mixing length theory
Ann
u. R
ev. F
luid
Mec
h. 1
994.
26:1
37-1
68. D
ownl
oade
d fr
om w
ww
.ann
ualr
evie
ws.
org
Acc
ess
prov
ided
by
Uni
vers
ity o
f C
alif
orni
a -
San
Die
go o
n 04
/04/
21. F
or p
erso
nal u
se o
nly.
HIGH RA CONVECTION 143
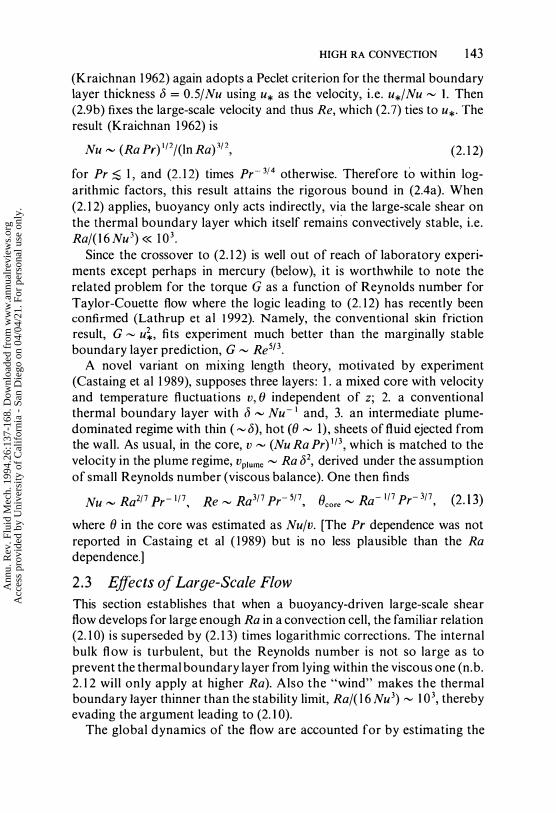
(Kraichnan 1 962) again adopts a Peclet criterion for the thermal boundary layer thickness 6 = O.5jNu using u* as the velocity, i .e. u*jNu � I. Then (2.9b) fixes the large-scale velocity and thus Re, which (2.7) ties to u*. The result (Kraichnan 1 962) is
Nu""' (RaPr)I/2j(ln Ra)3/2, (2. 1 2)
for Pr � 1 , and (2.1 2) times Pr-3/4 otherwise. Therefore to within logarithmic factors, this result attains the rigorous bound in (2.4a). When (2. 1 2) applies, buoyancy only acts indirectly, via the large-scale shear on the thermal boundary layer which itself remains convectively stable, i.e. Raj(16 Nu3)« 1 03•
Since the crossover to (2. 1 2) is well out of reach of laboratory experiments except perhaps in mercury (below), it is worthwhile to note the related problem for the torque G as a function of Reynolds number for Taylor-Couette flow where the logic leading to (2. 12) has recently been confirmed (Lathrup et al 1992). Namely, the conventional skin friction result, G � u�, fits experiment much better than the marginally stable boundary layer prediction, G � Re5!3.
A novel variant on mixing length theory, motivated by experiment (Castaing et al 1 989), supposes three layers: 1 . a mixed core with velocity and temperature fluctuations v, e independent of z; 2. a conventional thermal boundary layer with 6 ""' Nu- 1 and, 3. an intermediate plumedominated regime with thin ( � 6), hot (0""' I), sheets of fluid ejected from the wall. As usual, in the core, v ""' (Nu Ra Pr) 1/3, which is matched to the velocity in the plume regime, vplume � Ra 62, derived under the assumption of small Reynolds number (viscous balance). One then finds
Nu""' Ra2!7 Pr- 1/7, Re � Ra3/7 Pr- 5/7, Bcore � Ra- 1/7 Pr-3/7, (2.13) where 0 in the core was estimated as Nujv. [The Pr dependence was not reported in Castaing et al ( 1989) but is no less plausible than the Ra dependence.]
2.3 Effects of Large-Scale Flow
This section establishes that when a buoyancy-driven large-scale shear flow develops for large enough Ra in a convection cell, the familiar relation (2. 1 0) is superseded by (2. 1 3) times logarithmic corrcctions. The internal bulk flow is turbulent, but the Reynolds number is not so large as to prevent the thermal boundary layer from lying within the viscous one (n.b. 2. 1 2 will only apply at higher Ra). Also the "wind" makes the thermal boundary layer thinner than the stability limit, Raj( l 6 Nu3) � 103, thereby evading the argument leading to (2.10).
The global dynamics of the flow are accounted for by estimating the
Ann
u. R
ev. F
luid
Mec
h. 1
994.
26:1
37-1
68. D
ownl
oade
d fr
om w
ww
.ann
ualr
evie
ws.
org
Acc
ess
prov
ided
by
Uni
vers
ity o
f C
alif
orni
a -
San
Die
go o
n 04
/04/
21. F
or p
erso
nal u
se o
nly.

1 44 SIGGIA
energy dissipation in terms of the Reynolds number and substituting into (2.3). The Nu(Re) relation can be convincingly established when the boundary layers are nested as assumed (a condition to be verified subsequently), by solving
(z/y)13J) = 8;8, (2. 1 4)
where y-I is the shear rate near the wall. The solution is 8 = !-0.27/[z/ (yx) 1/3] with I(y) = He-y3/9 or Nu", 0.5/(yA)I/ 3 . The dependence on the aspect ratio A for A -::> I is contingent on the shear originating from a single extended circulation, while for A « 1 details of the corner flow enter, and in all cases the origin of x should be offset to avoid problems at x = o. With these assumptions, we arrive at two relations among Nu, Ra, and Re; thus fixing Nu(Ra), and Re(Ra).
To illustrate how this argument works in a simple context (Shraiman & Siggia 1 990), consider the limit Ra » 1 , Re « 1 . In this case the velocity has a single scale, so Nu Ra '" «\7V)2) '" <v2) '" (Re Pr)2, and y- I = Re Pro Therefore, Nu(y) can be reexpressed as Nu '" Ra 1/ 5 A - 2/ 5 which agrees with Roberts ( 1 979) (cf his Equation 5.23) for A ;;:; 2; otherwise multiple cells form. For completeness we note that for a Blasius boundary layer profile, Nu", Rel/2Prl/3A-I/2 and «\7v)2) � Re3Pr2A-1!2, implying
(2.15) [The similarity in the Ra exponent between (2. 1 5) and the analogous relationship of Busse & Clever ( 1 98 1 ) seems coincidental in view of the differing assumptions.]
The most interesting application of this reasoning (Shraiman & Siggia 1 990) arises when the velocity boundary layer is turbulent with a characteristic velocity u* (cf 2.7). We can then estimate the kinetic energy dissipation as
(2. 1 6)
The coefficient in (2. 1 6) is large because the viscous layer, where the dissipation peaks, is rather thick in comparison with z* = Pr/u*, e.g. zv/z* '" 10 , and boundary layers are present along all the walls. Note also that the dissipation scales with u* not Re (Hinze 1 975). The shear rate is just y- I = u*/z* so
Nu = 0.22 Ra2/7 Pr- 1/7 A - 3/7,
Re = 0.052 Ra3/7 [2.5 In (u*/Pr) + 6.0] Pr- 5/7 A - 1/7,
(2. 1 7a)
(2. 1 7b)
where u*/ Pr is determined from Re via (2.7), and in analogy with (2.6b),
8(z) '" constant + (Nu/u*) In (z/z*). (2. 1 7c)
Ann
u. R
ev. F
luid
Mec
h. 1
994.
26:1
37-1
68. D
ownl
oade
d fr
om w
ww
.ann
ualr
evie
ws.
org
Acc
ess
prov
ided
by
Uni
vers
ity o
f C
alif
orni
a -
San
Die
go o
n 04
/04/
21. F
or p
erso
nal u
se o
nly.

HIGH RA CONVECTION 1 45
The numerical prefactors in (2.17a,b) are from the A = 1 cell of Wu & Libchaber ( 1992) [the theoretical numbers based on (2.16) would have been 0.27 and 0. l 8 respectively], and the cell height is used in defining Re. The experiment used the same fixed probe at all Ra, so the maximum velocity may be larger than that given in (2. 1 7b); however using the coefficient in (2. 1 7a) and (2.6-2.7), all Ra dependence disappears from (2.5) to yield a rigorous upper bound of 0.39 on the coefficient in (2. 17b).
The lower Ra limit on the validity of (2. 17) is set by Re � 3 x 10³ which assumes that the maximum velocity occurs at a height equal to a substantial fraction of the depth. This lower limit ensures that the boundary layer is turbulent while the upper limit is the consistency requirement that the thermal boundary layer nests within the viscous one:
(2. 1 8)
The range of upper values corresponds to the choices Zy = (7-1 2)z* when used along with the numerical coefficients in (2. 1 7a,b ). There is a large uncertainty in the upper limit because, although the boundary layers must ultimately cross, their thickness ratio has a small effective exponent, i .e. � Ra02• (The A dependence of either limit requires additional assumptions and is not worth quoting.)
It should be emphasized that Equation (2. 1 8) is merely a necessary condition for (2. 17) to hold; it is not sufficient since we have assumed that the mean flow is dominant. When the upper limit in (2. 1 8) is exceeded, thc physics suggests a crossover to (2. 1 2) which can be rcdcrived with mean shear by combining the passivc scalar transport estimate, Nu � u*/lln z* I, with (2. 1 6) and (2.3). Clearly this level of theory cannot preclude a return to (2. 10) and evidently the dependence on Pr is the best way to test (2. 1 8) .
Another potential limitation on (2 . 17)-namely that the thermal boundary layer be convectively stable, i.e. Ra/( l 6 Nu3);:S 1 03, or from (2. 1 7a) Ra;:S 7 x 10 14Pr- 3-is not a limitation in practice [n.b. the Pr dependence of this expression comes entirely [rom the Pr- 1/7 in (2. 1 7a) and has not been checked experimentally]. In other words, the heat flux in (2. 17a) is greater than in (2. 1 0) for the accessible Ra, in spite of the unfavorable exponent, as one would expect intuitively from the shear.
Convection with a uniform imposed shear presents an interesting stability problem; for recent references see Clever & Busse ( 1991 , 1992). The relevance of this literature to the thermal boundary layer associated with (2. 17) subject to (2. 1 8) is minimal because the Reynolds number based on 6(z) at the edge of the viscous layer and hence throughout the thermal boundary layer is � IOzy/z* � 1 00 (cf 2.6 and below) and as just noted, the boundary layer Ra is less than 1 03• In a strictly two-dimensional flow a small amount of shear will suppress convection (Castaing et al 1 989),
Ann
u. R
ev. F
luid
Mec
h. 1
994.
26:1
37-1
68. D
ownl
oade
d fr
om w
ww
.ann
ualr
evie
ws.
org
Acc
ess
prov
ided
by
Uni
vers
ity o
f C
alif
orni
a -
San
Die
go o
n 04
/04/
21. F
or p
erso
nal u
se o
nly.

146 SIGGIA
but this restriction is unphysical since the rolls align with the mean flow. Convection and shear may interact in subtle ways on larger scales (cf Section 3.3) but this should not upset (2. 1 6) or (2. 1 7a,b) (for an alternative view see Zaleski 199 1 ).
2.4 Buoyancy vs Shear To understand the small-scale fluctuations and spectra in turbulent convection, one is forced to address the relative importance of the energy input directly into a given velocity mode by the buoyancy compared with the energy cascaded from larger scales. The analogous question for the temperature is: When does it reduce to a passive scalar?
Let us first consider the center of the cell and suppose that the Reynolds number is large enough, say � 105 for the bulk to be reasonably homogeneous and isotropic and exhibit some scaling as a function of the spacing r « I over which differences, bv or MJ, are defined. Take the aspect ratio large enough so that there is negligible convective heat transfer along the side walls. Under the hypothesis of no energy cascade and direct buoyant forcing, mixing length ideas (cf 2.9b) imply bv21r - bO Ra Pr. The scalar should cascade if the velocity does not, because turbulence should dissipate, and the dissipation rate for 02, 80, is of order bvb021r which furnishes a second equation for bv, bO. For consistency one must suppose bv bO « Nu, since otherwise Kolmogorov scaling for the velocity would reemerge in the guise bv31r '"" Nu Ra Pr (ef2 .3) . This inequality is physically reasonable because the heat flux is carried by the largest scales accessible (cf Fitzjarrald 1976). This chain of reasoning results in the BolgianoObukhov scaling (Procaccia & Zeitak 1 989):
Dv _ (eoRa2 Pr2) 1/5 r3/5
(2.19)
for r larger than a diffusive cutoff 10 - (Ra2 Pr2 ee)� 1/8 set by b02(l0)IIJ '"" eo. In addition, if (2. 1 9) applies up to r - I then the bound bvbO < Nu together with (2.17a) requires eo < Ral!7 Pr�4!7.
The partitioning of heat flux over scales is defined by the correlation function <vz(r)8(O) appearing in (2.8). Experiment (Fitzjarrald 1976) suggests that this correlation function sticks at its r = 0 value, Nu, until r ;<; I. Then we can invoke (2.8) for r « I (which is the formal statement that the velocity must cascade and is exact given our symmetries) to derive the Kolmogorov law DV3 = evr, with the energy dissipation rate ev = RaNuPr. Therefore we regard (2.19) as untenable as an asymptotic statement. Some caution is in order as regards to numerical factors since as remarked in conjunction with (2. 1 6), most of the kinetic energy dissipation
Ann
u. R
ev. F
luid
Mec
h. 1
994.
26:1
37-1
68. D
ownl
oade
d fr
om w
ww
.ann
ualr
evie
ws.
org
Acc
ess
prov
ided
by
Uni
vers
ity o
f C
alif
orni
a -
San
Die
go o
n 04
/04/
21. F
or p
erso
nal u
se o
nly.

HIGH RA CONVECTION 1 47
takes place in the boundary layers, not the bulk. Therefore 8y deduced from (2.8) is too large, and this can be rationalized most readily in an A � 1 cell by supposing that heat is predominately transported along the side walls and that vz(r)8(O) averaged in the bulk is substantially less than Nu.
To quantify the importance of direct buoyant forcing within the Kolmogorov picture, we
' need the analogous Corrsin-Obukhov prediction for
the scalar, (j() � 8J/28; 1/6rl/3, and an estimate for 8e in the bulk. If we use the upper bound for 8e of Nu given by (2.2), then applying (2. 1 7a) gives (j()(r '" I) � Ra- 1/14. This exceeds the scaling limit � Nu/u* (cf 2. 1 7c) so we adjust 80 downwards to '" Ra 1/7 reasoning that most of the dissipation occurs in the boundary layers. Finally the ratio of shear to buoyancy in (2. 1 a) becomes r-l(jv2/(RaPr(j() � r-2/3 � 1 .
While scaling arguments rule out (2. 1 9), small numerical factors do occur which favor direct buoyant forcing. For instance within the loglayer, the rate of vorticity production by the shear is no greater than u�/(z*Zy) � 1O-6RaI2/7 Pr-6/7 via (2.6-2.7) and (2.17b); while the buoyancy contribution is Ra Pr axe. Although the exponents favor the shear, the buoyancy dominates, particularly when the boundary layer separates and a plume is ejected, during which time ax() could scale as Nu.
More generally, averaged estimates such as (2. 1 0) or (2. 1 7), are a priori suspect, and higher moments more so, when plumes play an important role in the dynamics. A very analogous situation exists for the boundary layer where mixing length arguments have proven successful although the bursts contribute appreciable Reynolds stress (Lu & Willmarth 1 973). With buoyancy and shear both present, even their relative contributions to the instability leading to plume emission is out of reach theoretically.
For comparison with experiment, two standard scaling results for plumes at high Re should be noted (Turner 1 973). The first presupposes a constant source of heat (analogous to fixed Nu) and gives a velocity �ZI/3 as in (2.9b) and a diameter � z. The second assumes a detached bubble with size I and temperature contrast 11() obeying PI1() = Q = const. Then v � (Ra Pr Q) 1/2/1. However experiments by Moses et al (1993), including one run under reasonably turbulent conditions, find a constant plume velocity.
3. EXPERIMENTS
3.1 Large-Scale Structure of the Flow In 198 I Krishnamurti & Howard discovered, in a variety of large aspect ratio cells (cf Table I), an internally generated coherent flow, moving with a steady mean along the top plate and returning along the bottom.
Ann
u. R
ev. F
luid
Mec
h. 1
994.
26:1
37-1
68. D
ownl
oade
d fr
om w
ww
.ann
ualr
evie
ws.
org
Acc
ess
prov
ided
by
Uni
vers
ity o
f C
alif
orni
a -
San
Die
go o
n 04
/04/
21. F
or p
erso
nal u
se o
nly.

Table 1 Synopsis of the principle experiments discussed in the text"
Reference A Pr
Goldstein et al 1990 1.3-9 2750
Krishnamurti & Howard 1981 3.5, 10,24 6, 103
Garon & Goldstein 1973 2.5,4.5 5.5
Goldstein & Tokuda 1980 0.57-2.5 6.5
Tanaka & Miyata 1980 3.5-1.4 6.8
Zocchi et al 1990 5.6
Thrdfaii 1975 2.5 A 0 V.O Castaing et al 1989
}
0.5 0.64-1.5
Wu & Libchaber 1992 1.0 0.64-1.14
Wu 1991 6.7 0.64-1.0
Belmont & Libchaber I 0.7
(private communication)
Rossby 1969 7.4, 12.3 0.025
Mean flow (Range for flow)
Y (>3 x 10⁶, > 10')
Y ( � 109)
Y (> 108)
Y (>4x 10⁷)
Y ? Y (10'-10")
Nu
0.0659 Ra 1/3
0.130 Ra0293
0.0556 Ral/3
0.145 Rao.29O
" 1 '71 D�O.280 V • .lIJ ..l\..U
0.17 Ra0290
0.22 RaO.285
0.146 Rao.286
0.147 Rao.24'
(Range for Nu)
(3 x 10⁹-5 x 10 12)
(10'-3 x 10⁹)
(109-2 x lOll) (3 x 10 '-4 X 10⁹)
{A ... ,ln5 " ... �1{\9\ \''''' .LV -�A. LV J (108-1014)
(4x 10⁷_1012)
(104-101°)
(2 x 10⁴-5 x 10⁵)
"The experiments are ordered by PI'. The highest Prandtl numbers correspond to oil or electroconvection, those �6 are water experiments, helium and other gases comprise the Pr � I group, and mercury the last. A mean flow was marked "y" even if there were occasional reversals (see text for details).
.j::>. 00
'" Ci Cl :;
Ann
u. R
ev. F
luid
Mec
h. 1
994.
26:1
37-1
68. D
ownl
oade
d fr
om w
ww
.ann
ualr
evie
ws.
org
Acc
ess
prov
ided
by
Uni
vers
ity o
f C
alif
orni
a -
San
Die
go o
n 04
/04/
21. F
or p
erso
nal u
se o
nly.

HIGH RA CONVECTION 1 49
Although the Re based on mean flow and depth did not exceed 50, the effect in retrospect presaged more recent higher Ra experiments, already noted in connection with (2. 1 7a,b) where the shear generated by the coherent flow alters the heat flux. The sign of the coherent flow is random, as in a symmetry breaking bifurcation, yet the flow is turbulent when this occurs. Particular attention was paid to obvious biases such as tilt or side wall heating so the effect is intrinsic and not understood (but see Howard & Krishnamurti 1 986 and Busse 1 983).
The same nonzero averaged circulation was also observed at elevated Ra in a water experiment by Zocchi et al ( 1 990) and in A = 1 helium cells (Wu 199 1 , Castaing et al 1 989) as shown in Table 1. [Their A = 0.5 and 6.7 cells exhibited mean flow but with occasional reversals (Wu & Libchaber 1 992) . ] The helium measurements are both more surprising than the earlier ones, in the sense that the Ra is higher and Pr lower, but less surprising since the aspect ratio is smaller and the large-scale mode is reminiscent of the "fly wheel" effect proposed at low Pr (Proctor 1977). However the precise conditions required for the coherent flow are a bit obscure since Tanaka & Miyata ( 1 980), in an experiment similar to Zocchi et al ( 1 990), do not note the effect.
The balance of this section is organized in order of decreasing Prandtl number and roughly parallel with the theoretical development in Section 2. Traditional mixing length ideas are generally confirmed in water with Pr � 5-6 and for all higher Pr, while shear effects will be seen to predominate for Pr ;$ 1 .
3.2 Successes of Mixing Length Theory for Pr � 5 By far the highest Rayleigh numbers in this regime were attained by Goldstein et al ( 1 990) who employed an electro-chemical analogue to convection to reach Ra � 5 x 1 012 with Pr = 2750. A flux of Cu++ ions in a CuSO,j solution between two Cu electrodes is established by applying a current. Sulfuric acid is present in much greater concentrations to screen out the electric field and eliminate any ion current that would result. If the voltage is set at the "plateau" of the current-voltage plot, the Cu + + concentration at the cathode is zero and that at the anode is assumed to be twice the solution average by symmetry (though the justification for this assumption under all flow conditions is unclear). The local density is proportional to Cu + + concentration. Assuming isothermal conditions, this determines the "Rayleigh" number, and the "Nusselt" number follows from the current after corrections are made. [It would be reassuring to see this technique accurately reproduce Nu(Ra) obtained by conventional means for a cell of identical shape and Pr.] The authors' obtain an accurate fit to Equation (2. 1 0) (Table 1 ) .
Ann
u. R
ev. F
luid
Mec
h. 1
994.
26:1
37-1
68. D
ownl
oade
d fr
om w
ww
.ann
ualr
evie
ws.
org
Acc
ess
prov
ided
by
Uni
vers
ity o
f C
alif
orni
a -
San
Die
go o
n 04
/04/
21. F
or p
erso
nal u
se o
nly.

1 50 SIGGIA
Although no velocity measurements were made, it is reasonable to estimate their Reynolds number by extrapolating from a fit of mixing length theory to data in water (2. 1 1 ) which implies Re � 900 at Ra � 5 x 1 012• A Re this low precludes any contradiction with (2. 1 7a,b) (and by implication the helium experiments in Section 3.4), which by (2. 1 8) only apply for Ra ;<: 5 x 10 13 at Pr = 2750.
Some of the most detailed investigations of mixing length ideas come from water at Pr = 5-6. For Ra ;;;; 109, all experiments in water and air give exponents for Nu(Ra) around 0.29 (Table 1 and Goldstein et aI1990), as shown in Figure 1 . At high Ra Figure I shows a crossover to an exponent of �, but there is not much overlap between data at different aspect ratios.
The theory leading to (2. 1 7a) only applies in water for Ra> 2 x 1 09,
0.07 1 11111\ I 11111
0 0
0
0 0 0
0 0 0
M cP " 0 � 0.06 I 0 # ro � # # 0::: 0
[[] 0 0 ;:;1 cPo z
Doll
# :J 0 "'''''II''
0 0 o �
0
0
0.05 I I1III111 II
107 lOB 109 1010 1011 1012 Ra
Figure 1 A scaled plot of the Nu(Ra) data of Goldstein & Tokuda (1980) and Garon & Goldstein (1 973). A fit to the data below 3. 3 x 10⁹ gave Nu = 0. 1 30 Rao 293. The symbolscircle. square, diamond, star, and pound-denote the aspect ratios 4. 5, 2.5, 0.98, 0.67, and 0.57, respectively. The points at Ra = 1 .18 and 1.64 x 10 " are "suspect."
Ann
u. R
ev. F
luid
Mec
h. 1
994.
26:1
37-1
68. D
ownl
oade
d fr
om w
ww
.ann
ualr
evie
ws.
org
Acc
ess
prov
ided
by
Uni
vers
ity o
f C
alif
orni
a -
San
Die
go o
n 04
/04/
21. F
or p
erso
nal u
se o
nly.

HIGH RA CONVECTION 1 5 1
provided that there is a mean flow-although (2. 1 3) could apply at lower Ra and nicely accounts for the exponent of 0.29. Why the j exponent occurs only above 1 09, and whether the variable aspect ratio in Figure 1 masks some other scaling are open questions.
In my view, direct measurements of the velocity should provide a more compelling test of mixing length ideas than small differences in the Nu(Ra) exponent. The scaling of Re, defined around the midpoint of the cell, with Ra was already noted in (2. 1 1 ) from Garon & Goldstein ( 1973) and Tanaka & Miyata ( 1980). The Prandtl number of water is generally felt to be large enough for the velocity fluctuations to evolve from (2.9a) to (2.9b) as z moves beyond the boundary layer. Garon & Goldstein ( 1 973) provide evidence for (2.9b), while Chung et al ( 1 992) find evidence for a crossover in the temperature data [O(z) � Nu/v(z)]. Far more extensive data should soon be available from particle image ve10cimetry (Adrian et al 1 990). Finally, by using 0.05 mm diameter thermocouple wire, Tanaka & Miyata (1980) measured the mean temperature well within the boundary layer and found it to be accurately linear out to z = 0.5/Nu.
3.3 Plumes and Visualizations in Water
Plumes�hot (cold) parcels of fluid fed from the lower (upper) boundary layers-and thermals-detached parcels of marked fluid-have long been associated with convection particularly at high Pro Experimental capabilities have advanced in recent years due to the application of digital imaging (Hesselink 1988). Gluckman et al ( 1993) provide a nice illustration of a technique for simultaneous measurement of isothermal surfaces and the velocity field (in a plane). They seed the flow with small (50-1 00 ,urn) encapsulated spheres of liquid crystals. This material undergoes a transition around 25°C to a phase which acts like a diffraction grating with temperature-dependent properties. At fixed scattering angle, there is a sigmoidal map of temperature to hue (peak scattered wavelength); thus the resolution of a given isotherm in scaled temperature can be optimized by adjusting the plate temperatures to place the isotherm on the inflection point of the response curve. The image created by plane illumination is recorded on a 480 x 5 1 2 grid in three color bands with 256 levels each. The projected velocity field on a � 302 mesh could also be simultaneously reconstructed by particle tracking. [Higher resolution measurements of velocity alone are given in Adrian et al ( 1 990).]
For 1 07 < Ra < 3 x 1 08 in water, the statistics of the mean temperature isotherm from Gluckman et al ( 1 993) were substantially the same in vertical and horizontal sections at the center of the cell. One could also hope to measure the heat flux carried by the more prominent plumes and the Vz - 0 spectra by extensions of this technology, as was earlier done in air with a
Ann
u. R
ev. F
luid
Mec
h. 1
994.
26:1
37-1
68. D
ownl
oade
d fr
om w
ww
.ann
ualr
evie
ws.
org
Acc
ess
prov
ided
by
Uni
vers
ity o
f C
alif
orni
a -
San
Die
go o
n 04
/04/
21. F
or p
erso
nal u
se o
nly.

152 SIGGIA
moving hot wire (Fitzjarrald 1 976). An intriguing picture of ridge-like undulations of the thermal boundary layer was obtained with the superimposed velocity field. These images should stimulate a fruitful dialog with those engaged in numerical simulations.
Zocchi et al (1990) use the same liquid crystal technique to study the dynamics of the thermal boundary layer in water. At Ra = 1 .2 x 1 09, they observed a mean flow with a definite sense of circulation but slow, bounded fluctuations in direction, and a maximum horizontal velocity of '" 6 mm/sec. They report semi-quantitative statistics on "wave like" disturbances which have the appearance of unstable modes growing downstream in the large-scale flow. The measured dispersion relation, w2 ex k, is appropriate for Rayleigh-Taylor instability of the boundary layer and the numerical coefficient is reasonable. In a vertical slice through the fluid, they observe in the temperature field spirals (suggestive of vorticity ejected from the wall perpendicular to the plane of view) and tilted mushrooms (naturally interpreted as plumes). The mushrooms also resemble smoke visualizations of hairpin vortices viewed with the mean flow normal to the page (Head & Bandyopadhyay 1981). Since the "mushrooms" are seen
� I em from the wall (the thermal boundary layer is confined to 1 . 1 mm and the cell i s 1 9 cm on a side), the applicable Reynolds number is under 1 00-a bit too low for shear effects to predominate. However, Shelley & Vinson ( 1992), based on an idealized two-dimensional model, conclude that the "spirals" and "mushrooms" originate from the same instability and differ in the degree of imposed shear.
Unfortunately there is insufficient theory available to guide interpretation. Numerical studies of plane Coue:tte flow with heating (e.g. Domaradzki & Metcalfe 1 988, Clever & Busse 1 992) could be redesigned to model just the viscous boundary layer of experiments at high Ra and large enough Pr so that the velocity is linear over an interesting range of scales. Although the simulations do reach Re � 1 03, their Ra is ;s 2 X 1 05; thus the top and bottom boundary layers interact directly, contrary to what happens at the higher Ra of the experiments where plumes do not span the cell. Also, the experiments seem to call for an initial value problem with a local disturbance allowed to grow downstream.
Moses et al ( 1993) study plume formation experimentally in the context of thermally-driven turbulence, and also review the earlier literature.
3.4 Convection in Helium and the Effects of Shear
The technical virtues of gaseous helium at low temperatures (4-5 K) as a medium for high Ra convection studies have been appreciated for some time (Threlfall 1 975). They include: the ability to minimize the thermal noise in bolometers, the ease of thermal isolation by means of a vacuum
Ann
u. R
ev. F
luid
Mec
h. 1
994.
26:1
37-1
68. D
ownl
oade
d fr
om w
ww
.ann
ualr
evie
ws.
org
Acc
ess
prov
ided
by
Uni
vers
ity o
f C
alif
orni
a -
San
Die
go o
n 04
/04/
21. F
or p
erso
nal u
se o
nly.

HIGH RA CONVECTION 1 53
enclosure and radiation shields, and the low heat capacity of solids at helium temperatures.
Another advantage, most thoroughly exploited by the Libchaber group (Heslot et a11 987, Wu 199 1 ), is the ability to achieve most of the Rayleigh number variation by adjusting the fluid properties, i.e. pressure and mean temperature. In this way Ra can be varied by 1 06 or more for the same I1T in a single cell (with minimal variation in Pr; e.g. 0.64-1 .07 for Ra = 1 07_1 013). The heat source and temperature measurements can then be optimized within a more limited range (11 T from 50 mk to 700 mk only). Unfortunately, visualizations are not possible. Non-Boussinesq effects are most pronounced in the thermal diffusivity which varied by only 1 2% between the two plates at Ra = 1 0 13 in Libchaber's aspect ratio 0.5 cell.
The high Ra and smaIl viscosity imply very thin boundary layers, e.g. ;:S0. 1 mm, with consequent demands on technique when point measurements are made. The Libchaber group has employed cubic bolometers 0.2 mm on a side suspended on thin wires, from which they extract the probability distribution function (PDF), temporal power spectrum, and also the large-scale velocity (by cross-correlating two nearby bolometers to determine a transit time).
Thrcc cylindrical cells of aspect ratio 0.5, 1 .0, and 6.7 were used. For the two smaller cells there is a change around Ra <: 1 07 in Nu(Ra) from an ill-defined exponent near i to one indistinguishable from 2/7 (Figures 2, 3). This break correlates with the appearance of a quasi-steady largescale flow and a change in the temperature PDFs in the center of the cell from Gaussian to exponential which we discuss below. 1
This crossover coincides with the point where Re "-' 2000, in accord with the assumptions made in deriving (2. 1 7- 1 8). In the aspect ratio 6.7 cell a reasonable fit to 2/7 extends to such low Ra in Figure 4 so that the Rcynolds number must be < 1 03 -though it was not measured. Data in the wider cell agree well with those of Threlfall ( 1975), who obtained an exponent of O.2800 ± 0.0005 (Table 1 ).
The mean vertical velocity, measured 1 em from the side wall in the A = 1 ceIl (diameter = 8 .7 cm) (Sano et a11989, Wu 1 99 1 , Wu & Libchaber 1 992) defined the large-scale Re, and the velocity at other points was checked to verify the coherence of the flow. Although the experiments were first fit as Re = 0.31 RaO.485± 0.005, Figure 5 shows the fit to (2. l 7b)
I We do not use the terms "soft" and "hard" convection (Castaing et al 1989) to refer to the states on opposite sides of this transition because the definitions are irreparably muddled. For the original A = I cell, a mean flow, exponential probability distributions, and the 2/7 scaling of Nu all occurred together and constituted hard turbulence. In other cells and experiments each of these properties can occur singly. The "hard" regime is also unlikely to be asymptotic.
Ann
u. R
ev. F
luid
Mec
h. 1
994.
26:1
37-1
68. D
ownl
oade
d fr
om w
ww
.ann
ualr
evie
ws.
org
Acc
ess
prov
ided
by
Uni
vers
ity o
f C
alif
orni
a -
San
Die
go o
n 04
/04/
21. F
or p
erso
nal u
se o
nly.
1 54 SIGGIA
0.14
0.12
C'"l ::;-
I cd 0.10 n:: ::1
Z
0.08
o
o
000 o o
o
0.06 L-���� __ ����_LI�I�IUI�lilllllll __ �I-L1 Llull.�' �-L�LUW
104
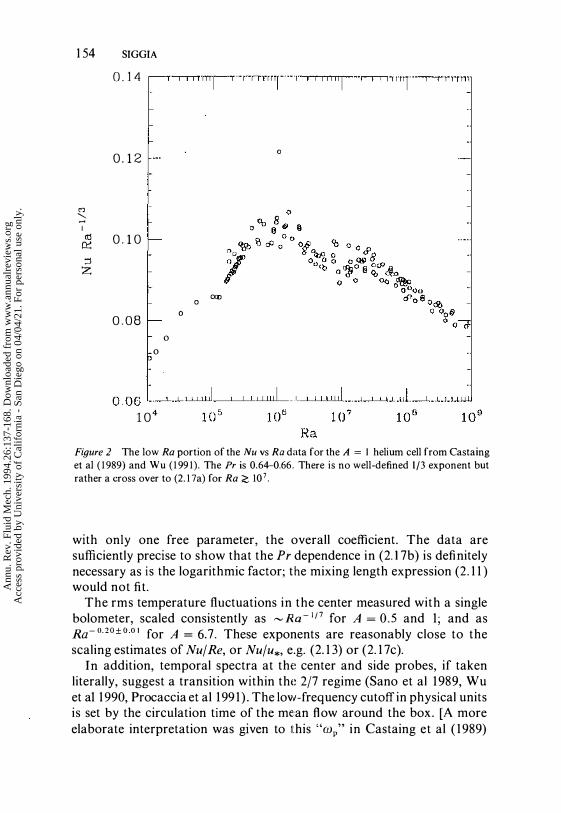
Figure 2 The low Ra portion of the Nu vs Ra data for the A = I helium cell from Castaing et al ( 1 989) and Wu ( 1 99 1). The Pr is 0.64-0.66. There is no well-defined 1/3 exponent but rather a cross over to (2. 1 7a) for Ra ;;;; 107.
with only one free parameter, the overall coefficient. The data are sufficiently precise to show that the Pr dependence in (2.17b) is definitely necessary as is the logarithmic factor; the mixing length expression (2. 1 1 ) would not fit.
The rms temperature fluctuations in the center measured with a single bolometer, scaled consistently as � Ra- 1j7 for A = 0.5 and 1; and as Ra-O.20±QOI for A = 6.7. These exponents are reasonably close to the scaling estimates of NujRe, or Nuju*, e.g. (2. 1 3) or (2. 17c).
In addition, temporal spectra at the center and side probes, if taken literally, suggest a transition within the 2/7 regime (Sano et al 1 989, Wu et a1 1990, Pro caccia et aI 1991 ) . The low-frequency cutoff in physical units is set by the circulation time of the mean flow around the box. [A more elaborate interpretation was given to this "wp" in Castaing et al ( 1 989)
Ann
u. R
ev. F
luid
Mec
h. 1
994.
26:1
37-1
68. D
ownl
oade
d fr
om w
ww
.ann
ualr
evie
ws.
org
Acc
ess
prov
ided
by
Uni
vers
ity o
f C
alif
orni
a -
San
Die
go o
n 04
/04/
21. F
or p
erso
nal u
se o
nly.
0.21
0.22
0.20
0.18
o 00 0
o
o o o
0 0 0
000 0
0
o 0
00 0
o
HIGH RA CONVECTION 1 55
0
0"
o o o cfll° o
0
#
0 000 0 00 oQJ % 00
00 0 0 0
o o
0.16���-L�illL��lli-LLWlli��Wlli��illL�Uil�
107 1010 1011
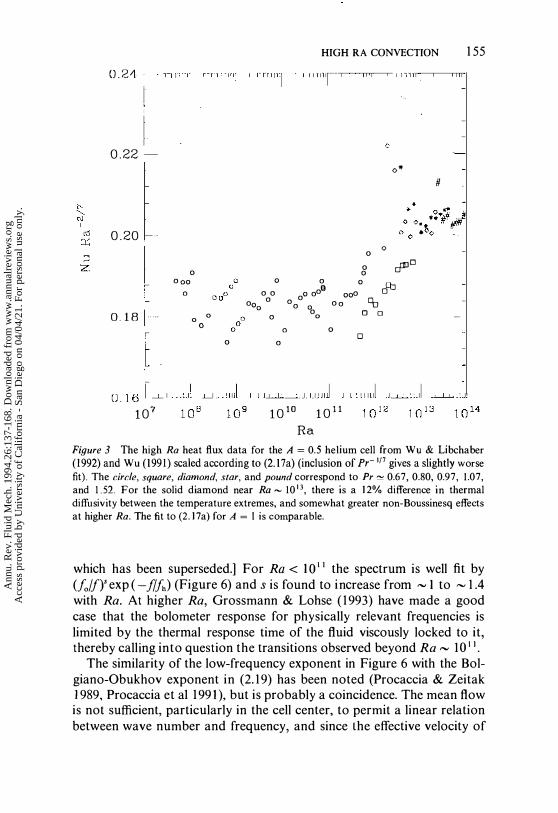
Ra Figure 3 The high Ra heat flux data for the A = 0.5 helium cell from Wu & Libchaber (1992) and Wu (1991) scaled according to (2.17a) (inclusion of Pr-1f7 gives a slightly worse fit). The circle, square, diamond, star, and pound correspond to Pr,.., 0.67, 0.80, 0.97, 1.07, and 1.52. For the solid diamond near Ra � 101J, there is a 12% difference in thermal diffusivity between the temperature extremes, and somewhat greater non-Boussinesq effects at higher Ra. The fit to (2.17a) for A = 1 is comparable.
which has been superseded.] For Ra < 10 II the spectrum is well fit by (folfYexp ( -flfh) (Figure 6) and s is found to increase from '" 1 to '" 1 .4 with Ra. At higher Ra, Grossmann & Lohse ( 1993) have made a good case that the bolometer response for physically relevant frequencies is limited by the thermal response time of the fluid viscously locked to it, thereby calling into question the transitions observed beyond Ra '" 1 0 I I.
The similarity of the low-frequency exponent in Figure 6 with the Bolgiano-Obukhov exponent in (2. 19) has been noted (Procaccia & Zeitak 1989, Procaccia et a1 1991), but is probably a coincidence. The mean flow is not sufficient, particularly in the cell center, to permit a linear relation between wave number and frequency, and since the effective velocity of
Ann
u. R
ev. F
luid
Mec
h. 1
994.
26:1
37-1
68. D
ownl
oade
d fr
om w
ww
.ann
ualr
evie
ws.
org
Acc
ess
prov
ided
by
Uni
vers
ity o
f C
alif
orni
a -
San
Die
go o
n 04
/04/
21. F
or p
erso
nal u
se o
nly.
156 SIGGIA O. 1 7 ,---,...,--,-,TTTTI-...... TTTTTlO-T·TTTITlT·-,-� 1-'-'
0. 16
0. 15
a a
0 0 all 0 0 0 00 0 0 0 0 0 00 00 00
o 0 0 0 0 0 a rP a 0 0 o
*' :11= *'*-* "
� � DIgIJ 0 0::}l5 o 0 <;0 0 00 0 0
o
"
"
0.14 ���R-��illL-LLUllliL��llWL-LL����=
104
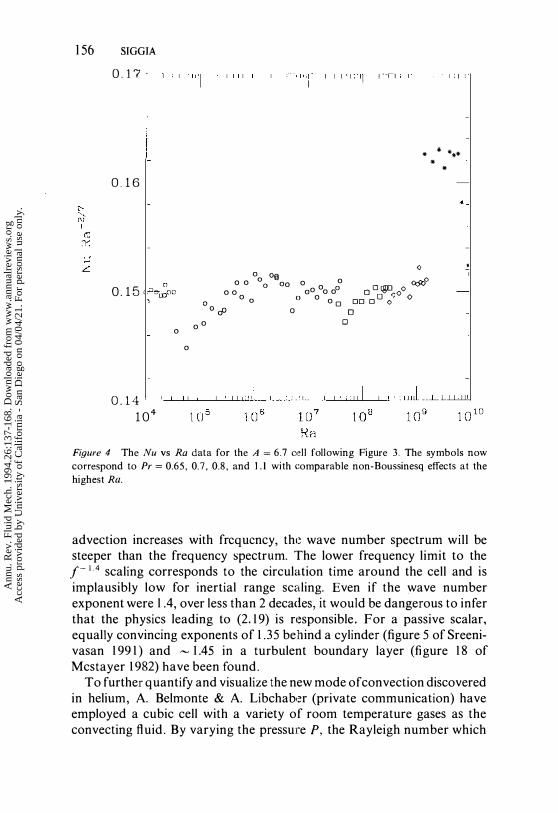
Figure 4 The Nu vs Ra data for the A = 6.7 cell following Figure 3. The symbols now correspond to Pr = 0.65,0.7,0.8, and 1 . 1 with comparable non-Boussinesq effects at the highest Ra.
advection increases with frequency, the wave number spectrum will be steeper than the frequency spectrum. The lower frequency limit to the j- 14 scaling corresponds to the circulation time around the cell and is implausibly low for inertial range scaling. Even if the wave number exponent were l A, over less than 2 decades, it would be dangerous to infer that the physics leading to (2.19) is responsible. For a passive scalar, equally convincing exponents of 1.35 behind a cylinder (figure 5 of Sreenivasan 1991) and � 1.45 in a turbulent boundary layer (figure 18 of Mcstayer 1982) have been found.
To further quantify and visualize the new mode of convection discovered in helium, A. Belmonte & A. Libchaber (private communication) have employed a cubic cell with a variety of room temperature gases as the convecting fluid. By varying the pressure P, the Rayleigh number which
Ann
u. R
ev. F
luid
Mec
h. 1
994.
26:1
37-1
68. D
ownl
oade
d fr
om w
ww
.ann
ualr
evie
ws.
org
Acc
ess
prov
ided
by
Uni
vers
ity o
f C
alif
orni
a -
San
Die
go o
n 04
/04/
21. F
or p
erso
nal u
se o
nly.

o . 04 '-..L.....1.--'-LLLlll.---'----'-.L.LLI..l.il.-----'---L..L-LLLJ.ll--'-L..L.l..J....JJ.L-.l-.L...L..Ll.ll1J 1 0 7
Ra Figure 5 The Reynolds number scaled according to (2. 1 7b) for the A = I data in Figure 2. The symbols-circle, square, diamond, star, and pound-correspond to Pr � 0.65, 0.7, 0.9, and 1.4.
scales as p2, could be varied from '" 106 to 1 0 " with �T maintained in the range 1 O-30°C, and Pr = 0.7. A mean flow was clearly evident at all Ra.
In addition, a bolometer of the same style and size as used in the helium experiments could be positioned continuously along a 0.9 mm vertical rod under the center of the top plate. The peak in 82 falls at a value of z that correlates well with the thermal boundary layer thickness as inferred from the helium data, or the break i n 8(z) measured directly. Some measure of the vertical penetration of the plumes is provided by the shape of the (J distribution which together with inferences about the velocity from the time dependence of 8 and two-point correlations should help quantify how convection drives the mean flow.
To more directly address the role played by the mean flow in the helium
Ann
u. R
ev. F
luid
Mec
h. 1
994.
26:1
37-1
68. D
ownl
oade
d fr
om w
ww
.ann
ualr
evie
ws.
org
Acc
ess
prov
ided
by
Uni
vers
ity o
f C
alif
orni
a -
San
Die
go o
n 04
/04/
21. F
or p
erso
nal u
se o
nly.

1 58 SIGGIA
1 0 -z c----,---,-,,'rr' ,I nl " I--'--'---'--"TTn---,-r-r-r---r-1""TTl
1\
1 0 -6 L-__ �-L�LLLU� __ �_-L�LLLUL-__ �-L-L�iLU
0 . 1 1 1 0 1 0 0 f (Hz)
Figure 6 The frequency power spectrum of temperature fluctuations i n the center of the A = 0.5 helium cell at Ra = 7.3 x 10¹⁰ from Wu et al ( 1 990). Two traces at different sampling rates are superimposed. The measured large-scale velocity is I I em/sec at this Ra and the cell diameter is 20 cm.
experiments, Solomon & Gollub ( 1990, 1991 ) devised a way to apply an external shear to a convection system (water with Ra � 3 x 10⁸) while measuring Nu(Ra) and visualizing with temperature sensitive liquid crystals. The shear was created by using, as. a lower "plate," mercury that was set in motion by running a current through it in the presence of fixed magnetic field. In one study, oscillatory solid body rotation was induced in the mercury so that the shear zone in the water had a thickness comparable to the thermal boundary layer and a maximum velocity at that height of - 4 times the natural one. The shear drastically changed the number and size of plumes, but left Nu(Ra) unchanged. In a second experiment, a fixed 4 x 4 grid of alternating vertical vortex columns in the mercury created, via Ekman pumping, a roughly fixed array of secondary flows in the overlying water layer. The heat flux then scaled with the
Ann
u. R
ev. F
luid
Mec
h. 1
994.
26:1
37-1
68. D
ownl
oade
d fr
om w
ww
.ann
ualr
evie
ws.
org
Acc
ess
prov
ided
by
Uni
vers
ity o
f C
alif
orni
a -
San
Die
go o
n 04
/04/
21. F
or p
erso
nal u
se o
nly.

HIGH RA CONVECTION 1 59
imposed forcing. The magnitude of the effect was sufficient to account for the change from the mixing length expression for Nu(Ra) to (2. 1 7a), a result that supports the importance of the mean flow.
3 . 5 Probability Distribution Function of Temperature and its Derivatives
In the first systematic measurements of the temperature probability distribution function, PDF, in convection by Castaing et al ( 1 989), universal (Ra independent when scaled to unit variance), nearly exponential, distributions appeared at the center of the cell within the 2/7 regime (Figure 7). More extensive measurements by the Libchaber group and others, plus numerical simulations, have made the systematics for the occurrence of these unexpected distributions more obscure rather than less. The subject has taken on a life of its own which we now recount.
1 0 1
1 00
1 0 - 1
,.-..., CD '---'
1 0 -2 � Q 0..
1 0 -3
- 5 a 5 e/u
Figure 7 The temperature PDF from Castaing et al ( 1989) for Ra = 2.7 x 10', 2.3 X 10⁹, 4.2 x 1 0 ' ", and 5.4 x 1 0 I I , increasing downwards. The data at each Ra are offset by a factor of 3 and the temperature is normalized to the variance at each Ra.
Ann
u. R
ev. F
luid
Mec
h. 1
994.
26:1
37-1
68. D
ownl
oade
d fr
om w
ww
.ann
ualr
evie
ws.
org
Acc
ess
prov
ided
by
Uni
vers
ity o
f C
alif
orni
a -
San
Die
go o
n 04
/04/
21. F
or p
erso
nal u
se o
nly.
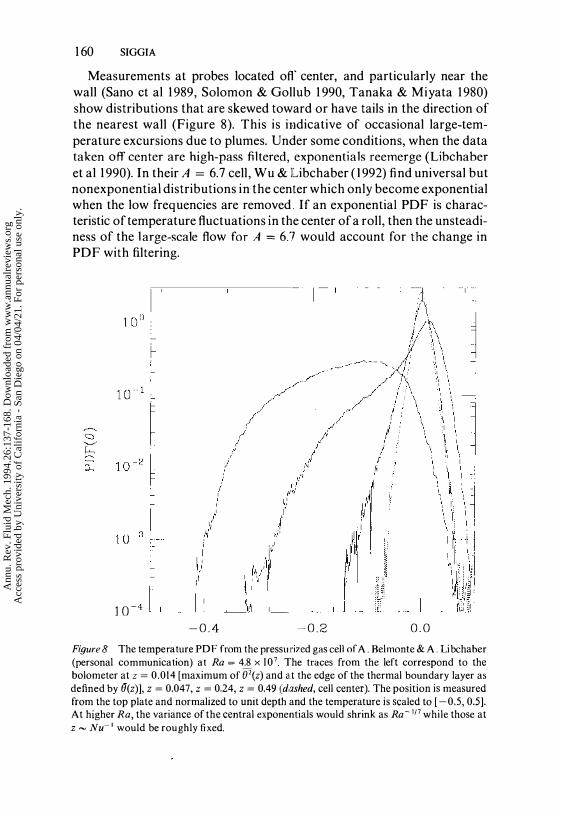
1 60 SIGGIA
Measurements at probes located ofr center, and particularly near the wall (Sano ct al 1989, Solomon & Gollub 1 990, Tanaka & Miyata 1980) show distributions that are skewed toward or have tails in the direction of the nearest wall (Figure 8). This is iNdicative of occasional large-temperature excursions due to plumes. Under some conditions, when the data taken off center are high-pass filtered, exponentials reemerge (Libchaber et aI 1990). In their A = 6.7 cell, Wu & Libchaber (1992) find universal but nonexponential distributions in the center which only become exponential when the low frequencies are removed . If an exponential PDF is characteristic of temperature fluctuations in the center of a roll, then the unsteadiness of the l arge-scale flow for A = 6.7 would account for the change in PDF with filtering.
!! � �
10-4 LL __ ��� __ �-L __ L __ L--L� __ �t_l-L� __ i-�
- 0 . 4 - 0 . 2 0 . 0 Figure 8 The temperature PDF from the pressurized gas cell of A . Belmonte & A . Libchaber (personal communication) at Ra = 4.8 x 10⁷ The traces from the left correspond to the bolometer at z = 0.014 [maximum of O'(z) and at the edge of the thermal boundary layer as defined by 8(z)], z = 0.047, z = 0.24, z = 0.49 (dashed, cell center). The position is measured from the top plate and normalized to unit depth and the temperature is scaled to [ - 0.5, 0.5]. At higher Ra, the variance of the central exponentials would shrink as Ra - 1j7 while those at z � Nu- I would be roughly fixed.
Ann
u. R
ev. F
luid
Mec
h. 1
994.
26:1
37-1
68. D
ownl
oade
d fr
om w
ww
.ann
ualr
evie
ws.
org
Acc
ess
prov
ided
by
Uni
vers
ity o
f C
alif
orni
a -
San
Die
go o
n 04
/04/
21. F
or p
erso
nal u
se o
nly.

HIGH RA CONVECTION 1 6 1
Solomon & Gollub ( 1990) at Ra � 108 i n water find exponentials i n the center irrespective of the shear they impose on the boundary layer which qualitatively alters the emission of plumes. The global flow state at these Ra is probably not the same in water as in helium, because of the higher Pr and lower Re. Numerical simulations of the temperature PDF are discussed in Section 4.
There is a general expectation that the PDFs of large-scale quantities in turbulence are Gaussian (Tennekes & Lumley 1 972). So it is of interest to note two recent experiments, which following a suggestion of Pumir et al ( 1 99 1), demonstrate one mechanism for the production of exponentials. In both cases the temperature was passive, the turbulence was homogeneous, and its integral scale was much less than the lateral dimension along which a constant temperature gradient was imposed. Gollub et al ( 199 1 ) obtained a stationary distribution in water by forcing with an oscillatory grid and found a remarkably exponential temperature distribution (flatness :<: 5 .5) for large enough Re. Their velocity field was nonisotropic but reasonably Gaussian in the direction along the scalar gradient.
Jayesh & Warhaft ( 1 99 1 , 1 992) studied conventional grid turbulence where the temperature PDF had exponential tails but a smaller flatness factor of 3.8-5 throughout the tunnel. They also introduced temperature variance with no mean gradient and found a strictly Gaussian distribution. The relevance of any of this to convection will be decided by whether measurements of 8(z) reveal an appreciable linear gradient [on the scale of (e - On in the cell center.
The Jayesh-Warhaft experiment does make implausible a theory of Sinai & Yakhot ( 1 989) which yielded an algebraic PDF (with a Gaussian limit) for a passive decaying scalar in the absence of a mean gradient (the experiment gave Gaussians). Their theoretical reexpression of the PDP in terms of a conditional probability is rigorous but subsequent arguments that close this expression are probably superfluous if they only function to rederive a Gaussian. Also flawed is the theory Yakhot ( 1 989), who factored out the z-dependent quantity, ozO, from a volume average, and made other ad hoc decouplings.
Ching ( 1 99 1 ) fits the PDFs of temporal temperature differences from the center probe in the A = 1 cell of Wu ( 1 99 1 ), to P(x) = a exp ( - b l x l"). For short time differences, which approximate a derivative, and all Ra <: 1 08, she found c = O.5 ± O.05 followed by a crossover to c � 1 .7 ± O. l for large differences. The later data are also consistent with a Gaussian core plus exponential tails and would be more noticeably exponential if it were high-pass filtered. There are no theoretical predictions for the derivative PDF, though it has "usp-like behavior near the origin down to scales much less than the variance.
Ann
u. R
ev. F
luid
Mec
h. 1
994.
26:1
37-1
68. D
ownl
oade
d fr
om w
ww
.ann
ualr
evie
ws.
org
Acc
ess
prov
ided
by
Uni
vers
ity o
f C
alif
orni
a -
San
Die
go o
n 04
/04/
21. F
or p
erso
nal u
se o
nly.

1 62 SIGGIA
3.6 Convection /or Pr « 1 The effects of large-scale flow and shear should all be magnified at low Pro In mercury, with Pr '" 0.02, it is feasible under Boussinesq conditions to exceed the upper limit in (2. 18), and perhaps also the threshold for the crossover from (2.10) to (2.12) (S. Ciliberto, private communication). The range of 2/7 scaling predicted by (2. 18) is rather small but may extend to lower Ra in large aspect ratio cells if the helium data are reliable. Whether Nu(Ra) goes directly to (2. 12) or proceeds via (2. 1 0) when Ra exceeds the upper limit in (2. 1 8) is unclear.
To date, the best measurements of Nu are those of Rossby ( 1969) (Table 1 ) , which agree very well with the analytic calculations of Busse & Clever ( 1 98 1 ) for Nu - 1 , i.e. 31[/64(2 Ra) 1/4, as regards prefactor and exponent. However, the difference between Nu (the quantity fit in the experiments) and (Nu- l ) is quite material when the highest Nu attained in the lab was 4! If the theory of Busse & Clever ( 1 98 1 ) is used to infer the Rayleigh number at which Re '" 3000, and where a transition to (2. 1 7a,b) may occur; one finds Ra - 1 0 5, near the highest value attained by Rossby, and in good agreement with the lower limit in (2. 1 8) obtained by fitting to the helium data. Suffice it to say, more extensive measurements in mercury should be very rewarding.
4. NUMERICAL SIMULATIONS Most of the experiments we have discussed are well beyond the capabilities of current computers, so serious compromises are required if simulations are to contribute at all to the discussion. The optimal trade-off between computational efficiency and fidelity to experiment are spectral methods that assume periodic or free-slip. boundaries laterally and use Chebyshev polynomials with no-slip boundary conditions in the vertical. Since derivatives are not reduced to multiplications by the Chebyshev transform, imposing rigid boundaries laterally would significantly complicate the Poisson inversion for the pressure.
The number of grid points should seale as the cube of the Kolmogorov wave number, (Nu Ra/ Pr2) 1/4, for Pr ;S 1 (Grotzbach 1 983) or the Batchelor cutoff for the temperature, (Nu Ra) 1/4 (Tennekes & Lumley 1 972) otherwise. The boundary layers should be well resolved, for large Ra, since if the bulk grid spacing is £, near the walls it becomes £2. The inverse time step is limited to Re times the cutoff wave number, though large eruptions from the boundary layers may strain this limit. Therefore the operation count required for one circulation time scales as ",-, Ra 16/9 assuming (2.9, 2. 1 0) . To set the coefficient, Kerr ( 1993) for instance needs 482 x 96 modes
Ann
u. R
ev. F
luid
Mec
h. 1
994.
26:1
37-1
68. D
ownl
oade
d fr
om w
ww
.ann
ualr
evie
ws.
org
Acc
ess
prov
ided
by
Uni
vers
ity o
f C
alif
orni
a -
San
Die
go o
n 04
/04/
21. F
or p
erso
nal u
se o
nly.

HIGH RA CONVECTION 1 63
per unit aspect ratio at Ra '" 1 0 7 and ", 8 Cray YMP hours to simulate one circulation time at this resolution.
The most realistic simulations currently are those of Kerr ( 1 993) who treats an A = 6 cell at Ra up to 2 X 1 07; but the integration times are ", half a circulation time which is cause for concern. He finds the velocity spectra and derivative skewness to be comparable to conventional turbulence simulations at similar large-scale Re ( ;s 1 0 3). This finding argues against the unconventional scaling (2. 1 9), which suppresses the energy cascade. The spectrum of <8(k)vz( - k) is of interest in the same context and easily accessible numerically. Contour pl()ts at fixed z of 8 and Vz show circular structures within the thermal boundary layer and more sheet-like entities further away. Plumes can penetrate substantially through the cell, as shown by the skewness of the temperature fluctuations, and the 8 PDF is only reasonably exponential in the cell center at the highest Ra. Kerr's Re is not high enough to honestly apply (2. 1 7a,b) but perhaps the arguments leading to (2. 1 3) could be checked.
Extensive statistics are also reported by Balachandar et al ( 1989) and Balachandar & Sirovich ( 1 99 1 ) in a three-dimensional A = 2j2 cell with Ra up to 107 but with free slip top and bottom boundaries. Christie & Domaradzki ( 1 993), with a code similar to Kerr's, find substantial dependence of the 8 PDF on aspect ratio at fixed Ra, but this may be due to the low values of Ra ( ;S 6.3 x 1 0 5) . The tendency, however, for small A to favor exponentials, accords with the experiments in helium discussed in Section 3 .5 .
Low Pr three-dimensional simulations are reviewed and extended by Thual ( 1 992), who is primarily interested in the onset of turbulence. He also reports simulations done for Pr = 0, the limit being taken as if Pe -+ 0.
Werne et al ( 199 1), DeLuca et al ( 1990), and J. Werne (private communication) work in two dimensions with rigid horizontal and free slip vertical walls and A = I, and thus are able to reach Ra = 1 .6 x 1 08 and integrate for '" 10 2 convective times. They see a transition to exponential PDFs which are symmetrical within the well-mixed core, and find exponents for Nu(Ra) and Re(Ra) of 0.290 ± 0.005 and 0.55 ± 0.02, respectively, for 5 x 10⁶ < Ra < 1 .6 x 1 08• They have a coherent flow (which was not seen in any of the three-dimensional simulations), and most of the heat transport is along the vertical walls. Some caution is in order because the simulations are at Pr = 6, and at Pr = I they are very much less turbulent, contrary to experiment. Also, real turbulent boundary layers are inherently three dimensional, so the assumptions made in deriving (2. 1 7a,b) do not apply in detail.
The interesting problem of infinite Pr convection was addressed in Hansen et a1 ( 1 990, 1 992) in two dimensions with free slip top and bottom
Ann
u. R
ev. F
luid
Mec
h. 1
994.
26:1
37-1
68. D
ownl
oade
d fr
om w
ww
.ann
ualr
evie
ws.
org
Acc
ess
prov
ided
by
Uni
vers
ity o
f C
alif
orni
a -
San
Die
go o
n 04
/04/
21. F
or p
erso
nal u
se o
nly.

1 64 SIGGIA
boundaries, lateral periodicity, with A ;:S lO for Ra ;:S 108 and A = 1 . 8 at Ra = lO9. The turbulence consists of random thermals plus a coherent flow. The Nu(Ra) exponent is 0.315, consistent with (2.4b), and that for the energy spectrum, treated as isotropic, is - 2.
5 . CONCLUSION AND FUTURE PROSPECTS
Turbulent convection in the past five years has become an exciting subject because experimental advances have firmly established an alternative to the critical boundary theory and the Nu � Ra l/3 scaling. The new physics brings with it all the complexities of turbulent shear flow, and argues for a convergence between conventional engineering turbulence approaches and convection research. The introduction of shear makes Pr as important a parameter as Ra; conventional mixing length ideas work well only for large Pr where the ! exponent applies, whereas the new work utilized helium with Pr � l . The appearance of a large-scale flow-the source of the shear-also accentuates the relevance of the aspect ratio parameter.
The flow-dominated 2/7 regime (i .e. Nu � Ra2f7) has a greater heat flux than the 1 /3 scaling for all accessible Ra as is intuitively reasonable; 2 and only paradoxical when one ignores the coefficient [i.e. (2. 10) vs (2. 1 7a)]. In fact, numerical factors are indispensable to those indulging in phenomenological considerations since numbers of order one are frequently � 0. 1 or � 1 0, and are then raised to the 7th or 9th power when terms are balanced (cf Sections 2.3-2.4). That the 2/7 regime is not asymptoticmost probably only (2.12) is-does not detract from its importance, since by a numerical conspiracy it occurs over a wide range of Rayleigh numbers.
Our present understanding of anything turbulent is at best phenomenological, so a multiplicity of measurements on the same system is essential to advance our understanding. Thus Re(Ra) is no less interesting than Nu(Ra) and the various temperature PDFs have a wealth of unexploited information. In the near future we can expect a detailed picture of the twodimensional projected velocity via particle tracking (Adrian et al 1 990) which should resolve questions about Equation (2. 1 9) (see also Tong & Shen 1 992) . Better measurements of the vz -8 correlation function will also help determine heat transport scales and quantify the amount of heat that moves along the side walls. It may also be of interest to intentionally tilt the cell and thus introduce a new parameter which couples directly to
2 For lower Ra (;;S 106) the effects of an imposed shear on convection are more complex, see Domaradzki & Metcalfe ( 1 988).
Ann
u. R
ev. F
luid
Mec
h. 1
994.
26:1
37-1
68. D
ownl
oade
d fr
om w
ww
.ann
ualr
evie
ws.
org
Acc
ess
prov
ided
by
Uni
vers
ity o
f C
alif
orni
a -
San
Die
go o
n 04
/04/
21. F
or p
erso
nal u
se o
nly.

HIGH RA CONVECTION 165
the mean flow. Expected too are measurements of e"(z) for Ra up to 1 0 I I
(A. Belmonte & A. Libchaber) which should provide a challenge to those pursuing one-point closures. Finally, one can hope that the very qualitative picture we have for plume formation in the presence of shear can be quantified via the methodology developed for turbulent bursts.
In contrast to this experimental cornucopia, theory can offer only a few crumbs. Two mechanisms [i.e. the arguments preceding (2. 1 3) and (2. 1 7a,b)] for the 2/7 regime have been offered by way of "postdiction." The Re(Ra) exponent in (2. 1 3) is close to, but definitely distinct from, experiment, whereas (2. 1 7b) works much better. However for large aspect ratios, the 2/7 exponent is seen at much lower Ra than (2. 1 8) would suggest. Perhaps the turbulent boundary layer is not a consequence of a bulk-driven mean flow as was assumed in deriving (2. 1 8), but rather the buoyancy and plumes force the boundary layer directly and render it turbulent. The bulk flow would then derive from the boundary layers, which is an inversion of the usual situation encountered in engineering problems. Leaving aside numerical coefficients, the Pr dependence of the upper and lower limits in (2. 1 8) is a legitimate prediction which should be tested by experiments in mercury. The more fundamental problem, to explain from first principles why there is a mean flow and a 2/7 exponent, is beyond reach.
While the 22 year gap between this review and its predecessor in these series (Spiegel 1 97 1) , seems to have inconvenienced no one, the current rate of experimental advances will soon antiquate this summary and humiliate its author where he was rash enough to make predictions.
ACKNOWLEDGMENTS
Whatever new perspective this review brings to convection stems from my continuing collaboration with Boris Shraiman whose contributions extend far beyond the few brief articles we coauthored. My understanding of the experiments owes much to discussions with Albert Libchaber, Jerry Gollub and their students. R. Kerr and J. Werne provided similar assistance with the simulations. All figures were reploted from the original data which was kindly supplied by A. Belmonte, E. Ching, and X. Wu. Belmonte, Gollub, Libchaber, and Shraiman commented on a draft of this review. A substantial fraction of the authors cited provided copies of their papers and responded to my questions. Space permits only a collective thanks. Financial support was supplied by the Air Force Office of Scientific Research grant no. 9 1 -00 1 1 , and the National Science Foundation grant no. DMR-90 12974.
Ann
u. R
ev. F
luid
Mec
h. 1
994.
26:1
37-1
68. D
ownl
oade
d fr
om w
ww
.ann
ualr
evie
ws.
org
Acc
ess
prov
ided
by
Uni
vers
ity o
f C
alif
orni
a -
San
Die
go o
n 04
/04/
21. F
or p
erso
nal u
se o
nly.

166 SIGGIA Literature Cited
Adrian, R. J. , Offitt, P. W., Liu, Z.-c., Hanratty, T. 1., Landreth, C. C. 1 990. Studies of liquid turbulence using double-pulsed particle correlation. In Application of Laser Techniques to Fluid Mechanics, ed. R. J. Adrian, D. F. G. Durao, F. Durst, M. Maeda, J. H. Whitelaw, pp. 435-5 1 . New York: Springer-Verlag. 479 pp.
Balachandar, S., Maxey, M. R. , Sirovich, L. 1 989. Nurnerical simulation of high Rayleigh number convection. J. Sci. Comput. 4: 1 19-236
Balanchandar, S., Sirovich, L. 1991. Probability distribution functions in turbulent convection. Phys. Fluids A 3: 9 1 9-27
Busse, F. H . 1 978. The optimum theory of turbulence. Adv. Appl. Mech. 1 8: 77-12 1
Busse, F. H . 198 1 . Transition t o turbulence in Rayleigh-Benard convection. In Topics in Applied Physics, ed. H . L. Swinney, 1. P. Gollub, 45: 97-137. Berlin/Heidelberg/New York: Springer-Verlag
Busse, F. H. 1983. Generation of mean flows by thermal convection. Physica D 9: 287 -99
Busse, F. H ., Clever, R. M. 1 981 . An asymptotic model of two-dimensional Convection in the limit oflow Prandt! number. 1. Fluid Mech. 1 02: 75-83
Castaing, B. , Gunaratne, G., Heslot, E, Kadanoff, L. Libchaber, A., et al. 1989. Scalinr; of hard thermal turbulence in Rayleigh-Benard convection. J. Fluid Mech. 204: 1-30
Ching, E. S. C. 1 99 1 . Probabilities for temperature differences in Rayleigh-Benard convection. Phys. Rev. A 44: 3622-29
Christie, S. L, Domaradzki, J. A. 1 993. Numerical evidence for nonuniversality of the soft/hard turbulence classification for thermal convection. Phys. Fluids A 5: 412-2 1
Chung, M . K . , Yun, H. C., Adrian, R . J. 1992. Scale analysis and wall-layer models for the temperature profile in turbulent thermal convection. Int. J. Heat Mass Transfer 35: 43-5 1
Clever, R. M., Busse, F. H. 199 1. Instabilities of longitudinal rolls in the presence of Poiseuille flow. J. Fluid Mech. 229: 5 17-29
Clever, R . M ., Busse, F. H. 1 992. Threedimensional convection in a horizontal fluid layer subjected to a constant shear. J. Fluid Mech. 234: 5 1 1-27
Cross, M. C., Hohenberg, P. C. 1 993. Pattern formation outside of equilibrium. Rev. Mod. Phys. To appear
DeLuca, E. E. , Werne, J . , Rosner, R. 1 990. Numerical simulations of soft and hard turbulence: preliminary results for two-
dimensional convection. Phys. Rev. Lett. 64: 2370-73
Domaradzki, J. A., Metcalfe R. W. 1 988. Direct numerical simulations of the effects of shear on turbulent Rayleigh-Benard convection. J. Fluid Mech. 1 93: 499-53 1
Fitzjarrald, D . E . 1976. An experimental study of turbulent convection in air. J. Fluid Mech. 73: 693-71 9
Garon, A . M . , Goldstein, R . J . 1973. Velocity and heat transfer measurements in thermal convection. Phys. Fluids 16: 1 8 18-25
Globe, S., Dropkin, D. 1959. Natural-convection heat transfer in liquids confined by two horizontal plates and heated from below. J. Heat Transfer Trans: ASME 8 1 : 24-28
Gluckman, S. J. , Willaime, H., Gollub, J. P. 1 993. Geometry of Isothermal and Isoconcentration surfaces in thermal turbulence. Phys. Fluids A 5: 647-61
Goldstein, R. J., Chiang, H. D., See, D. L. 1 990. High-Rayleigh-number convection in a horizontal enclosure. J. Fluid Mech. 213 : 1 1 1-26
Goldstein, R. J., Tokuda, S. 1 980. Heat transfer by thermal convection at high Rayleigh numbers. Int J. Heat Mass Transfer 23: 73 8-40
Gollub, J. P., Clarke, J., Gharib, M. , Lane, s., Mesquita, O. N. 1 99 1 . Fluctuations and transport in a stirred fluid with a mean gradient. Phys. Rev. Lett. 67: 3507-10
Grossmann, S . , Lohse, D. 1 993. Characteristic scales in Rayleigh-Benard turbulence. Phys. Lett. A 1 73 : 58
Grotzbach, G. 1983. Spacial resolution requirements for direct numerical simulations of the Rayleigh-Benard Convection. J. Com put. Phys. 49: 241-64
Hansen, U., Yuen, D. A., Kroening, S. E. 1 990. Transition to hard turbuh:nce in thermal convection at infinite Prandtl number. Phys. Fluids A 2: 2 157-63
Hansen, U., Yuen, D. A., Malevsky, A. V . 1 992. Comparison o f steady-state and strong chaotic thermal convection at high Rayleigh number. Phys. Rev. A 46: 4742-54
Head, M . R., Bandyopadhyay, P. 198 1. New aspects of turbulent boundary-layer structure. 1. Fluid Mech. 107: 297-338
Heslot, F., Castaing, 8., Libchaber, A. 1 987. Transitions to turbulence in Helium gas. Phys. Rev. A 36: 5 870-73
Hesselink, L. 1 988. Digital image processing in flow visualization. Annu. Rev. Fluid Mech. 20: 42 1-85
Hinze, 1. O. 1 975. Turbulence. New York: McGraw Hill. 790 pp. 2nd ed.
Ann
u. R
ev. F
luid
Mec
h. 1
994.
26:1
37-1
68. D
ownl
oade
d fr
om w
ww
.ann
ualr
evie
ws.
org
Acc
ess
prov
ided
by
Uni
vers
ity o
f C
alif
orni
a -
San
Die
go o
n 04
/04/
21. F
or p
erso
nal u
se o
nly.

Howard, L. 1 972. Bounds on flow quantities. Annu. Rev. Fluid Mech. 4: 473-94
Howard, L. N. 1 990. Limits on the transport of heat and momentum by turbulent convection with large-scale flow. Stud. Appl. Math. 83: 273-85
Howard, L. N., Krishnamurti, R. 1 986. Large scale flow in turbulent convection a mathematical model. J. Fluid Mech. 1 70: 385-41 0
Jayesh, Warhaft, Z . 1 99 1 . Probability distribution of a passive scalar in grid-generated turbulence. Phys. Rev. Lett. 67: 3503-6
Jayesh, Warhaft, Z. 1 992. Probability distribution, conditional dissipation, and transport of passive fluctuations in gridgenerated turbulence. Phys. Fluids A 4: 2292-307
Kerr, R. M. 1 993. Simulations of high Rayleigh number convection. J. Fluid Mech. Submitted
Kraichnan, R. H. 1 962. Turbulent thermal convection at arbitrary Prandtl number. Phys. Fluids 5: 1 374-89
Krishnamurti, R., Howard, L. N. 198 I . Largescale flow generation in turbulent convection. Proc. Natl. Acad. Sci. 78: 1981-85
Landau, L. D., Lifshitz, E. M . 1 987. Fluid Mechanics. Elmsford, NY: Pergamon. 539 pp. 2nd ed.
Lathrop, D. P., Fineberg, J., Swinney, H. L. 1 992. Transition to shear-driven turbulence in Couette-Taylor flow. Phys. Rev. A 46: 6390-405
Libchaber, A., Sano, M., Wu, X. 1 990. About thermal turbulence. Physica A 1 63: 258-64
Lu, S. S., Willmarth, W. W. 1973. Measurements of the structure of the Reynolds stress in a turbulent boundary layer. J. Fluid Mech. 60: 481-5 1 I
Mestayer, P. 1982. Local isotropy and anisotropy in a high Reynolds number turbulent boundary layer. J. Fluid Mech. 1 25: 475-503
Moses, E., Zocchi, G., Libchaber, A. 1 993. A localized heat source: an experimental study of laminar plumes. J. Fluid Mech. To appear
Newell, A. c., Passot, T., Lega, J. 1 993. Order parameter equations for patterns Annu. Rev. Fluid Mech. 25: 399-453
Procaccia, 1. , Ching, E. S. c., Constantin, P., Kadanoff, L. Libchaber, A., et al. 1 99 1 . Transitions i n convective turbulence: the role of thermal plumes. Phys. Rev. A 44: 8091 - 1 02
Procaccia, I. Zeitak, R. 1 989. Scaling exponents in non isotropic turbulence. Phys. Rev. Lell. 62: 2 1 28-3 1
Proctor, M. R. E. 1 977. Inertial convection
HIGH RA CONVECTION 1 67 at low Prandtl number. J. Fluid Mech. 82: 97- I I4
Pumir, A., Shraiman, B. 1., Siggia, E. D. 1 99 1 . Exponential tails and random advection. Phys. Rev. Lett. 66: 2984-87
Roberts, G. O. 1 979. Fast viscous Benard convection. Geophys. ASlrophys. Fluid Dyn. 1 2: 235-72
Rossby, H. T. 1 969. A study of Benard convection with and without rotation. J. Fluid Mech. 36: 309-35
Sano, M . , Wu, X., Libchaber, A. 1 989. Turbulence in helium-gas free convection. Phys. Rev. A 40: 642 1-30
Sreenivasan, K. 1 99 1 . On local isotropy of passive scalars in turbulent shear flows. Proc. R. Soc. London SeT. A 434: 1 65-82
Shelley, M. J. , Vinson, M. 1992. Coherent structures on a boundary layer in Rayleigh-Benard turbulence. Nonlinearity 5: 323-51
Shraiman, B. 1., Siggia, E. D. 1 990. Heat transport in high-Rayleigh-number convection. Phys. Rev. A 42 : 3650-53
Sinai, Y. G., Yakhot, V. 1989. Limiting probability distributions of a passive scalar in a random velocity field. Phys. Rev. Lett. 63: 1 962-64
Solomon, T. H., GolIub, J. P. 1 990. Sheared boundary layers in turbulent RayleighBenard Convection. Phys. Rev. Lett. 64: 2382-85
Solomon, T. H. , GolIub, J. P. 1 99 1 . Thermal boundary layers and heat flux in turbulent convection: the role of recirculating flows. Phys. Rev. A 45: 1 283
Spiegel, E. A. 1 97 1 . Convection in stars. Annu. Rev. Astron. Astrophys. 9: 323-52
Spruit, H. C., Nordlund, A., Title, A. M. 1 990. Solar convection. Annu. Rev. Astron. Astrophys. 28: 263-301
Tanaka, H., Miyata, H. 1 980. Turbulent natural convection in a horizontal water layer heated from below. Int. J. Hellt Mass Transfer 23: 1 273-8 1
Tennekes, H., Lumley, J. L. 1 972. A First Course in Turbulence. Cambridge/ London: MIT press. 300 pp.
Threlfall, D. C. 1 975. Free convection in lowtemperature gaseous helium. J. Fluid Mech. 67: 1 7-28
Thual, O. 1 992. Zero PrandtI number convection. J. Fluid Mech. 240: 229-58
Tong, P., Shen, Y. 1 992. Relative velocity fluctuations in turbulent Rayleigh-Benard convection. Phys. Rev. Lett. 67: 2066-69
Tritton, D. J. 1 988. Physical Fluid Dynamics. Oxford: Oxford Univ. Press. 5 1 9 pp. 2nd ed.
Turner, J. S. 1 973. Buoyancy Effects in Fluids. London: Cambridge Univ. Press. 367 pp.
Werne, J. 1 993. The structure of hard-turbulent convection in two dimensions;
Ann
u. R
ev. F
luid
Mec
h. 1
994.
26:1
37-1
68. D
ownl
oade
d fr
om w
ww
.ann
ualr
evie
ws.
org
Acc
ess
prov
ided
by
Uni
vers
ity o
f C
alif
orni
a -
San
Die
go o
n 04
/04/
21. F
or p
erso
nal u
se o
nly.

1 68 SIGGIA
numerical evidence. Phys. Rev. E To appear
Werne, 1 . , DeLuca, E. E., Rosner, R. , Cattaneo, F. 1 99 1 . Development of hard-turbulent convection in two dimensions: numerical evidence. Phy. Rev. Lett. 67: 3 5 1 9�22
Wu, X. 1991. Along a road 10 developed turbulence: (ree thermal convection in low temperature helium gas. Thesis. Univ. Chicago, Dept Phys.
Wu, X., Kadanoff, L., Libchaber, A., Sano, M. 1 990. Frequency power spectrum of fluctuations in free convection. Phys. Rev. Lett. 64: 2 140-43
Wu, X., Libchaber, A. 1992. Scaling relations in thermal turbulence: the aspect-ratio dependence. Pilys. Rev. A 45: 842-45
Yakhot, V. 1 989. Probability distributions in high-Rayleigh-number Benard convection. Pilys. Rev. Lett. 63: 1 965�67
ZaJeski, S. 1991. Boundary layer stability and heat flux in Rayleigh-Benard experiments. C. R. Acad. Sci. Paris 3 1 3 Ser. B: 1099�103
Zocchi, G., Moses, E., Libchaber, A. 1 990. Coherent structures in turbulent convection, an experimental study. Physica A 1 66: 387-407
Ann
u. R
ev. F
luid
Mec
h. 1
994.
26:1
37-1
68. D
ownl
oade
d fr
om w
ww
.ann
ualr
evie
ws.
org
Acc
ess
prov
ided
by
Uni
vers
ity o
f C
alif
orni
a -
San
Die
go o
n 04
/04/
21. F
or p
erso
nal u
se o
nly.

![Rayleigh wave phase velocities, small-scale convection ...eps.mq.edu.au/~yingjie/publication/2005_JGR_3D_scalifornia.pdf · [6] In this paper, we use Rayleigh wave data recorded at](https://img.pdfslide.us/doc/110x75/5edab837272674784f04f44a/rayleigh-wave-phase-velocities-small-scale-convection-epsmqeduauyingjiepublication2005jgr3d.jpg)


![Convection Workshop - Illinois Institute of Technology · Free (Natural) Convection: Grashof number and Rayleigh number For ideal gas, β = 1/T [in K] Understanding Concepts Free](https://img.pdfslide.us/doc/110x75/5ba39d7309d3f238618bac17/convection-workshop-illinois-institute-of-technology-free-natural-convection.jpg)