Embed Size (px)
Citation preview
High-Performance Geospatial Analytics in HyPerSpace
Varun Pandey Andreas Kipf Dimitri VoronaTobias Mühlbauer Thomas Neumann Alfons Kemper
Technische Universität München{pandey, kipf, vorona, muehlbau, neumann, kemper}@in.tum.de
ABSTRACTIn the past few years, massive amounts of location-baseddata has been captured. Numerous datasets containinguser location information are readily available to the pub-lic. Analyzing such datasets can lead to fascinating insightsinto the mobility patterns and behaviors of users. More-over, in recent times a number of geospatial data-drivencompanies like Uber, Lyft, and Foursquare have emerged.Real-time analysis of geospatial data is essential and en-ables an emerging class of applications. Database supportfor geospatial operations is turning into a necessity insteadof a distinct feature provided by only a few databases. Eventhough a lot of database systems provide geospatial supportnowadays, queries often do not consider the most currentdatabase state. Geospatial queries are inherently slow giventhe fact that some of these queries require a couple of ge-ometric computations. Disk-based database systems thatdo support geospatial datatypes and queries, provide richfeatures and functions, but they fall behind when perfor-mance is considered: specifically if real-time analysis of thelatest transactional state is a requirement. In this demon-stration, we present HyPerSpace, an extension to the high-performance main-memory database system HyPer devel-oped at the Technical University of Munich, capable of pro-cessing geospatial queries with sub-second latencies.
1. INTRODUCTIONThere has been a rapid advancement in research areas
such as machine learning and data mining, which can beattributed to the growth in the database industry and ad-vances in data analysis research. This has resulted in aneed for systems that can extract useful information andknowledge from data. Data scientists use various data min-ing tools on top of databases for this purpose. To achievelower latencies and minimize transmission costs between thedatabase and external tools, it is necessary to move compu-tation closer to the data. The current trend in database re-search is to integrate these various analytical functionalities
PREPRINT
that are useful for knowledge discovery into the databasekernel. The goal is to have a full-fledged general-purposedatabase that allows big data analysis along with conven-tional transaction processing.
At the same time, there has been an emergence ofdata-driven applications. Companies like Uber, Lyft, andFoursquare have a need to create real-time applications,including alerting systems, that consider the most currentstate of their data, enabling real world awareness. Some ofthese applications have been enabled by the advent of theInternet of Things and the massive amounts of geotaggedsensor data it generates.
There are publicly available datasets that can help ingeospatial exploration. The New York City (NYC) TaxiRides [6] dataset is a good example, but is only a sampleof what is captured by the aforementioned companies. Thedataset contains approximately 1.1 billion taxi rides takenin the city since 2009. This represents about 470,000 taxirides everyday in one of the most densely populated citiesin the world. Uber, a popular on demand car service avail-able via a mobile application, has also made a subset ofthe taxi rides available for the cities of San Francisco andNYC. For NYC, Uber published data containing around 19million rides for the periods from April to September 2014and from January to June 2015 [9]. Ever since the datasetswere published, there have been multiple static analyses onthese datasets [10, 2, 9]. The authors of [1] present a com-prehensive system built from scratch for storing, querying,and visualizing geospatial data using kd-trees. Their systemtakes two seconds to execute a query that returns 100,000taxi trips, which is too slow to address real-time workloads.MemSQL has some real-time capabilities [7] and is one of thefirst main-memory database systems (MMDBs) to deeplyintegrate geospatial support. The current database systemsdo not offer the performance required by real-time appli-cations, and companies are often forced to build their ownsolutions [4]. We estimate that a 10x performance improve-ment is needed in general-purpose database systems to en-able such applications/analytics.
We want to offer high-performance geospatial processingin a general-purpose database system that meets the require-ments of real-time workloads, which can be used by emergingapplications and data scientists alike without having to buildtheir own system or use external tools for data analytics.Recent advancements in MMDBs research make it possibleto efficiently create snapshots of the current database state.With our proposed system called HyPerSpace, we built afirst prototype into that direction. Our goal is to drasti-
cally improve the performance of geospatial data processingin relational database systems by carefully using advancedencoding schemes and index structures. In our demo, wewill present a web-based prototype called HyPerMaps thatshows that it is possible to have an interactive analysis ongeographical data using a general-purpose database systeminstead of a custom hand-written solution.
PostGIS [8] is a spatial database extension for the Post-greSQL object-relational database system. It adds supportfor geographic objects allowing users to formulate geospatialqueries in SQL. PostGIS adds two popular spatial datatypesto PostgreSQL: geometry and geography. The geometrydatatype treats the earth as a two dimensional flat surface.The earth is projected onto a plane and geographical co-ordinates are mapped to a two dimensional cartesian co-ordinate system. When evaluating spatial predicates suchas ST Covers, ST Intersects and spatial measurements suchas ST Area, ST Distance, this datatype allows for high effi-ciency, however, it comes with a drawback. Since it treatsthe earth as a two dimensional plane, the computations arenot precise over a large area as the spherical nature of theearth is not considered. To put this into context, consideran example of the shortest distance between two points. Ina 2D cartesian plane, the shortest distance between twopoints is a straight line, while on a spheroid the shortestdistance between two points is a geodesic (shortest distanceon the great circle). In contrast to geometry, the geographydatatype treats the earth as a three dimensional spheroidand all the computations are based on the spheroid. Thecomputations are precise since they are done on a spheroid,but they are very slow compared to those on geometry.
We implemented the geography datatype and the corre-sponding geospatial predicates, such as ST Covers, in thehigh-performance hybrid OLTP and OLAP MMDB Hy-Per [3]1. We achieve much better performance compared toan open-source database PostgreSQL, a commercially avail-able MMDB (System A), and a successful key-value store(System B). This demonstration presents HyPerSpace andshowcases that an interactive analysis of huge amounts ofrapidly changing geospatial data is indeed possible.
2. HYPERSPACESimilar to what PostGIS is to PostgreSQL, HyPerSpace
is a geospatial extension to HyPer, a high-performance re-lational MMDB that is optimized for modern multi-coreCPUs. HyPer belongs to an emerging class of hybriddatabases, which enable real world awareness in real timeby evaluating OLAP queries directly in the transactionaldatabase. In HyPer, OLAP is decoupled from mission-critical OLTP either by using the copy on write feature of thevirtual memory management or multi version concurrencycontrol [5]. These snapshotting mechanisms enable HyPer-Space to evaluate geospatial predicates on rapidly changingdatasets.
For geospatial data processing in HyPerSpace, we makeuse of the Google S2 geometry library2. This is not novel,since System B also uses the S2 library for evaluating geospa-tial predicates. The novelty of our system is the integrationof geospatial functionalities into a high-performance MMDB
1When saying HyPer, we are referring to the research versionof HyPer developed at the Technical University of Munich.2https://code.google.com/archive/p/s2-geometry-library/
with snapshotting mechanisms which makes it possible toevaluate geospatial predicates on rapidly changing datasets.
At the moment, we support the three geospatial datatypesPoint, LineString, and Polygon. Most of the geospatialprocessing is done using the S2 library.
S2 decomposes the earth into a hierarchy of cells. It con-siders earth of radius 1, and encloses it in a cube that com-pletely covers it. S2 projects a point on the earth’s surfaceonto one of the cube’s faces and finds the cell that containsit. The faces of the cube are the top level cells, which can berecursively divided into four children to obtain lower levelcells. There are 30 levels in total, and cells at the same levelcover equivalent areas on earth (e.g., level 30 cells cover ap-proximately 1cm2 each). The cells are enumerated using theHilbert space-filling curve. The Hilbert curve is hierarchicalin nature and fits well with the decomposition of earth intocells. Hilbert space-filling curves are fast to encode/decodeand they have a very desirable spatial property: they pre-serve spatial locality. This means that the points on earththat are close to each other are also close on the Hilbertcurve. The enumeration of the cells gives a compact rep-resentation of each cell in a 64 bit integer called CellId. ACellId thus uniquely identifies a cell in the cell decomposi-tion. Similarly, other spatial datatypes like LineString andPolygon can be approximated using cells.
The enumeration of cells in S2 is hierarchical, which meansthat a parent cell shares its prefix with its children. To checkif a cell is contained in another, we simply need to comparetheir prefixes, which is a bit operation. This enables oneto index points based on their CellIds and thus be able toretrieve points contained in a certain cell by performing aprefix lookup on the index. B tree data structures are agood choice to index CellIds, since they support fast prefixlookups (essentially range scans). Additionally, B trees allowfor high update rates, which is an essential requirement forreal-time workloads.
3. EVALUATIONAll experiments were run single threaded on an Ubuntu
15.04 machine with an Intel Xeon E5-2660 v2 CPU(2.20 GHz, 3.00 GHz maximum turbo boost) and 256 GBDDR3 RAM and all reported performance results are av-erages over ten runs.
For evaluation, we used the NYC Taxi Rides dataset con-sisting of approximately 1.1 billion rides taken in the cityfrom January 2009 until June 2015. The dataset includesthe pickup and dropoff locations (latitudes and longitudes),pickup and dropoff times, and various details about the trip,such as distance, payment type, number of passengers, var-ious taxes, tolls, surcharge, tip amount, and total fare. Forprivacy reasons, it does not contain details about driversor passengers. The exact route taken for the trip is alsonot available. We needed to clean the dataset as some ofthe pickup or dropoff locations did not make sense as theywere way outside NYC. We cleaned such records from thedataset and only considered rides that originated betweenlongitude values -70.00 and -80.00, and latitude values 35.00and 45.00. For evaluation, we made use of the taxi data forthe month of January 2015. The cleaned dataset for January2015 contains a total of 12505344 records.
We compared HyPerSpace with the following related sys-tems: System A, System B, and PostgreSQL 9.4.5 (postgis-2.2.0). Since PostgreSQL does not support intra-query par-
20.88
6.29
9.69
0.580.63 0.290.50
5
10
15
20
HyPerSpace System A PostgreSQL System B
M c
o−or
dina
tes/
s
with index
without index
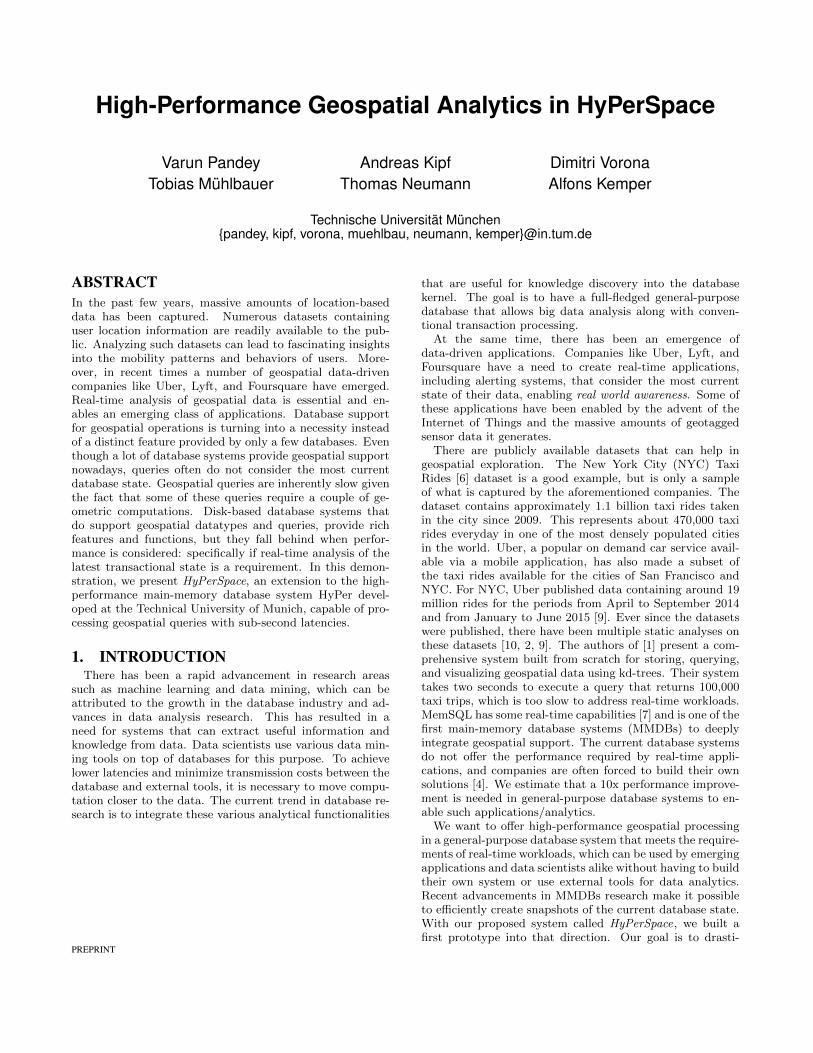
Figure 1: HyPerSpace vs. related systems: through-put of ST Covers using lat/long co-ordinates
5
3429
65
0
20
40
60
GoogleBTree CellUnionContains STLMultiMap FastContains
M c
o−or
dina
tes/
s
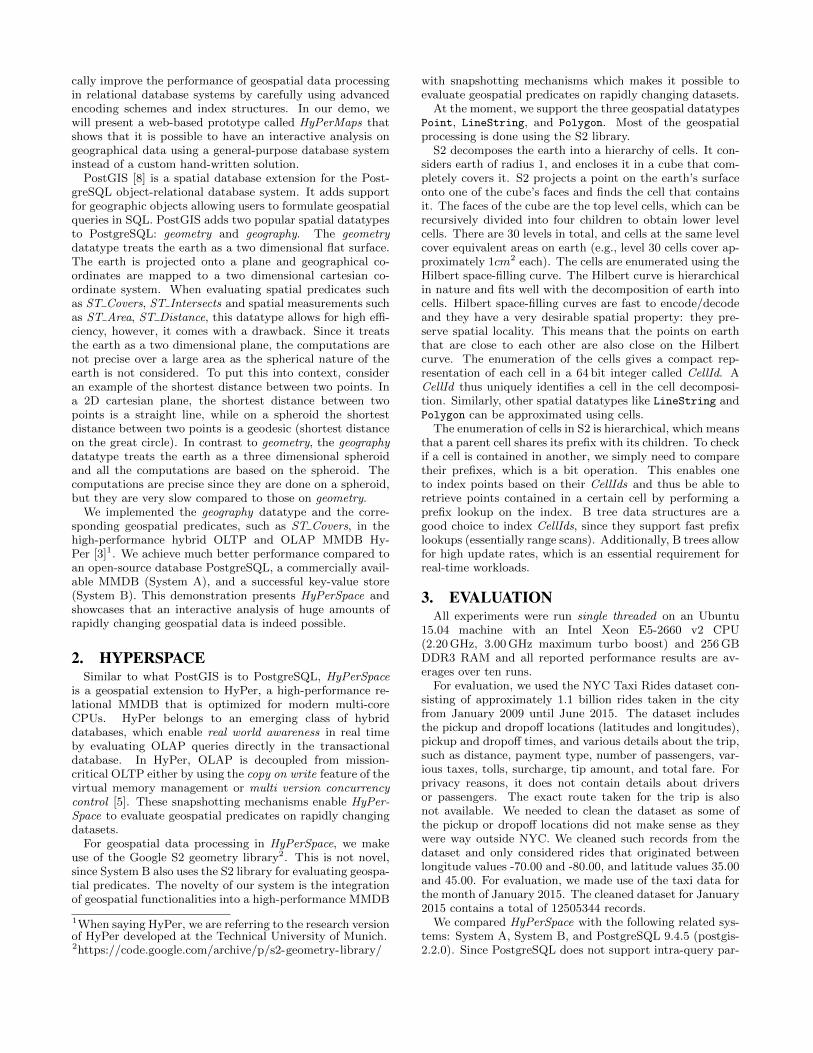
Figure 2: Microbenchmark results: throughput ofST Covers using lat/long co-ordinates
allelism, we configured all systems to run single threaded.For evaluation purposes, we find how many rides originatedfrom Midtown Manhattan in January 2015. In SQL nota-tion, the following query is issued:
select count(*)
from nyc,pickups_jan_2015
where ST_Covers(nyc.geog,pickups_jan_2015.geog)
and borough=’Manhattan’
and neighborhood=’Midtown’;
With the exception of System B, with NoSQL syntax, thequery looks similar on all systems.
Figure 1 shows the throughput of the ST Covers predicatefor all of the systems. System A, System B, and PostgreSQLachieve better performance when using appropriate indexstructures. Particularly System B, which also makes useof the Google S2 geometry library, benefits from its indexon points. System B’s index is basically a B tree on the64bit CellIds. System B computes an exterior covering ofthe polygon using the S2 library. That covering consists ofcells at various levels (i.e., of different sizes). For each cell ofthis covering, it then performs a prefix lookup in the B tree(essentially a range scan) and evaluates qualifying points foractual containment in the polygon. System B suffers heavilyfrom its document-based storage layout, since it needs toparse GeoJSON documents at runtime.
HyPerSpace completes the query in 550ms and thusachieves more than twice the performance of its closest com-petitor, which is System A with an index on points (1290ms).We have not evaluated HyPerSpace with an index on pointsyet, but ran multiple microbenchmarks outside of HyPer-Space. All microbenchmarks were implemented in C++11and compiled with gcc 4.9.2 with -O3 and -march=native
settings. We compared the implementation CellUnionCon-tains that we used in HyPerSpace as well as FastContains,which is a modified version of the S2Loop.Contains imple-mentation that skips the initial bounding box check, to thetwo index-based implementations GoogleBTree and STL-MultiMap.
Figure 2 shows the throughput of the ST Covers predicatefor the different implementations. GoogleBTree, which is an
implementation similar to System B’s index, completes theworkload in 191ms. In the GoogleBTree implementation, wefirst compute exterior and interior coverings for the givenpolygon and then perform a range scan in a Google B tree3
for each cell of the exterior covering. For each qualifyingpoint, we check whether the point is contained in the interiorcovering, which is essentially a binary search on a sorted vec-tor of CellIds. Only if a point qualifies the exterior, but notthe interior covering, an exact containment check using ourmodified implementation of the S2Loop.Contains functionneeds to be performed. The other index-based implementa-tion STLMultiMap takes twice as long (425ms) as GoogleB-Tree to complete the workload, even though it uses the sameapproach. In C++11, the stl::multi_map interface that weused in this case is implemented by a RB tree, which is lessefficient for range scans. It is well known that a B+ treewould yield even higher rates for range scans than a B tree.However, for the sake of expediency and reproducibility ofour measurements, we have used the B tree implementationprovided by Google instead of a custom B+ tree implemen-tation. Once we integrate this approach into HyPerSpace,we will make use of an optimized B+ tree implementation.The difference in performance between the two implementa-tions GoogleBTree and STLMultiMap shows that the overallruntime of this approach is heavily influenced by the actualindex structure used.
The approach CellUnionContains completes the workloadin 367ms, compared to 550ms when implemented within Hy-PerSpace. The overhead is mostly caused by function callsthat are issued for each of the 12M points. CellUnionCon-tains is a straightforward approach. It first computes thebounding box and exterior and interior coverings for thegiven polygon. For each of the points, CellUnionContainsthen performs the following steps: First, it checks whetherthe point is within the bounding box. If that is the case,it checks for containment in one of the cells of the exteriorcovering. Analogous to the containment check for the inte-rior covering, this essentially comes down to a binary search.Then the CellUnionContains approach continues analogousto the GoogleBTree approach by checking the interior cover-ing and performing the exact containment check if necessary.By properly using the S2 mechanisms, our CellUnionCon-tains approach achieves a slightly better performance thanthe index-based STLMultiMap approach, even though wehave to loop over all of the 12M points.
4. DEMONSTRATIONWe created an interactive web interface, called HyPer-
Maps, that demonstrates the outstanding geospatial pro-cessing performance of HyPerSpace on the NYC Taxi Ridesdataset. The user interaction concept of HyPerMaps is de-signed to minimize the requirement of users’ expertize withthe explored data. The ability of HyPerSpace to answerqueries with typically sub-second latency enables tight feed-back loops. It supports users during query formulation andencourages an iterative approach. During filtering of thedata, users can rely on datatype dependent elements, whichprovide context-based information like value distributions orgeographic locations in real time. Users can draw polygonson the map to filter points geographically. Subsequently,users can combine different graphical and textual represen-
3https://code.google.com/archive/p/cpp-btree/
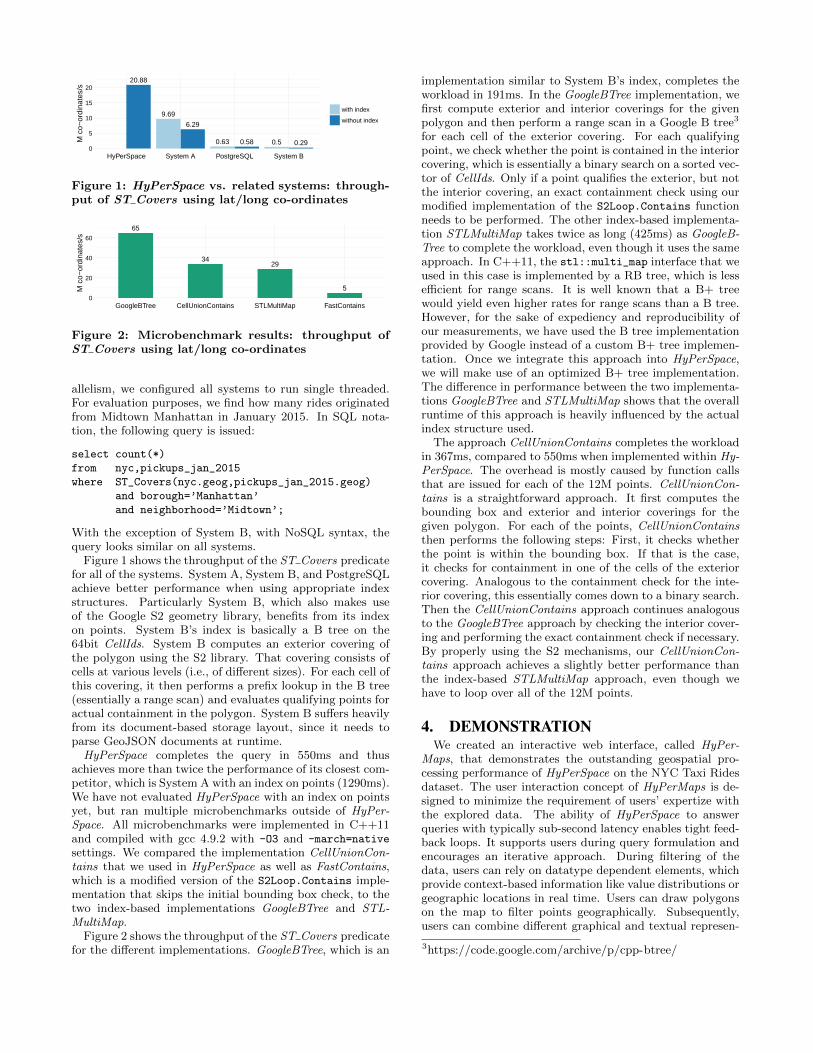
Figure 3: Interactive visualization of a real-time re-play of NYC taxi rides using HyPerMaps
tations to create an informative and intuitive visualization.During this data exploration process, HyPerMaps will au-tomatically compute updated results reflecting the currentstate of the user interface as well as the underlying dataset.
Figure 3 shows HyPerMaps visualizing the taxi dataset.On the left, various tiles allow users to specify filters onthe data, which will be immediately translated into SQLcode as illustrated on the top. This binding works in bothdirections—manually written SQL code will be translatedinto corresponding tiles. Users can choose between a heatmap and pins to display selected points on the map. Onthe right, HyPerMaps shows aggregated information aboutselected points in tabular or in chart form.
During the demonstration we will run a HyPerSpace in-stance on a demonstration laptop with two months of dataalready loaded and one month of data being replayed at var-ious speeds. We will motivate our demonstration by showinga scenario of a hotel owner wanting to install a shuttle busfor his or her guests to allow them to save money on theirarrival, departure, and daily travels by not having to takeexpensive taxis. The hotel owner will select the taxi pickuparea of his hotel by drawing a polygon on HyPerMaps, whichboils down to a similar database query that we previouslyused for the evaluation of the different systems. Then, com-mon dropoff areas of the taxi rides originating from this areawill be displayed and the hotel owner can retrieve aggregateinformation for each of these areas. HyPerMaps will com-pute how much money and CO2 emissions would be saved onaggregate if the hotel owner would install a shuttle to one ofthese dropoff areas. Additionally, we will demonstrate var-ious scenarios showing that recently ingested data will beimmediately reflected in HyPerMaps, thereby enabling realworld awareness in real time.
5. TAKE-AWAY MESSAGEIn this paper, we presented HyPerSpace, a geospatial ex-
tension to the MMDB HyPer. Our implementation of theST Covers predicate achieves a much lower latency than cor-responding implementations in related systems, without us-ing any index structures. Additionally, we found that usingindex structures optimized for range scans such as B trees orB+ trees on CellIds, can yield even lower latencies. In ourdemo, we will show that it is indeed possible to build real-time visualizations on geographical data using a general-
purpose database system instead of a custom hand-writtensolution that takes much longer to build and is harder tomaintain. The novelty of our system is the integration ofgeospatial functionalities into a high-performance MMDBthat allows for efficient snapshotting of the current databasestate. Our contribution also includes the careful use of thefeatures of the Google S2 geometry library, thereby achiev-ing much lower latencies than related systems. This makesit possible for the first time to evaluate inherently complexgeospatial predicates on high throughput data streams inreal time. To demonstrate this, we created a web inter-face that allows users to interactively explore the NYC TaxiRides dataset while the data is being replayed at variousspeeds. Our demo shows that features (such as value dis-tributions) of the entire dataset, including the most currentdata, can be used to populate UI elements, thereby sup-porting users in creating meaningful (aggregated) real-timevisualizations.
6. ACKNOWLEDGEMENTSThis work is part of the TUM Living Lab Connected Mo-
bility (TUM LLCM) project and has been funded by theBayerisches Staatsministerium fur Wirtschaft und Medien,Energie und Technologie (StMWi).
7. REFERENCES[1] N. F. Ferreira, J. Poco, H. T. Vo, J. Freire, and C. T.
Silva. Visual Exploration of Big Spatio-TemporalUrban Data: A Study of New York City Taxi Trips. InIEEE Transactions on Visualization and ComputerGraphics, pages 2149–2158, December 2013.
[2] R. Fischer-Baum and C. Bialik. Uber Is TakingMillions Of Manhattan Rides Away From Taxis.http://fivethirtyeight.com/features/uber-is-taking-millions-of-manhattan-rides-away-from-taxis/.
[3] A. Kemper and T. Neumann. HyPer: A Hybrid OLTP& OLAP Main Memory Database System Based onVirtual Memory Snapshots. In ICDE, pages 195–206,Apr. 2011.
[4] J. Miranda. Uber Unveils its Realtime MarketPlatform. http://www.infoq.com/news/2015/03/uber-realtime-market-platform/.
[5] T. Neumann, T. Muhlbauer, and A. Kemper. FastSerializable Multi-Version Concurrency Control forMain-Memory Database Systems. In SIGMOD,SIGMOD ’15, pages 677–689, New York, NY, USA,2015. ACM.
[6] TLC Trip Record Data. http://www.nyc.gov/html/tlc/html/about/trip record data.shtml.
[7] G. Orenstein. Real-Time Geospatial Intelligence withSupercar. http://blog.memsql.com/real-time-geospatial-intelligence-with-supercar/.
[8] PostGIS. http://postgis.net/.
[9] T. Schneider. Analyzing 1.1 Billion NYC Taxi andUber Trips, with a Vengeance.http://toddwschneider.com/posts/analyzing-1-1-billion-nyc-taxi-and-uber-trips-with-a-vengeance/.
[10] C. Wong. FOILing NYC’s Taxi Trip Data.http://chriswhong.com/open-data/foil nyc taxi/.


![1898.] THE PHILOSOPHY OF HYPERSPACE. 187 … · 1898.] THE PHILOSOPHY OF HYPERSPACE. 187 ... 1898.] THE PHILOSOPHY OF HYPERSPACE, 189 ... ment and ceiling of a dungeon, ...Published](https://img.pdfslide.us/doc/110x75/5af14c2a7f8b9a8c308e4e56/1898-the-philosophy-of-hyperspace-187-the-philosophy-of-hyperspace-187-.jpg)