Embed Size (px)
Citation preview

High Performance Gas Chromatography Mass Spectrometry in Addressing the Challenges of Metabolomic Studies – Separation in Time and
Mass
Jeffrey S. Patrick Director of Marketed Technology
LECO Separation Science

Outline of Presentation The Metabolomics Problem – Technologies and Challenges
The Zucker Rat Biological Problem and Other
Metabolomic Data
The Outcome of the Study – What is Expressionist?
GC-HRMS – Technology and Data
GCxGC-TOF-HRMS – Rats and Breath

Objectives • GCMS provides capabilities to define modulated analytes in populations
and phenotypes which complements LCMS • HRMS enables identification of unknowns and confident identification of
knowns – Accurate m/z for fragments – Isotopic Abundance for knowns and unknown – Mass accuracy and Isotopic abundance confirm formulae for m/z – Chemical Ionization with accurate m/z enables unknown ID – Provides linearity and sensitivity needed for metabolomics analysis
• Deconvolution enables the ability to: – detect and quantify metabolites – provide searchable spectra from difficult peak pairs – provide interpretable spectra from difficult peak pairs
• GCxGC TOF MS – – Separation of additional analytes – Differential Analysis and enhanced Sensitivity
• Genedata enables an HRMS-optimized tool for differential analysis of phenotypes and populations.

The Metabolomic Problem

Analytical Challenges in Metabolomics Accurate
Differential Analysis of
Biochemistry
Complex Samples and Analytes •Diverse samples (plants, phys
fluids, insects, tissue, etc) •Matrix Effects
•Spectral Dynamic Range •Isomer Differentiation
•Reproducibility
Range of Analyte Concentrations
Peak Capacity (1000s of
Analytes/hour)
Comprehensive Analysis (vs.
Targeted) > 60% Unknowns!
Data Interpretation Systems Biology and Contextual
Information

© R. Goodacre 13th Annual Fera/JIFSAN 2012
Can’t cover needed analytes with GC or LC Alone

Why GCMS? Fast and easy to
adopt
Sensitive, Reliable, Robust and Quantitative Linear Response
and Good Dynamic Range
Universal Application for M <
600 (w/ Deriv)
Over 50 yrs of Application and Largest Presence of ANY MS
System
HUGE Well-established
Database (>250k spectra)
Highest Peak Capacity
Chromatography
Variety of MS Opportunities
(Nominal, HRMS, MSMS)

System Under Study • Zucker Rats
– 3 Phenotypes/Strains w/ Animals bred to be • Lean (n=12), Fatty (n=12), Obese
(n=12) – 7-9 Weeks old (terminal bleed)
• Disodium EDTA as anti-coagulant • 0.1 µm filtered
• Objectives – Identify analytes which are up or down
regulated with phenotype using high performance MS
– Test the capabilities of HRTs
“Husky??”
“Fit”

Zucker Rat Study: Sample Preparation
1)Plasma (100 µL) 3) Vortex
4) Centrifuge & RemoveProtein Pellet
2) MeOH(400 µL)
5) Dry (2 hrs)6) Lyophilize(Overnight)
7) MeONH2
8) MSTFA
Pegasus GC-HRT9) FAMEs

Why High Resolution and Accurate Mass?

What are these values?
63%
48%
56%
51%
71%
68%
Percentage of Unidentified Analytes in a Metabolomic Study
Why?? Corrupt or Impure Spectra Uncertainty in m/z EI only with no M Limited MS/MS or accurate mass databases Limited Libraries to match Derivatives or Analytes Inadequate Chemical Analysis Tools

What is the real value of Accurate Mass?
Rachel L. Sleighter and Patrick G. Hatcher (2011). Fourier Transform Mass Spectrometry for the Molecular Level Characterization of Natural Organic Matter: Instrument Capabilities, Applications, and Limitations, Fourier Transforms - Approach to Scientific Principles, Prof. Goran Nikolic (Ed.), ISBN: 978-953-307-231-9, InTech, DOI: 10.5772/15959. Available from: http://www.intechopen.com/books/fourier-transforms-approach-to-scientific-principles/fourier-transform-mass-spectrometry-for-the-molecular-level-characterization-of-natural-organic-matt

Zucker Rat Study: Workflow
Pegasus GC-HRT® (EI and CI-MS)
Separation &
Detection
ChromaTOF HRT Untargeted
and/or Targeted Peak Find
GeneData (Differential Analysis)
Alignment, Normalization & Statistics
Metabolite Identification
Sample Preparation

Zucker Rat Study: Instrument Parameters GC Agilent 7890 with 7693 Auto Sampler Column Restek Rxi-5Sil MS (30m x 0.25mm x 0.25mm) & 5m
Guard Carrier Gas, Flow He, 1.0 mL/min Constant Flow Injection/Volume Splitless, 1 µL (CI 2 µL) Temp. Program 70 °C (4 min) to 300 °C at 20 °C/min (6 min)
MS LECO Pegasus® GC-HRT Transfer Line Temp.
300 °C
Ion Source Temp. 250 °C (CI 200 °C) Ionization EI (70 eV); CI (140 eV) Mass Range 60 – 520 (CI 100 – 1000, Reagent Gas = 5% NH3 in CH4) Acquisition Rate 6 sps Mass Calibration PFTBA (Internal)

General Findings
500 600 700 800 900 1000
0.0e01.0e62.0e63.0e64.0e65.0e66.0e6
0.0e01.0e62.0e63.0e64.0e65.0e66.0e6
0.0e01.0e62.0e63.0e64.0e65.0e66.0e6
Time (s)
AIC Fatty 6
AIC Lean 6
AIC Obese 6
• Total Average Features Found (S/N > 100) – 662 (+/- 57) • Analytes having ID Match > 800 – 274 (+/- 34) • Analytes at > 600 and M , 2ppm – 266 (+/- 26) (N = 36)
ChromaTOF HRT: Deconvolution
500 600 700 800 900 1000 1100 12000.0e0
1.0e7
2.0e7
3.0e7
4.0e7
5.0e7
Time (s)
AIC
636 638 640 642 644 646 648
XIC(176.0921±0.0005) XIC(156.0836±0.0005) XIC(74.0360±0.0005)
A
B
Methionine (2TMS)
5-Oxo-Proline (2TMS)
Methyl Decanoate
Obese

100 150 200 250 300
0.0e01.0e52.0e53.0e54.0e55.0e5
02004006008001000
M/Z
73.04673 156.08361
258.
0973
8
230.
1024
7
156
73
147
75 230
258
Peak True - sample "Obese 9", L-Proline, 5-oxo-1-(trimethylsilyl)-, trimethylsilyl ester (CAS), at 639.86 s , Height (Counts)
Library Hit - Similarity: 835 - Library: Wiley9 - L-Proline, 5-oxo-1-(trimethylsilyl)-, trimethylsilyl ester (CAS), Abundance
EI-HRT: Accuracy & Spectral Similarity N
Si
O
O
O
Si-0.77 ppm
835/1000
80 100 120 140 160 180 200 220
0.0e01.0e52.0e53.0e54.0e55.0e5
02004006008001000
M/Z
74.03605 87.04401
69.0
6988
143.
1066
6
171.
1378
8
129.
0909
7
101.
0597
1
183.
1742
5
115.
0752
9
71.0
8552
84.0
5698
67.0
5429
140.
0316
6
185.
1535
5
74
87
143
69 129
171
101
83 97 183
115
71 157
185
67 85
Peak True - sample "Obese 9", Dodecanoic acid, methyl ester (CAS), at 641.033 s , Height (Counts)
Library Hit - Similarity: 750 - Library: Wiley9 - Dodecanoic acid, methyl ester (CAS), Abundance
-1.0 ppm
OO
750/1000
215
214.19251
215.
1991
8
218
0663
2
216.
2035
3

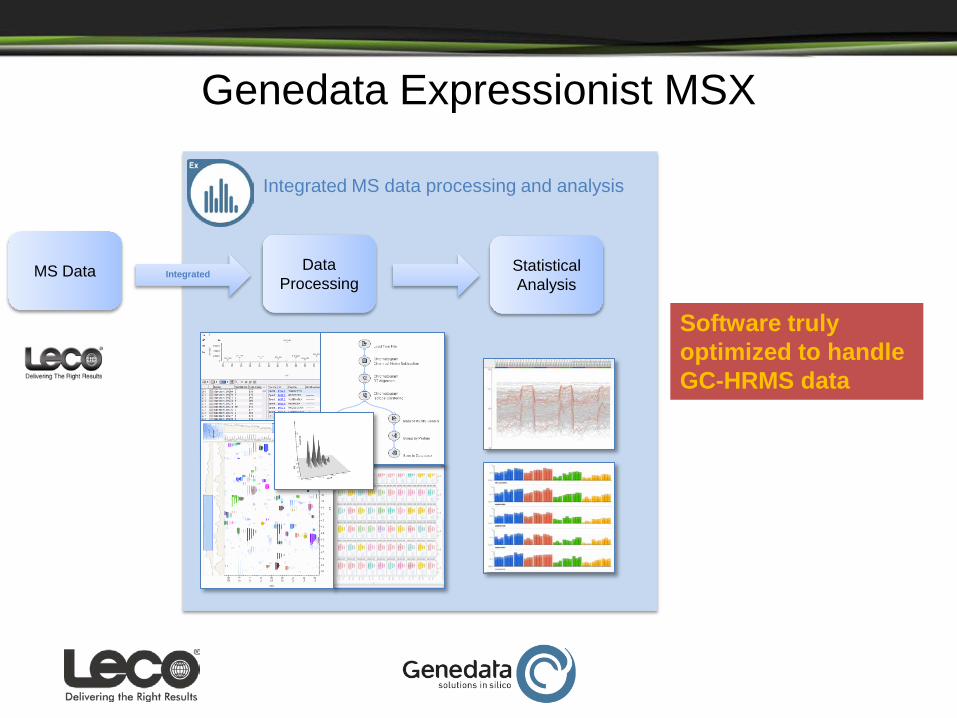
ChromaTOF HRT: Representative Compounds (0.9 ppm mass error)
Name Formula R.T. (s) Area LM (1000) Ion Observed Ion m/z Mass Accuracy (ppm)Alanine (3TMS) C9H23NO2Si2 448.6 127332975 829 [M-CH3]+ 218.10235 -1.62
Oxalic Acid (2TMS) C8H18O4Si2 464.5 27487671 889 [M-CH3]+ 219.05012 -1.00
Valine (2TMS) C11H27NO2Si2 508.2 50953068 820 [M-C3H7]+ 218.10250 -0.95
Serine (3TMS) C12H31NO3Si3 572.5 16161374 811 [M-CH3]+ 306.13720 0.16
Threonine (3TMS) C13H33NO3Si3 583.6 17103360 807 [M-CH3]+ 320.15264 -0.51
L-Proline, 5-oxo- (2TMS) C11H23NO3Si2 639.9 47799304 835 M+● 273.12089 -0.77
[M-CH3]+ 258.09738 -0.94
Citric Acid (4TMS) C18H40O7Si4 739.9 39155972 861 [M-CH3]+ 465.16066 -0.92
Galactose (MEOX, 5TMS) C22H55NO6Si5 795.467 38182656 792 [M-C10H27O2Si3]+ 364.1788657 -0.4088
Glucose (MEOX, 5TMS) C22H55NO6Si5 801.498 12382092 821 [M-C11H31O3Si3]+ 332.1529305 0.3934
Inositol (6TMS) C24H60O6Si5 824.445 11117824 850 [M-C6H20O2Si2]+ 432.1992864 -1.2284
Octadecanoic acid (TMS) C21H44O2Si 865.1 18735936 895 M+● 356.30982 -1.94
Arachidonic acid (TMS) C23H40O2Si 899.0 16205056 889 M+● 376.27853 -1.80
Cholestadiene C27H44 1061.05 384812 782 M+● 368.3441255 1.0118
Cholesterol TMS C30H54OSi 1164.7 24326300 736 M+● 458.39349 -0.76
Campesterol, TMS C31H56OSi 1224.6 1668712 888 M+● 472.40950 0.01Ave = 0.90 ppm
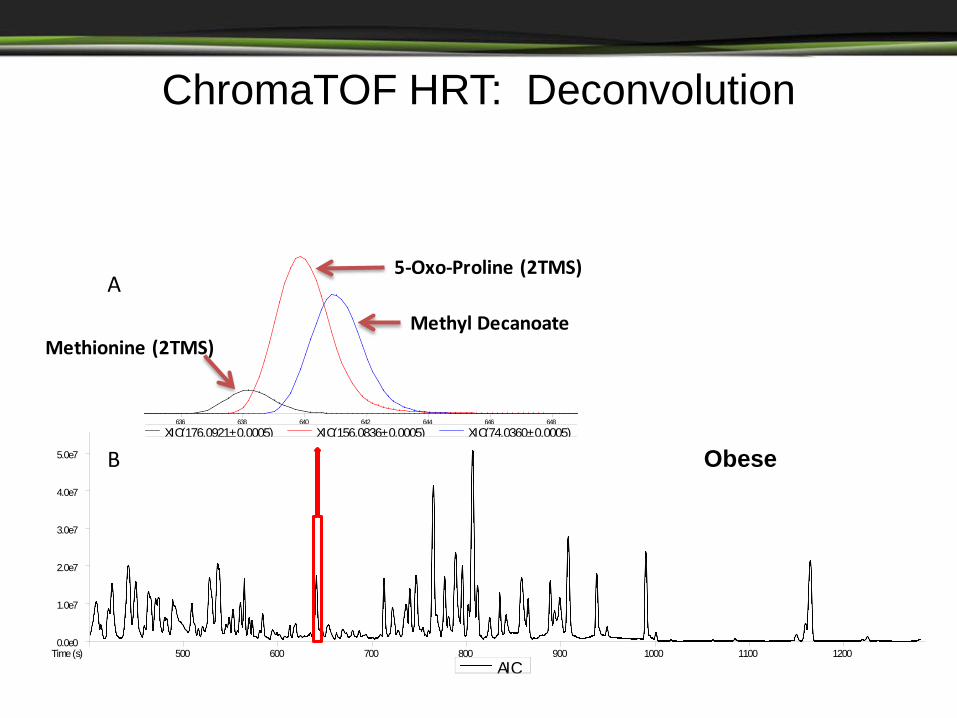
Genedata Expressionist MSX
Data Processing
MS Data Statistical Analysis
Integrated
Integrated MS data processing and analysis
Software truly optimized to handle GC-HRMS data

GeneData Results
Obese
Lean
Fatty Fold Change > 1.5
P values < 0.05

Pathways Implicated in GCMS
Statistics and Pathways are important but individual metabolites are important as well
BCAAs which Feed fatty acids and lipids

Serotonin – Obesity, Sleep and Appetite
0
50000
100000
150000
200000
250000
Serotonin
Fatty Lean Obese Total
5-Hydroxytryptamine
Implicated Pathways and Physiology Tryptophan Biosynthesis Neurotransmission Appetite control Depression Obesity

Branched Amino Acids
Figures of merit • Average m/z =
86.096368 • Target m/z
86.096430 • Avg. Mass Error =
0.72 ppm (Abs) (N = 36 over 2 days)
0
500000
1000000
1500000
2000000
2500000
Isoleucine
Fatty Lean Obese Total
Leucine and Valine show similar trends
Branched Chain AA, Fatty Acid and other Metabolism

Modulated Fatty Acid
0
500000
1000000
1500000
2000000
2500000
3000000
3500000
4000000
4500000
Hexadecanoic Acid
Figures of merit • Average m/z =
328.278977 • Target m/z
328.27889 • Avg. Mass Error =
0.97 ppm (Abs) (N = 36 over 2 days) Fatty Lean Obese Total

Other Modulated Metabolites
0
200000
400000
600000
800000
1000000
1200000
1400000
Myoinositol (6TMS)
m/z 217.1073
m/z 318.1483
Fatty Lean Obese Total
Monitored by each of 2 accurate m/z values one is more consistent/selective than the other Linked to selected lipid metabolism

Metabolite ID in Tobacco Leaf

Cholesterol in Green Tobacco Leaf
1100 1200 1300 1400 1500 1600 1700 18000.0e0
2.0e6
4.0e6
6.0e6
8.0e6
1.0e7
1.2e7
1.4e7
1.6e7
Time (s)TIC

1645 1647.5 1650 1652.5 1655 1657.5 1660 1662.5 16650.0e0
5.0e4
1.0e5
1.5e5
2.0e5
2.5e5
3.0e5
3.5e5
4.0e5
4.5e5
Time (s)XIC(145.101145±3ppm) XIC(165.090939±3ppm)
1645 1647.5 1650 1652.5 1655 1657.5 1660 1662.5 1665
2.0e6
3.0e6
4.0e6
5.0e6
6.0e6
7.0e6
Time (s)TIC
Tocopherol
Cholesterol

1650 1660
dl-à
-Toc
ophe
rol
Chol
este
rol (
CAS)
XIC(165.0909)
Green Leaf : Co-eluting Compounds
50 100 150 200 250 300 350 400 450 5000
200
400
600
800
1000
Area
(Ab
unda
nce)
M/Z
145.1011581.06991 105.06991
95.0
8561
43.0
5449
55.0
5439
159.
1167
9
121.
1011
1
213.
1636
3
133.
1011
1
368.
3433
3
67.0
5431
255.
2105
0
247.
2417
2
353.
3199
7
163.
1480
6
71.0
8556
129.
0698
1
173.
1324
3
301.
2886
7
39.0
2315
199.
1480
3
275.
2729
2Peak True - sample"GL 9aT Splitless", Cholesterol (CAS), at 1652.88 s
50 100 150 200 250 300 350 400 450 5000.0e0
2.0e2
4.0e2
6.0e2
8.0e2
1.0e3
1.2e3
Area
(Ab
unda
nce)
M/Z
43 81
95 145
368
105
9155
247
159
121
133
67 213
255
18 353
386
275
173
36
Library Hit - Library: Wiley9 - Cholesterol (CAS)
LM = 880/1000
Peak True
*
HO
50 100 150 200 250 300 350 400 450 5000.0e0
2.0e2
4.0e2
6.0e2
8.0e2
1.0e3
1.2e3
Area
(Ab
unda
nce)
M/Z
165.09094
430.
3803
3
205.
1222
6
Peak True - sample"GL 9aT Splitless", dl-à-Tocopherol, at 1650.87 s
50 100 150 200 250 300 350 400 450 5000.0e0
2.0e2
4.0e2
6.0e2
8.0e2
1.0e3
1.2e3
Area
(Ab
unda
nce)
M/Z
165
430
43 205
57
Library Hit - Library: mainlib - dl-à-Tocopherol LM = 833/100
Peak True
OHO

50 100 150 200 250 300 350 400 450 5000
100
200
300
400
500
600
700
800
900
1000
M/Z
145.10115
81.0
6991
105.
0699
0
91.0
5432
95.0
8561
43.0
5449
55.0
5439
27.9
9492
159.
1167
9
121.
1011
0
213.
1636
3
133.
1011
1
368.
3433
3
67.0
5431
255.
2105
024
7.24
171
353.
3199
7
173.
1324
3
301.
2886
7
199.
1480
0
275.
2729
1
Area (Abundance), Peak True - sample"GL 9aT Splitless", Cholesterol, at 1652.88 s
Interpretative Power of Accurate Mass – Cholesterol (in Tobacco Leaf Extract NOT TMS)
CH3
CH3
CH3
CH3+ CH31.1 ppm
CH2+
CH3CH3CH3
CH3
CH3
0.9 ppm
Match = 852
M●+ 0.5 ppm
Structures and fragmentation with ACD/MS Workbook Suite

GCxGC TOF MS

Sample Preparation
Centrifuge
SpeedVac BSTFA
GCxGC TOF - MS
Pool by Condition
Control Ethanol
Freeze; Pulverize; Extract with MeOH

DISEASED ETHANOLIC
1942.5 1945 1947.5 1950 1952.5 1955 1957.5 1960 Time (s)
Oct
adec
anoi
c ac
id, t
rim
ethy
lsily
l est
er
132 POOLED ETOH 132 POOLED CTRL REF
Oct
adec
anoi
c ac
id, t
rim
ethy
lsily
l est
er
100 200 300 400
100 200 300 400
500
1000 129
341 201 257
Peak True - sample "POOLED ETOH ", peak 866, at 1951.76 s
100 200 300 400
500
1000 117 73 341
201 297
Library Hit - similarity 811, "Octadecanoic acid, trimethylsilyl ester"
100 200 300 400
100 200 300 400
500
1000 117 73
341 201
Peak True - sample "POOLED CTRL REF", peak 989, at 1951.74 s
100 200 300 400
500
1000 73 117
341 201
Library Hit - similarity 869, "Octadecanoic acid, trimethylsilyl ester (CAS)"
Octadecanoic Acid in Mouse Liver extracts – arrow indicates up regulation
NORMAL CONTROL
Similarity > 800

Match Present in reference and sample within user-specified concentration tolerance
Out of Tolerance
Present in reference and sample, but not within user-specified concentration tolerance
Not found
Present in reference, but not in sample
Unknown Present in sample, but not in reference
Normal Control Pooled (Reference)
Disease Ethanolic Pooled (Sample)
How can we identify differences between similar samples?
ChromaTOF’s Reference Feature computes the relative concentration of peaks in a sample with respect to a user specified reference. Type tags are assigned to each analyte:

Representative Examples
Match: Proline, di-TMS Out of Tolerance: Linoleic Acid, TMS
Not Found: Ala-Gly, N-TMS-, TMS ester Unknown: Tryptophan, tri-TMS
Type Concentration Name Similarity R.T. (s) Quant S/N Area Height Quant Masses Match 105.68 Proline, di-TMS 888 1044 , 1.025 5419.4 665035 28371 142 Out of Tolerance 199 Linoleic Acid, TMS 901 2232 , 1.175 12237 1858318 141038 67
Not Found Ala-Gly, N-TMS-, TMS ester 850 1548 , 1.325 116
Unknown Tryptophan, tri-TMS 844 2229 , 1.360 664.14 48291 3073.3 202
Control Disease Control Disease
Control Disease Control Disease

Library ID: Undecane
Breath Analysis

Breath tests using 1D GC MS
Demonstrated proof of principle in: • Lung cancer • Breast cancer • Heart transplant rejection • Pulmonary tuberculosis • Environmental toxicology • Influenza

All of these studies were performed with 1D GC MS…
…and then 2D GC MS came along

Human breath VOCs Two-dimensional gas chromatography and time-of-flight mass
spectrometry
Breath
Breath minus air

The limitations of 1D GC MS Poor selectivity ~ 200 VOCs in breath Co-elution +++ Biomarker ID not consistent
The advantages of GCxGC TOF MS Excellent selectivity ~ 2,000 VOCs in breath Co-elution – minimal Biomarker ID highly consistent

Conclusions • Metabolomics Studies using GCMS provide capabilities to define modulated
analytes in populations and phenotypes which complements LCMS • HRMS provides an ability to identify unknowns and to have confident
identification of knowns – Accurate m/z for fragments – Isotopic Abundance for knowns and unknown – Mass accuracy and isotopic Abundance confirm formulae for m/z – CI enables molecular ion m/z – Provides linearity and sensitivity needed for metabolomics analysis
• Deconvolution enables the ability to: – detect and quantify metabolites – provide searchable spectra from difficult peak pairs – provide interpretable spectra from difficult peak pairs
• GCxGC TOF MS – – Separation of additional analytes – Differential Analysis and enhanced Sensitivity
• Genedata enables an HRMS-optimized tool for differential analysis of phenotypes and populations.

People Doing the Work

For More Information
Contact LECO at:
World Headquarters/United States In United States: 800-292-6141 or 269-985-5496
Outside U.S.A.: 269-983-5531
Email: [email protected] www.leco.com


![INDEX [] · # 910001 R Alfa Romeo 147 - F Alfa Romeo 156 - F Alfa Romeo 156 Sportwagon - F Alfa Romeo GT - F # 910002 R Audi A3 - R Audi A3 Sportback - R # 910003 R Audi A4 - R](https://img.pdfslide.us/doc/110x75/5b1d8eba7f8b9a173f8b75f4/index-910001-r-alfa-romeo-147-f-alfa-romeo-156-f-alfa-romeo-156-sportwagon.jpg)