Embed Size (px)
Citation preview
HIGH MOISTURE EXTRUSION OF OATMEAL
A Thesis
presented to
the Faculty of California Polytechnic State University,
San Luis Obispo
In Partial Fulfillment
of the Requirements for the Degree
Master’s of Science in Agriculture with a Specialization in Food Science and Nutrition
by
Brandon Fletcher Coleman
June 2015

ii
© 2015
Brandon Fletcher Coleman
ALL RIGHTS RESERVED
iii
COMMITTEE MEMBERSHIP
TITLE: High Moisture Extrusion of Oatmeal
AUTHOR: Brandon Fletcher Coleman
DATE SUBMITTED: June 2015
COMMITTEE CHAIR: Dr. Gour Choudhury, Professor and Department Head of Food
Science and Nutrition
COMMITTEE MEMBER: Dr. Jay Noel, Professor and Department Chair of Agribusiness
COMMITTEE MEMBER: Dr. Amy Lammert, Assistant Professor of Food Science
iv
ABSTRACT
High Moisture Extrusion of Oatmeal
Brandon Fletcher Coleman
Oats are considered to be a highly nutritious breakfast food available to consumers.
Heightened consumer interest in functional food products and advances in human nutrition have
led to increased levels of interest in the development of new oat based products (Webster and
Wood 2011). Developments in technology have led to manufacturing of instant oatmeal,
making the product more convenient to consumers. Low moisture extrusion processing is one of
the most widely used methods to produce ready to eat breakfast cereals; however, there has been
little research carried out to determine if high moisture extrusion methods would be viable. This
study evaluated the economic and technical feasibility to utilize high moisture extrusion
processing to produce ready to eat oatmeal. A process economics evaluation included measuring
the capital requirements to implement the system, process costing to estimate the weighted
average unit cost, and net present value of high moisture extrusion production. The capital
expense was significantly high. However, the unit cost is comparable to similar products in the
market. The net present value of implementing the technology revealed a significant profit over
the course of 20 years. Six different technical experiments were performed using a twin screw
extruder, each experiment testing for the effect of different extrusion variables on finished
product texture. Reference texture data was measured using a control product currently made in
the industry using an alternative batch process. The processing parameters which seemed to have
the biggest influence on product quality were high rates of water injection, low feed rate, high
reaction zone temperature, reduction of particle size, and the use of functional ingredients in the
formula. Technical hurdles such as low dwell times, steam plugging, and inconsistent feeding
prevented complete starch gelatinization and the steady state of extrusion. Overall, the high
moisture methodology did not yield product quality that was consistent and cannot be
recommended for use.
v
ACKNOWLEDGMENTS
I wish to express sincere gratitude to my mentor and advisor Dr. Gour S. Choudhury. He
provided wisdom, knowledge, direction, and moral support that were critical to my success as a
graduate student. His expertise in the field of Food Engineering was a vital asset in the
completion of this experimentation. I will be forever grateful for his mentorship and friendship.
I would also like to extend my appreciation towards my advising committee: Dr. Jay
Noel, Department Chair of Agribusiness, and Dr. Amy Lammert, Associate Professor of Food
Science for their unwavering support, valuable time, expertise, and participation in this project.
Special thanks are due to my colleague Mr. Kyler Walters, who provided moral support
and assisted in carrying out the experimentation for this research.
The financial support from the California Agricultural Research Institute is
acknowledged. Wawona Frozen Foods is also acknowledged for their matching support in
funding this research, as well as providing the information needed to carry out the study. Without
the financial support of these organizations, performing this research would have been very
difficult.
To my wife Erin, who has supported me throughout the entire Master’s program. She has
been consistently encouraging and supportive, even during times of difficulty. Without her, none
of this would have been at all possible.
Most importantly, I want to thank my Lord and Savior Jesus Christ for providing me with
the strength, wisdom, and ability to commence on this journey.
vi
TABLE OF CONTENTS
LIST OF TABLES ……………………………………………………………………………....xi
LIST OF FIGURES ……………………………………………………………………………xiii
CHAPTER 1: INTRODUCTION ................................................................................................... 1
1.1 Background Information and Problem Statement................................................................. 1
1.2 Importance of the Project ...................................................................................................... 2
1.3 General Hypothesis ............................................................................................................... 3
CHAPTER 2: LITERATURE REVIEW ........................................................................................ 4
2.1 Physicochemical Composition of Oats ................................................................................. 4
Structure and Chemistry of Oat Kernel .................................................................................. 4
Oat Groat Physicochemical Composition ............................................................................... 6
Starch ...................................................................................................................................... 6
Starch Gelatinization ............................................................................................................... 7
Protein ..................................................................................................................................... 8
Lipids ...................................................................................................................................... 9
2.2 Influence of Other Ingredients .............................................................................................. 9
Sugar ....................................................................................................................................... 9
Salt ........................................................................................................................................ 10
Hydrocolloids ........................................................................................................................ 10
Flavors................................................................................................................................... 10
Water ..................................................................................................................................... 11
2.3 Ready to Eat Oatmeal ......................................................................................................... 11
Kettle Cooking ...................................................................................................................... 13
vii
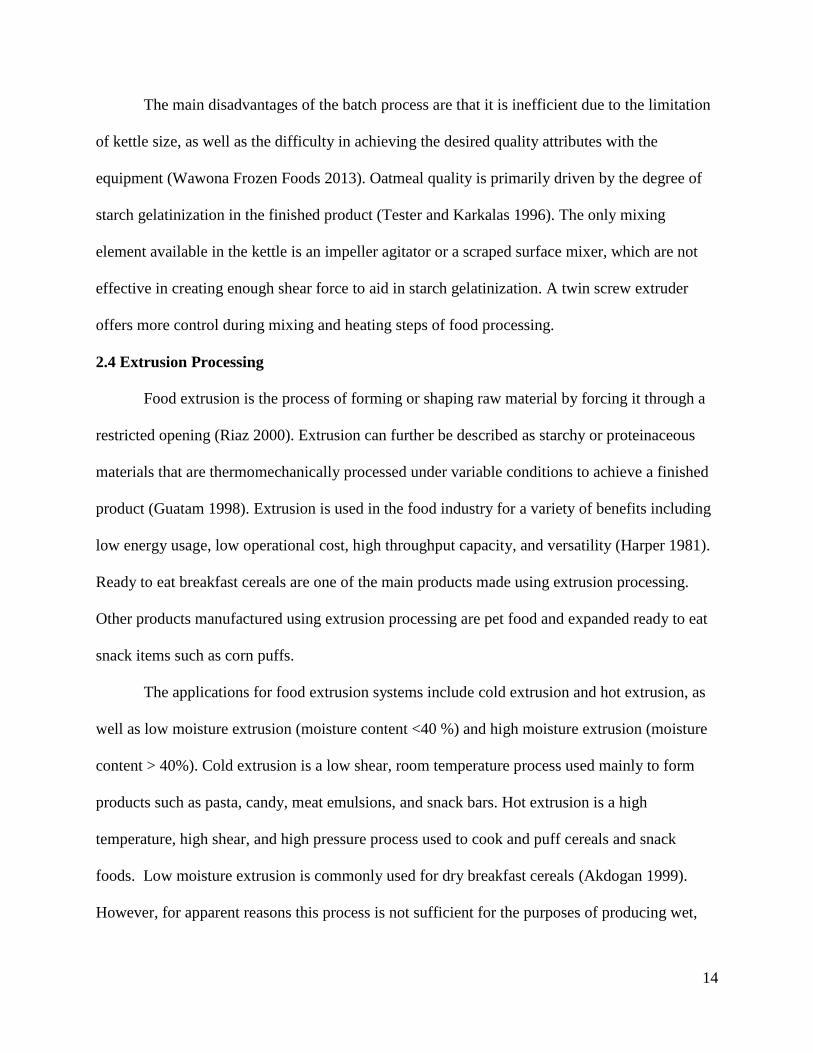
2.4 Extrusion Processing ........................................................................................................... 14
2.5 High Moisture Extrusion..................................................................................................... 15
2.6 Process Economics: Extrusion Processing.......................................................................... 17
Economic Advantages of Extrusion Processing ................................................................... 17
Process Costing ..................................................................................................................... 18
Extrusion Process Costing .................................................................................................... 18
CHAPTER 3: MATERIALS AND METHODS .......................................................................... 21
Extrusion Parameters ............................................................................................................ 23
Barrel Temperature Profile ................................................................................................... 24
Screw Profile ......................................................................................................................... 25
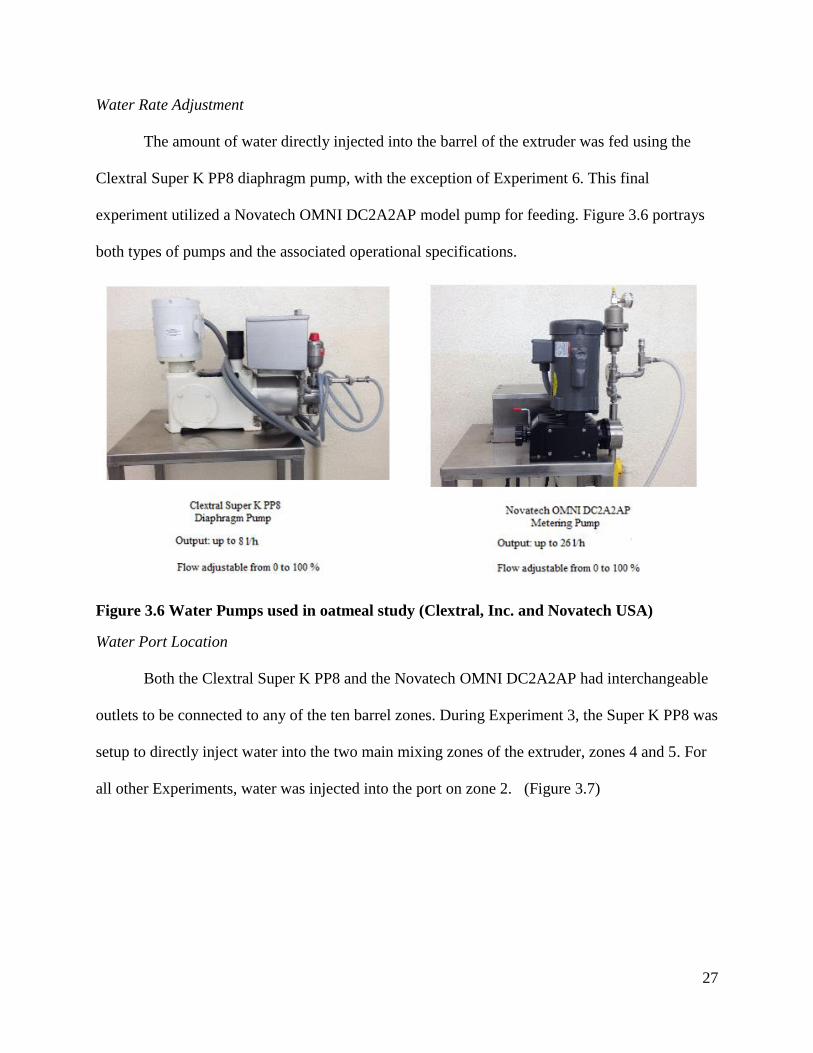
Water Rate Adjustment ......................................................................................................... 27
Water Port Location .............................................................................................................. 27
Feed Preparation ................................................................................................................... 28
Sampling ............................................................................................................................... 28
Product Analysis ................................................................................................................... 28
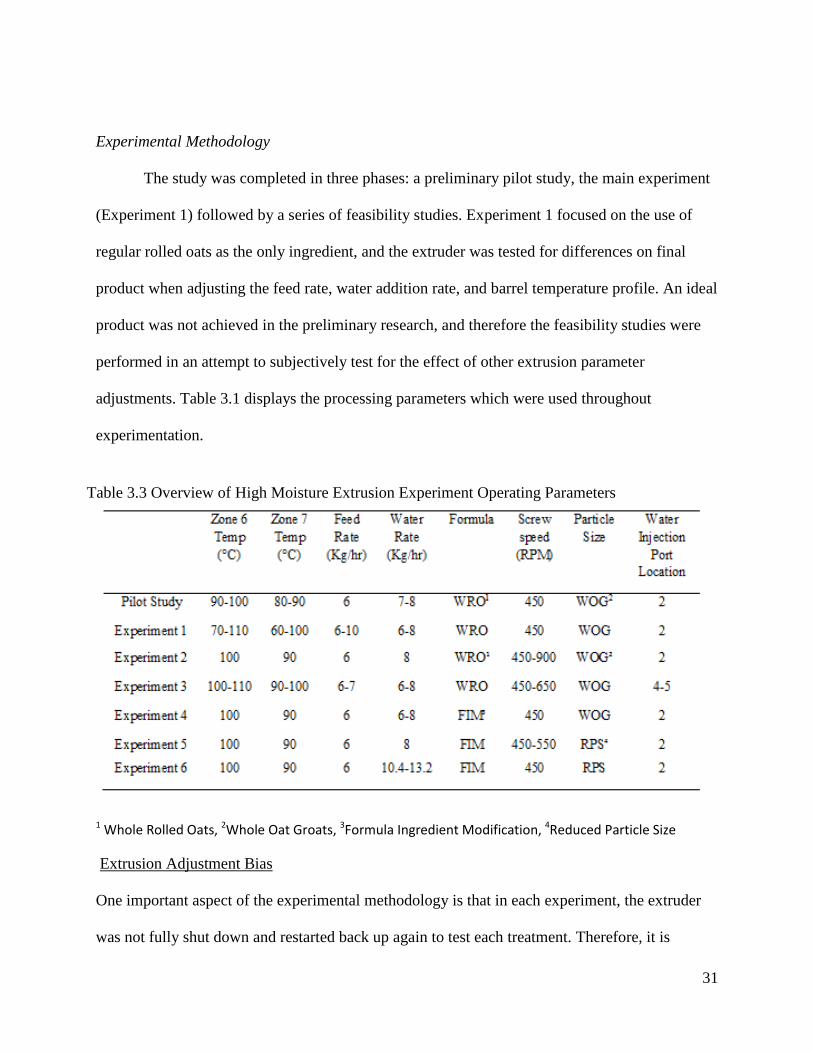
Experimental Methodology .................................................................................................. 31
3.1 Preliminary Experiment ...................................................................................................... 32
3.2 Main Experiment (Experiment 1) ....................................................................................... 33
3.3 Feasibility Studies ............................................................................................................... 34
3.3.1 Experiment 2- Screw Speed ............................................................................................. 34
Screw Speed Adjustment ...................................................................................................... 34
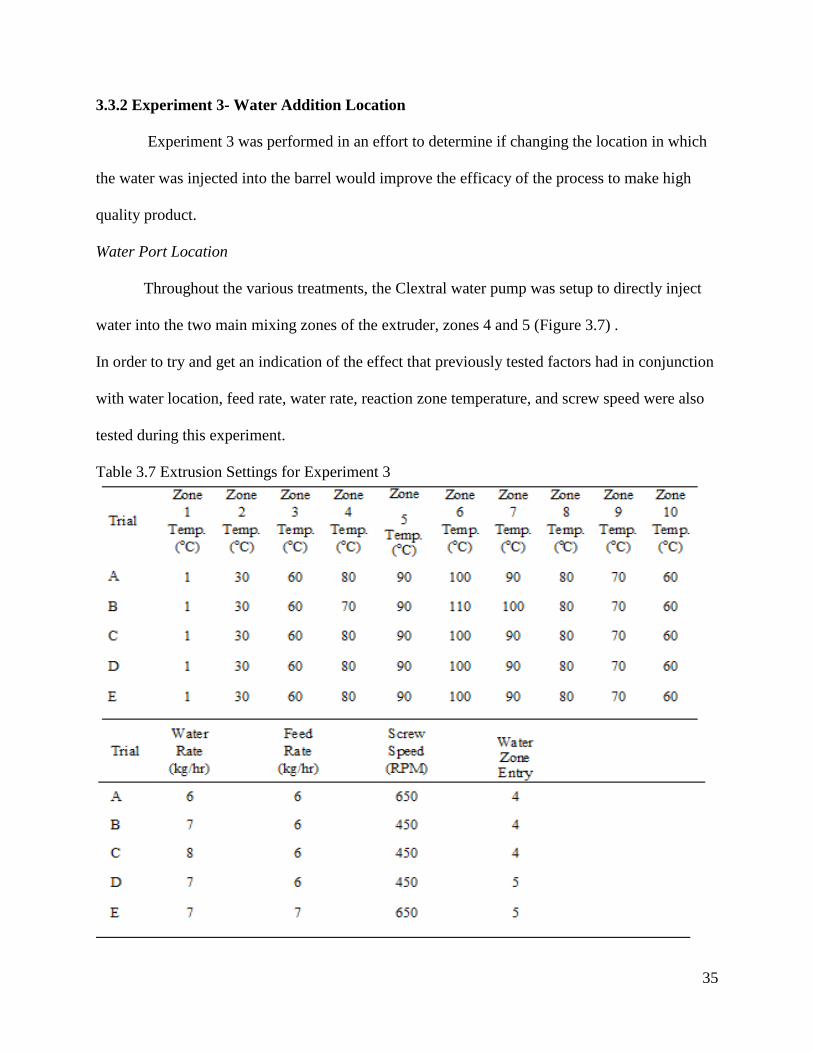
3.3.2 Experiment 3- Water Addition Location ......................................................................... 35
Water Port Location .............................................................................................................. 35
viii
3.3.3 Experiment 4- Oatmeal Mix ............................................................................................ 36
Feed Preparation ................................................................................................................... 36
3.3.4 Experiment 5- Reduced Particle Size .............................................................................. 37
Feed Preparation ................................................................................................................... 37
Extrusion Parameters ............................................................................................................ 39
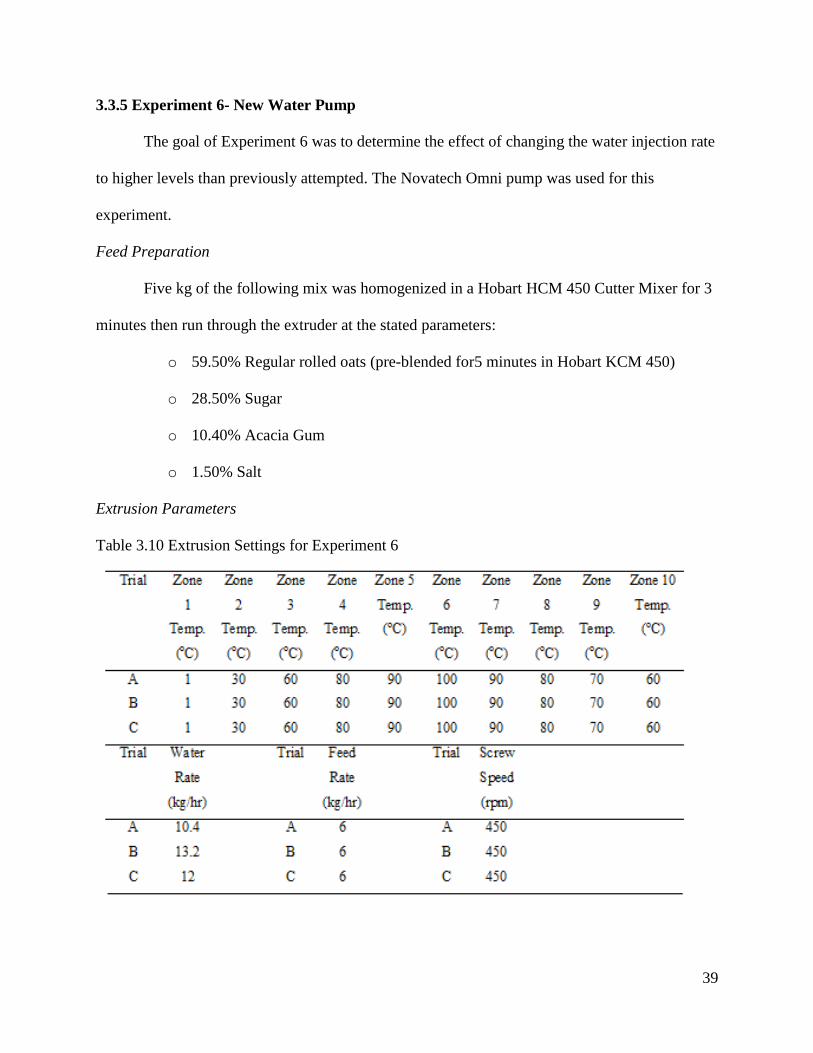
3.3.5 Experiment 6- New Water Pump ..................................................................................... 39
Feed Preparation ................................................................................................................... 39
Extrusion Parameters ............................................................................................................ 40
Technical Evaluation Assumptions....................................................................................... 40
3.3.6 Process Economics Evaluation ........................................................................................ 40
Capital Requirements ............................................................................................................ 41
Process Cost Analysis ........................................................................................................... 42
Net Present Value (NPV) Analysis ....................................................................................... 43
Economic Evaluation Assumptions ...................................................................................... 44
CHAPTER 4: RESULTS AND DISCUSSION ............................................................................ 45
4.1 Process Economics Evaluation ........................................................................................... 45
Process Costing ..................................................................................................................... 45
Capital Expenditures ............................................................................................................. 46
4.2 Technical Evaluation of Extrusion Process ........................................................................ 48
4.2.1 Preliminary Experiment ................................................................................................... 48
Product Evaluation ................................................................................................................ 48
4.2.2 Experiment 1 .................................................................................................................... 49
Product Evaluation ................................................................................................................ 49
ix
Reaction Zone Temperature .................................................................................................. 50
Water Rate ............................................................................................................................ 51
Feed Rate .............................................................................................................................. 51
4.2.3 Experiment 2 .................................................................................................................... 52
Product Evaluation ................................................................................................................ 52
Screw Speed .......................................................................................................................... 52
4.2.4 Experiment 3 .................................................................................................................... 53
Product Evaluation ................................................................................................................ 53
Water Injection Location ...................................................................................................... 53
4.2.5 Experiment 4 .................................................................................................................... 54
Product Evaluation ................................................................................................................ 54
Oatmeal Formula Effect ........................................................................................................ 55
Water Rate Effect .................................................................................................................. 55
4.2.6 Experiment 5 .................................................................................................................... 56
Product Evaluation ................................................................................................................ 56
Particle Size Reduction ......................................................................................................... 56
Screw Speed Adjustment ...................................................................................................... 57
4.2.7 Experiment 6 .................................................................................................................... 57
Product Evaluation ................................................................................................................ 58
Increased Water Injection Capacity ...................................................................................... 59
CHAPTER 5: CONCLUSIONS ................................................................................................... 60
REFERENCES………………………………………………………………………………......63

x
APPENDICES
Appendix A:Glossary of Terms ............................................................................................ 68
xi
LIST OF TABLES
Table Page
Table 2.1 Composition of dry, not fortified regular rolled oats ...................................................... 6
Table 2.2 Different types of hot cereal products ........................................................................... 12
Table 3.1 Materials used in study ................................................................................................. 21
Table 3.2 Equipment used in this study ........................................................................................ 21
Table 3.3 Overview of High Moisture Extrusion Experiment Operating Parameters .................. 31
Table 3.4 Extrusion Parameter Settings for Pilot Study ............................................................... 32
Table 3.5 Extrusion Parameter Settings for Main Experiment ..................................................... 33
Table 3.6 Extrusion Parameters for Experiment 2 ........................................................................ 34
Table 3.7 Extrusion Settings for Experiment 3 ............................................................................. 35
Table 3.8 Extrusion Settings for Experiment 4 ............................................................................. 37
Table 3.9 Extrusion Settings for Experiment 5 ............................................................................. 39
Table 3.10 Extrusion Settings for Experiment 6 ........................................................................... 40
Table 3.11 Cost of Goods Available for Sale ............................................................................... 42
Table 4.1 Cost of Goods Available for Sale ................................................................................. 45
Table 4.2 Capital Requirements for High Moisture Extrusion System ........................................ 46
Table 4.3 Net Present Value for High Moisture Extrusion System .............................................. 47
Table 4.4 Pilot Study Back Extrusion Results .............................................................................. 48
Table 4.5 Experiment 1 Back Extrusion Test Results .................................................................. 50
Table 4.6 Experiment 2 Back Extrusion Results .......................................................................... 52
Table 4.7 Experiment 3 Back Extrusion Results .......................................................................... 54
Table 4.8 Experiment 4 Back Extrusion Results .......................................................................... 55

xii
Table 4.9 Experiment 5 Back Extrusion Results .......................................................................... 57
Table 4.10 Experiment 6 Results and Observations ..................................................................... 58
Table 5.1 Conclusive observations made during oatmeal study ................................................... 61
xiii
LIST OF FIGURES
Figure Page
Figure 1.1 Kettle Batch Control Product ........................................................................................ 2
Figure 2.1 Cross section of oat kernel (Adapted from Webster and Wood 2011) .......................... 5
Figure 2.2 Relationship between water content and temperature for rice starch gelatinization
(Adapted from Wirakartakusumah 1981) ....................................................................................... 8
Figure 2.3 Schematic of kettle batch process for producing oatmeal (Adapted from Maroulis
and Saravocos 2008) ......................................................................................................................13
Figure 2.4 Schematic of extrusion processing paramters (Adapted from Choudhury and
others 1995) ...................................................................................................................................16
Figure 2.5 Production cost sheet for an extrusion process. (Adapted from Harper 1981) ........... 19
Figure 3.1 Clextral Model EV 25 Twin Screw Extruder (Source: Clextral, Inc.) ........................ 23
Figure 3.2 Die Configuration ....................................................................................................... 24
Figure 3.3 Barrel Temperature Profile for Oatmeal Study ........................................................... 25
Figure 3.4 Screw segments used in screw profile design (Source: Clextral Inc.) ........................ 26
Figure 3.5 Screw profile design for oatmeal study showing location of various elements. ......... 26
Figure 3.6 Water Pumps used in oatmeal study (Clextral, Inc. and Novatech USA) ................... 27
Figure 3.7 Water Port Location Schematic .................................................................................. 28
Figure 3.8 TA-94 Back Extrusion Rig used in oatmeal study ...................................................... 30
Figure 3.9 Feed Preparation using Hobart HCM 450 ................................................................... 38
Figure 3.10 Process Flow Diagram for High Moisture Extrusion of Oatmeal (Adapted from
Maroulis and Saravocos 2008)...................................................................................................... 41
1
CHAPTER 1
Introduction
1.1 Background Information and Problem Statement
Oats make up less than 2 % of total grain production in the U.S. and are the sixth most
grown cereal grain after corn, wheat, barley, sorghum, and millet (Webster and Wood 2011). The
increasing awareness of the nutritive and functional properties of oats enhances the possibility
for sustainable growth in the marketplace. In many countries, oats are used as a mixed feed
source for livestock; however, there are many oat- based products for human consumption as
well (Chang and others 1985). Oats are considered to be one of the most nutritious breakfast
foods available to consumers. This nutritionally dense cereal is composed of one third more
protein, four times more fat as well as less starch than wheat. Heightened consumer interest in
functional food products and advances in human nutrition have led to increased levels of interest
in the development of new oat based products (Webster and Wood 2011).
Developments in technology have led to manufacturing of instant oatmeal, making the
product more convenient to consumers. Low moisture extrusion processing is one of the most
widely used methods to produce ready to eat breakfast cereals; however, there has been little
research performed to determine if high moisture extrusion methods would be viable. In order to
determine high moisture extrusion feasibility, it is necessary to understand how oatmeal
ingredients are affected by varying extrusion processing variables. The quality of oatmeal is
driven by the degree of starch gelatinization. Achieving gelatinization of starch is a function of
heat, water addition, and mixing. Therefore, it is important to determine the efficacy of this
technology to produce high quality starch based products.
2
1.2 Importance of the Project
Currently, the food industry is experiencing negative quality attributes using the batch
method to produce oatmeal. Kettle cooking is a commonly used methodology to produce ready
to eat oatmeal. Quality attributes such as texture, flavor, and appearance are inconsistent from
batch to batch (Wawona Frozen Foods 2014). There is interest in finding a new way of
producing oatmeal that would lead to fewer consumer complaints related to product quality. The
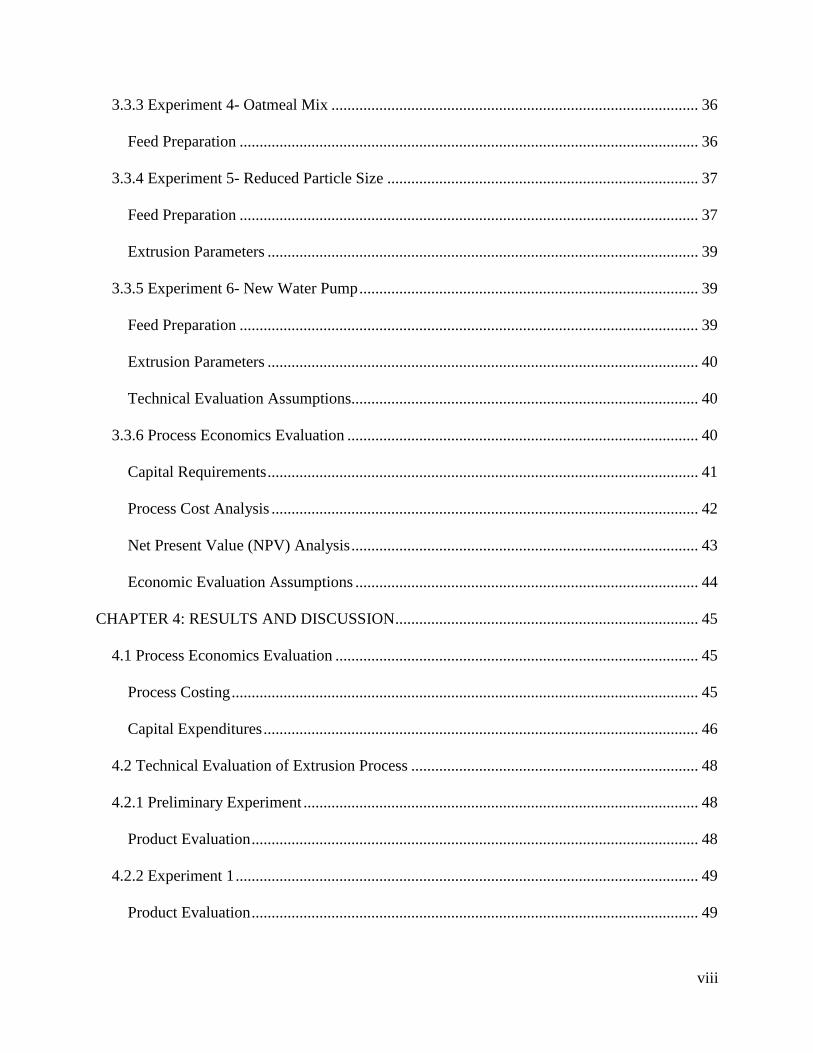
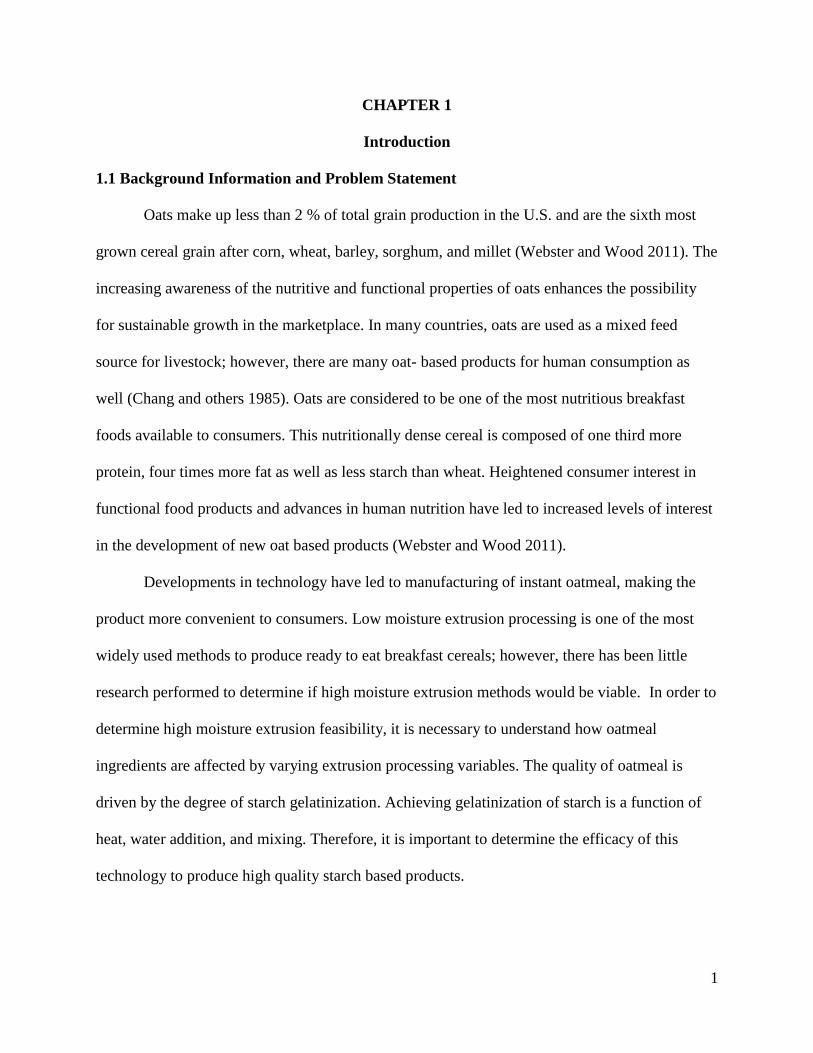
industry provided a batch made product which served as a control (Figure 1.1). Through
performing this research, we can determine if it is possible to achieve desired quality using high
moisture extrusion technology. Quality improvements could include consistent texture, moisture
dispersion and absorption, as well as optimal starch gelatinization. In performing the economic
analysis, we may be able to improve the efficiency of the oatmeal making process as well. Some
potential economic performance measures that could be improved with high moisture extrusion
are production labor efficiency, throughput capacity, and total cost per unit.
Figure 1.1 Kettle Batch Control Product

3
1.3 General Hypothesis
This study will test the overall hypothesis that it would be economically and technically
feasible to utilize high moisture extrusion processing to produce ready to eat oatmeal. Efficacy
will be measured technically through evaluating finished product texture, and economically by
assessing process costs.
4
CHAPTER 2
Literature Review
2.1 Physicochemical Composition of Oats
Structure and Chemistry of Oat Kernel
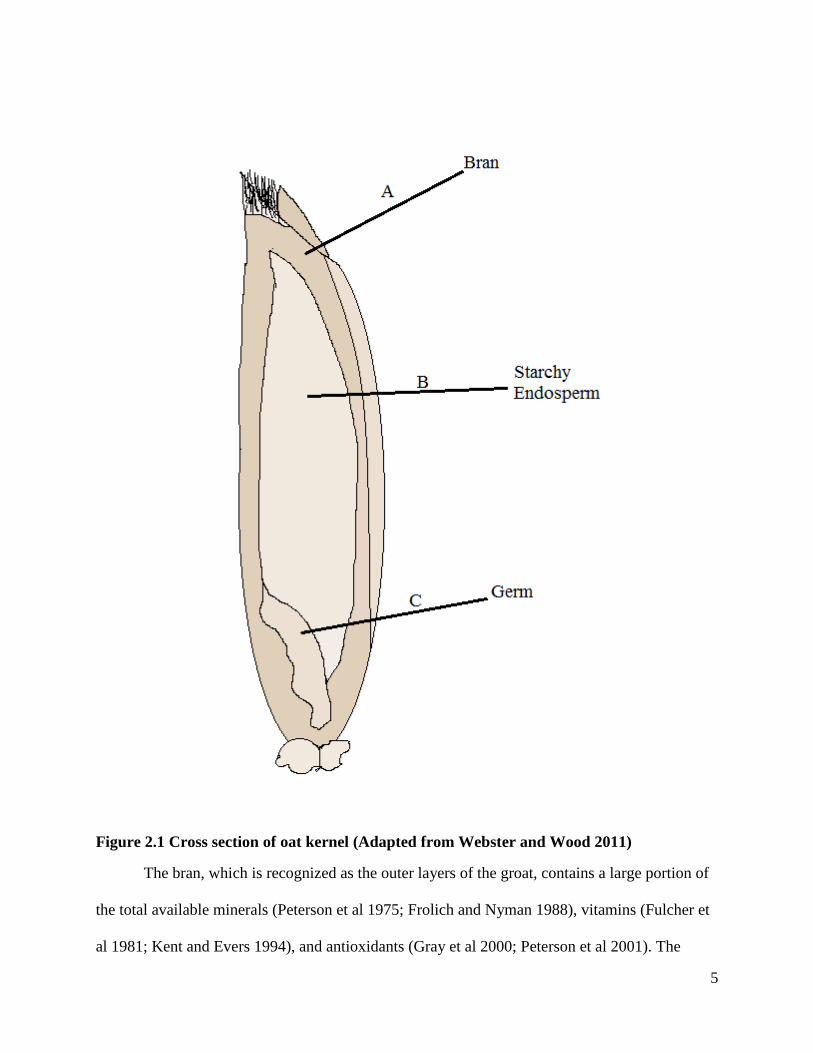
It is important to understand oat grain characteristics and composition as well as how
these are affected by the extrusion process design. The kernel has two main portions, the
protective hull, and the oat groat. During oat milling and processing, the hull of the kernel is
removed. The remaining oat groat can be classified as having three major components: the bran,
the germ, and the starchy endosperm. Figure 2.1 illustrates a cross section of an oat kernel.
Sections A, B, and C are higher magnifications of the bran, starchy endosperm, and germ-
endosperm matrix, respectively (Webster and Wood 2011).
5
Figure 2.1 Cross section of oat kernel (Adapted from Webster and Wood 2011)
The bran, which is recognized as the outer layers of the groat, contains a large portion of
the total available minerals (Peterson et al 1975; Frolich and Nyman 1988), vitamins (Fulcher et
al 1981; Kent and Evers 1994), and antioxidants (Gray et al 2000; Peterson et al 2001). The
6
endosperm is the region of the mature oat groat that primarily houses starch, proteins, lipids, and
beta glucans. In most mature oat groats, there is a reverse gradient effect seen between protein
and starch. In other words, protein and starch concentration are proportionally different in the
outlayer of the endosperm versus the center of the endosperm (Webster and Wood 2011). The
starchy endosperm can contain up to 90% of the total lipids found in oats. Most of the lipids
found in the endosperm are neutral lipids, however there are small amounts of glycolipids and
phospholipids. The endosperm cell wall is fortified with beta glucan, which is one of the non-
starch carbohydrates found in the groat. The last major component of the oat is the germ, which
primarily acts as an embroyo during germination. The germ is mainly composed of protein and
lipid, with starch being a minor component (Webster and Wood 2011).
Oat Groat Physicochemical Composition
Extrusion processing is dependent upon several ingredient parameters, making it
necessary to understand the chemical composition of oats. Table 2.1 shows the chemical
composition of regular rolled oats:
Table 2.1 Composition of dry, not fortified regular rolled oats
Item Moisture (%) Protein (%) Lipid (%) Ash(%) Carbohydrate(%)
Oats 10.8 13.2 6.5 1.9 67.7
Source: USDA National Nutrient Database 2015
The main components of oat groats which have an influential effect on extrusion are starch,
protein, and lipids. Therefore, these components will be the focus of this review.
Starch
Starch is a major constituent to the total carbohydrate available in the oat groat.
Typically, starch is found in the form of granules which are composed of several million highly
7
branched amylopectin molecules as well as a larger amount of amylose molecules (Webster and
Wood 2011) There is also a third component to starch called “intermediate materials”.
Physicochemical and functional properties of the starch are dependent upon the variance in
amylose, amylopectin, and intermediate materials (Wang and White, 1994). It is important to
understand that every oat variety has diverse amounts of these starch components (Table 2.1).
There have been many studies performed on the use of corn, rice, and wheat starch over
the last two centuries. However, oat starch was not extensively studied until the mid 1950s. In
order to effectively process oats, one must truly understand the functionality and morphology of
oat starch. Oat starch displays high water absorption activity as well as low gelatinization
temperatures (Macarthur and D’Appolonia 1979). It has also been determined that cooked
granules found in oat starches exhibit more sheer sensitivity than other cereal starches (Wang
and White 1994). The starch found in oats significantly impacts the finished texture of the
extruded oatmeal through the gelatinization process.
Starch Gelatinization
When both water and heat are applied to starch, a transition occurs in the structure of the
molecules. Starch granules swell and collapse, becoming a mixture of polymers-in-solution. As
heat is applied, there is increased motion of the molecules within the starch granule. This will
eventually lead to the disruption of hydrogen and hydrophobic bonds for molecules found in the
crystalline area of the granule. These molecules become hydrated and are discharged into the
surrounding water. This process is known as gelatinization (Robyt 2008).
Starch gelatinization is an important physicochemical change which occurs in many food
materials. There are varying types of starch such as corn starch, potato starch, rice starch, as well
as oat starch. The gelatinization properties of each starch are slightly different (Ratnayake and
8
Jackson 2008). Each type of starch has a level of water and temperature which acts as the onset,
peak, and conclusion of the gelatinization process. Figure 2.2 shows the effect of water content
on gelatinization temperature in the example of rice starch. Generally, the lower the water to
starch ration, the higher the temperature required to achieve complete starch gelatinization.
According to Ratnayake and Jackson (2008), oats in excess water have an onset gelatinization
temperature of 60°C, peak temperature of 63.5°C, and conclusion temperature of 70.5°C. The
only other type of starch with lower gelatinization temperatures is wheat starch.
Figure 2.2 Relationship between water content and temperature for rice starch
gelatinization (Adapted from Wirakartakusumah 1981)
Protein
The main role of protein in oats is its nutritional contribution accompanied by
functionality during processing (Webster and Wood 2011). Proteins may coagulate and form a
gel when exposed to high temperatures, but in the case of extrusion, a high enough temperature
9
is not reached to cause gelation in the protein fraction. High thermal stability of oat globulin may
be desirable in some settings. However, this functional property limits its use as a gelling agent
in many food items processed at low temperatures. (Webster and Wood 2011)
Lipids
As mentioned previously, the lipid content of oats are about 7%. This is higher than in
most other cereal grains (Decker et al 2013). The lipids in oats can create a lubrication effect,
which reduces the shear force created inside the barrel of the extruder (Camire 2000). Therefore,
processors will at times remove fat from the oats prior to extrusion to prevent this detrimental
effect. Another important factor to consider during extrusion is lipid oxidation. The stability of
oat lipids is compromised during exposure to the high temperatures to cook product. Therefore,
temperature control is crucial to preventing rancidity in the finished product (Gutkoski and El-
Dash 1998).
2.2 Influence of Other Ingredients
Sugar
The use of sugar as an ingredient in oatmeal plays the primary roles of sweetening and
flavor enhancement. Brown sugar is one of the most widely used forms of sugar used in oatmeal
processing. Brown sugar is made from blending granulated cane sugar with refinery syrups or
molasses, but could also be granulated sugar which is artificially sweetened and colored to be
similar to standard brown sugar (Stansell1997). Sugar helps prevent lumping in oatmeal by
separating the starch molecules, which creates a desirable texture. Sugar also used to breakdown
proteins so that they become more evenly dispersed in liquid mixtures (Canadian Sugar Institute
2015). In oatmeal processing, these functional properties play a significant role in ensuring
effective dispersion of particles to aid in texture development.
10
Salt
Sodium Chloride, also known as table salt, is added to breakfast cereals such as oats to
impart flavor to the product (Brady 2002). Salt intensifies the sweetness being contributed by
natural and added sugar, and also helps reduce bitterness. Salt decreases the amount of available
water in oatmeal mixtures, due to the hygroscopic nature of the ingredient. Starch gelatinization
temperatures and times will increase due to the lower water activity in the product. It is essential
to ensure that an appropriate amount of salt is added to the formula, as it has a direct impact on
the functionality of other constituent ingredients (Hutton 2002).
Hydrocolloids
Gum as an ingredient can be sourced from exudates, seeds, or seaweed. The oatmeal
formula used in this study utilized gum arabic (acacia), which comes from an exudate source.
Acacia gum is regarded as one of the first thickening agents used in food products, and is widely
used across the food industry in many applications. Emulsification, acid stability, low viscosity
at high temperatures, binding properties, and impact on mouth-feel characteristics are the
applicable functional properties of the gum arabic. In the extrusion process, high temperatures
will be used to gelatinize the starch within the oat groat. The aforementioned properties of acacia
gum will help ensure the product has a low viscosity and homogeneous texture within the barrel
of the extruder, warranting effective mixing in the kneading zone of the barrel (Wareing 1999).
Flavors
Oats alone are generally regarded as having little flavor, and therefore the addition of
some flavor enhancer is required. Oatmeal can be flavored with various types of additives to
enhance the consumer experience. Some common flavors of oatmeal seen on the market are
maple and brown sugar, strawberries and cream, cinnamon, as well as many more. The only
11
added flavor affecting the process comes from spices such as cinnamon. Cinnamon is regarded
as an aromatic spice, and the purpose of addition to the oatmeal is to provide flavor and odor to
the finished product (Ranken 1997). One concern of the use of aromatic spices in the extrusion
process is flavor retention. Due to the stress of temperature, shear force, and pressure on the
mixture, flavors can degrade inside the barrel of the extruder (Maga1989). This degradation
effect may lead some extrusion processors to add flavorings post extrusion, alleviating the
detriments observed on flavor during extrusion.
Water
Water has a strong influence on the processing conditions as well as the flavor, texture,
and appearance of ready to eat oatmeal. Controlling the moisture content of the feed has been
proven to be a technique that can be used to regulate the temperature and flow rate during the
process. The addition of water can also affect product rehydration, product density, and starch
gelatinization (Harper 1981). Achieving starch gelatinization in oatmeal processing requires the
addition of heat, shear force, and water. Water plays a major role in flavor retention in that, due
to the reduced pressure relative to the product exiting the die, developed flavor that is water
soluble will volatilize with the flashing of water. Therefore, it is essential to have an elongated
die, so that the product has time to drop in temperature and decrease in pressure prior to entering
the atmosphere (Maga 1989). The amount of water added during the process will be essential to
creating uniformity in the finished extrudate (Harper 1981).
2.3 Ready to Eat Oatmeal
Human consumption of oat based products is significantly increasing due to their
beneficial health implications. The range of oat based products for human consumption varies
from cold cereals such as granola to hot cereals such as instant oats. Hot cereal is the most
12
widely used application for oat flakes (Webster and Wood 2011). In order to comparatively
determine the optimal unit operation for producing ready to eat oatmeal, it is important to assess
the difference in the main product types. The table below illustrates the differences between hot
cereal products, as well as the processing methodology for each.
Table 2.2 Different types of hot cereal products
Product Category1 Product Characteristics Cooking Unit Operation
Finished Product
Dispostion
Rolled Oats -Prepare on the
stovestop
-Whole oat flakes
-Addition of water
required
Oats are steamed and
then rolled thin
-Shelf Stable
-Stovetop
prepared
Instant Oatmeal -Prepare-in-the-bowl
-Fractionated oat flakes
-Partially-gelatinized
-Low moisture content
-Addition of water to
rehydrate starch
-May be pre-portioned
- Includes flavorings,
additives, and vitamins
Oats are rolled into
thinner flakes and/or
steamed longer to pre-
gelatinize the starch
-Shelf Stable
-Microwave
Prepared
Frozen Oatmeal2 -Pre-gelatinized
-High moisture content
-Pre-hydrated
-Always pre-portioned
- Includes flavorings,
additives, and vitamins
-Evaporative Kettle
Cooked
-Product heated to
gelatinization
temperatures based on
ingredient mix
-Frozen
-Microwave
Prepared
1 Whole Grains Council. 2013.
2 Wawona Frozen Foods. 2013.
13
The processing of oatmeal into a frozen unit using extrusion cooking is an unexplored
method to achieve starch gelatinization for the frozen oatmeal product format.
Kettle Cooking
Developments in technology have led to manufacturing of instant oatmeal, (Table
2.2) making the product more convenient to consumers. While instant oatmeal has traditionally
been packaged dry and requires the addition of water, prepared oatmeal can also be packaged
into individually frozen ready to eat units. There is not a significant amount of available
literature on the production of ready to eat oatmeal. However, processing information was
provided from oatmeal industry contacts to aid in completing this study. Ready to eat units are
made using the “kettle batch” method. These units have already been precooked with water, and
require a microwave to make the product ready to eat. In the batch method, oatmeal is cooked
inside of a kettle and then pumped into a piston filler. The piston filler then portions the oatmeal
into individual units to be frozen (Figure 2.3) (Wawona Frozen Foods 2013).
Figure 2.3 Schematic of kettle batch process for producing oatmeal (Adapted from
Maroulis and Saravocos 2008)
14
The main disadvantages of the batch process are that it is inefficient due to the limitation
of kettle size, as well as the difficulty in achieving the desired quality attributes with the
equipment (Wawona Frozen Foods 2013). Oatmeal quality is primarily driven by the degree of
starch gelatinization in the finished product (Tester and Karkalas 1996). The only mixing
element available in the kettle is an impeller agitator or a scraped surface mixer, which are not
effective in creating enough shear force to aid in starch gelatinization. A twin screw extruder
offers more control during mixing and heating steps of food processing.
2.4 Extrusion Processing
Food extrusion is the process of forming or shaping raw material by forcing it through a
restricted opening (Riaz 2000). Extrusion can further be described as starchy or proteinaceous
materials that are thermomechanically processed under variable conditions to achieve a finished
product (Guatam 1998). Extrusion is used in the food industry for a variety of benefits including
low energy usage, low operational cost, high throughput capacity, and versatility (Harper 1981).
Ready to eat breakfast cereals are one of the main products made using extrusion processing.
Other products manufactured using extrusion processing are pet food and expanded ready to eat
snack items such as corn puffs.
The applications for food extrusion systems include cold extrusion and hot extrusion, as
well as low moisture extrusion (moisture content <40 %) and high moisture extrusion (moisture
content > 40%). Cold extrusion is a low shear, room temperature process used mainly to form
products such as pasta, candy, meat emulsions, and snack bars. Hot extrusion is a high
temperature, high shear, and high pressure process used to cook and puff cereals and snack
foods. Low moisture extrusion is commonly used for dry breakfast cereals (Akdogan 1999).
However, for apparent reasons this process is not sufficient for the purposes of producing wet,
15
ready to eat oatmeal. High moisture extrusion has been developed over the last ten years to meet
the demand for products with high moisture content which needs to be cooked continuously and
efficiently.
A food extruder has flighted screws which rotate inside of a temperature controlled barrel
to function as a scraped surface heat exchanger (Choudhury and Gogoi 1995). Two types of food
extruders which are currently used in the food industry include single screw and twin screw
extruders. Single screw extruders utilize one single screw component which extends through the
entire distance of the barrel, whereas twin screw extruders have two screws, either co-rotating or
counter-rotating inside the barrel (Riaz 2000). Twin screw extruders can also have either
intermeshing or non-intermeshing screws. Intermeshing screws have shared channels of
conveyance, whereas non intermeshing screws do not engage each other's threads (Riaz, 2000).
Twin screw extrusion is a highly versatile process capable of producing a wide variety of
products in comparison to the single screw models. In contrast to a single screw system, twin
screws are able to handle viscous, sticky, wet materials which would not flow in a single screw
system. Also, twin screw extruders allow for a wide range of particle size whereas single screw
models are limited to a specific range (Riaz, 2000).
2.5 High Moisture Extrusion
High moisture extrusion has been made possible with the implementation of a twin screw
system, new barrel designs, and versatile screws and dies (Akdogan 1999). The extruder
conditions that impact product qualities are screw speed, throughput, temperature, screw
configuration, die design, and barrel ratios. The extruder conditions as well as ingredient
composition impact finished extrudate quality. Feed moisture and lipid content play a significant
role in the characteristics of starch based extrudates, such as oatmeal (Nguyen and others 2010).
16
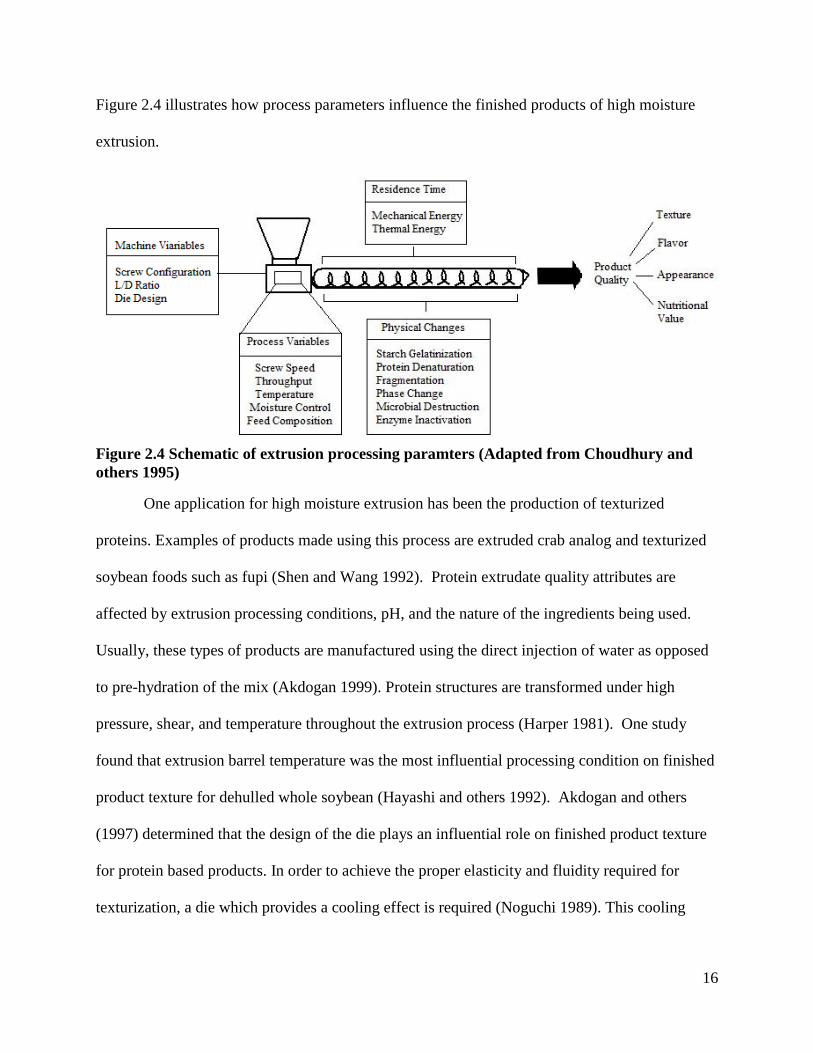
Figure 2.4 illustrates how process parameters influence the finished products of high moisture
extrusion.
Figure 2.4 Schematic of extrusion processing paramters (Adapted from Choudhury and
others 1995)
One application for high moisture extrusion has been the production of texturized
proteins. Examples of products made using this process are extruded crab analog and texturized
soybean foods such as fupi (Shen and Wang 1992). Protein extrudate quality attributes are
affected by extrusion processing conditions, pH, and the nature of the ingredients being used.
Usually, these types of products are manufactured using the direct injection of water as opposed
to pre-hydration of the mix (Akdogan 1999). Protein structures are transformed under high
pressure, shear, and temperature throughout the extrusion process (Harper 1981). One study
found that extrusion barrel temperature was the most influential processing condition on finished
product texture for dehulled whole soybean (Hayashi and others 1992). Akdogan and others
(1997) determined that the design of the die plays an influential role on finished product texture
for protein based products. In order to achieve the proper elasticity and fluidity required for
texturization, a die which provides a cooling effect is required (Noguchi 1989). This cooling
17
effect allows the protein in the food matrix to maintain air bubbles, creating a layered texture
similar to that of meat (Harper 1981).
High moisture extrusion is desirable for starch based products due to the potential for
complete starch gelatinization of the extrudate. It is important that the starch is gelatinized
because it is more susceptible to enzymatic reactions in that state. Extruders are analogous to
enzymatic bioreactors. The viscosity of the product is greatly reduced when enzymatic reactions
are coupled with mechanical and thermal breakdown of starch. In the early 1970s, it was
discovered that the use of high moisture extrusion could inhibit enzymatic reactions in breakfast
cereals. This led to further studies of enzymatic reaction prevention in other applications, such as
the fish processing industry (Choudhury and others 1995). In order for a twin screw extruder to
be used effectively to influence enzymatic starch hydrolysis, product temperature, pH, and
enzyme concentration must be considered (Akdogan 1999). While these experiments found that
high moisture extrusion is a useful new method to influence enzymatic reactions in starch based
products, overall, little research exists on other starch interactions using this process.
2.6 Process Economics: Extrusion Processing
Economic Advantages of Extrusion Processing
There has been little research performed to determine if high moisture extrusion methods
would be a viable option to produce oatmeal. However, extrusion allows for a continuous,
efficient process and is regarded as an effective method to produce many ready to eat products.
This is primarily due to the fact that extrusion cooking combines unit operations such as
pumping, mixing, kneading, heating, and forming in one machine (Jansen 1989). Also, the
amount of floor space required by an extrusion system is significantly less than that of traditional
cooking operations (Riaz 2000). Processing costs are also lower than typical cooking and
18
forming systems. Darrington (1987) reported savings in raw materials (19%), labor (14%), and
capital investment (44%) when implementing extrusion.
Process Costing
Process costing is utilized for product pricing when a department within a company
manufactures individual units of output that are the same. In using this assessment tool, costs are
consistently accumulated by department over a certain period of time. The costs are then
assigned uniformly to all units which were produced during that time period. One tactic used to
assign costing to units is called weighted average costs. This method applies aggregated costs to
produced units by dividing the total cost with the number of units produced during the period
being assessed (Garrison and others 2012).
Extrusion Process Costing
In order to determine the feasibility of using extrusion for ready to eat oatmeal, it is
important to understand the process costs associated with extrusion. Due to the fact that
extruders are usually a part of a large plant with multiple processing lines and products, the
initial apportioning of costs to an individual extruder can be cumbersome. One tactic to alleviate
the difficulty in assessing operating costs is to monitor the extrusion line for a given period of
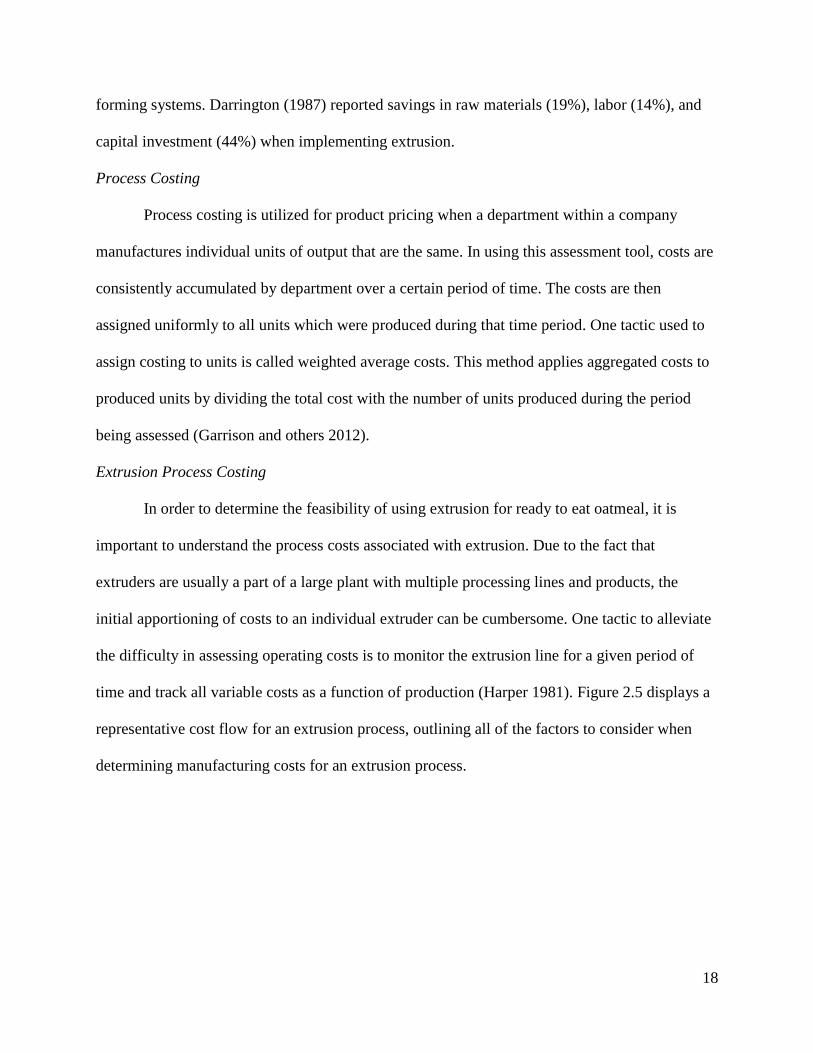
time and track all variable costs as a function of production (Harper 1981). Figure 2.5 displays a
representative cost flow for an extrusion process, outlining all of the factors to consider when
determining manufacturing costs for an extrusion process.
19
Figure 2.5 Production cost sheet for an extrusion process. (Adapted from Harper 1981)
In a typical extrusion process, the cost breakdown is as follows: raw materials are about
35 to 60 % of total cost, labor 5 to 10%, packaging costs 25 to 50%, utilities 5 to 10 %, and all
other costs about 5% (Harper 1981). When developing a business strategy around implementing
an extrusion process, these are the expected values which could be used to predict final product
cost.
Functional and nutritional properties of oats serve as a gateway to the development of
new oat-based products. An understanding of how these qualities will be influenced by
processing variables is critical to using the extrusion technology application for oatmeal.
Processing parameters will ultimately play a role in the finished product quality. The process
costs of extrusion technology are substantial. However, due to the high throughput capacity of
the machine coupled with the benefits of continuous methodology, it could be an optimal
technology for large scale food producers. Most studies on high moisture extrusion have focused
on protein based products. This study will attempt to apply the high moisture technique to a
Manufacturing Cost
Direct
Production Costs
Fixed Costs Overhead Costs
-Raw Materials -Operating Labor
-Supervisory Labor
-Packaging Labor
-Utilities
-Maintenance and Repairs
-Operating Supplies -Laboratory Charges
-Patents and Royalties
-Depreciation - Interest
-Taxes
-Insurance
-Rent
-Sanitation - Payroll
-Medical Services
-Safety
-Lunch Room
-Office Supplies

20
starch based extrusion system, and determine feasibility through measuring technical and
economical metrics.
21
CHAPTER 3
Materials and Methods
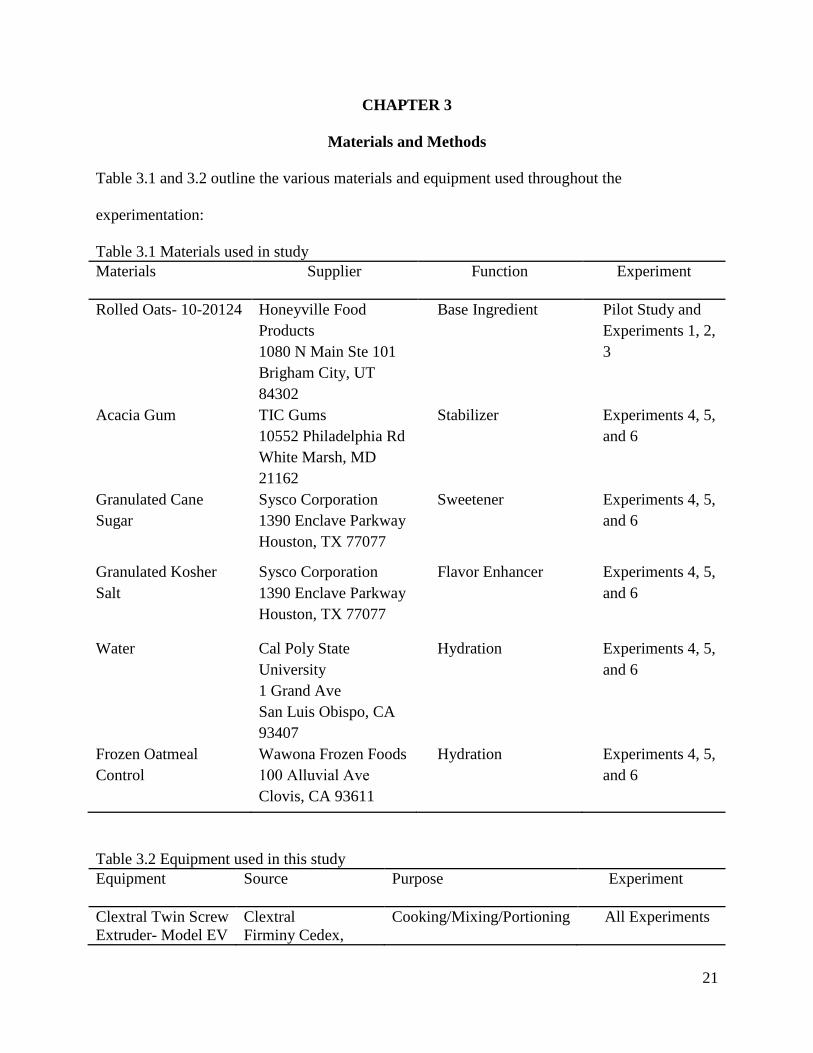
Table 3.1 and 3.2 outline the various materials and equipment used throughout the
experimentation:
Table 3.1 Materials used in study
Materials Supplier Function Experiment
Rolled Oats- 10-20124 Honeyville Food
Products
1080 N Main Ste 101
Brigham City, UT
84302
Base Ingredient Pilot Study and
Experiments 1, 2,
3
Acacia Gum TIC Gums
10552 Philadelphia Rd
White Marsh, MD
21162
Stabilizer Experiments 4, 5,
and 6
Granulated Cane
Sugar
Sysco Corporation
1390 Enclave Parkway
Houston, TX 77077
Sweetener Experiments 4, 5,
and 6
Granulated Kosher
Salt
Sysco Corporation
1390 Enclave Parkway
Houston, TX 77077
Flavor Enhancer Experiments 4, 5,
and 6
Water Cal Poly State
University
1 Grand Ave
San Luis Obispo, CA
93407
Hydration Experiments 4, 5,
and 6
Frozen Oatmeal
Control
Wawona Frozen Foods
100 Alluvial Ave
Clovis, CA 93611
Hydration Experiments 4, 5,
and 6
Table 3.2 Equipment used in this study
Equipment Source Purpose Experiment
Clextral Twin Screw
Extruder- Model EV
Clextral
Firminy Cedex,
Cooking/Mixing/Portioning All Experiments
22
25
France
Hobart Vertical
Chopper Mixer -
Model HMC450
Hobart Corporation
701 S Ridge Ave
Troy, OH 45373
Size reduction Experiment 5 and 6
Scale (g)
Model: ARD110
SN:
H2831203250986 P
Ohaus Corp.
19A Chapin Rd.
Pine Brook, Morris,
NJ 07058
Weighing product All Experiments
Blast Freezer
Cal Poly State
University
1 Grand Ave
San Luis Obispo,
CA 93407
Freezing All Experiments
Microwave Oven
Model :
PEB1590DM2BB
General Electric
3135 Easton
Turnpike
Fairfield, CT 06828
Thawing/Reheating All Experiments
Clextral Super K
PP8
Water Pump
Clextral
Firminy Cedex,
France
Extruder water addition Pilot Study and
Experiments 1, 2, 3,
4, and 5
OMNI DC2A2AP
Metering Pump
Novatech USA
800 Rockmead Dr
Ste 102
Kingwood, TX
77339
Extruder water addition Experiment 6
Compa Chill –
Chiller
Model: SA3-4-2PT
Whaley Products,
Inc
526 Charlotte Ave
Burkburkett, TX
76354
Extrusion cooling All Experiments
Texture Analyzer
Model: TAXT Plus
SN: 11460
Texture
Technologies Corp.
18 Fairview Road
Scarsdale, NY
10583
Measuring texture All Experiments
Table 3.2 (Cont’d). Equipment used in this study
23
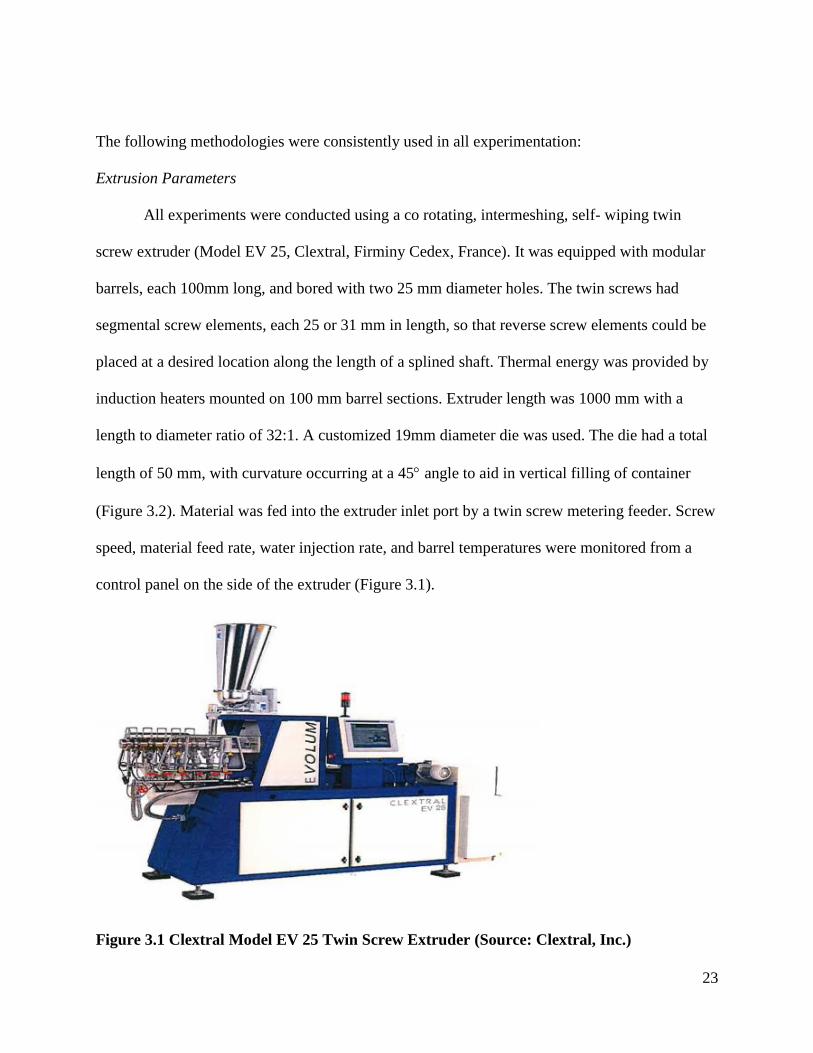
The following methodologies were consistently used in all experimentation:
Extrusion Parameters
All experiments were conducted using a co rotating, intermeshing, self- wiping twin
screw extruder (Model EV 25, Clextral, Firminy Cedex, France). It was equipped with modular
barrels, each 100mm long, and bored with two 25 mm diameter holes. The twin screws had
segmental screw elements, each 25 or 31 mm in length, so that reverse screw elements could be
placed at a desired location along the length of a splined shaft. Thermal energy was provided by
induction heaters mounted on 100 mm barrel sections. Extruder length was 1000 mm with a
length to diameter ratio of 32:1. A customized 19mm diameter die was used. The die had a total
length of 50 mm, with curvature occurring at a 45 angle to aid in vertical filling of container
(Figure 3.2). Material was fed into the extruder inlet port by a twin screw metering feeder. Screw
speed, material feed rate, water injection rate, and barrel temperatures were monitored from a
control panel on the side of the extruder (Figure 3.1).
Figure 3.1 Clextral Model EV 25 Twin Screw Extruder (Source: Clextral, Inc.)
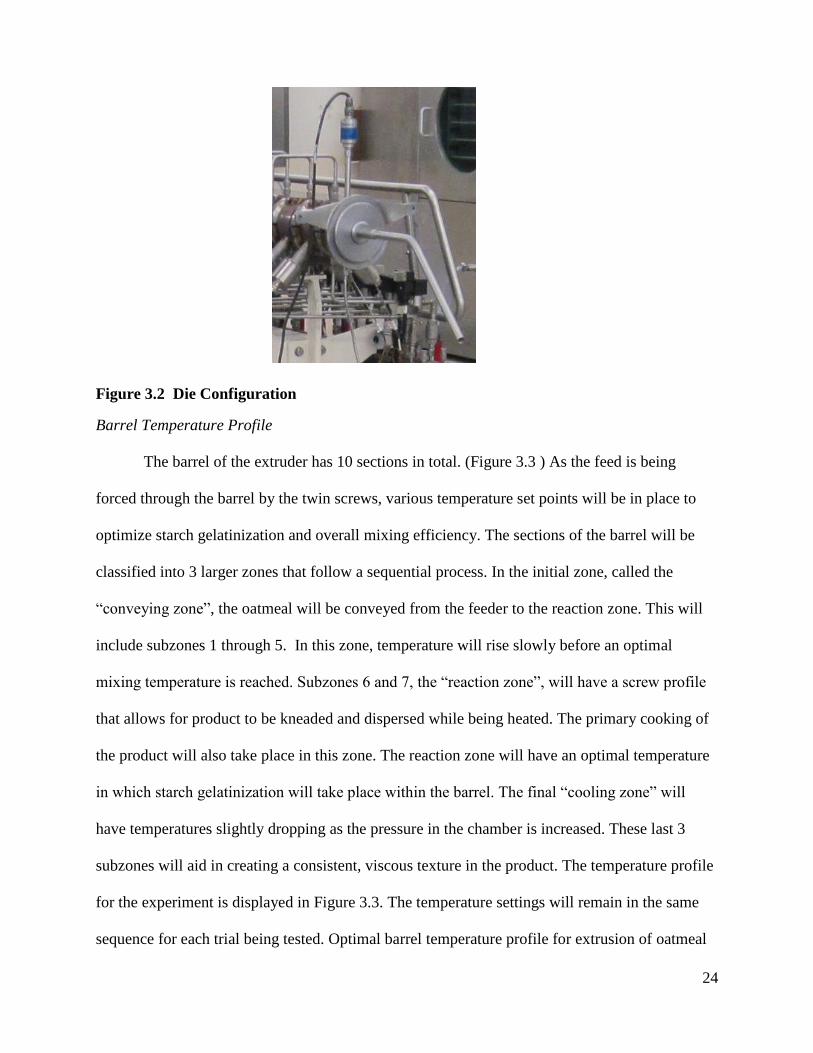
24
Figure 3.2 Die Configuration
Barrel Temperature Profile
The barrel of the extruder has 10 sections in total. (Figure 3.3 ) As the feed is being
forced through the barrel by the twin screws, various temperature set points will be in place to
optimize starch gelatinization and overall mixing efficiency. The sections of the barrel will be
classified into 3 larger zones that follow a sequential process. In the initial zone, called the
“conveying zone”, the oatmeal will be conveyed from the feeder to the reaction zone. This will
include subzones 1 through 5. In this zone, temperature will rise slowly before an optimal
mixing temperature is reached. Subzones 6 and 7, the “reaction zone”, will have a screw profile
that allows for product to be kneaded and dispersed while being heated. The primary cooking of
the product will also take place in this zone. The reaction zone will have an optimal temperature
in which starch gelatinization will take place within the barrel. The final “cooling zone” will
have temperatures slightly dropping as the pressure in the chamber is increased. These last 3
subzones will aid in creating a consistent, viscous texture in the product. The temperature profile
for the experiment is displayed in Figure 3.3. The temperature settings will remain in the same
sequence for each trial being tested. Optimal barrel temperature profile for extrusion of oatmeal
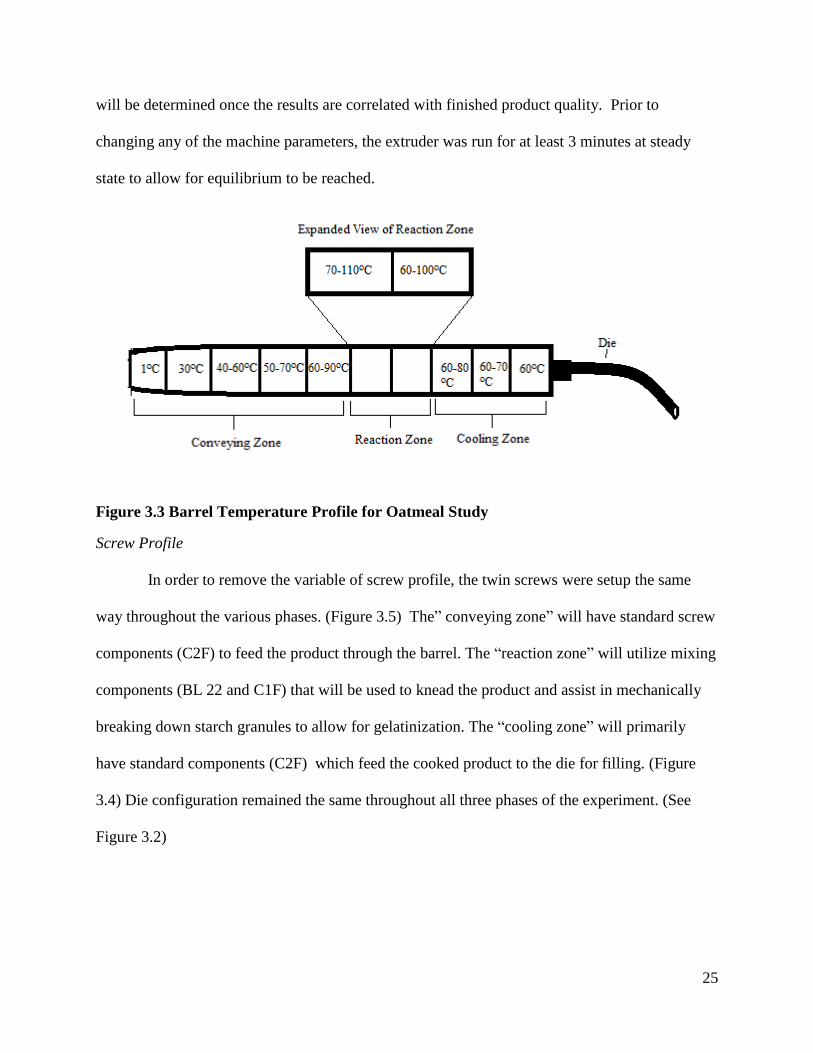
25
will be determined once the results are correlated with finished product quality. Prior to
changing any of the machine parameters, the extruder was run for at least 3 minutes at steady
state to allow for equilibrium to be reached.
Figure 3.3 Barrel Temperature Profile for Oatmeal Study
Screw Profile
In order to remove the variable of screw profile, the twin screws were setup the same
way throughout the various phases. (Figure 3.5) The” conveying zone” will have standard screw
components (C2F) to feed the product through the barrel. The “reaction zone” will utilize mixing
components (BL 22 and C1F) that will be used to knead the product and assist in mechanically
breaking down starch granules to allow for gelatinization. The “cooling zone” will primarily
have standard components (C2F) which feed the cooked product to the die for filling. (Figure
3.4) Die configuration remained the same throughout all three phases of the experiment. (See
Figure 3.2)
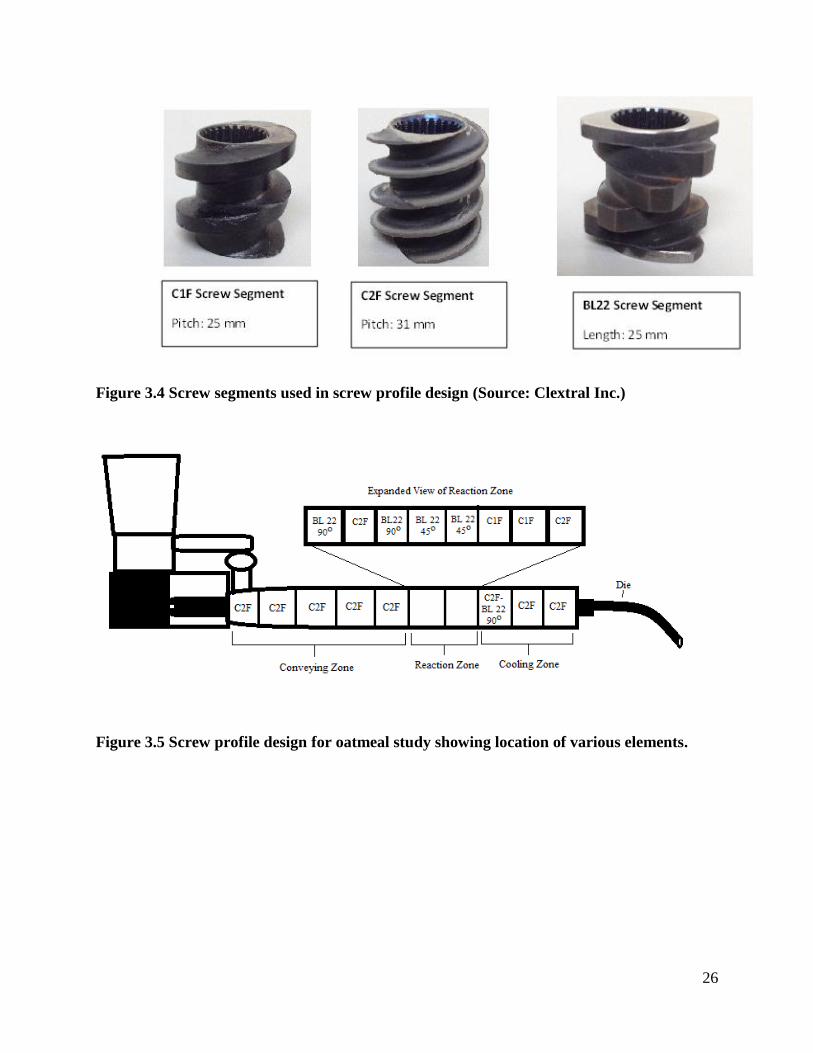
26
Figure 3.4 Screw segments used in screw profile design (Source: Clextral Inc.)
Figure 3.5 Screw profile design for oatmeal study showing location of various elements.
27
Water Rate Adjustment
The amount of water directly injected into the barrel of the extruder was fed using the
Clextral Super K PP8 diaphragm pump, with the exception of Experiment 6. This final
experiment utilized a Novatech OMNI DC2A2AP model pump for feeding. Figure 3.6 portrays
both types of pumps and the associated operational specifications.
Figure 3.6 Water Pumps used in oatmeal study (Clextral, Inc. and Novatech USA)
Water Port Location
Both the Clextral Super K PP8 and the Novatech OMNI DC2A2AP had interchangeable
outlets to be connected to any of the ten barrel zones. During Experiment 3, the Super K PP8 was
setup to directly inject water into the two main mixing zones of the extruder, zones 4 and 5. For
all other Experiments, water was injected into the port on zone 2. (Figure 3.7)
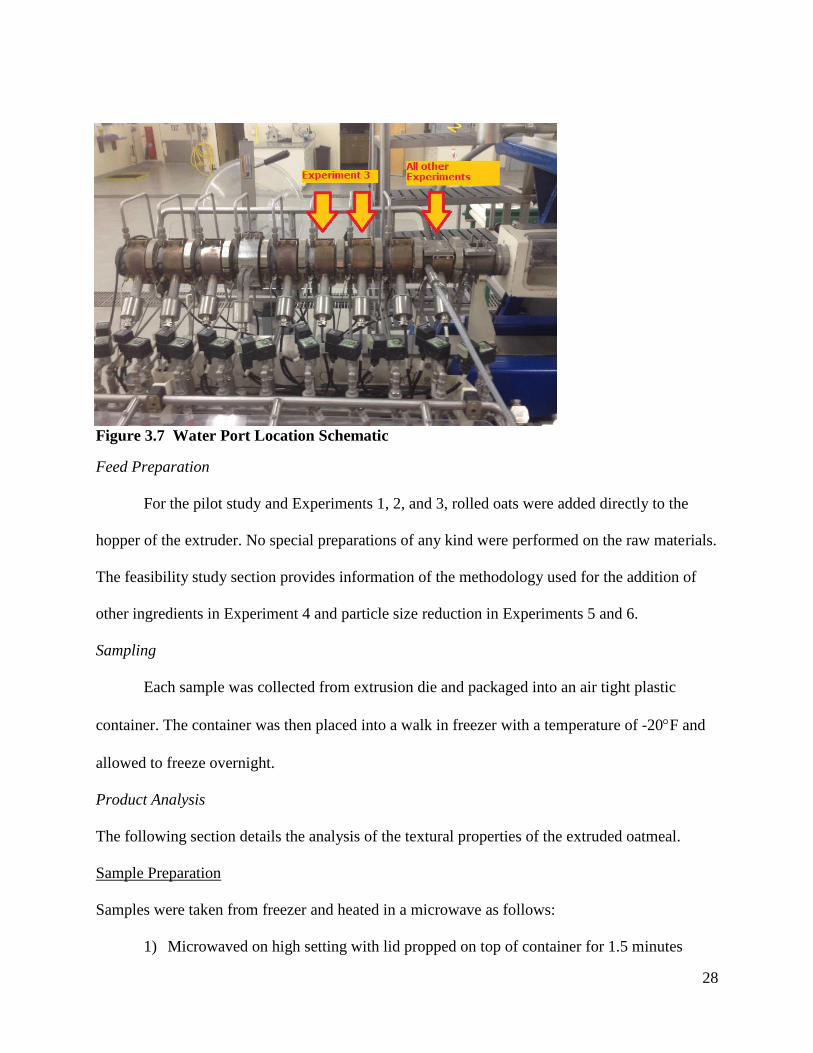
28
Figure 3.7 Water Port Location Schematic
Feed Preparation
For the pilot study and Experiments 1, 2, and 3, rolled oats were added directly to the
hopper of the extruder. No special preparations of any kind were performed on the raw materials.
The feasibility study section provides information of the methodology used for the addition of
other ingredients in Experiment 4 and particle size reduction in Experiments 5 and 6.
Sampling
Each sample was collected from extrusion die and packaged into an air tight plastic
container. The container was then placed into a walk in freezer with a temperature of -20F and
allowed to freeze overnight.
Product Analysis
The following section details the analysis of the textural properties of the extruded oatmeal.
Sample Preparation
Samples were taken from freezer and heated in a microwave as follows:
1) Microwaved on high setting with lid propped on top of container for 1.5 minutes
29
2) Sample then removed, stirred with a fork for approximately 10 seconds
3) Sample placed back into microwave for 2-2.5 minutes
4) Sample removed and underwent a final stir for approximately 10 seconds
After the products were finished the microwave step, they were allowed to cool to between 7-
10C. Once proper temperature was reached, 100 grams of sample was weighed for testing.
Sample texture was measured using the TA.XT Plus Texture Analyzer (Texture Technologies
Corp, Scarsdale, N.Y., USA).
Textural Properties
The force required to back extrude the oatmeal mixture was determined by placing 100
grams of sample into the TA-94 back extrusion rig (Texture Technologies Corp, Scarsdale, N.Y.,
USA). The rig is comprised of a cylindrical sample container which is centrally located
underneath a disc plunger (Figure 3.8). When a test was initiated, the disc plunger was lowered
into the receptacle full with product. A 30 second compression test was performed which
extrudes the product up and around the edge of the disc. This compression test provided results
which were relative to product viscosity. Data was recorded using Microsoft Excel, to be further
analyzed at a later time (Stable Micro Systems 2003).
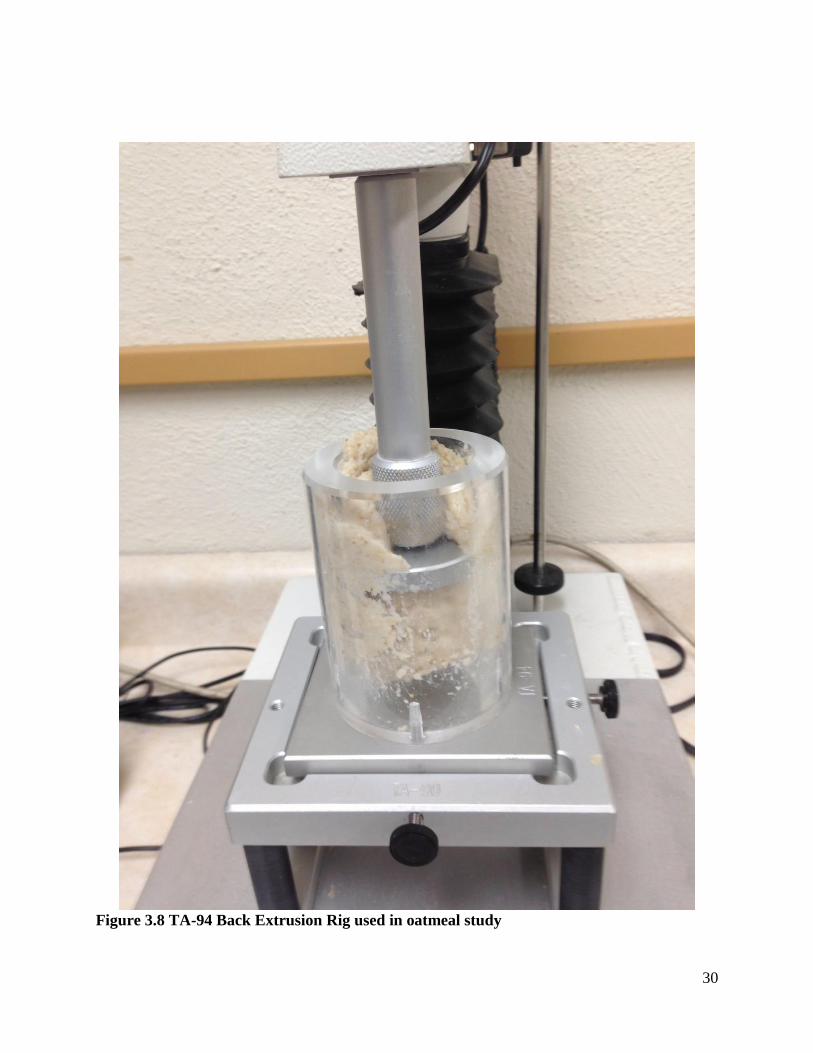
30
Figure 3.8 TA-94 Back Extrusion Rig used in oatmeal study
31
Experimental Methodology
The study was completed in three phases: a preliminary pilot study, the main experiment
(Experiment 1) followed by a series of feasibility studies. Experiment 1 focused on the use of
regular rolled oats as the only ingredient, and the extruder was tested for differences on final
product when adjusting the feed rate, water addition rate, and barrel temperature profile. An ideal
product was not achieved in the preliminary research, and therefore the feasibility studies were
performed in an attempt to subjectively test for the effect of other extrusion parameter
adjustments. Table 3.1 displays the processing parameters which were used throughout
experimentation.
1 Whole Rolled Oats, 2Whole Oat Groats, 3Formula Ingredient Modification, 4Reduced Particle Size
Extrusion Adjustment Bias
One important aspect of the experimental methodology is that in each experiment, the extruder
was not fully shut down and restarted back up again to test each treatment. Therefore, it is
Table 3.3 Overview of High Moisture Extrusion Experiment Operating Parameters
32
possible that some bias occurred in the first treatments performed in each experiment due to the
difference in environmental conditions between the first treatments and succeeding ones.
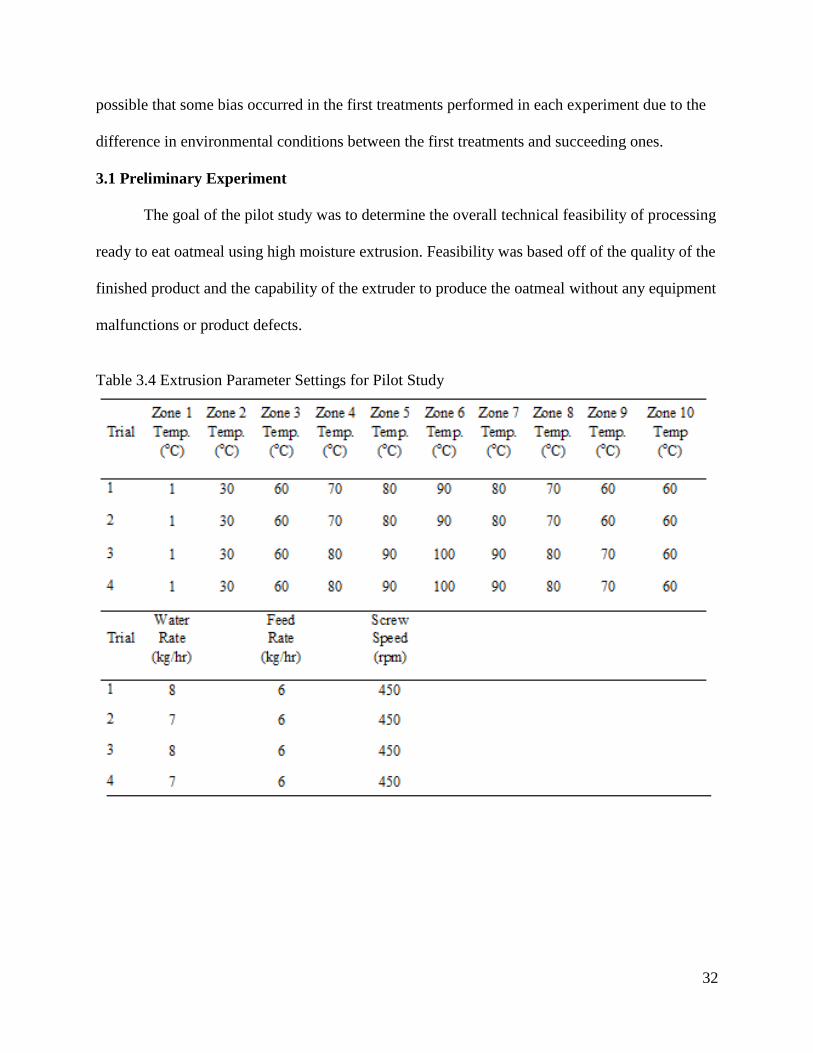
3.1 Preliminary Experiment
The goal of the pilot study was to determine the overall technical feasibility of processing
ready to eat oatmeal using high moisture extrusion. Feasibility was based off of the quality of the
finished product and the capability of the extruder to produce the oatmeal without any equipment
malfunctions or product defects.
Table 3.4 Extrusion Parameter Settings for Pilot Study
33
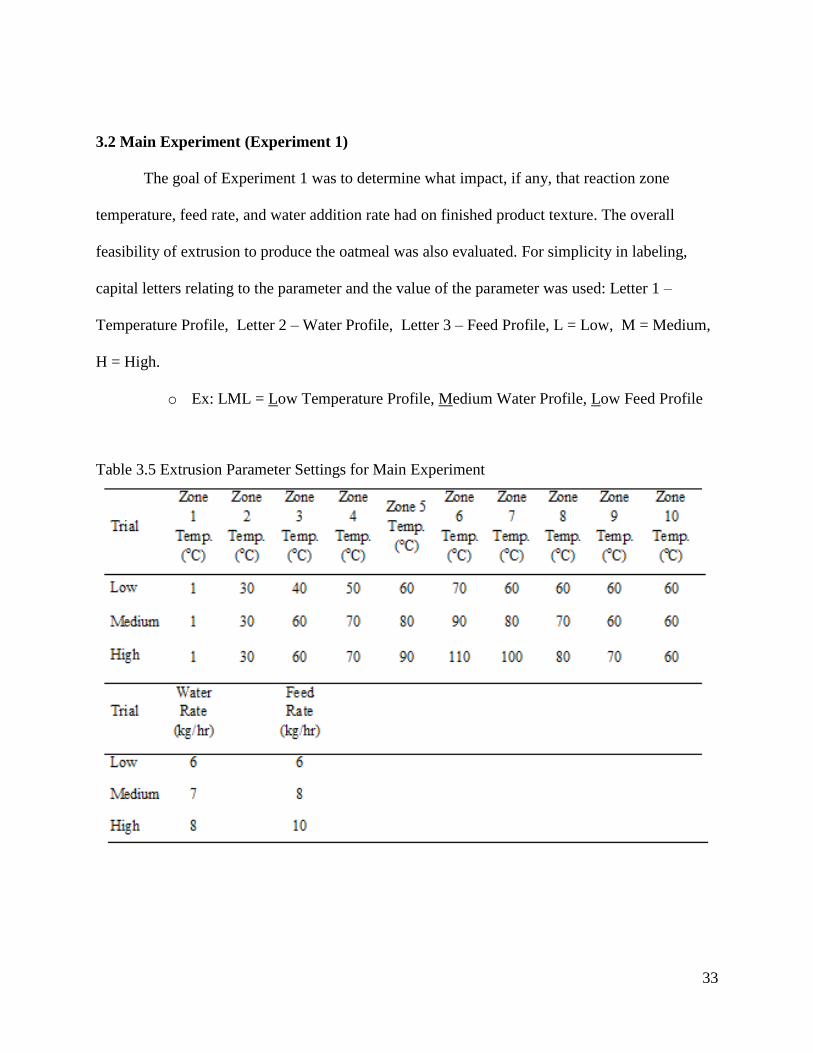
3.2 Main Experiment (Experiment 1)
The goal of Experiment 1 was to determine what impact, if any, that reaction zone
temperature, feed rate, and water addition rate had on finished product texture. The overall
feasibility of extrusion to produce the oatmeal was also evaluated. For simplicity in labeling,
capital letters relating to the parameter and the value of the parameter was used: Letter 1 –
Temperature Profile, Letter 2 – Water Profile, Letter 3 – Feed Profile, L = Low, M = Medium,
H = High.
o Ex: LML = Low Temperature Profile, Medium Water Profile, Low Feed Profile
Table 3.5 Extrusion Parameter Settings for Main Experiment
34
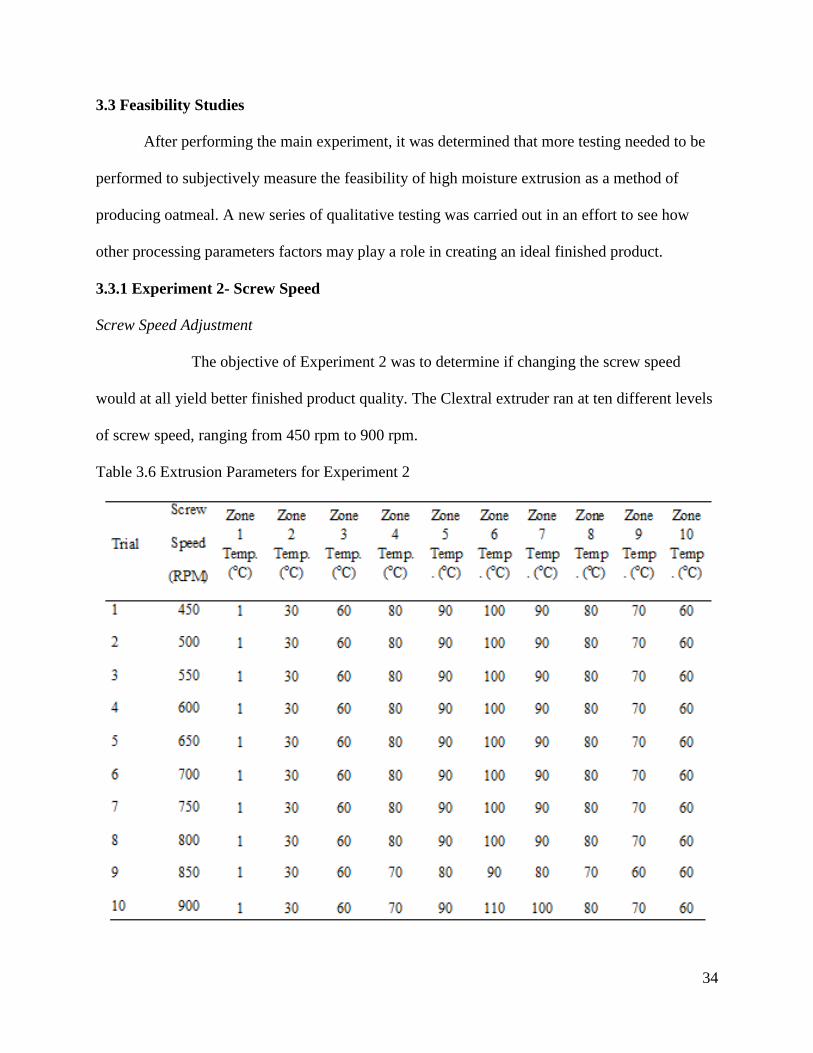
3.3 Feasibility Studies
After performing the main experiment, it was determined that more testing needed to be
performed to subjectively measure the feasibility of high moisture extrusion as a method of
producing oatmeal. A new series of qualitative testing was carried out in an effort to see how
other processing parameters factors may play a role in creating an ideal finished product.
3.3.1 Experiment 2- Screw Speed
Screw Speed Adjustment
The objective of Experiment 2 was to determine if changing the screw speed
would at all yield better finished product quality. The Clextral extruder ran at ten different levels
of screw speed, ranging from 450 rpm to 900 rpm.
Table 3.6 Extrusion Parameters for Experiment 2
35
3.3.2 Experiment 3- Water Addition Location
Experiment 3 was performed in an effort to determine if changing the location in which
the water was injected into the barrel would improve the efficacy of the process to make high
quality product.
Water Port Location
Throughout the various treatments, the Clextral water pump was setup to directly inject
water into the two main mixing zones of the extruder, zones 4 and 5 (Figure 3.7) .
In order to try and get an indication of the effect that previously tested factors had in conjunction
with water location, feed rate, water rate, reaction zone temperature, and screw speed were also
tested during this experiment.
Table 3.7 Extrusion Settings for Experiment 3
36
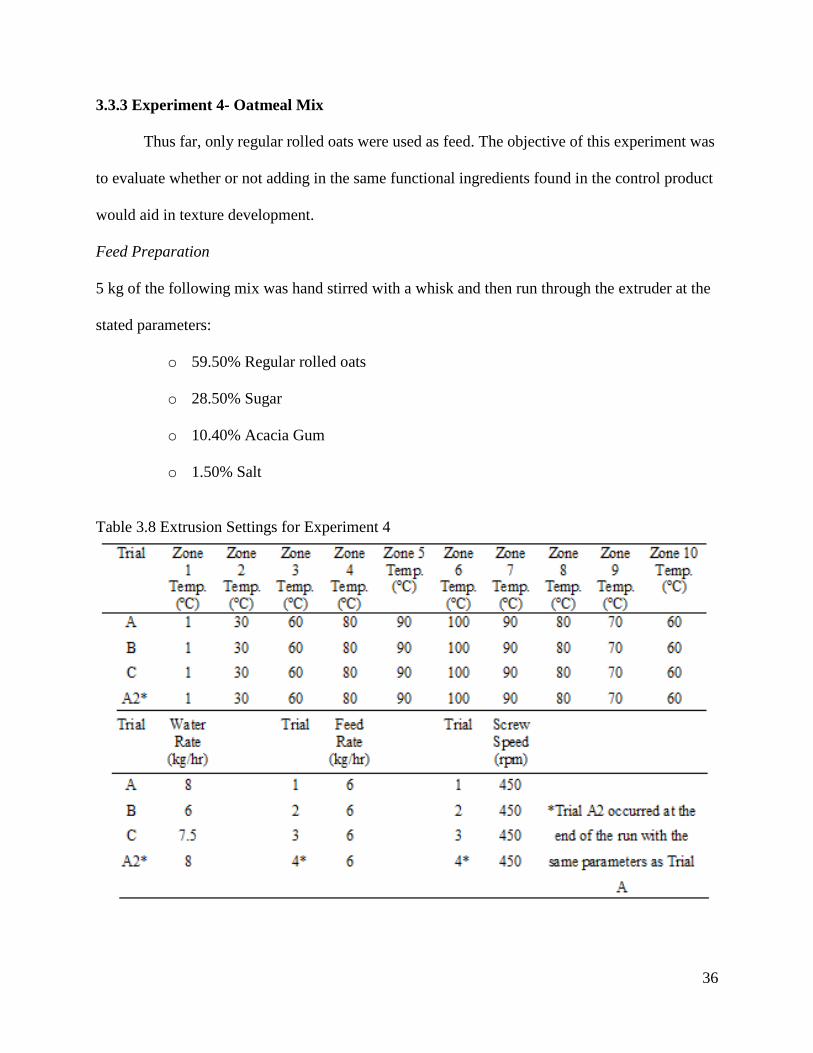
3.3.3 Experiment 4- Oatmeal Mix
Thus far, only regular rolled oats were used as feed. The objective of this experiment was
to evaluate whether or not adding in the same functional ingredients found in the control product
would aid in texture development.
Feed Preparation
5 kg of the following mix was hand stirred with a whisk and then run through the extruder at the
stated parameters:
o 59.50% Regular rolled oats
o 28.50% Sugar
o 10.40% Acacia Gum
o 1.50% Salt
Table 3.8 Extrusion Settings for Experiment 4
37
3.3.4 Experiment 5- Reduced Particle Size
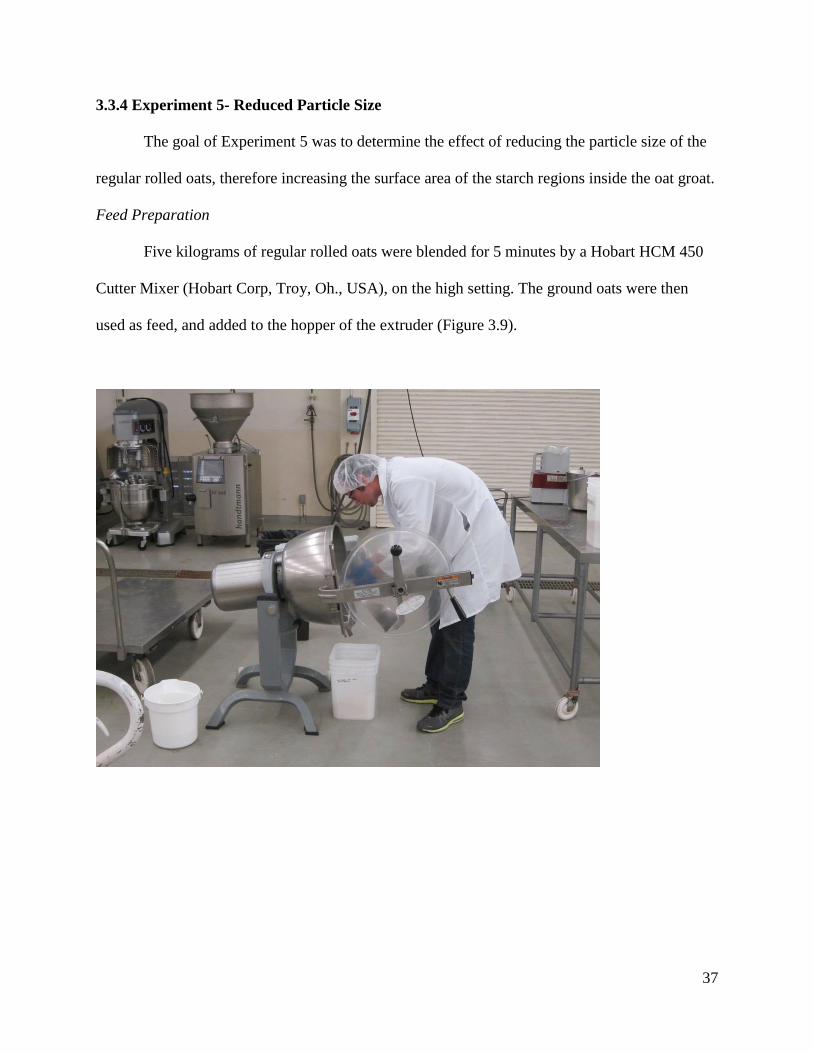
The goal of Experiment 5 was to determine the effect of reducing the particle size of the
regular rolled oats, therefore increasing the surface area of the starch regions inside the oat groat.
Feed Preparation
Five kilograms of regular rolled oats were blended for 5 minutes by a Hobart HCM 450
Cutter Mixer (Hobart Corp, Troy, Oh., USA), on the high setting. The ground oats were then
used as feed, and added to the hopper of the extruder (Figure 3.9).
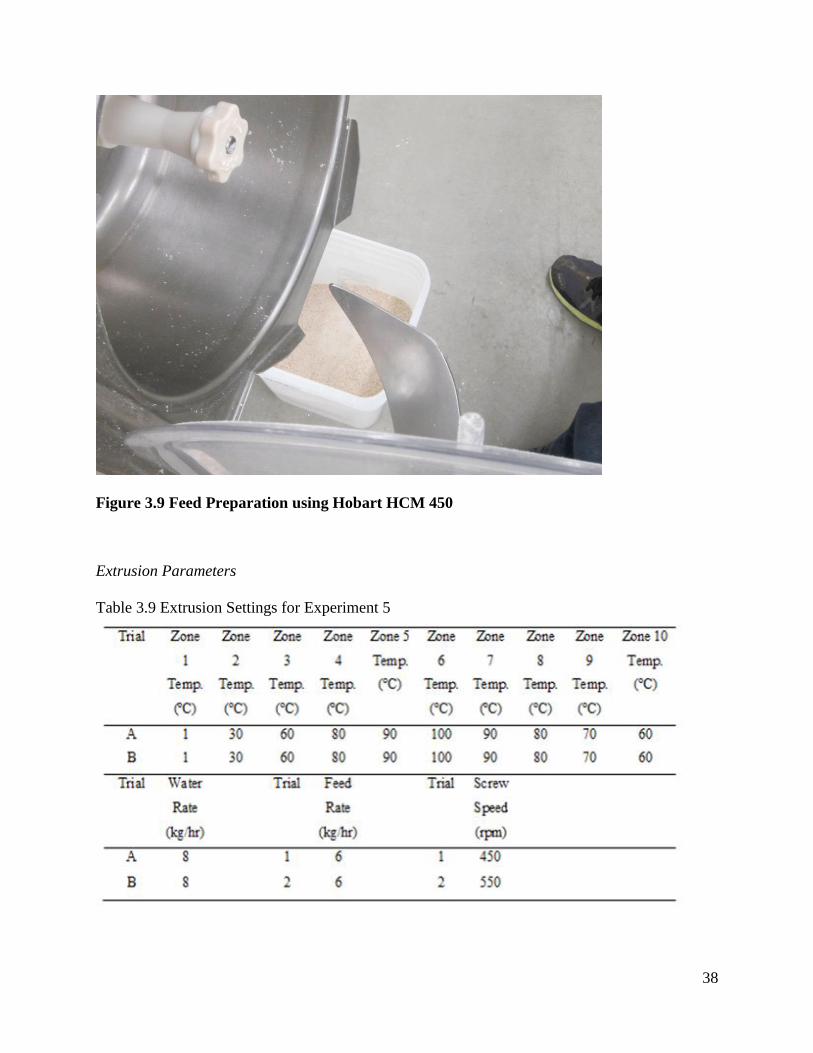
38
Figure 3.9 Feed Preparation using Hobart HCM 450
Extrusion Parameters
Table 3.9 Extrusion Settings for Experiment 5
39
3.3.5 Experiment 6- New Water Pump
The goal of Experiment 6 was to determine the effect of changing the water injection rate
to higher levels than previously attempted. The Novatech Omni pump was used for this
experiment.
Feed Preparation
Five kg of the following mix was homogenized in a Hobart HCM 450 Cutter Mixer for 3
minutes then run through the extruder at the stated parameters:
o 59.50% Regular rolled oats (pre-blended for5 minutes in Hobart KCM 450)
o 28.50% Sugar
o 10.40% Acacia Gum
o 1.50% Salt
Extrusion Parameters
Table 3.10 Extrusion Settings for Experiment 6
40
Technical Evaluation Assumptions
Clextral Extruder operates consistently when performing the experiment.
The environmental conditions of the Pilot Plant do not change between trials.
The oats supplied by Wawona were all grown, harvested, and processed under the same
conditions
3.3.6 Process Economics Evaluation
The process economics of the extrusion method to produce oatmeal will be assessed
using the following parameters:
1) Capital Requirements
2) Process Costing
3) Net Present Value
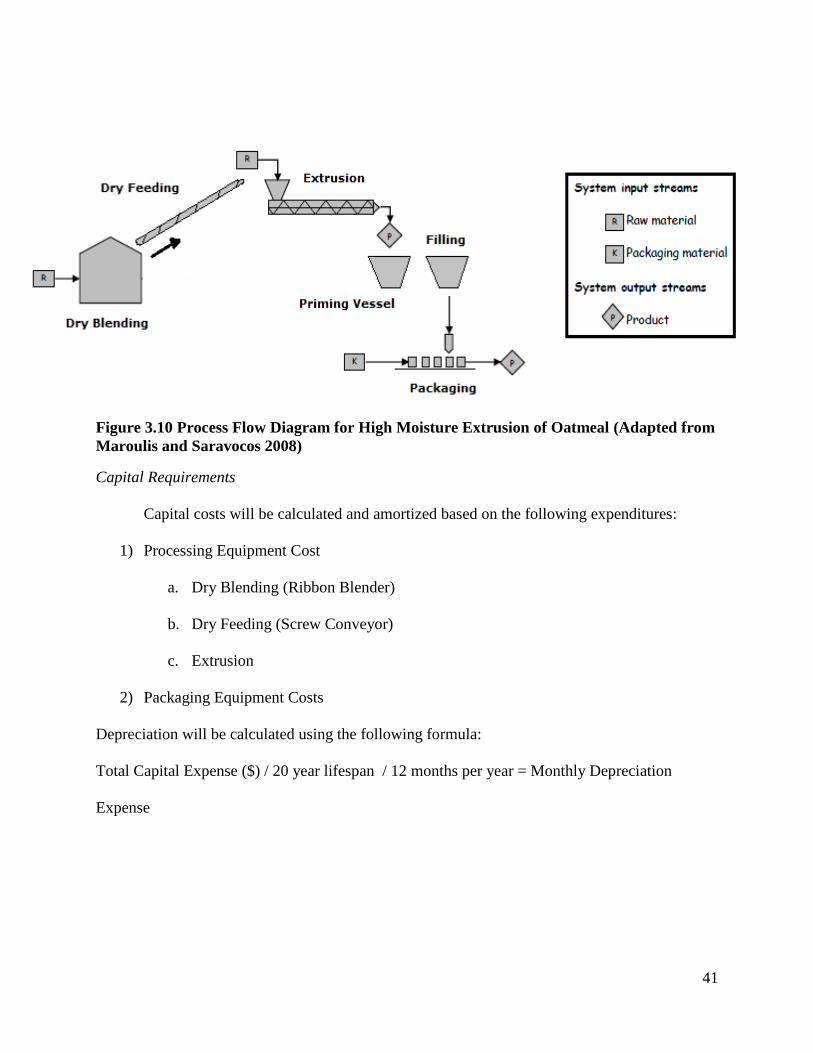
In their text, Food Plant Economics, Maroulis and Saravacos (2008) surveyed the food
processing industry and determined average financial requirements for various processing
technologies. For the purposes of evaluating the economical requirements for the auxiliary
blending and feeding process, financial data was generalized from this collection of data.
Extrusion financial data was extrapolated from the process performed in the Cal Poly Pilot Plant
and applied to the following model for commercially utilizing high moisture extrusion to process
oatmeal:
41
Figure 3.10 Process Flow Diagram for High Moisture Extrusion of Oatmeal (Adapted from
Maroulis and Saravocos 2008)
Capital Requirements
Capital costs will be calculated and amortized based on the following expenditures:
1) Processing Equipment Cost
a. Dry Blending (Ribbon Blender)
b. Dry Feeding (Screw Conveyor)
c. Extrusion
2) Packaging Equipment Costs
Depreciation will be calculated using the following formula:
Total Capital Expense ($) / 20 year lifespan / 12 months per year = Monthly Depreciation
Expense
42
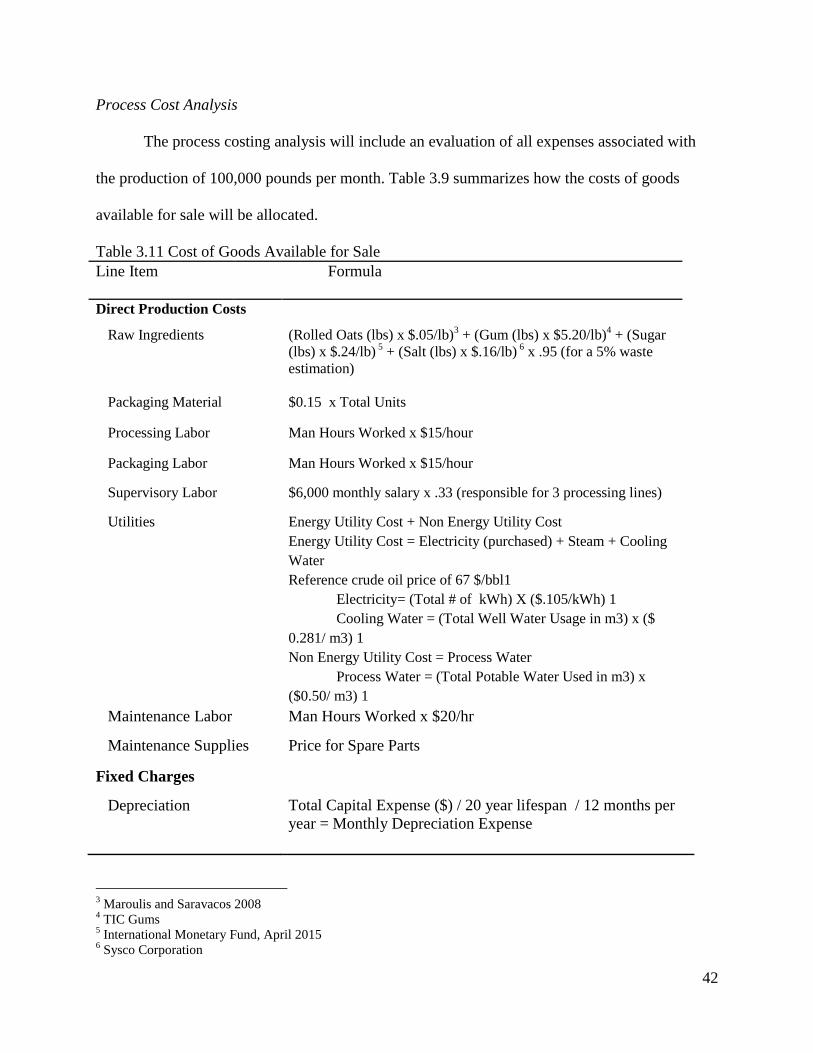
Process Cost Analysis
The process costing analysis will include an evaluation of all expenses associated with
the production of 100,000 pounds per month. Table 3.9 summarizes how the costs of goods
available for sale will be allocated.
Table 3.11 Cost of Goods Available for Sale
Line Item Formula
Direct Production Costs
Raw Ingredients (Rolled Oats (lbs) x $.05/lb)3 + (Gum (lbs) x $5.20/lb)
4 + (Sugar
(lbs) x $.24/lb) 5 + (Salt (lbs) x $.16/lb)
6 x .95 (for a 5% waste
estimation)
Packaging Material $0.15 x Total Units
Processing Labor Man Hours Worked x $15/hour
Packaging Labor Man Hours Worked x $15/hour
Supervisory Labor $6,000 monthly salary x .33 (responsible for 3 processing lines)
Utilities Energy Utility Cost + Non Energy Utility Cost
Energy Utility Cost = Electricity (purchased) + Steam + Cooling
Water
Reference crude oil price of 67 $/bbl1
Electricity= (Total # of kWh) X ($.105/kWh) 1
Cooling Water = (Total Well Water Usage in m3) x ($
0.281/ m3) 1
Non Energy Utility Cost = Process Water
Process Water = (Total Potable Water Used in m3) x
($0.50/ m3) 1
Maintenance Labor Man Hours Worked x $20/hr
Maintenance Supplies Price for Spare Parts
Fixed Charges
Depreciation Total Capital Expense ($) / 20 year lifespan / 12 months per
year = Monthly Depreciation Expense
3 Maroulis and Saravacos 2008
4 TIC Gums
5 International Monetary Fund, April 2015
6 Sysco Corporation
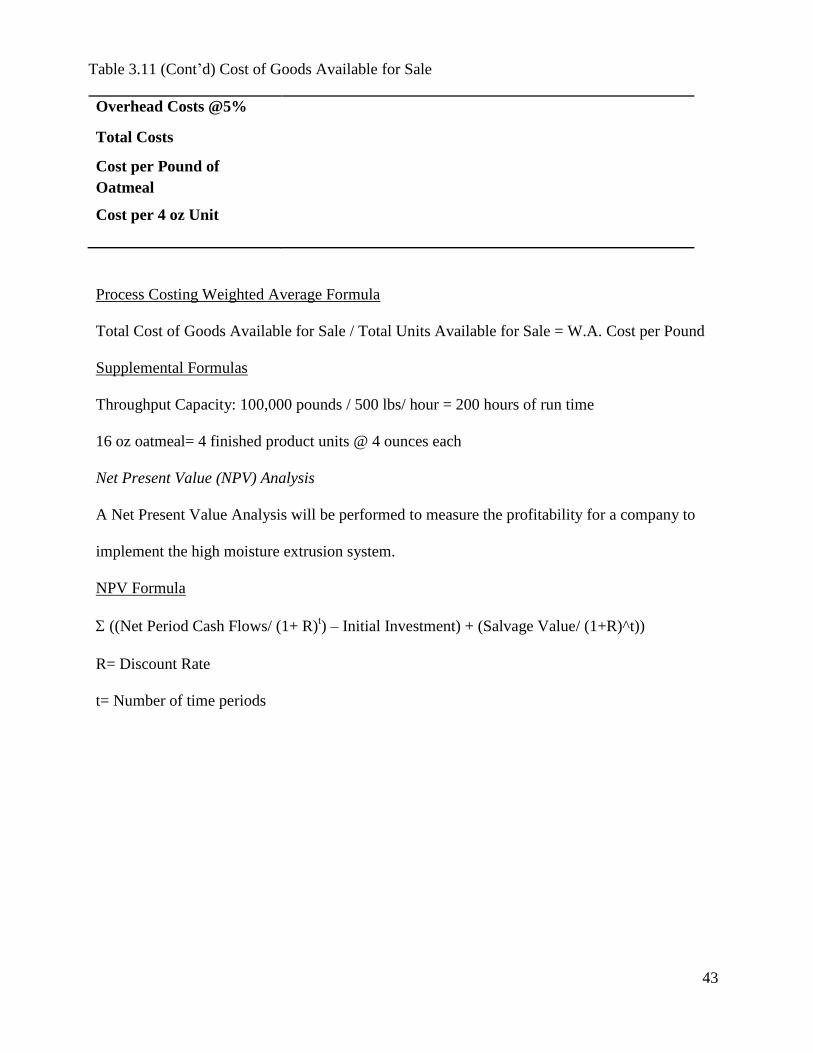
43
Overhead Costs @5%
Total Costs
Cost per Pound of
Oatmeal
Cost per 4 oz Unit
Process Costing Weighted Average Formula
Total Cost of Goods Available for Sale / Total Units Available for Sale = W.A. Cost per Pound
Supplemental Formulas
Throughput Capacity: 100,000 pounds / 500 lbs/ hour = 200 hours of run time
16 oz oatmeal= 4 finished product units @ 4 ounces each
Net Present Value (NPV) Analysis
A Net Present Value Analysis will be performed to measure the profitability for a company to
implement the high moisture extrusion system.
NPV Formula
((Net Period Cash Flows/ (1+ R)t) – Initial Investment) + (Salvage Value/ (1+R)^t))
R= Discount Rate
t= Number of time periods
Table 3.11 (Cont’d) Cost of Goods Available for Sale

44
Economic Evaluation Assumptions
I. Infrastructure
a. The facility implementing oatmeal production already has typical utilities installed
in the building as well as chilled water
b. There is already a building infrastructure in place
c. Processing supplies such as buckets, utensils, carts, etc. are available within
facility
II. Costing
a. Fixed costs such as insurance, interest, and taxes do not change relative to
oatmeal processing methodology
b. Cash is used to purchase all necessary infrastructure
45
CHAPTER 4
Results and Discussion
4.1 Process Economics Evaluation
Process Costing
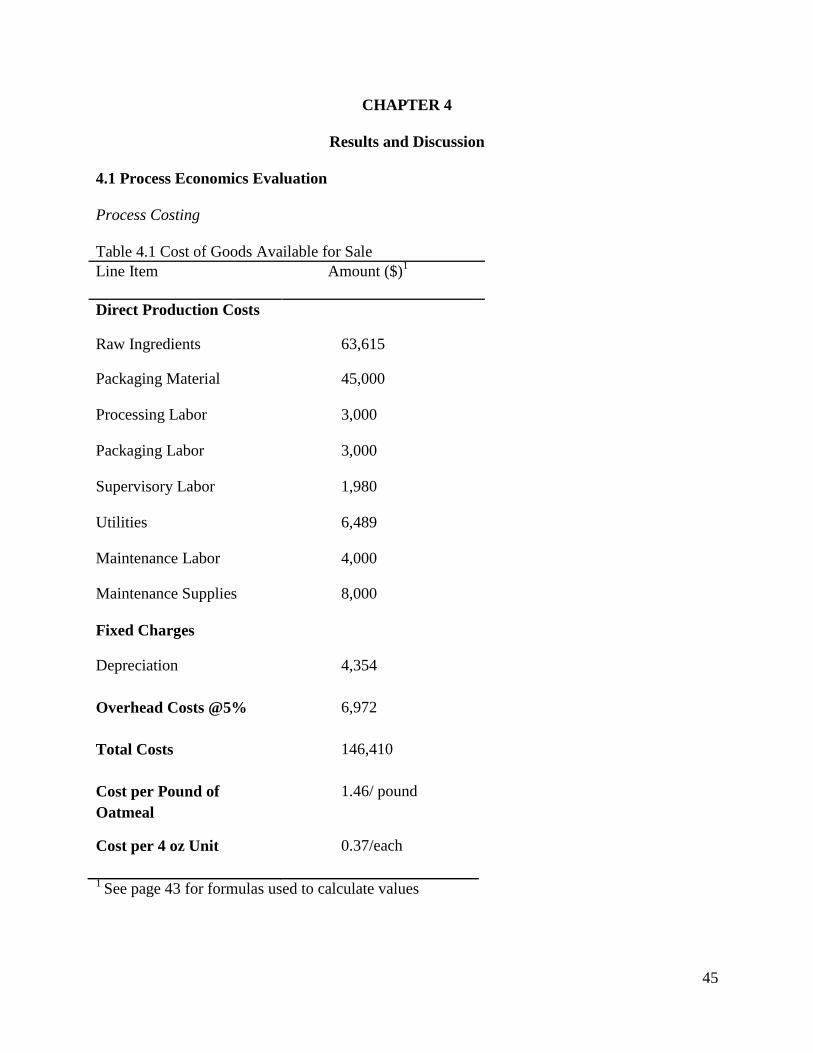
Table 4.1 Cost of Goods Available for Sale
Line Item Amount ($)1
Direct Production Costs
Raw Ingredients 63,615
Packaging Material 45,000
Processing Labor 3,000
Packaging Labor 3,000
Supervisory Labor 1,980
Utilities 6,489
Maintenance Labor 4,000
Maintenance Supplies 8,000
Fixed Charges
Depreciation 4,354
Overhead Costs @5% 6,972
Total Costs 146,410
Cost per Pound of
Oatmeal
1.46/ pound
Cost per 4 oz Unit 0.37/each
1 See page 43 for formulas used to calculate values
46
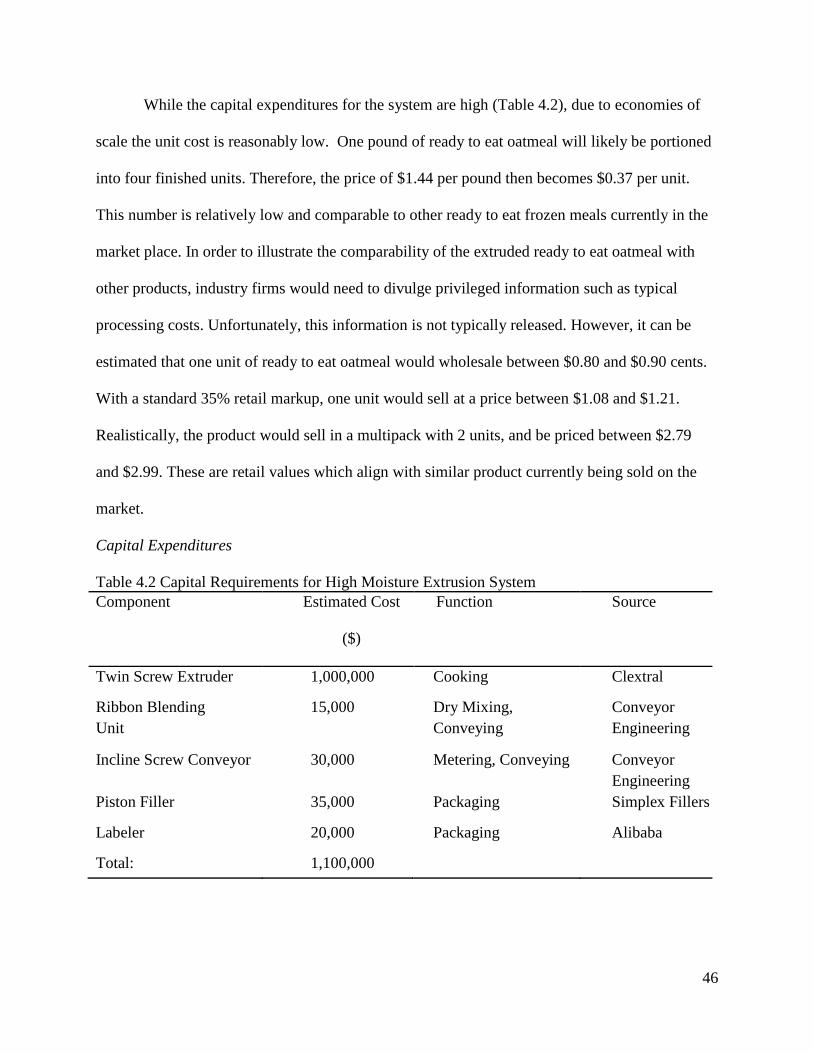
While the capital expenditures for the system are high (Table 4.2), due to economies of
scale the unit cost is reasonably low. One pound of ready to eat oatmeal will likely be portioned
into four finished units. Therefore, the price of $1.44 per pound then becomes $0.37 per unit.
This number is relatively low and comparable to other ready to eat frozen meals currently in the
market place. In order to illustrate the comparability of the extruded ready to eat oatmeal with
other products, industry firms would need to divulge privileged information such as typical
processing costs. Unfortunately, this information is not typically released. However, it can be
estimated that one unit of ready to eat oatmeal would wholesale between $0.80 and $0.90 cents.
With a standard 35% retail markup, one unit would sell at a price between $1.08 and $1.21.
Realistically, the product would sell in a multipack with 2 units, and be priced between $2.79
and $2.99. These are retail values which align with similar product currently being sold on the
market.
Capital Expenditures
Table 4.2 Capital Requirements for High Moisture Extrusion System
Component Estimated Cost
($)
Function Source
Twin Screw Extruder 1,000,000 Cooking Clextral
Ribbon Blending
Unit
15,000 Dry Mixing,
Conveying
Conveyor
Engineering
Incline Screw Conveyor 30,000 Metering, Conveying Conveyor
Engineering
Piston Filler 35,000 Packaging Simplex Fillers
Labeler 20,000 Packaging Alibaba
Total: 1,100,000
47
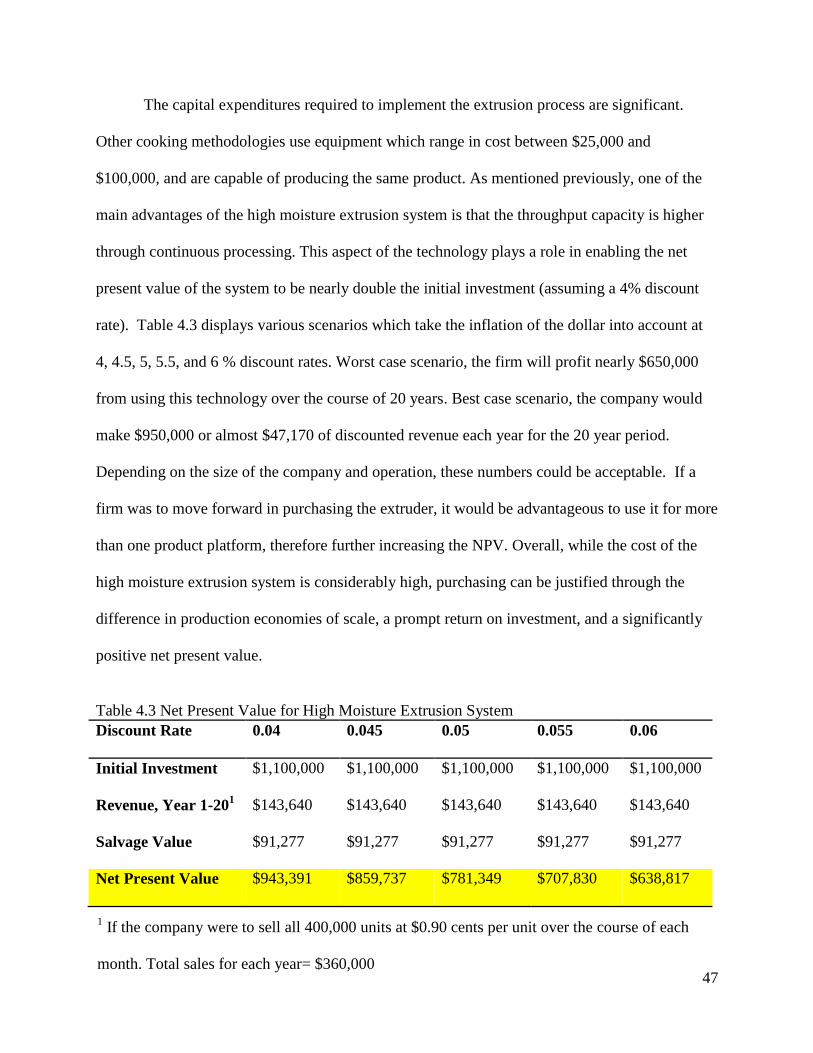
The capital expenditures required to implement the extrusion process are significant.
Other cooking methodologies use equipment which range in cost between $25,000 and
$100,000, and are capable of producing the same product. As mentioned previously, one of the
main advantages of the high moisture extrusion system is that the throughput capacity is higher
through continuous processing. This aspect of the technology plays a role in enabling the net
present value of the system to be nearly double the initial investment (assuming a 4% discount
rate). Table 4.3 displays various scenarios which take the inflation of the dollar into account at
4, 4.5, 5, 5.5, and 6 % discount rates. Worst case scenario, the firm will profit nearly $650,000
from using this technology over the course of 20 years. Best case scenario, the company would
make $950,000 or almost $47,170 of discounted revenue each year for the 20 year period.
Depending on the size of the company and operation, these numbers could be acceptable. If a
firm was to move forward in purchasing the extruder, it would be advantageous to use it for more
than one product platform, therefore further increasing the NPV. Overall, while the cost of the
high moisture extrusion system is considerably high, purchasing can be justified through the
difference in production economies of scale, a prompt return on investment, and a significantly
positive net present value.
Table 4.3 Net Present Value for High Moisture Extrusion System
Discount Rate 0.04 0.045 0.05 0.055 0.06
Initial Investment $1,100,000 $1,100,000 $1,100,000 $1,100,000 $1,100,000
Revenue, Year 1-201 $143,640 $143,640 $143,640 $143,640 $143,640
Salvage Value $91,277 $91,277 $91,277 $91,277 $91,277
Net Present Value $943,391 $859,737 $781,349 $707,830 $638,817
1 If the company were to sell all 400,000 units at $0.90 cents per unit over the course of each
month. Total sales for each year= $360,000
48
4.2 Technical Evaluation of Extrusion Process
The previous section determined whether or not using the high moisture extrusion system
to produce ready to eat oatmeal would be financially possible. Since the evaluation revealed that
it would be economically feasible, a technical study was performed to determine the plausibility
of actually implementing the system.
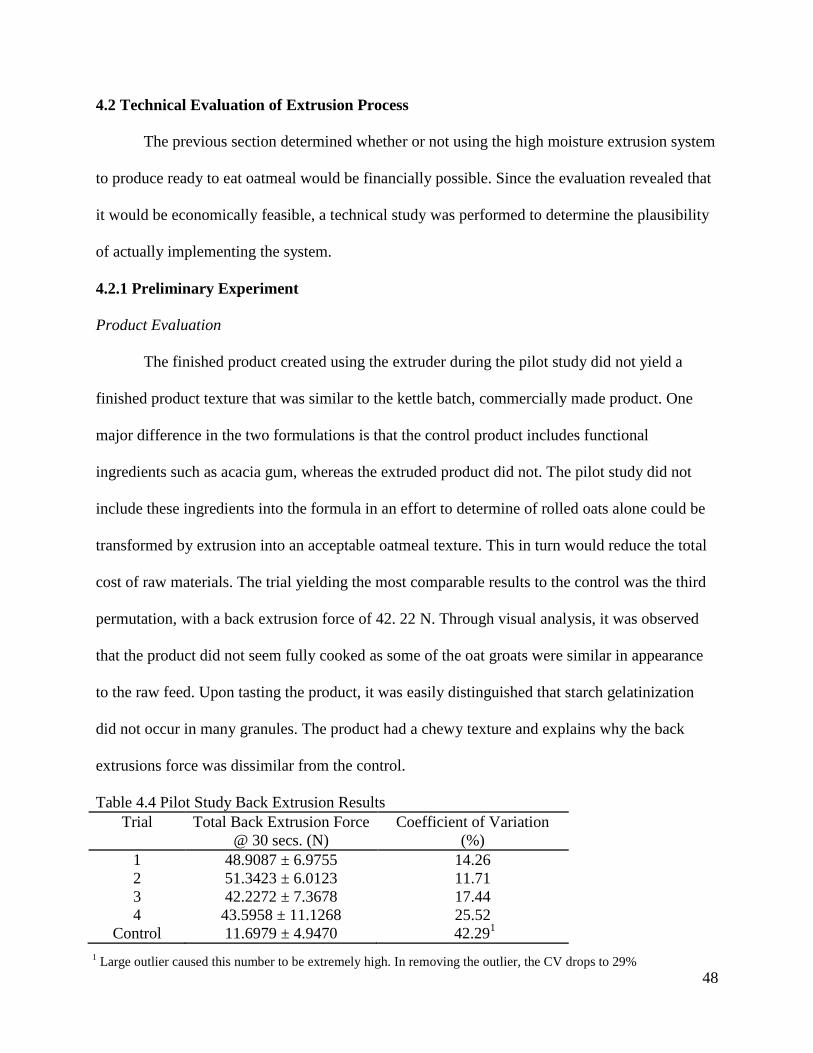
4.2.1 Preliminary Experiment
Product Evaluation
The finished product created using the extruder during the pilot study did not yield a
finished product texture that was similar to the kettle batch, commercially made product. One
major difference in the two formulations is that the control product includes functional
ingredients such as acacia gum, whereas the extruded product did not. The pilot study did not
include these ingredients into the formula in an effort to determine of rolled oats alone could be
transformed by extrusion into an acceptable oatmeal texture. This in turn would reduce the total
cost of raw materials. The trial yielding the most comparable results to the control was the third
permutation, with a back extrusion force of 42. 22 N. Through visual analysis, it was observed
that the product did not seem fully cooked as some of the oat groats were similar in appearance
to the raw feed. Upon tasting the product, it was easily distinguished that starch gelatinization
did not occur in many granules. The product had a chewy texture and explains why the back
extrusions force was dissimilar from the control.
Table 4.4 Pilot Study Back Extrusion Results
Trial Total Back Extrusion Force
@ 30 secs. (N)
Coefficient of Variation
(%)
1 48.9087 ± 6.9755 14.26
2 51.3423 ± 6.0123 11.71
3 42.2272 ± 7.3678 17.44
4 43.5958 ± 11.1268 25.52
Control 11.6979 ± 4.9470 42.291
1 Large outlier caused this number to be extremely high. In removing the outlier, the CV drops to 29%
49
One observation noted during back extrusion testing was that as the reaction zone
temperature increased, the back extrusion force seemed to decrease. As the water rate increased,
the back extrusion force also decreased. This aligned with our expectations that starch
gelatinization would occur as a function of these two factors.
One can easily see that compression force was lower for the trials 3 and 4. Therefore, in
the main experiment, it would be ideal to use a high water rate and explore using reaction zone
temperatures that are higher than the profile seen in trials 3 and 4. Also, since the finished
product texture was not comparable to that of the control in this experiment, it was concluded
that incorporating the effect of a third factor, feed rate, into the main experiment might yield
more promising results. The decision to include feed rate into the next experiment was based on
the need to determine its relationship with water rate and reaction zone temperature, since starch
gelatinization depends on the proportion of heat and water to the amount of starch.
4.2.2 Experiment 1
Product Evaluation
The experiment largely confirmed the original hypothesis that a lower dry feed rate and a
higher water injection rate would be most comparable in texture with the kettle batch control
product. The treatments which revealed the lowest force required to back extrude were LML,
LHL and HHL permutations, at 40.01 N, 41.65 N and 47.57 N respectively. The coefficient of
variation (CV) was considerably high in many of the trials. It is likely that this can be attributed
human error during sample preparation for the texture analysis. It could also be partially
attributed to the extrusion adjustment bias mentioned previously.
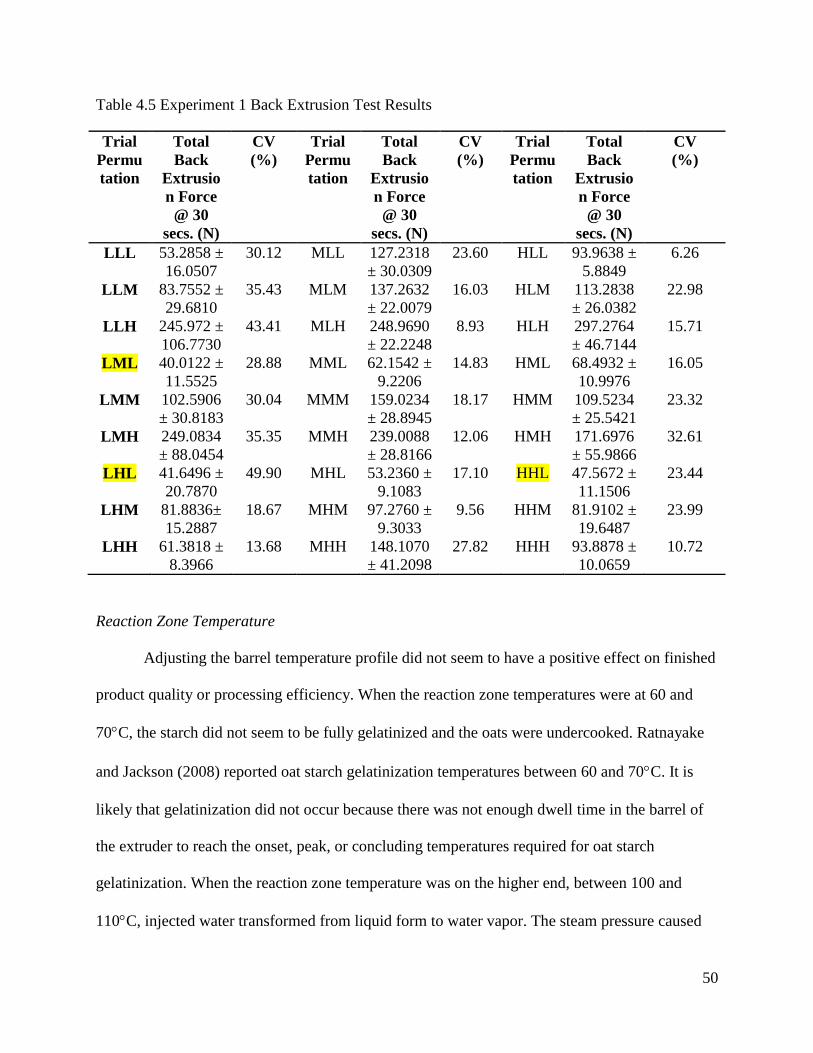
50
Table 4.5 Experiment 1 Back Extrusion Test Results
Reaction Zone Temperature
Adjusting the barrel temperature profile did not seem to have a positive effect on finished
product quality or processing efficiency. When the reaction zone temperatures were at 60 and
70C, the starch did not seem to be fully gelatinized and the oats were undercooked. Ratnayake
and Jackson (2008) reported oat starch gelatinization temperatures between 60 and 70C. It is
likely that gelatinization did not occur because there was not enough dwell time in the barrel of
the extruder to reach the onset, peak, or concluding temperatures required for oat starch
gelatinization. When the reaction zone temperature was on the higher end, between 100 and
110C, injected water transformed from liquid form to water vapor. The steam pressure caused
Trial
Permu
tation
Total
Back
Extrusio
n Force
@ 30
secs. (N)
CV
(%)
Trial
Permu
tation
Total
Back
Extrusio
n Force
@ 30
secs. (N)
CV
(%)
Trial
Permu
tation
Total
Back
Extrusio
n Force
@ 30
secs. (N)
CV
(%)
LLL 53.2858 ±
16.0507
30.12 MLL 127.2318
± 30.0309
23.60 HLL 93.9638 ±
5.8849
6.26
LLM 83.7552 ±
29.6810
35.43 MLM 137.2632
± 22.0079
16.03 HLM 113.2838
± 26.0382
22.98
LLH 245.972 ±
106.7730
43.41 MLH 248.9690
± 22.2248
8.93 HLH 297.2764
± 46.7144
15.71
LML 40.0122 ±
11.5525
28.88 MML 62.1542 ±
9.2206
14.83 HML 68.4932 ±
10.9976
16.05
LMM 102.5906
± 30.8183
30.04 MMM 159.0234
± 28.8945
18.17 HMM 109.5234
± 25.5421
23.32
LMH 249.0834
± 88.0454
35.35 MMH 239.0088
± 28.8166
12.06 HMH 171.6976
± 55.9866
32.61
LHL 41.6496 ±
20.7870
49.90 MHL 53.2360 ±
9.1083
17.10 HHL 47.5672 ±
11.1506
23.44
LHM 81.8836±
15.2887
18.67 MHM 97.2760 ±
9.3033
9.56 HHM 81.9102 ±
19.6487
23.99
LHH 61.3818 ±
8.3966
13.68 MHH 148.1070
± 41.2098
27.82 HHH 93.8878 ±
10.0659
10.72
51
the extruder to clog in the earlier feeding zones, which affected the flow rate of the product.
These clogs were cleared by ramping down the feed rate in the extruder and then increasing the
water rate to fully clear out any clogs. Once clogged product was removed, testing would resume
after steady state had once again been reached.
Water Rate
The rate of water directly injected into the barrel definitely seemed to highly
impact the product texture. When the feed rate was low and more water was injected into the
barrel during processing, it led to a more consistent flow of product. This lower viscosity product
decreased the total amount of force required to back extrude (Table 4.5). Subjectively, it was
observed that when the water level was too low, there was not enough moisture in the
environment to allow for starch gelatinization. The result was a thick, clumpy product in which
particles were not evenly cooked due to the lack of sufficient water levels inside the barrel of the
extruder. Oat starch requires excess water to fully gelatinize, but in this case there was a higher
proportion of oats to water.
Feed Rate
The product texture appeared to be negatively impacted when the feed rate was at a high
level. When feed rate was high (between 8 and 10 kg/hr), the product texture did not reach ideal
consistency regardless of reaction zone temperature or water addition rate. However, it was
observed that when the feed rate was set at 6 kg per hour, results that were more comparable to
the control product were achieved. Since flow consistency was still an issue and the product
texture results were extremely different to the control, it was determined that future feasibility
studies should include testing the effect of factors that had been constant in the preliminary and
main experiments.
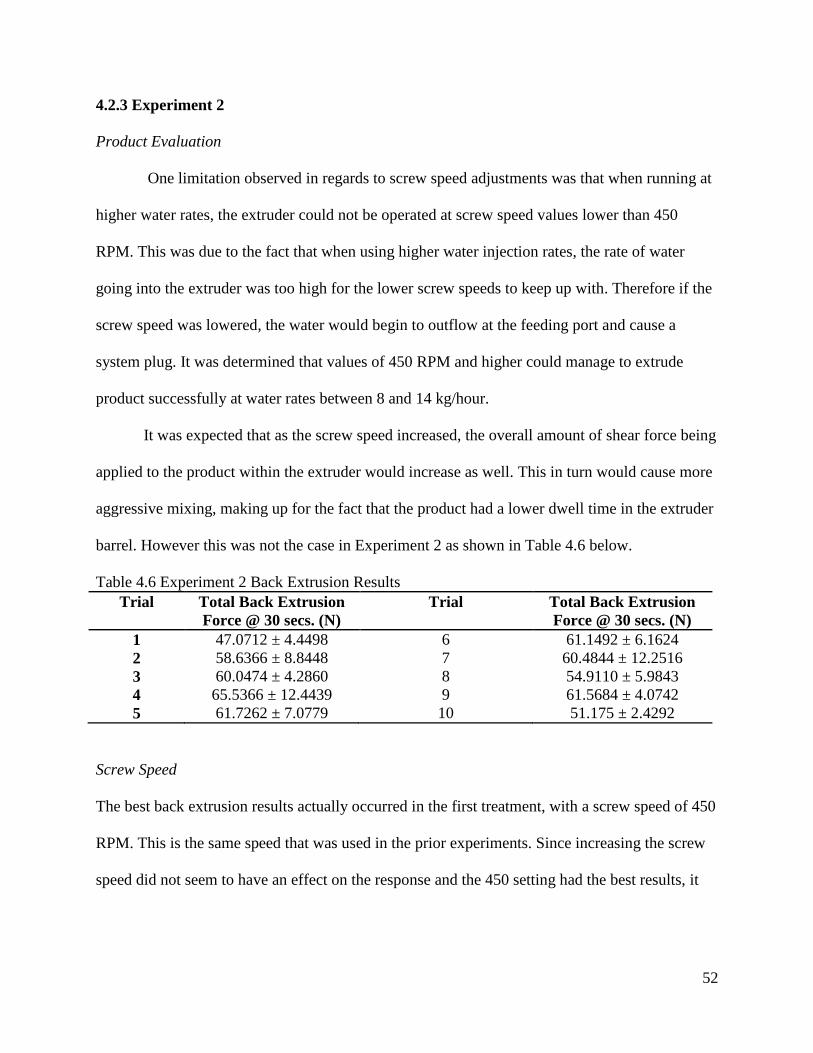
52
4.2.3 Experiment 2
Product Evaluation
One limitation observed in regards to screw speed adjustments was that when running at
higher water rates, the extruder could not be operated at screw speed values lower than 450
RPM. This was due to the fact that when using higher water injection rates, the rate of water
going into the extruder was too high for the lower screw speeds to keep up with. Therefore if the
screw speed was lowered, the water would begin to outflow at the feeding port and cause a
system plug. It was determined that values of 450 RPM and higher could manage to extrude
product successfully at water rates between 8 and 14 kg/hour.
It was expected that as the screw speed increased, the overall amount of shear force being
applied to the product within the extruder would increase as well. This in turn would cause more
aggressive mixing, making up for the fact that the product had a lower dwell time in the extruder
barrel. However this was not the case in Experiment 2 as shown in Table 4.6 below.
Table 4.6 Experiment 2 Back Extrusion Results
Trial Total Back Extrusion
Force @ 30 secs. (N)
Trial Total Back Extrusion
Force @ 30 secs. (N)
1 47.0712 ± 4.4498 6 61.1492 ± 6.1624
2 58.6366 ± 8.8448 7 60.4844 ± 12.2516
3 60.0474 ± 4.2860 8 54.9110 ± 5.9843
4 65.5366 ± 12.4439 9 61.5684 ± 4.0742
5 61.7262 ± 7.0779 10 51.175 ± 2.4292
Screw Speed
The best back extrusion results actually occurred in the first treatment, with a screw speed of 450
RPM. This is the same speed that was used in the prior experiments. Since increasing the screw
speed did not seem to have an effect on the response and the 450 setting had the best results, it
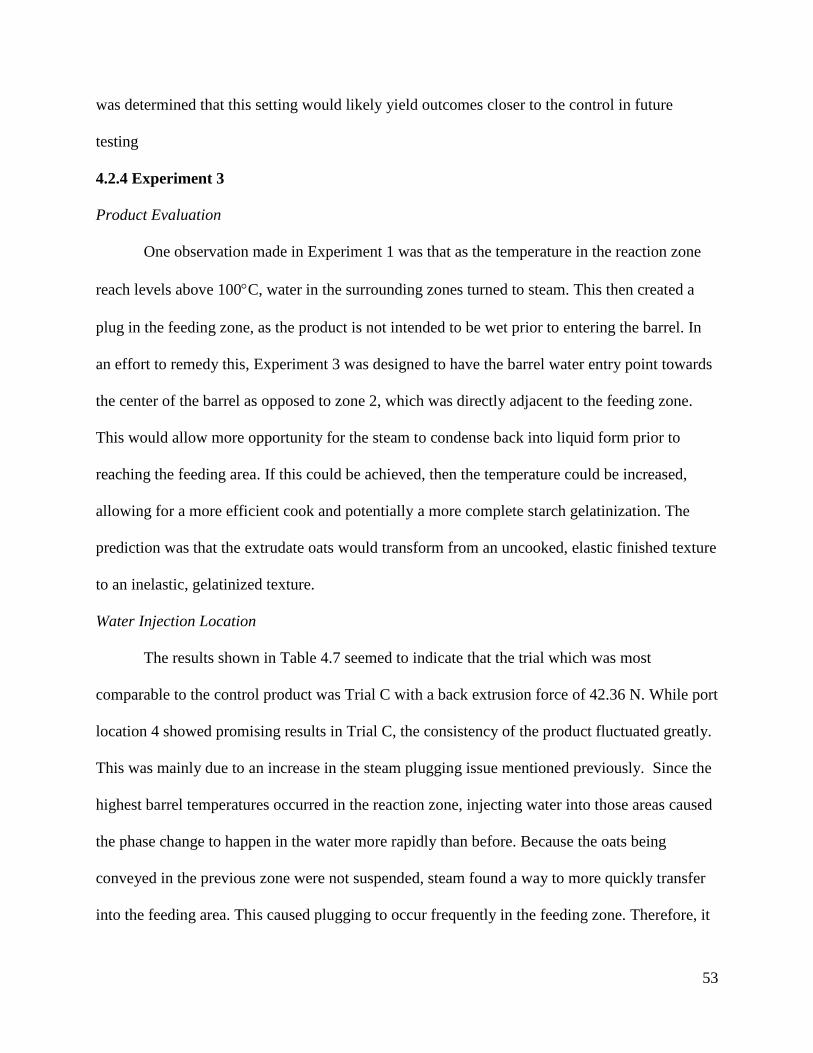
53
was determined that this setting would likely yield outcomes closer to the control in future
testing
4.2.4 Experiment 3
Product Evaluation
One observation made in Experiment 1 was that as the temperature in the reaction zone
reach levels above 100C, water in the surrounding zones turned to steam. This then created a
plug in the feeding zone, as the product is not intended to be wet prior to entering the barrel. In
an effort to remedy this, Experiment 3 was designed to have the barrel water entry point towards
the center of the barrel as opposed to zone 2, which was directly adjacent to the feeding zone.
This would allow more opportunity for the steam to condense back into liquid form prior to
reaching the feeding area. If this could be achieved, then the temperature could be increased,
allowing for a more efficient cook and potentially a more complete starch gelatinization. The
prediction was that the extrudate oats would transform from an uncooked, elastic finished texture
to an inelastic, gelatinized texture.
Water Injection Location
The results shown in Table 4.7 seemed to indicate that the trial which was most
comparable to the control product was Trial C with a back extrusion force of 42.36 N. While port
location 4 showed promising results in Trial C, the consistency of the product fluctuated greatly.
This was mainly due to an increase in the steam plugging issue mentioned previously. Since the
highest barrel temperatures occurred in the reaction zone, injecting water into those areas caused
the phase change to happen in the water more rapidly than before. Because the oats being
conveyed in the previous zone were not suspended, steam found a way to more quickly transfer
into the feeding area. This caused plugging to occur frequently in the feeding zone. Therefore, it
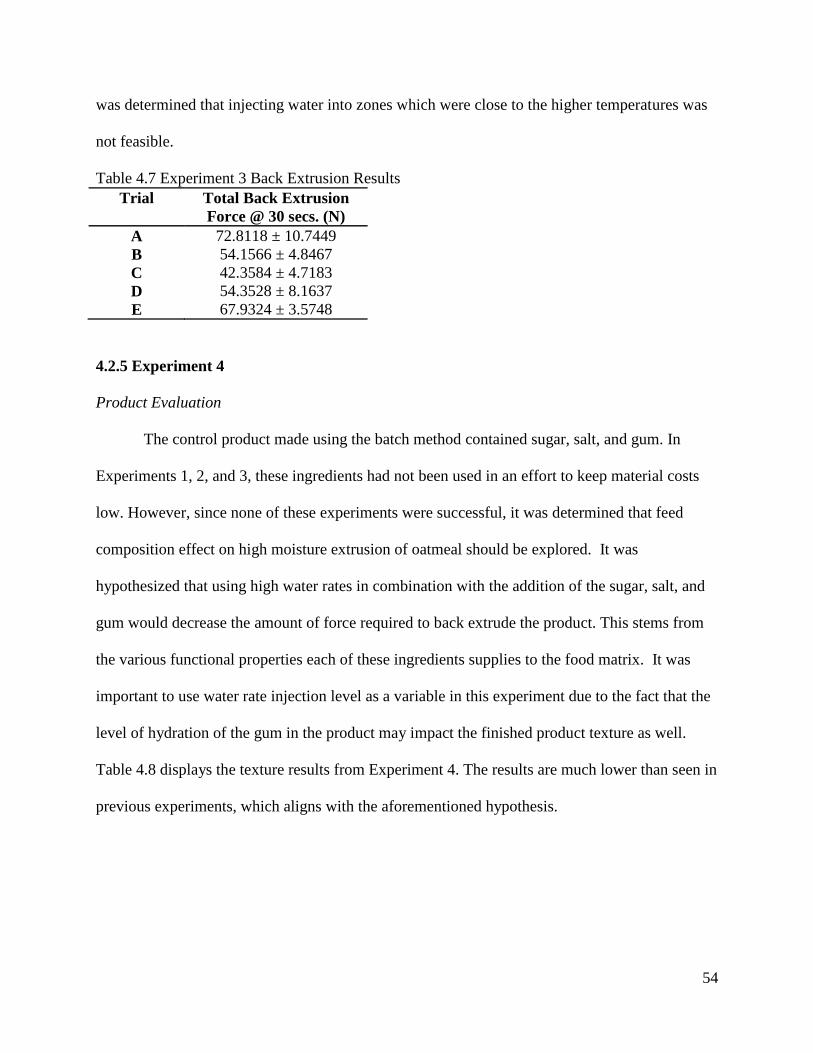
54
was determined that injecting water into zones which were close to the higher temperatures was
not feasible.
Table 4.7 Experiment 3 Back Extrusion Results
Trial Total Back Extrusion
Force @ 30 secs. (N)
A 72.8118 ± 10.7449
B 54.1566 ± 4.8467
C 42.3584 ± 4.7183
D 54.3528 ± 8.1637
E 67.9324 ± 3.5748
4.2.5 Experiment 4
Product Evaluation
The control product made using the batch method contained sugar, salt, and gum. In
Experiments 1, 2, and 3, these ingredients had not been used in an effort to keep material costs
low. However, since none of these experiments were successful, it was determined that feed
composition effect on high moisture extrusion of oatmeal should be explored. It was
hypothesized that using high water rates in combination with the addition of the sugar, salt, and
gum would decrease the amount of force required to back extrude the product. This stems from
the various functional properties each of these ingredients supplies to the food matrix. It was
important to use water rate injection level as a variable in this experiment due to the fact that the
level of hydration of the gum in the product may impact the finished product texture as well.
Table 4.8 displays the texture results from Experiment 4. The results are much lower than seen in
previous experiments, which aligns with the aforementioned hypothesis.
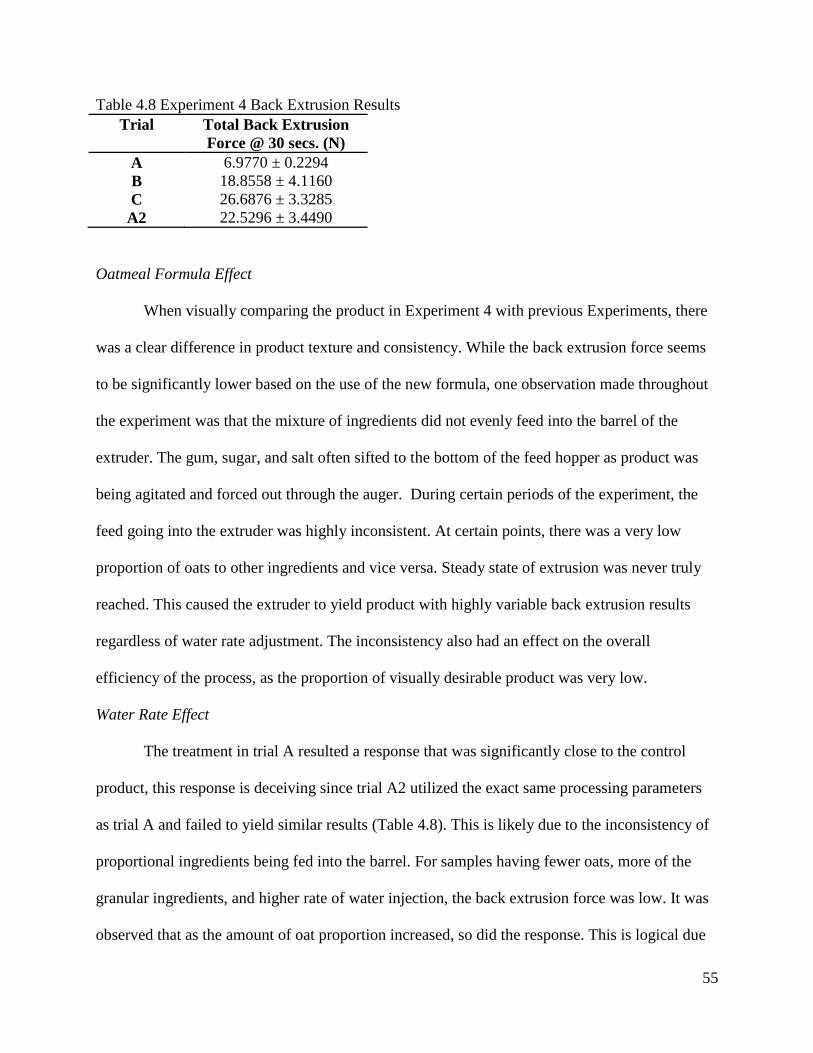
55
Table 4.8 Experiment 4 Back Extrusion Results
Trial Total Back Extrusion
Force @ 30 secs. (N)
A 6.9770 ± 0.2294
B 18.8558 ± 4.1160
C 26.6876 ± 3.3285
A2 22.5296 ± 3.4490
Oatmeal Formula Effect
When visually comparing the product in Experiment 4 with previous Experiments, there
was a clear difference in product texture and consistency. While the back extrusion force seems
to be significantly lower based on the use of the new formula, one observation made throughout
the experiment was that the mixture of ingredients did not evenly feed into the barrel of the
extruder. The gum, sugar, and salt often sifted to the bottom of the feed hopper as product was
being agitated and forced out through the auger. During certain periods of the experiment, the
feed going into the extruder was highly inconsistent. At certain points, there was a very low
proportion of oats to other ingredients and vice versa. Steady state of extrusion was never truly
reached. This caused the extruder to yield product with highly variable back extrusion results
regardless of water rate adjustment. The inconsistency also had an effect on the overall
efficiency of the process, as the proportion of visually desirable product was very low.
Water Rate Effect
The treatment in trial A resulted a response that was significantly close to the control
product, this response is deceiving since trial A2 utilized the exact same processing parameters
as trial A and failed to yield similar results (Table 4.8). This is likely due to the inconsistency of
proportional ingredients being fed into the barrel. For samples having fewer oats, more of the
granular ingredients, and higher rate of water injection, the back extrusion force was low. It was
observed that as the amount of oat proportion increased, so did the response. This is logical due
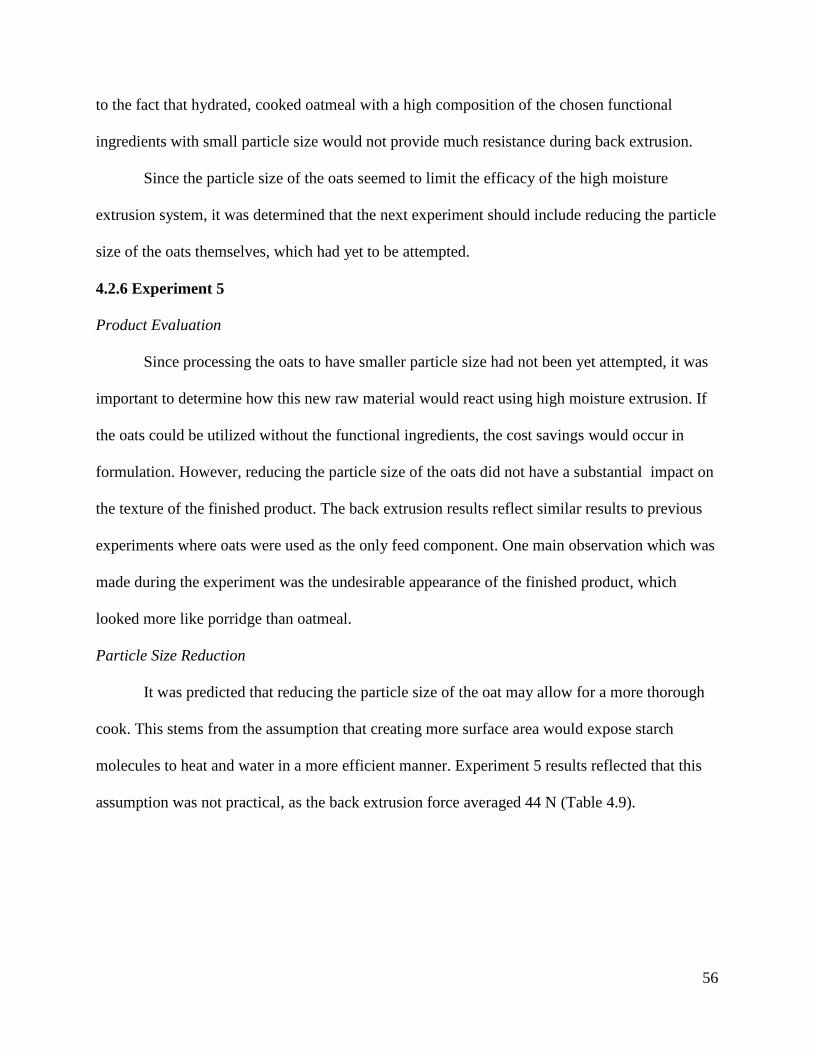
56
to the fact that hydrated, cooked oatmeal with a high composition of the chosen functional
ingredients with small particle size would not provide much resistance during back extrusion.
Since the particle size of the oats seemed to limit the efficacy of the high moisture
extrusion system, it was determined that the next experiment should include reducing the particle
size of the oats themselves, which had yet to be attempted.
4.2.6 Experiment 5
Product Evaluation
Since processing the oats to have smaller particle size had not been yet attempted, it was
important to determine how this new raw material would react using high moisture extrusion. If
the oats could be utilized without the functional ingredients, the cost savings would occur in
formulation. However, reducing the particle size of the oats did not have a substantial impact on
the texture of the finished product. The back extrusion results reflect similar results to previous
experiments where oats were used as the only feed component. One main observation which was
made during the experiment was the undesirable appearance of the finished product, which
looked more like porridge than oatmeal.
Particle Size Reduction
It was predicted that reducing the particle size of the oat may allow for a more thorough
cook. This stems from the assumption that creating more surface area would expose starch
molecules to heat and water in a more efficient manner. Experiment 5 results reflected that this
assumption was not practical, as the back extrusion force averaged 44 N (Table 4.9).
57
Table 4.9 Experiment 5 Back Extrusion Results
Screw Speed Adjustment
Increasing the screw speed lowers the total dwell time for feed to be mixed with water
and exposure to heat. Since the oat particles were going to be much smaller, it was predicted that
the starch would not need as much time to hydrate and cook. Therefore, multiple screw speeds
were used in an attempt to verify this concept. However, increasing the screw speed by did not
yield a considerably different response in this experiment, meaning that decreasing dwell time by
roughly 20% did not appear to have any effect on the finished product.
Although the regular blended oats did not yield results similar to the commercial product,
it was thought that once they were mixed with the functional ingredients of the oatmeal formula
used in Experiment 4 the back extrusion results might improve. In the next experiment, this
hypothesis was tested.
4.2.7 Experiment 6
In all previous Experiments, one major limitation was the capacity of the Clextral water
pump, which could only deliver water at a maximum rate of 8 kg/hr. Once this was realized, a
higher capacity water pump was ordered, and the water rate maximum load was increased to 26
kg per hour. Throughout the main experiment and all previous feasibility studies, it was observed
that the extrusion parameters which yielded that most desirable product were:
1) High water rates
2) Low feed rates
3) Low screw speed
Trial Total Back Extrusion
Force @ 30 secs. (N)
A 43.8894 ± 3.3023
B 45.4104 ± 4.2070
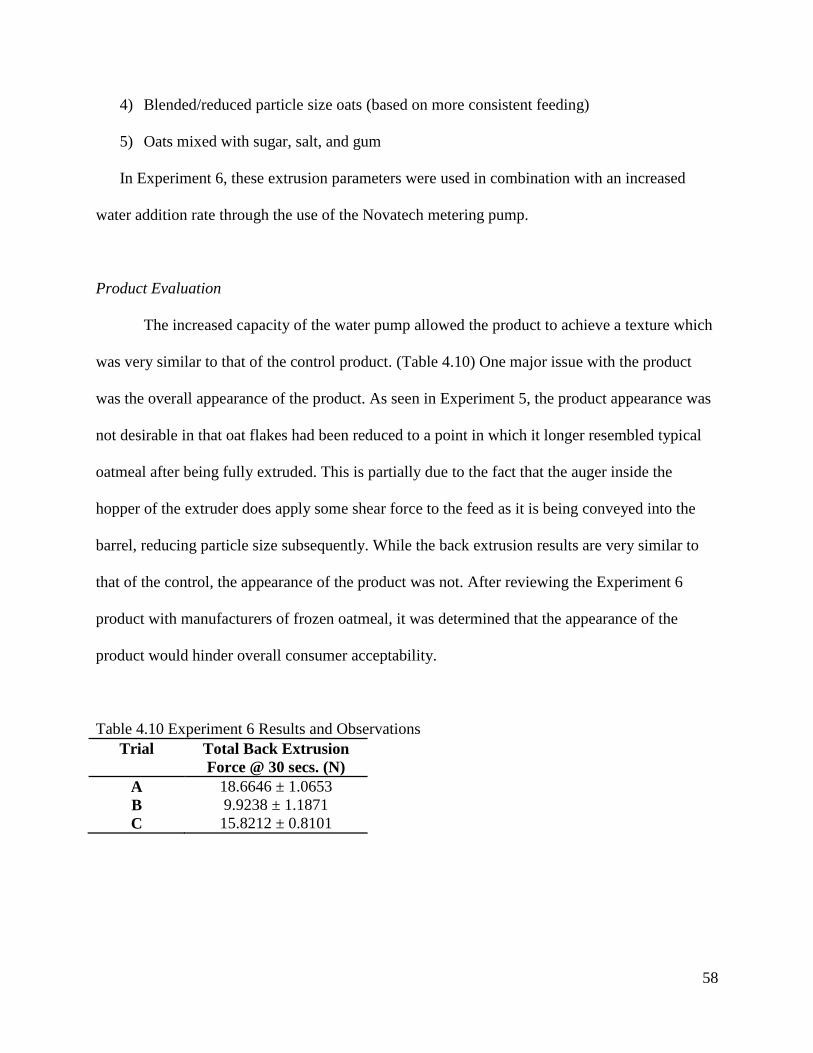
58
4) Blended/reduced particle size oats (based on more consistent feeding)
5) Oats mixed with sugar, salt, and gum
In Experiment 6, these extrusion parameters were used in combination with an increased
water addition rate through the use of the Novatech metering pump.
Product Evaluation
The increased capacity of the water pump allowed the product to achieve a texture which
was very similar to that of the control product. (Table 4.10) One major issue with the product
was the overall appearance of the product. As seen in Experiment 5, the product appearance was
not desirable in that oat flakes had been reduced to a point in which it longer resembled typical
oatmeal after being fully extruded. This is partially due to the fact that the auger inside the
hopper of the extruder does apply some shear force to the feed as it is being conveyed into the
barrel, reducing particle size subsequently. While the back extrusion results are very similar to
that of the control, the appearance of the product was not. After reviewing the Experiment 6
product with manufacturers of frozen oatmeal, it was determined that the appearance of the
product would hinder overall consumer acceptability.
Table 4.10 Experiment 6 Results and Observations
Trial Total Back Extrusion
Force @ 30 secs. (N)
A 18.6646 ± 1.0653
B 9.9238 ± 1.1871
C 15.8212 ± 0.8101
59
Increased Water Injection Capacity
It was observed that increasing the rate of water injection into the extruder to higher levels
did not fully resolve the texture issues in previous experiments. While at certain points during
processing product exiting the extruder appeared desirable, steady state was never fully achieved.
This appeared to be due to the large difference in the amount of feed entering the barrel versus
the amount of water. High water injection rates actually seemed to affect flowability of the feed
and water mixture inside the barrel. Because the water entered the barrel at a much faster rate
than the feed it is likely that the junction of feed and water in zone 2 became congested in certain
periods throughout the run. This would then lead to product exiting the extruder that was high in
water content but extremely low in feed content, and then at other sampling periods there would
be more feed and less water.
Another limitation was the particle size of the oats. In order to make the product similar
to the appearance of typical oatmeal, the particle size of the oats would need to increase. Upon
attempting this in further experiments, it was realized that the large size of the oats in
conjunction with the high water injection rate would at times cause product to clog in the mixing
zones of the extruder. As mentioned previously, certain periods would have very little water
flowing through the barrel, at high amounts of oat mix. When this oat mix reached the kneading
screw profile elements in the mixing zone, it would at times obstruct the flowability of the
product inside the barrel. This hence created a very inconsistent finished product texture with
variable feed and moisture content.
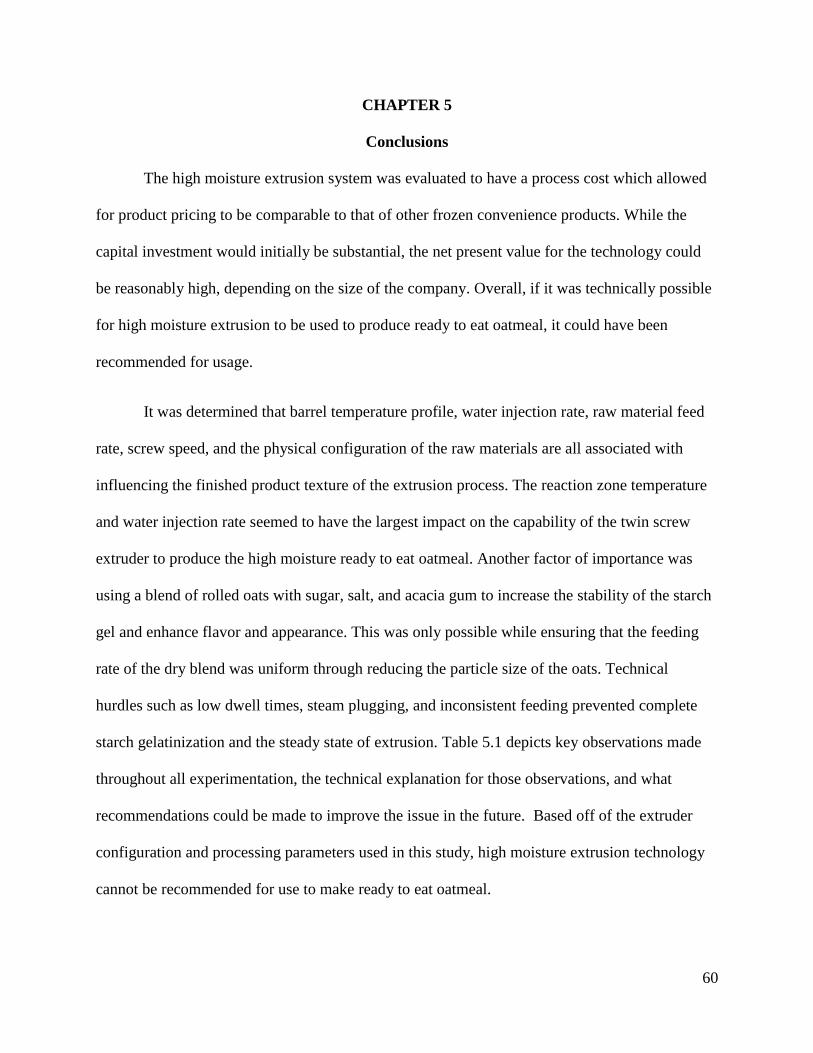
60
CHAPTER 5
Conclusions
The high moisture extrusion system was evaluated to have a process cost which allowed
for product pricing to be comparable to that of other frozen convenience products. While the
capital investment would initially be substantial, the net present value for the technology could
be reasonably high, depending on the size of the company. Overall, if it was technically possible
for high moisture extrusion to be used to produce ready to eat oatmeal, it could have been
recommended for usage.
It was determined that barrel temperature profile, water injection rate, raw material feed
rate, screw speed, and the physical configuration of the raw materials are all associated with
influencing the finished product texture of the extrusion process. The reaction zone temperature
and water injection rate seemed to have the largest impact on the capability of the twin screw
extruder to produce the high moisture ready to eat oatmeal. Another factor of importance was
using a blend of rolled oats with sugar, salt, and acacia gum to increase the stability of the starch
gel and enhance flavor and appearance. This was only possible while ensuring that the feeding
rate of the dry blend was uniform through reducing the particle size of the oats. Technical
hurdles such as low dwell times, steam plugging, and inconsistent feeding prevented complete
starch gelatinization and the steady state of extrusion. Table 5.1 depicts key observations made
throughout all experimentation, the technical explanation for those observations, and what
recommendations could be made to improve the issue in the future. Based off of the extruder
configuration and processing parameters used in this study, high moisture extrusion technology
cannot be recommended for use to make ready to eat oatmeal.
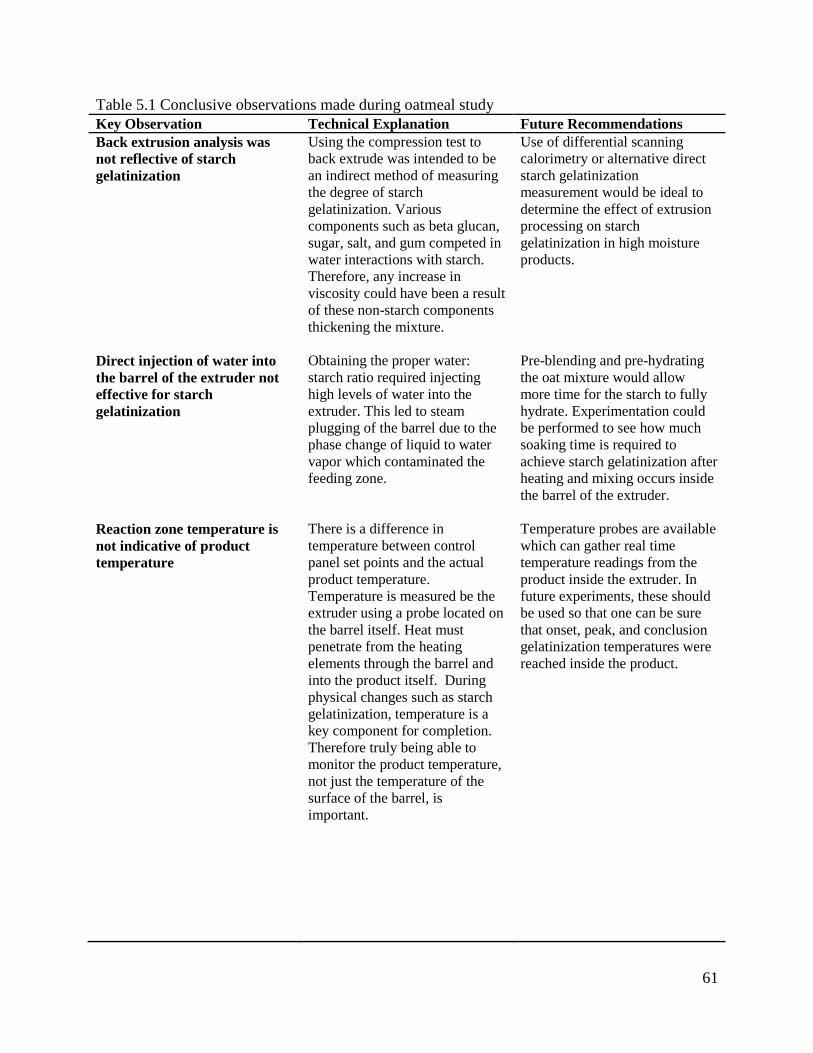
61
Table 5.1 Conclusive observations made during oatmeal study
Key Observation Technical Explanation Future Recommendations
Back extrusion analysis was
not reflective of starch
gelatinization
Using the compression test to
back extrude was intended to be
an indirect method of measuring
the degree of starch
gelatinization. Various
components such as beta glucan,
sugar, salt, and gum competed in
water interactions with starch.
Therefore, any increase in
viscosity could have been a result
of these non-starch components
thickening the mixture.
Use of differential scanning
calorimetry or alternative direct
starch gelatinization
measurement would be ideal to
determine the effect of extrusion
processing on starch
gelatinization in high moisture
products.
Direct injection of water into
the barrel of the extruder not
effective for starch
gelatinization
Obtaining the proper water:
starch ratio required injecting
high levels of water into the
extruder. This led to steam
plugging of the barrel due to the
phase change of liquid to water
vapor which contaminated the
feeding zone.
Pre-blending and pre-hydrating
the oat mixture would allow
more time for the starch to fully
hydrate. Experimentation could
be performed to see how much
soaking time is required to
achieve starch gelatinization after
heating and mixing occurs inside
the barrel of the extruder.
Reaction zone temperature is
not indicative of product
temperature
There is a difference in
temperature between control
panel set points and the actual
product temperature.
Temperature is measured be the
extruder using a probe located on
the barrel itself. Heat must
penetrate from the heating
elements through the barrel and
into the product itself. During
physical changes such as starch
gelatinization, temperature is a
key component for completion.
Therefore truly being able to
monitor the product temperature,
not just the temperature of the
surface of the barrel, is
important.
Temperature probes are available
which can gather real time
temperature readings from the
product inside the extruder. In
future experiments, these should
be used so that one can be sure
that onset, peak, and conclusion
gelatinization temperatures were
reached inside the product.
62
Reducing the particle size of
whole rolled oats caused
finished product to be visually
unacceptable
In order for the feed material to
be distributed evenly into the
feeding zone, particle size must
be similar. Denser, granular
particles such as sugar, salt, etc.
will gravity feed towards the
bottoms of the hopper much
more quickly than lower density
materials such as oats. However,
reducing the particle size of the
oats creates a finished product
that no longer resembles oatmeal.
It has an extremely homogeneous
texture, similar to cream of
wheat.
Utilizing the pre-hydration
method of oatmeal dry blend
preparation and then force
feeding the material into the
feeding zone would allow for a
difference in particle size and a
finished product which has
partial oat particles visible to the
naked eye therefore resonating
with consumers as oatmeal.
Dwell time in the extruder was
too low to achieve starch
gelatinization
In order for the starch to fully
hydrate and gelatinize, more
dwell time is required inside the
barrel. This is not possible with
screw speeds less than 450 RPM
due to water back flowing into
the feeding zone causing system
plugs.
When utilizing the pre-hydration
method of high moisture
extrusion of oatmeal, screw
speeds should be set between 100
and 300 RPM in order to allow
for enough cooking time
Table 5.1 (Cont’d) Conclusive observations made during oatmeal study
63
REFERENCES
Akdogan, H. 1999. High moisture food extrusion. International Journal of Food Science and
Technology 34: 195-207.
Akdogan, H. Tomas, R., and Oliveira, J. 1997. Rheological properties of rice starch at high
moisture contents during twin screw extrusion. Lebensmittel-Wissenchaft und Technologie.
30:488-496.
Alibaba Group. 2015. High quality labeling machine. Available from:
http://www.alibaba.com/product-detail/High-quality-labeling-machine-jar-
price_60256741917.html?s=p. Accessed 2015 June 9.
Brady, M. 2002. Survey of the usage and functionality of salt as an ingredient in UK
manufactured food products. British Food Journal 104(2): 84-125.
Canadian Sugar Institute. 2015. Functions of Sugar. Available from:
http://www.sugar.ca/Nutrition-Information-Service/Consumers/Cooking-with-
Sugar/Functions-of-Sugar.aspx. Accessed 2015 May 14.
Camire, M. E. 2000. Chemical and nutritional changes in food during extrusion. p.167-204. In
Mian Riaz (ed.) Extruders in Food Applications. CRC Press, Lancaster, PA.
Chang, P.R. and F.W. Sosulski. 1985. Functional properties of dry milled fractions from wild
oats (Avena fatua L.). Journal of Food Science 50:1143-1147.
Choudhury, G.S. and B.K. Gogoi. 1995. Extrusion processing of fish muscle: A review. Journal
of Aquatic Food Product Technology 4:37-49.
Clextral Inc. 2015. Personal Communication
Conveyor Engineering. 2015. Personal Communication
Darrington, H. 1987. A long running cereal. Food Manufacture 3: 47-48.
64
Decker, E., Rose, D., and Stewart, D. 2013. Processing of oats and the impact of processing
operations on nutrition and health benefits. British Journal of Nutrition 112: S58-S64.
Frolich, W. and M. Nyman. 1988. Minerals, phytate and dietary fibre in different fractions of oat
grain. Journal of Cereal Science 7:73-82.
Fulcher, R.G., T.P. O’Brien, and S.I. Wong. 1981. Microchemical detection of niacin, aromatic
amine, and phytin reserves in cereal bran. Journal of Cereal Chemistry 58:130-135
Garrison, R., Brewer, P., Noreen, E. 2012. Process Costing. New York, NY. McGraw Hill. p
143-151.
Gray, D.A., R.H. Auerbach, S. Hill, R. Wang, G.M. Campbell, C. Webb, and J.B. South. 2000.
Enrichment of oat antioxidant activity by dry milling and sieving. Journal of Cereal Science
32:89-98.
Guatam, A. 1998. Screw configuration effects during twin screw extrusion of starchy and
proteinaceous materials. University of Alaska, Fairbanks.
Gutkoski, L.C. and A.A. Dash. 1999. Effect of extrusion process variables on physical and
chemical properties of extruded oat products. Journal of Plant Foods for Human Nutrition
54:315-325.
Harper, J.M. 1981. Extrusion of foods. 1st vol. Boca Raton, FL. CRC Press. Volume 1. p 165-
181.
Hayashi, N., Abe, H., Hayakawa, I. and Fujio, Y. 1992. Texturization of dehulled whole soybean
with a twin screw extruder and texture evaluation. In: Hayakawa, A. editor. Food Processing
by Ultra High Pressure Twin-Screw Extrusion. Pennsylvania. Technomic Publishing
Company. p. 133–146.
65
Hutton, T. 2002. Technological functions of salt in the manufacturing of food and drink
products. British Food Journal 104: 126-152.
Janssen, L. 1989. Engineering aspects of food extrusion. In: Mercier, C., Linko, P., Harper, J.,
editors. Extrusion Cooking. St. Paul, MA. American Association of Cereal Chemists, Inc. p
17-38.
Kent, N.L., and E. Evers. 1994. Technology of Cereals. 4th
ed. London, England.
Lookhart, G., L. Albers and Y.Pomeranz. 1986. The effect of commercial processing on some
chemical and physical properties of oat groats. Journal of Cereal Chemistry 63:280-282.
Macarthur, L.A., and B.L. D’Appolonia. 1979. Comparison of oat and wheat carbohydrates.
Journal of Cereal Chemistry 56: 458-461.
Maga, J. 1989. Flavor formation and retention during extrusion. In: Mercier, C., Linko, P.,
Harper, J., editors. Extrusion Cooking. St. Paul, MA. American Association of Cereal
Chemists, Inc. p 387-398.
Maroulis, Z. and Saravacos, G. 2008. Food Plant Economics. Boca Raton, Fl. CRC Press.
Nguyen, V. H., C. Mouquet-Rivier and S. Treche. 2010. Effects of starch, lipid and moisture
contents on extrusion behavior and extrudate characteristics of rice-based blends prepared
with a very-low-cost extruder. Journal of Food Process Engineering 33:519-539.
Noguchi, A. 1989. High moisture protein foods. In: Mercier, C. Linko, P., Harper, J. Extrusion
Cooking. St. Paul, MN. American Association of Cereal Chemists. p. 343–370.
Peterson, D.M., J. Senturia, V.L. Youngs, and L.E. Schrader. 1975. Elemental composition of oat
groats. Journal of Agricultural and Food Chemistry 23: 9-13.
Peterson, D.M., C.L. Emmons, and A. Hibbs. 2001. Phenolic antioxidants and antioxidant
activity in pearling fractions of oat groats. Journal of Cereal Science 33:97-103.
66
Ranken, M. 1997. Miscellaneous food ingredients. In: Ranken, M., Kill, R., and Baker, C.
editors. Food industries manual. London. Chapman & Hall. p 480-498.
Ratnayake, W. and Jackson, D. 2008. Starch Gelatinization. Advances in Food and Nutrition
Research. 55: 221-268.
Riaz, M. 2000. Definitions of extrusion. In: Riaz, M editor. Extruders in food applications.
Lancaster, PA. p 1-2
Robyt, J. 2008. Starch: structure, properties, chemistry, and enzymology. In: Fraser-Reid, B.,
Tatsuta, K., and Theim, J. editors. Glycoscience. Springer Berlin Heidelberg. p 1437-1472.
Shen, Z. and Wang, Z. 1992. A novel extruder for soybean texturization. In: Kokini, J., Ho, T.,
and Karwe, M. editors. Food Extrusion Science and Technology. New York. Marcel Dekker
Inc. p. 725-732.
Simplex Fillers. 2015. Personal Communication
Stable Micro Systems. 2003. Texture Analysis Applications Directory, Materials and Products.
Available from: www.stablemicrosystems.com . Accessed 2015 June 7.
Stansell, D. Sugar and chocolate confectionary. In: Ranken, M., Kill, R., and Baker, C. editors.
Food industries manual. London. Chapman & Hall. p 406-443.
Tester, R and J. Karkalas. 1996. Swelling and gelatinization of oat starches. Journal of Cereal
Chemistry 73:271-277.
United States Department of Agriculture. 2015. National Nutrient Database for Stanard
Reference Release 27. Available from:
http://ndb.nal.usda.gov/ndb/foods/show/1889?fgcd=&manu=&lfacet=&format=&count=&m
ax=35&offset=&sort=&qlookup=rolled+oats. Accessed 2015 May 14.
67
Wang, L.Z. and P.J. White. 1994. Structure and properties of amylose, amylopectin, and
intermediate materials of oat starches. Cereal Chemistry 71: 263-268.
Wang, L., Chessari, C., and Karpiel, E. 2001. Inferential control of product quality attriutes-
application to food cooking extrusion process. Journal of Food Process Control 11: 621-636.
Wareing, M. 1999. Exudate gums. In: Imeson, A, editor. Thickening and gelling agents for food.
2nd
Edition. Gaithersburg, MD. Aspen Publishers. p 86-100.
Wawona Frozen Foods. 2014. Personal communication.
Webster, F.H. and P.J. Wood. 2011. Oats: Chemistry and technology (2nd Ed). St. Paul, MI.
Whole Grains Council. 2013. Types of Oats. Available from:
http://wholegrainscouncil.org/whole-grains-101/types-of-oats. Accessed 2015 May 14.
Wirakartakusumah, M. 1981. Kinetics of starch gelatinization and water absorption in rice. Ph.
D. thesis, Department of Food Science, University of Wisconsin, Madison.
68
APPENDICES
Appendix A
Glossary of Terms
1) M.C. – Moisture Content
2) Feed- The raw material to be extruded
3) Extrudate- Finished product which has been extruded
4) Back Extrusion- The process of forcing material opposite of the direction in which the
plunger is moving via the small gap between the plunger and cell wall
5) RPM – Revolutions per minute
6) Kg/hr – kilograms per hour