Embed Size (px)
Citation preview
High Frequency Trading
in Financial Markets
Zur Erlangung des akademischen Grades einesDoktors der Wirtschaftswissenschaften
(Dr. rer. pol.)
von der Fakultät fürWirtschaftswissenschaften
am Karlsruher Institut für Technologie (KIT)
genehmigte
DISSERTATION
von
Shuo Sarah Zhang, M. Sc. Ind. Eng.
Tag der mündlichen Prüfung: 11.12.2013Referent: Prof. Dr. Christof Weinhardt
Korreferent: Prof. Dr. Marliese Uhrig-Homburg
2013 Karlsruhe


Acknowledgements
I would like to express my deep gratitude to Prof. Dr. Christof Weinhardt for givingme the opportunity to pursue my research interests at the Institute of InformationSystems and Marketing (IISM) and for his support and advice throughout mydissertation. I would further like to thank Prof. Dr. Ryan Riordan for his guidanceand without whom this work would not have been possible.
I would also like to thank Prof. Dr. Marliese Uhrig-Homburg for insightfuldiscussions and helpful comments. My thanks also go to Prof. Dr. Martin Ruckesand Prof. Dr. Kay Mitusch for serving on my thesis committee. I am also verygrateful to Prof. Albert S. Kyle, Prof. Andreas Park, and Prof. Peter Cziraki forcomments on my work and for their support - it made all the difference.
My sincere thanks go to my colleagues at the IISM. I could not have wished forbetter collegues. In particular I would like to thank my colleagues Dr. Marc Adam,Stephan Meyer, Dr. Andreas Storkenmaier, Dr. Florian Teschner, and Dr. MartinWagener for their feedback and guidance. It has been a privilege to be a member ofthis inspiring and enthusiastic team.
I gratefully acknowledge financial support by the IME Graduate School at the Karl-sruhe Institute of Technology (KIT) funded by Deutsche Forschungsgemeinschaft(DFG) and financial support by the Karlsruhe House of Young Scientists (KHYS) forthe research stay at University of Toronto.
Finally, but most importantly, I thank my family and friends. I thank my parentsLanju and Wucheng for their unconditional love and support throughout my life, andDominik for his love, forbearance, and encouragement. I owe them more than I canever put in words.

Contents
List of Figures v
List of Tables vii
List of Abbreviations ix
1 Motivation and Introduction 11.1 Modern Financial Markets . . . . . . . . . . . . . . . . . . . . . . . . . . 2
1.1.1 Technological Innovation in Financial Markets . . . . . . . . . . 31.1.2 The Role of HFT . . . . . . . . . . . . . . . . . . . . . . . . . . . 41.1.3 Applications of Financial Market Engineering . . . . . . . . . . 6
1.2 Research Questions and Structure . . . . . . . . . . . . . . . . . . . . . . 6
2 HFT and the Electronic Evolution of Financial Markets 112.1 The Electronic Evolution of Financial Markets . . . . . . . . . . . . . . 12
2.1.1 Measures of Market Quality . . . . . . . . . . . . . . . . . . . . . 122.1.2 Market Quality Framework . . . . . . . . . . . . . . . . . . . . . 172.1.3 Case Study: IBIS vs. Xetra . . . . . . . . . . . . . . . . . . . . . . 23
2.2 Economic and Regulatory Aspects of HFT . . . . . . . . . . . . . . . . . 302.2.1 HFT Definition and Strategies . . . . . . . . . . . . . . . . . . . . 322.2.2 HFT Literature . . . . . . . . . . . . . . . . . . . . . . . . . . . . 362.2.3 HFT Regulation . . . . . . . . . . . . . . . . . . . . . . . . . . . . 382.2.4 Case Study: HFT and Liquidity . . . . . . . . . . . . . . . . . . . 41
2.3 Summary . . . . . . . . . . . . . . . . . . . . . . . . . . . . . . . . . . . . 46
3 HFT and Information Processing 493.1 Related Literature . . . . . . . . . . . . . . . . . . . . . . . . . . . . . . . 51
3.1.1 HFT and Price Discovery . . . . . . . . . . . . . . . . . . . . . . 513.1.2 Categories of Information Events . . . . . . . . . . . . . . . . . . 52
3.2 Data and Sample Descriptives . . . . . . . . . . . . . . . . . . . . . . . . 533.2.1 Sample Descriptives . . . . . . . . . . . . . . . . . . . . . . . . . 543.2.2 Hard and Soft Information . . . . . . . . . . . . . . . . . . . . . 56
3.3 Results . . . . . . . . . . . . . . . . . . . . . . . . . . . . . . . . . . . . . 573.3.1 Correlation Results . . . . . . . . . . . . . . . . . . . . . . . . . . 573.3.2 Impact of Information Events on Returns and Net Trading . . . 613.3.3 Influence of Information Events on Price Discovery . . . . . . . 80
iii
iv Contents
3.3.4 Influence of Information Events on Trading Profits . . . . . . . 833.4 Summary . . . . . . . . . . . . . . . . . . . . . . . . . . . . . . . . . . . . 88
4 HFT and Human Trading Behavior 914.1 Related Literature and Hypothesis Development . . . . . . . . . . . . . 93
4.1.1 Experimental and Neuro Finance . . . . . . . . . . . . . . . . . . 934.1.2 Market Microstructure and Mechanism Design . . . . . . . . . . 95
4.2 A Market Framework for Human-Computer Interaction . . . . . . . . 964.2.1 Individual Behavior and Emotional State . . . . . . . . . . . . . 984.2.2 Application to IS Constructs . . . . . . . . . . . . . . . . . . . . 994.2.3 Market Outcome and Market Design . . . . . . . . . . . . . . . 100
4.3 The Experiment . . . . . . . . . . . . . . . . . . . . . . . . . . . . . . . . 1034.3.1 Experimental Design . . . . . . . . . . . . . . . . . . . . . . . . . 1034.3.2 Participants and Incentives . . . . . . . . . . . . . . . . . . . . . 1044.3.3 Treatment Structure and Procedure . . . . . . . . . . . . . . . . 1054.3.4 Implementation . . . . . . . . . . . . . . . . . . . . . . . . . . . . 108
4.4 Statistical Analysis . . . . . . . . . . . . . . . . . . . . . . . . . . . . . . 1124.4.1 Individual Trader Analysis . . . . . . . . . . . . . . . . . . . . . 1124.4.2 Market Level Analysis . . . . . . . . . . . . . . . . . . . . . . . . 113
4.5 Results . . . . . . . . . . . . . . . . . . . . . . . . . . . . . . . . . . . . . 1144.5.1 Effects on Emotional Arousal . . . . . . . . . . . . . . . . . . . . 1144.5.2 Trading Behavior . . . . . . . . . . . . . . . . . . . . . . . . . . . 1184.5.3 Market Quality . . . . . . . . . . . . . . . . . . . . . . . . . . . . 125
4.6 Summary . . . . . . . . . . . . . . . . . . . . . . . . . . . . . . . . . . . . 140
5 Conclusion and Outlook 1435.1 Contributions . . . . . . . . . . . . . . . . . . . . . . . . . . . . . . . . . 1435.2 Implications . . . . . . . . . . . . . . . . . . . . . . . . . . . . . . . . . . 1475.3 Future Research . . . . . . . . . . . . . . . . . . . . . . . . . . . . . . . . 1485.4 Summary . . . . . . . . . . . . . . . . . . . . . . . . . . . . . . . . . . . . 151
A Sample Stocks and Robustness Checks (Chapter 3) 153A.1 List of Sample Stocks . . . . . . . . . . . . . . . . . . . . . . . . . . . . . 153A.2 Reverse Ordering of HFT and NHFT net trading in VARX Model . . . 155A.3 Trading Profits - Robustness over Time . . . . . . . . . . . . . . . . . . . 157
B Experimental Design and Instructions (Chapter 4) 163B.1 Participant Instructions . . . . . . . . . . . . . . . . . . . . . . . . . . . . 163B.2 Emotion Regulation Questionnaire . . . . . . . . . . . . . . . . . . . . . 168
References 169
List of Figures
2.1 Framework for Market Quality . . . . . . . . . . . . . . . . . . . . . . . 18
3.1 Exemplary News Item . . . . . . . . . . . . . . . . . . . . . . . . . . . . 583.2 Impact of Hard Information Shocks - 1 Second Analysis . . . . . . . . 653.3 Initiated Net Trading after Information Events . . . . . . . . . . . . . . 683.4 Passive Net Trading after Information Events . . . . . . . . . . . . . . . 693.5 Calculation of Fictitious Profits . . . . . . . . . . . . . . . . . . . . . . . 84
4.1 Market Framework for Human-Computer Interaction . . . . . . . . . . 974.2 Trading Graphical User Interface . . . . . . . . . . . . . . . . . . . . . . 1094.3 Pseudo-Code for ZIP agents . . . . . . . . . . . . . . . . . . . . . . . . . 1114.4 Direct and Indirect Effects on Trading Behavior: Model 1a and Model 1b 1134.5 Direct and Indirect Effects on Market Quality: Model 2 . . . . . . . . . 1144.6 Heart Rate for different Treatments . . . . . . . . . . . . . . . . . . . . . 1164.7 Alpha for different Treatments . . . . . . . . . . . . . . . . . . . . . . . 1274.8 Alpha for different Treatments and Market Settings . . . . . . . . . . . 1284.9 Profit Dispersion for different Treatments . . . . . . . . . . . . . . . . . 1314.10 Market Quality for different Market Settings . . . . . . . . . . . . . . . 134
v

List of Tables
2.1 Sample Constituents . . . . . . . . . . . . . . . . . . . . . . . . . . . . . 252.2 Descriptive Statistics . . . . . . . . . . . . . . . . . . . . . . . . . . . . . 282.3 Liquidity and Information Measures over time . . . . . . . . . . . . . . 312.4 Final Sample Constituents and their Market Capitalization . . . . . . . 422.5 Trading and Quoting Activity of HFTs . . . . . . . . . . . . . . . . . . . 452.6 HFT Liquidity Provision and Demand . . . . . . . . . . . . . . . . . . . 47
3.1 Summary Descriptives . . . . . . . . . . . . . . . . . . . . . . . . . . . . 553.2 Correlation of Information Shocks, Net Trading and Trading Volume . 593.3 Impact of Information Shocks on Stock Returns . . . . . . . . . . . . . . 643.4 Impact of Information Shocks on Net Trading . . . . . . . . . . . . . . . 673.5 Impact of Information Shocks on Net Trading - Robustness over time . 723.6 Impact of Positive and Negative Futures Shocks on Net Trading . . . . 773.7 Impact of Positive and Negative Volatility Shocks on Net Trading . . . 783.8 Impact of Positive and Negative News Shocks on Net Trading . . . . . 793.9 Influence of Trading after Information Shocks on Price Discovery . . . 823.10 HFT Profits after Information Shocks . . . . . . . . . . . . . . . . . . . . 85
4.1 Experiment Summary Statistics . . . . . . . . . . . . . . . . . . . . . . . 1054.2 Experimental Design . . . . . . . . . . . . . . . . . . . . . . . . . . . . . 1074.3 Direct and Indirect Effects on Price Aggressiveness . . . . . . . . . . . . 1174.4 Moderated Effects on Price Aggressiveness . . . . . . . . . . . . . . . . 1194.5 Direct and Indirect Effects on Trade Aggressiveness . . . . . . . . . . . 1224.6 Moderated Effects on Trade Aggressiveness . . . . . . . . . . . . . . . . 1244.7 Direct and Indirect Effects on Market Efficiency . . . . . . . . . . . . . . 1264.8 Direct and Indirect Effects on Profit Dispersion . . . . . . . . . . . . . . 1304.9 Direct and Indirect Effects on Human Profit Dispersion . . . . . . . . . 1324.10 Direct and Indirect Effects on Spreads . . . . . . . . . . . . . . . . . . . 1354.11 Direct and Indirect Effects on Volume . . . . . . . . . . . . . . . . . . . 1374.12 Direct and Indirect Effects on Depth . . . . . . . . . . . . . . . . . . . . 138
A.1 Sample Descriptives . . . . . . . . . . . . . . . . . . . . . . . . . . . . . 154A.2 Impact of Information Shocks on Net Trading - Reverse Ordering . . . 155A.3 HFT Profits after Information Shocks - Robustness over time . . . . . . 157
vii


List of AbbreviationsAFME Association for Financial Markets in EuropeAT Algorithmic TradingATs Algorithmic TradersATS Alternative Trading SystemCBOE Chicago Board Options ExchangeCEP Complex Event ProcessingCFTC U.S. Commodity Futures Trading CommissionCME Chicago Mercantile ExchangeDAX Deutscher Aktien IndexDMA Direct Market AccessDWZ Deutsche Wertpapier-DatezentraleEBS Electronic Broking ServicesECG ElectrocardiographyECN Electronic Communication NetworksEEG ElectroencephalographyEMG Facial ElectromyographyER Emotion RegulationETF Exchange-Traded FundEurex European ExchangeFCA Financial Conduct AuthorityfMRI functional Magnetic Resonance ImagingHCI Human-Computer InteractionHFT High Frequency TradingHFTs High Frequency TradersHR Heart RateIBIS I Inter-Banken-Informations-SystemIBIS II Integriertes Boersenhandels- und InformationssystemICAP IntercapitalIS Implementation ShortfallLSE London Stock ExchangeMAD Market Abuse DirectiveMiFID Markets in Financial Instruments DirectiveMTF Multilateral Trading FacilitiesNasdaq National Association of Securities Dealers and Automated Quotations
ix
x List of Abbreviations
non-HFT non-High Frequency Tradingnon-HFTs non-High Frequency TradersNYSE New York Stock ExchangeRegNMQ Regulation National Market SystemRNSE Reuters NewsScope Sentiment EngineSA Sponsored AccessSCR Skin Conductance ResponseSEC Securities and Exchange CommissionSIRCA Securities Industry Research Centre of Asia-PacificS&P 500 Standard & Poor’s 500TWAP Time-Weighted Average PriceVaR Value-at-RiskVAR Vector AutoregressionVMA Vector Moving AverageVWAP Volume-Weighted Average PriceWFE World Federation of ExchangesXetra Exchange Electronic TradingZI Zero IntelligenceZIP Zero Intelligence Plus
Chapter 1
Motivation and Introduction
Technological innovation has always been a driving factor in the development of fi-
nancial markets. Starting with the computerization of tasks on trading floors, through
the introduction of completely electronic markets, to Algorithmic Trading (AT) and
High Frequency Trading (HFT), trading has become almost completely automated.
Prerequisites for this electronic evolution of financial markets are the technological
advances made in the area of information and communication technology. Over the
last decade, this has also made the increasing use of AT and HFT systems1 possible,
which has had immense technological and economic impact on investors and mar-
ketplaces. In 2012, HFT made up more than 50% of U.S. equity trading volume and
more than 30% of equity trading volume in Europe (cf. Sussman, 2012). Despite its
importance, the role of HFT in financial markets is still not well understood.
An incident on May 6, 2010, the so-called “Flash Crash”, has drawn the attention of
the regulatory authorities and the public to HFT. The “Flash Crash” was a crash in the
U.S. stock market which resulted in a rapid drop in major U.S. indices and a similarly
rapid recovery within half an hour. With this incident, the current market structure
has revealed serious vulnerabilities that may be exacerbated by HFT. Kirilenko et al.
(2011) find that HFT did not cause the “Flash Crash”, but that it exacerbated market
1AT is defined as “the use of computer algorithms to automatically make trading decisions, submitorders, and manage those orders after submission” (Hendershott et al., 2011). HFT is considered asa subcategory of AT and includes more sophisticated and complex strategies that make use of thefast connection and processing speed of computers. See Chapter 2 for a more detailed discussionof HFT definitions.
1
2 Motivation and Introduction
volatility during the crash. Thus, it is crucial to gain knowledge of HFT behavior
during normal and extreme market conditions in order to make regulatory decisions
in the best interest of financial markets in general and of different groups of traders.
The World Federation of Exchanges (WFE) points out that “[a]lthough there have
always been occasional trading errors and episodic volatility spikes in markets, the
speed, automation and interconnectedness of today’s markets create a different scale
of risk” (World Federation of Exchanges, 2013).
Since the trading process is central to efficient risk sharing and price efficiency,
it is important for regulators, market operators, and investors to understand the
role of HFT in this interconnected high frequency world and the implications for
financial market design and trading behavior. In this context, there are also different
perspectives of the view on HFT. Market quality and how HFT contributes to the
different dimensions of market quality is a major concern for all interest groups.
While higher market efficiency and liquidity is desirable for markets in general, the
protection of investors is yet another goal of regulatory authorities, such as the U.S.
Securities and Exchange Commission (SEC). Therefore, another issue next to market
quality is whether HFT puts individual investors at a disadvantage and leads to
differences in their trading behavior and strategies.
1.1 Modern Financial Markets
In today’s modern financial markets, market operators have to cope with a multiple
of the trading volume and message traffic than around a decade ago. Angel et al.
(2011) show that daily U.S. equity share volume increased more than threefold, “from
about 3 billion shares per day in 2003 to nearly 10 billion shares per day in 2009”
(p. 5, Angel et al., 2011), that quote frequency dramatically increased from below
50 quotes per minute to up to more than 500 (cf. Figure 16, Angel et al., 2011), and
that execution speed fell significantly as well. In light of this development, trading
venues increased IT investments and adopted more innovative technologies in order
to handle increased activity and attract order flow and thus profit. Due to their high

Motivation and Introduction 3
trading volume, HFT has become an especially important source of profit for trading
venues.
1.1.1 Technological Innovation in Financial Markets
Infrastructure investments by market operators mainly concern latency and risk man-
agement aspects as well as platform stability and reliability. In terms of latency reduc-
tions, co-location services offered by marketplaces have become common, i.e. “enable
exchange customers to place their servers in close proximity to the exchange’s match-
ing engine” SEC (2010) in order to further reduce latency. In 2009, NYSE Euronext
built a 400,000 sq. foot data center in New Jersey, while CME opened a 428,000 sq.
foot data center in 2012 in order to serve the colocation demand of clients (Wall Street
and Technology, 2011). However, the SEC raised the questions (see Section IV.B.2. in
their call for comments on the US equity market structure in 2010 SEC, 2010) about
the fairness of co-location to long-term investors, whether it improved market quality,
and whether the use of co-location should involve trading obligations to counterbal-
ance the speed advantage.
Immense IT investments have further been made in order to reduce the latency
between different marketplaces, e.g. using fiber-optic cables. The cost of a fiber con-
nection between Chicago and New York is estimated to around $200,000 per mile, re-
sulting in round trip latencies below 9 milliseconds (Forbes, 2010). The construction
of a high-speed cable connection between London and New York totals to around
$300 million, reducing latency from 64 milliseconds per round-trip to 59.6 millisec-
onds and making it the world’s fastest transatlantic cable in 2013 (Bloomberg Busi-
ness Week, 2012). These services are specifically catered to HFT, considering that the
reaction time of the human brain is around 110-120 milliseconds and the blink of an
eye takes 200 milliseconds (Timms, 2012).
New trends in the area of latency reduction are microwave and laser technologies.
For the route from London to Frankfurt, Perseus, a network operator specialized in
building ultra-low latency networks, says its microwave system has decreased the
roundtrip time from 8.35 milliseconds for its fiber-optic network to below 4.6 mil-
4 Motivation and Introduction
liseconds (Reuters, 2013b). Another leap in this sector will be provided by competitor
ANOVA Technologies with its new hybrid system of lasers and millimeter waves
wireless dishes. CEO Michael Persico states that this technology will be “on par
with fiber-optic cable in terms of availability - and continue to surpass it in terms
of speed, [... increasing] the current availability of wireless networks from 95% to
99.99%” (p.46, Hammer, 2013). These technological advances will bring transmis-
sion speed even closer to the speed of light.
With latency reduction reaching this natural threshold, HFT firms are developing
more complex strategies in order to gain another competitive edge towards their com-
petitors. One of the current trends include trading on machine-readable news, which
have made computerized trading on complex information easier (New York Times,
2010). Recent investments have been made by NASDAQ and Deutsche Börse to in-
tegrate machine-readable economic news into their line of services offered for trad-
ing firms and specifically automated traders (Wall Street Journal, 2011b). Current
research in computer science, e.g. in the area of sentiment analysis, is further evolv-
ing to use social media, such as Twitter messages, to predict box-office revenues for
movies (Asur, 2010) and market returns (Bollen et al., 2011). When asked about the
next “quantum leap” in technology, executives of Bottom Line Metrics, a technology
solutions provider, suggested Complex Event Processing (CEP) which will further
help to manage risk in real-time in this high-speed environment (p.150, Hammer,
2013). Used for alpha-seeking strategies as well as for the execution of trading deci-
sions, it serves as an additional tool for AT and HFT systems in order to make exact
decisions based on the analysis of large volumes of fast-moving data (c.f. Waters Tech-
nology, 2013).
1.1.2 The Role of HFT
Due to the sophistication and the advances made in computing power and network
systems, technological innovations, such as HFT, have gained increasing economic
importance. In this context, concerns have been raised towards the impact of HFT
on market quality and possible systemic risks that it poses to financial markets. The
Motivation and Introduction 5
public opinion of practitioners and regulatory authorities on this topic is dominated
by scepticism and aversion. In their call for comments in 2010 (SEC, 2010), the SEC
addresses different issues regarding the U.S. market structure and specifically raises
concerns towards HFT, such as its impact on market quality and certain types of ma-
nipulative HFT strategies.
Recent market disturbances have further increased this scepticism, such as the
computer glitch on August 1, 2012 by Knight Capital, a large HFT market making
company. It was due to not properly tested software and resulted in a loss of $440
million for Knight. In 2013, Knight Capital was acquired by Getco, a leading HFT
market-making firm (Bloomberg Businessweek, 2013). In 2013, U.S. Commodity Fu-
tures Trading Commission (CFTC), the UK Financial Conduct Authority (FCA), and
market operator CME fined an individual, Michael Coscia, over $4 million for con-
ducting HFT market manipulation in commodities markets. This was the first CFTC
enforcement action under Dodd-Frank Act that targets discruptive trading practices
(Bloomberg, 2013).
While these incidents have put HFT under even higher regulatory scrutiny, most
empirical research so far show that HFT activity improves overall liquidity and effi-
ciency (e.g. Hendershott et al., 2011; Jovanovic and Menkveld, 2012; Brogaard et al.,
2013), for example by implementing market making or index arbitrage strategies. As
stated by Mary Schapiro, the chairman of the SEC, “[r]eliance on computers is a fact
of life not only in markets everywhere, but in virtually every facet of business. [...]
It’ll take a few more Knight Capitals to really create the pressure needed to blow
against the wind” (Forbes, 2012). However, specific market manipulation strategies
still concern regulators and the role of HFT during extreme market events is also an
open question.
In summary, there is no consistently positive or negative image for HFT overall,
but there are up and downsides as to every technological innovation. Put by U.S.
economist Robert Shiller, “[millisecond trading is] neither really amazingly good nor
amazingly bad. It’s just an implication of information technology” (Forbes, 2012).
6 Motivation and Introduction
1.1.3 Applications of Financial Market Engineering
Challenges of technological nature, specifically posed by HFT, in modern electronic
markets, call for a conscious and revised thinking about financial market structure
design, in the context of newly introduced markets, but also of the regulation of ex-
isting markets. This area of research falls into the research framework of Financial
Market Engineering. Financial Market Engineering is defined as
“[...] an engineering approach to market structure that is needed to help
market operators exploit the opportunities for IT-enabled markets while
minimizing the risk of failure” (Weinhardt et al., 2006).
Especially in the light of current examples of market failure, a structured way of re-
thinking some market design choices seems necessary, for market operators as well
as for regulators, in order to prevent further market failures from happening. For ex-
ample in the aftermath of the Flash Crash and with regard to the strong interlinkage
of financial markets, the introduction of multi-market volatility breakers have been
discussed which halts trading when volatility exceeds a certain threshold. This mar-
ket design element was implemented in order to prevent that crashes happen and
transmit to other markets.
In this thesis, two extensions of the financial market engineering framework are
proposed. The Market Quality Framework in Chapter 2 provides a structured approach
to analyze market quality in modern financial electronic markets in the context of a
dynamic competitive, regulatory, and technological environment. The Market Frame-
work for Human-Computer Interaction in Chapter 4 extends the market engineering
framework by behavioral and psychophysiological aspects of competitive interaction
between human traders and computer agents.
1.2 Research Questions and Structure
The goal of this thesis is to shed light into the influence of a specific technological
innovation, namely HFT, in the context of the electronic evolution of financial mar-
Motivation and Introduction 7
kets. The main part of the thesis is structured into three chapters. Chapter 2 presents
aspects of the electronic evolution of financial markets and the role of HFT in this
development. Chapter 3 focuses on the role of HFT in the processing of hard and soft
information. Chapter 4 researches into effects of fast and slow computer agents on
human trading behavior.
Section 2.1 in Chapter 2 provides a conceptual framework to analyze market qual-
ity and a discussion of the electronic evolution in financial markets. Section 2.1 is
based on the joint paper “The Quality of Electronic Markets” with Martin Wagener,
Andreas Storkenmaier, and Christof Weinhardt, which has been presented at the
“Hawaii International Conference on System Sciences 2011” (Zhang et al., 2011). The
trading landscape has tremendously changed over the last two decades, with respect
to market quality, but also to external factors, such as technology and regulation, and
internal market structure, such as business and market microstructure. Since the term
market quality is often referred to in an ambiguous way, a framework is proposed that
puts several prominent measures of market quality into context with external factors
and the internal market structure. The framework is applied to a comparative case
study, “IBIS vs. Xetra.” The case study demonstrates the evolution of financial mar-
kets by the example of the German financial market. Specifically, it compares market
quality measures as well as the regulatory and technological environment of the two
dominant electronic markets in Germany, IBIS II and Xetra. Section 2.1 thus focuses
on Research Question 1:
Research Question 1: How did market quality and external and internal factors
of the trading landscape change over the last two decades?
Based on the proposed framework for market quality and the discussion of regu-
latory and technological changes, Section 2.2 discusses the role of HFT in financial
markets along the factors in the framework. Section 2.2 is based on the joint paper
“Technology and Market Quality: The Case of High Frequency Trading” with Ryan
Riordan, which has been presented at the “European Conference of Information Sys-
tems 2011” (Zhang and Riordan, 2011). The case study on “HFT and Liquidity” shows
8 Motivation and Introduction
the improvements of market quality in the context of HFT activity and contribution
to liquidity. It specifically focuses on Research Question 2:
Research Question 2: Which role does HFT play in modern financial markets
and for market quality?
Based on the foundations on the electronic evolution of financial markets in
Chapter 2, Chapter 3 specifically analyzes the roles that HFT and non-HFT play
in price discovery. Chapter 3 is based on the working paper “Need for Speed:
An Empirical Analysis of Hard and Soft Information in a High Frequency World”
(Zhang, 2013). Common information processing strategies applied by High Fre-
quency Traders (HFTs) are arbitrage and news trading strategies. Statistical arbi-
trage realizes profits from mispricings between different assets. Index arbitrage, be-
ing a subset of statistical arbitrage, focuses on mispricings between an index (such
as the S&P 500 index) and its components. In the context of qualitative textual in-
formation, advances have been made to quantify textual information in order to in-
corporate them into trading strategies. In Chapter 3, I specifically analyze the use
of “hard” futures price information for index arbitrage strategies and the use of
“soft” textual news information for news trading strategies by HFTs and non-HFTs
and implications for price discovery and trading profits. Chapter 3 thus focuses on
Research Questions 3a-3c:
Research Question 3a: What is the market impact of hard and soft information
events?
Research Question 3b: How do HFT and NHFT process hard and soft infor-
mation shocks?
Research Question 3c: What is the value of speed in information processing?
While HFT plays an important role for market liquidity and price discovery, regu-
lators are also concerned about the influences on individual human investors. These
Motivation and Introduction 9
are prone to behavioral biases and disadvantaged with respect to speed and process-
ing capabilities when competing with computerized agents. Chapter 4 presents the
design and results of an economic laboratory experiment which sheds light into the
direct effects of the presence of fast and slow computer agents on human arousal and
trading behavior and how this translates into differences in market efficiency. Chap-
ter 4 is based on a paper which has been presented as a joint research-in-progress pa-
per “Humans versus Agents: Competition in Financial Markets of the 21st century”
with Marc Adam and Christof Weinhardt, which has been presented at the “Interna-
tional Conference on Information Systems 2012” (Zhang et al., 2012). These objectives
are reflected in Research Questions 4a-4b:
Research Question 4a: Are humans more or less emotionally aroused when
trading against computer agents than against other humans?
Research Question 4b: Do differences in emotional arousal affect trading be-
havior?
Research Question 4c: Do differences in human trading behavior in turn trans-
late into differences in market quality?
Finally, Chapter 5 summarizes the findings of this thesis and discusses implications
for regulators and policy makers, market operators, and investors. Furthermore, it
outlines the interface with other areas in finance and information systems research
and provides a guideline for future research.

Chapter 2
HFT and the Electronic Evolution of
Financial Markets
This chapter discusses technological innovation in the context of the electronic evolu-
tion of financial markets over the last decades, with a focus on HFT, and its impact on
market quality. Technological innovation had a profound impact on financial markets
and serves as support of the trading process and trading decisions. As put by Frame
and White (2004), “the basic underlying “physical” technologies of finance are those
of telecommunications and data processing, which permit the gathering of informa-
tion, its transmission, and its analysis. [B]etter (more advanced, faster, lower-cost)
physical technologies have permitted more innovations (e.g., credit and behavioral
scoring) that allow lenders better to overcome those asymmetric information prob-
lems. [. . . ] Better physical technologies may also permit organizational innovations
(e.g., electronic securities exchanges) that would not be possible with less advanced
technologies.” Since the postulate of Frame and White (2004), an increasing amount
of research has been conducted in the field of financial innovation.
Section 2.1 provides an overview of this literature with a focus on technological
innovation. It further discusses existing measures of market quality and relates them
to a methodological framework of market quality (cf. Zhang et al., 2011). The changes
in market quality over time are further demonstrated in a comparative case study
of the two prevailing electronic systems in Germany of their time, IBIS II and Xetra.
Section 2.2 analyzes and discusses the role of HFT as a technological innovation in this
11
12 HFT and the Electronic Evolution of Financial Markets
dynamic environment and its contribution to market quality. Section 2.3 summarizes
findings in this chapter.
2.1 The Electronic Evolution of Financial Markets
Innovations in information and communication technology have profoundly
changed the design and operation of financial markets over the last decades, mak-
ing trading without the use of IT systems impossible. While the introduction of elec-
tronic trading can be considered a revolution in securities trading, a lot of change that
happened since then has been gradual and incremental. In this context, Jürgen Spill-
mann, the deputy CEO and head of IT and operations for Eurex Exchange and Eurex
Clearing, states: “You cannot have revolutionary changes every year and expect the
market to keep up. Our goal is a continuum” (Hammer, 2013).
While market quality has simultaneously improved (Chordia et al., 2011; Angel
et al., 2011), much of its improvement is attributed to technological innovations, such
as AT (Hendershott et al., 2011), automation, and IT system updates (e.g. Jain, 2005;
Hendershott and Moulton, 2011; Riordan and Storkenmaier, 2012). Factors other than
technological innovation, such as the rapidly changing regulatory environment and
the adjusting internal market structures, also have to be taken into account in the
discussion of improving market quality.
2.1.1 Measures of Market Quality
Academics and practitioners refer to the term market quality in a very ambiguous
way, often in terms of liquidity measures, specifically spreads and trading intensity,
or information and efficiency measures, for instance price impacts and price rever-
sals. Since market quality can involve different aspects, a framework is proposed that
highlights common measures in finance literature, namely market activity, liquidity,
and price efficiency, and puts these measures of market quality into context with ex-
ternal factors and internal market structure.
HFT and the Electronic Evolution of Financial Markets 13
Activity, Volume, and Trade Sizes
Activity can be measured using measures like the traded dollar volume (Turnover),
the number of trades (Transactions), or the average trade size (Trade Size) (e.g. Chor-
dia et al., 2011; Barclay et al., 2003; Bessembinder, 1999), usually on a daily basis per
instrument. These measures are closely related. An increase in transactions does not
unconditionally imply an increase in turnover, since trade sizes also have to be taken
into account. Chordia et al. (2011) show that turnover and number of transactions
per day have been increasing from 1993 to 2008 at an accelerating rate, while aver-
age trade size has simultaneously declined from up to $ 90,000 in the mid 1990’s to
around $ 7,000 in 2008. They further find that this trend has been influenced by de-
creases in trading costs and that institutional trading has been a key contributor for
this development.
While all three measures can be classified as trading intensity, quote updates can
be considered as a measure for the mere market activity of traders. Especially in
the context of increasing HFT activity, this has become an important issue for trad-
ing venues. Message traffic in terms of order submissions and cancellations have
increased disproportionately to the increase in transactions. This poses an excessive
overload of technological processing capacity which requires higher investments of
trading venues into their IT systems. Without any market quality improvements due
to these investments, this poses a negative externality to marketplaces. Gai et al.
(2012) analyze the installation of a new matching machine at NASDAQ in May 2010.
The installation led to the entering of a nanosecond regime in trading and to increases
in cancellation to execution ratio without any market quality improvement. They ar-
gue that HFTs submit and cancel orders excessively in order to generate congestion
and slow down other traders which falls into the group of manipulative strategies.
Liquidity
Liquidity indicates “the ability to trade large size quickly, at low cost, when you
want to trade” (cf. p.394, Harris, 2003). It also affects external factors, i.e. reg-
ulation as well as competition: “Everyone likes liquidity. Traders like liquidity
14 HFT and the Electronic Evolution of Financial Markets
because it allows them to implement their trading strategies cheaply. Exchanges
like liquidity because it attracts traders to their markets. Regulators like liquidity
because liquid markets are often less volatile than illiquid ones” (cf. p.394, Harris,
2003). Liquidity as a central measure for market quality is therefore one of the
main criteria for the attractiveness of a trading venue. Liquidity typically involves
several dimensions, which Jones (2013) categorizes into dimensions of price, size,
and time. He further points out that most liquidity measures, such as spreads
and price impact, coincide with measures of execution costs. In that context, there
is a difference between explicit and implicit execution costs. Explicit execution
costs include broker commissions, exchange fees, and taxes (e.g. transaction
taxes). Implicit execution costs are more difficult to measure and include e.g. bid-ask
spread, depth, market impact, and timing risk among others (p. 284, Aldridge, 2010).
The Quoted Spread is an ex-ante measure of liquidity which can be calculated
directly from order book data. However, it only measures the transaction costs of
small trades at the best (visible) price levels of the order book, thus only representing
the transaction costs of small trades. The quoted spread can also be calculated as
trade-time quoted spread (Quoted Spread Trade), i.e. the prevailing quoted spread at
the time when a trade occurred. Let Aski,t denote the ask price for a stock i at time
t, Bidi,t the respective bid price, and Midi,t the midpoint. The quoted spread is then
calculated as follows:
QSpreadi,t = (Aski,t − Bidi,t)/(2 ∗Midi,t)× 10,000 (2.1)
The Effective Spread is an ex-post measure which can be obtained from actual
trade and quote data. It represents the actual transaction costs paid when an incom-
ing market order is executed against a limit order. With most data sets, the trade
direction of the order has to be inferred from a heuristic (e.g. Lee and Ready, 1991).
Let Pricei,t denote the execution price and Di,t the trade direction, with -1 for a market
HFT and the Electronic Evolution of Financial Markets 15
sell and +1 for a market buy order, then the effective spread is calculated as follows:
ESpreadi,t = Di,t ∗ ((Pricei,t −Midi,t)/Midi,t)× 10,000 (2.2)
The effective spread can be decomposed into the Realized Spread, i.e. liquidity
suppliers’ revenue, and the Price Impact after time x (the latter is discussed in the
next section on price efficiency measures). Time intervals x of 5 and 15 minutes are
most common. Realized Spread equals losses of the market marker to better informed
traders and is defined as follows:
RSpreadi,t = Di,t ∗ ((Pricei,t −Midi,t+x)/Midi,t)× 10,000 (2.3)
As Jones (2013) points out, institutions usually “work” large orders over time, i.e.
they split large orders into smaller ones that they execute over time in order to re-
duce price impact, but thereby bear execution risks. To measure the performance of
executing these strategies with respect to trading costs and market impact, they use
e.g. benchmark strategies, such as the value-weighted average price (VWAP), time-
weighted average price (TWAP), Implementation Shortfall (IS).
The VWAP is a standard benchmark which is a purely cost-minimizing algorithm
and is defined as VWAPi = ∑t vit pit/ ∑t vit, t ∈ T where vit is the traded volume of
security i at time t, and pit is the market price of security i at time t on day T.
The TWAP is another measure for the ability to time the market and is defined as
the average price for equally spaced time intervals, i.e. TWAPi = (1/T)∑t pit, t ∈ T
where pit is the market price of security i at time t on day T.
The IS “measures the efficiency of executing investments decisions” and is com-
puted as the “difference between the realized trades and the trades recorded in paper
trading”, the latter meaning a record of all trades as if they were “executed at desir-
able price at optimal times”, following Perold (1988).
One example for a more dynamic participation-oriented strategy which is also com-
monly applied by practitioners is one based on average daily volume (ADV) which
aims at executing a certain percentage of daily market volume.
16 HFT and the Electronic Evolution of Financial Markets
While spread measures account for the width of liquidity, Depth is another dimen-
sion of liquidity. It measures the quoted volume of limit orders in the order book at a
given price (cf. Barclay et al., 2003). Let VolBidi,t and VolAski,t denote the volume at
the best bid and ask, respectively. Depth at the best bid and ask can then be measured
as:
Depthi,t = (VolBidi,t + VolAski,t)/2 (2.4)
While liquidity in terms of transaction costs has improved, depth decreased (Chor-
dia et al., 2011) which can be accounted to decreases in tick size. This decrease likely
contributed to the further decrease in trade size.
Price Discovery
The Price Impact measure makes use of continuous price discovery in financial mar-
kets and measure the information content of trades and quotes by the price develop-
ment after their submission. The simple measure Price Impact can interpreted as the
short-term profit of a trade and is defined as:
PImpacti,t = Di,t ∗ ((Midi,t+x −Midi,t)/Midi,t)× 10,000 (2.5)
However, Price Impact (as well as the corresponding Realized Spread) only considers
one specific price 5 and 15 minutes after a trade. This time interval might be too long
for very actively traded stocks, for which a shorter time interval can be assumed to
impound new information in the prices, while 5 or 15 minutes might be too short for
stocks that are only traded several times a day.
Easley et al. (2012) suggest that “in a high frequency world, trade time, as cap-
tured by volume, is a more relevant metric than clock time”. Thus, they propose a
new framework based on volume imbalance and trade intensity which is measured
in volume time, namely the volume-synchronized probability of informed trading
(VPIN), or the VPIN flow-toxicity metric. However, its predictive capability on short
run volatility has been questioned by Andersen and Bondarenko (2013).
Next to price impact measures, there are econometric techniques to measure devi-
HFT and the Electronic Evolution of Financial Markets 17
ations from the efficient price and thus price efficiency. These have been analyzed
by Hasbrouck information measures (cf. Hasbrouck, 1991b,a). The information mea-
sures are based on a pre-defined number of quote revisions after a trade and trades
after a quote revision, defined as the number of lags. They therefore take the actual
trade activity of the specific stock into account instead of a fixed time interval. Has-
brouck (1991a) uses a vector autoregressive model (VAR) with 10 lags:
rt = γ0,r +10
∑i=0
αt−ixt−i +10
∑i=1
βt−irt−i + ur
xt = γ0,x +10
∑i=1
δt−ixt−i +10
∑i=1
ηt−irt−i + ux
(2.6)
with rt as the time series of quote revisions and xt the time series of trade direction.
γ, α, β, δ, and η are the coefficients of the respective VAR models, and ur and ux
are the error terms. The quote revision rt is decomposed into ten preceding trades
xt− 10, ..., xt, ten preceding quote revisions rt− 10, ..,rt, as well as the mean γ and the
error term ur. The cumulative impulse response function is the result of the inversion
of the VAR-model to a vector moving average (VMA) representation and the addition
of the coefficients of the VMA model. The cumulative impulse response function can
be interpreted as the information impact of 10 preceding trades on the current quote.
In order to highlight the different regimes of market quality in the last decades, a
comparative case study of the two prevailing electronic market systems in Germany
at that time, IBIS II and Xetra, is conducted.
2.1.2 Market Quality Framework
Improvements in market quality can be attributed to several factors that are exter-
nal and internal to markets. In the context of this framework for market quality as
depicted in Figure 2.1, external factors influence market quality indirectly and can-
not be influenced directly by trading venues. External factors include technological
development as well as the regulatory and competitive environment. On the other
side, internal market structure concerns how the market is designed, created, and
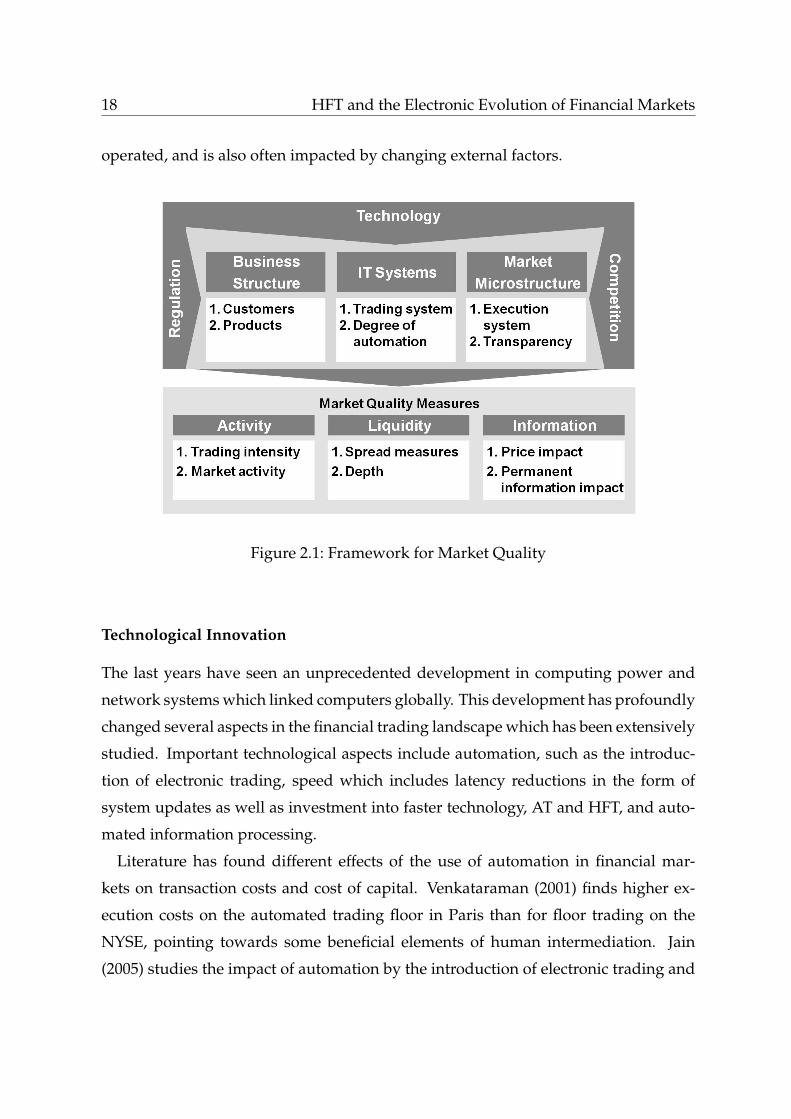
18 HFT and the Electronic Evolution of Financial Markets
operated, and is also often impacted by changing external factors.
Figure 2.1: Framework for Market Quality
Technological Innovation
The last years have seen an unprecedented development in computing power and
network systems which linked computers globally. This development has profoundly
changed several aspects in the financial trading landscape which has been extensively
studied. Important technological aspects include automation, such as the introduc-
tion of electronic trading, speed which includes latency reductions in the form of
system updates as well as investment into faster technology, AT and HFT, and auto-
mated information processing.
Literature has found different effects of the use of automation in financial mar-
kets on transaction costs and cost of capital. Venkataraman (2001) finds higher ex-
ecution costs on the automated trading floor in Paris than for floor trading on the
NYSE, pointing towards some beneficial elements of human intermediation. Jain
(2005) studies the impact of automation by the introduction of electronic trading and
HFT and the Electronic Evolution of Financial Markets 19
finds improvements in liquidity, informativeness, and reduced cost of capital. Easley
et al. (2013) analyze a major system upgrade at NYSE in 1980/1981 which enhanced
system latency and improved information dissemination. They find significant price
improvements for stocks traded by posts that experienced an extended latency re-
duction as well as reduced transaction costs in the low latency regime. Hendershott
and Moulton (2011) examine the introduction of the hybrid system at NYSE which re-
duced latency and improved electronic order execution. They find increased bid-ask
spreads due to increased adverse selection by anonymous trading as well as higher
price efficiency. Riordan and Storkenmaier (2012) study a upgrade of the Xetra sys-
tem at Deutsche Börse which involved a latency reduction and led to a decrease in
quoted and effective spreads. Other papers concentrate on the relevance of geograph-
ical distance to the market venues. Hau (2001) finds that higher geographical distance
lowers proprietary trading profits. Garvey and Wu (2010) find that orders of traders
located in the NYC area are executed at a significantly better price than orders of
traders outside the NYC area.
More recent technological trends include the automated processing of information
and the impact of automated news on market quality. Gross-Klussmann and Hautsch
(2011) show that there are significant intraday effects around the arrival of stock-
specific Reuters news ticker information. In Riordan et al. (2013), we show that there
are asymmetric effects of positive and negative stock-specific information on market
quality. The increasing relevance of social media has become apparent when a fake
tweet resulted in a stock market plunge. This tweet about a bombing in the White
House which was the result of a Twitter hack on April 23, 2013 led to plunges in
the stock markets and a 143 fall in the Dow Jones industrial average (The Guardian,
2013). A survey on social media in trading by One Market Data LLC, a firm special-
ized in tick data management and analytics, stated that this event “revealed potential
weaknesses in social media’s usability to feed trading and investment strategies, but
it also demonstrated the impact the new form of data already is having on financial
markets” (One Market Data, 2013). As a result, 18% of survey participants said the
they are currently using social media data for trading, while 35% said that they were
researching into how to incorporate social media into trading strategies. With the in-
20 HFT and the Electronic Evolution of Financial Markets
creasing relevance and interest of investors in social media, the demand for solutions
to use social media data will also be expected to grow, the director of solutions at
OneMarketData states.
Regulation and Competition
Regulatory authorities have tried to keep pace with new technological advances of
electronic markets and different market environments by adapting new regulation.
During the last years, one of the regulatory changes with the biggest impact on trad-
ing in Europe includes the “Markets in Financial Instruments Directive” (MiFID).
MiFID became effective in November 2007 to create a harmonized trading landscape
in the 27-nation European Union. It abolished the concentration rule which favored
one single dominating exchange in each country. Instead, MiFID promotes competi-
tion between traditional exchanges and multilateral trading facilities (MTF) and the
order processing under best execution. Best execution under MiFID relies on mul-
tiple factors, for instance prices, trading costs, speed, or likelihood of execution and
settlement. The introduction of MiFID allowed MTFs to offer trading in European
equities, which led to fierce competition between trading venues in Europe. After
this regulatory change, the till then monopoly-like status of traditional exchanges has
evolved to a more fragmented and diverse European market.
Literature is inconclusive about the impact of market fragmentation and competi-
tion on market quality and price discovery. Barclay et al. (2003) explore the compe-
tition of Electronic Communication Networks (ECNs), a form of Alternative Trading
System (ATS) in the US, and NASDAQ market makers. They report that trades are
more likely to be executed on ECNs in case of high information asymmetry, high
trading volume and stock-return volatility. However, ECNs possess higher execu-
tion costs, since NASDAQ market makers can preference or internalize less informed
trades. Degryse (2009) provides a review of the theoretical and empirical literature on
intermarket competition and discusses implications in the European case of MiFID.
Gomber and Gsell (2006) discuss possible regulatory changes of MiFID in the context
of technological advances and best execution. Empirical studies include Hengelbrock
HFT and the Electronic Evolution of Financial Markets 21
and Theissen (2009) and Storkenmaier et al. (2012). Hengelbrock and Theissen (2009)
study the market entry of Turquoise in 14 different countries in September 2008 and
find that the “entry of Turquoise led to a decrease in spreads but not to an increase in
trading volume”. Storkenmaier et al. (2012) study public information arrival on Lon-
don Stock Exchange (LSE) and Chi-X post-MiFID and find that private information
shifts from Chi-X to the LSE on both positive and negative days.
Internal Microstructure, Business Structure, and IT Infrastructure
In contrast to external factors, the internal market structure directly influences market
quality. External factors provide general conditions which affect the internal market
structure, i.e. the design, creation, and operation of electronic markets. Following
Weinhardt et al. (2003), the internal market structure can be decomposed into busi-
ness structure, market microstructure, and IT systems.
At the heart of market design, the microstructure is established. Market microstruc-
ture is “the study of the process and outcomes of exchanging assets under explicit
trading rules” (p.1, O’Hara, 1997). In order to determine the market microstructure,
the execution system, the market model, and the role of intermediaries have to be
defined, as well as the degree of transparency. Changes in microstructure can have
a direct effect on market quality, which has been one focus in market microstructure
research.
The market model determines the auction model of the market, for example a call
auction or a continuous double auction, which also are the two most important ones
for financial markets.
The execution system, i.e. the matching of buyers and sellers, can be either quote-
driven, brokered or order-driven, or a hybrid form of those. Quote-driven and
brokered markets involve intermediaries, e.g. in the form of brokers or liquidity
providers. One prominent example for a comparison of execution systems is pre-
sented by Huang and Stoll (1996). They analyze differences in liquidity of the NAS-
DAQ, and the NYSE. During their observation period, the NYSE operated a floor-
based order-driven trading system, but also engaged liquidity providers in the form
22 HFT and the Electronic Evolution of Financial Markets
of specialists. Those are more common in quote-driven systems. The NASDAQ, on
the other hand, was a fully quote-driven market at that time, with dealers acting as in-
termediaries for every trade. Huang and Stoll (1996) compare both execution systems
and find that transaction costs on the NASDAQ are larger than on the NYSE.
Another aspect of market microstructure is the degree of transparency, i.e. the ex-
tent to which information is disclosed before, during, and after the trading process
plays a vital role. Boehmer et al. (2005) examine the introduction of the NYSE’s Open-
Book, the dissemination of the whole order book instead of only the best bid and ask
prices. This increase in pre-trade transparency has led to changes in market qual-
ity: smaller order sizes, more order cancellations, less order book depth, liquidity
improvements, and a decline in the participation of specialists.
Depending on the customer target group, trading venues adapt their market model
to cater to a specific business structure. Among others, it specifies a target group of
customers that the market intends to attract and provide products and services for.
Different types of traders are attracted by different market models, making the choice
of market model and the knowledge of trader types extremely relevant.
The close connection of business structure and IT systems can be demonstrated by
the example of AT and HFT systems. Agency AT strategies are usually applied to
split large orders into smaller ones in order to minimize impact and transaction costs
and to hide information and trading strategies. AT systems with short-term strate-
gies, called HFT systems, intensify this effect even more.1 HFT strategies sometimes
involve the submission and an immediate cancellation in case of non-execution of an
order, both within milliseconds. As a result, increased trading and quoting activity,
and a rising demand for speed and anonymity can be observed. With this changing
group of customers, exchanges adapted their IT system and business structure ac-
cordingly. However, ECNs und MTFs often meet the described needs of traders for
anonymous low latency systems better than traditional exchanges.
On the other side however, foreign exchange markets such as ICAP’s EBS chose
to curb HFT activity on their platform by introducing a “latency floor” for specific
currency pairs, meaning that orders are bundled into batches of one to three millisec-
1For a more detailed distinction of AT and HFT systems, see Section 2.2.1.
HFT and the Electronic Evolution of Financial Markets 23
onds and executed in a randomized fashion (cf. Reuters, 2013a). With this change
in microstructure, they intend to level the playing field for both HFT and non-HFT
groups.
2.1.3 Case Study: IBIS vs. Xetra
A comparative case study of the IBIS II and the Xetra system serves as a demonstra-
tion of the evolution of market quality over time and an exemplary application of the
market quality framework. Both were two predominant financial electronic markets
in the history of German exchanges. IBIS II had been the trading system for German
DAX 30 securities between April 1991 and November 1997. It has been replaced by
the Xetra system in November 1997.
Institutional details
The “Inter-Banken-Informations-System” (IBIS I) was originally designed as a quo-
tation and settlement support system for the Deutsche Boerse Group. The Deutsche
Boerse Group is one of the largest stock exchange operators in the world. In the early
days between December 1989 and April 1991, trading took place from 8:30 a.m. to 5
p.m. (local time) by phone. IBIS I was replaced by the “Integriertes Boersenhandels-
und Informationssystem” (IBIS II), a fully automated trading system organized as an
anonymous continuous open limit-order book with price-time priority. However, it
was only possible to trade round lots of 100 or 500 shares (cf. Schmidt and Iversen,
1992; Theissen, 2002, for details). Orders were directly transferred to the DWZ, the
German securities clearing service.
The Deutsche Boerse Group replaced IBIS II with the Xetra system in November
1997, the prevailing trading system for all German securities since, which has un-
dergone several releases and changes. The Xetra system is a fully-electronic trading
system, with trading hours from 9:00 a.m. (local time) to 5.30 p.m. (local time) in the
chosen sample. Like IBIS II, it is order-driven, anonymous, and is organized as an
open limit-order book. It follows a flexible market model, specifically a continuous
double auction. There is an opening call auction at 9:00 a.m. (local time) in the morn-
24 HFT and the Electronic Evolution of Financial Markets
ing, a two-minute intra-day call auction at 1:00 p.m. (local time) and a closing call
auction at 5:30 p.m. (local time), all three with a random ending. This study focuses
only on the continuous trading periods.
The external factors, i.e. regulation, competition, and technology significantly
changed over time. In contrast, the basic market microstructures of IBIS II and the
Xetra system as described above are quite similar: Both enable fully automated con-
tinuous trading with price-time priority within same time durations. The analysis
primarily focuses on the comparison of both markets with regard to the specified
market quality measures and to the external factors and internal market structure of
the market quality framework.
The data samples used in the case study consist of DAX stocks traded on IBIS II
between January 1st, 1997 and March 31st, 1997 and on the Xetra system for the same
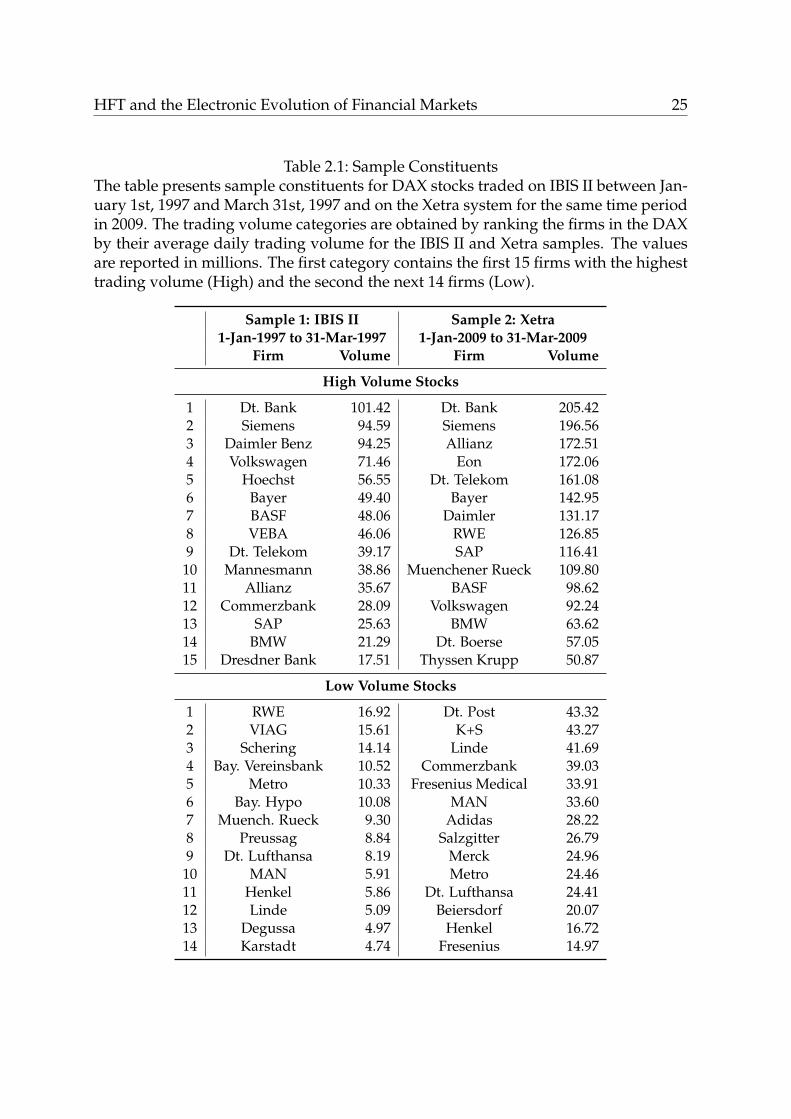
time period in 2009. Table 2.1 shows the data samples, with each consisting of 29
DAX stocks. Companies that are not continuously traded during the observation
period are excluded. The companies in Table 2.1 are ranked by their average daily
trading volume over the specific observation periods. While Sample 1 consists of
stocks traded on IBIS II, Sample 2 comprises Xetra stocks. In order to transform mea-
sures given in Deutsche Mark from Sample 1 to Euros, the exchange rate at which the
currency entered the Euro is used.
Internal and External Changes
Despite the similar market microstructure of both markets, internal and external fac-
tors have significantly changed. The external factors regulation and competition have
profoundly changed from 1997 to 2009 particularly after the introduction of MiFID.
As a result of the concentration rule, national markets have often operated as a de
facto monopolist. After MiFID, the introduction of MTFs has started a fierce compe-
tition for order flow between incumbent exchanges in Europe and alternative trading
venues. For instance the London Stock Exchange (LSE) lost over 30 percent of its mar-
ket share between 2007 and 2009. Deutsche Boerse has been able to maintain a higher
fraction of market shares but they have also seen a significant drop lately. As to the
HFT and the Electronic Evolution of Financial Markets 25
Table 2.1: Sample ConstituentsThe table presents sample constituents for DAX stocks traded on IBIS II between Jan-uary 1st, 1997 and March 31st, 1997 and on the Xetra system for the same time periodin 2009. The trading volume categories are obtained by ranking the firms in the DAXby their average daily trading volume for the IBIS II and Xetra samples. The valuesare reported in millions. The first category contains the first 15 firms with the highesttrading volume (High) and the second the next 14 firms (Low).
Sample 1: IBIS II Sample 2: Xetra1-Jan-1997 to 31-Mar-1997 1-Jan-2009 to 31-Mar-2009
Firm Volume Firm Volume
High Volume Stocks
1 Dt. Bank 101.42 Dt. Bank 205.422 Siemens 94.59 Siemens 196.563 Daimler Benz 94.25 Allianz 172.514 Volkswagen 71.46 Eon 172.065 Hoechst 56.55 Dt. Telekom 161.086 Bayer 49.40 Bayer 142.957 BASF 48.06 Daimler 131.178 VEBA 46.06 RWE 126.859 Dt. Telekom 39.17 SAP 116.4110 Mannesmann 38.86 Muenchener Rueck 109.8011 Allianz 35.67 BASF 98.6212 Commerzbank 28.09 Volkswagen 92.2413 SAP 25.63 BMW 63.6214 BMW 21.29 Dt. Boerse 57.0515 Dresdner Bank 17.51 Thyssen Krupp 50.87
Low Volume Stocks
1 RWE 16.92 Dt. Post 43.322 VIAG 15.61 K+S 43.273 Schering 14.14 Linde 41.694 Bay. Vereinsbank 10.52 Commerzbank 39.035 Metro 10.33 Fresenius Medical 33.916 Bay. Hypo 10.08 MAN 33.607 Muench. Rueck 9.30 Adidas 28.228 Preussag 8.84 Salzgitter 26.799 Dt. Lufthansa 8.19 Merck 24.9610 MAN 5.91 Metro 24.4611 Henkel 5.86 Dt. Lufthansa 24.4112 Linde 5.09 Beiersdorf 20.0713 Degussa 4.97 Henkel 16.7214 Karstadt 4.74 Fresenius 14.97
26 HFT and the Electronic Evolution of Financial Markets
technological changes, there is an immense increase in the speed of both information
and communication technology. The electronic revolution has also greatly affected
the German trading landscape, with the use of computerized high speed trading sys-
tems, geographically dispersed market participants, anonymization of trading, and a
greater choice of trading platforms.
The change in external factors has triggered a substantial transformation of ex-
changes’ internal market structures consisting of business structures, IT systems, and
market microstructures. The customer target group as an aspect of the internal busi-
ness structure has changed. Particularly institutional investors aim for more sophisti-
cated trading strategies and a higher degree of automation, e.g. by using algorithmic
trading systems. With the introduction of the Automated Trading Program (ATP)
in December 2007, Deutsche Boerse directly targets to attract algorithmic traders.
ATs have a different trading behavior than human traders as well as competitive
advantage with respect to speed and computation, as pointed out by Hendershott
et al. (2011). Therefore, the importance of latency and availability have changed.
Nowadays, trading venues compete for customers by offering co-location services
and faster systems.
The aforementioned development has been enabled by increasingly automated IT
systems and it has also been accompanied by a shift from floor to electronic trading.
In 1997 floor trading still played an important role, leaving IBIS II with about 40
percent of the total trading volume in DAX stocks. The situation in 2009 was quite
different. Xetra now accounts for more than 90 percent of turnover in the DAX shares.
IBIS II and Xetra are based on different IT systems. Xetra was originally developed
to attract order flow from non-institutional investors and from outside of Germany
by providing a decentral access. Since it was accessible for all market participants, it
also provided improved transparency, which is part of the market microstructure.
Changes in Market Quality
All these changes in the business structure and in IT systems led to an anonymous
and highly automated market which has been faster in processing trades and trade

HFT and the Electronic Evolution of Financial Markets 27
information. There is no change in the main characteristics of the market microstruc-
ture. However, main drivers of a market differences between Xetra and IBIS II can be
attributed to the internal factors business structure and IT structure strongly driven
by changes in external factors. For the evaluation and comparison of market qual-
ity of both markets, descriptive statistics of market quality measures are reported in
Table 2.2.
28 HFT and the Electronic Evolution of Financial Markets
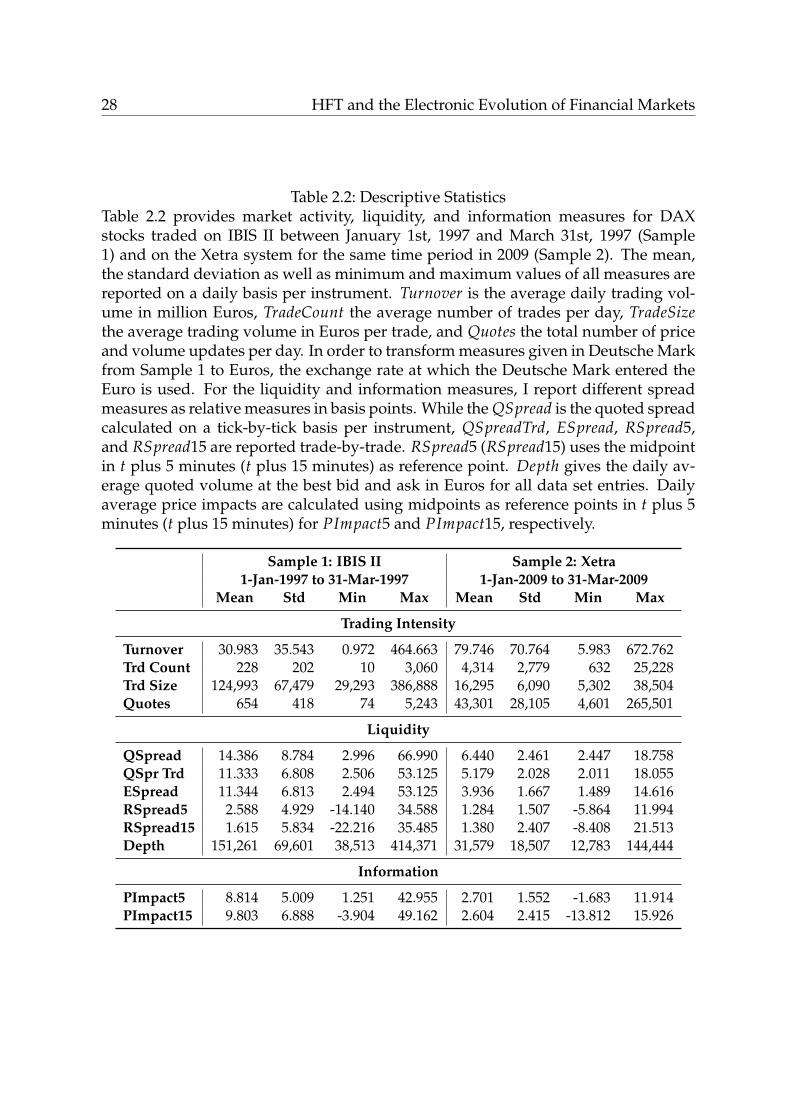
Table 2.2: Descriptive StatisticsTable 2.2 provides market activity, liquidity, and information measures for DAXstocks traded on IBIS II between January 1st, 1997 and March 31st, 1997 (Sample1) and on the Xetra system for the same time period in 2009 (Sample 2). The mean,the standard deviation as well as minimum and maximum values of all measures arereported on a daily basis per instrument. Turnover is the average daily trading vol-ume in million Euros, TradeCount the average number of trades per day, TradeSizethe average trading volume in Euros per trade, and Quotes the total number of priceand volume updates per day. In order to transform measures given in Deutsche Markfrom Sample 1 to Euros, the exchange rate at which the Deutsche Mark entered theEuro is used. For the liquidity and information measures, I report different spreadmeasures as relative measures in basis points. While the QSpread is the quoted spreadcalculated on a tick-by-tick basis per instrument, QSpreadTrd, ESpread, RSpread5,and RSpread15 are reported trade-by-trade. RSpread5 (RSpread15) uses the midpointin t plus 5 minutes (t plus 15 minutes) as reference point. Depth gives the daily av-erage quoted volume at the best bid and ask in Euros for all data set entries. Dailyaverage price impacts are calculated using midpoints as reference points in t plus 5minutes (t plus 15 minutes) for PImpact5 and PImpact15, respectively.
Sample 1: IBIS II Sample 2: Xetra1-Jan-1997 to 31-Mar-1997 1-Jan-2009 to 31-Mar-2009
Mean Std Min Max Mean Std Min Max
Trading Intensity
Turnover 30.983 35.543 0.972 464.663 79.746 70.764 5.983 672.762Trd Count 228 202 10 3,060 4,314 2,779 632 25,228Trd Size 124,993 67,479 29,293 386,888 16,295 6,090 5,302 38,504Quotes 654 418 74 5,243 43,301 28,105 4,601 265,501
Liquidity
QSpread 14.386 8.784 2.996 66.990 6.440 2.461 2.447 18.758QSpr Trd 11.333 6.808 2.506 53.125 5.179 2.028 2.011 18.055ESpread 11.344 6.813 2.494 53.125 3.936 1.667 1.489 14.616RSpread5 2.588 4.929 -14.140 34.588 1.284 1.507 -5.864 11.994RSpread15 1.615 5.834 -22.216 35.485 1.380 2.407 -8.408 21.513Depth 151,261 69,601 38,513 414,371 31,579 18,507 12,783 144,444
Information
PImpact5 8.814 5.009 1.251 42.955 2.701 1.552 -1.683 11.914PImpact15 9.803 6.888 -3.904 49.162 2.604 2.415 -13.812 15.926
HFT and the Electronic Evolution of Financial Markets 29
In contrast, the number of trades has shown an 18-fold increase, from 228 trades
per day to 4,314 trades. The explanation comes with the analysis of average trade
sizes, which are in 2009 less than one seventh of the sizes they were in 1997. This
accounts for the small increase in turnover relative to the immense increase in the
number of trades. The standard deviation is 67,479 Euros compared to 6,090 Euros,
indicating that the main part of the order flow concentrates in the dimension of small
orders. Thus, the behavior of traders has dramatically changed within the time period
between 1997 and 2009.
Market activity in general is reflected by quote updates, which occur with every
cancellation of an order, a change of best bid, ask or volume, as well as the execution
of an order over one or more levels in the order book. Quote updates have increased
with the factor 65, from 654 updates to 43,300 updates. A large proportion of these
changes in activity can be attributed to recent technological developments like algo-
rithmic trading and low latency networks. Today, large orders are often split into
smaller ones in order to minimize their impact and to hide the trading strategy which
leads to more and smaller trades.
Regarding the liquidity measures, there is a decrease of up to 65 percent, from 11.34
bps to 3.94 bps for average effective spreads and from about 11.33 bps to around 5.18
bps in the case of average quoted spreads at trades, with smaller standard deviations
and therefore a lower variability in the availability of liquidity. This increase in liquid-
ity might be explained by higher competition between liquidity suppliers in the order
book. On the other hand, depth has fallen quite sharply, from 151,261 to 31,579 Euros
on average per day and instrument. However, this development can be explained
by changes in trading behavior and strategies. As stated before, order sizes have de-
creased on average, thus one might infer smaller orders at the best bid and asks.The
results imply that there is an improvement of liquidity in spread measures, but not
a definite improvement of overall liquidity. Spreads decrease, implying a higher liq-
uidity, depth on the other side decreases, implying a lower liquidity. Such results
are also reflected in MiFID’s best execution policy which requires intermediaries to
consider multiple dimensions of market quality (cf. Section 2.1.2).
The information content of trades, measured by the price impact, decreased be-
30 HFT and the Electronic Evolution of Financial Markets
tween 1997 and 2009, with a simultaneous increase of realized spread. The results
show that the price impact at the five minute mark decreases from 8.814 bps to in
1997 only 2.701 bps in 2009. As expected, information per trade decreases as a result
of smaller order sizes and increased activity as shown in the descriptive results for
market activity. Thompson clustered standard errors (cf. Thompson, 2011) are ap-
plied to test for the statistical significance of the differences. Each sample is split into
high and low volume stocks and test these categories individually.
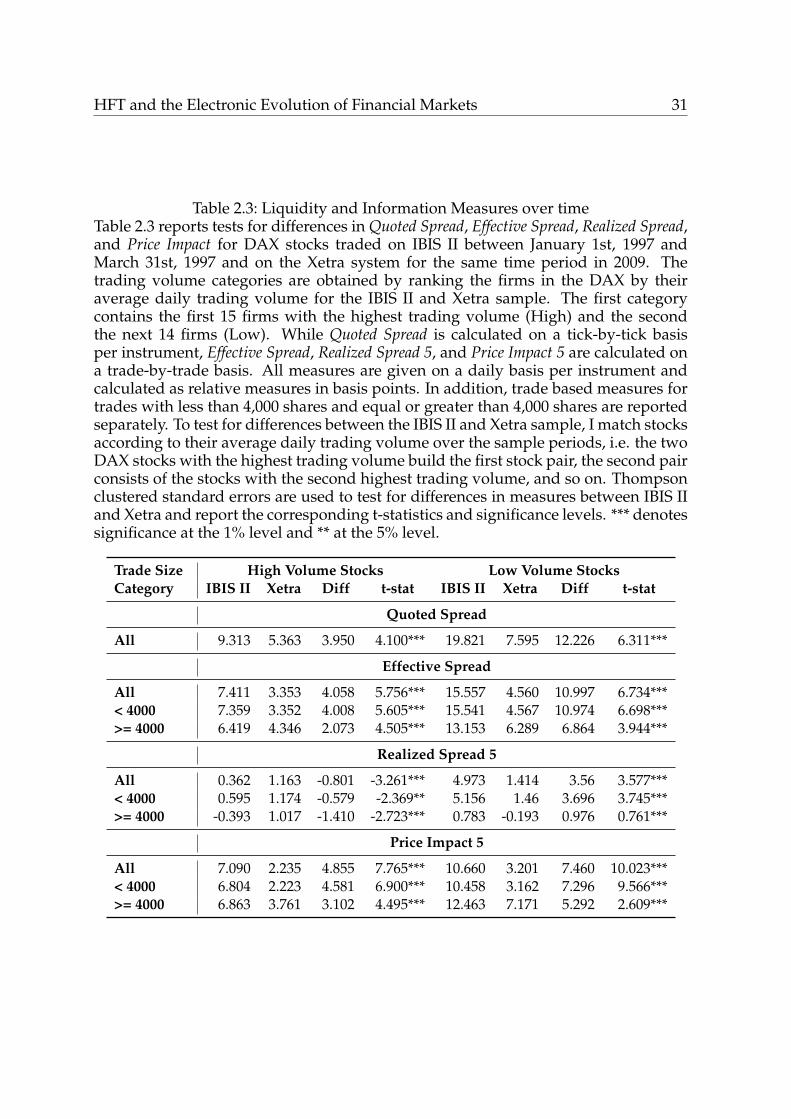
The results shown in Table 2.3 are statistically significant at the 1% level for quoted,
effective and realized spreads and price impacts at the 5-minute mark. Individual
trades have a larger price impact both in 1997 and 2009 for low volume stocks. Differ-
ences between trades of less than 4000 shares and more than 4000 shares are generally
more pronounced on the Xetra system.
In conclusion, quantitative measures and qualitative aspects have tremendously
changed. Overall, there is a significant increase in activity and liquidity, with signifi-
cant decreases in effective spreads, actual transaction costs, from 1997 to 2009. While
the landscape of external factors, regulation, competition, and technology have nec-
essarily changed due to the computerization of financial markets, the internal market
structure has also been adopted, by providing higher transparency and focusing more
on the needs of AT and HFT.
2.2 Economic and Regulatory Aspects of HFT
The growing importance of AT and HFT has gained considerable attention in public
and regulatory discussions in recent years. However, due to the variety of different
HFT strategies, definition of the term HFT vary considerably. In this section, I give
insight into the term HFT which is usually defined by specific trading characteris-
tics and strategies. I further discuss the growing body of related literature especially
in the light of market quality effects and ongoing regulatory proposals and actions
against the negative effects of HFT and further present some descriptive measures of
HFT contribution to liquidity in the case study “HFT and liquidity”.
HFT and the Electronic Evolution of Financial Markets 31
Table 2.3: Liquidity and Information Measures over timeTable 2.3 reports tests for differences in Quoted Spread, Effective Spread, Realized Spread,and Price Impact for DAX stocks traded on IBIS II between January 1st, 1997 andMarch 31st, 1997 and on the Xetra system for the same time period in 2009. Thetrading volume categories are obtained by ranking the firms in the DAX by theiraverage daily trading volume for the IBIS II and Xetra sample. The first categorycontains the first 15 firms with the highest trading volume (High) and the secondthe next 14 firms (Low). While Quoted Spread is calculated on a tick-by-tick basisper instrument, Effective Spread, Realized Spread 5, and Price Impact 5 are calculated ona trade-by-trade basis. All measures are given on a daily basis per instrument andcalculated as relative measures in basis points. In addition, trade based measures fortrades with less than 4,000 shares and equal or greater than 4,000 shares are reportedseparately. To test for differences between the IBIS II and Xetra sample, I match stocksaccording to their average daily trading volume over the sample periods, i.e. the twoDAX stocks with the highest trading volume build the first stock pair, the second pairconsists of the stocks with the second highest trading volume, and so on. Thompsonclustered standard errors are used to test for differences in measures between IBIS IIand Xetra and report the corresponding t-statistics and significance levels. *** denotessignificance at the 1% level and ** at the 5% level.
Trade SizeCategory
High Volume Stocks Low Volume StocksIBIS II Xetra Diff t-stat IBIS II Xetra Diff t-stat
Quoted Spread
All 9.313 5.363 3.950 4.100*** 19.821 7.595 12.226 6.311***
Effective Spread
All 7.411 3.353 4.058 5.756*** 15.557 4.560 10.997 6.734***< 4000 7.359 3.352 4.008 5.605*** 15.541 4.567 10.974 6.698***>= 4000 6.419 4.346 2.073 4.505*** 13.153 6.289 6.864 3.944***
Realized Spread 5
All 0.362 1.163 -0.801 -3.261*** 4.973 1.414 3.56 3.577***< 4000 0.595 1.174 -0.579 -2.369** 5.156 1.46 3.696 3.745***>= 4000 -0.393 1.017 -1.410 -2.723*** 0.783 -0.193 0.976 0.761***
Price Impact 5
All 7.090 2.235 4.855 7.765*** 10.660 3.201 7.460 10.023***< 4000 6.804 2.223 4.581 6.900*** 10.458 3.162 7.296 9.566***>= 4000 6.863 3.761 3.102 4.495*** 12.463 7.171 5.292 2.609***
32 HFT and the Electronic Evolution of Financial Markets
2.2.1 HFT Definition and Strategies
HFT can be considered as a subcategory of AT which is commonly defined as the use
of computer algorithms to support the trading process (cf. Hendershott et al., 2011).
While popular AT algorithms are simple transaction cost minimizing algorithms, so-
called “slice and dice” algorithms, which split large orders into smaller ones in order
to minimize price impact and transaction costs (c.f. Gomber and Gsell, 2006), HFT
algorithms are often more complex. Since HFT involves different trading strategies,
there is no specific HFT definition, but trading characteristics that constitute such a
group of high-speed traders that academics and regulator focus on. The SEC identi-
fies the following characteristics (cf. p.45, SEC, 2010):
1. extraordinarily high-speed and sophisticated computer programs for generat-
ing, routing, and executing orders;
2. use of co-location services and individual data feeds offered by exchanges and
others to minimize latency;
3. very short time-frames for establishing and liquidating positions;
4. submission of numerous orders cancelled shortly after submission; and
5. ending the trading day in as close to a flat position as possible (that is, not car-
rying significant, unhedged positions over-night).
Further characteristics include high message rates in terms of order submissions
and cancellations (a direct consequence of characteristic 4) which poses a substantial
burden to market venues in term of processing power. Jones (2013) illustrates three
groups of HFT strategies, namely market making, relative-value trading (arbitrage),
and directional trading. I follow this classification and further discuss another loosely
defined group of manipulative trading strategies that makes use of weaknesses of
other participants and of structural nature of the market and thus especially concern
regulators. The SEC similarly categorizes HFT strategies into four groups (namely
passive market making, arbitrage, structural, and directional strategies) and point
out possible negative effects on financial markets for each group (SEC, 2010).
HFT and the Electronic Evolution of Financial Markets 33
Automated Market Making
Market making strategies involve liquidity provision by the submission of non-
marketable resting orders (bids and offers) that provide liquidity to the marketplace
at specified prices. On the other side, liquidity takers submit marketable orders, i.e.
market orders or limit orders that can be executed directly against orders in the or-
der book. Market-makers aim to buy at the bid price and sell at the ask price and
thereby make the bid-ask spread as a profit. They further profit from liquidity re-
bates provided by marketplaces. While the classic structure involves a fee for every
transaction, there has been a shift to rebate pricing. Rebate pricing grants liquidity
providers a rebate, while liquidity takers pay a fee. The impact of the introduction of
a maker-taker rebate system is analyzed by e.g. Malinova and Park (2011).
What is questioned is the quality of liquidity provided since algorithms often can-
cel limit orders immediately after submission. This would result in a “flickering”
of liquidity for a few milliseconds, but no liquidity that non-HFT can actually use.
Since the rebates for liquidity provision are often only fractions of a basis point, pas-
sive market making strategies involve a high amount of trading volume and a fast
connection to be profitable. Another point of discussion is the fairness against other
long-term investors who cannot profit from this kind of rebate to the extent that HFTs
do. Further questions are whether marketplaces should adopt their business struc-
ture and also request certain trading obligations to grant this kind of rebate.
Arbitrage Trading
Arbitrage strategies seek to profit from pricing inefficiencies between related prod-
ucts or same products on different markets by selling the overpriced and buying the
underpriced instrument or sell at the market with the higher price and buy at the
market with the lower price respectively. HFT have the possibility to make use of
arbitrage opportunities that only exist for a few milliseconds. A popular strategy
is index arbitrage which can involve different instruments based on the same un-
derlying (e.g. the S&P 500 futures and the exchange-traded fund (ETF) that tracks
the S&P 500 index) or index products and individual stocks that make up the index
34 HFT and the Electronic Evolution of Financial Markets
(Jones, 2013). Another typical arbitrage strategy is pairs trading which makes use of
statistical correlation of securities. It usually involves quantitative and heavily com-
putational approaches, which can be better solved by computers than humans. The
impact on market quality here is of a positive nature, since the detection of arbitrage
improves price efficiency and market quality.
Directional Trading
Another strength of HFT systems involves the processing of considerable amounts
of possibly complex data sources, such as macroeconomic announcements, textual
news information, or historical transaction data (cf. Section 3). As in Aldridge (2010,
cf. p.16), directional strategies identify short-term trends or momentum. While the
group of event-driven directional strategies might be beneficial for financial markets,
there might also be manipulative ignition strategies. Automated news trading in-
volves the analyses of market and investor sentiment, semantic analysis, and text
mining, which are only a few examples of the ongoing research being conducted to
make texts or qualitative financial data interpretable for machines. As introduced by
Martinez and Rosu (2013), the dimension of “information precision” plays a crucial
role for this type of information processing strategies.
Market Manipulation
Manipulative strategies include the exploitations of certain vulnerabilities of markets
and participants and are often called predatory strategies. Latency Arbitrage, Or-
der Anticipation, and Momentum Ignition strategies are often mentioned that would
cause potential harm to financial markets (SEC, 2010), but also other strategies are
listed as potential abusive types of strategies (e.g. Biais and Woolley, 2011; IIROC,
2012).
• Latency Arbitrage makes use of the low-latency nature of HFT (use of co-location
and high-frequency data feeds) and is a concern in terms of a structural abuse
of RegNMS. Since a National Best Bid and Offer (NBBO) system provides an
HFT and the Electronic Evolution of Financial Markets 35
official efficient price, HFTs could construct their own NBBO using their high-
frequency data feeds which is faster than the official NBBO and thus trade on
these stale prices as compared to their own faster and more efficient price (cf. p.
52f., SEC, 2010).
• Order Anticipation involves the detection of large orders, e.g. using sophisticated
pattern recognition or “pinging” different market centers, and trade ahead of
these orders. This type of detection activities might be perceived as some sort of
front running, which however does not involve the use of confidential informa-
tion, but the use of “pinging” strategies (i.e. the use of very small orders which
indicate the existence of hidden orders for example). While order anticipation
strategies specifically harm the investor whose order is being anticipated, they
do not improve market quality in any way. It is still an open question whether
and how these large orders are strategically disadvantaged in their execution
by HFTs.
• Momentum Ignition or “Layering” strategies aim to ignite a rapid price move-
ment in one direction by a series of orders and traders. While other traders
follow the price movement, HFTs would take the other side of the market and
profit from the artificially high or low prices. This kind of market manipulation
would harm market quality by increasing market inefficiency.
• While ignition strategies using trades carry a certain amount of risks, Spoofing
strategies usually include the submission of limit orders that are not intended
to be executed in order to manipulate prices.
• Smoking strategies similarly involve alluring limit orders to attract slow traders.
Then HFT would rapidly revise these orders with less favorable prices to profit
from incoming flow of slow traders’ market orders (Biais and Woolley, 2011).
• Quote Stuffing involves a huge number of orders and cancels in order to strategi-
cally slow down the matching engines and increase latencies, possibly in order
to create “latency arbitrage” opportunities (IIROC, 2012).
36 HFT and the Electronic Evolution of Financial Markets
2.2.2 HFT Literature
The body of HFT literature has been growing in the recent years. While the empirical
work has concentrated mostly on the overall impact of HFT on market quality in
terms of liquidity, price discovery, and efficiency, the theoretical work was able to
give more detail on the specific trading characteristics, such as the speed advantage
or news trading strategies, and their influence on market quality and welfare.
Theoretical HFT Literature
The specifically HFT-related theoretical papers are Biais et al. (2012), Jovanovic and
Menkveld (2012), Martinez and Rosu (2013), and Foucault et al. (2013).
Biais et al. (2012) analyze the number of fast and slow traders in a market as well
as the equilibrium investment level of traders into fast technology. Their results yield
ambiguous results: While a certain amount of fast traders can increase volume, it
might also crowd out slower traders. This ambiguity seems to be reflected in different
amounts of HFT in different markets: While equity and futures market venues con-
tinue to invest into faster platforms and IT systems, FX market such as EBS (as men-
tioned above in Section 2.1.2, Reuters, 2013a) experience a crowding out of slower
traders. This and a possible “over-investment” into fast trading technology would in
fact decrease overall welfare.
Jovanovic and Menkveld (2012) focus on the intermediary “middlemen” role of
HFT. They show that HFTs acting as intermediaris can decrease adverse selection by
processing information faster and quote more efficiently, and thus improve welfare.
Martinez and Rosu (2013) and Foucault et al. (2013) concentrate on directional
information-processing HFTs. Martinez and Rosu (2013) find that with increasing
HFT activity, volume and liquidity increases as well as informational volatility and
market efficiency due to the faster information processing of HFTs. In Zhang (2013),
I test several theoretical predictions of the model empirically and find consistent em-
pirical results. Foucault et al. (2013) further model the effects of information accuracy
(or news precision) and speed.
HFT and the Electronic Evolution of Financial Markets 37
Cartea and Penalva (2011) model a market with liquidity traders, market makers,
and HFTs. They find that HFTs increase price volatility, trade volume, and may de-
crease liquidity.
Empirical HFT Literature
The empirical body of HFT literature concentrates on the influence of HFT on market
quality, but also extends to measures of profitability subject to the availability of more
detailed data. Brogaard et al. (2013) analyze the impact on price efficiency and find
that HFT significantly contribute to informational volatility. Hagströmer and Nordén
(2012) analyze different types of HFT strategies, market-making and opportunistic
HFTs, and find that market-making HFTs lower short-term volatility. Hasbrouck and
Saar (2013) use “strategic runs” (responses to market events in the millisecond en-
vironment) as a proxy for HFT activity and find positive effects of HFT on market
quality in terms of decreased spreads, increased order book depth, and lower short-
term volatility.
Other papers have also shown negative effects of HFT on price discovery and mar-
ket volatility. Kirilenko et al. (2011) find that HFT did not trigger the “Flash Crash” on
May 6th, 2010, but exacerbated market volatility during this extreme event. Hirschey
(2013) finds that HFT are better at anticipating buying and selling pressure and order
flow. Predatory HFT strategies include quote stuffing, as discussed below, which is
analyzed empirically by Gai et al. (2012) and Egginton et al. (2012).
Menkveld (2013) analyzes the trading activity and profit of an HFT market maker
who is active on both Chi-X and Euronext. Baron et al. (2012) find that HFTs make
$23 million in trading profits in the E-mini S&P 500 futures market in August 2010
and that the fastest HFT firms earn the highest profits.
Research on HFT is also closely related to research on AT. Hendershott et al. (2011)
focus on the impact of AT on liquidity and find a positive impact on liquidity, but
no increase in volatility caused by AT. On the contrary, they find that an increased
activity of AT leads to more efficient prices for large stocks. Chaboud et al. (2013)
analyze the effects of AT on volatility in foreign exchange markets. Despite an ap-
38 HFT and the Electronic Evolution of Financial Markets
parent correlation of high frequency trading strategies, a higher activity of AT is not
associated with higher volatility, but an increase in efficiency by the execution of ar-
bitrage strategies. Hendershott and Riordan (2013) find that ATs improve liquidity
and specifically that they consume it when it is cheap and supply liquidity when it
is expensive. Boehmer et al. (2012) study the introduction of co-location facilities as
a proxy for AT activity and find that higher AT activity increases liquidity, informa-
tional efficiency, and volatility.
2.2.3 HFT Regulation
Despite the fact that most empirical studies find positive effects of HFT on financial
markets, regulators in the U.S. and Europe are discussing stricter regulations for HFT.
The concept release on equity market structure published by the SEC (SEC, 2010)
highlights some of the regulatory concerns on HFT. The “Flash Crash” on May 6th,
2010, has further fueled the discussions. The more than 10% drop in the Dow Jones
Industrial Average has drawn the public’s attention to HFT and although HFT seems
not to have been the original source of the event, they may have exacerbated the
situation (cf. Kirilenko et al., 2011). The increase of market volatility has served more
to focus negative attention on HFT.
The MiFID, an EU wide regulation on financial services, is currently under review.
One of the focuses of the MiFID review (“MiFID II”) and of a new regulation (Markets
in Financial Instruments Regulation, MiFIR) is how to regulate HFT. The proposals re-
garding HFT regulation would have a significant impact on the structure and quality
of European financial markets. Regarding the proposals, the Association for Finan-
cial Markets in Europe (AFME) published a position paper on the regulatory points
of discussion concerning HFT (Association for Financial Markets in Europe, 2012).
These are discussed in the context of recent regulatory developments in the U.S. and
Europe below:
• Authorization and Risk Control: AFME generally agrees with the European
Commission’s intentions to increase regulatory oversight of members of trading
venues and risk control of clients that have “direct electronic access”. With the
HFT and the Electronic Evolution of Financial Markets 39
HFT act coming into effect in Germany, this would be a first attempt to increase
transparency by requiring a license for HFT firms and flagging orders by those
firms.
• Direct Electronic Access: This term includes the different forms Direct Market
Access (DMA), Sponsored Access (SA), and Naked Sponsored Access. DMA
allows automatic transmission of orders to a specified trading platform after
being transmitted first to the investment firm’s internal electronic trading sys-
tems which is often used by smaller brokers and retail investors. SA is defined
as direct access without being routed through internal electronic trading sys-
tems of the investment firm, but has to pass pre-trade controls of the investment
firm. Naked SA would be unfiltered access without any pre-trade controls and
is prohibited under MiFID. Thus, DMA and SA serve as valuable services not
only to HFT, but also to retail investors in order to reduce transaction fees and
to provide cost-effective market access.
• Order-to-Trade Ratios: Several HFT strategies involve a large amount of mes-
sage traffic in the form of order submissions and cancellations without an ap-
propriate number of actually executed trades. Since the former would not in-
volve any fees for these types of traders, several exchanges have introduced ex-
cessive order fees in order to limit these activities. For example, Nasdaq OMX,
Borsa Italiana, Oslo Børs and Xetra Frankurt have implemented fees on high
order-to-trade ratios (Credit Suisse, 2012). However, the range has been consid-
erably wide from 70:1 at the Oslo Stock Exchange in Norway to 2500:1 for DAX
names at Xetra. AFME supports the introduction of this kind of fees, but at the
discretion of the venue and not the dictate of a fixed limit.
• Circuit Breakers: While regulators agree that trading venues should have suit-
able control mechanisms, AFME further points towards a harmonisation of this
kind of mechanism between venues. In response to the “Flash Crash”, the SEC
approved a pilot for single-stock circuit breaker trading pauses for five minutes
based on a five-minute window (SEC, 2012b,a) to complement the market-wide
circuit breakers which have not been triggered during the “Flash Crash”. On
40 HFT and the Electronic Evolution of Financial Markets
May 31, 2012, the Commission approved a “limit up-limit down” mechanism
to replace the single-stock circuit breaker rules as well revised the market-wide
circuit breaker rules (cf. SEC, 2012c).
• Annual Disclosure: As the AFME states, this might result in “a large amount of
meaningless information being disclosed to regulators”, thus not effective as a
preventive action to curb negative effects of HFTs.
• Minimum Resting Time: In the MiFID II proposal, a minimum resting time
of 500 milliseconds was proposed, but met strong opposition of practitioners.
Negative effects might involve a decrease of activity of actual liquidity supply
by HFTs due to the higher exposure posed by longer order lifetimes and addi-
tional arbitrage opportunities for aggressive HFTs.
• Continuous Operation Requirement: This point goes in line with previous dis-
cussions on trading obligations, specifically in the context of HFT market mak-
ing activities. However, as AFME correctly stated, formal market makers usu-
ally received certain incentives when serving the obligation to provide liquidity
for a portion of the trading day.
• Transaction Taxes: These were introduced for example in France as well as an
additional HFT tax on entities located in France. Although claiming to target
HFT activity with this measure, it affected the whole market and led to deteri-
orations in some dimensions of market quality (cf. Meyer et al., 2013; Colliard
and Hoffmann, 2013; Haferkorn and Zimmermann, 2013). The direct effect of
the HFT tax on HFT might also be limited since most HFT firms trading French
names would be located outside of France.
While HFT is often viewed as entirely negative, it should be noted that not all
behaviors attributable to HFT strategies are detrimental to the market (Credit Suisse,
2012). Thus, despite the variety of possible HFT regulation, the negative effects of ma-
nipulative strategies should be targeted more directly, as stated in the Credit Suisse
Report, by updating the EU Market Abuse Directive (MAD) to “more accurately re-
HFT and the Electronic Evolution of Financial Markets 41
flect newly identified practices like quote stuffing” rather than imposing “new, overly
burdensome regulation”.
2.2.4 Case Study: HFT and Liquidity
The case study on the HFT contribution to market quality makes use of a subset of
the transaction data analyzed in Section 3 and uses quote data from NASDAQ. The
data sample consists of trade and quote data of three weeks between 2008 and 2010,
specifically September 15-19, 2008, October 05-09, 2009, and February 22-26, 2010.
The dataset indicates 26 HFT firms as HFT, while the non-HFT group includes the
remaining trading firms. While the non-HFT group includes more than 1000 trading
firms on NASDAQ, the results for trading activity are limited to the interpretation of
these two groups. The trade data contains identifiers that characterize the liquidity
demander and provider of the trade as HFT and non-HFT. The specific trade types are
HH, HN, NH, and NN, with HH for example involving HFT as liquidity demander
as well as liquidity supplier. The quote data contains best bid and ask prices and sizes
quoted by HFT as well as non-HFT. Trade and quote data is on a millisecond basis.
The original stock sample of 120 stocks is the result of a random pick to ensure an
unbiased sample. Stocks with less than 10 transactions per day and with less than
one trade per day that involves HFT within the sample period are deleted.
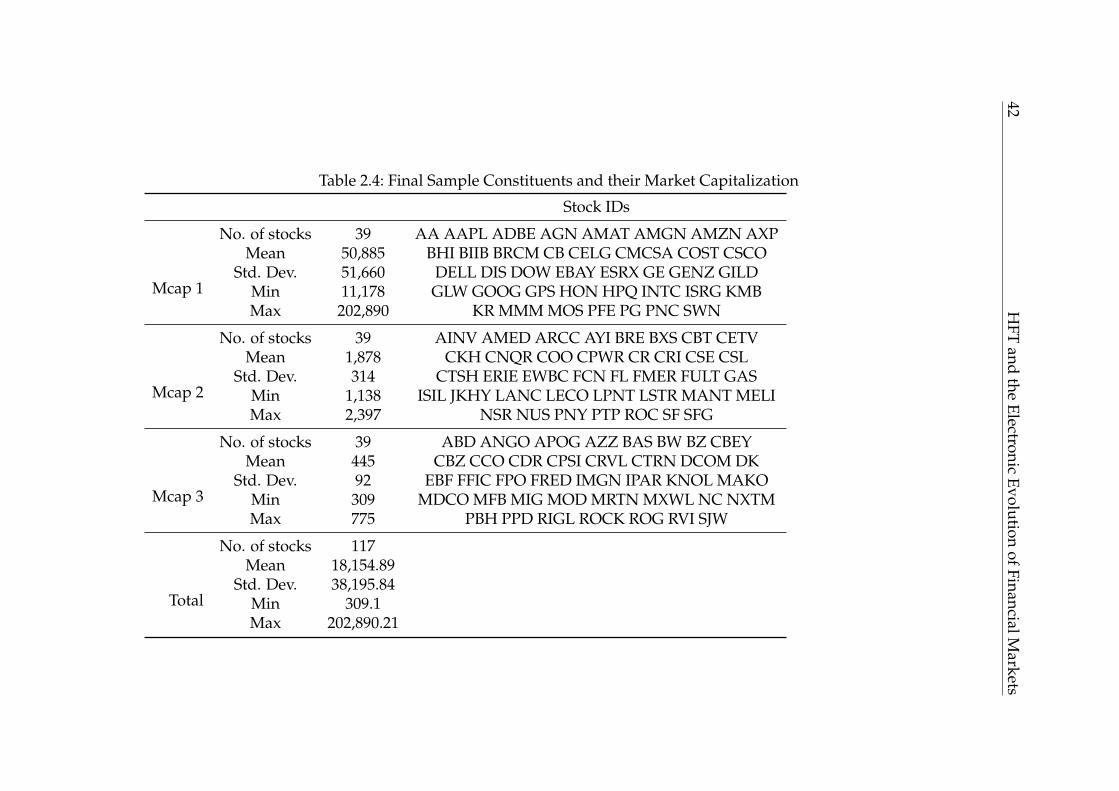
42H
FTand
theElectronic
EvolutionofFinancialM
arkets
Table 2.4: Final Sample Constituents and their Market Capitalization
Stock IDs
Mcap 1
No. of stocks 39 AA AAPL ADBE AGN AMAT AMGN AMZN AXPMean 50,885 BHI BIIB BRCM CB CELG CMCSA COST CSCO
Std. Dev. 51,660 DELL DIS DOW EBAY ESRX GE GENZ GILDMin 11,178 GLW GOOG GPS HON HPQ INTC ISRG KMBMax 202,890 KR MMM MOS PFE PG PNC SWN
Mcap 2
No. of stocks 39 AINV AMED ARCC AYI BRE BXS CBT CETVMean 1,878 CKH CNQR COO CPWR CR CRI CSE CSL
Std. Dev. 314 CTSH ERIE EWBC FCN FL FMER FULT GASMin 1,138 ISIL JKHY LANC LECO LPNT LSTR MANT MELIMax 2,397 NSR NUS PNY PTP ROC SF SFG
Mcap 3
No. of stocks 39 ABD ANGO APOG AZZ BAS BW BZ CBEYMean 445 CBZ CCO CDR CPSI CRVL CTRN DCOM DK
Std. Dev. 92 EBF FFIC FPO FRED IMGN IPAR KNOL MAKOMin 309 MDCO MFB MIG MOD MRTN MXWL NC NXTMMax 775 PBH PPD RIGL ROCK ROG RVI SJW
Total
No. of stocks 117Mean 18,154.89
Std. Dev. 38,195.84Min 309.1Max 202,890.21
HFT and the Electronic Evolution of Financial Markets 43
The final data sample consists of 117 Russell 3000 stocks. Table 2.4 presents sample
constituents and their statistics. The values of market capitalization (Mcap) are in
$ million. The sample contains large companies with a high market capitalization,
e.g. General Electric Company and Apple Inc., as well as smaller companies with a
low market capitalization, e.g. Acco Brands Corp. and Maxwell Technologies Inc.
The sample is ranked by their average market capitalization (Mcap) over the entire
sample. It is further categorized into three market capitalization groups: Mcap 1 (39
stocks with the highest Mcap), Mcap 2 (39 stocks with medium Mcap), and Mcap 3
(39 stocks with low Mcap).
NASDAQ itself is the world’s largest exchange company and has over 20% of the
market share in listed U.S. equity. It is a fully electronic market, with trading hours
from 9:30 a.m. to 16:00 p.m. There are call auctions, called “crosses”, throughout
the day: an opening cross at 9:30 a.m., a closing cross at 4:00 p.m., as well as three
intraday crosses. This study focuses only on continuous trading periods, thus the
first and last fifteen minutes of the trading period are deleted in order to avoid data
errors from opening and closing procedures.
The descriptives give insight about the contribution of HFT on market quality. The
contribution of HFT to market quality as compared to non-HFT is evaluated, grouped
by the categories market activity and liquidity. Robust Thompson clustered standard
errors are applied to test for significance of the differences between HFT and non-HFT
measures (c.f. Thompson, 2011).
Table 2.5 presents the contribution of HFT to market activity. Measures of trading
activity and quoting activity are distinguished. Hinit and Ninit indicate that the trade
initiator is a HFT and non-HFT respectively, while Hpass and Npass indicate whether
the passive order was from a HFT or a non-HFT. The difference between Hinit and
Ninit as well as Hpass and Npass is shown in the column Diff with the t-statistic in
parentheses. Turnover is the average daily trading volume in $ million, Trade Count
the average number of trades per day, Trade Size the average number of shares per
trade, and Quote Frequency the total number of price and volume updates per day.
Quote Frequency is grouped by the initiator of the quote update, i.e. HFT (Hinit)
or non-HFT (Ninit). ***, **, and * denote significance at the 1%, 5%, and 10% level
44 HFT and the Electronic Evolution of Financial Markets
respectively.
HFT initiate a smaller portion of the trades, in terms of turnover and trade count,
and that they use smaller initiating orders. Non-HFT make up around 55% of the
total turnover in the sample period and they also initiate 54% of the trades. Although
this result is counterintuitive, I have previously pointed out limitations relating to the
data. The comparison of the group HFT consisting of 26 HFT firms and the remaining
firms demonstrates that turnover and trade count per firm is actually higher for HFTs.
Therefore these results on trading activity provide an additional reference point to
interpret the following results. As expected from the previous discussions of trade
characteristics and definition of HFT, trades initiated by HFT involve a smaller trade
size measured in number of shares. The right part of the table presents results for
trading activity grouped by the passive side of a trade. Although HFT provide less
liquidity in terms of turnover, they provide liquidity more often than non-HFT, as
shown in the results for trade count. The smaller turnover can be related to the
smaller trade size, from which one can infer that HFT trade smaller order sizes when
they demand and supply liquidity.
The quoting activity is measured by the number of price and volume updates per
day. The number of quote updates initiated by HFT is threefold the number of quote
updates initiated by non-HFT. From the results for trading activity and quoting ac-
tivity, one can infer a significant amount of market making strategies by HFTs since
HFTs supply a similar amount of liquidity in terms of trade count, but provide less
liquidity in terms of turnover. This is accompanied by a smaller trade size and a high
quoting activity.
In order to analyze how HFT influence the total liquidity provision and liquidity
demand of the market, quote- and trade-based measures are separated in Table 2.6.
Quote-based measures are grouped by HFT (NHFT), which denotes the case when
HFT (non-HFT) provide liquidity on both sides of the spread, i.e. supply liquidity
at the best bid and ask price. For trade-based measures, Hinit and Ninit indicate that
the trade initiator is a HFT and non-HFT respectively, while Hpass and Npass indicate
whether the passive order was from a HFT or a non-HFT. Diff is the difference be-
tween Hinit and Ninit, as well as Hpass and Npass respectively. ***, **, and * denote
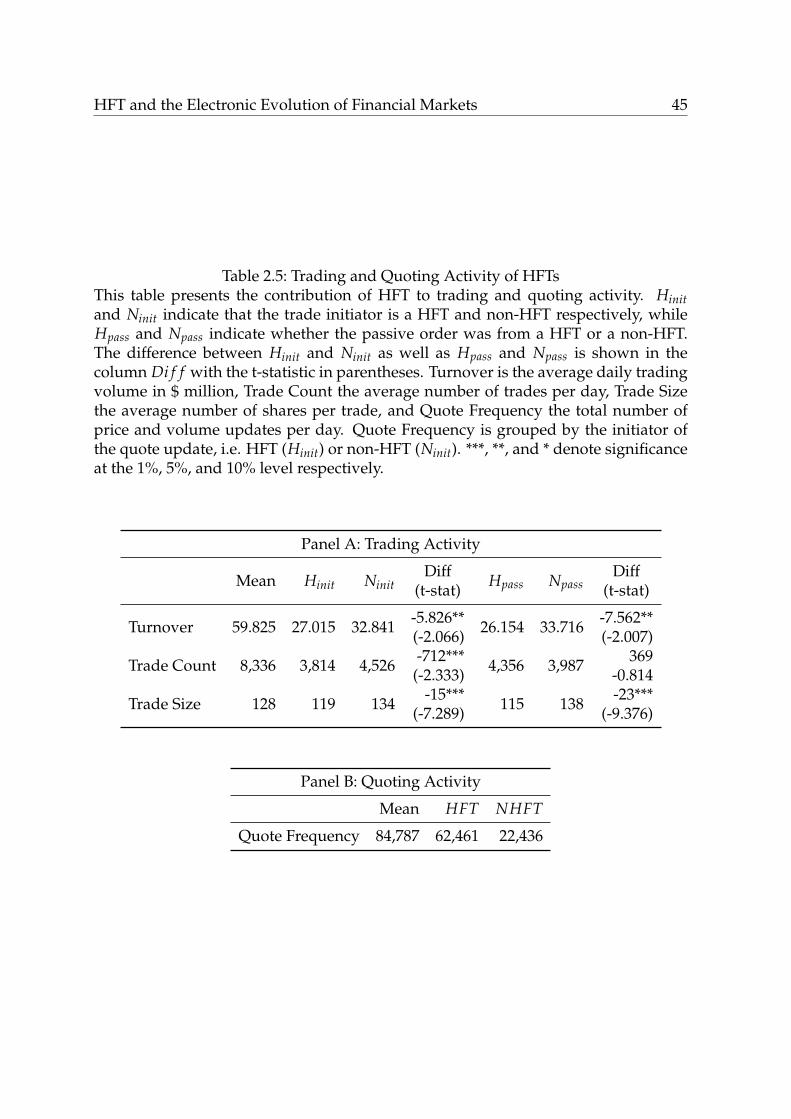
HFT and the Electronic Evolution of Financial Markets 45
Table 2.5: Trading and Quoting Activity of HFTsThis table presents the contribution of HFT to trading and quoting activity. Hinitand Ninit indicate that the trade initiator is a HFT and non-HFT respectively, whileHpass and Npass indicate whether the passive order was from a HFT or a non-HFT.The difference between Hinit and Ninit as well as Hpass and Npass is shown in thecolumn Di f f with the t-statistic in parentheses. Turnover is the average daily tradingvolume in $ million, Trade Count the average number of trades per day, Trade Sizethe average number of shares per trade, and Quote Frequency the total number ofprice and volume updates per day. Quote Frequency is grouped by the initiator ofthe quote update, i.e. HFT (Hinit) or non-HFT (Ninit). ***, **, and * denote significanceat the 1%, 5%, and 10% level respectively.
Panel A: Trading Activity
Mean Hinit NinitDiff Hpass Npass
Diff(t-stat) (t-stat)
Turnover 59.825 27.015 32.841 -5.826** 26.154 33.716 -7.562**(-2.066) (-2.007)
Trade Count 8,336 3,814 4,526 -712*** 4,356 3,987 369(-2.333) -0.814
Trade Size 128 119 134 -15*** 115 138 -23***(-7.289) (-9.376)
Panel B: Quoting Activity
Mean HFT NHFT
Quote Frequency 84,787 62,461 22,436
46 HFT and the Electronic Evolution of Financial Markets
significance at the 1%, 5%, and 10% level respectively.
The quoted spread in case HFTs provide liquidity on both sides of the market is
significantly higher compared to the case when non-HFT are on both sides of the
market, while the depth is significantly lower when HFT are best on both sides of
the market. This means that HFT provide liquidity when the market is less liquid,
meaning that liquidity is rather expensive since quoted spreads are higher and depth
is lower. The trade-based measures are determinants when HFT initiate trades and
when they provide liquidity. The spread measures are all significantly lower when
HFT initiate a trade, which means that they trade more aggressively when liquidity is
cheap. As for the liquidity supply of HFT, there is a confirmation on the observation
that HFT supply liquidity when it is expensive. They provide liquidity in case of
significantly higher quoted spread at trade and effective spreads as well as lower
depth.
2.3 Summary
This chapter discussed the technological and economic aspects of the electronic evo-
lution and the technological innovation HFT. The first section concerning the elec-
tronic evolution gives insight into the different technological and economic factors
involved in the improvement of market quality.
While HFT is currently undergoing more regulatory inspections, it is still a major
driver for technological and economic advances in electronic trading. This is espe-
cially shown by the developments of internal market structure, specifically IT system,
business structure, and market microstructure. HFT challenges marketplaces to im-
prove and invest in their IT system in order to meet the needs of computer traders.
Additionally, these marketplaces also adapt their business structure in order to attract
HFT and adjust their market microstructure to make this kind of trading possible and
safe. The adaptations of the internal market structure as well the increased HFT ac-
tivity had different effects on market quality. The empirical results indicate the con-
tribution of HFT and non-HFT to different extents on different measures of market
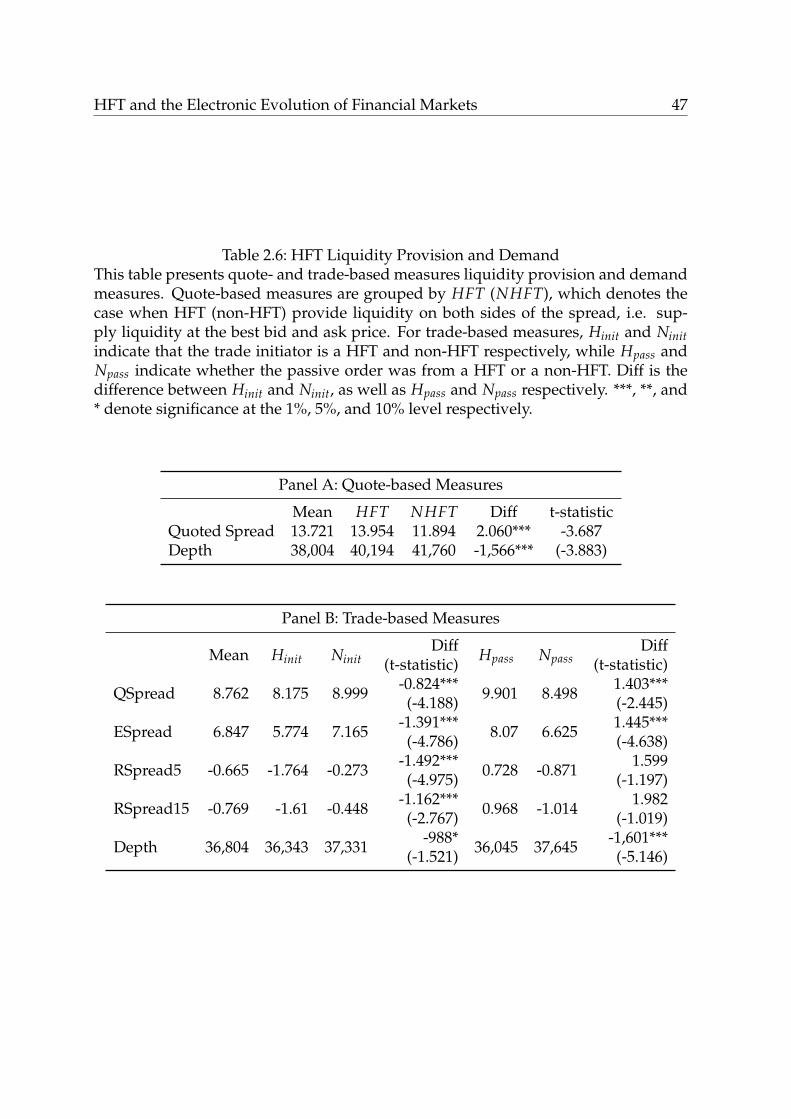
HFT and the Electronic Evolution of Financial Markets 47
Table 2.6: HFT Liquidity Provision and DemandThis table presents quote- and trade-based measures liquidity provision and demandmeasures. Quote-based measures are grouped by HFT (NHFT), which denotes thecase when HFT (non-HFT) provide liquidity on both sides of the spread, i.e. sup-ply liquidity at the best bid and ask price. For trade-based measures, Hinit and Ninitindicate that the trade initiator is a HFT and non-HFT respectively, while Hpass andNpass indicate whether the passive order was from a HFT or a non-HFT. Diff is thedifference between Hinit and Ninit, as well as Hpass and Npass respectively. ***, **, and* denote significance at the 1%, 5%, and 10% level respectively.
Panel A: Quote-based Measures
Mean HFT NHFT Diff t-statisticQuoted Spread 13.721 13.954 11.894 2.060*** -3.687Depth 38,004 40,194 41,760 -1,566*** (-3.883)
Panel B: Trade-based Measures
Mean Hinit NinitDiff Hpass Npass
Diff(t-statistic) (t-statistic)
QSpread 8.762 8.175 8.999 -0.824*** 9.901 8.498 1.403***(-4.188) (-2.445)
ESpread 6.847 5.774 7.165 -1.391*** 8.07 6.625 1.445***(-4.786) (-4.638)
RSpread5 -0.665 -1.764 -0.273 -1.492*** 0.728 -0.871 1.599(-4.975) (-1.197)
RSpread15 -0.769 -1.61 -0.448 -1.162*** 0.968 -1.014 1.982(-2.767) (-1.019)
Depth 36,804 36,343 37,331 -988* 36,045 37,645 -1,601***(-1.521) (-5.146)
48 HFT and the Electronic Evolution of Financial Markets
quality. In general, a significant amount of HFT engages in market making strategies.
They provide liquidity when it is expensive and demand liquidity when it is cheap,
which is also in line with the results of Hendershott and Riordan (2009) and support
the existing results in academic literature that found predominantly positive effects
of HFT. It is shown that a majority of HFT apply market making strategies and that
only 26 HFT firms make up more than 40% of the total trading volume in the data
sample. This result shows the importance of HFT and adds to the concern whether
such a large amount of trading volume coming from a small group of traders could
pose systemic risk to financial markets.
Chapter 3
HFT and Information Processing
In recent years, the nature of information flow and its role in financial markets have
significantly changed. The growing amount and complexity of information accessible
have reached the human boundaries of information processing capacity. Thus, more
computer algorithms are used in order to process large amounts of data in less time.
One specific group of computer trading algorithms are HFTs. Common information
processing strategies applied by HFTs are arbitrage and news trading strategies. Sta-
tistical arbitrage realizes profits from mispricings between different assets. Index
arbitrage, being a subset of statistical arbitrage, focuses on mispricings between an
index (such as the S&P 500 or the market volatility index VIX) and its components.
In the context of qualitative textual information, recent investments in the area of
machine-readable news have made the automation of news information processing
and thus computerized trading on this information easier (cf. New York Times, 2010).
Recent investments have been made by NASDAQ and Deutsche Börse in 2011 to in-
tegrate machine-readable economic news into their line of services offered for trading
firms and specifically automated traders (Wall Street Journal, 2011b).
In this chapter, I analyze the use of “hard” futures price information for index ar-
bitrage strategies and the use of “soft” textual news information for news trading
strategies by HFTs and non-HFTs and implications for price discovery and trading
profits. Petersen (2004) characterizes “hard” information as quantitative and easily
processable and storable by computers, while “soft” information is qualitative and
harder to interpret by computers. Based on this classification, I focus on the follow-
49
50 HFT and Information Processing
ing research questions:
Research Question 3a: What is the market impact of hard and soft information
events?
Research Question 3b: How do HFT and NHFT process hard and soft infor-
mation shocks?
Research Question 3c: What is the value of speed in information processing?
I have three major findings: Firstly, I show that HFTs dominate non-HFTs in pro-
cessing hard information. Their reaction to hard information is stronger than the
reaction of non-HFTs. Specifically, they react strongly to hard information within 10
seconds and sell out their trading position within 2 minutes. Thereby, they function
as “messengers” between the futures and stock market and create a stronger linkage
between both markets. Secondly, I demonstrate that speed matters for information
processing and for realizing trading gains because of very high realized and fictitious
trading profits within the first 10 seconds. Thirdly, I find no evidence for automated
news trading by HFTs, but rather a dominance of non-HFTs in processing soft news
information. In the context of soft information, speed plays a less important role and
the trading profits are comparably lower.
These results suggest a split of the trading world: On one side, the high frequency
world is dominated by HFTs which specialize in the processing of hard information
within a short amount of time. On the other side, the low-frequency world is still
dominated by non-HFTs that have better information processing abilities with re-
spect to soft information and engage in strategies for longer periods than HFTs. I
follow the classification of hard and soft information that is suggested in Jovanovic
and Menkveld (2012) in a HFT context. A similar dimension of information classifi-
cation is introduced by Martinez and Rosu (2013) with the level of “news precision”.
I confirm the theoretical findings of Martinez and Rosu (2013) and Foucault et al.
(2013) on a higher HFT activity and informed variance ratio with increased news pre-
cision. I further provide evidence of larger effects in periods of heightened volatility
as shown by Foucault et al. (2013): For high volatility periods, short-term HFT net
HFT and Information Processing 51
trading in the direction of the information event are even higher than for low volatil-
ity periods as well as trading profits, which makes higher speed and trading volume
even more important.
Furthermore, I provide further insight into the price discovery process of and the
role HFTs play in interlinked markets. The lead-lag relationship between the futures
and stock market has been well-documented in finance literature, such as by Has-
brouck (2003) and Theissen (2012). In this context, I show that HFTs strengthen the
interlinkage and contribute to a higher efficiency between both markets.
3.1 Related Literature
A major concern of regulatory authorities, such as the U.S. Securities and Exchange
Commission (SEC) and the US Commodity Futures Trading Commission (CFTC), is
the influence of HFT on market quality and price discovery (cf. the call for comments
of the SEC, 2010). This study relates to HFT literature on information and price dis-
covery as well as literature on different categories of information events (hard and
soft).
3.1.1 HFT and Price Discovery
Empirical evidence shows that HFT contributes to price discovery and improve price
efficiency. Brogaard et al. (2013) use a state space model to decompose the market
return time series into a transitory component (i.e. pricing errors) and a permanent
component (i.e. permanent price changes). They find a positive relationship of HFT
initiated trades with permanent price changes, while HFT passive trades are posi-
tively related to pricing errors. They further find an increase in trades initiated by
HFTs after macroeconomic news. O’Hara et al. (2011) study the contribution of odd-
lot trades1 to price discovery. They show that odd-lot trades account for 30% of price
discovery. Chaboud et al. (2013) find that AT increase price efficiency in FX markets
1Odd-lot trades are trades below 100 shares. They are often used by Algorithmic Traders (ATs) andHFTs as a result of slicing large orders into smaller ones in order to hide trading intentions.
52 HFT and Information Processing
by applying triangular arbitrage strategies. I strengthen previous results by showing
that HFTs also engage in index arbitrage strategies and thus create an efficient linkage
between futures and stock markets.
The results are closely related to the theoretical findings of Martinez and Rosu
(2013) and Foucault et al. (2013), and empirical findings of Jovanovic and Menkveld
(2012). Martinez and Rosu (2013) show that with increasing news precision, trading
volume, and the informed variance ratio increases. Foucault et al. (2013) compare
two models based on the model by Kyle (1985): one “fast” model in which the in-
formed trader has a speed advantage in addition to his superior information process-
ing possibilities and one benchmark model without speed advantage. Jovanovic and
Menkveld (2012) find a positive relationship between HFT activity and hard informa-
tion days.
In order to estimate the value of speed, I further study HFT profits after informa-
tion events. General HFT profits are studied by Menkveld (2013) who analyzes the
influence and profitability of a HFT market-maker on Chi-X. Baron et al. (2012) fur-
ther analyze HFT profitability in the E-mini futures markets and the time-horizon of
profitability. In contrast to these studies, I concentrate on trading profits of HFT after
information events.
3.1.2 Categories of Information Events
Various types of information events and their effect on financial markets have been
analyzed in finance literature, for example earnings announcements, macroeconomic
news, and stock-specific news arrivals among others.
The studied information events can be classified into hard and soft information
according to Petersen (2004). He characterizes hard information as quantitative and
easily processable and storable by computers, such as stock prices and market indices.
On the contrary, soft information is qualitative and hard to interpret by computers,
e.g. news ticker items, blog posts or even Twitter messages. The distinction between
hard and soft information can be ambiguous: Futures returns are quantitative infor-
mation and can be interpreted relatively easily, while VIX returns, however quanti-
HFT and Information Processing 53
tative, involves a higher uncertainty of interpretation and prediction of subsequent
market reactions than of futures shocks.
In the context of machine-readable news, Petersen (2004) mentions the possibility
of hardening soft information with the use of algorithms. The automatic transfor-
mation of textual information into numbers has made the border between hard and
soft information more blurred and offers opportunities to include this information in
trading strategies. I argue that although certain sentiment and relevance measures of
the news dataset might be included into automated strategies, the interpretation and
use of the measures is still ambiguous and thus qualify as soft information.
The classification of hard and soft information is also applied by Jovanovic and
Menkveld (2012) and Engelberg (2008). Jovanovic and Menkveld (2012) find a posi-
tive relationship between HFT activity and hard information days. Engelberg (2008)
extracts a hard and a soft information component of earnings announcements. The
hard information component is based on accounting data while the soft component
is based on the text of news articles on the earnings announcement.
Literature on soft information uses different information types, such as a Wall Street
Journal column (Tetlock, 2007), newswire messages (Tetlock, 2010), and Internet stock
messages boards (Antweiler and Frank, 2004). Current research in computer science
is further evolving to use social media, such as Twitter messages, to predict box-
office revenues for movies (Asur, 2010) and market returns (Bollen et al., 2011). In
this study, I focus on Reuters news ticker data which is described in the following
section.
3.2 Data and Sample Descriptives
There are few datasets available that directly identify AT and HFT. Datasets used in
research often use proxies for HFT and AT (such as Hendershott et al., 2011; Has-
brouck and Saar, 2013). Only recently, data with specific AT and HFT identifiers has
become available. Hendershott and Riordan (2009) use data from Deutsche Börse in
Germany. The same dataset as in this study is also used for research by Brogaard et al.
(2013) and O’Hara et al. (2011).
54 HFT and Information Processing
I match the high frequency information datasets with a proprietary HFT dataset
provided by NASDAQ.2 Trade data is tick-by-tick data time-stamped to milliseconds
and identifies the liquidity demander and liquidity supplier of a trade as a HFT or
non-HFT. It covers the years 2008 and 2009. The information datasets include ab-
normally high and low S&P 500 futures returns and VIX returns as hard information
shocks and Reuters news ticker data as soft information shocks.
3.2.1 Sample Descriptives
I restrict my data sample to 40 stocks listed in the S&P 500 index which provide a
sufficiently high number of high frequency trades and news items. Descriptives of
the data sample are shown in Table 3.1.
The trading volume in “Traded Shares” shows that the NASDAQ trading volume
in this sample represents around 30% of the total volume of sample stocks. The min-
imum number of HF trades per day is 125; thus the chosen sample provides suffi-
cient observations for analysis. The final stock sample consists of 40 stocks listed
in the S&P 500 index: 20 listed on NYSE and 20 listed on NASDAQ. The complete
list of sample stocks and relative portion of HFT can be found in Appendix A.1,
Table A.1. Sample stocks are highly capitalized with an average of $47 billion. I dis-
tinguish between the HFT group demanding liquidity (HFTinit) and supplying liq-
uidity (HFTpass) as well as the corresponding non-HFT group demanding liquidity
(NHFTinit) and supplying liquidity (NHFTpass). Only continuous trading is consid-
ered in order to measure the direct intra-day reaction after an information event. The
first and last five minutes of each trading day are omitted in order to leave out trad-
ing on overnight information and biases associated with market opening and closing.
Thus, the data spans the time interval from 9:35 a.m. to 3:55 p.m.
2I thank Frank Hathaway and Jeff Smith for providing access to the data as well as Terrence Hen-dershott and Ryan Riordan for compiling the dataset. For further information on the dataset seeBrogaard et al. (2013).
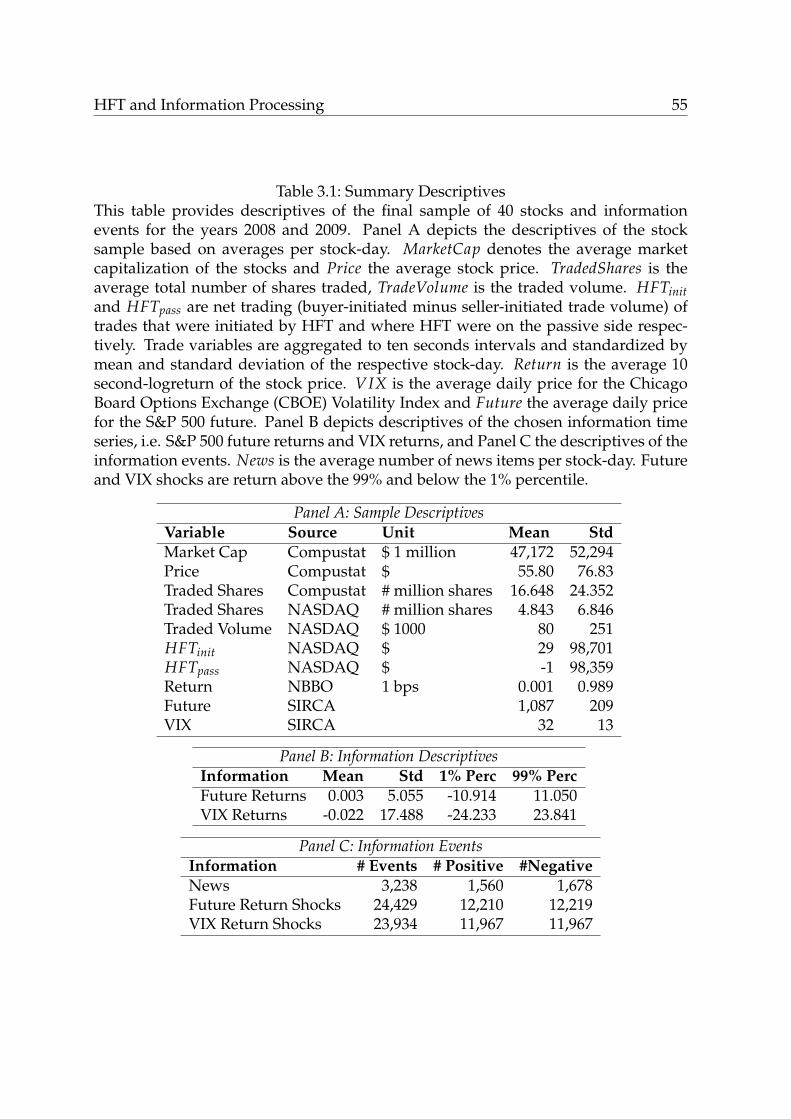
HFT and Information Processing 55
Table 3.1: Summary DescriptivesThis table provides descriptives of the final sample of 40 stocks and informationevents for the years 2008 and 2009. Panel A depicts the descriptives of the stocksample based on averages per stock-day. MarketCap denotes the average marketcapitalization of the stocks and Price the average stock price. TradedShares is theaverage total number of shares traded, TradeVolume is the traded volume. HFTinitand HFTpass are net trading (buyer-initiated minus seller-initiated trade volume) oftrades that were initiated by HFT and where HFT were on the passive side respec-tively. Trade variables are aggregated to ten seconds intervals and standardized bymean and standard deviation of the respective stock-day. Return is the average 10second-logreturn of the stock price. VIX is the average daily price for the ChicagoBoard Options Exchange (CBOE) Volatility Index and Future the average daily pricefor the S&P 500 future. Panel B depicts descriptives of the chosen information timeseries, i.e. S&P 500 future returns and VIX returns, and Panel C the descriptives of theinformation events. News is the average number of news items per stock-day. Futureand VIX shocks are return above the 99% and below the 1% percentile.
Panel A: Sample DescriptivesVariable Source Unit Mean StdMarket Cap Compustat $ 1 million 47,172 52,294Price Compustat $ 55.80 76.83Traded Shares Compustat # million shares 16.648 24.352Traded Shares NASDAQ # million shares 4.843 6.846Traded Volume NASDAQ $ 1000 80 251HFTinit NASDAQ $ 29 98,701HFTpass NASDAQ $ -1 98,359Return NBBO 1 bps 0.001 0.989Future SIRCA 1,087 209VIX SIRCA 32 13
Panel B: Information DescriptivesInformation Mean Std 1% Perc 99% PercFuture Returns 0.003 5.055 -10.914 11.050VIX Returns -0.022 17.488 -24.233 23.841
Panel C: Information EventsInformation # Events # Positive #NegativeNews 3,238 1,560 1,678Future Return Shocks 24,429 12,210 12,219VIX Return Shocks 23,934 11,967 11,967
56 HFT and Information Processing
3.2.2 Hard and Soft Information
Information events are manifold and can be categorized based on a number of di-
mensions. Following Petersen (2004), I distinguish between “hard” and “soft” infor-
mation events. I present three proxies for information events, futures return shocks,
news events, and VIX return shocks and discuss their characteristics in more detail.
They are derived from recent literature. I argue that all three information datasets ful-
fill the requirement for exogenous shocks in order to run a de facto impulse response
analysis in Section 3.3.2.
For hard information shocks, I choose S&P 500 futures return shocks and volatility
index (VIX) price return shocks. S&P 500 futures prices and VIX prices are collected
on a tick by tick basis from Thomson Reuters Tick History.3 Jovanovic and Menkveld
(2012) propose the R squared from a capital asset pricing model (CAPM) based on
stock returns and market futures returns as a proxy for the relevance of hard infor-
mation. Hence, I consider market futures returns as a proxy for hard information.
I exclude the first and last 5 minutes of the trading day and determine the 1% and
99% percentiles of S&P 500 futures 10 second returns over the whole observation pe-
riod. Returns above the 99% and below the 1% level are considered as futures return
shocks.
I also include VIX prices in my analyses. The VIX is published by the Chicago Board
Options Exchange (CBOE) and is constructed from the implied near-term volatility
of S&P 500 stock index option prices.4 Similar to futures returns, VIX price returns
can be easily processed by HFTs and therefore qualify as hard information. However,
the information content of a futures shock as compared to a VIX price shocks is of
a different nature with different implications for HFTs and non-HFTs. As suggested
by Foucault et al. (2013), volatility increases are followed by an increase of HFT flow
trading. I apply the same methodology as the analysis of futures returns and analyze
the relationship between abnormally high and low VIX returns and subsequent HFT
and non-HFT activity.
3I thank SIRCA for providing access to the Thomson Reuters DataScope Tick History.4VIX is widely considered as a measure for investor sentiment and market volatility, http://www.cboe.com/micro/VIX/vixintro.aspx.
HFT and Information Processing 57
News data serves as a proxy for soft information. The news dataset is provided
by Thomson Reuters and contains firm-specific newswire items time-stamped to mil-
liseconds. An exemplary news item is shown in Figure 3.1. Each news item includes
a time stamp, a stock ticker symbol (BCAST_REF), a relevance indicator, a sentiment
indicator, probabilities of the news item having a positive, neutral, or negative tone
(SENT_POS, SENT_NEUT, SENT_NEG), a linked count (LNKD_CNT1) that repre-
sents the count of linked articles in a particular time period, the PNAC (Primary
News Access Code, a semi-unique story identifier), as well as topic codes among
others. The dataset allows a differentiation of news items based on the indicators
Sentiment, and Relevance. Sentiment can be either negative (-1), neutral (0), or pos-
itive (+1) depending on the news item. Relevance is a real number on the interval
[0,1]. I only consider positive and negative news items during continuous trading
hours. Gross-Klussmann and Hautsch (2011) find a significant market reaction only
to relevant news items. Thus, I concentrate only on news items that are relevant to the
specific stock (Relevance = 1). Furthermore, news items with identical PNAC within
the same day as well as are deleted so only new information is considered.
The news dataset is professionally processed by algorithms of the Reuters News
Sentiment Engine (RNSE) which is used by practitioners and academics.
The descriptives of the chosen hard and soft information events are presented in
Table 3.1, Panel B and Panel C.
3.3 Results
This section presents the correlation results as well as results on the market impact of
hard and soft information events, the impact on HFT and NHFT net trading, contri-
bution to price discovery, and HFT profits.
3.3.1 Correlation Results
Correlation results on trading variables and information event dummies give us first
indications of trading behavior after information events. Trade variables in Panel A
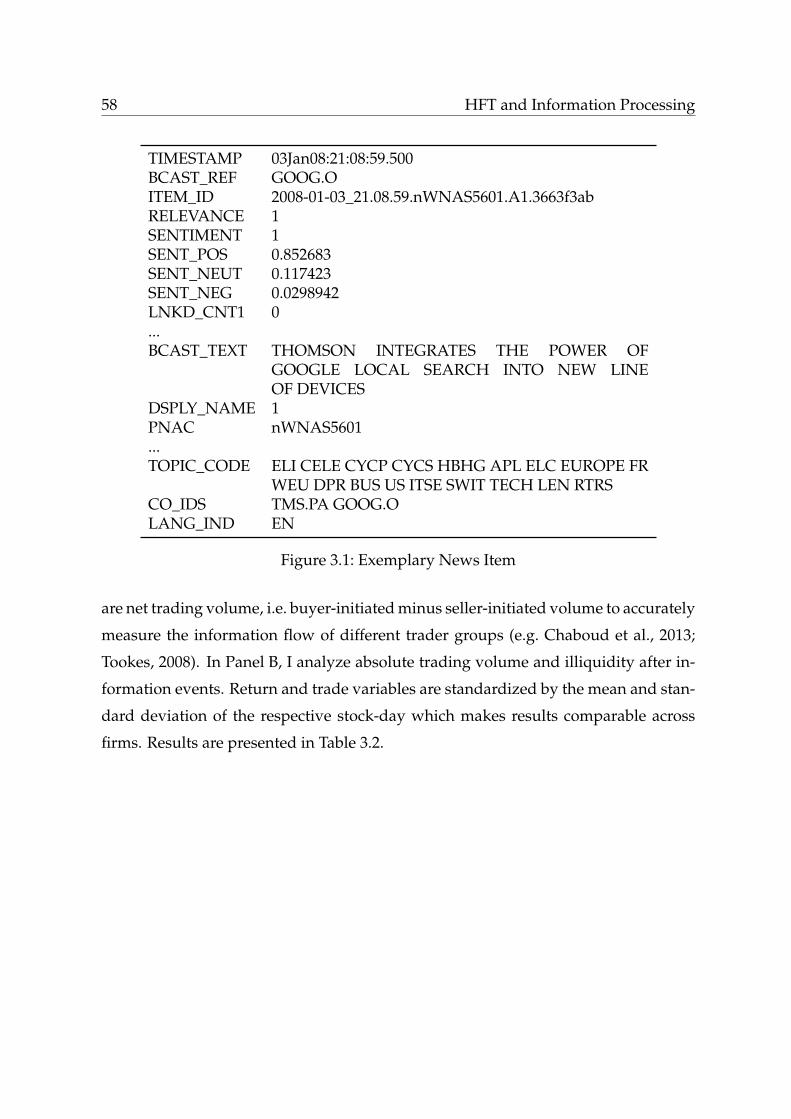
58 HFT and Information Processing
TIMESTAMP 03Jan08:21:08:59.500BCAST_REF GOOG.OITEM_ID 2008-01-03_21.08.59.nWNAS5601.A1.3663f3abRELEVANCE 1SENTIMENT 1SENT_POS 0.852683SENT_NEUT 0.117423SENT_NEG 0.0298942LNKD_CNT1 0...BCAST_TEXT THOMSON INTEGRATES THE POWER OF
GOOGLE LOCAL SEARCH INTO NEW LINEOF DEVICES
DSPLY_NAME 1PNAC nWNAS5601...TOPIC_CODE ELI CELE CYCP CYCS HBHG APL ELC EUROPE FR
WEU DPR BUS US ITSE SWIT TECH LEN RTRSCO_IDS TMS.PA GOOG.OLANG_IND EN
Figure 3.1: Exemplary News Item
are net trading volume, i.e. buyer-initiated minus seller-initiated volume to accurately
measure the information flow of different trader groups (e.g. Chaboud et al., 2013;
Tookes, 2008). In Panel B, I analyze absolute trading volume and illiquidity after in-
formation events. Return and trade variables are standardized by the mean and stan-
dard deviation of the respective stock-day which makes results comparable across
firms. Results are presented in Table 3.2.
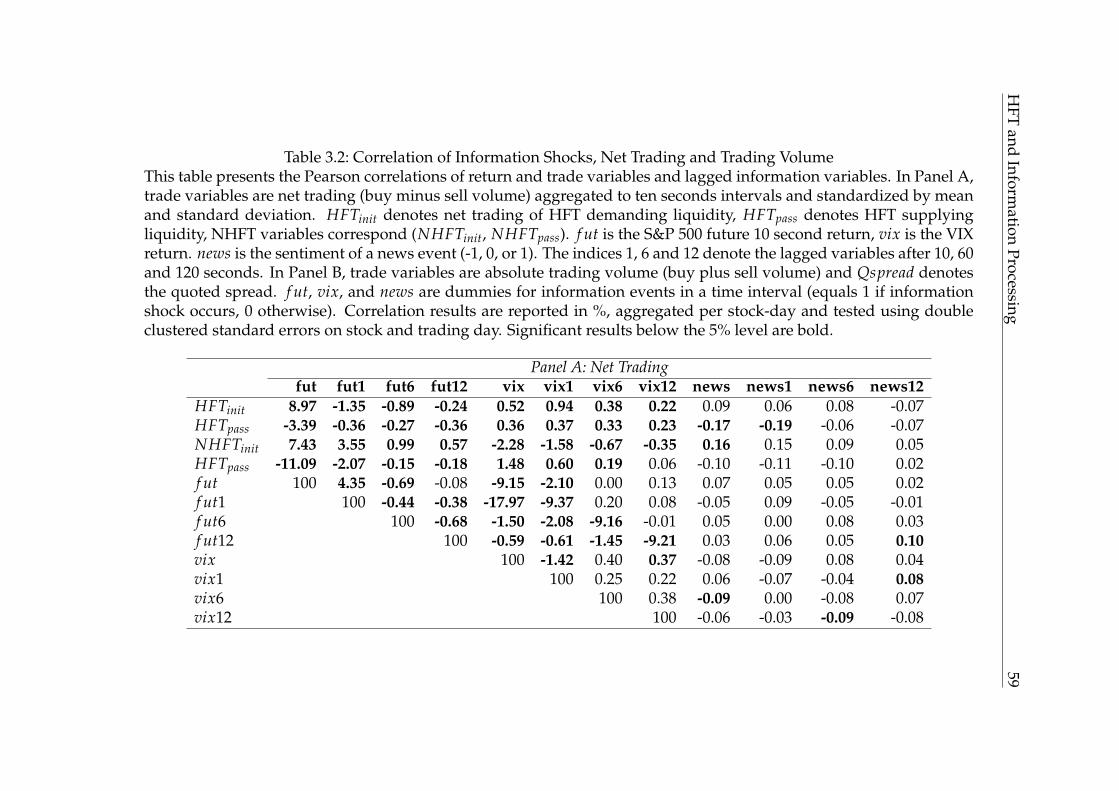
HFT
andInform
ationProcessing
59
Table 3.2: Correlation of Information Shocks, Net Trading and Trading VolumeThis table presents the Pearson correlations of return and trade variables and lagged information variables. In Panel A,trade variables are net trading (buy minus sell volume) aggregated to ten seconds intervals and standardized by meanand standard deviation. HFTinit denotes net trading of HFT demanding liquidity, HFTpass denotes HFT supplyingliquidity, NHFT variables correspond (NHFTinit, NHFTpass). f ut is the S&P 500 future 10 second return, vix is the VIXreturn. news is the sentiment of a news event (-1, 0, or 1). The indices 1, 6 and 12 denote the lagged variables after 10, 60and 120 seconds. In Panel B, trade variables are absolute trading volume (buy plus sell volume) and Qspread denotesthe quoted spread. f ut, vix, and news are dummies for information events in a time interval (equals 1 if informationshock occurs, 0 otherwise). Correlation results are reported in %, aggregated per stock-day and tested using doubleclustered standard errors on stock and trading day. Significant results below the 5% level are bold.
Panel A: Net Tradingfut fut1 fut6 fut12 vix vix1 vix6 vix12 news news1 news6 news12
HFTinit 8.97 -1.35 -0.89 -0.24 0.52 0.94 0.38 0.22 0.09 0.06 0.08 -0.07HFTpass -3.39 -0.36 -0.27 -0.36 0.36 0.37 0.33 0.23 -0.17 -0.19 -0.06 -0.07NHFTinit 7.43 3.55 0.99 0.57 -2.28 -1.58 -0.67 -0.35 0.16 0.15 0.09 0.05HFTpass -11.09 -2.07 -0.15 -0.18 1.48 0.60 0.19 0.06 -0.10 -0.11 -0.10 0.02f ut 100 4.35 -0.69 -0.08 -9.15 -2.10 0.00 0.13 0.07 0.05 0.05 0.02f ut1 100 -0.44 -0.38 -17.97 -9.37 0.20 0.08 -0.05 0.09 -0.05 -0.01f ut6 100 -0.68 -1.50 -2.08 -9.16 -0.01 0.05 0.00 0.08 0.03f ut12 100 -0.59 -0.61 -1.45 -9.21 0.03 0.06 0.05 0.10vix 100 -1.42 0.40 0.37 -0.08 -0.09 0.08 0.04vix1 100 0.25 0.22 0.06 -0.07 -0.04 0.08vix6 100 0.38 -0.09 0.00 -0.08 0.07vix12 100 -0.06 -0.03 -0.09 -0.08
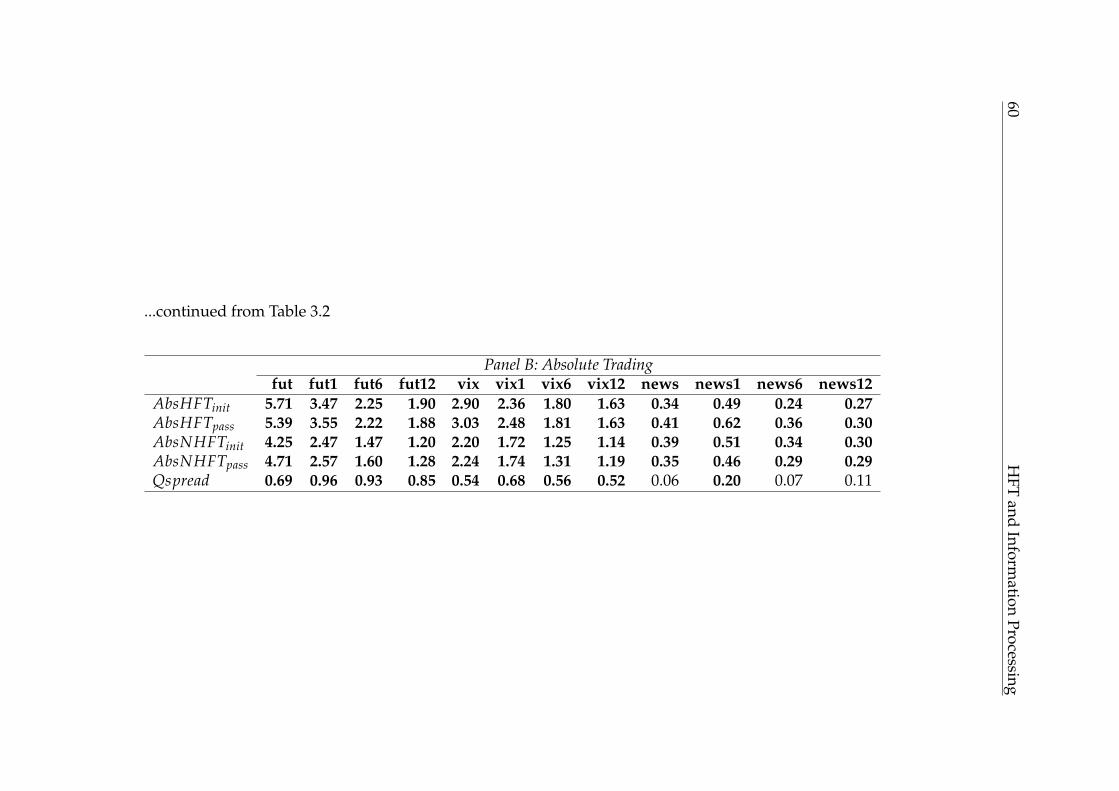
60H
FTand
Information
Processing
...continued from Table 3.2
Panel B: Absolute Tradingfut fut1 fut6 fut12 vix vix1 vix6 vix12 news news1 news6 news12
AbsHFTinit 5.71 3.47 2.25 1.90 2.90 2.36 1.80 1.63 0.34 0.49 0.24 0.27AbsHFTpass 5.39 3.55 2.22 1.88 3.03 2.48 1.81 1.63 0.41 0.62 0.36 0.30AbsNHFTinit 4.25 2.47 1.47 1.20 2.20 1.72 1.25 1.14 0.39 0.51 0.34 0.30AbsNHFTpass 4.71 2.57 1.60 1.28 2.24 1.74 1.31 1.19 0.35 0.46 0.29 0.29Qspread 0.69 0.96 0.93 0.85 0.54 0.68 0.56 0.52 0.06 0.20 0.07 0.11
HFT and Information Processing 61
The results in Panel A show positive contemporaneous correlations of HFT initi-
ated volume (HFTinit) and non-HFT initiated volume (NHFTinit) with futures shocks
and negative correlations with the corresponding passive trade variables (HFTpass
and NHFTpass). VIX returns are positively related to HFTinit and HFTpass for all lags
and negatively to initiating non-HFT volume. News sentiment has the highest pos-
itive relationship with NHFTinit. In order to rule out interrelationships between the
information events, I also compute correlations of futures and VIX returns and news
sentiment. Correlations with news sentiment are negative and low, with the max-
imum correlation being 0.16% for both futures and VIX and the minimum being -
0.19%. In conclusion, I find low correlations between the chosen information events
and thus low interrelationships between them.
In Panel B, I present results for absolute trading variables. According to findings by
Martinez and Rosu (2013), trading volume and illiquidity increase with news preci-
sion. Equating news precision with the hardness of information, I can confirm these
findings: I see a higher effect on absolute trading volume and on illiquidity5 after
hard futures shocks and a lower effect after soft news shocks.
3.3.2 Impact of Information Events on Returns and Net Trading
In order to answer the question what type of impact information events have on stock
returns and trading behavior, I implement a VARX model based on models of Has-
brouck (1991a) and Chaboud et al. (2013). The VARX model includes three time series:
one for stock returns, one for HFT order flow, and one for non-HFT order flow. I con-
trol for k lags of stock return, HFT order flow, and non-HFT order flow. The relevant
lags after an information shock are denoted by W. The coefficients of interest are φri,w,
φhi,w and φn
i,w which represent stock return as well as HFT and non-HFT net trading
after exogenous information shocks. The subscript i denotes the stock, w denotes lags
after an information event.
The VARX model is implemented as follows:
5The quoted spread is computed as Qspreadi,t = (AskPricei,t− BidPricei,t)/Midi,t for stock i and timet. Qspread is a measure for execution costs of a trade and thus for market illiquidity.
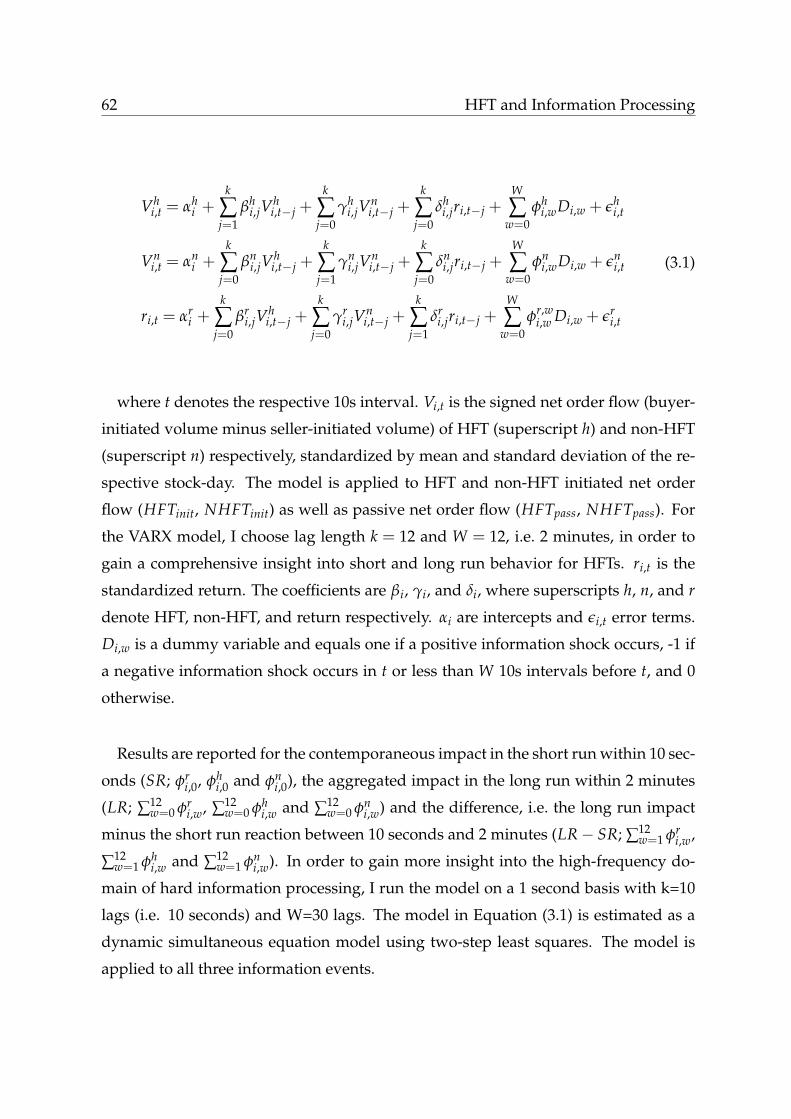
62 HFT and Information Processing
Vhi,t = αh
i +k
∑j=1
βhi,jV
hi,t−j +
k
∑j=0
γhi,jV
ni,t−j +
k
∑j=0
δhi,jri,t−j +
W
∑w=0
φhi,wDi,w + εh
i,t
Vni,t = αn
i +k
∑j=0
βni,jV
hi,t−j +
k
∑j=1
γni,jV
ni,t−j +
k
∑j=0
δni,jri,t−j +
W
∑w=0
φni,wDi,w + εn
i,t
ri,t = αri +
k
∑j=0
βri,jV
hi,t−j +
k
∑j=0
γri,jV
ni,t−j +
k
∑j=1
δri,jri,t−j +
W
∑w=0
φr,wi,w Di,w + εr
i,t
(3.1)
where t denotes the respective 10s interval. Vi,t is the signed net order flow (buyer-
initiated volume minus seller-initiated volume) of HFT (superscript h) and non-HFT
(superscript n) respectively, standardized by mean and standard deviation of the re-
spective stock-day. The model is applied to HFT and non-HFT initiated net order
flow (HFTinit, NHFTinit) as well as passive net order flow (HFTpass, NHFTpass). For
the VARX model, I choose lag length k = 12 and W = 12, i.e. 2 minutes, in order to
gain a comprehensive insight into short and long run behavior for HFTs. ri,t is the
standardized return. The coefficients are βi, γi, and δi, where superscripts h, n, and r
denote HFT, non-HFT, and return respectively. αi are intercepts and εi,t error terms.
Di,w is a dummy variable and equals one if a positive information shock occurs, -1 if
a negative information shock occurs in t or less than W 10s intervals before t, and 0
otherwise.
Results are reported for the contemporaneous impact in the short run within 10 sec-
onds (SR; φri,0, φh
i,0 and φni,0), the aggregated impact in the long run within 2 minutes
(LR; ∑12w=0 φr
i,w, ∑12w=0 φh
i,w and ∑12w=0 φn
i,w) and the difference, i.e. the long run impact
minus the short run reaction between 10 seconds and 2 minutes (LR− SR; ∑12w=1 φr
i,w,
∑12w=1 φh
i,w and ∑12w=1 φn
i,w). In order to gain more insight into the high-frequency do-
main of hard information processing, I run the model on a 1 second basis with k=10
lags (i.e. 10 seconds) and W=30 lags. The model in Equation (3.1) is estimated as a
dynamic simultaneous equation model using two-step least squares. The model is
applied to all three information events.
HFT and Information Processing 63
Impact on Stock Returns
Firstly, I characterize the chosen information events with respect to their impact on
stock returns. The model in Equation (3.1) is applied to the sum of HFT initiated and
passive net order flow (HFTall = HFTinit + HFTpass) as well as non-HFT order flow
(NHFTall = NHFTinit + NHFTpass).6 Table 3.3 presents the aggregated coefficients of
the VARX model for stock returns of the sample from 2008-2009.
From the results in 3.3, I can infer that the impact of futures shocks on stock returns
is highest in the short run, while the impact of news events is increasing in the long
run. VIX shocks do lead to a slight decrease in stock returns which also goes along
with the negative correlation of VIX returns and futures returns.
Figure 3.2 gives more insight into the high-frequency impact on stock returns, with
the highest impact during the first 5 seconds. Thus, hard futures shocks seem to have
a high impact on stock returns in the short run while the impact of news events is
higher in the long run.
6Applying the model only to initiating (HFTinit and NHFTinit) net order flow or passive net orderflow (HFTpass and NHFTpass) does not yield qualitatively different results.
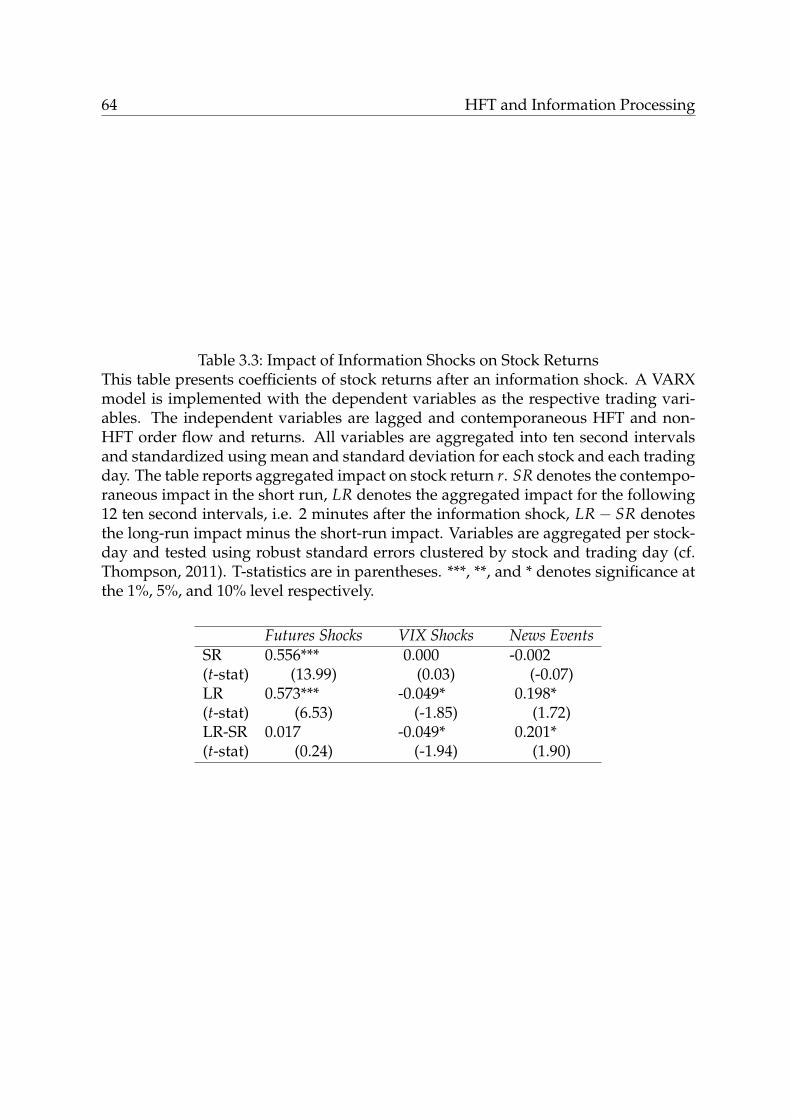
64 HFT and Information Processing
Table 3.3: Impact of Information Shocks on Stock ReturnsThis table presents coefficients of stock returns after an information shock. A VARXmodel is implemented with the dependent variables as the respective trading vari-ables. The independent variables are lagged and contemporaneous HFT and non-HFT order flow and returns. All variables are aggregated into ten second intervalsand standardized using mean and standard deviation for each stock and each tradingday. The table reports aggregated impact on stock return r. SR denotes the contempo-raneous impact in the short run, LR denotes the aggregated impact for the following12 ten second intervals, i.e. 2 minutes after the information shock, LR− SR denotesthe long-run impact minus the short-run impact. Variables are aggregated per stock-day and tested using robust standard errors clustered by stock and trading day (cf.Thompson, 2011). T-statistics are in parentheses. ***, **, and * denotes significance atthe 1%, 5%, and 10% level respectively.
Futures Shocks VIX Shocks News EventsSR 0.556*** 0.000 -0.002(t-stat) (13.99) (0.03) (-0.07)LR 0.573*** -0.049* 0.198*(t-stat) (6.53) (-1.85) (1.72)LR-SR 0.017 -0.049* 0.201*(t-stat) (0.24) (-1.94) (1.90)
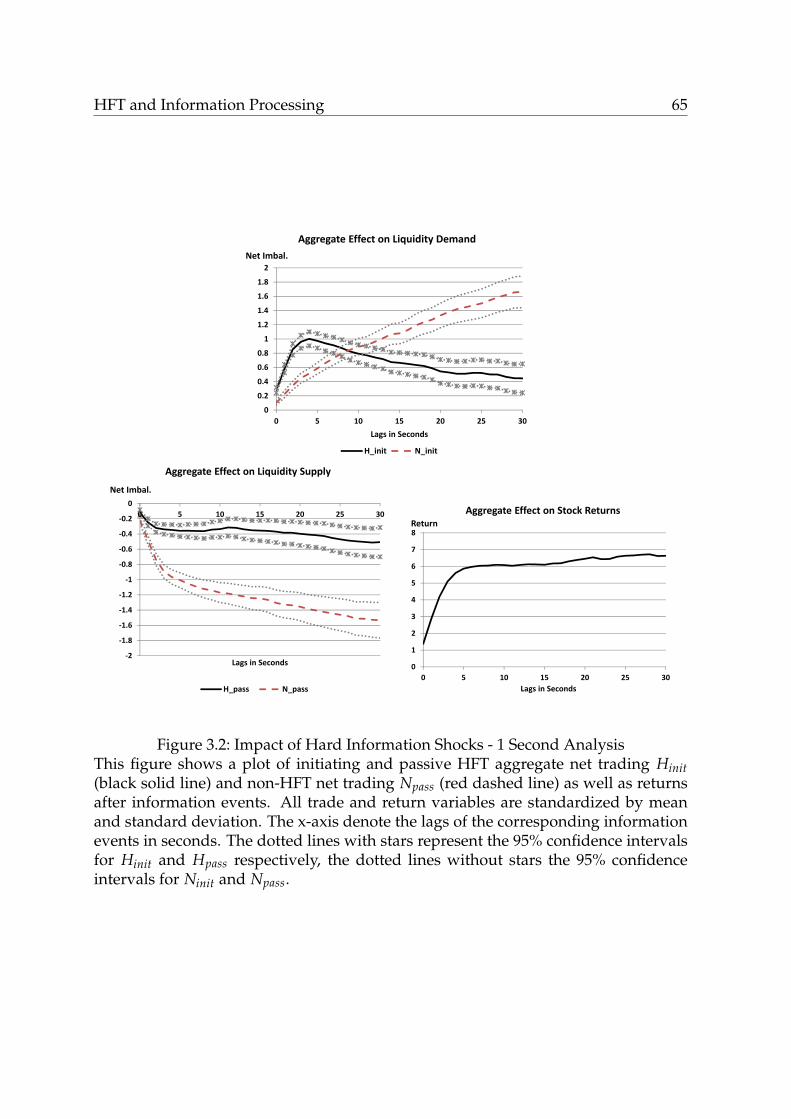
HFT and Information Processing 65
0
0.2
0.4
0.6
0.8
1
1.2
1.4
1.6
1.8
2
0 5 10 15 20 25 30
Net Imbal.
Lags in Seconds
Aggregate Effect on Liquidity Demand
H_init N_init
‐2
‐1.8
‐1.6
‐1.4
‐1.2
‐1
‐0.8
‐0.6
‐0.4
‐0.2
00 5 10 15 20 25 30
Net Imbal.
Lags in Seconds
Aggregate Effect on Liquidity Supply
H_pass N_pass
0
1
2
3
4
5
6
7
8
0 5 10 15 20 25 30
Return
Lags in Seconds
Aggregate Effect on Stock Returns
Figure 3.2: Impact of Hard Information Shocks - 1 Second AnalysisThis figure shows a plot of initiating and passive HFT aggregate net trading Hinit(black solid line) and non-HFT net trading Npass (red dashed line) as well as returnsafter information events. All trade and return variables are standardized by meanand standard deviation. The x-axis denote the lags of the corresponding informationevents in seconds. The dotted lines with stars represent the 95% confidence intervalsfor Hinit and Hpass respectively, the dotted lines without stars the 95% confidenceintervals for Ninit and Npass.
66 HFT and Information Processing
Impact on Net Trading
I am further interested in the trade reaction in the short and long run. Table 3.4
presents the aggregated coefficients of the VARX model for S&P 500 futures return
shocks in Panel A, VIX shocks in Panel B, and news events in Panel C of the sam-
ple from 2008-2009. Results for initiated trades of HFTs (HFTinit) and non-HFTs
(NHFTinit) and their difference (Di f f ) are on the left hand side and results for pas-
sive trades on the right hand side. Figure 3.3 depicts the results for initiated net
trading after information events graphically, Figure 3.4 depicts the results for passive
net trading after information events.
After the occurrence of an information event, I argue that net trading in the direc-
tion of this information event can be interpreted as informed trading activity based
on the event. Thus, the rationale of interpretation is positive net trading, i.e. more
buy than sell orders, after positive information shocks and negative net trading af-
ter negative information shocks. The information shocks are represented by directed
dummies Di,w as mentioned above, i.e. -1 for negative shocks and +1 for positive
shocks. Thus, the coefficients of the model can be interpreted as the impact of a di-
rected information shock on net trading in the same direction.
As shown in Panel A, initiating HFTs show a significant and positive reaction to
futures shocks in the short run (0.240). In case of a futures price increase, initiating
HFTs thus demonstrate a 24% of the 10 second standard deviation higher amount of
buy volume than sell volume as compared to the average net trading. Initiating HFTs
invert their trading behavior within two minutes in the long run (-0.249 in LR-SR),
representing a complete liquidation of the trading position acquired within the first 10
seconds. The analysis on a 1 second level gives more insight into the high frequency
impact and reveals that the highest impact on HFT net trading is during the first
5 seconds after the information event. Differently, non-HFTs exhibit a consistently
positive reaction to the information shock (0.179 in the short run and 0.350 in the
long run). As a consequence, the difference between HFTs and non-HFTs initiated
trading, Di f f , results in a positive coefficient in the short run (0.061), but a negative
coefficient in the long run (-0.420 in LR-SR). The different reaction of HFTs and non-
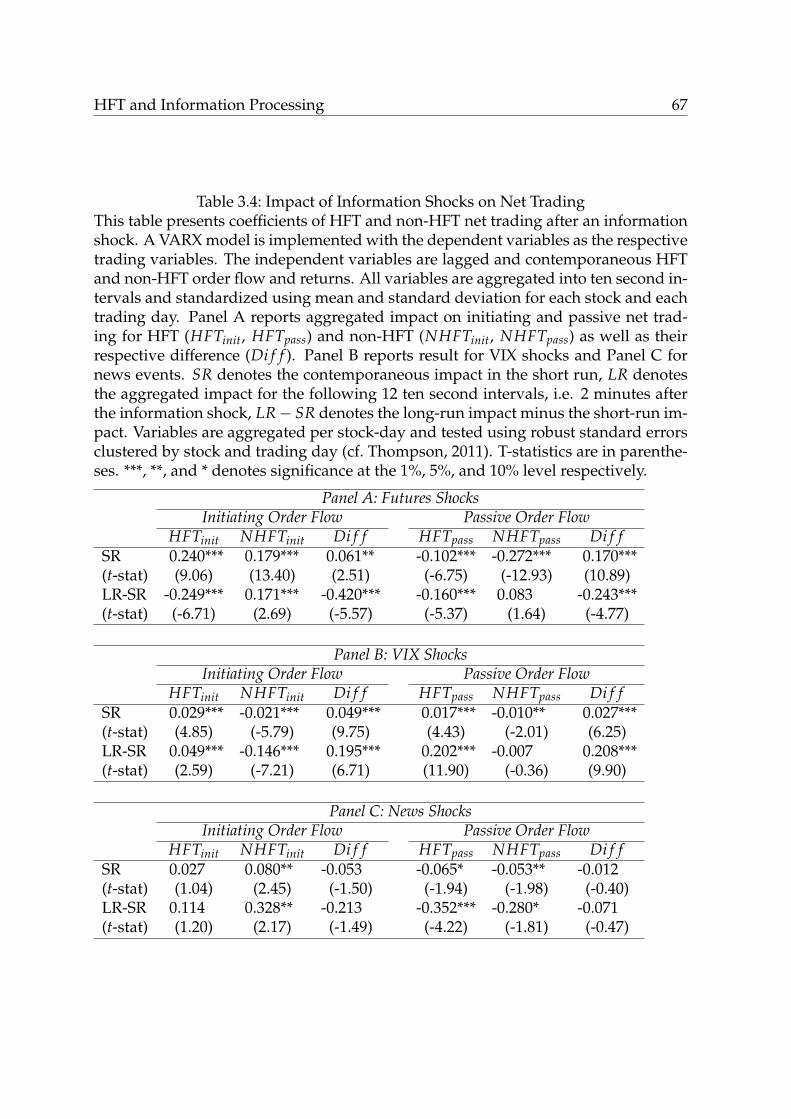
HFT and Information Processing 67
Table 3.4: Impact of Information Shocks on Net TradingThis table presents coefficients of HFT and non-HFT net trading after an informationshock. A VARX model is implemented with the dependent variables as the respectivetrading variables. The independent variables are lagged and contemporaneous HFTand non-HFT order flow and returns. All variables are aggregated into ten second in-tervals and standardized using mean and standard deviation for each stock and eachtrading day. Panel A reports aggregated impact on initiating and passive net trad-ing for HFT (HFTinit, HFTpass) and non-HFT (NHFTinit, NHFTpass) as well as theirrespective difference (Di f f ). Panel B reports result for VIX shocks and Panel C fornews events. SR denotes the contemporaneous impact in the short run, LR denotesthe aggregated impact for the following 12 ten second intervals, i.e. 2 minutes afterthe information shock, LR− SR denotes the long-run impact minus the short-run im-pact. Variables are aggregated per stock-day and tested using robust standard errorsclustered by stock and trading day (cf. Thompson, 2011). T-statistics are in parenthe-ses. ***, **, and * denotes significance at the 1%, 5%, and 10% level respectively.
Panel A: Futures ShocksInitiating Order Flow Passive Order Flow
HFTinit NHFTinit Di f f HFTpass NHFTpass Di f fSR 0.240*** 0.179*** 0.061** -0.102*** -0.272*** 0.170***(t-stat) (9.06) (13.40) (2.51) (-6.75) (-12.93) (10.89)LR-SR -0.249*** 0.171*** -0.420*** -0.160*** 0.083 -0.243***(t-stat) (-6.71) (2.69) (-5.57) (-5.37) (1.64) (-4.77)
Panel B: VIX ShocksInitiating Order Flow Passive Order Flow
HFTinit NHFTinit Di f f HFTpass NHFTpass Di f fSR 0.029*** -0.021*** 0.049*** 0.017*** -0.010** 0.027***(t-stat) (4.85) (-5.79) (9.75) (4.43) (-2.01) (6.25)LR-SR 0.049*** -0.146*** 0.195*** 0.202*** -0.007 0.208***(t-stat) (2.59) (-7.21) (6.71) (11.90) (-0.36) (9.90)
Panel C: News ShocksInitiating Order Flow Passive Order Flow
HFTinit NHFTinit Di f f HFTpass NHFTpass Di f fSR 0.027 0.080** -0.053 -0.065* -0.053** -0.012(t-stat) (1.04) (2.45) (-1.50) (-1.94) (-1.98) (-0.40)LR-SR 0.114 0.328** -0.213 -0.352*** -0.280* -0.071(t-stat) (1.20) (2.17) (-1.49) (-4.22) (-1.81) (-0.47)
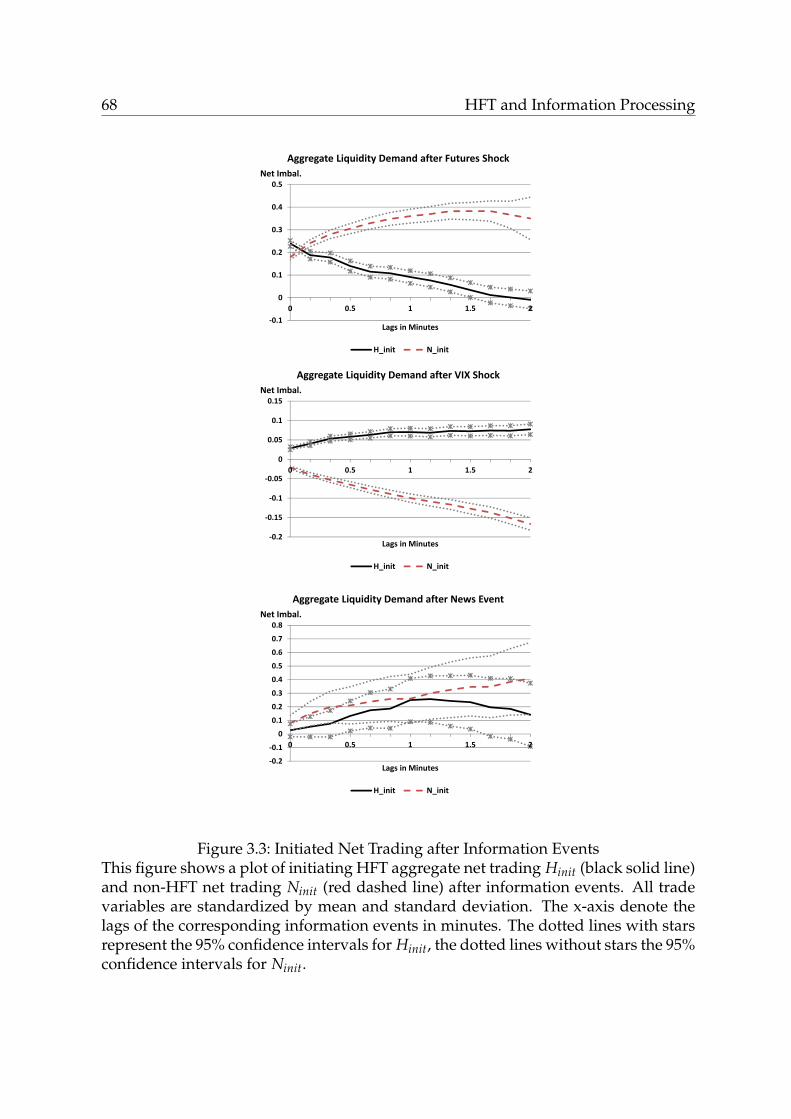
68 HFT and Information Processing
‐0.1
0
0.1
0.2
0.3
0.4
0.5
0 0.5 1 1.5 2
Net Imbal.
Lags in Minutes
Aggregate Liquidity Demand after Futures Shock
H_init N_init
‐0.2
‐0.15
‐0.1
‐0.05
0
0.05
0.1
0.15
0 0.5 1 1.5 2
Net Imbal.
Lags in Minutes
Aggregate Liquidity Demand after VIX Shock
H_init N_init
‐0.2
‐0.1
0
0.1
0.2
0.3
0.4
0.5
0.6
0.7
0.8
0 0.5 1 1.5 2
Net Imbal.
Lags in Minutes
Aggregate Liquidity Demand after News Event
H_init N_init
Figure 3.3: Initiated Net Trading after Information EventsThis figure shows a plot of initiating HFT aggregate net trading Hinit (black solid line)and non-HFT net trading Ninit (red dashed line) after information events. All tradevariables are standardized by mean and standard deviation. The x-axis denote thelags of the corresponding information events in minutes. The dotted lines with starsrepresent the 95% confidence intervals for Hinit, the dotted lines without stars the 95%confidence intervals for Ninit.
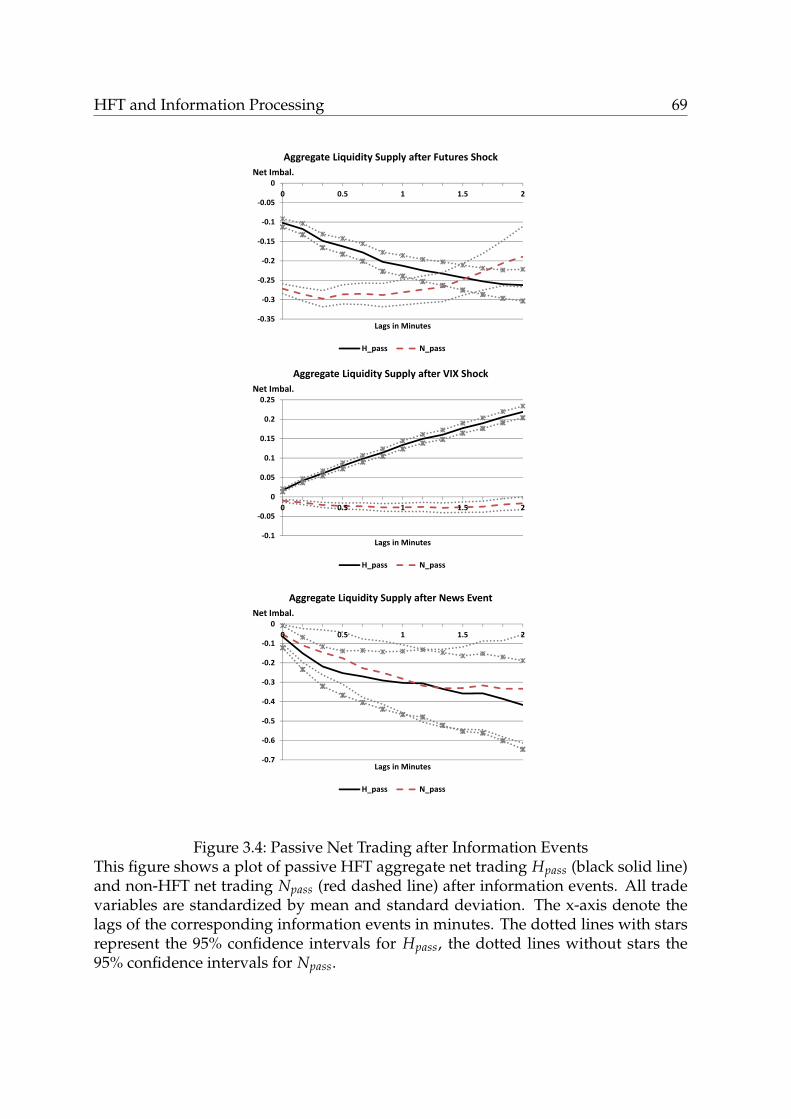
HFT and Information Processing 69
‐0.35
‐0.3
‐0.25
‐0.2
‐0.15
‐0.1
‐0.05
00 0.5 1 1.5 2
Net Imbal.
Lags in Minutes
Aggregate Liquidity Supply after Futures Shock
H_pass N_pass
‐0.1
‐0.05
0
0.05
0.1
0.15
0.2
0.25
0 0.5 1 1.5 2
Net Imbal.
Lags in Minutes
Aggregate Liquidity Supply after VIX Shock
H_pass N_pass
‐0.7
‐0.6
‐0.5
‐0.4
‐0.3
‐0.2
‐0.1
00 0.5 1 1.5 2
Net Imbal.
Lags in Minutes
Aggregate Liquidity Supply after News Event
H_pass N_pass
Figure 3.4: Passive Net Trading after Information EventsThis figure shows a plot of passive HFT aggregate net trading Hpass (black solid line)and non-HFT net trading Npass (red dashed line) after information events. All tradevariables are standardized by mean and standard deviation. The x-axis denote thelags of the corresponding information events in minutes. The dotted lines with starsrepresent the 95% confidence intervals for Hpass, the dotted lines without stars the95% confidence intervals for Npass.
70 HFT and Information Processing
HFTs can be interpreted that HFTs are able to react faster to hard information shocks,
such as futures return shocks. In the long run, HFTs trade in the opposite direction
of the futures shock. This points to a reduction of their trading positions and thus a
realization of their short-term profits.
Panel B presents the aggregated coefficients of the VARX model in Equation (3.1)
for VIX return shocks. I provide insight into the trading behavior of HFTs for periods
of extremely high volatility events, measured by VIX return shocks above the 99%
level and below the 1% level. These results suggest a consistent trading behavior of
HFTs around VIX return shocks. Initiating and passive HFTs demonstrate consistent
net trading in the same direction as the specific VIX shock, i.e. positive net trading
after positive VIX shocks and negative net trading after negative ones. On the other
side, initiating non-HFTs exhibit a trading behavior in the opposite direction to HFT
for VIX shocks. Passive non-HFTs show a similar behavior though results are not
significant. Comparing the results for hard information, I see two different reactions
to hard information shocks: While futures return shocks induce a strong short-term
reaction of HFTs, positive VIX return shocks lead to more long-term reaction and
an increase in HFT net trading. Non-HFT reaction is weaker in the short run and
increases in the long run for futures shocks. In contrast to HFTs, they increase their
net trading in periods of low volatility.
In comparison to hard information, the reaction to soft information is different.
Though both initiating HFTs and non-HFTs trade in the expected direction, non-HFTs
demonstrate a significantly stronger reaction especially in the long run (0.408 as com-
pared to 0.142 in the long run). I thus conclude that non-HFTs are able to process soft
information more accurately, but need time for its interpretation. Passive traders get
adversely selected and non-HFTs get less adversely selected than HFTs. An explana-
tion for the stronger non-HFT reaction can be different trading strategies. Although
the news data source is reliable and also used by trading firms7, the actual trading
strategies are not known. As proposed by Rich Brown8 from Thomson Reuters, news
7cf. Thomson Reuters News Analytics Fact sheet, http://thomsonreuters.com/content/financial/pdf/enterprise/News_Analytics.pdf.
8See “The Algo who cried ‘Wolf!’ ”, Rich Brown, A-TeamGroup Publication, Oct 2009, Issue3.
HFT and Information Processing 71
ticker data can be used as a circuit breaker. By interpreting stock specific news arrival
as a signal for proximate stock price volatility, a trading halt might be triggered by
HFT on their arrival in order to reduce the risk of uncertainty about the following
stock price reaction.
Robustness Checks
In order to check for robustness of the results for different time periods, I perform
the analysis separately for time periods of high uncertainty (during the financial cri-
sis from September 2008 to June 2009) and low uncertainty (pre- and post financial
crisis). I choose time periods according to the VIX value which increased to above 30
in September 2008 and decreased again below 30 in July 2009. Results are shown in
Table 3.5. The results hold for both futures shocks and VIX shocks. I can observe an
even higher reaction of HFTs in the financial crisis period. This points to the theoret-
ical finding of Foucault et al. (2013) that with increasing volatility, flow trading and
thus HFT activity also increases.
72 HFT and Information Processing
Table 3.5: Impact of Information Shocks on Net Trading - Robustness over timeThis table presents aggregated coefficients of HFT and non-HFT net trading after aninformation shock for different periods of the sample. I distinguish between the pre-crisis period (Jan-Aug 2008; Panel A1, B1, C1), the crisis period (Sep 2008-June 2009;Panel A2, B2, C2), and the post-crisis period (July 2009-Dec 2009; Panel A3, B3, C3).The VARX model is implemented with the respective trading variables as the depen-dent variables. The independent variables are lagged and contemporaneous HFT andnon-HFT order flow and returns. All variables are aggregated into ten second inter-vals and standardized using mean and standard deviation for each stock and eachtrading day. Panel A reports aggregated impact on initiating and passive net trad-ing for HFT (HFTinit, HFTpass) and non-HFT (NHFTinit, NHFTpass) as well as theirrespective difference (Di f f ). Panel B reports result for VIX shocks and Panel C fornews events. Panel D presents differences between reaction to futures shocks andnews events. SR denotes the contemporaneous impact in the short run, LR denotesthe aggregated impact for the following 12 ten second intervals, i.e. 2 minutes af-ter the information shock, LR− SR denotes the long-run impact minus the short-runimpact. Variables are aggregated per stock-day and tested using double clusteredstandard errors on stock and trading day (cf. Thompson, 2011). T-statistics are inparentheses. ***, **, and * denotes significance at the 1%, 5%, and 10% level respec-tively.
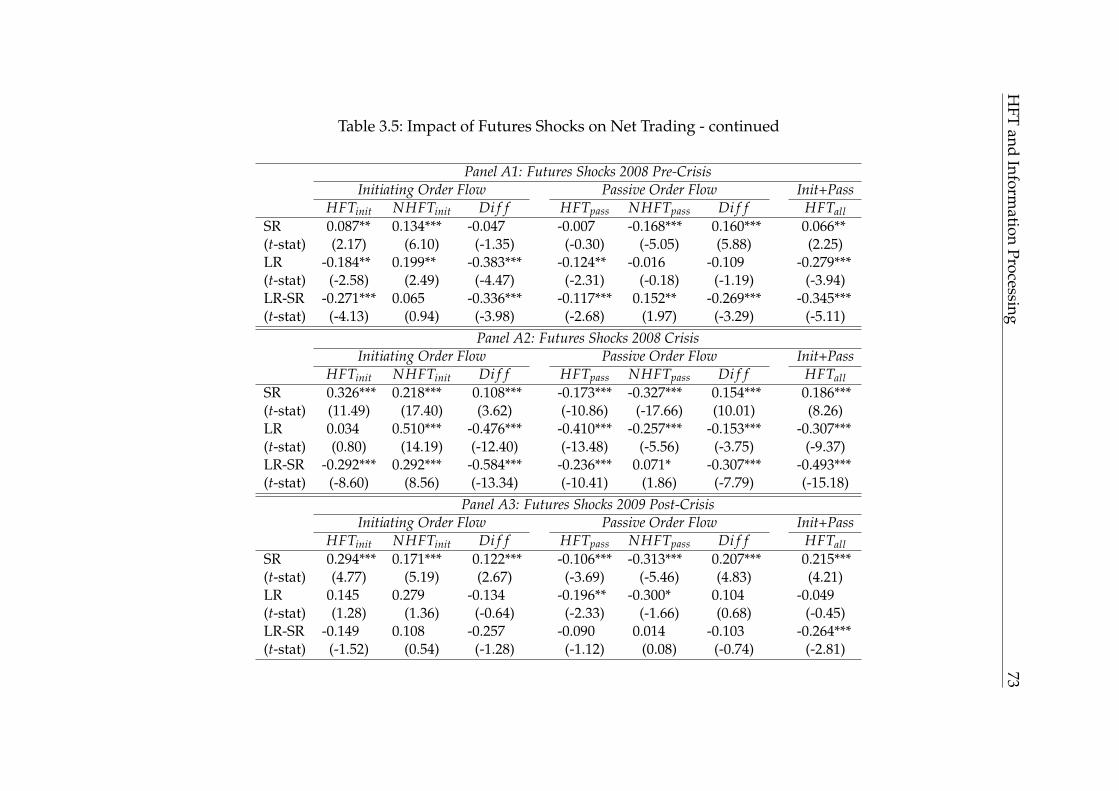
HFT
andInform
ationProcessing
73Table 3.5: Impact of Futures Shocks on Net Trading - continued
Panel A1: Futures Shocks 2008 Pre-CrisisInitiating Order Flow Passive Order Flow Init+Pass
HFTinit NHFTinit Di f f HFTpass NHFTpass Di f f HFTallSR 0.087** 0.134*** -0.047 -0.007 -0.168*** 0.160*** 0.066**(t-stat) (2.17) (6.10) (-1.35) (-0.30) (-5.05) (5.88) (2.25)LR -0.184** 0.199** -0.383*** -0.124** -0.016 -0.109 -0.279***(t-stat) (-2.58) (2.49) (-4.47) (-2.31) (-0.18) (-1.19) (-3.94)LR-SR -0.271*** 0.065 -0.336*** -0.117*** 0.152** -0.269*** -0.345***(t-stat) (-4.13) (0.94) (-3.98) (-2.68) (1.97) (-3.29) (-5.11)
Panel A2: Futures Shocks 2008 CrisisInitiating Order Flow Passive Order Flow Init+Pass
HFTinit NHFTinit Di f f HFTpass NHFTpass Di f f HFTallSR 0.326*** 0.218*** 0.108*** -0.173*** -0.327*** 0.154*** 0.186***(t-stat) (11.49) (17.40) (3.62) (-10.86) (-17.66) (10.01) (8.26)LR 0.034 0.510*** -0.476*** -0.410*** -0.257*** -0.153*** -0.307***(t-stat) (0.80) (14.19) (-12.40) (-13.48) (-5.56) (-3.75) (-9.37)LR-SR -0.292*** 0.292*** -0.584*** -0.236*** 0.071* -0.307*** -0.493***(t-stat) (-8.60) (8.56) (-13.34) (-10.41) (1.86) (-7.79) (-15.18)
Panel A3: Futures Shocks 2009 Post-CrisisInitiating Order Flow Passive Order Flow Init+Pass
HFTinit NHFTinit Di f f HFTpass NHFTpass Di f f HFTallSR 0.294*** 0.171*** 0.122*** -0.106*** -0.313*** 0.207*** 0.215***(t-stat) (4.77) (5.19) (2.67) (-3.69) (-5.46) (4.83) (4.21)LR 0.145 0.279 -0.134 -0.196** -0.300* 0.104 -0.049(t-stat) (1.28) (1.36) (-0.64) (-2.33) (-1.66) (0.68) (-0.45)LR-SR -0.149 0.108 -0.257 -0.090 0.014 -0.103 -0.264***(t-stat) (-1.52) (0.54) (-1.28) (-1.12) (0.08) (-0.74) (-2.81)
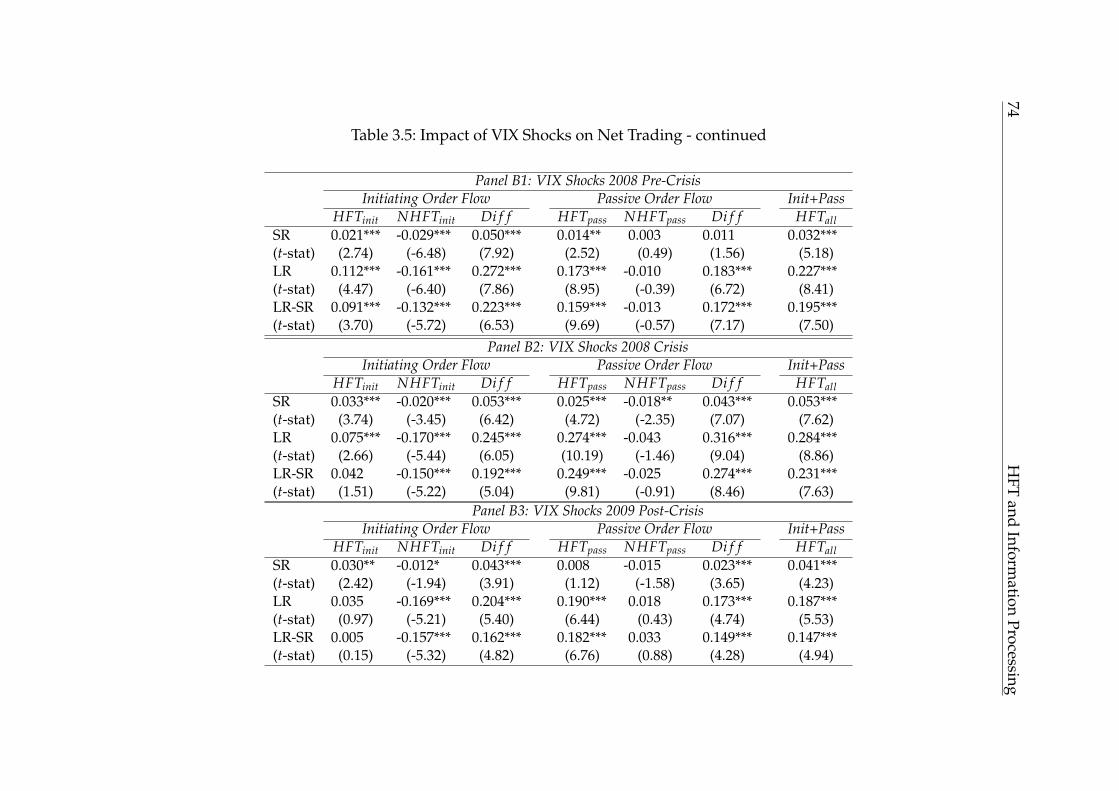
74H
FTand
Information
Processing
Table 3.5: Impact of VIX Shocks on Net Trading - continued
Panel B1: VIX Shocks 2008 Pre-CrisisInitiating Order Flow Passive Order Flow Init+Pass
HFTinit NHFTinit Di f f HFTpass NHFTpass Di f f HFTallSR 0.021*** -0.029*** 0.050*** 0.014** 0.003 0.011 0.032***(t-stat) (2.74) (-6.48) (7.92) (2.52) (0.49) (1.56) (5.18)LR 0.112*** -0.161*** 0.272*** 0.173*** -0.010 0.183*** 0.227***(t-stat) (4.47) (-6.40) (7.86) (8.95) (-0.39) (6.72) (8.41)LR-SR 0.091*** -0.132*** 0.223*** 0.159*** -0.013 0.172*** 0.195***(t-stat) (3.70) (-5.72) (6.53) (9.69) (-0.57) (7.17) (7.50)
Panel B2: VIX Shocks 2008 CrisisInitiating Order Flow Passive Order Flow Init+Pass
HFTinit NHFTinit Di f f HFTpass NHFTpass Di f f HFTallSR 0.033*** -0.020*** 0.053*** 0.025*** -0.018** 0.043*** 0.053***(t-stat) (3.74) (-3.45) (6.42) (4.72) (-2.35) (7.07) (7.62)LR 0.075*** -0.170*** 0.245*** 0.274*** -0.043 0.316*** 0.284***(t-stat) (2.66) (-5.44) (6.05) (10.19) (-1.46) (9.04) (8.86)LR-SR 0.042 -0.150*** 0.192*** 0.249*** -0.025 0.274*** 0.231***(t-stat) (1.51) (-5.22) (5.04) (9.81) (-0.91) (8.46) (7.63)
Panel B3: VIX Shocks 2009 Post-CrisisInitiating Order Flow Passive Order Flow Init+Pass
HFTinit NHFTinit Di f f HFTpass NHFTpass Di f f HFTallSR 0.030** -0.012* 0.043*** 0.008 -0.015 0.023*** 0.041***(t-stat) (2.42) (-1.94) (3.91) (1.12) (-1.58) (3.65) (4.23)LR 0.035 -0.169*** 0.204*** 0.190*** 0.018 0.173*** 0.187***(t-stat) (0.97) (-5.21) (5.40) (6.44) (0.43) (4.74) (5.53)LR-SR 0.005 -0.157*** 0.162*** 0.182*** 0.033 0.149*** 0.147***(t-stat) (0.15) (-5.32) (4.82) (6.76) (0.88) (4.28) (4.94)
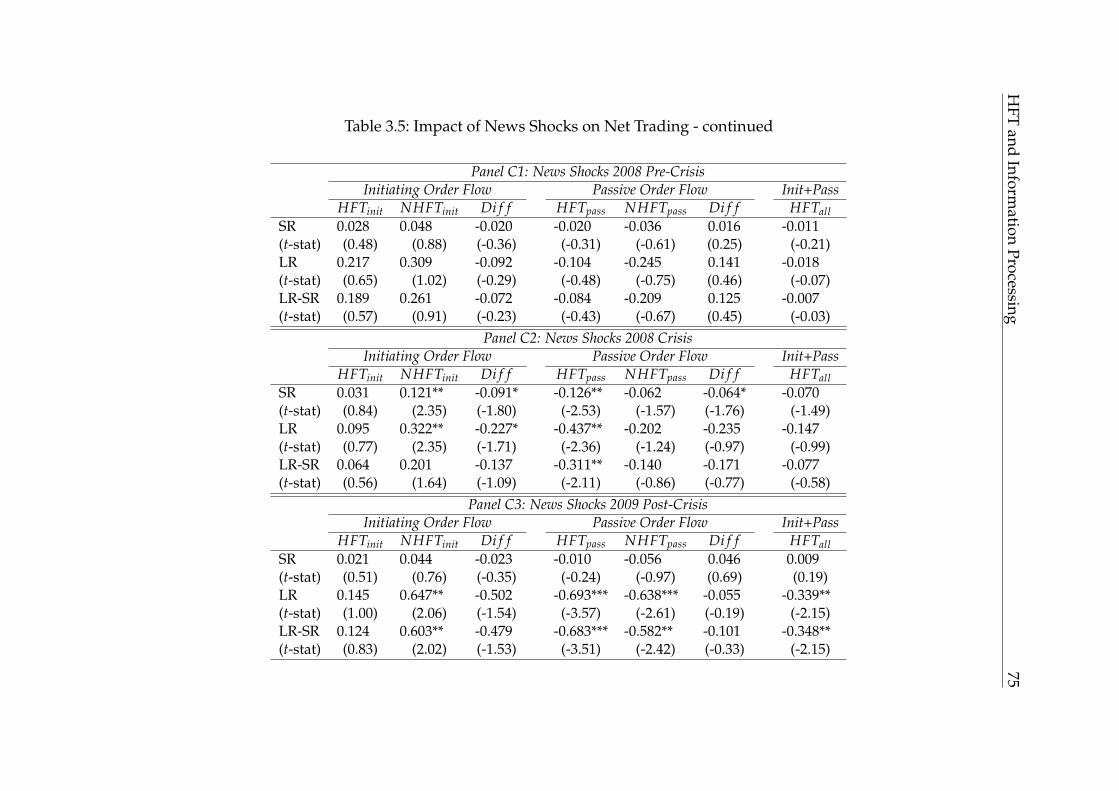
HFT
andInform
ationProcessing
75Table 3.5: Impact of News Shocks on Net Trading - continued
Panel C1: News Shocks 2008 Pre-CrisisInitiating Order Flow Passive Order Flow Init+Pass
HFTinit NHFTinit Di f f HFTpass NHFTpass Di f f HFTallSR 0.028 0.048 -0.020 -0.020 -0.036 0.016 -0.011(t-stat) (0.48) (0.88) (-0.36) (-0.31) (-0.61) (0.25) (-0.21)LR 0.217 0.309 -0.092 -0.104 -0.245 0.141 -0.018(t-stat) (0.65) (1.02) (-0.29) (-0.48) (-0.75) (0.46) (-0.07)LR-SR 0.189 0.261 -0.072 -0.084 -0.209 0.125 -0.007(t-stat) (0.57) (0.91) (-0.23) (-0.43) (-0.67) (0.45) (-0.03)
Panel C2: News Shocks 2008 CrisisInitiating Order Flow Passive Order Flow Init+Pass
HFTinit NHFTinit Di f f HFTpass NHFTpass Di f f HFTallSR 0.031 0.121** -0.091* -0.126** -0.062 -0.064* -0.070(t-stat) (0.84) (2.35) (-1.80) (-2.53) (-1.57) (-1.76) (-1.49)LR 0.095 0.322** -0.227* -0.437** -0.202 -0.235 -0.147(t-stat) (0.77) (2.35) (-1.71) (-2.36) (-1.24) (-0.97) (-0.99)LR-SR 0.064 0.201 -0.137 -0.311** -0.140 -0.171 -0.077(t-stat) (0.56) (1.64) (-1.09) (-2.11) (-0.86) (-0.77) (-0.58)
Panel C3: News Shocks 2009 Post-CrisisInitiating Order Flow Passive Order Flow Init+Pass
HFTinit NHFTinit Di f f HFTpass NHFTpass Di f f HFTallSR 0.021 0.044 -0.023 -0.010 -0.056 0.046 0.009(t-stat) (0.51) (0.76) (-0.35) (-0.24) (-0.97) (0.69) (0.19)LR 0.145 0.647** -0.502 -0.693*** -0.638*** -0.055 -0.339**(t-stat) (1.00) (2.06) (-1.54) (-3.57) (-2.61) (-0.19) (-2.15)LR-SR 0.124 0.603** -0.479 -0.683*** -0.582** -0.101 -0.348**(t-stat) (0.83) (2.02) (-1.53) (-3.51) (-2.42) (-0.33) (-2.15)
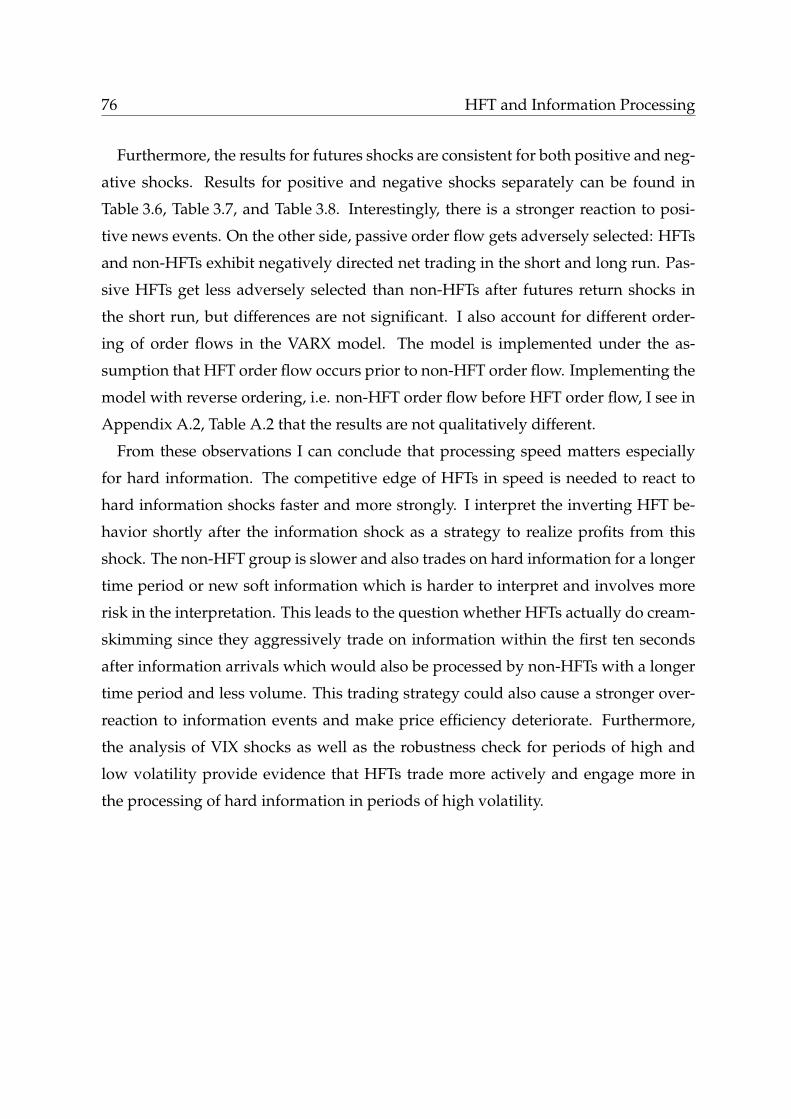
76 HFT and Information Processing
Furthermore, the results for futures shocks are consistent for both positive and neg-
ative shocks. Results for positive and negative shocks separately can be found in
Table 3.6, Table 3.7, and Table 3.8. Interestingly, there is a stronger reaction to posi-
tive news events. On the other side, passive order flow gets adversely selected: HFTs
and non-HFTs exhibit negatively directed net trading in the short and long run. Pas-
sive HFTs get less adversely selected than non-HFTs after futures return shocks in
the short run, but differences are not significant. I also account for different order-
ing of order flows in the VARX model. The model is implemented under the as-
sumption that HFT order flow occurs prior to non-HFT order flow. Implementing the
model with reverse ordering, i.e. non-HFT order flow before HFT order flow, I see in
Appendix A.2, Table A.2 that the results are not qualitatively different.
From these observations I can conclude that processing speed matters especially
for hard information. The competitive edge of HFTs in speed is needed to react to
hard information shocks faster and more strongly. I interpret the inverting HFT be-
havior shortly after the information shock as a strategy to realize profits from this
shock. The non-HFT group is slower and also trades on hard information for a longer
time period or new soft information which is harder to interpret and involves more
risk in the interpretation. This leads to the question whether HFTs actually do cream-
skimming since they aggressively trade on information within the first ten seconds
after information arrivals which would also be processed by non-HFTs with a longer
time period and less volume. This trading strategy could also cause a stronger over-
reaction to information events and make price efficiency deteriorate. Furthermore,
the analysis of VIX shocks as well as the robustness check for periods of high and
low volatility provide evidence that HFTs trade more actively and engage more in
the processing of hard information in periods of high volatility.
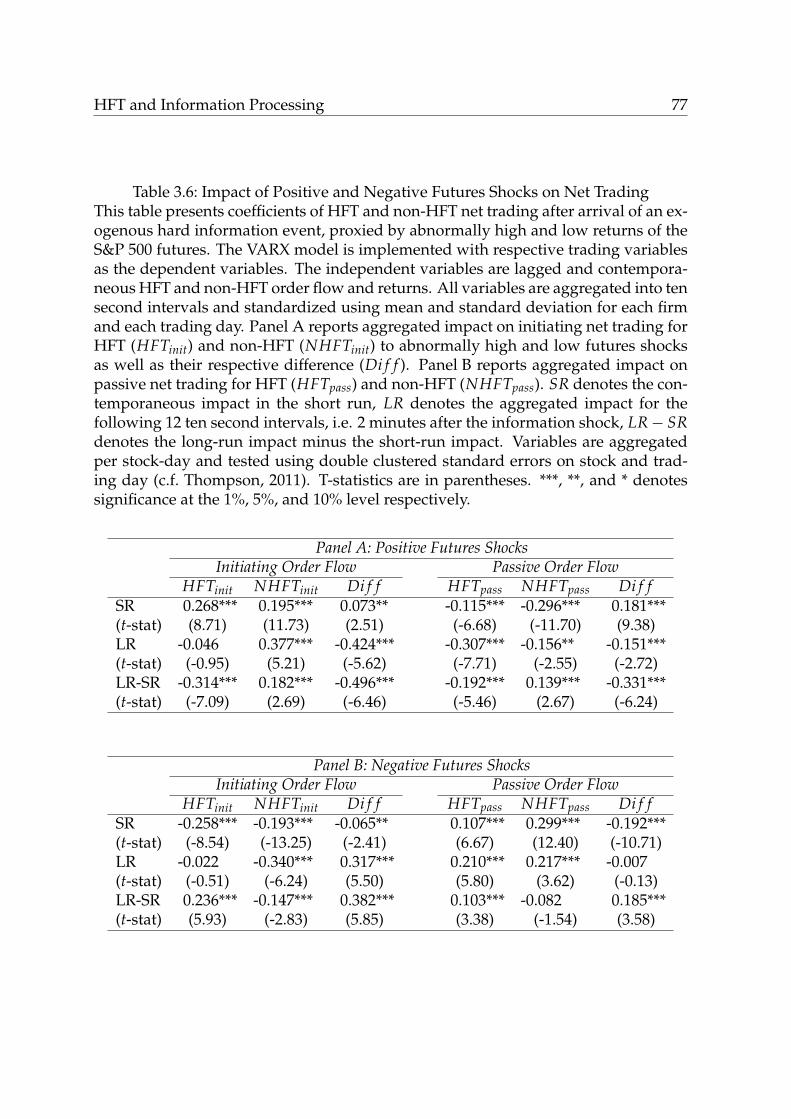
HFT and Information Processing 77
Table 3.6: Impact of Positive and Negative Futures Shocks on Net TradingThis table presents coefficients of HFT and non-HFT net trading after arrival of an ex-ogenous hard information event, proxied by abnormally high and low returns of theS&P 500 futures. The VARX model is implemented with respective trading variablesas the dependent variables. The independent variables are lagged and contempora-neous HFT and non-HFT order flow and returns. All variables are aggregated into tensecond intervals and standardized using mean and standard deviation for each firmand each trading day. Panel A reports aggregated impact on initiating net trading forHFT (HFTinit) and non-HFT (NHFTinit) to abnormally high and low futures shocksas well as their respective difference (Di f f ). Panel B reports aggregated impact onpassive net trading for HFT (HFTpass) and non-HFT (NHFTpass). SR denotes the con-temporaneous impact in the short run, LR denotes the aggregated impact for thefollowing 12 ten second intervals, i.e. 2 minutes after the information shock, LR− SRdenotes the long-run impact minus the short-run impact. Variables are aggregatedper stock-day and tested using double clustered standard errors on stock and trad-ing day (c.f. Thompson, 2011). T-statistics are in parentheses. ***, **, and * denotessignificance at the 1%, 5%, and 10% level respectively.
Panel A: Positive Futures ShocksInitiating Order Flow Passive Order Flow
HFTinit NHFTinit Di f f HFTpass NHFTpass Di f fSR 0.268*** 0.195*** 0.073** -0.115*** -0.296*** 0.181***(t-stat) (8.71) (11.73) (2.51) (-6.68) (-11.70) (9.38)LR -0.046 0.377*** -0.424*** -0.307*** -0.156** -0.151***(t-stat) (-0.95) (5.21) (-5.62) (-7.71) (-2.55) (-2.72)LR-SR -0.314*** 0.182*** -0.496*** -0.192*** 0.139*** -0.331***(t-stat) (-7.09) (2.69) (-6.46) (-5.46) (2.67) (-6.24)
Panel B: Negative Futures ShocksInitiating Order Flow Passive Order Flow
HFTinit NHFTinit Di f f HFTpass NHFTpass Di f fSR -0.258*** -0.193*** -0.065** 0.107*** 0.299*** -0.192***(t-stat) (-8.54) (-13.25) (-2.41) (6.67) (12.40) (-10.71)LR -0.022 -0.340*** 0.317*** 0.210*** 0.217*** -0.007(t-stat) (-0.51) (-6.24) (5.50) (5.80) (3.62) (-0.13)LR-SR 0.236*** -0.147*** 0.382*** 0.103*** -0.082 0.185***(t-stat) (5.93) (-2.83) (5.85) (3.38) (-1.54) (3.58)
78 HFT and Information Processing
Table 3.7: Impact of Positive and Negative Volatility Shocks on Net TradingThis table presents coefficients of HFT and non-HFT net trading after arrival of an ex-ogenous hard information event, proxied by abnormally high and low VIX returns.The VARX model is implemented with respective trading variables as the depen-dent variables. The independent variables are lagged and contemporaneous HFTand non-HFT order flow and returns. All variables are aggregated into ten second in-tervals and standardized using mean and standard deviation for each stock and eachtrading day. Panel A reports aggregated impact on initiating net trading for HFT(HFTinit) and non-HFT (NHFTinit) to abnormally high and low VIX shocks as wellas their respective difference (Di f f ). Panel B reports aggregated impact on passivenet trading for HFT (HFTpass) and non-HFT (NHFTpass). SR denotes the contempo-raneous impact in the short run, LR denotes the aggregated impact for the following12 ten second intervals, i.e. 2 minutes after the information shock, LR− SR denotesthe long-run impact minus the short-run impact. Variables are aggregated per stock-day and tested using double clustered standard errors on stock and trading day (c.f.Thompson, 2011). T-statistics are in parentheses. ***, **, and * denotes significance atthe 1%, 5%, and 10% level respectively.
Panel A: Positive VIX ShocksInitiating Order Flow Passive Order Flow
HFTinit NHFTinit Di f f HFTpass NHFTpass Di f fSR 0.026*** -0.019*** 0.045*** 0.010** -0.006 0.015***(t-stat) (3.52) (-4.99) (7.54) (2.09) (-0.93) (2.97)LR 0.081*** -0.128*** 0.209*** 0.183*** -0.031 0.215***(t-stat) (3.59) (-5.78) (7.47) (8.68) (-1.39) (8.71)LR-SR 0.055** -0.109*** 0.164*** 0.174*** -0.026 0.200***(t-stat) (2.52) (-5.18) (6.11) (8.83) (-1.19) (8.92)
Panel B: Negative VIX ShocksInitiating Order Flow Passive Order Flow
HFTinit NHFTinit Di f f HFTpass NHFTpass Di f fSR -0.035*** 0.016*** -0.051*** -0.018*** 0.017*** -0.036***(t-stat) (-4.33) (3.62) (-6.87) (-3.78) (2.73) (-6.39)LR -0.089*** 0.151*** -0.240*** -0.169*** 0.015 -0.185***(t-stat) (-3.74) (6.42) (-7.90) (-8.66) (0.65) (-6.97)LR-SR -0.055** 0.134*** -0.189*** -0.151*** -0.002 -0.149***(t-stat) (-2.55) (6.33) (-6.83) (-8.45) (-0.09) (-6.23)
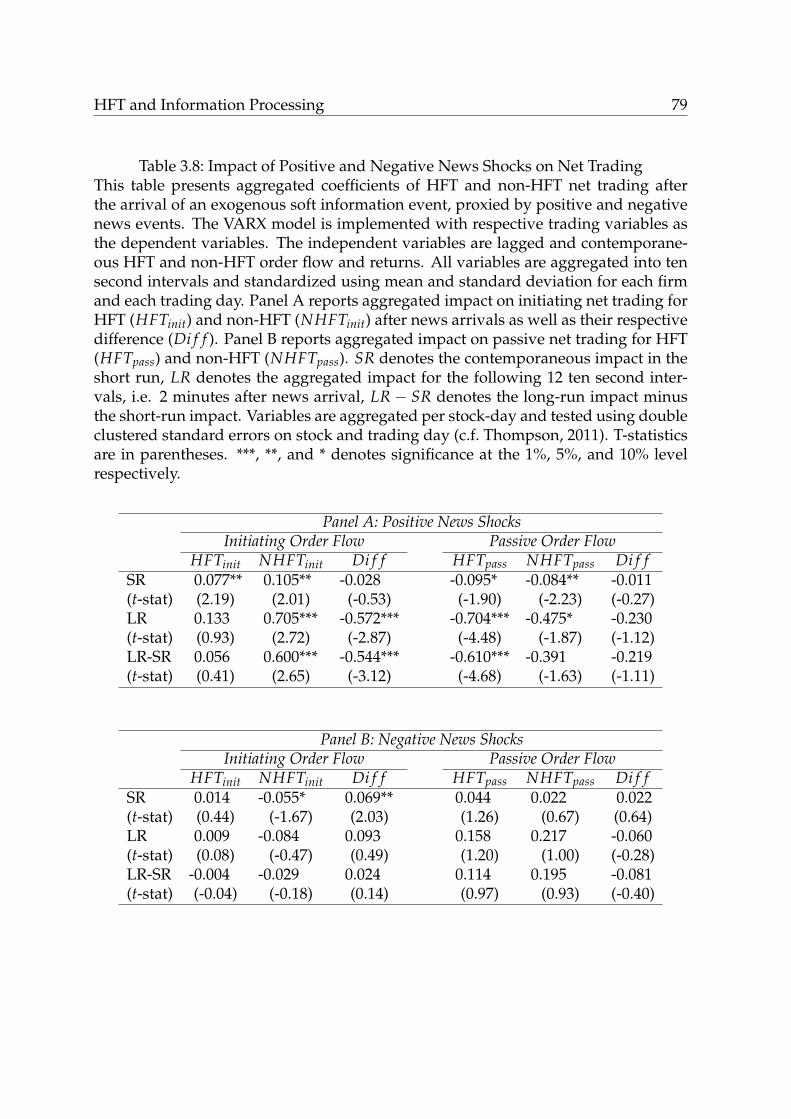
HFT and Information Processing 79
Table 3.8: Impact of Positive and Negative News Shocks on Net TradingThis table presents aggregated coefficients of HFT and non-HFT net trading afterthe arrival of an exogenous soft information event, proxied by positive and negativenews events. The VARX model is implemented with respective trading variables asthe dependent variables. The independent variables are lagged and contemporane-ous HFT and non-HFT order flow and returns. All variables are aggregated into tensecond intervals and standardized using mean and standard deviation for each firmand each trading day. Panel A reports aggregated impact on initiating net trading forHFT (HFTinit) and non-HFT (NHFTinit) after news arrivals as well as their respectivedifference (Di f f ). Panel B reports aggregated impact on passive net trading for HFT(HFTpass) and non-HFT (NHFTpass). SR denotes the contemporaneous impact in theshort run, LR denotes the aggregated impact for the following 12 ten second inter-vals, i.e. 2 minutes after news arrival, LR− SR denotes the long-run impact minusthe short-run impact. Variables are aggregated per stock-day and tested using doubleclustered standard errors on stock and trading day (c.f. Thompson, 2011). T-statisticsare in parentheses. ***, **, and * denotes significance at the 1%, 5%, and 10% levelrespectively.
Panel A: Positive News ShocksInitiating Order Flow Passive Order Flow
HFTinit NHFTinit Di f f HFTpass NHFTpass Di f fSR 0.077** 0.105** -0.028 -0.095* -0.084** -0.011(t-stat) (2.19) (2.01) (-0.53) (-1.90) (-2.23) (-0.27)LR 0.133 0.705*** -0.572*** -0.704*** -0.475* -0.230(t-stat) (0.93) (2.72) (-2.87) (-4.48) (-1.87) (-1.12)LR-SR 0.056 0.600*** -0.544*** -0.610*** -0.391 -0.219(t-stat) (0.41) (2.65) (-3.12) (-4.68) (-1.63) (-1.11)
Panel B: Negative News ShocksInitiating Order Flow Passive Order Flow
HFTinit NHFTinit Di f f HFTpass NHFTpass Di f fSR 0.014 -0.055* 0.069** 0.044 0.022 0.022(t-stat) (0.44) (-1.67) (2.03) (1.26) (0.67) (0.64)LR 0.009 -0.084 0.093 0.158 0.217 -0.060(t-stat) (0.08) (-0.47) (0.49) (1.20) (1.00) (-0.28)LR-SR -0.004 -0.029 0.024 0.114 0.195 -0.081(t-stat) (-0.04) (-0.18) (0.14) (0.97) (0.93) (-0.40)
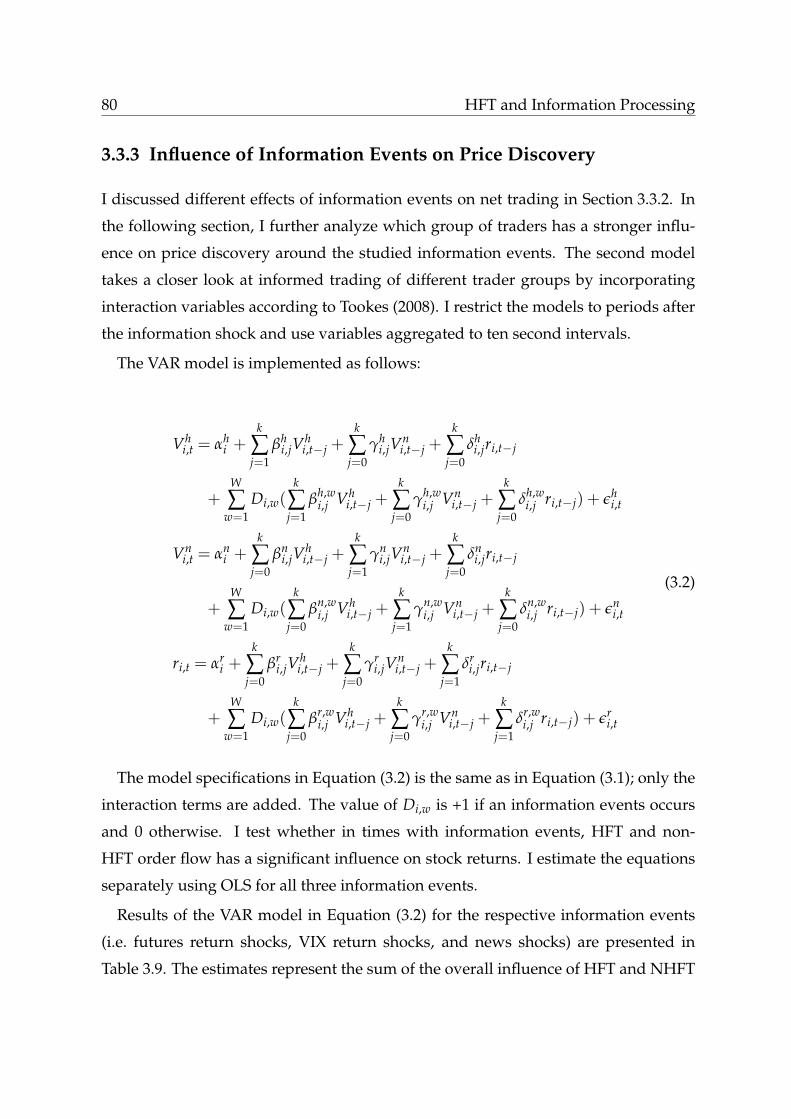
80 HFT and Information Processing
3.3.3 Influence of Information Events on Price Discovery
I discussed different effects of information events on net trading in Section 3.3.2. In
the following section, I further analyze which group of traders has a stronger influ-
ence on price discovery around the studied information events. The second model
takes a closer look at informed trading of different trader groups by incorporating
interaction variables according to Tookes (2008). I restrict the models to periods after
the information shock and use variables aggregated to ten second intervals.
The VAR model is implemented as follows:
Vhi,t = αh
i +k
∑j=1
βhi,jV
hi,t−j +
k
∑j=0
γhi,jV
ni,t−j +
k
∑j=0
δhi,jri,t−j
+W
∑w=1
Di,w(k
∑j=1
βh,wi,j Vh
i,t−j +k
∑j=0
γh,wi,j Vn
i,t−j +k
∑j=0
δh,wi,j ri,t−j) + εh
i,t
Vni,t = αn
i +k
∑j=0
βni,jV
hi,t−j +
k
∑j=1
γni,jV
ni,t−j +
k
∑j=0
δni,jri,t−j
+W
∑w=1
Di,w(k
∑j=0
βn,wi,j Vh
i,t−j +k
∑j=1
γn,wi,j Vn
i,t−j +k
∑j=0
δn,wi,j ri,t−j) + εn
i,t
ri,t = αri +
k
∑j=0
βri,jV
hi,t−j +
k
∑j=0
γri,jV
ni,t−j +
k
∑j=1
δri,jri,t−j
+W
∑w=1
Di,w(k
∑j=0
βr,wi,j Vh
i,t−j +k
∑j=0
γr,wi,j Vn
i,t−j +k
∑j=1
δr,wi,j ri,t−j) + εr
i,t
(3.2)
The model specifications in Equation (3.2) is the same as in Equation (3.1); only the
interaction terms are added. The value of Di,w is +1 if an information events occurs
and 0 otherwise. I test whether in times with information events, HFT and non-
HFT order flow has a significant influence on stock returns. I estimate the equations
separately using OLS for all three information events.
Results of the VAR model in Equation (3.2) for the respective information events
(i.e. futures return shocks, VIX return shocks, and news shocks) are presented in
Table 3.9. The estimates represent the sum of the overall influence of HFT and NHFT
HFT and Information Processing 81
net trading on returns plus the additional influence after the occurrence of an informa-
tion shock. Panel A represents results for the influence of initiated and passive HFT
net trading influence after the occurrence of a futures return shock. Panel B represents
results for VIX return shocks, and Panel C for news events.
Positive and negative information events, such as a positive or negative return
shock or news, should steer the aggregate order flow in the same direction, i.e. more
buy orders after positive events and more sell orders after negative events. While
HFTs dominate the price discovery in the short run, the dominance decreases for
futures and VIX shocks and inverts for news events. With regard to the overall in-
fluence of news shocks on stock returns as presented in Table 3.3, I have shown that
the main impact of news events on stock returns occurs after 10 seconds of the event.
In this context, the influence on stock returns paints a consistent picture of initiating
non-HFTs contributing to price discovery around 8% more than HFTs (which eco-
nomically significant, however not statistically).
With respect to the passive order flow after information shocks, both groups of
traders get adversely selected in the short run, reflected in the negative influences
on stock returns. On the long run however, HFT as well as non-HFT influence on
stock returns becomes positive in the long run (10.5% for futures shocks and 9.7%
for VIX shocks9). Interestingly, passive non-HFTs consistently demonstrate a higher
contribution to price discovery in the long run than HFTs. I conclude that passive
trading strategies follow the change in order flow and prices after information events
in the long run.
This is an interesting aspect for the price discovery discussion about the level of
information of initiating and passive orders: While previous literature has suggested
that passive limit orders are more informed, I can contribute to this statements with a
more differentiated analysis. While initiating marketable orders, especially by HFTs,
dominate price discovery in the short run, i.e. within a period of 10 seconds, passive
non-HFT orders are more informed in the long run. This finding holds for periods
without information events as well as for the additional influences after the occur-
9A differentiation between positive and negative VIX shocks does not yield qualitatively different re-sults, though coefficients for positive VIX shocks are generally higher than for negative VIX shocks.
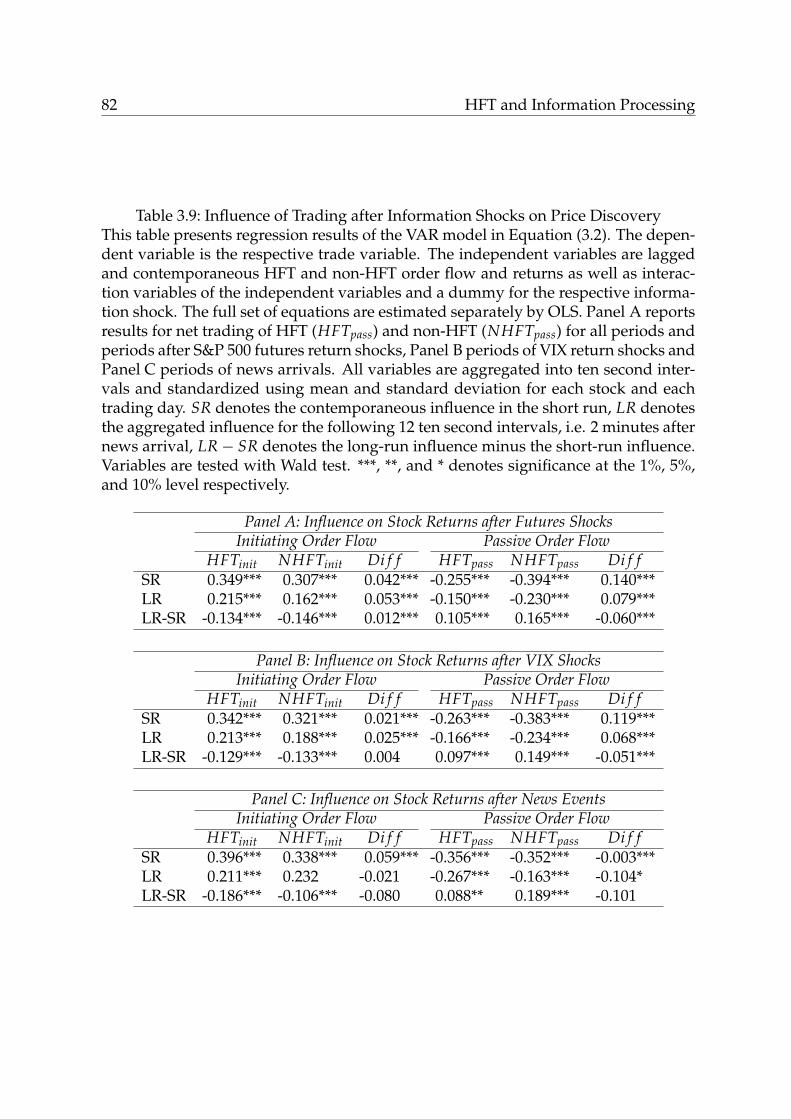
82 HFT and Information Processing
Table 3.9: Influence of Trading after Information Shocks on Price DiscoveryThis table presents regression results of the VAR model in Equation (3.2). The depen-dent variable is the respective trade variable. The independent variables are laggedand contemporaneous HFT and non-HFT order flow and returns as well as interac-tion variables of the independent variables and a dummy for the respective informa-tion shock. The full set of equations are estimated separately by OLS. Panel A reportsresults for net trading of HFT (HFTpass) and non-HFT (NHFTpass) for all periods andperiods after S&P 500 futures return shocks, Panel B periods of VIX return shocks andPanel C periods of news arrivals. All variables are aggregated into ten second inter-vals and standardized using mean and standard deviation for each stock and eachtrading day. SR denotes the contemporaneous influence in the short run, LR denotesthe aggregated influence for the following 12 ten second intervals, i.e. 2 minutes afternews arrival, LR− SR denotes the long-run influence minus the short-run influence.Variables are tested with Wald test. ***, **, and * denotes significance at the 1%, 5%,and 10% level respectively.
Panel A: Influence on Stock Returns after Futures ShocksInitiating Order Flow Passive Order Flow
HFTinit NHFTinit Di f f HFTpass NHFTpass Di f fSR 0.349*** 0.307*** 0.042*** -0.255*** -0.394*** 0.140***LR 0.215*** 0.162*** 0.053*** -0.150*** -0.230*** 0.079***LR-SR -0.134*** -0.146*** 0.012*** 0.105*** 0.165*** -0.060***
Panel B: Influence on Stock Returns after VIX ShocksInitiating Order Flow Passive Order Flow
HFTinit NHFTinit Di f f HFTpass NHFTpass Di f fSR 0.342*** 0.321*** 0.021*** -0.263*** -0.383*** 0.119***LR 0.213*** 0.188*** 0.025*** -0.166*** -0.234*** 0.068***LR-SR -0.129*** -0.133*** 0.004 0.097*** 0.149*** -0.051***
Panel C: Influence on Stock Returns after News EventsInitiating Order Flow Passive Order Flow
HFTinit NHFTinit Di f f HFTpass NHFTpass Di f fSR 0.396*** 0.338*** 0.059*** -0.356*** -0.352*** -0.003***LR 0.211*** 0.232 -0.021 -0.267*** -0.163*** -0.104*LR-SR -0.186*** -0.106*** -0.080 0.088** 0.189*** -0.101
HFT and Information Processing 83
rence of information events.
In summary, initiating and passive traders complement each other in the price dis-
covery process since initiating traders lead price discovery in the short run, while
passive non-HFTs have a higher influence on market returns in the long run. Further-
more, I find that hard information has significant effects on HFT and non-HFT order
flow and price discovery in the short and long run. Soft information is impounded in
a longer amount of time than 10 seconds as shown in Section 3.3.2. Thus, long-run ef-
fects are more representative of the price discovery process and indicate a dominance
of non-HFTs in processing soft information and impounding it into stock prices.
3.3.4 Influence of Information Events on Trading Profits
In this section, I use HFT profits to characterize the different information events. I
adapt profit measures based on Menkveld (2013) and Brogaard et al. (2013). Specifi-
cally, I assume that HFTs start with zero inventory at the occurrence of the informa-
tion shock (t = 0) and cumulate profit after the shock (t = 1, ...,12). This measure is
denoted Real in the results in Table 3.10. In the spirit of Menkveld (2013) and Bro-
gaard et al. (2013), Real can be further decomposed into a “positioning” profit and a
cash flow profit,
Realt =t
∑i=0
IMB_HFTi ∗ PT −t
∑i=0
HFTt, (3.3)
where t denotes the 10 second interval, IMB_HFTt is the closing imbalance (num-
ber of shares bought minus number of shares sold) of HFT trades in number of shares
at the end of t, PT is the closing quote midpoint at the end of t in dollars, and HFTt is
HFT net trading in dollars (buy volume minus sell volume). I distinguish between ini-
tiated and passive trades for HFT imbalance (IMB_HFTinit,t, IMB_HFTpass,t) and net
trading (HFTinit,t, HFTpass,t). Since participants of a trade are exhaustively indexed
as either HFT or non-HFT, this also implies that the non-HFT profit is the negative of
HFT profit.
I further compute fictitious profits that would have been realized from trading only
in the ten second interval in which the information shock occurs (Fast), in the time
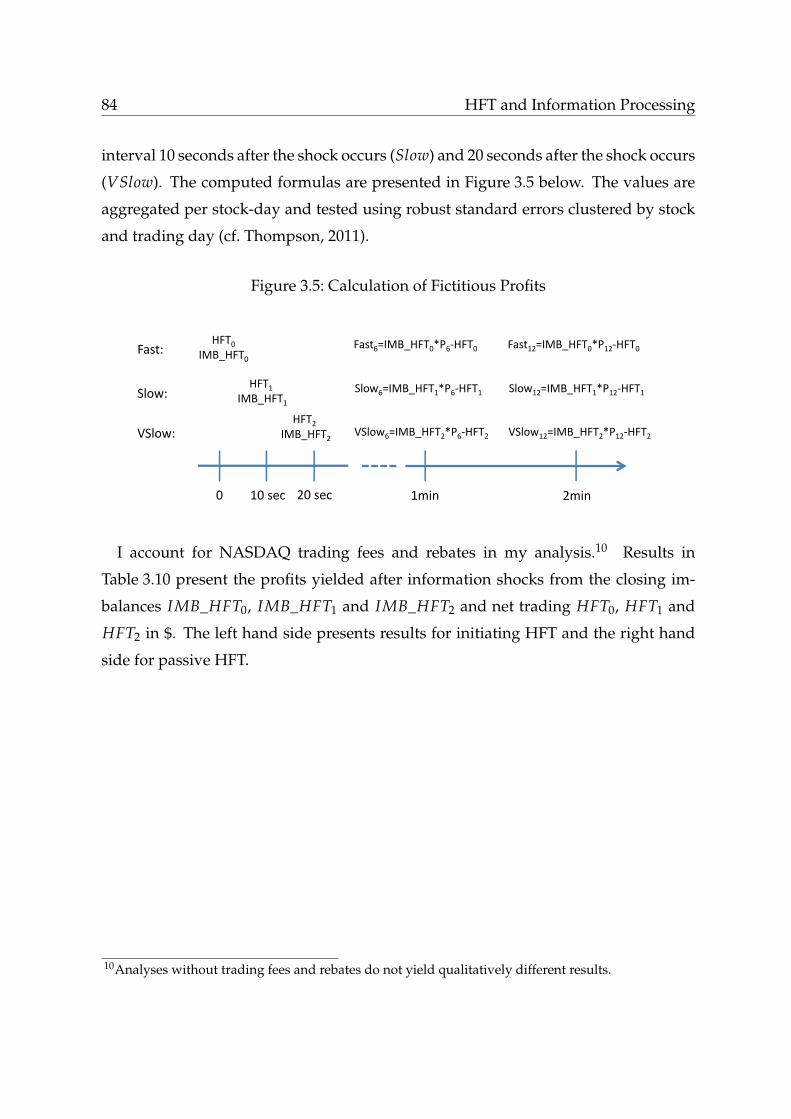
84 HFT and Information Processing
interval 10 seconds after the shock occurs (Slow) and 20 seconds after the shock occurs
(VSlow). The computed formulas are presented in Figure 3.5 below. The values are
aggregated per stock-day and tested using robust standard errors clustered by stock
and trading day (cf. Thompson, 2011).
Figure 3.5: Calculation of Fictitious Profits
0 1min 2min10 sec 20 sec
HFT0IMB_HFT0
Fast: Fast6=IMB_HFT0*P6‐HFT0
HFT1IMB_HFT1Slow: Slow6=IMB_HFT1*P6‐HFT1
VSlow:HFT2
IMB_HFT2 VSlow6=IMB_HFT2*P6‐HFT2
Fast12=IMB_HFT0*P12‐HFT0
Slow12=IMB_HFT1*P12‐HFT1
VSlow12=IMB_HFT2*P12‐HFT2
I account for NASDAQ trading fees and rebates in my analysis.10 Results in
Table 3.10 present the profits yielded after information shocks from the closing im-
balances IMB_HFT0, IMB_HFT1 and IMB_HFT2 and net trading HFT0, HFT1 and
HFT2 in $. The left hand side presents results for initiating HFT and the right hand
side for passive HFT.
10Analyses without trading fees and rebates do not yield qualitatively different results.
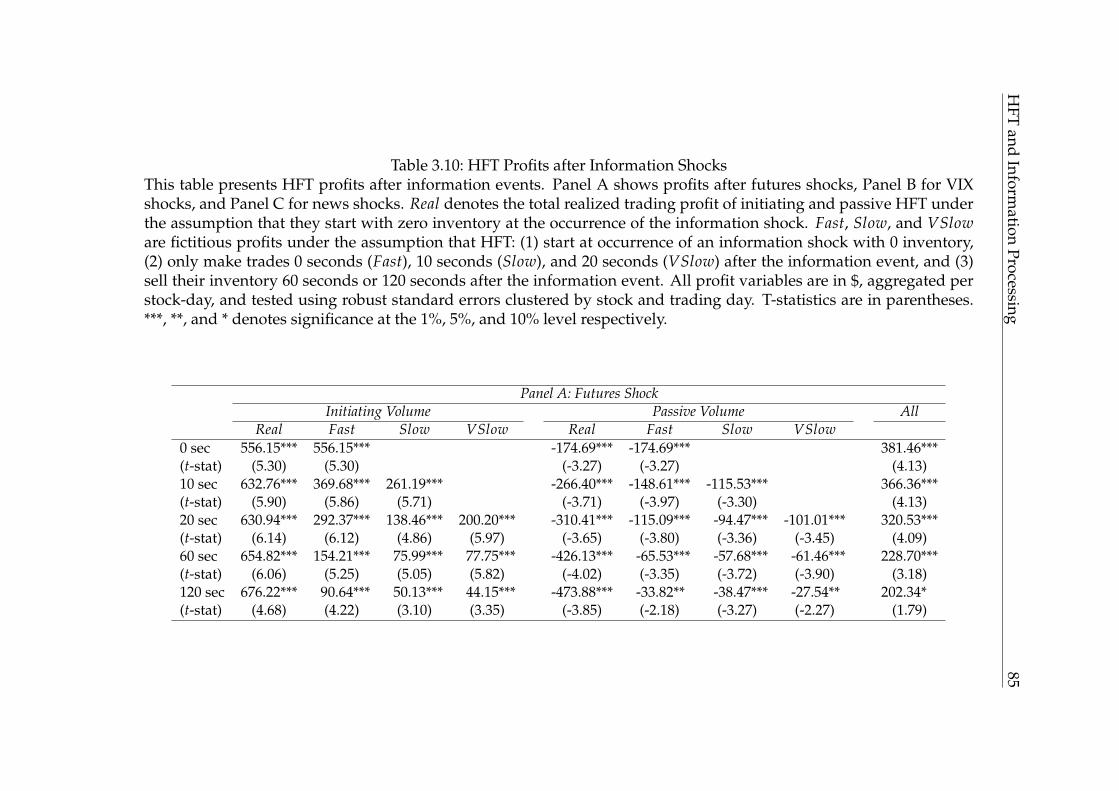
HFT
andInform
ationProcessing
85
Table 3.10: HFT Profits after Information ShocksThis table presents HFT profits after information events. Panel A shows profits after futures shocks, Panel B for VIXshocks, and Panel C for news shocks. Real denotes the total realized trading profit of initiating and passive HFT underthe assumption that they start with zero inventory at the occurrence of the information shock. Fast, Slow, and VSloware fictitious profits under the assumption that HFT: (1) start at occurrence of an information shock with 0 inventory,(2) only make trades 0 seconds (Fast), 10 seconds (Slow), and 20 seconds (VSlow) after the information event, and (3)sell their inventory 60 seconds or 120 seconds after the information event. All profit variables are in $, aggregated perstock-day, and tested using robust standard errors clustered by stock and trading day. T-statistics are in parentheses.***, **, and * denotes significance at the 1%, 5%, and 10% level respectively.
Panel A: Futures ShockInitiating Volume Passive Volume All
Real Fast Slow VSlow Real Fast Slow VSlow0 sec 556.15*** 556.15*** -174.69*** -174.69*** 381.46***(t-stat) (5.30) (5.30) (-3.27) (-3.27) (4.13)10 sec 632.76*** 369.68*** 261.19*** -266.40*** -148.61*** -115.53*** 366.36***(t-stat) (5.90) (5.86) (5.71) (-3.71) (-3.97) (-3.30) (4.13)20 sec 630.94*** 292.37*** 138.46*** 200.20*** -310.41*** -115.09*** -94.47*** -101.01*** 320.53***(t-stat) (6.14) (6.12) (4.86) (5.97) (-3.65) (-3.80) (-3.36) (-3.45) (4.09)60 sec 654.82*** 154.21*** 75.99*** 77.75*** -426.13*** -65.53*** -57.68*** -61.46*** 228.70***(t-stat) (6.06) (5.25) (5.05) (5.82) (-4.02) (-3.35) (-3.72) (-3.90) (3.18)120 sec 676.22*** 90.64*** 50.13*** 44.15*** -473.88*** -33.82** -38.47*** -27.54** 202.34*(t-stat) (4.68) (4.22) (3.10) (3.35) (-3.85) (-2.18) (-3.27) (-2.27) (1.79)

86H
FTand
Information
Processing
Panel B: VIX ShockInitiating Volume Passive Volume All
Real Fast Slow VSlow Real Fast Slow VSlow0 sec 264.27*** 264.27*** -104.05*** -104.05*** 160.21***(t-stat) (5.77) (5.77) (-3.31) (-3.31) (3.67)10 sec 483.74*** 262.97*** 219.22*** -211.70*** -124.26*** -85.45** 272.04***(t-stat) (5.88) (5.96) (5.41) (-3.50) (-4.13) (-2.50) (3.58)20 sec 606.78*** 194.61*** 220.40*** 191.78*** -316.90*** -90.31*** -128.53*** -98.07*** 289.88***(t-stat) (6.07) (6.33) (5.47) (5.39) (-3.90) (-3.03) (-4.18) (-4.01) (3.85)60 sec 784.33*** 120.43*** 91.64*** 94.18*** -512.75*** -57.83*** -73.51*** -75.27*** 271.58***(t-stat) (6.29) (6.11) (4.81) (4.22) (-4.43) (-3.19) (-4.29) (-4.42) (3.44)120 sec 962.52*** 75.26*** 67.68*** 64.95*** -651.26*** -29.35*** -44.51*** -50.51*** 311.26***(t-stat) (6.05) (3.53) (3.97) (4.24) (-4.38) (-3.01) (-3.34) (-3.96) (2.85)
Panel C: News ShockInitiating Volume Passive Volume All
Real Fast Slow VSlow Real Fast Slow VSlow0 sec 10.43*** 10.43*** -15.03*** -15.03*** -4.60(t-stat) (3.02) (3.02) (-3.14) (-3.14) (-1.04)10 sec 17.76 5.54 12.14* 19.86 23.87 -3.89 37.62**(t-stat) (0.48) (0.15) (1.93) (0.41) (0.49) (-0.75) (2.27)20 sec 34.82 0.45 6.59 27.79* 26.98 21.72 3.39 1.86 61.80*(t-stat) (0.78) (0.01) (0.40) (1.81) (0.54) (0.45) (0.24) (0.23) (1.87)60 sec 55.29* 18.87** -2.49 -10.57 -16.59 1.36 9.86 14.20 38.71(t-stat) (1.77) (2.09) (-0.11) (-0.98) (-0.47) (0.07) (0.56) (1.21) (1.02)120 sec 136.31** 27.19*** 25.26 2.17 -76.39 -1.42 4.93 11.05 59.93(t-stat) (2.03) (2.66) (1.01) (0.30) (-1.30) (-0.12) (0.34) (0.77) (1.28)
HFT and Information Processing 87
The profit results support results on trading reaction. In terms of the characteri-
zation of the different information shocks, I can see clear differences: Futures shocks
imply a strong and decreasing reaction in realized trading profits. In terms of HFT
reaction, speed is vital: Profits from fast reaction ($556.15) deteriorates by more than
30% if realized after 10 seconds and only yields one sixth of the actually realized profit
after two minutes. Compared to profits from slower reaction to information events
($261.19 for Slow and $200.20 VSlow), the profits are less than half of the profits of fast
HFTs. On the other side, passive HFTs get adversely selected which is also reflected
in their profits. In total, HFTs gain their highest profits in the short run directly after
the shock and their profits monotonously decrease. VIX shocks yield similar results
to futures shocks, but differently to futures shocks, the initiating profits as well as the
total profits are increasing.
News shocks induce weaker reactions in realized trading profits in absolute terms,
but profits are increasing in the long run. The interesting result here is that despite
high adverse selection losses of passive trades, HFTs are able to gain positive profits in
total. Additionally, profits of slower trades are higher than those of fast trades which
can be explained that HFTs wait for the market reaction before actually trading on
soft information.
In terms of profits, non-HFTs experience disadvantages for both hard and soft in-
formation: They do not realize short-term profits on hard information since HFTs are
faster in processing this type of information. Furthermore, they do not seize profit
opportunities available in periods of high volatility, but increase their net trading
in periods of low volatility when profits are low. Additionally, for soft information
shocks, HFTs are able to interpret market reaction comparably fast and gain positive
profits within the twenty second period after the news event.
A differentiation between crisis, pre-crisis, and post-crisis periods (for a definition
of the periods see Section 3.3.2) gives insight into profit opportunities in the respec-
tive time period. Results are presented in Table A.3. Profit opportunities after futures
shocks are higher during the financial crisis and more short-lived. In the crisis pe-
riod, realized as well as fictitious trading profits are decreasing within two minutes
while they are increasing in the other time periods. Consequently, the importance of
88 HFT and Information Processing
speed is even higher in crisis periods with high volatility. Similar to the total results,
Fast yields the highest profit compared to Slow and VSlow. Apart from the fact that
profit opportunities are more short-lived in the crisis period, the results do not yield
qualitatively different results.
There are several limitations to this study. I do not test for causality in the analy-
ses. Therefore, the results are restricted to the impact on specific trade variables after
controlling for specified lagged variables. I use a relatively short time period after the
information events though the applied models are robust to different time lags. Fur-
thermore, I discuss possible correlations between information events in Section 3.2
and do not find any relevant interrelationships between the chosen events. Further
research should be done to include other information events, such as earnings an-
nouncements and macroeconomic news. An in-depth analysis at the 1 second-level
as well as longer time periods might be important in order to make inferences on the
exact duration of the information impacts.
3.4 Summary
I analyze the impact of different kinds of information events on HFT and non-HFT,
on price discovery as well as on trading profits for short and long time periods. I
follow the classification of hard quantitative and soft qualitative information shocks
by Petersen (2004). Based on the analysis of futures return shocks as well as news
events, I find that information processing in financial markets is split into two speed
domains: The high frequency world is dominated by HFT that trade on hard infor-
mation shocks within a short time period. This dominance is also reflected in the
short-term price discovery and short-term trading profits. On the other side, the non-
high frequency world is still dominated by non-HFTs that process soft information
and lead long-run price discovery.
Recent developments have shown a trend towards machine-processable news and
a general hardening of soft information. In addition to existing concerns associated
with HFT, these algorithms might give rise to even greater concerns than traditional
HFT algorithms due to misinterpretation of and overreaction to events. In my anal-

HFT and Information Processing 89
ysis, I cannot confirm this development although my analysis is limited to a data
sample from 2008 to 2009. My results might ease some of these concerns towards
soft information processing, but also point to an edge of HFTs over non-HFTs in the
speed of hard information processing. Thus, I cannot draw a consistently positive
or negative image for HFT overall, but provide a more differentiated insight with re-
spect to differentiation of initiating and passive trading, the effect on different time
frequencies, and hard and soft information.

Chapter 4
HFT and Human Trading Behavior
Discussions on HFT are controversial with respect to whether the impact of HFT on
market quality and retail traders are overly positive or negative. Proponents empha-
size the overall positive effects on financial markets, such as lower transaction costs as
well as higher liquidity and efficiency, that also retail traders benefit from (Financial
Times, 2009). Opponents argue that due to the superior speed and processing power
of HFTs, ordinary investors would be “left in the dust” (Wall Street Journal, 2011a)
when put into competition with HFTs. Empirical literature so far has focused on the
overall effects of HFT on market quality and efficiency, while the impact on human
trading behavior is difficult to identify. Another challenging aspect for empirical re-
search is the gradual automation in financial markets and thus the impossibility of a
clean separation of a world with and without computerized agents.
In order to systematically investigate the impact of computer trading on markets
and trading behavior, I conduct a controlled lab experiment. Experiments are an un-
derused method in finance (c.f. Bloomfield and Anderson, 2010), mostly due to their
limited external validity. Conducting experiments can, however, serve as a comple-
mentary approach where field data cannot be obtained and where there is a lack of
observability. Both conditions apply when aiming at isolating the gradual effect of
computer trading on trading behavior and overall market efficiency. To the best of my
knowledge, this is the first experiment with physiological measurements that inves-
tigates a financial market setting with both trading agents and human participants.
In this experiment, I focus specifically on three questions: (1) whether the interac-
91
92 HFT and Human Trading Behavior
tion of human traders with computer agents has a systematic influence on their trad-
ing behavior and (2) on their emotional state, and (3) whether this influence translates
into differences in market outcome. I distinguish between computer agents with dif-
ferent trading speed. Moreover, I measure the participants’ heart rates as proxies for
their overall level of emotional arousal as well as intensities of emotional responses
to specific market events.
I find that the presence of slow trading agents leads to a decrease of price aggres-
siveness and to a slight increase in market efficiency. This is due to the lower level
of competitiveness of human traders against computer agents than against other hu-
man traders. The introduction of fast trading agents however increases the time pres-
sure on human traders and thus increases their price aggressiveness. Furthermore,
I find that the human traders’ emotional states are affected by the presence of com-
puter agents as well as their speed. Physiological measurement allows to make infer-
ences on the emotional state of human traders in different market settings. Results of
heart rate measurement are consistent with the findings for trading behavior, but al-
low deeper insight into the underlying visceral processes when humans interact with
agents of different speed: While fast trading agents induce a higher level of arousal
due to an increasing “time pressure”, slower agents cause a “de-emotionalization” of
human participants and thus a lower level of arousal than in human-only markets.
From the results, I can make inferences on the reaction of human traders in their
reaction and emotional arousal to the presence and speed of trading agents. In the
experiment, the market is transparent to the extent that the number of trading agents
is known ex ante, but the counterparties of the transactions are not revealed. The
amount of HFT is quantified at around 50% of the overall equity trading volume in
the U.S. (Sussman, 2012) and the identity of counterparties is not revealed. Thus,
I argue that this setting provides a similar context with respect to the level of trans-
parency that is provided to human traders in real-world financial markets. Consistent
with empirical literature on HFT, I find that trading agents have a positive effect on
efficiency and liquidity (cf. Hendershott et al., 2011; Chaboud et al., 2013). The exper-
imental environment also allows to draw inferences on individual trading behavior
and emotional arousal: While the presence of slow agents leads to a decrease of price
HFT and Human Trading Behavior 93
aggressiveness and emotional arousal, fast agents induce higher aggressiveness and
arousal.
4.1 Related Literature and Hypothesis Development
There are several strands of literature that are related to this paper, specifically in the
areas experimental finance and NeuroIS as well as market microstructure and mech-
anism design, but also to psychological research. In this experiment, I am specifi-
cally interested in the impact of computer agent presence on trading behavior and
arousal and how behavioral differences translate into differences in market efficiency
and liquidity. To explain the differences in arousal and trading behavior, I draw in-
ferences from psychological literature on “competitive arousal”. As argued by Ku
et al. (2005), “competitive arousal” involves factors such as “rivalry, social facilita-
tion, time pressure, and/or the uniqueness of being first” which can fuel arousal and
possibly impair decision-making. I combine this line of literature with the strand of
market microstructure literature on trading aggressiveness and market quality and
draw methodological links to experimental finance and economics and NeuroIS.
4.1.1 Experimental and Neuro Finance
This study is closely related to experimental studies with a focus on behavioral bi-
ases and market design issues as well as their effects on market quality. Bloomfield
et al. (2009) introduce noise traders to their experimental market that mostly follow
contrarian strategies. This leads to an increase in market volume and liquidity. I
similarly introduce trading agents to the experimental markets which follow a profit
maximization strategy. This leads to increases in market volume and liquidity as
well. In the context of emotional arousal and excitement, Andrade et al. (2012) pro-
vide evidence of larger asset bubbles in experimental markets where participants are
shown exciting videos before. In the experimental markets, I find different levels of
emotional arousal across treatments, which are not induced by videos or pictures but
are integral to the trading task. The different levels of arousal in this experiment can
94 HFT and Human Trading Behavior
thus be isolated as a result from the varying number of trading agents as well as the
differences in market conditions.
Within the last ten years, researchers also started to draw upon the advances in
cognitive neuroscience in order to gain a deeper understanding of the traders’ emo-
tional processes. Due to the dynamic interaction in markets, most of the studies that
focus on competitive market interaction build on psychophysiological parameters as
these can be collected for several individuals simultaneously. Among the first, Lo
and Repin (2002) measure psychophysiological parameters of professional security
traders during live trading sessions in the field. The authors find that traders exhibit
emotional responses to market events and that senior traders show a different pattern
of emotional arousal than junior traders. Similarly, Fenton-O’Creevy et al. (2012) find
that experienced traders exhibit a higher degree of heart rate variability, which can
be interpreted as a higher individual capacity for emotion regulation. Based on heart
rate measurements, Smith and Dickhaut (2005) provide evidence that the design of
the market mechanism has an influence on the degree of emotions experienced by
market participants. Building on these results, Adam et al. (2013) find that arousal
can in fact mediate the impact of market design on human behavior.
As argued by Ku et al. (2005), interaction with other humans can induce competi-
tive arousal in the human traders which is driven by social facilitation, time pressure,
and rivalry. These higher levels of arousal are known to push humans to deviate from
previously chosen strategies and to increase their willingness to take risk (e.g. Maule
et al., 2000). With the increasing presence of computerized trading agents in financial
markets though, both social facilitation and rivalry may be less intense. As a result,
the human traders’ arousal levels as well as their impact on trading behavior may be
mitigated. In this context, Teubner et al. (2012) find in an auction lab experiment that
human bidders exhibit less arousal and experience emotions less intensely when they
are facing computerized rather than human opponents. It is important to highlight
that their experiment focused on static first-price sealed-bid auctions. In contrast, this
study investigates the dynamic interaction of traders in continuous double auctions.
Thus, I concentrate on the following research questions in Section 4.5.1 and 4.5.2:
HFT and Human Trading Behavior 95
Research Question 4a: Are humans more or less emotionally aroused when
trading against computer agents than against other humans?
Research Question 4b: Do differences in emotional arousal affect trading be-
havior?
4.1.2 Market Microstructure and Mechanism Design
The experimental design is oriented along the classic experiments of Smith (1962)
and Gode and Sunder (1993). In his seminal work in experimental economics, Smith
(1962) demonstrates the efficiency of the double auction mechanism in different ex-
perimental market settings. A double auction allows buyers and sellers to submit
their buy orders (bids) or sell orders (asks) continuously and asynchronously at any
time during a trading period. The market design is closely related to his setting in
order to reduce effects that are common for other market designs, such as informa-
tion processing activities (e.g. Plott and Sunder, 1988) or behavioral biases such as the
disposition effect (Weber and Camerer, 1998) or overconfidence (Biais et al., 2005). A
similar design is applied by Gode and Sunder (1993) who conduct double auction ex-
periments for human participants and zero intelligence (ZI) traders separately. They
demonstrate that the combination of the double auction design and the budget con-
straint of otherwise irrational trading agents still leads to a convergence of transaction
prices towards the equilibrium price and thus an efficient market outcome.
In order to provide a more realistic scenario of competition against trading agents
in the context of AT and HFT, I apply zero intelligence plus (ZIP) agents in this ex-
periment. The ZIP algorithm, developed by Cliff and Bruten (1997b) as a response to
the Gode and Sunder (1993) experiment, is a learning algorithm that yields a better
performance in double auction markets by executing simple profit maximization (see
Section 4.3.4 for details). There are several demonstrations that ZIP agents achieve
a higher trading performance in competition with human traders for fast as well
as slow trading speeds (cf. Das et al., 2001). However, economic implications were
restricted due to limited number of observations and the complexity of the market
design.
96 HFT and Human Trading Behavior
The results are further related to the increasing literature on HFT and AT. Hen-
dershott et al. (2011) show that an increase in AT leads to higher market liquidity.
Chaboud et al. (2013) provide evidence that AT improve market efficiency in FX mar-
kets by executing triangular arbitrage strategies. I find similar results in this exper-
iment. The experimental analysis also provides further insight into human trading
behavior and emotions which would be difficult to obtain in a real world scenario.
Consequently, it is important to understand the influence of human trading
behavior on final market outcome. I focus on outcome measures in terms of market
quality, specifically efficiency and liquidity, and draw connections to recent empir-
ical HFT literature. Thus, the following research question is answered in Section 4.5.3.
Research Question 4c: Do differences in human trading behavior in turn trans-
late into differences in market quality?
4.2 A Market Framework for Human-Computer
Interaction
In order to measure human emotions in economic laboratory experiments, I apply
the psychophysiological measurement as proposed by Adam et al. (2011). I further
propose a framework that applies a NeuroIS approach for analyzing competitive
human-computer interaction in large-scale double auction experiments. The frame-
work is depicted in Figure 4.1.
The left hand side of the framework concentrates on human individuals’ strategy
and emotional state. Human behavior can be modeled with a game theoretical ap-
proach. In the context of financial markets, strategic actions involve the submission
of a buy or sell order for a specific quantity and price and at a specific time. The in-
terrelationship of emotional state and strategic behavior plays a vital role in human
decision making. Studies on the emotional state are done extensively in the field of
NeuroIS (Riedl et al., 2010; Dimoka, 2010; Adam et al., 2013).
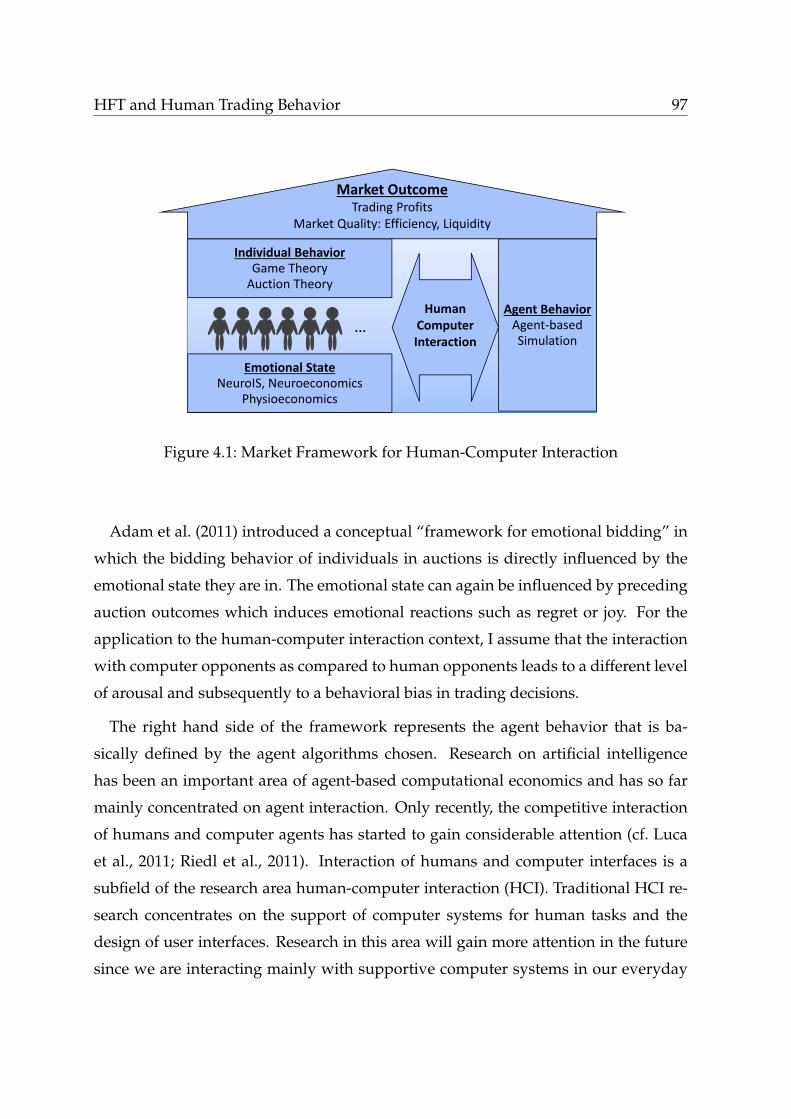
HFT and Human Trading Behavior 97
Individual BehaviorGame TheoryAuction Theory
Emotional StateNeuroIS, Neuroeconomics
Physioeconomics
Agent BehaviorAgent‐basedSimulation
Market OutcomeTrading Profits
Market Quality: Efficiency, Liquidity
Human ComputerInteraction
…
Figure 4.1: Market Framework for Human-Computer Interaction
Adam et al. (2011) introduced a conceptual “framework for emotional bidding” in
which the bidding behavior of individuals in auctions is directly influenced by the
emotional state they are in. The emotional state can again be influenced by preceding
auction outcomes which induces emotional reactions such as regret or joy. For the
application to the human-computer interaction context, I assume that the interaction
with computer opponents as compared to human opponents leads to a different level
of arousal and subsequently to a behavioral bias in trading decisions.
The right hand side of the framework represents the agent behavior that is ba-
sically defined by the agent algorithms chosen. Research on artificial intelligence
has been an important area of agent-based computational economics and has so far
mainly concentrated on agent interaction. Only recently, the competitive interaction
of humans and computer agents has started to gain considerable attention (cf. Luca
et al., 2011; Riedl et al., 2011). Interaction of humans and computer interfaces is a
subfield of the research area human-computer interaction (HCI). Traditional HCI re-
search concentrates on the support of computer systems for human tasks and the
design of user interfaces. Research in this area will gain more attention in the future
since we are interacting mainly with supportive computer systems in our everyday
98 HFT and Human Trading Behavior
life, but also begin to compete with computer agents for specific tasks. I distinguish
between supportive computer systems and competitive computer agents that are so-
phisticated enough to overtake simple or even complex human tasks. The focus in
this framework is on competitive market environments and, thus, I also concentrate
on competitive computer agents.
Market outcome is depicted in the upper part of Figure 4.1. Market outcome can
be characterized by (1) overall market quality measures, such as market liquidity and
market efficiency (Zhang et al., 2011), and (2) individuals’ success measures, such as
trading profits. Work in mechanism design analyzes the effect of different market
mechanisms on human and agent behavior and its subsequent effect on market out-
come. The interaction of strategic behavior and mechanism design is further analyzed
in the field of auction theory. A common market mechanism in financial markets is
the double auction. Double auctions are a market mechanism in which buyers as well
as sellers are able to submit buy orders (bids) and sell orders (offers) and accept bids
and offers simultaneously.
4.2.1 Individual Behavior and Emotional State
NeuroIS is a relatively new field in IS research and the use cases for NeuroIS re-
search have grown considerably. NeuroIS is defined as the application of “cognitive
neuroscience theories, methods, and tools in Information Systems (IS) research” (cf.
Dimoka, 2010). It further understands itself as a “subfield in the IS literature that re-
lies on neuroscience and neurophysiological theories and tools to better understand
the development, use, and impact of information technologies (IT)” (cf. Riedl et al.,
2010). The neuro- and psychophysiological tools include functional magnetic res-
onance imaging (fMRI), electroencephalography (EEG), electrocardiography (ECG),
facial electromyography (EMG), and skin conductance response (SCR).
Examples for IS research issues that can be tackled with NeuroIS methods include
the identification of the TAM in the brain (cf. Dimoka and Davis, 2008) and the in-
teraction of humans with recommendation avatars of different races and gender (cf.
Dimoka et al., 2011; Riedl et al., 2011). Dimoka et al. (2012) outline further research
HFT and Human Trading Behavior 99
directions, some of them described below. In their recent work, Riedl et al. (2012) also
address possible negative effects of technology usage using NeuroIS tools, such as the
increase in “Technostress”, as measured by the increase of cortisol. Another instance
of an increasing amount of stress is auction fever which has been analyzed by Adam
et al. (2011). A model for a more general emotion in competitive situations, “compet-
itive arousal”, is introduced by Ku et al. (2005). Adam et al. (2011) further introduce a
methodological framework which is closely related to the psychophysiological tools
in NeuroIS with a primary focus on economic problems, called “Physioeconomics”.
Physioeconomics extends existing methods of experimental economics by measur-
ing autonomic nervous system activity using well-established psychophysiological
methodology. In the context of electronic markets, these measures can serve as prox-
ies for the emotional processing of human traders.
4.2.2 Application to IS Constructs
Possible IS constructs for the analysis with NeuroIS methods have been outlined by
Dimoka et al. (2011), with a focus on HCI constructs. A popular research focus is the
construct of trust in HCI and its impact on behavior and neurology (e.g. Riedl et al.,
2011; Dimoka, 2010). This line of research is based on the assumption that computer
agents are supportive for humans. Their results might have an unforeseeable impact
not only on the form of communication in the future (with respect to avatar-based
communication for example), but also on the visualization of information systems in
general.
In contrast to the supportive nature of agents, the research focus here is on the IS
construct “competition” (cf. Dimoka et al., 2011). The group of competitive agents has
a different nature than those related to supportive agents. In contrast to the “positive”
construct of trust presented above, competition has a rather negative connotation. As
described by Smith (1776), competition is created by a shortfall of a specific commod-
ity. While HCI literature has traditionally concentrated on supportive computer sys-
tems and the design of these systems, HCI literature on competitive interaction has
been relatively sparse. Williams and Clippinger (2002) analyze aggressiveness of hu-
100 HFT and Human Trading Behavior
man players in computer games. They found that users experienced higher levels of
aggressiveness when playing with computer opponents than with a human stranger
face-to-face. Decety et al. (2004) use neurological tools to shed more light on the vis-
ceral processes underlying competition in human-human interaction. The authors
have understood competition as a “socially rewarding process” in the human-human
context. Competitive human-computer interaction and its neurological impact have
been further studied by Gallagher et al. (2002) and Sanfey et al. (2003). Recent stud-
ies have shown that the human opponents cause more activation with unfair offers
in the ultimatum game (Güth et al., 1982) than computer opponents. This again can
lead to a higher competition towards human opponents due to a social effect. With
the growing sophistication of algorithms, trading agents have gained more abilities
to learn and adapt their behavior to the economic and social environment. I argue
that this kind of smart agents might have different effects on humans since inter-
acting with computer intelligence might have a vital influence on the behavior and
emotional state of human participants.
4.2.3 Market Outcome and Market Design
The analysis of strategic interaction in a competitive environment can be traced back
to the introduction of game theory by von Neumann in 1928. One assumption for
game theoretic analysis is the notion of rational decision makers in the game. The
rational expectation model understands expectations as informed predictions of fu-
ture events and, thus, essentially the same as the predictions of the relevant economic
theory (Muth, 1961). This notion has served as a foundation for auction theory and
mechanism design.
Based on the assumption of rational agents, the field of auction theory studies the
design of market mechanisms and the quality of the market outcome. In recent eco-
nomic literature, experimental economists have departed from the assumptions of
rational agents in the rational expectation model (Camerer, 2003; Adam and Kroll,
2012). The main reasons were behavioral deviations from the rational expectation
model which often yield empirical results in contradiction to theoretical predictions.
HFT and Human Trading Behavior 101
Conducting lab experiments have become a standard methodology in this field of
research.
A challenge in the area of market design is whether with the presence of behavioral
biases, market designs still yield efficient outcomes. The framework is also embedded
into this field. The interrelationships of IS constructs, behavioral biases, and market
outcome are further discussed in Weinhardt et al. (2003).
Double auctions are a commonly used market mechanism for financial assets and
commodities. In comparison to other market mechanisms, it provides flexibility for
traders to update their trades at any point in time. Moreover, double auctions are
efficient and operationally simple.
An experimental double auction was first conducted by Smith (1962) who demon-
strates the mechanism’s efficiency for different market settings. Based on the seminal
work of Smith (1962), further experiments were conducted to demonstrate that a dou-
ble auction market mechanism can force markets with rational as well as irrational
participants to converge to market equilibrium. The latter has been shown by Gode
and Sunder (1993) who conduct simulations with zero intelligence (ZI) traders. ZI
traders are implemented to post random bids and offers within a specific range and
are considered as irrational agents. By imposing a budget constraint on this kind of
traders, Gode and Sunder (1993) are able to show that even markets populated with
these kinds of traders were able to converge to market equilibrium price.
This work has incentivized researchers in computer science to improve agent algo-
rithms with regard to a better performance for a variety of market settings. A promi-
nent type of agent has been developed by Cliff and Bruten (1997b) who named the
agents zero intelligence plus (ZIP). ZIP is a commonly used agent strategy in the area
of agent-based simulation. ZIP traders are able to adapt their profit margin according
to previously accepted or rejected bids and offers.
Further work in this field of “agent-human interaction” is done by Das et al. (2001)
and Grossklags and Schmidt (2003). Thereby, this strand of the literature has put an
emphasis on the improvement of agent algorithms and it was also restricted to an
economically small number of observations. Das et al. (2001) study fast and slow
agents in mixed human-agent markets, but were not able to make robust inferences
102 HFT and Human Trading Behavior
on the impact of agent speed on market efficiency due to a limited number of obser-
vations. Empirical research in finance has shown that latency and speed matters for
the market quality and for trading profits (Riordan and Storkenmaier, 2012; Zhang,
2013).
Implications for Market Design
In the experimental study, I focus on the competitive interaction of humans and com-
puter agents in the context of a financial market. Although the experiment is not
framed as a financial asset experiment, the design is closely related to a continuous
double auction mechanism as used at professional stock exchanges. In order to sim-
plify the market design and to ensure comprehensibility, I restrict the design to one
asset and one market. Additional assets as well as parallel markets would add more
complexity to the setting and are an interesting extension for future research. Regard-
ing market outcome, I specifically concentrate on market efficiency in this study since
it is an important performance criterion and one of the main regulatory concerns in
the current debate on HFT.
Following previous work in the area of NeuroIS, I apply NeuroIS tools in order to
analyze human-computer interaction in the proposed competitive financial market
setting. In order to gain statistically significant results, the number of participants
per session as well as the number of sessions conducted must be sufficiently high.
As pointed out by Dimoka et al. (2012), due to the high cost and time constraints,
fMRI measurements might not be useful for IS theories at the strategy level. There-
fore, I focus on psychophysiological parameters, specifically ECG and SCR, which
offer real-time data. Another important reason for focusing on these measures is that
markets inherently comprise the strategic interaction of many subjects. In this case
study, I simultaneously measure physiological parameters of up to 12 human traders.
Rustichini et al. (1994) theoretically analyzed possible inefficiencies resulting from an
insufficient number of traders. This inefficiency vanishes as soon as more traders
are involved. In more detail, given the expected inefficiency of a double auction as
O(1/m), doubling the number of buyer and seller pairs would result in an expected
HFT and Human Trading Behavior 103
inefficiency of O(1/m ∗ 1/2). With a number of 6 buyers and sellers as in this case, the
expected inefficiency approaches to the one of an optimal mechanism with a precision
of 0.0001 (cf. Rustichini et al., 1994). A market setting therefore requires a critical num-
ber of participants to provide a sufficient result regarding market efficiency. Thus, I
concentrate solely on the psychophysiological measures of the NeuroIS toolset. These
measures provide data that is retrievable in real-time and from a larger pool of sub-
jects. The application of more sophisticated tools, such as fMRI, would be highly
desirable, but unrealistic to achieve at the current state of technology.
In order to ensure a competitive setting, I choose to populate some markets with
ZIP agents. For double auctions, ZIP agents, though rather minimalistic, are suffi-
ciently sophisticated to outperform human traders in specific settings (cf. Das et al.,
2001). In order to make inferences of the specific impact of computer agents on hu-
man participants and test for significant differences in trading behavior and market
efficiency, the treatment structure has to involve treatments with and without com-
puter agents. I further introduce treatments for which I analyze whether the speed
in which trading agents react plays a significant role for the behavior and emotional
state of humans agents and eventually for market efficiency.
4.3 The Experiment
4.3.1 Experimental Design
The market design of this case study builds on the experiments of Smith (1962) and
Gode and Sunder (1993). Each market is constituted by six buyers and six sellers.
Each participant of the experiment either takes the role of a buyer or a seller. Gode
and Sunder (1993) define different market settings as specific supply and demand
functions, which simulate characteristic market situations; such as a market in which
buyers have a higher market power than sellers (buyer market) and vice versa (seller
market). In this experiment, I distinguish between three different market settings,
a symmetric market, a buyer market, and a seller market. Each session comprises
all three market settings. Every market setting is played for 6 consecutive trading
104 HFT and Human Trading Behavior
periods which each lasts 2.5 minutes by each trader.1
In each trading period, every trader is allowed to trade 6 units of an unspecified
commodity. A buyer is privately informed of his or her redemption value vi for unit
i, i = 1, ...,6, which is drawn from the specified supply and demand functions. The
values are randomized for each participant in order to avoid order biases. His or her
trading profits for trading the ith unit are computed as vi− pi. The information about
the (redemption) value of the (i + 1)th is given to the buyer after the successful sell of
the ith unit. The (redemption) values for the six units of his or her tradable units per
trading period are sorted in descending order. On the other side, a seller is privately
informed of the costs vi for unit i, i = 1, ...,6, and the trading profits for trading the
ith unit is computed as pi − vi. The information about the redemption value of the
(i + 1)th unit is given to the seller after the successful buy of his or her ith unit. The
costs for the six units of his or her tradable units per trading period are sorted in
ascending order. Each limit order and each transaction is valid for a single unit, all
orders are cancelled after a transaction, and a crossing of bid and ask prices leads to
a transaction equal to the earlier of the two.
All the above information in Section 4.3.1 is presented to the participants in the
form of hard copy instructions as well as in an oral review of the instructions. The
instructions can be found in Appendix B.1.
4.3.2 Participants and Incentives
The experiment was conducted at the IISM lab at Karlsruhe Institute of Technology.
Following the induced value theory of Smith (1976), I directly link the actions of the
participants to real monetary payoffs and conduct the experiment with university stu-
dents with an academic background in economics. The participants were recruited
from a pool of students using the ORSEE software environment (Greiner, 2004). A to-
tal of 288 students participated in the experiment with a male/female ratio of 77/23.
No student took part in more than one experiment. Students have been frequently
1Moreover, subjects randomly participated in one of two abnormal market settings which are notreported here. The order of the market settings is randomized in order to control for learningeffects and exhaustion.
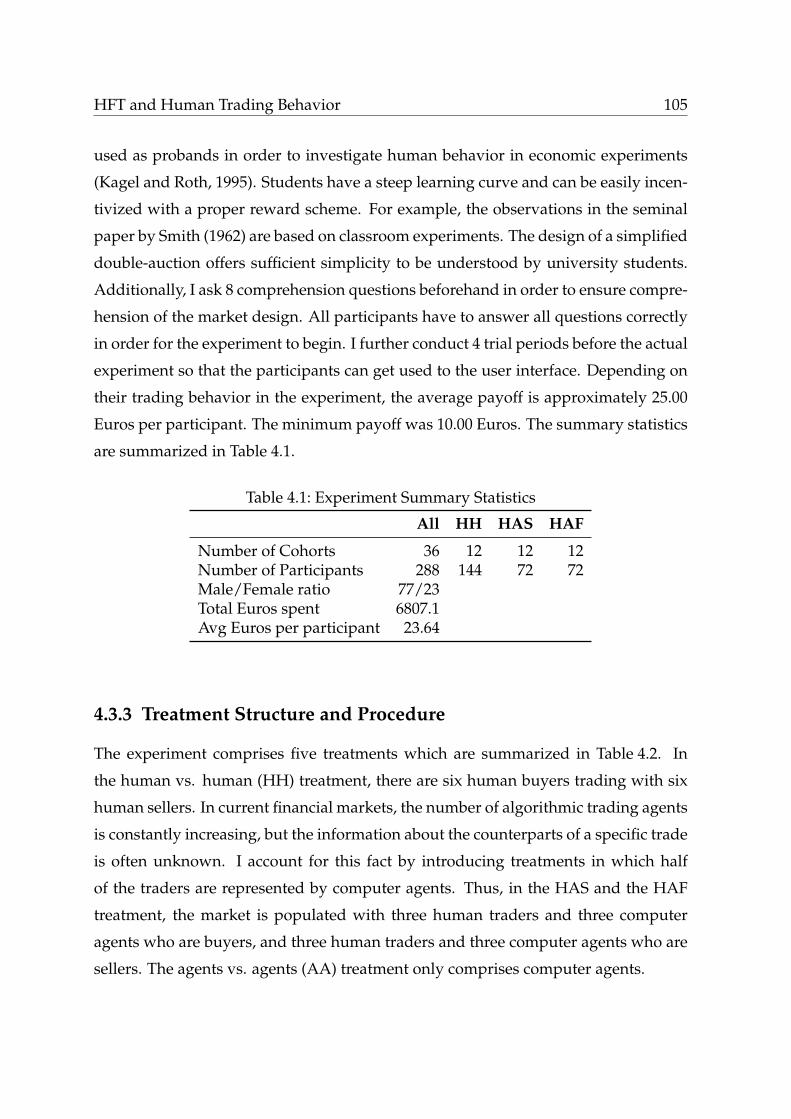
HFT and Human Trading Behavior 105
used as probands in order to investigate human behavior in economic experiments
(Kagel and Roth, 1995). Students have a steep learning curve and can be easily incen-
tivized with a proper reward scheme. For example, the observations in the seminal
paper by Smith (1962) are based on classroom experiments. The design of a simplified
double-auction offers sufficient simplicity to be understood by university students.
Additionally, I ask 8 comprehension questions beforehand in order to ensure compre-
hension of the market design. All participants have to answer all questions correctly
in order for the experiment to begin. I further conduct 4 trial periods before the actual
experiment so that the participants can get used to the user interface. Depending on
their trading behavior in the experiment, the average payoff is approximately 25.00
Euros per participant. The minimum payoff was 10.00 Euros. The summary statistics
are summarized in Table 4.1.
Table 4.1: Experiment Summary Statistics
All HH HAS HAF
Number of Cohorts 36 12 12 12Number of Participants 288 144 72 72Male/Female ratio 77/23Total Euros spent 6807.1Avg Euros per participant 23.64
4.3.3 Treatment Structure and Procedure
The experiment comprises five treatments which are summarized in Table 4.2. In
the human vs. human (HH) treatment, there are six human buyers trading with six
human sellers. In current financial markets, the number of algorithmic trading agents
is constantly increasing, but the information about the counterparts of a specific trade
is often unknown. I account for this fact by introducing treatments in which half
of the traders are represented by computer agents. Thus, in the HAS and the HAF
treatment, the market is populated with three human traders and three computer
agents who are buyers, and three human traders and three computer agents who are
sellers. The agents vs. agents (AA) treatment only comprises computer agents.
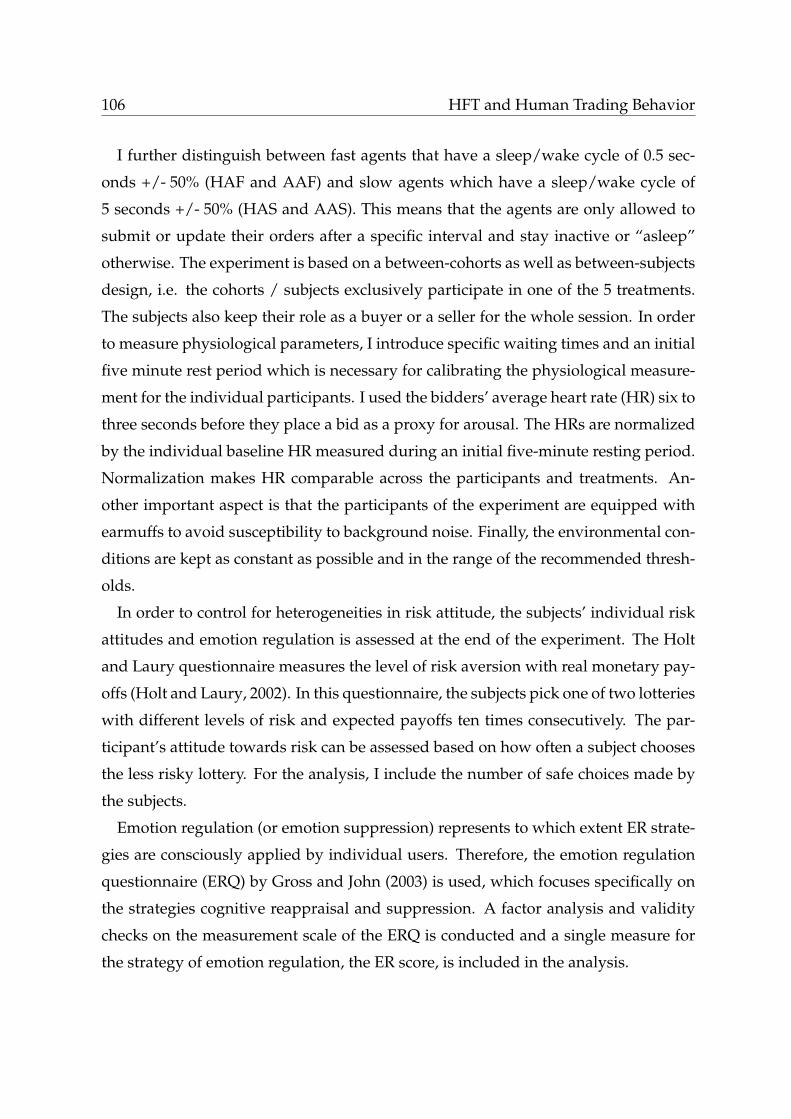
106 HFT and Human Trading Behavior
I further distinguish between fast agents that have a sleep/wake cycle of 0.5 sec-
onds +/- 50% (HAF and AAF) and slow agents which have a sleep/wake cycle of
5 seconds +/- 50% (HAS and AAS). This means that the agents are only allowed to
submit or update their orders after a specific interval and stay inactive or “asleep”
otherwise. The experiment is based on a between-cohorts as well as between-subjects
design, i.e. the cohorts / subjects exclusively participate in one of the 5 treatments.
The subjects also keep their role as a buyer or a seller for the whole session. In order
to measure physiological parameters, I introduce specific waiting times and an initial
five minute rest period which is necessary for calibrating the physiological measure-
ment for the individual participants. I used the bidders’ average heart rate (HR) six to
three seconds before they place a bid as a proxy for arousal. The HRs are normalized
by the individual baseline HR measured during an initial five-minute resting period.
Normalization makes HR comparable across the participants and treatments. An-
other important aspect is that the participants of the experiment are equipped with
earmuffs to avoid susceptibility to background noise. Finally, the environmental con-
ditions are kept as constant as possible and in the range of the recommended thresh-
olds.
In order to control for heterogeneities in risk attitude, the subjects’ individual risk
attitudes and emotion regulation is assessed at the end of the experiment. The Holt
and Laury questionnaire measures the level of risk aversion with real monetary pay-
offs (Holt and Laury, 2002). In this questionnaire, the subjects pick one of two lotteries
with different levels of risk and expected payoffs ten times consecutively. The par-
ticipant’s attitude towards risk can be assessed based on how often a subject chooses
the less risky lottery. For the analysis, I include the number of safe choices made by
the subjects.
Emotion regulation (or emotion suppression) represents to which extent ER strate-
gies are consciously applied by individual users. Therefore, the emotion regulation
questionnaire (ERQ) by Gross and John (2003) is used, which focuses specifically on
the strategies cognitive reappraisal and suppression. A factor analysis and validity
checks on the measurement scale of the ERQ is conducted and a single measure for
the strategy of emotion regulation, the ER score, is included in the analysis.
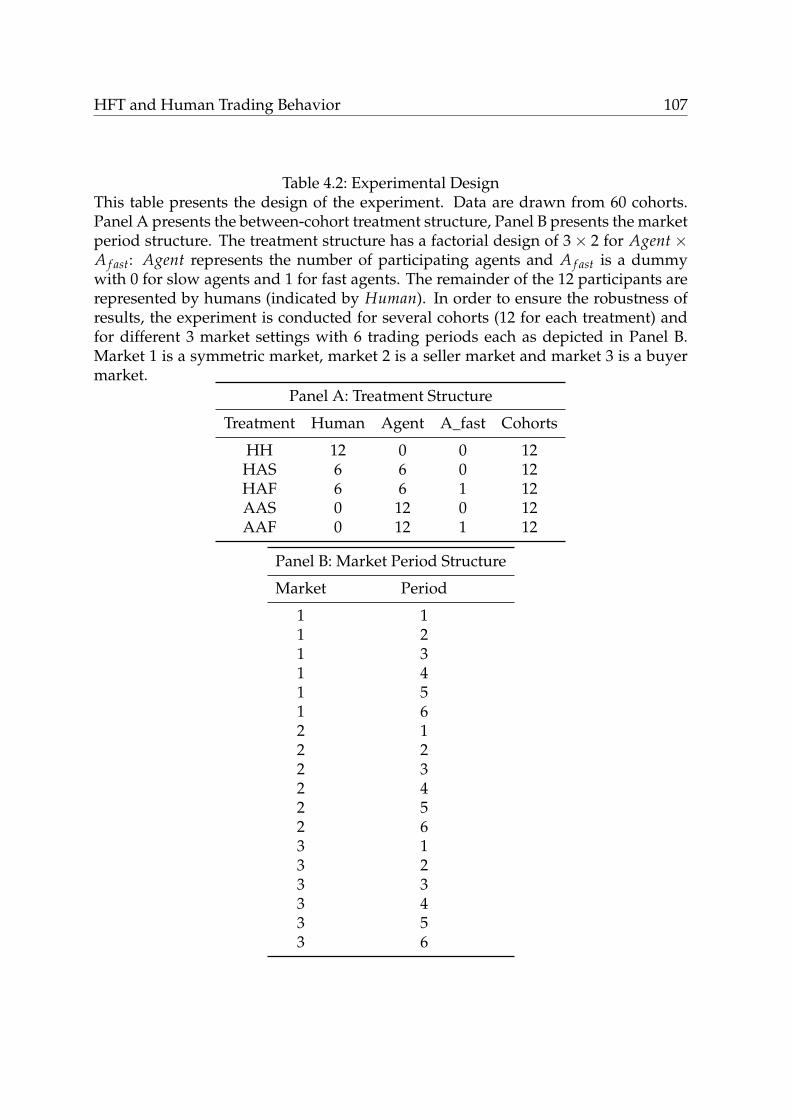
HFT and Human Trading Behavior 107
Table 4.2: Experimental DesignThis table presents the design of the experiment. Data are drawn from 60 cohorts.Panel A presents the between-cohort treatment structure, Panel B presents the marketperiod structure. The treatment structure has a factorial design of 3× 2 for Agent×A f ast: Agent represents the number of participating agents and A f ast is a dummywith 0 for slow agents and 1 for fast agents. The remainder of the 12 participants arerepresented by humans (indicated by Human). In order to ensure the robustness ofresults, the experiment is conducted for several cohorts (12 for each treatment) andfor different 3 market settings with 6 trading periods each as depicted in Panel B.Market 1 is a symmetric market, market 2 is a seller market and market 3 is a buyermarket.
Panel A: Treatment Structure
Treatment Human Agent A_fast Cohorts
HH 12 0 0 12HAS 6 6 0 12HAF 6 6 1 12AAS 0 12 0 12AAF 0 12 1 12
Panel B: Market Period Structure
Market Period
1 11 21 31 41 51 62 12 22 32 42 52 63 13 23 33 43 53 6
108 HFT and Human Trading Behavior
4.3.4 Implementation
The market platform was developed in Java and is based on the OpenExchange soft-
ware environment. OpenExchange is an open-source trading software developed by
De Luca and Cliff (2011). The market design is according to the description above.
The trading interface is depicted in Figure 4.2. It includes the most essential infor-
mation necessary for trading. The left hand side contains the personal information
for a specific trader, such as the treatment he or she is in, the profit gained, the units
traded, and the trade he or she made. The middle part of the interface provides infor-
mation for the order submission. At the top is the order book in which the traders can
see all the orders submitted by other traders as well as his own order ordered by price
and then by the time of submission. The order submission panel offers information
about the value or cost of the current unit of commodity that is currently traded. The
right hand side contains the transaction history of the whole market.
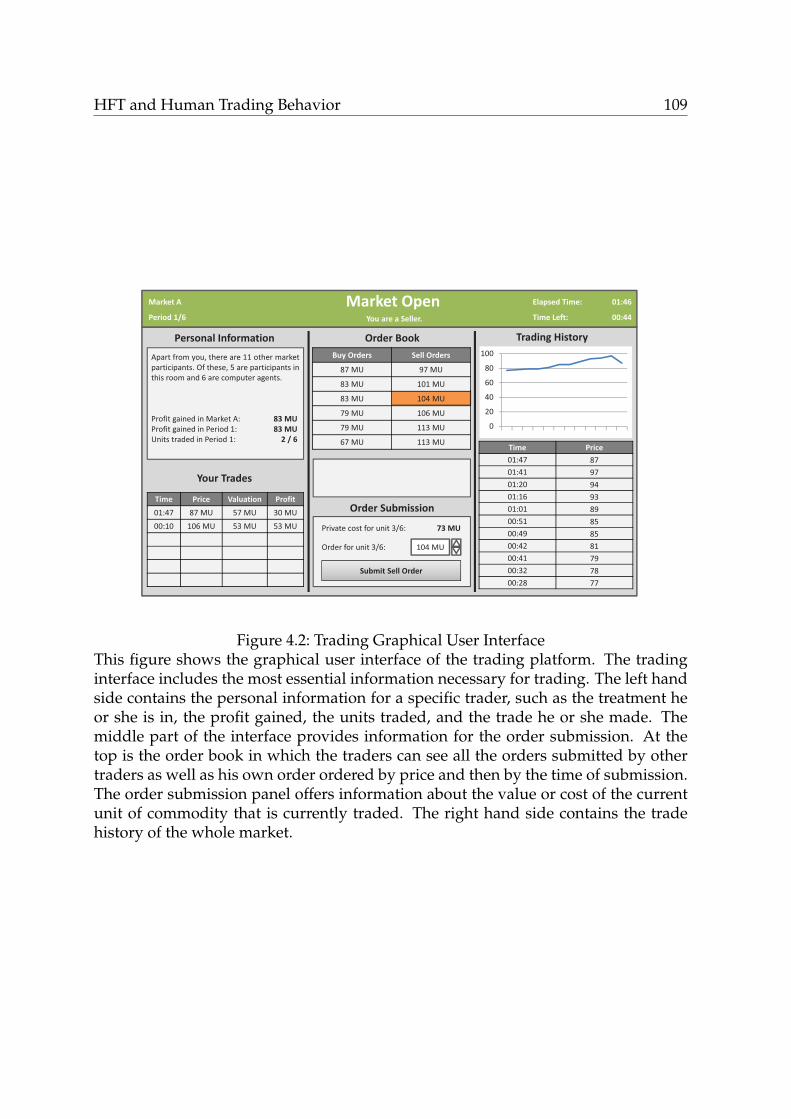
HFT and Human Trading Behavior 109
Market�OpenMarket�A
Period 1/6
Elapsed Time: 01:46�
Time�Left: 00:44
Time Price01:47 8701:41 9701:20 9401:16 9301:01 8900:51 8500:49 8500:42 8100:41 7900:32 7800:28 77
Trading�HistoryOrder�Book
Order�Submission
Submit Sell�Order
104�MUOrder�for unit 3/6:
Private�cost for unit 3/6: 73�MU
Personal�Information
Apart from you, there are 11 other marketparticipants. Of these, 5 are participants inthis room and 6 are computer agents.
Profit�gained in�Market�A: 83�MUProfit�gained in�Period 1: 83�MUUnits�traded in�Period 1: 2�/�6
Time Price Valuation Profit01:47 87�MU 57�MU 30�MU00:10 106�MU 53�MU 53�MU
Your Trades
You are a�Seller.
0
20
40
60
80
100Buy Orders Sell�Orders
87�MU 97�MU
83�MU 101�MU
83�MU 104�MU
79�MU 106�MU
79�MU 113�MU
67�MU 113�MU
Figure 4.2: Trading Graphical User InterfaceThis figure shows the graphical user interface of the trading platform. The tradinginterface includes the most essential information necessary for trading. The left handside contains the personal information for a specific trader, such as the treatment heor she is in, the profit gained, the units traded, and the trade he or she made. Themiddle part of the interface provides information for the order submission. At thetop is the order book in which the traders can see all the orders submitted by othertraders as well as his own order ordered by price and then by the time of submission.The order submission panel offers information about the value or cost of the currentunit of commodity that is currently traded. The right hand side contains the tradehistory of the whole market.
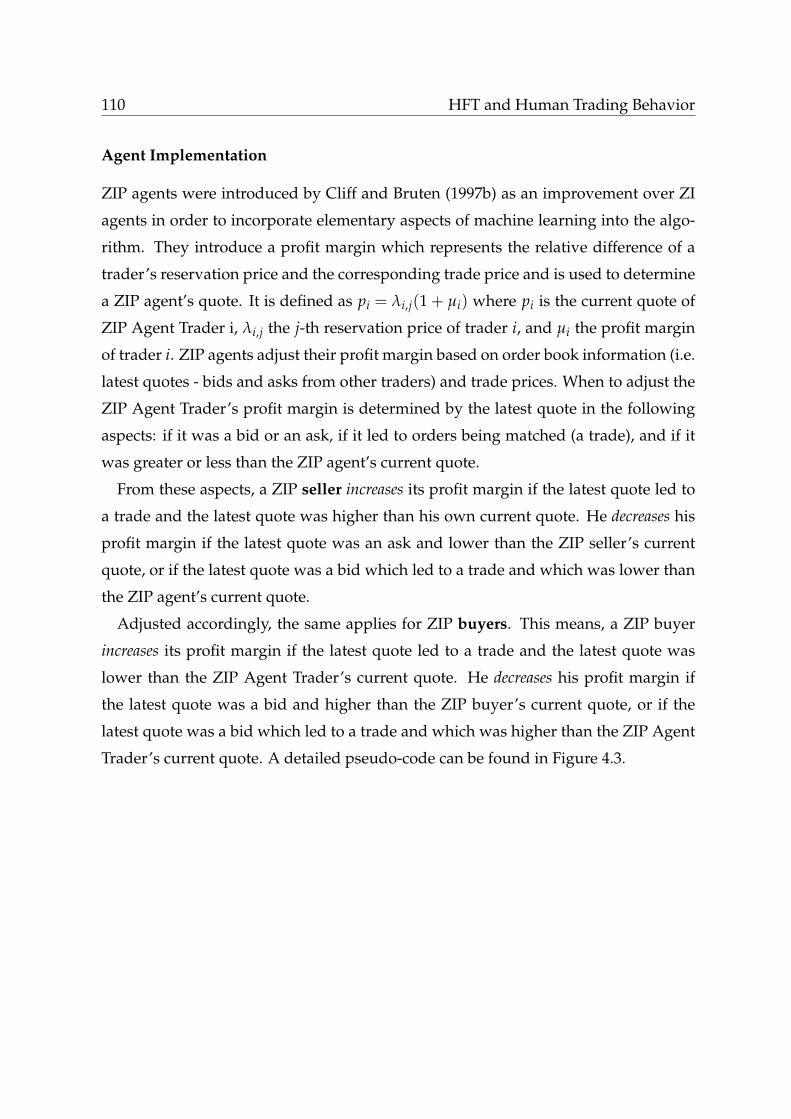
110 HFT and Human Trading Behavior
Agent Implementation
ZIP agents were introduced by Cliff and Bruten (1997b) as an improvement over ZI
agents in order to incorporate elementary aspects of machine learning into the algo-
rithm. They introduce a profit margin which represents the relative difference of a
trader’s reservation price and the corresponding trade price and is used to determine
a ZIP agent’s quote. It is defined as pi = λi,j(1 + µi) where pi is the current quote of
ZIP Agent Trader i, λi,j the j-th reservation price of trader i, and µi the profit margin
of trader i. ZIP agents adjust their profit margin based on order book information (i.e.
latest quotes - bids and asks from other traders) and trade prices. When to adjust the
ZIP Agent Trader’s profit margin is determined by the latest quote in the following
aspects: if it was a bid or an ask, if it led to orders being matched (a trade), and if it
was greater or less than the ZIP agent’s current quote.
From these aspects, a ZIP seller increases its profit margin if the latest quote led to
a trade and the latest quote was higher than his own current quote. He decreases his
profit margin if the latest quote was an ask and lower than the ZIP seller’s current
quote, or if the latest quote was a bid which led to a trade and which was lower than
the ZIP agent’s current quote.
Adjusted accordingly, the same applies for ZIP buyers. This means, a ZIP buyer
increases its profit margin if the latest quote led to a trade and the latest quote was
lower than the ZIP Agent Trader’s current quote. He decreases his profit margin if
the latest quote was a bid and higher than the ZIP buyer’s current quote, or if the
latest quote was a bid which led to a trade and which was higher than the ZIP Agent
Trader’s current quote. A detailed pseudo-code can be found in Figure 4.3.
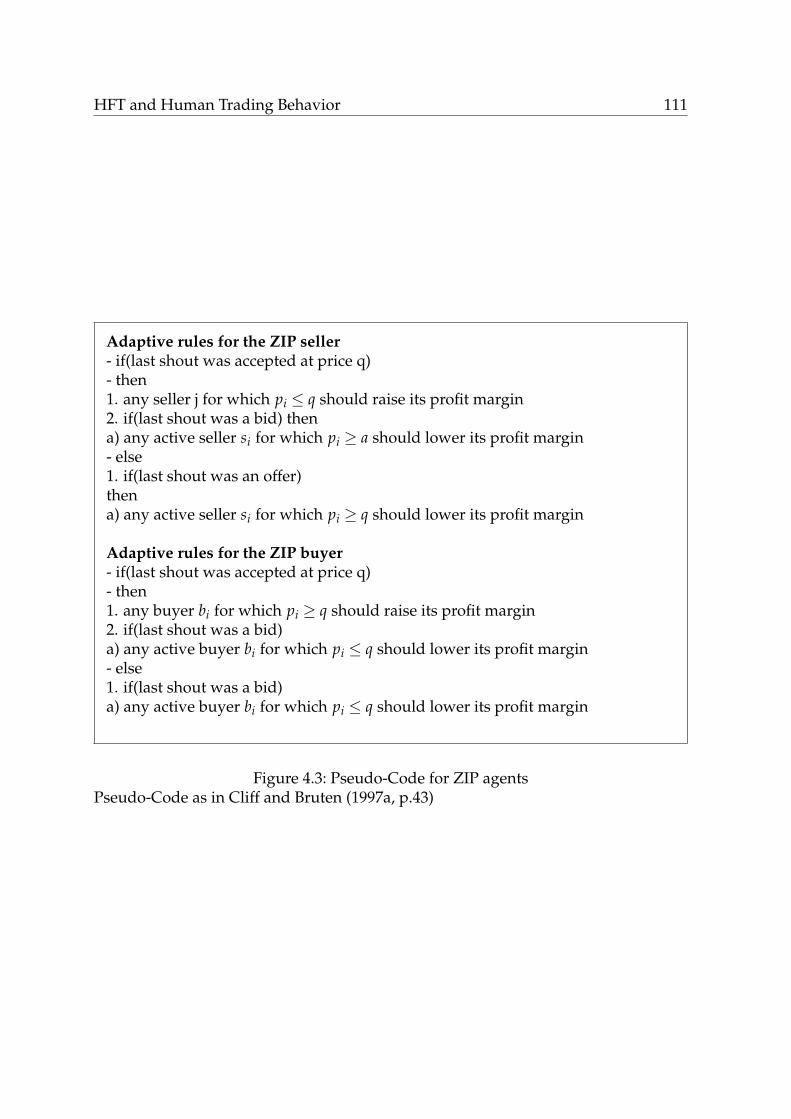
HFT and Human Trading Behavior 111
Adaptive rules for the ZIP seller- if(last shout was accepted at price q)- then1. any seller j for which pi ≤ q should raise its profit margin2. if(last shout was a bid) thena) any active seller si for which pi ≥ a should lower its profit margin- else1. if(last shout was an offer)thena) any active seller si for which pi ≥ q should lower its profit margin
Adaptive rules for the ZIP buyer- if(last shout was accepted at price q)- then1. any buyer bi for which pi ≥ q should raise its profit margin2. if(last shout was a bid)a) any active buyer bi for which pi ≤ q should lower its profit margin- else1. if(last shout was a bid)a) any active buyer bi for which pi ≤ q should lower its profit margin
Figure 4.3: Pseudo-Code for ZIP agentsPseudo-Code as in Cliff and Bruten (1997a, p.43)
112 HFT and Human Trading Behavior
4.4 Statistical Analysis
For the analysis of the different treatments, I use a fixed effects model as well as
a moderator-mediator analysis in order to analyze direct, moderated and mediated
effects on the individual trader level as well as on a market-period level.
4.4.1 Individual Trader Analysis
Due to significant fixed effects for different market settings and trading periods, I
apply a fixed effects model on the individual trader level. I test the different treat-
ments separately, i.e. I introduce a dummy variable for both the HAS and the HAF
treatment. The baseline for each regression model is the HH treatment. As fixed ef-
fects, I include Period fixed effects for periods 1 to 6 as well as for the Marketrole,
i.e. being a buyer / seller in each of the 3 market settings (symmetric, buyer, seller).
Mroler,r = 1, ...,6 represents 6 dummy variables, one for each of the 2 roles (buyer,
seller) in each of the 3 market settings. I estimate the following equation on an indi-
vidual trader level:
Yr,s,i = Intercept + α ∗ HAS + β ∗ HAF +6
∑r=1
γr ∗Mroler
+6
∑s=1
δs ∗ Periods + Controli + εr,s
(4.1)
The Intercept represents the average for the HH treatment in period 6 for a buyer in
the symmetric market. As Control, I include the risk aversion (proxied by the number
of safe choices) and emotion regulation score of every participant. Trading behavior
variables comprise emotional arousal as well as trading and pricing aggressiveness.
I apply the fixed effects model above to analyze the direct treatment effects on trad-
ing behavior and emotional arousal which are depicted as red arrows in Figure 4.4,
Model 1a below. In order to assess the conditional indirect effect of arousal on ag-
gressiveness, i.e. the orange arrow, I conduct a mediator analysis and a bootstrapping
analysis based on 500 bootstrapped samples using 95% confidence intervals.
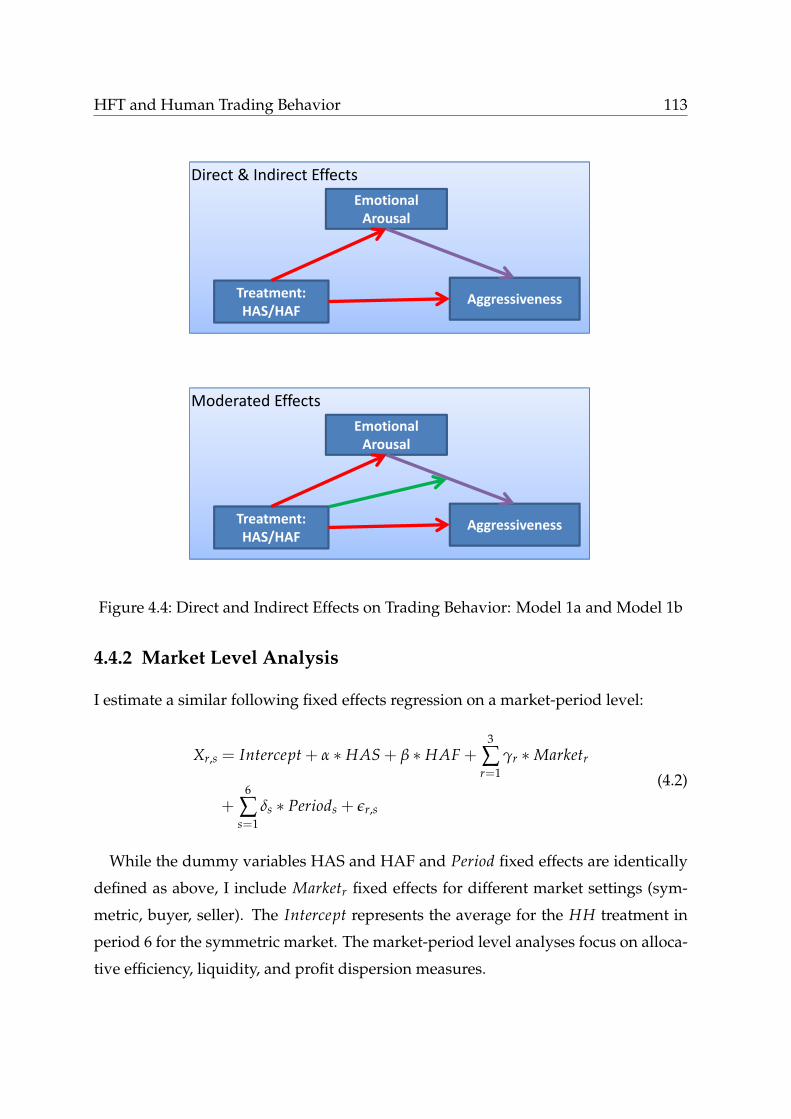
HFT and Human Trading Behavior 113
Direct & Indirect Effects
Treatment: HAS/HAF
Aggressiveness
Emotional Arousal
Moderated Effects
Treatment: HAS/HAF
Aggressiveness
Emotional Arousal
Figure 4.4: Direct and Indirect Effects on Trading Behavior: Model 1a and Model 1b
4.4.2 Market Level Analysis
I estimate a similar following fixed effects regression on a market-period level:
Xr,s = Intercept + α ∗ HAS + β ∗ HAF +3
∑r=1
γr ∗Marketr
+6
∑s=1
δs ∗ Periods + εr,s
(4.2)
While the dummy variables HAS and HAF and Period fixed effects are identically
defined as above, I include Marketr fixed effects for different market settings (sym-
metric, buyer, seller). The Intercept represents the average for the HH treatment in
period 6 for the symmetric market. The market-period level analyses focus on alloca-
tive efficiency, liquidity, and profit dispersion measures.
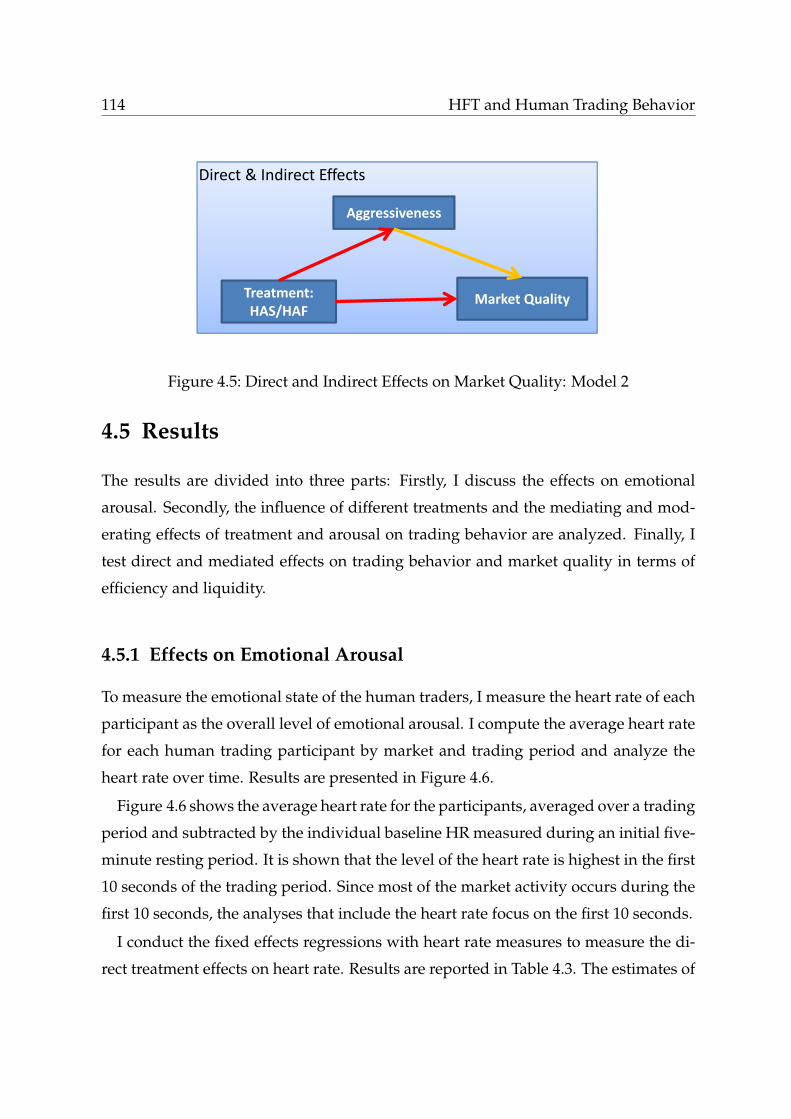
114 HFT and Human Trading Behavior
Direct & Indirect Effects
Treatment: HAS/HAF
Market Quality
Aggressiveness
Figure 4.5: Direct and Indirect Effects on Market Quality: Model 2
4.5 Results
The results are divided into three parts: Firstly, I discuss the effects on emotional
arousal. Secondly, the influence of different treatments and the mediating and mod-
erating effects of treatment and arousal on trading behavior are analyzed. Finally, I
test direct and mediated effects on trading behavior and market quality in terms of
efficiency and liquidity.
4.5.1 Effects on Emotional Arousal
To measure the emotional state of the human traders, I measure the heart rate of each
participant as the overall level of emotional arousal. I compute the average heart rate
for each human trading participant by market and trading period and analyze the
heart rate over time. Results are presented in Figure 4.6.
Figure 4.6 shows the average heart rate for the participants, averaged over a trading
period and subtracted by the individual baseline HR measured during an initial five-
minute resting period. It is shown that the level of the heart rate is highest in the first
10 seconds of the trading period. Since most of the market activity occurs during the
first 10 seconds, the analyses that include the heart rate focus on the first 10 seconds.
I conduct the fixed effects regressions with heart rate measures to measure the di-
rect treatment effects on heart rate. Results are reported in Table 4.3. The estimates of
HFT and Human Trading Behavior 115
the first regression in Panel A show overall differences in the level of arousal. There
are different competing effects of computer agents and agent speed on the emotional
arousal of participants. The HAF treatment induces a significantly higher level of
arousal than the baseline, the HH treatment, which stems from the increased trading
speed and “time pressure”. Interestingly, the HAS treatment depicts a significantly
lower level of arousal.
The results on emotional arousal can be further discussed in the context of the psy-
chological theory on “competitive arousal”. In psychology literature, the construct
of competitive arousal is related to risk taking behavior. Ku et al. (2005) demon-
strates that competition against other human traders induces a high level of compet-
itive arousal as well as higher risk taking behavior. On the other side, the increasing
speed of trading agents also induces a certain “time pressure”. When introducing
fast agents, the number of market events within a time period increases and the con-
vergence towards the equilibrium becomes faster. Therefore, humans must act faster
in order to gain profits. This in turn induces a higher level of time pressure which
then translates into higher arousal and higher risk taking. Therefore, I hypothesize
that there are opposing effects caused by trading agents, such as the effect of “de-
emotionalization”, i.e. the lack of competitiveness towards trading agents, and the
effect of time pressure caused by the presence of fast agents. The experimental results
strengthen the hypothesis of de-emotionalization by slow computer agents, reflected
by a lower heart rate. The decreasing effect is also comparably higher than the in-
creasing time pressure effect by fast agents on arousal. In order to gain more detailed
insight into the effects on actual trading behavior, I further link the results on emo-
tional arousal to behavioral measures of aggressiveness, specifically price and trade
aggressiveness.
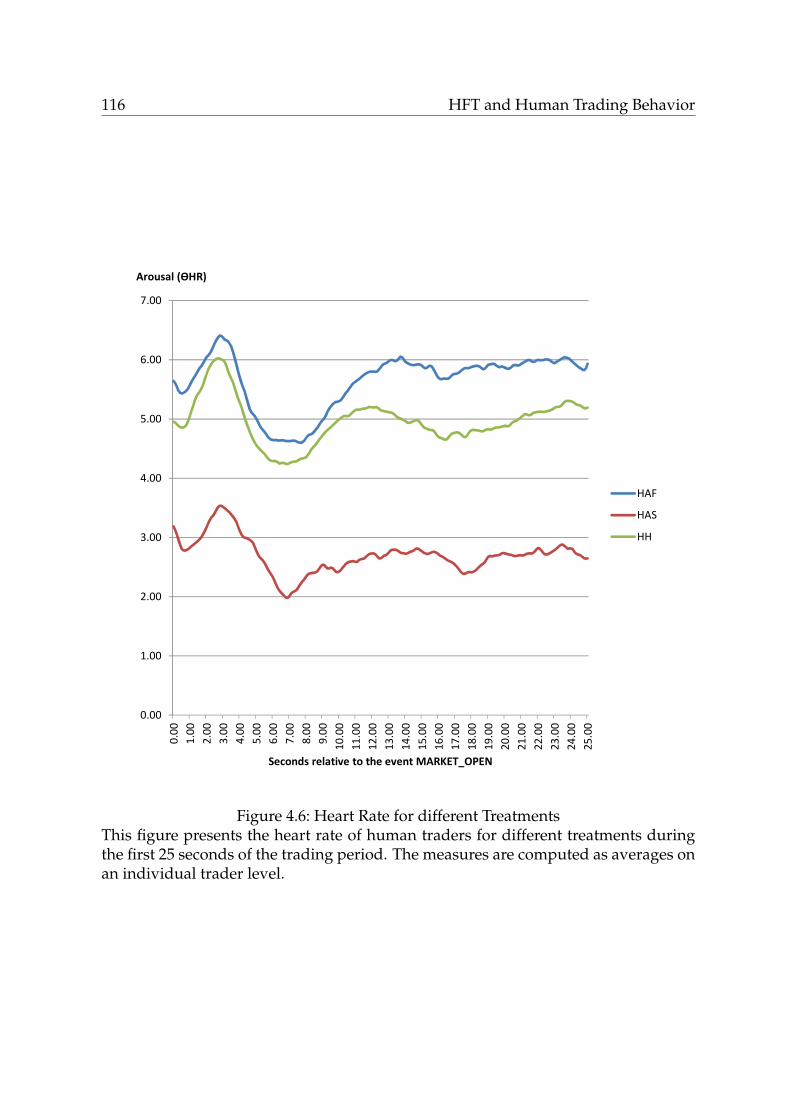
116 HFT and Human Trading Behavior
0.00
1.00
2.00
3.00
4.00
5.00
6.00
7.00
0.00
1.00
2.00
3.00
4.00
5.00
6.00
7.00
8.00
9.00
10.00
11.00
12.00
13.00
14.00
15.00
16.00
17.00
18.00
19.00
20.00
21.00
22.00
23.00
24.00
25.00
Arousal (ϴHR)
Seconds relative to the event MARKET_OPEN
HAF
HAS
HH
Figure 4.6: Heart Rate for different TreatmentsThis figure presents the heart rate of human traders for different treatments duringthe first 25 seconds of the trading period. The measures are computed as averages onan individual trader level.
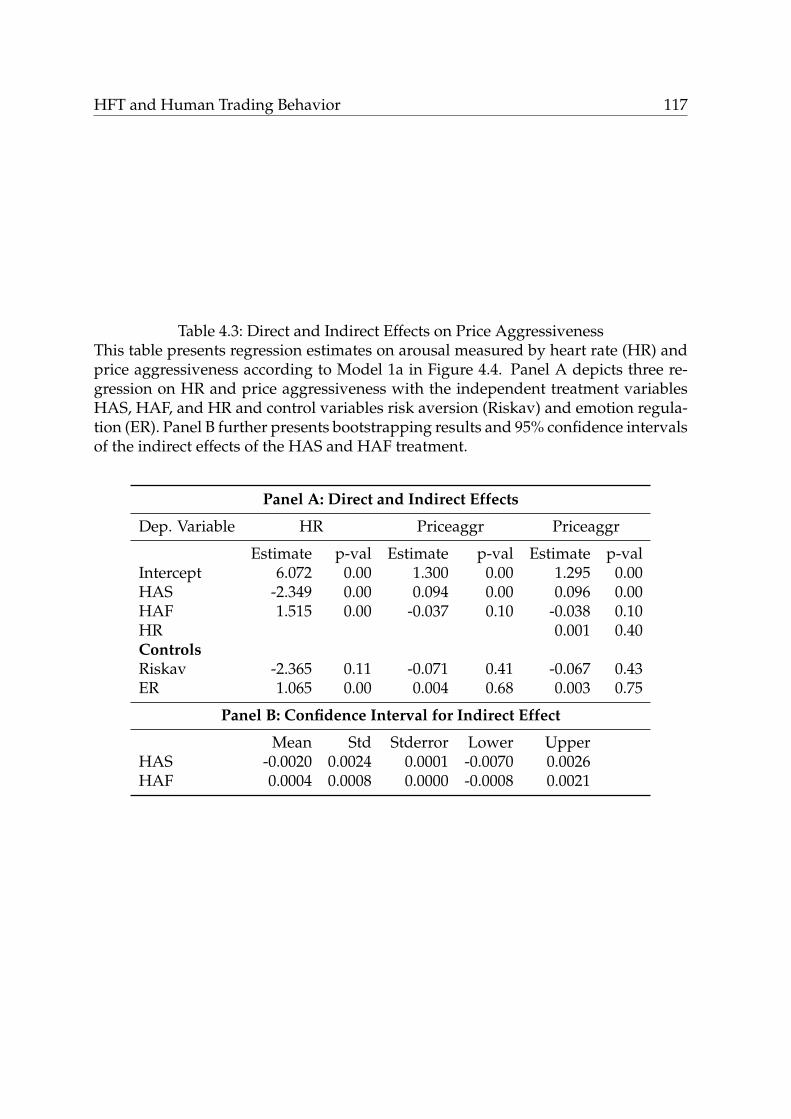
HFT and Human Trading Behavior 117
Table 4.3: Direct and Indirect Effects on Price AggressivenessThis table presents regression estimates on arousal measured by heart rate (HR) andprice aggressiveness according to Model 1a in Figure 4.4. Panel A depicts three re-gression on HR and price aggressiveness with the independent treatment variablesHAS, HAF, and HR and control variables risk aversion (Riskav) and emotion regula-tion (ER). Panel B further presents bootstrapping results and 95% confidence intervalsof the indirect effects of the HAS and HAF treatment.
Panel A: Direct and Indirect Effects
Dep. Variable HR Priceaggr Priceaggr
Estimate p-val Estimate p-val Estimate p-valIntercept 6.072 0.00 1.300 0.00 1.295 0.00HAS -2.349 0.00 0.094 0.00 0.096 0.00HAF 1.515 0.00 -0.037 0.10 -0.038 0.10HR 0.001 0.40ControlsRiskav -2.365 0.11 -0.071 0.41 -0.067 0.43ER 1.065 0.00 0.004 0.68 0.003 0.75
Panel B: Confidence Interval for Indirect Effect
Mean Std Stderror Lower UpperHAS -0.0020 0.0024 0.0001 -0.0070 0.0026HAF 0.0004 0.0008 0.0000 -0.0008 0.0021
118 HFT and Human Trading Behavior
4.5.2 Trading Behavior
In the analysis on trading behavior, I distinguish between aggressiveness measures
of pricing and trading behavior of participants.
Price Aggressiveness
Price aggressiveness is measured by the log-ratio of potential profit and theoretical
profit that can be realized with submitted orders. Specifically, I compute the theoreti-
cal profit πi,j for unit i and trader j and the “potentially” realized profit is computed
as the difference of the submitted limit order price li,j and the assigned private value
vi,j: bi,j=li,j − vi,j. This potential profit is computed as log(bi,j/πi,j). The lower the po-
tential profit, the higher the price aggressiveness since in this market setting, higher
price aggressiveness represents a lower willingness to risk not being executed and a
higher willingness to forgo profit that could theoretically be realized than not being
executed. Thus, the lower the regression estimates on price aggressiveness are, the
higher the price aggressiveness of participants. The results are presented in Table 4.3
above.
In Regression 2 of Panel A in Table 4.3, there is a significantly positive treatment
effect of HAS on price aggressiveness, while HAF has a negative effect. The latter is
consistent with the “time pressure” effect which causes human participants to sub-
mit orders closer to their private value, i.e. quote more aggressively, than if not under
time pressure. Thus, these findings strengthen the effect of time pressure in the con-
text of competitive arousal. As for the presence of slow agents, these would rather
have the above mentioned “de-emotionalization” effect and thus lead to decreased
aggressiveness.
However, there is no significant indirect effect of arousal on time pressure as shown
by the estimates in Regression 3 in Panel A. Thus, the time pressure effect on price
aggressiveness is independent from the actual normalized level of heart rate. I further
analyze moderating effects of human versus human competition as well as emotion
regulation effects which significantly influences the heart rate level of participants.
Results are shown in Table 4.4.
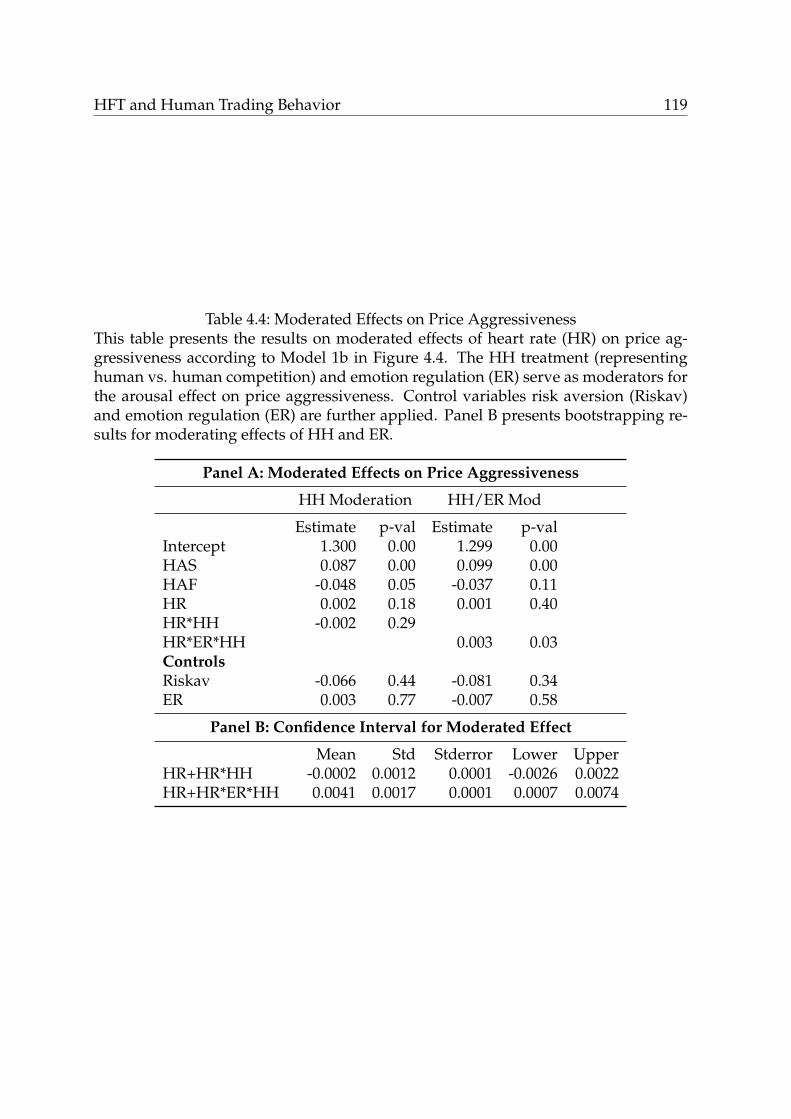
HFT and Human Trading Behavior 119
Table 4.4: Moderated Effects on Price AggressivenessThis table presents the results on moderated effects of heart rate (HR) on price ag-gressiveness according to Model 1b in Figure 4.4. The HH treatment (representinghuman vs. human competition) and emotion regulation (ER) serve as moderators forthe arousal effect on price aggressiveness. Control variables risk aversion (Riskav)and emotion regulation (ER) are further applied. Panel B presents bootstrapping re-sults for moderating effects of HH and ER.
Panel A: Moderated Effects on Price Aggressiveness
HH Moderation HH/ER Mod
Estimate p-val Estimate p-valIntercept 1.300 0.00 1.299 0.00HAS 0.087 0.00 0.099 0.00HAF -0.048 0.05 -0.037 0.11HR 0.002 0.18 0.001 0.40HR*HH -0.002 0.29HR*ER*HH 0.003 0.03ControlsRiskav -0.066 0.44 -0.081 0.34ER 0.003 0.77 -0.007 0.58
Panel B: Confidence Interval for Moderated Effect
Mean Std Stderror Lower UpperHR+HR*HH -0.0002 0.0012 0.0001 -0.0026 0.0022HR+HR*ER*HH 0.0041 0.0017 0.0001 0.0007 0.0074
120 HFT and Human Trading Behavior
While there is no significant moderating effect of the HH treatment alone (HR*HH),
there is in fact one for participants with high ER scores (HR*ER*HH). Emotion reg-
ulation plays a major role for decision making. It has been shown that traders and
investors with high emotion regulation capabilities perform better in trading (Fenton-
O’Creevy et al., 2012). As shown here, participants with a high ER score are more
prone to effects of heart rate on their pricing behavior which indicates a higher level
of competitiveness between this kind of participants. I further analyze another mea-
sure for aggressiveness, trade aggressiveness, which measures the immediateness of
trade executions that are intended by the participants.
HFT and Human Trading Behavior 121
Trade Aggressiveness
Trade aggressiveness is measured by the ratio of initiated trades to the number of
total trades by a trader. A trade is initiated by a the submission of a marketable order
which is executed against a passive order in the order book. Higher liquidity demand
in general market settings represents a lower willingness to wait for being executed
and a higher willingness to pay for immediacy. In this market setting, it can also be
interpreted as a lower willingness to risk the execution of the order and to “wait”
for higher profits using a passive limit order. In market microstructure literature, the
measure of relative liquidity demand is often interpreted as trading aggressiveness.
In the behavioral context, higher trading aggressiveness is related to lower risk taking
since trading aggressively also means to rather forego profit and trade right away
than risk the possibility of not getting executed. The possibility of achieving higher
profits thus points in the opposite direction of the “execution risk”. I argue that in
this market setting, “execution risk” is more relevant for a profit optimizing strategy
since the convergence towards the equilibrium price can be observed and learned
very quickly and is therefore close to deterministic. The results for direct and indirect
treatment effects on trade aggressiveness are presented in Table 4.5.
As depicted in Table 4.5, the presence of fast trading agents in treatment HAF again
induces higher aggressiveness similarly to the results on price aggressiveness. Inter-
estingly, the HAS treatment leads to significantly higher trade aggressiveness as well.
Since the effects of HAS and HAF both point into the same direction, this might al-
low inference of overall effects of de-emotionalization by agents. However, trade ag-
gressiveness allows a less nuanced study than price aggressiveness, which takes the
actual submitted limit prices into account. Additionally, the results are also mechan-
ically driven since agent strategies are by nature more aggressive in terms of their
choice of a marketable or non-marketable order. This in turn then leads to higher
trade aggressiveness of human participants. These differences have to be taken into
account before making inferences based on trade aggressiveness.
Similar to the results on price aggressiveness, the indirect effects of arousal on trade
aggressiveness are weak. Since emotion regulation has a significant direct effect on
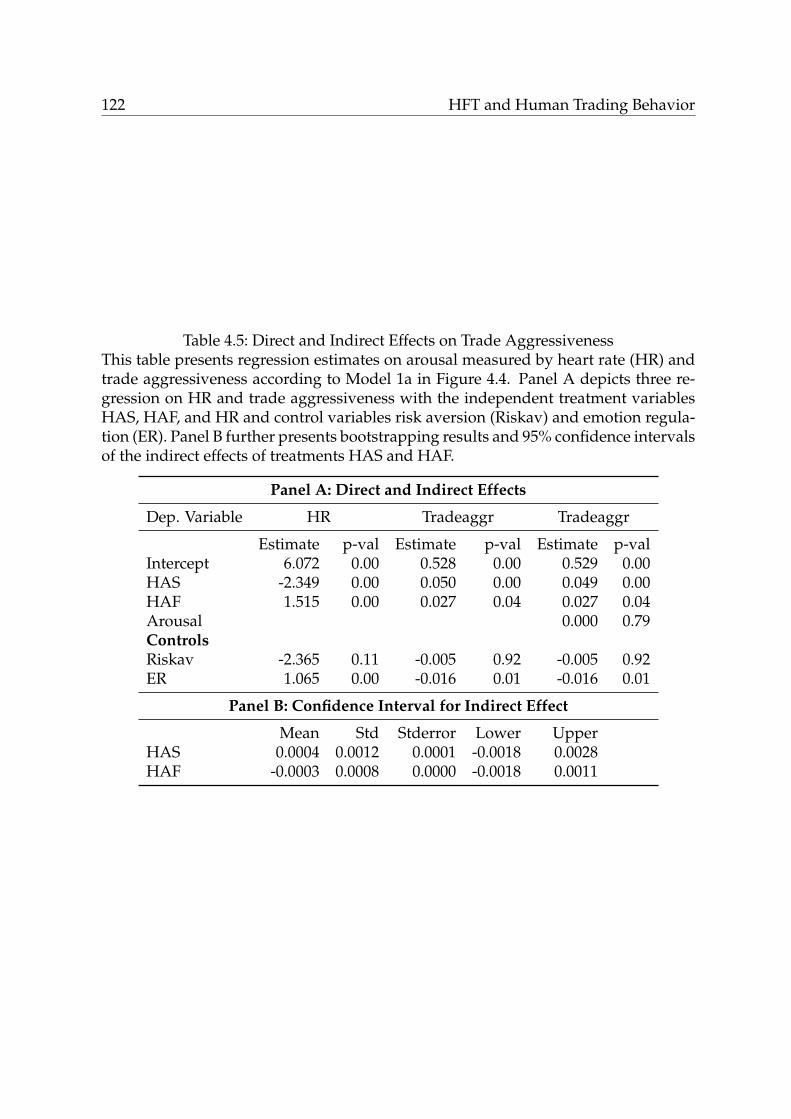
122 HFT and Human Trading Behavior
Table 4.5: Direct and Indirect Effects on Trade AggressivenessThis table presents regression estimates on arousal measured by heart rate (HR) andtrade aggressiveness according to Model 1a in Figure 4.4. Panel A depicts three re-gression on HR and trade aggressiveness with the independent treatment variablesHAS, HAF, and HR and control variables risk aversion (Riskav) and emotion regula-tion (ER). Panel B further presents bootstrapping results and 95% confidence intervalsof the indirect effects of treatments HAS and HAF.
Panel A: Direct and Indirect Effects
Dep. Variable HR Tradeaggr Tradeaggr
Estimate p-val Estimate p-val Estimate p-valIntercept 6.072 0.00 0.528 0.00 0.529 0.00HAS -2.349 0.00 0.050 0.00 0.049 0.00HAF 1.515 0.00 0.027 0.04 0.027 0.04Arousal 0.000 0.79ControlsRiskav -2.365 0.11 -0.005 0.92 -0.005 0.92ER 1.065 0.00 -0.016 0.01 -0.016 0.01
Panel B: Confidence Interval for Indirect Effect
Mean Std Stderror Lower UpperHAS 0.0004 0.0012 0.0001 -0.0018 0.0028HAF -0.0003 0.0008 0.0000 -0.0018 0.0011
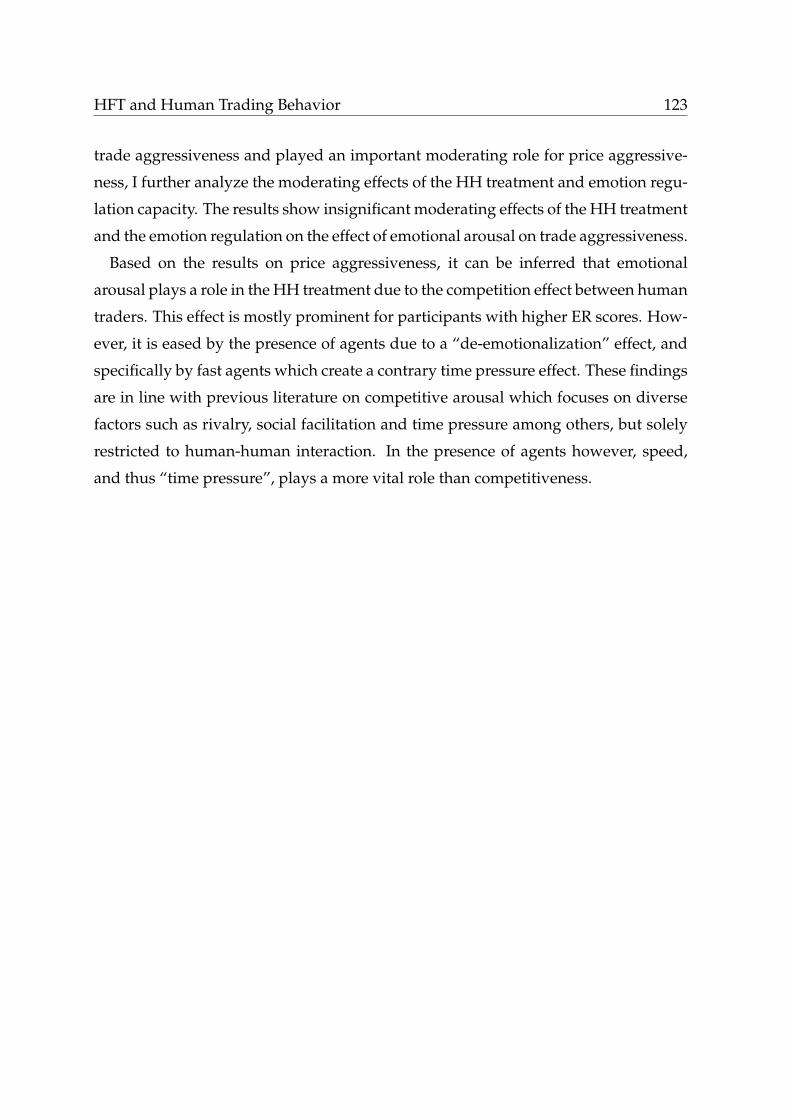
HFT and Human Trading Behavior 123
trade aggressiveness and played an important moderating role for price aggressive-
ness, I further analyze the moderating effects of the HH treatment and emotion regu-
lation capacity. The results show insignificant moderating effects of the HH treatment
and the emotion regulation on the effect of emotional arousal on trade aggressiveness.
Based on the results on price aggressiveness, it can be inferred that emotional
arousal plays a role in the HH treatment due to the competition effect between human
traders. This effect is mostly prominent for participants with higher ER scores. How-
ever, it is eased by the presence of agents due to a “de-emotionalization” effect, and
specifically by fast agents which create a contrary time pressure effect. These findings
are in line with previous literature on competitive arousal which focuses on diverse
factors such as rivalry, social facilitation and time pressure among others, but solely
restricted to human-human interaction. In the presence of agents however, speed,
and thus “time pressure”, plays a more vital role than competitiveness.
124 HFT and Human Trading Behavior
Table 4.6: Moderated Effects on Trade AggressivenessThis table presents the results on moderated effects of heart rate (HR) on trade ag-gressiveness according to Model 1b in Figure 4.4. The HH treatment (representinghuman vs. human competition) and emotion regulation (ER) serve as moderators forthe arousal effect on trade aggressiveness. Control variables risk aversion (Riskav)and emotion regulation (ER) are further applied. Panel B presents bootstrapping re-sults for moderating effects of HH and ER.
Panel A: Moderated Effects on Trade Aggressiveness
HH Moderation HH/ER Mod
Estimate p-val Estimate p-valIntercept 0.529 0.00 0.527 0.00HAS 0.049 0.00 0.049 0.00HAF 0.026 0.07 0.027 0.04Arousal 0.000 0.93 0.000 0.77Arousal*HH 0.000 0.86Arousal*ER*HH -0.001 0.24ControlsRiskav -0.005 0.92 0.000 1.00ER -0.016 0.01 -0.013 0.07
Panel B: Confidence Interval for Moderated Effect
Mean Std Stderror Lower UpperHR+HR*HH -0.0002 0.0007 0.0000 -0.0016 0.0011HR+HR*ER*HH -0.0013 0.0010 0.0000 -0.0035 0.0007
HFT and Human Trading Behavior 125
4.5.3 Market Quality
Market quality is measured specifically by allocative efficiency, profit dispersion,
market volume, spreads, and depth.
Allocative Efficiency
In order to measure market quality, I use the variable Alpha which is used by Smith
(1962). Alpha is defined as the standard deviation σi of trade prices around the equi-
librium price Pi relative to the equilibrium price: α = 100 ∗ σi/Pi. The higher Alpha,
the higher the price variation around the equilibrium price, and the less efficient trade
prices. Figure 4.7 presents efficiency results over time for the different treatments.
As shown in Figure 4.7, market efficiency increases over time and that efficiency
increases with an increasing number of computer agents as well. In order to check
for further robustness, I also present results by different market settings (symmetric,
seller, and buyer) and trading periods in Figure 4.8 and also find consistent results.
For a more robust analysis, the fixed effects regression results are presented in
Table 4.7. The results of Regression 2 in Panel A show that both HAS and HAF in-
crease efficiency by decreasing alpha, although only the decrease of HAF is efficient.
It thus shows how the presence of slow agents increase market efficiency. Faster
agents moreover introduce an increased time pressure. It should be noted however
that this increase in market speed mechanically leads to a faster conversion of trade
prices to the equilibrium price.
To get an idea of the role of price aggressiveness for efficiency, I further analyze
the indirect effects. These show that price explains a large amount of variation in the
alpha measure, primarily in the HAS treatment however. The bootstrapping result
confirm this finding. This indicates that the introduction of time pressure in the HAF
treatment has a direct effect on efficiency while changes in order pricing behavior
lead to the positive effects on efficiency in the HAS treatment.
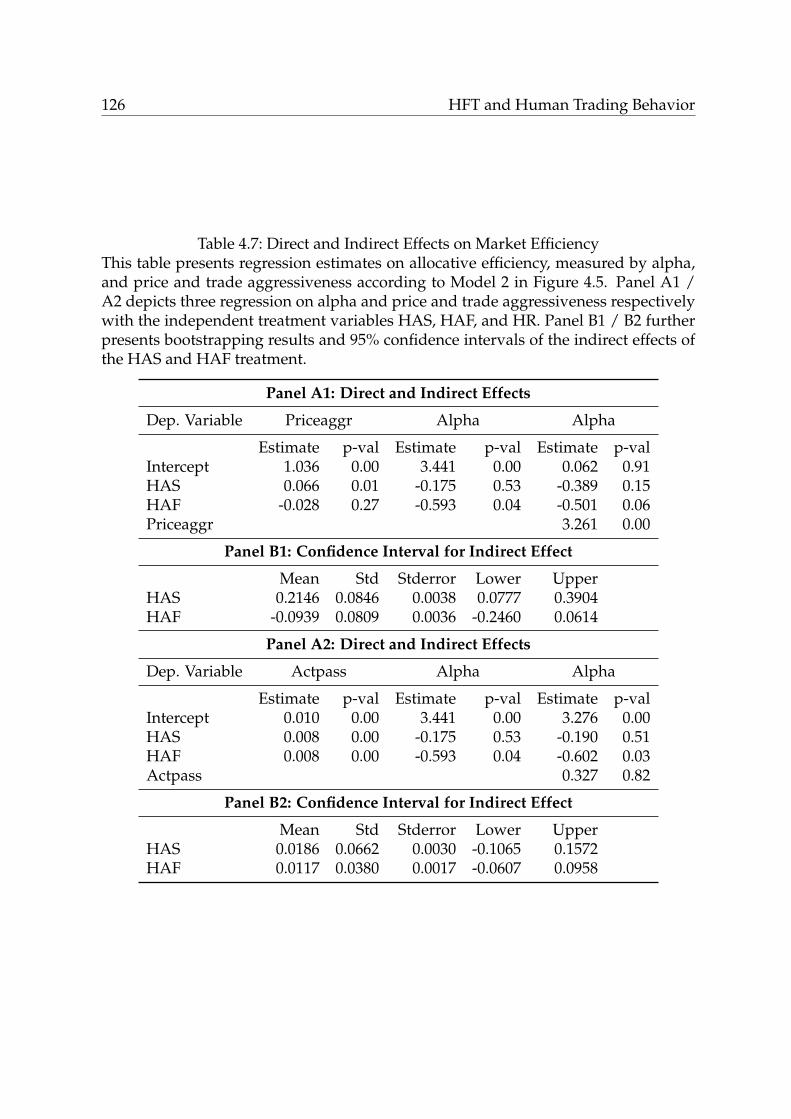
126 HFT and Human Trading Behavior
Table 4.7: Direct and Indirect Effects on Market EfficiencyThis table presents regression estimates on allocative efficiency, measured by alpha,and price and trade aggressiveness according to Model 2 in Figure 4.5. Panel A1 /A2 depicts three regression on alpha and price and trade aggressiveness respectivelywith the independent treatment variables HAS, HAF, and HR. Panel B1 / B2 furtherpresents bootstrapping results and 95% confidence intervals of the indirect effects ofthe HAS and HAF treatment.
Panel A1: Direct and Indirect Effects
Dep. Variable Priceaggr Alpha Alpha
Estimate p-val Estimate p-val Estimate p-valIntercept 1.036 0.00 3.441 0.00 0.062 0.91HAS 0.066 0.01 -0.175 0.53 -0.389 0.15HAF -0.028 0.27 -0.593 0.04 -0.501 0.06Priceaggr 3.261 0.00
Panel B1: Confidence Interval for Indirect Effect
Mean Std Stderror Lower UpperHAS 0.2146 0.0846 0.0038 0.0777 0.3904HAF -0.0939 0.0809 0.0036 -0.2460 0.0614
Panel A2: Direct and Indirect Effects
Dep. Variable Actpass Alpha Alpha
Estimate p-val Estimate p-val Estimate p-valIntercept 0.010 0.00 3.441 0.00 3.276 0.00HAS 0.008 0.00 -0.175 0.53 -0.190 0.51HAF 0.008 0.00 -0.593 0.04 -0.602 0.03Actpass 0.327 0.82
Panel B2: Confidence Interval for Indirect Effect
Mean Std Stderror Lower UpperHAS 0.0186 0.0662 0.0030 -0.1065 0.1572HAF 0.0117 0.0380 0.0017 -0.0607 0.0958
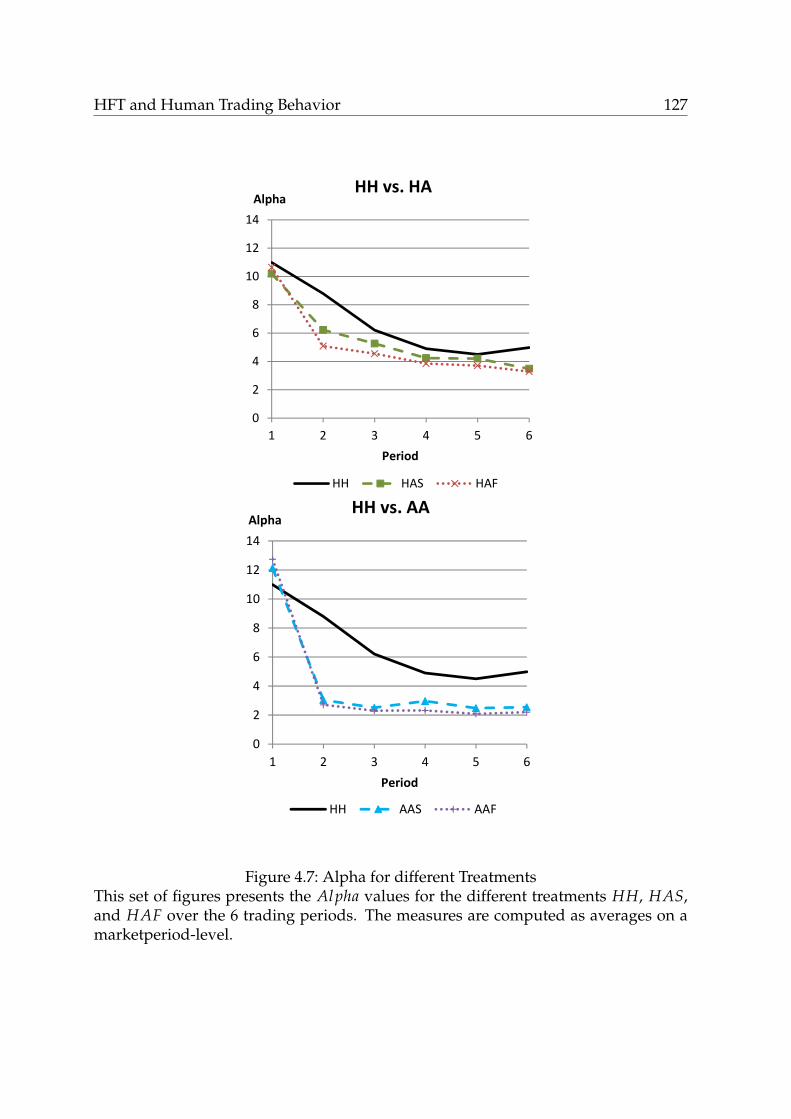
HFT and Human Trading Behavior 127
0
2
4
6
8
10
12
14
1 2 3 4 5 6
Alpha
Period
HH vs. HA
HH HAS HAF
0
2
4
6
8
10
12
14
1 2 3 4 5 6
Alpha
Period
HH vs. AA
HH AAS AAF
Figure 4.7: Alpha for different TreatmentsThis set of figures presents the Alpha values for the different treatments HH, HAS,and HAF over the 6 trading periods. The measures are computed as averages on amarketperiod-level.
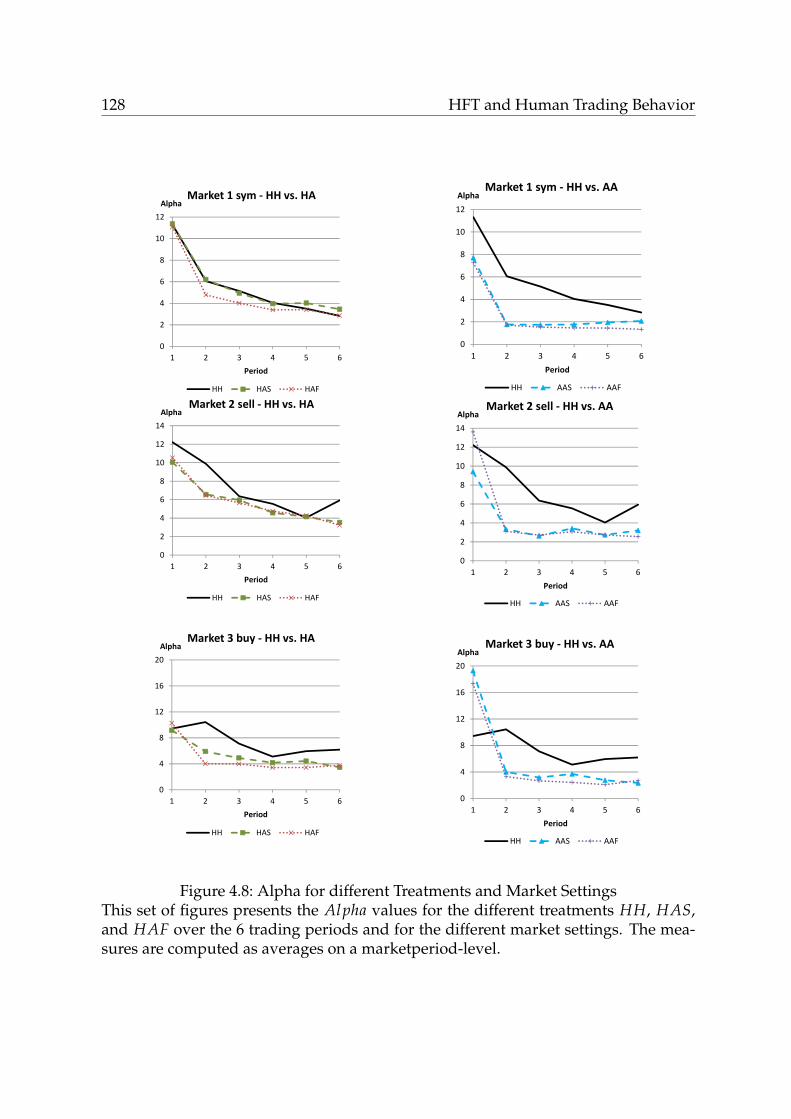
128 HFT and Human Trading Behavior
0
2
4
6
8
10
12
1 2 3 4 5 6
Alpha
Period
Market 1 sym ‐ HH vs. HA
HH HAS HAF
0
2
4
6
8
10
12
14
1 2 3 4 5 6
Alpha
Period
Market 2 sell ‐ HH vs. HA
HH HAS HAF
0
4
8
12
16
20
1 2 3 4 5 6
Alpha
Period
Market 3 buy ‐ HH vs. HA
HH HAS HAF
0
2
4
6
8
10
12
1 2 3 4 5 6
Alpha
Period
Market 1 sym ‐ HH vs. AA
HH AAS AAF
0
2
4
6
8
10
12
14
1 2 3 4 5 6
Alpha
Period
Market 2 sell ‐ HH vs. AA
HH AAS AAF
0
4
8
12
16
20
1 2 3 4 5 6
Alpha
Period
Market 3 buy ‐ HH vs. AA
HH AAS AAF
Figure 4.8: Alpha for different Treatments and Market SettingsThis set of figures presents the Alpha values for the different treatments HH, HAS,and HAF over the 6 trading periods and for the different market settings. The mea-sures are computed as averages on a marketperiod-level.
HFT and Human Trading Behavior 129
Profit Dispersion
Trading profits are measured as the ratio of realized profit aj = ∑i,j vi,j − pi,j and the
theoretical equilibrium profits πj, i.e. the difference between assignment and equi-
librium price, for each trader j: aj/πj. Profit dispersion is computed as the root
mean squared difference between the transaction price and the assignment value:√1/n ∗∑j (aj − πj)2 with aj being the actual profits and πj the theoretical equilib-
rium profits of each trader j for all his n transactions.
Figure 4.9 presents average profit dispersion over the trading period for different
treatments. There is a monotonous decrease of trading profit dispersion over the
trading periods. HH is the treatment with the highest trading profit dispersion and
HAF the treatment with the lowest trading profit dispersion. Thus, profit dispersion
decreases with the presence of agents. In order to distinguish between the dispersion
of human and agent profits, I further compute the results for only human profits. I
observe that human profit dispersion increases for the HA effect, so the previously
observed decrease actually stems from the agent profit distribution. I thus conclude
that the distributional aspects of market performance actually improve for agents,
but worsen for human traders in mixed markets with slow agents.
I further analyze the impact of price and trade aggressiveness on profit dispersion.
Results are presented in Table 4.8. From these results, a weak positive indirect effect
of price aggressiveness on profit dispersion can be inferred. However, the analysis
of moderated effects show that the effect is primarily present for the HAS treatment
and is significant on a 5 % level in that case. There is no significant effect from trade
aggressiveness.
It can be inferred that the link between price aggressiveness and profit dispersion
is strong in the HAS treatment due to the lack of time pressure. Thus, time pressure
would directly lead to a higher profit dispersion, while HAS leads to lower aggres-
siveness and thus lower profit dispersion.
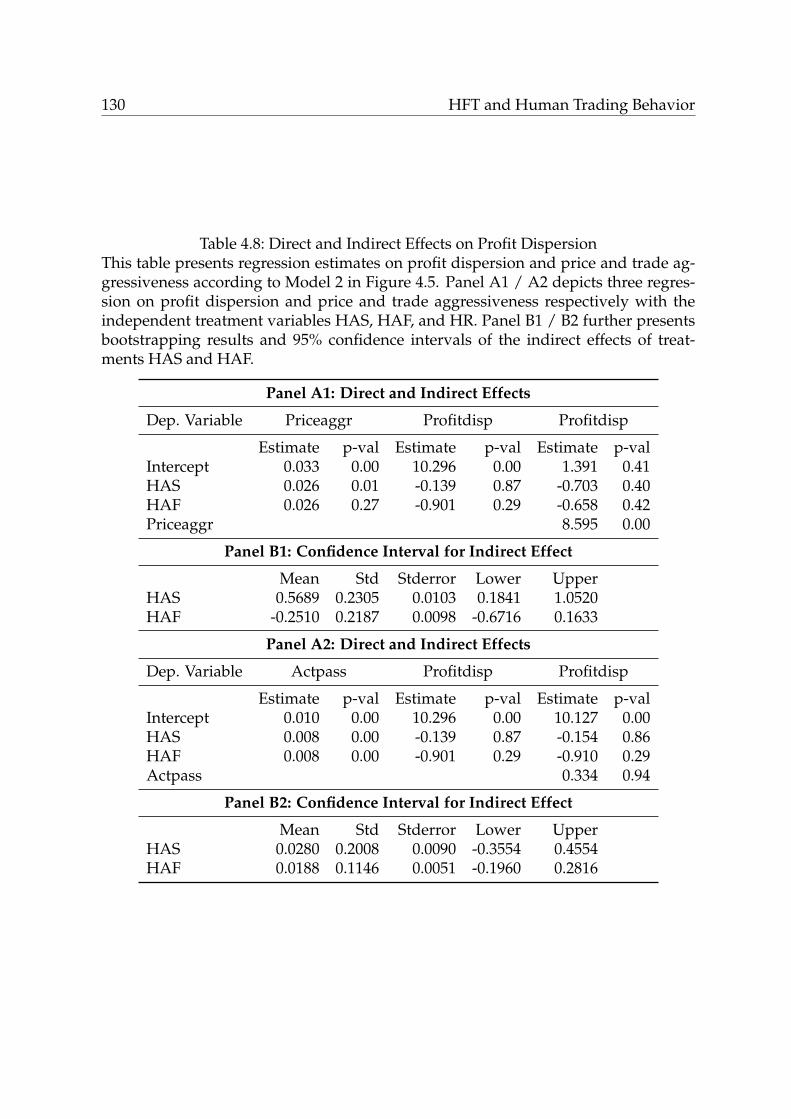
130 HFT and Human Trading Behavior
Table 4.8: Direct and Indirect Effects on Profit DispersionThis table presents regression estimates on profit dispersion and price and trade ag-gressiveness according to Model 2 in Figure 4.5. Panel A1 / A2 depicts three regres-sion on profit dispersion and price and trade aggressiveness respectively with theindependent treatment variables HAS, HAF, and HR. Panel B1 / B2 further presentsbootstrapping results and 95% confidence intervals of the indirect effects of treat-ments HAS and HAF.
Panel A1: Direct and Indirect Effects
Dep. Variable Priceaggr Profitdisp Profitdisp
Estimate p-val Estimate p-val Estimate p-valIntercept 0.033 0.00 10.296 0.00 1.391 0.41HAS 0.026 0.01 -0.139 0.87 -0.703 0.40HAF 0.026 0.27 -0.901 0.29 -0.658 0.42Priceaggr 8.595 0.00
Panel B1: Confidence Interval for Indirect Effect
Mean Std Stderror Lower UpperHAS 0.5689 0.2305 0.0103 0.1841 1.0520HAF -0.2510 0.2187 0.0098 -0.6716 0.1633
Panel A2: Direct and Indirect Effects
Dep. Variable Actpass Profitdisp Profitdisp
Estimate p-val Estimate p-val Estimate p-valIntercept 0.010 0.00 10.296 0.00 10.127 0.00HAS 0.008 0.00 -0.139 0.87 -0.154 0.86HAF 0.008 0.00 -0.901 0.29 -0.910 0.29Actpass 0.334 0.94
Panel B2: Confidence Interval for Indirect Effect
Mean Std Stderror Lower UpperHAS 0.0280 0.2008 0.0090 -0.3554 0.4554HAF 0.0188 0.1146 0.0051 -0.1960 0.2816
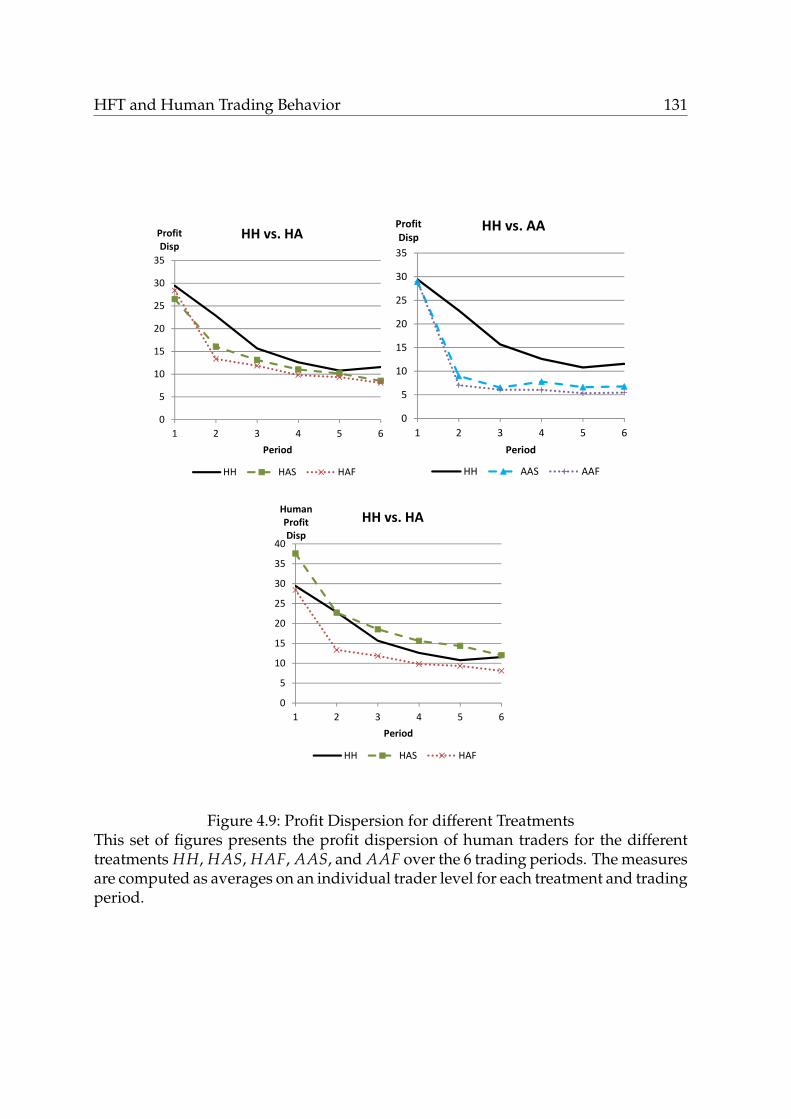
HFT and Human Trading Behavior 131
0
5
10
15
20
25
30
35
1 2 3 4 5 6
Profit Disp
Period
HH vs. HA
HH HAS HAF
0
5
10
15
20
25
30
35
1 2 3 4 5 6
Profit Disp
Period
HH vs. AA
HH AAS AAF
0
5
10
15
20
25
30
35
40
1 2 3 4 5 6
Human Profit Disp
Period
HH vs. HA
HH HAS HAF
Figure 4.9: Profit Dispersion for different TreatmentsThis set of figures presents the profit dispersion of human traders for the differenttreatments HH, HAS, HAF, AAS, and AAF over the 6 trading periods. The measuresare computed as averages on an individual trader level for each treatment and tradingperiod.

132 HFT and Human Trading Behavior
Table 4.9: Direct and Indirect Effects on Human Profit DispersionThis table presents the regressions on human profit dispersion and price and tradeaggressiveness according to Model 2 in Figure 4.5. Panel A1 / A2 depicts three re-gression on profit dispersion and price and trade aggressiveness respectively with theindependent treatment variables HAS, HAF, and HR. Panel B1 / B2 further presentsbootstrapping results and 95% confidence intervals of the indirect effects of treat-ments HAS and HAF.
Panel A1: Direct and Indirect Effects
Dep. Variable Priceaggr Profitdisp_h Profitdisp_h
Estimate p-val Estimate p-val Estimate p-valIntercept 0.033 0.00 9.277 0.00 -2.371 0.28HAS 0.026 0.01 5.790 0.00 5.053 0.00HAF 0.026 0.27 4.771 0.00 5.088 0.00Priceaggr 11.243 0.00
Panel B1: Confidence Interval for Indirect Effect
Mean Std Stderror Lower UpperHAS 0.7457 0.3068 0.0137 0.2328 1.3921HAF -0.3268 0.2847 0.0127 -0.8876 0.2150
Panel A2: Direct and Indirect Effects
Dep. Variable Actpass Profitdisp_h Profitdisp_h
Estimate p-val Estimate p-val Estimate p-valIntercept 0.010 0.00 9.277 0.00 8.682 0.01HAS 0.008 0.00 5.790 0.00 5.737 0.00HAF 0.008 0.00 4.771 0.00 4.740 0.00Actpass 1.182 0.83
Panel B2: Confidence Interval for Indirect Effect
Mean Std Stderror Lower UpperHAS 0.0732 0.2829 0.0127 -0.4679 0.6621HAF 0.0462 0.1623 0.0073 -0.2605 0.4009
HFT and Human Trading Behavior 133
Market Volume, Spreads, and Depth
I further study market liquidity in the dimensions market volume, bid-ask spreads,
and depth. Market Volume is defined as the absolute number of units traded within
the market-period and represents the overall trading activity on the market. Spread
is computed as the average spread of the best bid and best ask price over the mid-
point mid = (ask + bid)/2: Spread = (ask − bid)/mid ∗ 100. Lower spreads can be
interpreted as lower transaction costs for trading and thus higher liquidity. Depth
represents the number of orders submitted to both the buy (bid) and sell (ask) side
of the limit order book: Depth = (countask + countbid)/2. Higher depth can be inter-
preted as higher liquidity.
Figure 4.10 presents the results by market setting and trading period. Volume re-
sults are consistent for all three market settings in terms of an increase with the num-
ber of active agents in the market. The spreads similarly decrease, which equates
to higher liquidity in the presence of agents. Depth however does not exhibit this
improvement in liquidity as the other variables.
In order to have a deeper understanding between price and trade aggressiveness
and the different market quality measures in the market, I apply the statistical anal-
ysis as depicted in Model 2 in Figure 4.5 to the three measures of market quality
volume, spreads, and depth. The results in Table 4.10 show a strong increasing effect
of price aggressiveness on market spreads, specifically in the HAS treatment, which
can be interpreted that lower aggressiveness decreases liquidity. This result however
is partly mechanical since the spread is computed as the difference between quoted
bid and ask prices.
However, trade aggressiveness shows a consistently negative influence of trade
aggressiveness on spreads for both the HAS and the HAF treatment. This is in line
with previous microstructure literature on trade aggressiveness where it is equated
with liquidity demand. Thus, the finding here provide experimental confirmation of
this interpretation of the relationship between trade aggressiveness and spreads.
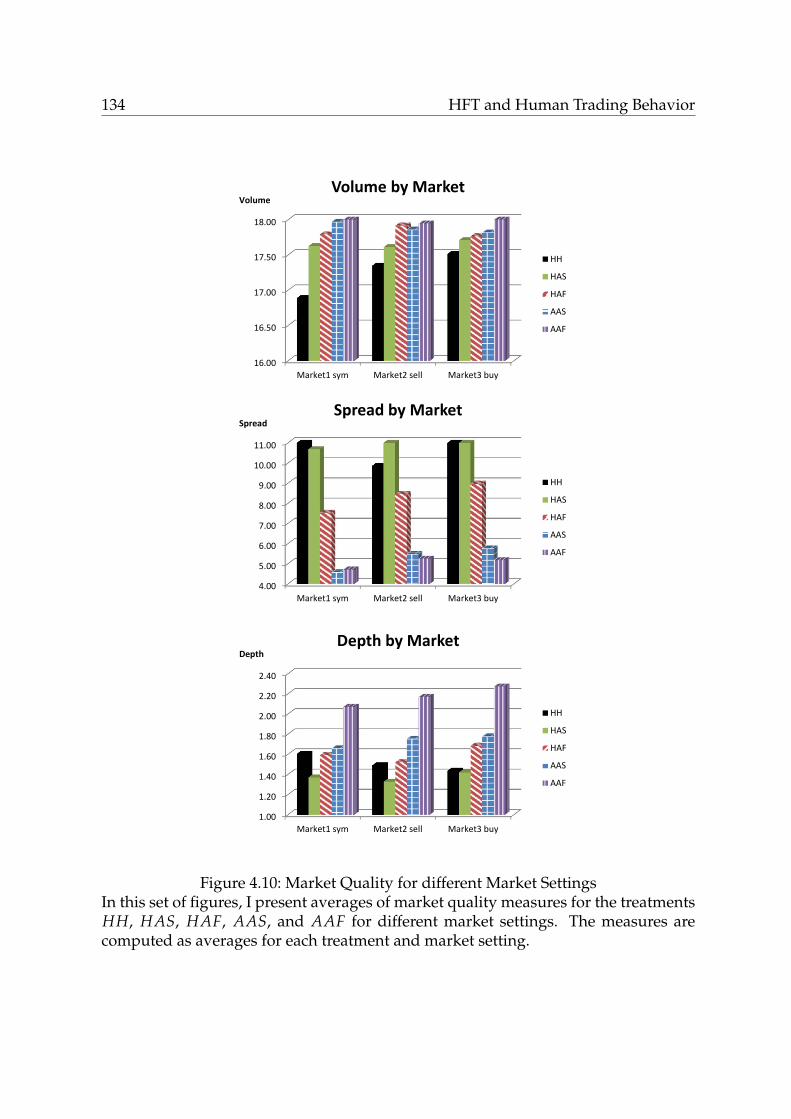
134 HFT and Human Trading Behavior
16.00
16.50
17.00
17.50
18.00
Market1 sym Market2 sell Market3 buy
VolumeVolume by Market
HH
HAS
HAF
AAS
AAF
4.00
5.00
6.00
7.00
8.00
9.00
10.00
11.00
Market1 sym Market2 sell Market3 buy
SpreadSpread by Market
HH
HAS
HAF
AAS
AAF
1.00
1.20
1.40
1.60
1.80
2.00
2.20
2.40
Market1 sym Market2 sell Market3 buy
DepthDepth by Market
HH
HAS
HAF
AAS
AAF
Figure 4.10: Market Quality for different Market SettingsIn this set of figures, I present averages of market quality measures for the treatmentsHH, HAS, HAF, AAS, and AAF for different market settings. The measures arecomputed as averages for each treatment and market setting.
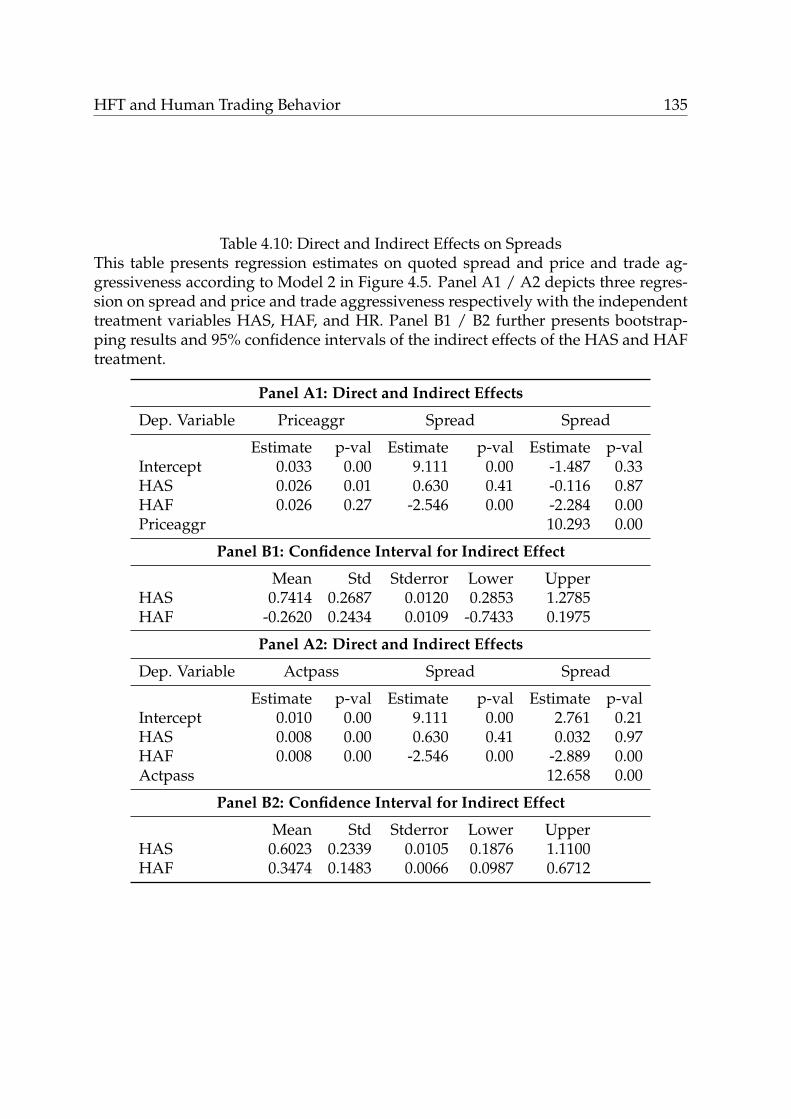
HFT and Human Trading Behavior 135
Table 4.10: Direct and Indirect Effects on SpreadsThis table presents regression estimates on quoted spread and price and trade ag-gressiveness according to Model 2 in Figure 4.5. Panel A1 / A2 depicts three regres-sion on spread and price and trade aggressiveness respectively with the independenttreatment variables HAS, HAF, and HR. Panel B1 / B2 further presents bootstrap-ping results and 95% confidence intervals of the indirect effects of the HAS and HAFtreatment.
Panel A1: Direct and Indirect Effects
Dep. Variable Priceaggr Spread Spread
Estimate p-val Estimate p-val Estimate p-valIntercept 0.033 0.00 9.111 0.00 -1.487 0.33HAS 0.026 0.01 0.630 0.41 -0.116 0.87HAF 0.026 0.27 -2.546 0.00 -2.284 0.00Priceaggr 10.293 0.00
Panel B1: Confidence Interval for Indirect Effect
Mean Std Stderror Lower UpperHAS 0.7414 0.2687 0.0120 0.2853 1.2785HAF -0.2620 0.2434 0.0109 -0.7433 0.1975
Panel A2: Direct and Indirect Effects
Dep. Variable Actpass Spread Spread
Estimate p-val Estimate p-val Estimate p-valIntercept 0.010 0.00 9.111 0.00 2.761 0.21HAS 0.008 0.00 0.630 0.41 0.032 0.97HAF 0.008 0.00 -2.546 0.00 -2.889 0.00Actpass 12.658 0.00
Panel B2: Confidence Interval for Indirect Effect
Mean Std Stderror Lower UpperHAS 0.6023 0.2339 0.0105 0.1876 1.1100HAF 0.3474 0.1483 0.0066 0.0987 0.6712
136 HFT and Human Trading Behavior
Results on trading volume are shown in Table 4.11. The results indicate that the
increase in volume is not driven by the aggressiveness in pricing behavior. However,
trade aggressiveness is again positively related to overall market volume which is
mechanical to a high portion since part of the volume would be represented by the
number of aggressive human transactions. The results on market depth in Table 4.12
similarly show that price aggressiveness is unrelated to the quoting activity on the
market.
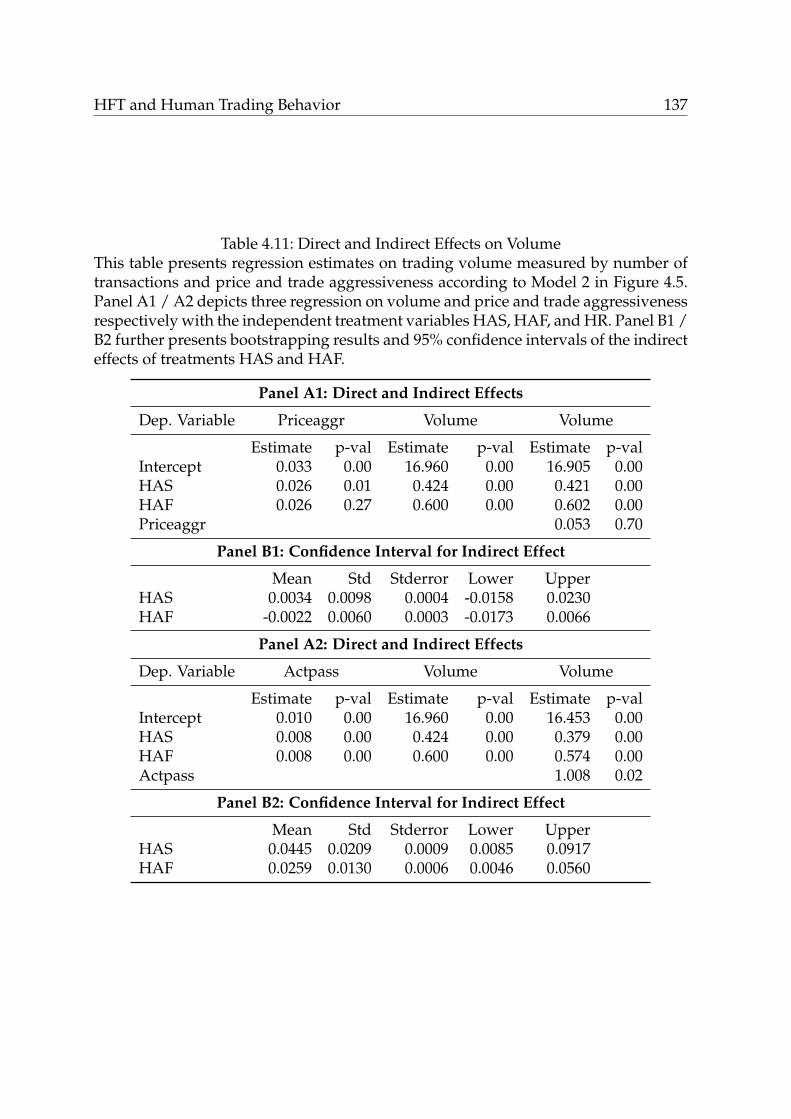
HFT and Human Trading Behavior 137
Table 4.11: Direct and Indirect Effects on VolumeThis table presents regression estimates on trading volume measured by number oftransactions and price and trade aggressiveness according to Model 2 in Figure 4.5.Panel A1 / A2 depicts three regression on volume and price and trade aggressivenessrespectively with the independent treatment variables HAS, HAF, and HR. Panel B1 /B2 further presents bootstrapping results and 95% confidence intervals of the indirecteffects of treatments HAS and HAF.
Panel A1: Direct and Indirect Effects
Dep. Variable Priceaggr Volume Volume
Estimate p-val Estimate p-val Estimate p-valIntercept 0.033 0.00 16.960 0.00 16.905 0.00HAS 0.026 0.01 0.424 0.00 0.421 0.00HAF 0.026 0.27 0.600 0.00 0.602 0.00Priceaggr 0.053 0.70
Panel B1: Confidence Interval for Indirect Effect
Mean Std Stderror Lower UpperHAS 0.0034 0.0098 0.0004 -0.0158 0.0230HAF -0.0022 0.0060 0.0003 -0.0173 0.0066
Panel A2: Direct and Indirect Effects
Dep. Variable Actpass Volume Volume
Estimate p-val Estimate p-val Estimate p-valIntercept 0.010 0.00 16.960 0.00 16.453 0.00HAS 0.008 0.00 0.424 0.00 0.379 0.00HAF 0.008 0.00 0.600 0.00 0.574 0.00Actpass 1.008 0.02
Panel B2: Confidence Interval for Indirect Effect
Mean Std Stderror Lower UpperHAS 0.0445 0.0209 0.0009 0.0085 0.0917HAF 0.0259 0.0130 0.0006 0.0046 0.0560
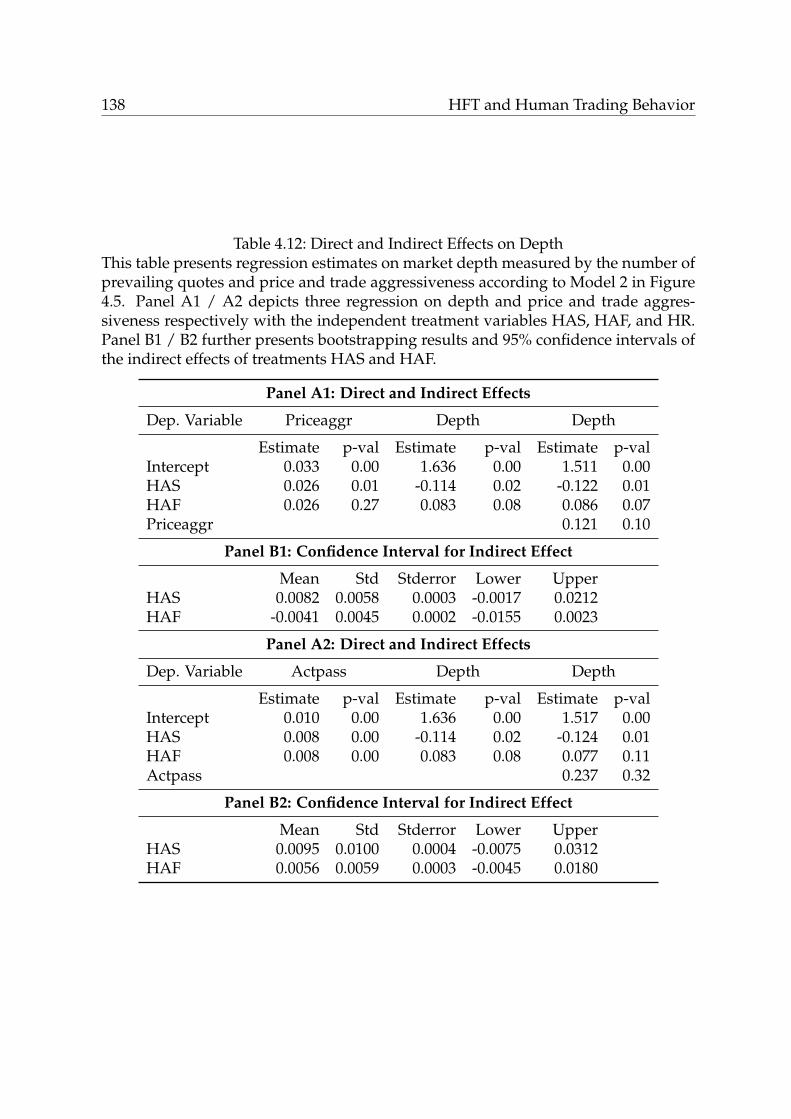
138 HFT and Human Trading Behavior
Table 4.12: Direct and Indirect Effects on DepthThis table presents regression estimates on market depth measured by the number ofprevailing quotes and price and trade aggressiveness according to Model 2 in Figure4.5. Panel A1 / A2 depicts three regression on depth and price and trade aggres-siveness respectively with the independent treatment variables HAS, HAF, and HR.Panel B1 / B2 further presents bootstrapping results and 95% confidence intervals ofthe indirect effects of treatments HAS and HAF.
Panel A1: Direct and Indirect Effects
Dep. Variable Priceaggr Depth Depth
Estimate p-val Estimate p-val Estimate p-valIntercept 0.033 0.00 1.636 0.00 1.511 0.00HAS 0.026 0.01 -0.114 0.02 -0.122 0.01HAF 0.026 0.27 0.083 0.08 0.086 0.07Priceaggr 0.121 0.10
Panel B1: Confidence Interval for Indirect Effect
Mean Std Stderror Lower UpperHAS 0.0082 0.0058 0.0003 -0.0017 0.0212HAF -0.0041 0.0045 0.0002 -0.0155 0.0023
Panel A2: Direct and Indirect Effects
Dep. Variable Actpass Depth Depth
Estimate p-val Estimate p-val Estimate p-valIntercept 0.010 0.00 1.636 0.00 1.517 0.00HAS 0.008 0.00 -0.114 0.02 -0.124 0.01HAF 0.008 0.00 0.083 0.08 0.077 0.11Actpass 0.237 0.32
Panel B2: Confidence Interval for Indirect Effect
Mean Std Stderror Lower UpperHAS 0.0095 0.0100 0.0004 -0.0075 0.0312HAF 0.0056 0.0059 0.0003 -0.0045 0.0180
HFT and Human Trading Behavior 139
In summary, the results on a market-period level show a consistently positive im-
pact of an increasing number of agents on the market. The additional speed effect
of fast agents leads to an additional improvement in efficiency, spreads, and market
volume, but however to increases in profit dispersion. This confirms recent empiri-
cal results of HFT research on the positive effects of HFT, but it comes at the cost of
higher profit dispersion, as shown in this experimental setting and quite apparent in
the real world scenario.
More specifically, the increase in profit dispersion introduced by fast agents is
around 5.7 %. In comparision, the improvement in efficiency amounts to around
17% and in spreads to 27 %. While these numbers need a pressing confirmation with
real world data, it gives a first indication of the balance between improvement in
market quality and discrimination of non-HFT with respect to speed. These findings
generally add to the current HFT discussion on the fairness towards other groups of
traders.
140 HFT and Human Trading Behavior
4.6 Summary
While HFT has become an important issue in financial markets, the impact of HFT on
human trading behavior has not been studied yet. I fill this gap with the analyses on
human traders. Computer agents induce more efficient trading behavior and higher
price aggressiveness. In the context of the theory on competitive arousal, I can pro-
vide insight into the competitive reaction of human traders to trading agents. Due
to a “de-emotionalization” effect by trading agents, human traders are less compet-
itively aroused and thus exhibit more efficient trading behavior demonstrated by an
increasing liquidity demand and higher price aggressiveness. However, the presence
of fast agents induces a “time pressure” which increases arousal and aggressiveness
and leads to higher efficiency.
Before making inferences on financial markets, there are several limitations of this
study. I implement a comparably simple market structure as applied by Smith (1962)
in order to rule out other effects that interact with agent and agent speed effects.
In line with this structure, traders are assigned private values which rules out any
informed trading behavior. As another consequence, I am only able to measure the
allocative efficiency, but not the informational efficiency of the market. Apart from
the ex ante known private values and costs, I have full transparency on the market.
In reality, the transparency of the limit order book is not given for specific trading
venues, such as dark pools.
This study contributes to the increasing amount of HFT literature and extend re-
cent literature with respect to the experimental methodology and behavioral focus.
Physiological measures give insight into differences in human trading behavior and
emotional state which translates into significant differences in market efficiency and
liquidity. Specifically, I contribute to neuro finance methodology by applying heart
rates as a proxy for emotional arousal. I further contribute to research in experimental
finance by the introduction of mixed computer- and human-based experiments. The
application of these kind of experiments in asset markets is a very promising field for
future research. In the context of the increase of AT and HFT in financial markets,
mixed human-agent market settings also might serve as a better platform for certain
HFT and Human Trading Behavior 141
research questions.
Furthermore, this study also has regulatory implications for AT and HFT. Despite
the limitations of my design, the positive effects of computer agents is in line with
previous empirical literature on market quality and market efficiency. The presence
of trading agents improves overall efficiency and liquidity and also induces more ef-
ficient human trading behavior. However, although the trading speed of computer
agents has a significant effect on the level of arousal and human quoting aggressive-
ness, it does not provide an additional positive market impact other than market
depth. In the context of recent AT and HFT regulation, my results suggest that reg-
ulation to decrease AT volume harms market quality, but a decrease of HFT speed
ceteris paribus should not have an overall effect on efficiency and liquidity.

Chapter 5
Conclusion and Outlook
The nature of financial markets and market participants have significantly changed
within the last decades. In today’s electronic markets, computerized trading agents
are deployed for different purposes with different degrees of sophistication. Fuelled
by discussions on their possible risks, there is a need for research on the effects of
HFT on market quality and on human traders. The goal of this thesis is to gain more
insight into the influence of HFT on market quality in general, and more specifically
on price discovery and human trading behavior. This chapter summarizes the main
contributions of this thesis, discusses its implications, and outlines avenues for future
research in finance and information systems.
5.1 Contributions
The main contributions of this thesis are threefold: Firstly, Chapter 2 provides a back-
ground on the on-going evolution of financial markets, recent trends and the role of
HFT in that context. Secondly, the empirical and experimental results in Chapter 3
and 4 give further insight into the information processing activities of HFT in price
discovery and its impact on human trading behavior. Finally, I propose a framework
for financial market quality and a market framework of human-computer interaction,
as presented in Chapter 2 and 4 respectively. These frameworks provide a structured
approach for the discussion of market quality and the analysis of trading behavior in
mixed human-agent markets using physiological measurement.
143
144 Conclusion and Outlook
Chapter 2 presents the basic foundations for the technological evolution of financial
markets, measurement of market quality in financial markets, and discusses the role
of HFT in this environment. It specifically addresses the following research question:
Research Question 1: How did market quality and external and internal factors
of the trading landscape change over the last two decades?
I focus the discussion on recent developments of technological nature in the context
of market quality and a changing regulatory and competitive environment. In order
to enable a structured analysis of market quality, I provide a conceptual framework to
analyze market quality in three dimensions, namely market activity, liquidity, and in-
formation. It further incorporates external and internal effects which have important
effects on financial market quality. A case study is presented in order to illustrate im-
portant changes in financial market quality and changes in the external and internal
factors. Market quality dramatically improved over the last decades in most dimen-
sions, such as spreads and volume. However, due to decreased tick sizes, market
depth decreased and the increase in AT and HFT activity contributed to a decrease in
trade sizes and an increase in message traffic. Due to the importance of HFT and AT
in discussions on the structure of financial markets, it is thus important to understand
the role of HFT in financial markets, as asked in the following research question:
Research Question 2: Which role does HFT play in modern financial markets
and for market quality?
The second part of Chapter 2 emphasizes the crucial role of HFT in the electronic
evolution, which has been a driver for several improvements in terms of IT sys-
tems and innovations in business structures. It might be subject to higher regulatory
scrutiny in the next years despite its positive effects on financial markets. I discuss
the most important groups of HFT strategies. The different nature of these strategies
demonstrates that it is difficult to make general statements on HFT without distin-
guishing between specific strategies. I further discuss approaches of HFT regulation
and evaluate their possible effects on HFT activity and overall market quality and
demonstrate the role of HFT based on empirical evidence in a case study. I show that
Conclusion and Outlook 145
HFT play a crucial role for financial market quality. Despite the limitations of the
dataset which identifies the activity of 26 HFT firms, the HFT volume is considerable.
The results show that HFT is involved in has a stabilizing liquidity effect due to the
fact that HFT consume liquidity when liquidity is cheap (i.e. spreads are narrow) and
supply liquidity when it is expensive.
In Chapter 3, an empirical HFT study is presented which is based on transaction
data provided by NASDAQ over 2 years, 2008-2009, for which HFTs and non-HFTs
are identified. The analysis focuses on the role of HFTs and non-HFTs in process-
ing hard index price information and soft news information. The research questions
primarily concern the market impact of information events, information processing
activities, and trading profits:
Research Question 3a: What is the market impact of hard and soft information
events?
Research Question 3b: How do HFT and NHFT process hard and soft infor-
mation shocks?
Research Question 3c: What is the value of speed in information processing?
The results imply that HFTs and non-HFTs play complementing roles in process-
ing hard and soft information. On one side, HFTs dominate non-HFTs in processing
hard information by exhibiting a stronger reaction after the hard information shocks.
Thereby, they create a stronger linkage between the futures and stock markets. Speed
matters especially for hard information processing and realizing trading gains due to
high short-run trading profits. On the other side, soft news information is primarily
processed by non-HFTs and is incorporated into stock prices for a longer amount of
time. These results contribute to the growing body of literature on financial innova-
tion and HFT. While HFT research so far focuses more on the overall effect of HFT
in financial markets, I specialize on information processing strategies and the role of
speed.
Chapter 4 focuses on the influence of HFT on market quality and efficiency and on
human trading behavior and emotions in a laboratory market. In order to system-
146 Conclusion and Outlook
atically investigate these issues, a market framework for human-computer interac-
tion is introduced which gives guidelines for studies involving human traders and
computer agents in an experimental laboratory setting using NeuroIS tools. This
framework is then applied in experimental study of a financial market scenario. In
particular, a laboratory experiment is conducted based on the traditional design by
Smith (1962) with human participants and computer agents with different trading
speed. This experiment provides insight into the complex construct of “competitive
arousal”. In order to assess the emotional arousal of human participants, their heart
rate is measured. In the analysis, I primarily focus on the effects on emotional arousal,
human trading behavior, and direct and indirect effects on market quality, as formu-
lated in the following research questions:
Research Question 4a: Are humans more or less emotionally aroused when
trading against computer agents than against other humans?
Research Question 4b: Do differences in emotional arousal affect trading be-
havior?
Research Question 4c: Do differences in human trading behavior in turn trans-
late into differences in market quality?
Interestingly, human traders are less emotionally aroused in a market with slow
agents than in a human-only market and more aroused in a fast agent scenario. In
line with the theory of competitive arousal, rivalry is mitigated when agents are
present since competitiveness between humans decreases. However, counteracting
“time pressure” effects that are a result of fast agent activity increase the emotional
arousal of participants. Consequently, human traders price their orders less aggres-
sively when interacting with slow agents. However, the time pressure induced by
fast agents has a direct effect on aggressiveness and leads to more aggressive pricing
of order as compared to the treatment with human only interaction.
The positive effects of computer agents are in line with previous empirical liter-
ature on market quality and market efficiency. Especially the presence of fast trad-
ing agents induces more efficient human trading behavior in terms of aggressiveness
Conclusion and Outlook 147
which translates into higher efficiency and liquidity. However, it also increases profit
dispersion among traders which points towards a discrimination of slower traders.
5.2 Implications
This thesis addresses several regulatory concerns of HFT in financial markets and
provides more insight for discussions regarding regulatory and policy changes. Ad-
ditionally, trading venues are equally interested in these topics in order to understand
the role of HFT for their business models, to overcome market frictions, and prevent
market failure by regularly adapting their market structure to the dynamic environ-
ment.
While some regulatory measures might have negative effects on market quality,
specific rules such as circuit breakers and fees on message traffic or order-to-trade ra-
tios might be beneficial to curb some of the unwanted effects of HFT activity. Circuit
breakers for example address one concern of regulators which is the strong inter-
linkage between different markets. This could cause erroneous information to travel
faster between markets and thus create or worsen market disruptions. Findings in
Chapter 2 strengthen regulatory discussions on market-wide circuit breaker rules,
i.e. trading halts that are triggered by abnormally high volatility within a certain
time period. These rules have been revised for example by the SEC (cf. SEC, 2012c,
“Market-Wide Circuit Breaker Approval Order”).
Recent developments have shown a trend towards machine-processable news and
a general hardening of soft information. In addition to existing concerns associated
with HFT, these algorithms might give rise to even greater concerns than traditional
HFT algorithms due to misinterpretation of and overreaction to events. In my anal-
yses, I cannot confirm this development although the analysis is limited to a data
sample from 2008 to 2009. In terms of soft information processing, I can refute con-
cerns that HFTs overreact to soft information events. HFTs seem to rather withdraw
from the market than actively trade on soft information events which might ease
some of these concerns towards soft information processing at least for the analyzed
time period.
148 Conclusion and Outlook
My findings further point to an edge of HFTs over non-HFTs in the speed of hard
information processing. Thus, concerns could be raised whether HFT might lead to
overreactions in the short run, but in the long run, they rather mitigate volatility due
to the inversion of their trading behavior. Furthermore, the results also strengthen
previous literature on HFT contribution to short-term price discovery (cf. Brogaard
et al., 2013).
Furthermore, the presence of different types of agents has several implications for
human traders, such as individual investors. While I generally show lower aggres-
siveness towards computer agents and higher time pressure in the presence of faster
agents, investors should take behavioral considerations into account next to the tech-
nological changes in financial markets in order to adapt their trading strategies.
5.3 Future Research
Although HFT is currently under some regulatory scrutiny, technological innovation
plays an important role for market participants and market operators in order to
adapt to the changing competitive environment. The processing power and sophisti-
cation of algorithms used by buy-side investors improves with the growing techno-
logical possibilities and adapt to the different types of markets structures and types
of traders. Due to this fact, the diversity of HFT strategies must be taken into account
when conducting research in this field. Furthermore, the technological innovation
also changes the market conditions and interaction with human traders. The techno-
logical evolution in market places also leads to a general speeding up of markets and
an increasing interaction with computerized trading agents. While these effects were
central in the experimental study in Chapter 4, there is still need for research on these
kind of mixed human-agent markets and how these markets affect human trading
behavior and emotional arousal.
Conclusion and Outlook 149
Diversity of HFT strategies
As suggested by Hagströmer and Nordén (2012), different HFT strategies might have
different effects on market quality. Thus, future research should take the distinc-
tion between different strategies into account, such as market making and arbitrage
strategies. Furthermore, HFT might also have different effects on different markets.
As discussed in Section 2.1.2, HFT has overly positive effects on equity and futures
markets and is a group of traders that these types of markets aim to attract. However,
foreign exchange markets claim that overall volume in FX trading decreased because
HFT activity driving away other groups of traders (Reuters, 2013a). Thus, it is im-
portant to understand the different roles of HFTs in these markets and the different
strategies that they apply.
Next to the discussion on market quality, regulatory discussions also involve the
risk involved with the growing importance of HFT. The Flash Crash on May 6th,
2010 was a striking demonstration of systemic risks that are incorporated in finan-
cial markets. Opponents claim stricter regulation of HFT as a group regarding their
market making activities from which trading venues profit, but on which they also
rely heavily. Although a majority of U.S. retail advisor believed in an “overreliance
on computer systems and high-frequency systems” that caused the Flash Crash (c.f.
Kirilenko et al., 2011), academic literature have not found any negative effects of HFT
and moreover supports evidence on positive effects. As for the growing literature
on HFT that researches into the volatility and risk effects of HFT, more research has
to be done to shed light on the behavior of HFT in different market situations, e.g.
periods of high market volatility and market crashes. Furthermore, it still needs to be
understood whether HFT exacerbate these kind of extreme market situations.
Large-scale Experiments of Dynamic Market Environments
The application of mixed computer- and human-based experiments in asset markets
is a very promising field for future research in experimental finance and NeuroIS.
Especially in the context of the increase of AT and HFT in financial markets, mixed
human-agent market settings might serve as a better platform for certain research
150 Conclusion and Outlook
questions. The proposed market framework for human-computer interaction further
provides possibilities for further extensions in financial and information systems re-
search.
Firstly, the experimental design can be more complex than the one presented. Next
to additional assets and markets, one might introduce special order types, such as
hidden orders (i.e. orders that are invisible in the limit order book). An experiment
on this market microstructure issue has already been conducted by Bloomfield et al.
(2011). Thus, experimental environments are an ideal setting to analyze effects of
variations in market design and complement empirical research on historical data.
Furthermore, differences in interface design could also lead to differences in behav-
ior and help to improve financial decision making. An example is demonstrated by
Astor et al. (2013) who present a game for learning to control emotions and fulfill-
ing numerical tasks in parallel and thereby demonstrate the effectiveness of a tool
for emotion regulation. Furthermore, the type of agent not restricted to competitive
computer agents, but can also be applied to the group of supportive computer agents
that e.g. rather provide liquidity than compete for trading profits. Using computer
agents as market makers would be an interesting aspect to improve market design,
specifically with respect to differences in performance and effects on liquidity of a
human market maker and a computerized market maker.
Secondly, the analysis of “competitive arousal” still offers a wide range of research
possibilities due to the many dimensions involved, especially in the interface with
other areas in IS, such as social networks, behavioral and NeuroIS, and human-
computer interaction. Specific examples include e.g. the research on “technostress”
and information overflow. This kind of stress may be caused by extensive human-
computer interaction (cf. Riedl et al., 2012) and can be discussed both from the per-
spective of NeuroIS and the design of user interfaces. In this context, more sophis-
ticated technology can help to gain deeper insight into different dimensions of these
effects, such as eye-tracking technology, and neurological tools, such as fMRI, in or-
der to evaluate alternative interface designs with respect to their psychophysiological
response.
Finally, the market framework for human-computer interaction offers a large va-
Conclusion and Outlook 151
riety of possibilities for further extension. The framework is intended to link emo-
tional and behavioral biases with regard to human-computer interaction to market
outcomes and support research on HCI in a market setting. However, transfers to in-
dustries other than the financial market setting applied in the experimental study are
also possible. One example includes recent work on agent-mediation in automated
negotiations, often applied in e-commerce, as described by Guttmann et al. (1998)
and He et al. (2003). Gimpel et al. (2013) further present a guideline in the form of a
“NeuroIS framework for emotion regulation in management” which combines Neu-
roIS tools in a managerial decision environment in order to enable more sophisticated
decision making of managerial executives.
5.4 Summary
In this chapter, I presented the main contributions of this thesis which consists of an
overview of the electronic evolution of financial markets, empirical and experimen-
tal evidence of HFT activity in financial markets, and methodological guidelines for
research on market quality and on the interaction of humans and computer agents in
a dynamic market environment.
I further outlined several fields for possible future research. There is need for fur-
ther research on HFT especially during extreme market events as well as on the differ-
ence between HFT strategies in different markets. Furthermore, the methodological
approach of the market framework for human-computer interaction offers a wide
range of applications and extensions for future finance and information systems re-
search. In the context of ever-evolving financial markets, it is crucial to understand
the role of innovation, but also to assess the influence of regulatory and market design
changes on the different dimensions of market quality.

Appendix A
Sample Stocks and Robustness Checks
(Chapter 3)
A.1 List of Sample Stocks
Table A.1 presents the 40 sample stocks and the absolute and relative HFT activity.
Total denotes the average total number of trades per stock day, HFTrades the number
of trades involving an HFT. Abs.Hinit and Abs.Hpass denote the absolute number of
HFT initiated and passive trades respectively, while Rel.Hinit and Rel.Hpass is the
relative percentage.
153
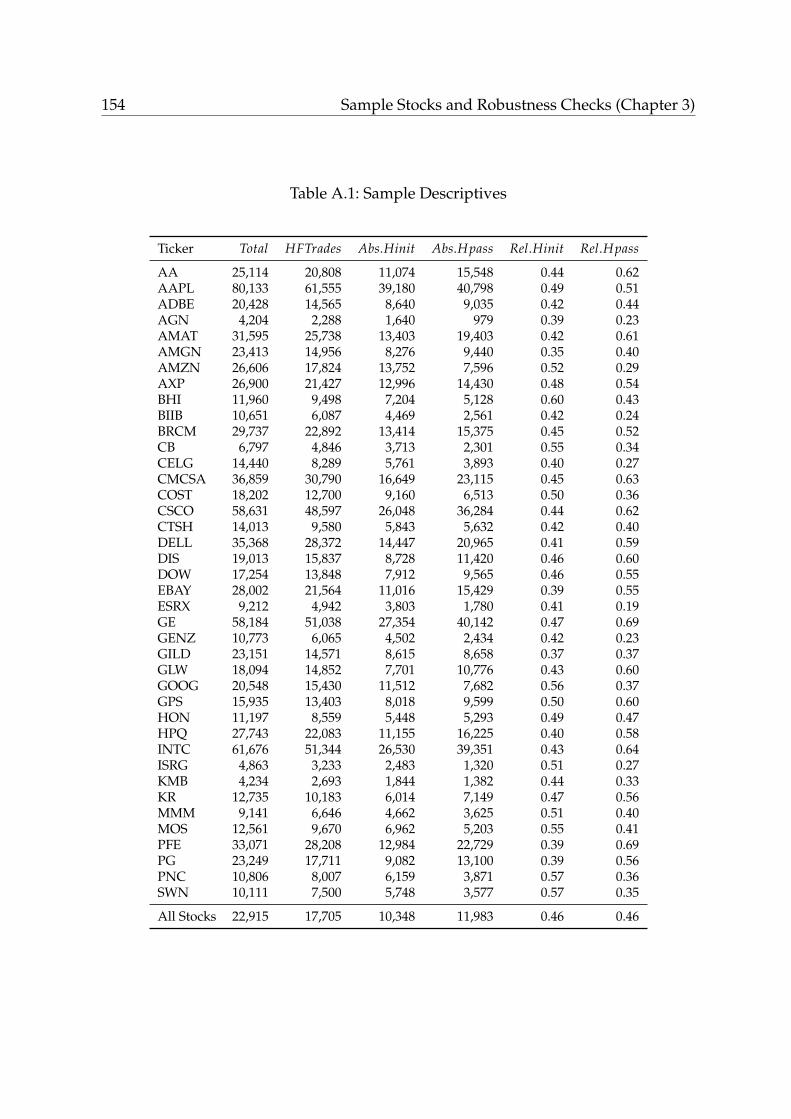
154 Sample Stocks and Robustness Checks (Chapter 3)
Table A.1: Sample Descriptives
Ticker Total HFTrades Abs.Hinit Abs.Hpass Rel.Hinit Rel.Hpass
AA 25,114 20,808 11,074 15,548 0.44 0.62AAPL 80,133 61,555 39,180 40,798 0.49 0.51ADBE 20,428 14,565 8,640 9,035 0.42 0.44AGN 4,204 2,288 1,640 979 0.39 0.23AMAT 31,595 25,738 13,403 19,403 0.42 0.61AMGN 23,413 14,956 8,276 9,440 0.35 0.40AMZN 26,606 17,824 13,752 7,596 0.52 0.29AXP 26,900 21,427 12,996 14,430 0.48 0.54BHI 11,960 9,498 7,204 5,128 0.60 0.43BIIB 10,651 6,087 4,469 2,561 0.42 0.24BRCM 29,737 22,892 13,414 15,375 0.45 0.52CB 6,797 4,846 3,713 2,301 0.55 0.34CELG 14,440 8,289 5,761 3,893 0.40 0.27CMCSA 36,859 30,790 16,649 23,115 0.45 0.63COST 18,202 12,700 9,160 6,513 0.50 0.36CSCO 58,631 48,597 26,048 36,284 0.44 0.62CTSH 14,013 9,580 5,843 5,632 0.42 0.40DELL 35,368 28,372 14,447 20,965 0.41 0.59DIS 19,013 15,837 8,728 11,420 0.46 0.60DOW 17,254 13,848 7,912 9,565 0.46 0.55EBAY 28,002 21,564 11,016 15,429 0.39 0.55ESRX 9,212 4,942 3,803 1,780 0.41 0.19GE 58,184 51,038 27,354 40,142 0.47 0.69GENZ 10,773 6,065 4,502 2,434 0.42 0.23GILD 23,151 14,571 8,615 8,658 0.37 0.37GLW 18,094 14,852 7,701 10,776 0.43 0.60GOOG 20,548 15,430 11,512 7,682 0.56 0.37GPS 15,935 13,403 8,018 9,599 0.50 0.60HON 11,197 8,559 5,448 5,293 0.49 0.47HPQ 27,743 22,083 11,155 16,225 0.40 0.58INTC 61,676 51,344 26,530 39,351 0.43 0.64ISRG 4,863 3,233 2,483 1,320 0.51 0.27KMB 4,234 2,693 1,844 1,382 0.44 0.33KR 12,735 10,183 6,014 7,149 0.47 0.56MMM 9,141 6,646 4,662 3,625 0.51 0.40MOS 12,561 9,670 6,962 5,203 0.55 0.41PFE 33,071 28,208 12,984 22,729 0.39 0.69PG 23,249 17,711 9,082 13,100 0.39 0.56PNC 10,806 8,007 6,159 3,871 0.57 0.36SWN 10,111 7,500 5,748 3,577 0.57 0.35
All Stocks 22,915 17,705 10,348 11,983 0.46 0.46
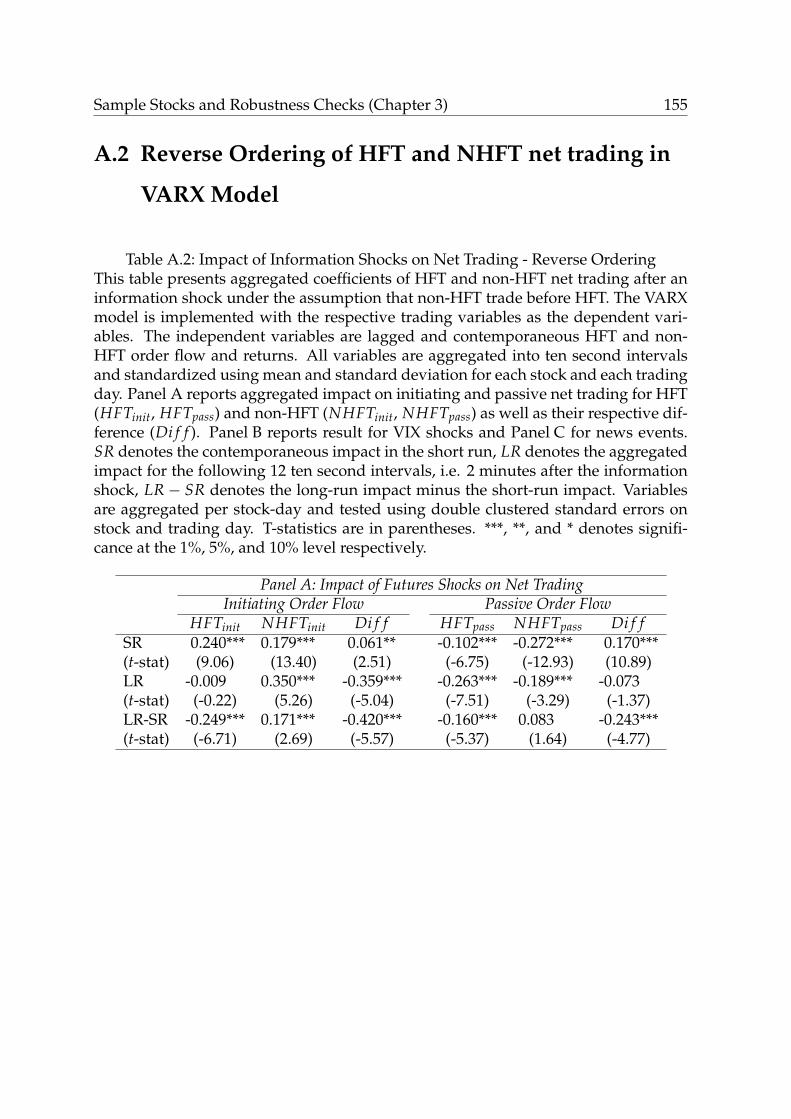
Sample Stocks and Robustness Checks (Chapter 3) 155
A.2 Reverse Ordering of HFT and NHFT net trading in
VARX Model
Table A.2: Impact of Information Shocks on Net Trading - Reverse OrderingThis table presents aggregated coefficients of HFT and non-HFT net trading after aninformation shock under the assumption that non-HFT trade before HFT. The VARXmodel is implemented with the respective trading variables as the dependent vari-ables. The independent variables are lagged and contemporaneous HFT and non-HFT order flow and returns. All variables are aggregated into ten second intervalsand standardized using mean and standard deviation for each stock and each tradingday. Panel A reports aggregated impact on initiating and passive net trading for HFT(HFTinit, HFTpass) and non-HFT (NHFTinit, NHFTpass) as well as their respective dif-ference (Di f f ). Panel B reports result for VIX shocks and Panel C for news events.SR denotes the contemporaneous impact in the short run, LR denotes the aggregatedimpact for the following 12 ten second intervals, i.e. 2 minutes after the informationshock, LR− SR denotes the long-run impact minus the short-run impact. Variablesare aggregated per stock-day and tested using double clustered standard errors onstock and trading day. T-statistics are in parentheses. ***, **, and * denotes signifi-cance at the 1%, 5%, and 10% level respectively.
Panel A: Impact of Futures Shocks on Net TradingInitiating Order Flow Passive Order Flow
HFTinit NHFTinit Di f f HFTpass NHFTpass Di f fSR 0.240*** 0.179*** 0.061** -0.102*** -0.272*** 0.170***(t-stat) (9.06) (13.40) (2.51) (-6.75) (-12.93) (10.89)LR -0.009 0.350*** -0.359*** -0.263*** -0.189*** -0.073(t-stat) (-0.22) (5.26) (-5.04) (-7.51) (-3.29) (-1.37)LR-SR -0.249*** 0.171*** -0.420*** -0.160*** 0.083 -0.243***(t-stat) (-6.71) (2.69) (-5.57) (-5.37) (1.64) (-4.77)
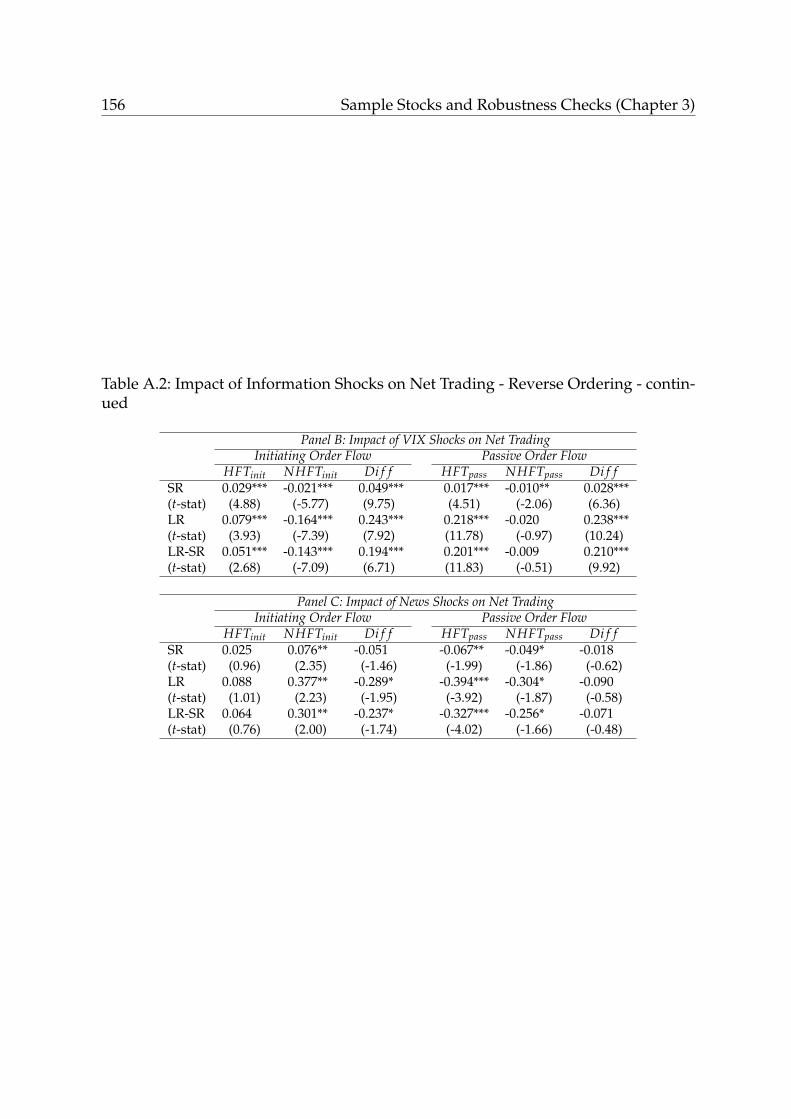
156 Sample Stocks and Robustness Checks (Chapter 3)
Table A.2: Impact of Information Shocks on Net Trading - Reverse Ordering - contin-ued
Panel B: Impact of VIX Shocks on Net TradingInitiating Order Flow Passive Order Flow
HFTinit NHFTinit Di f f HFTpass NHFTpass Di f fSR 0.029*** -0.021*** 0.049*** 0.017*** -0.010** 0.028***(t-stat) (4.88) (-5.77) (9.75) (4.51) (-2.06) (6.36)LR 0.079*** -0.164*** 0.243*** 0.218*** -0.020 0.238***(t-stat) (3.93) (-7.39) (7.92) (11.78) (-0.97) (10.24)LR-SR 0.051*** -0.143*** 0.194*** 0.201*** -0.009 0.210***(t-stat) (2.68) (-7.09) (6.71) (11.83) (-0.51) (9.92)
Panel C: Impact of News Shocks on Net TradingInitiating Order Flow Passive Order Flow
HFTinit NHFTinit Di f f HFTpass NHFTpass Di f fSR 0.025 0.076** -0.051 -0.067** -0.049* -0.018(t-stat) (0.96) (2.35) (-1.46) (-1.99) (-1.86) (-0.62)LR 0.088 0.377** -0.289* -0.394*** -0.304* -0.090(t-stat) (1.01) (2.23) (-1.95) (-3.92) (-1.87) (-0.58)LR-SR 0.064 0.301** -0.237* -0.327*** -0.256* -0.071(t-stat) (0.76) (2.00) (-1.74) (-4.02) (-1.66) (-0.48)
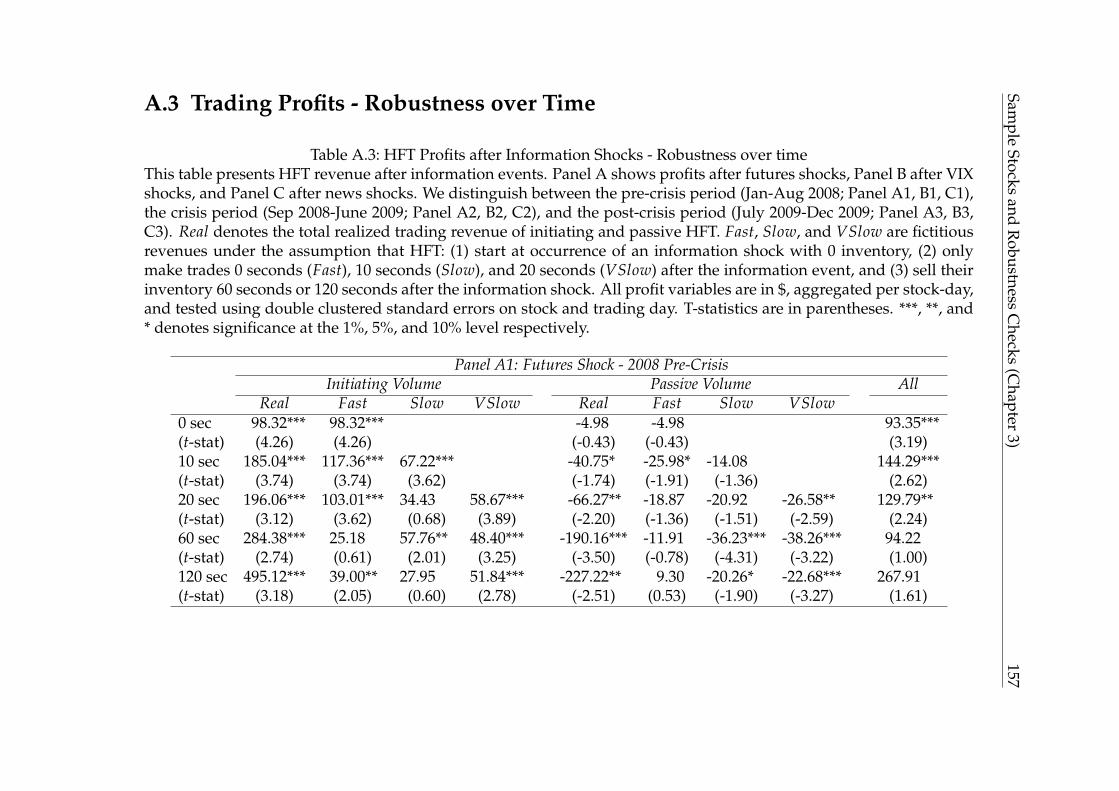
Sample
Stocksand
Robustness
Checks
(Chapter
3)157
A.3 Trading Profits - Robustness over Time
Table A.3: HFT Profits after Information Shocks - Robustness over timeThis table presents HFT revenue after information events. Panel A shows profits after futures shocks, Panel B after VIXshocks, and Panel C after news shocks. We distinguish between the pre-crisis period (Jan-Aug 2008; Panel A1, B1, C1),the crisis period (Sep 2008-June 2009; Panel A2, B2, C2), and the post-crisis period (July 2009-Dec 2009; Panel A3, B3,C3). Real denotes the total realized trading revenue of initiating and passive HFT. Fast, Slow, and VSlow are fictitiousrevenues under the assumption that HFT: (1) start at occurrence of an information shock with 0 inventory, (2) onlymake trades 0 seconds (Fast), 10 seconds (Slow), and 20 seconds (VSlow) after the information event, and (3) sell theirinventory 60 seconds or 120 seconds after the information shock. All profit variables are in $, aggregated per stock-day,and tested using double clustered standard errors on stock and trading day. T-statistics are in parentheses. ***, **, and* denotes significance at the 1%, 5%, and 10% level respectively.
Panel A1: Futures Shock - 2008 Pre-CrisisInitiating Volume Passive Volume All
Real Fast Slow VSlow Real Fast Slow VSlow0 sec 98.32*** 98.32*** -4.98 -4.98 93.35***(t-stat) (4.26) (4.26) (-0.43) (-0.43) (3.19)10 sec 185.04*** 117.36*** 67.22*** -40.75* -25.98* -14.08 144.29***(t-stat) (3.74) (3.74) (3.62) (-1.74) (-1.91) (-1.36) (2.62)20 sec 196.06*** 103.01*** 34.43 58.67*** -66.27** -18.87 -20.92 -26.58** 129.79**(t-stat) (3.12) (3.62) (0.68) (3.89) (-2.20) (-1.36) (-1.51) (-2.59) (2.24)60 sec 284.38*** 25.18 57.76** 48.40*** -190.16*** -11.91 -36.23*** -38.26*** 94.22(t-stat) (2.74) (0.61) (2.01) (3.25) (-3.50) (-0.78) (-4.31) (-3.22) (1.00)120 sec 495.12*** 39.00** 27.95 51.84*** -227.22** 9.30 -20.26* -22.68*** 267.91(t-stat) (3.18) (2.05) (0.60) (2.78) (-2.51) (0.53) (-1.90) (-3.27) (1.61)
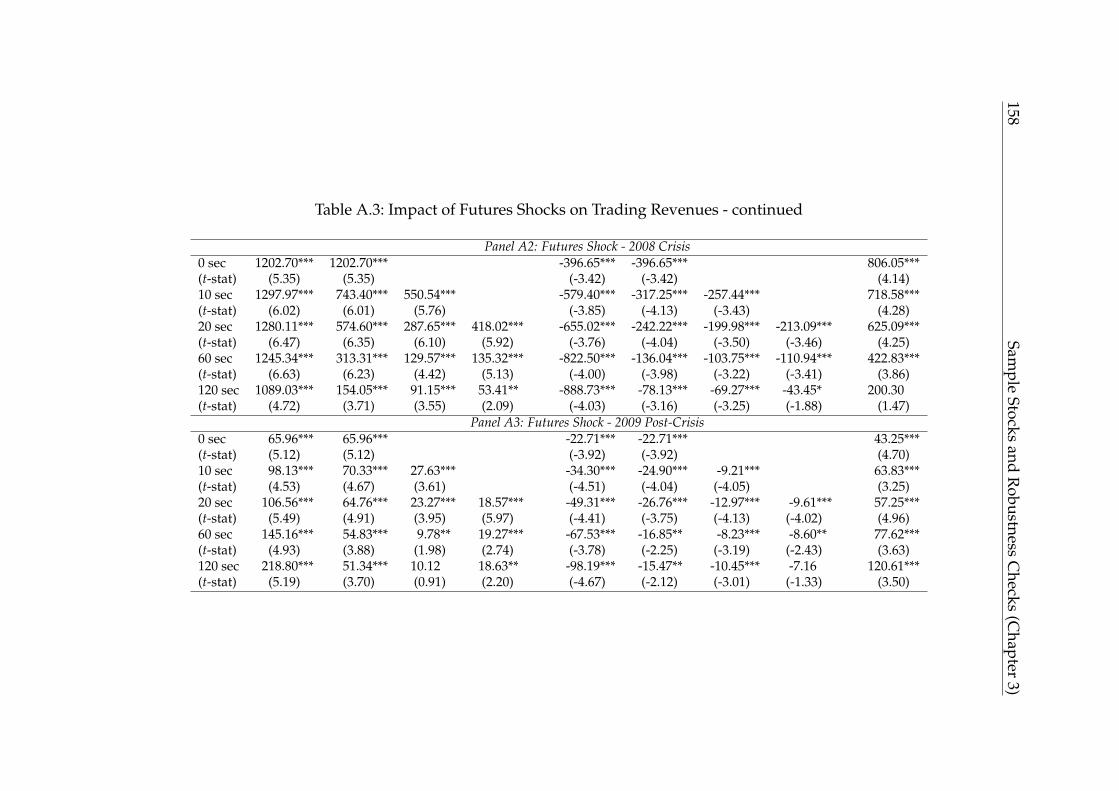
158Sam
pleStocks
andR
obustnessC
hecks(C
hapter3)
Table A.3: Impact of Futures Shocks on Trading Revenues - continued
Panel A2: Futures Shock - 2008 Crisis0 sec 1202.70*** 1202.70*** -396.65*** -396.65*** 806.05***(t-stat) (5.35) (5.35) (-3.42) (-3.42) (4.14)10 sec 1297.97*** 743.40*** 550.54*** -579.40*** -317.25*** -257.44*** 718.58***(t-stat) (6.02) (6.01) (5.76) (-3.85) (-4.13) (-3.43) (4.28)20 sec 1280.11*** 574.60*** 287.65*** 418.02*** -655.02*** -242.22*** -199.98*** -213.09*** 625.09***(t-stat) (6.47) (6.35) (6.10) (5.92) (-3.76) (-4.04) (-3.50) (-3.46) (4.25)60 sec 1245.34*** 313.31*** 129.57*** 135.32*** -822.50*** -136.04*** -103.75*** -110.94*** 422.83***(t-stat) (6.63) (6.23) (4.42) (5.13) (-4.00) (-3.98) (-3.22) (-3.41) (3.86)120 sec 1089.03*** 154.05*** 91.15*** 53.41** -888.73*** -78.13*** -69.27*** -43.45* 200.30(t-stat) (4.72) (3.71) (3.55) (2.09) (-4.03) (-3.16) (-3.25) (-1.88) (1.47)
Panel A3: Futures Shock - 2009 Post-Crisis0 sec 65.96*** 65.96*** -22.71*** -22.71*** 43.25***(t-stat) (5.12) (5.12) (-3.92) (-3.92) (4.70)10 sec 98.13*** 70.33*** 27.63*** -34.30*** -24.90*** -9.21*** 63.83***(t-stat) (4.53) (4.67) (3.61) (-4.51) (-4.04) (-4.05) (3.25)20 sec 106.56*** 64.76*** 23.27*** 18.57*** -49.31*** -26.76*** -12.97*** -9.61*** 57.25***(t-stat) (5.49) (4.91) (3.95) (5.97) (-4.41) (-3.75) (-4.13) (-4.02) (4.96)60 sec 145.16*** 54.83*** 9.78** 19.27*** -67.53*** -16.85** -8.23*** -8.60** 77.62***(t-stat) (4.93) (3.88) (1.98) (2.74) (-3.78) (-2.25) (-3.19) (-2.43) (3.63)120 sec 218.80*** 51.34*** 10.12 18.63** -98.19*** -15.47** -10.45*** -7.16 120.61***(t-stat) (5.19) (3.70) (0.91) (2.20) (-4.67) (-2.12) (-3.01) (-1.33) (3.50)
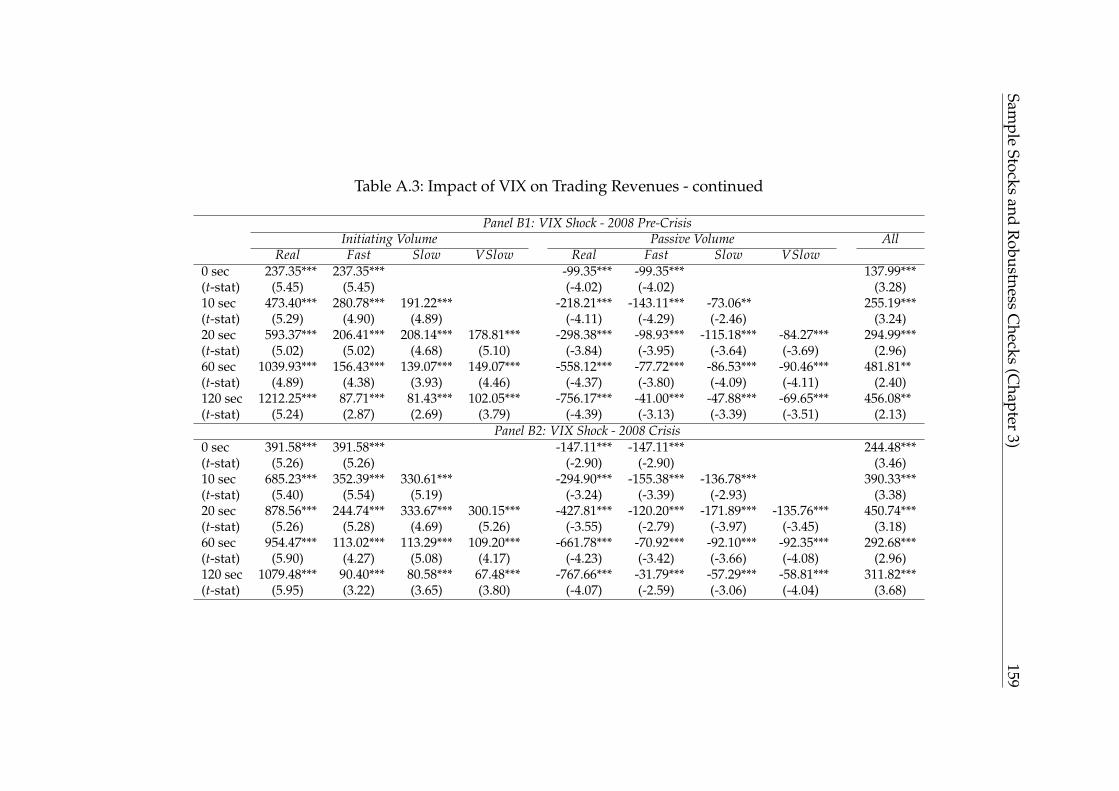
Sample
Stocksand
Robustness
Checks
(Chapter
3)159
Table A.3: Impact of VIX on Trading Revenues - continued
Panel B1: VIX Shock - 2008 Pre-CrisisInitiating Volume Passive Volume All
Real Fast Slow VSlow Real Fast Slow VSlow0 sec 237.35*** 237.35*** -99.35*** -99.35*** 137.99***(t-stat) (5.45) (5.45) (-4.02) (-4.02) (3.28)10 sec 473.40*** 280.78*** 191.22*** -218.21*** -143.11*** -73.06** 255.19***(t-stat) (5.29) (4.90) (4.89) (-4.11) (-4.29) (-2.46) (3.24)20 sec 593.37*** 206.41*** 208.14*** 178.81*** -298.38*** -98.93*** -115.18*** -84.27*** 294.99***(t-stat) (5.02) (5.02) (4.68) (5.10) (-3.84) (-3.95) (-3.64) (-3.69) (2.96)60 sec 1039.93*** 156.43*** 139.07*** 149.07*** -558.12*** -77.72*** -86.53*** -90.46*** 481.81**(t-stat) (4.89) (4.38) (3.93) (4.46) (-4.37) (-3.80) (-4.09) (-4.11) (2.40)120 sec 1212.25*** 87.71*** 81.43*** 102.05*** -756.17*** -41.00*** -47.88*** -69.65*** 456.08**(t-stat) (5.24) (2.87) (2.69) (3.79) (-4.39) (-3.13) (-3.39) (-3.51) (2.13)
Panel B2: VIX Shock - 2008 Crisis0 sec 391.58*** 391.58*** -147.11*** -147.11*** 244.48***(t-stat) (5.26) (5.26) (-2.90) (-2.90) (3.46)10 sec 685.23*** 352.39*** 330.61*** -294.90*** -155.38*** -136.78*** 390.33***(t-stat) (5.40) (5.54) (5.19) (-3.24) (-3.39) (-2.93) (3.38)20 sec 878.56*** 244.74*** 333.67*** 300.15*** -427.81*** -120.20*** -171.89*** -135.76*** 450.74***(t-stat) (5.26) (5.28) (4.69) (5.26) (-3.55) (-2.79) (-3.97) (-3.45) (3.18)60 sec 954.47*** 113.02*** 113.29*** 109.20*** -661.78*** -70.92*** -92.10*** -92.35*** 292.68***(t-stat) (5.90) (4.27) (5.08) (4.17) (-4.23) (-3.42) (-3.66) (-4.08) (2.96)120 sec 1079.48*** 90.40*** 80.58*** 67.48*** -767.66*** -31.79*** -57.29*** -58.81*** 311.82***(t-stat) (5.95) (3.22) (3.65) (3.80) (-4.07) (-2.59) (-3.06) (-4.04) (3.68)
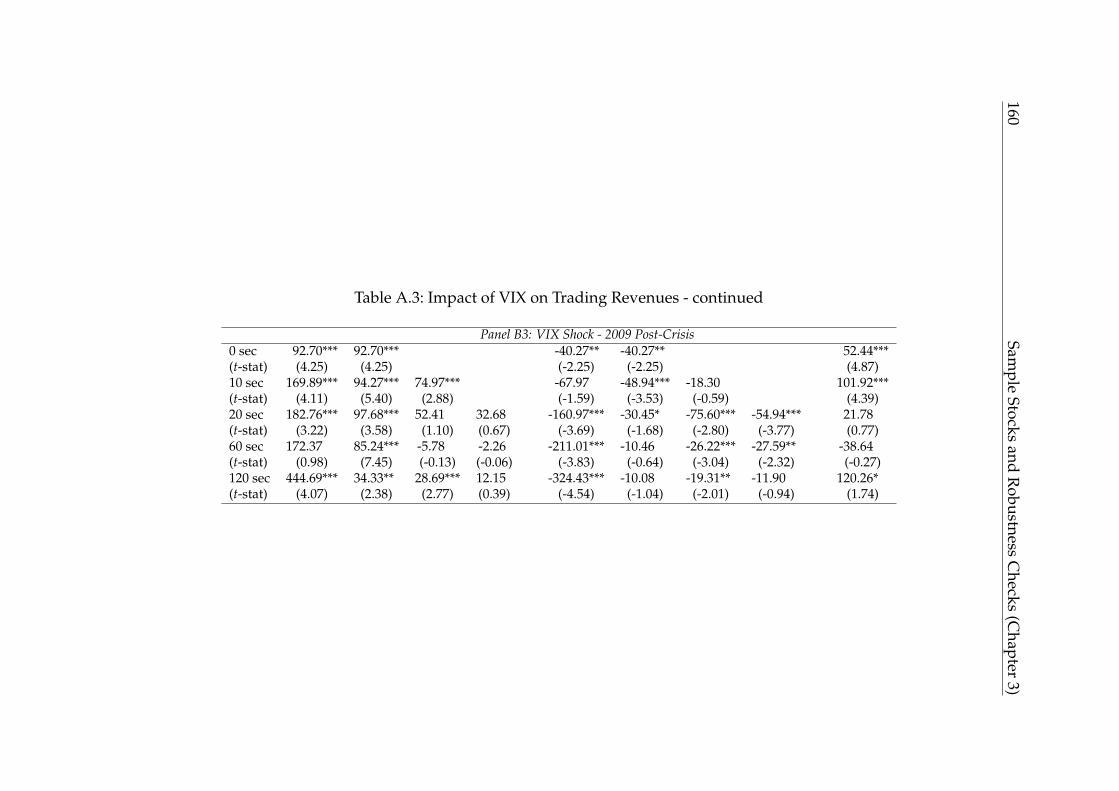
160Sam
pleStocks
andR
obustnessC
hecks(C
hapter3)
Table A.3: Impact of VIX on Trading Revenues - continued
Panel B3: VIX Shock - 2009 Post-Crisis0 sec 92.70*** 92.70*** -40.27** -40.27** 52.44***(t-stat) (4.25) (4.25) (-2.25) (-2.25) (4.87)10 sec 169.89*** 94.27*** 74.97*** -67.97 -48.94*** -18.30 101.92***(t-stat) (4.11) (5.40) (2.88) (-1.59) (-3.53) (-0.59) (4.39)20 sec 182.76*** 97.68*** 52.41 32.68 -160.97*** -30.45* -75.60*** -54.94*** 21.78(t-stat) (3.22) (3.58) (1.10) (0.67) (-3.69) (-1.68) (-2.80) (-3.77) (0.77)60 sec 172.37 85.24*** -5.78 -2.26 -211.01*** -10.46 -26.22*** -27.59** -38.64(t-stat) (0.98) (7.45) (-0.13) (-0.06) (-3.83) (-0.64) (-3.04) (-2.32) (-0.27)120 sec 444.69*** 34.33** 28.69*** 12.15 -324.43*** -10.08 -19.31** -11.90 120.26*(t-stat) (4.07) (2.38) (2.77) (0.39) (-4.54) (-1.04) (-2.01) (-0.94) (1.74)
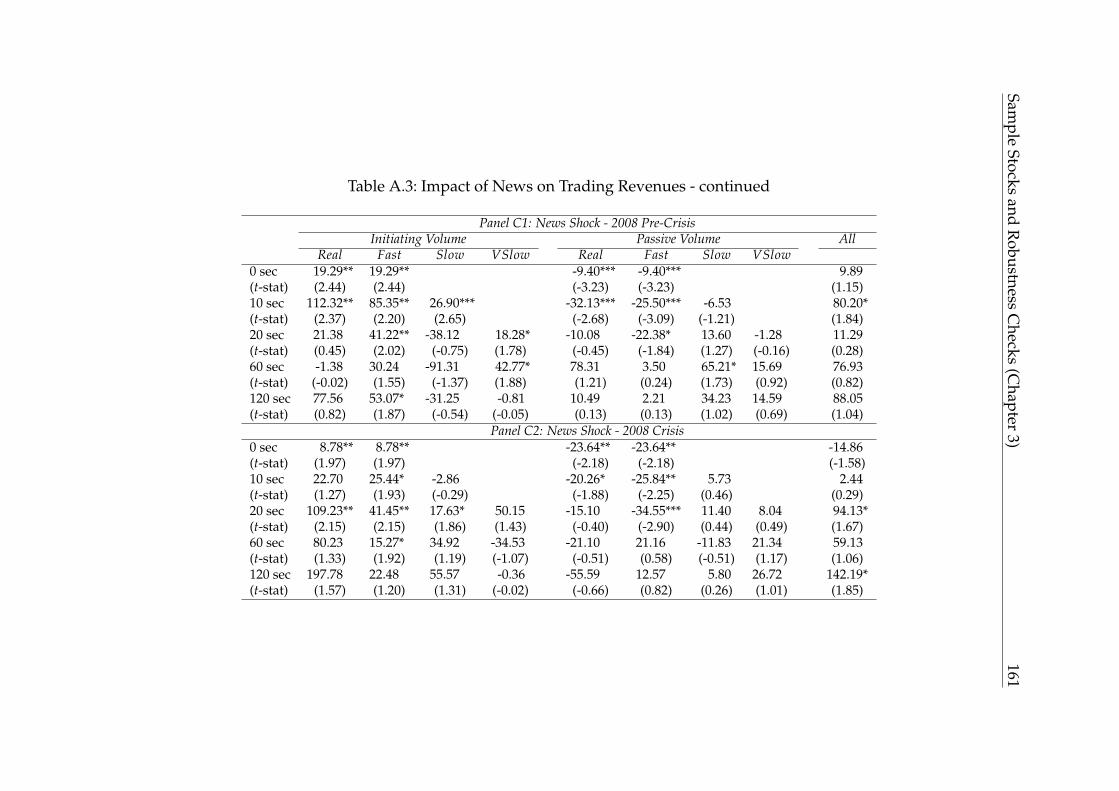
Sample
Stocksand
Robustness
Checks
(Chapter
3)161
Table A.3: Impact of News on Trading Revenues - continued
Panel C1: News Shock - 2008 Pre-CrisisInitiating Volume Passive Volume All
Real Fast Slow VSlow Real Fast Slow VSlow0 sec 19.29** 19.29** -9.40*** -9.40*** 9.89(t-stat) (2.44) (2.44) (-3.23) (-3.23) (1.15)10 sec 112.32** 85.35** 26.90*** -32.13*** -25.50*** -6.53 80.20*(t-stat) (2.37) (2.20) (2.65) (-2.68) (-3.09) (-1.21) (1.84)20 sec 21.38 41.22** -38.12 18.28* -10.08 -22.38* 13.60 -1.28 11.29(t-stat) (0.45) (2.02) (-0.75) (1.78) (-0.45) (-1.84) (1.27) (-0.16) (0.28)60 sec -1.38 30.24 -91.31 42.77* 78.31 3.50 65.21* 15.69 76.93(t-stat) (-0.02) (1.55) (-1.37) (1.88) (1.21) (0.24) (1.73) (0.92) (0.82)120 sec 77.56 53.07* -31.25 -0.81 10.49 2.21 34.23 14.59 88.05(t-stat) (0.82) (1.87) (-0.54) (-0.05) (0.13) (0.13) (1.02) (0.69) (1.04)
Panel C2: News Shock - 2008 Crisis0 sec 8.78** 8.78** -23.64** -23.64** -14.86(t-stat) (1.97) (1.97) (-2.18) (-2.18) (-1.58)10 sec 22.70 25.44* -2.86 -20.26* -25.84** 5.73 2.44(t-stat) (1.27) (1.93) (-0.29) (-1.88) (-2.25) (0.46) (0.29)20 sec 109.23** 41.45** 17.63* 50.15 -15.10 -34.55*** 11.40 8.04 94.13*(t-stat) (2.15) (2.15) (1.86) (1.43) (-0.40) (-2.90) (0.44) (0.49) (1.67)60 sec 80.23 15.27* 34.92 -34.53 -21.10 21.16 -11.83 21.34 59.13(t-stat) (1.33) (1.92) (1.19) (-1.07) (-0.51) (0.58) (-0.51) (1.17) (1.06)120 sec 197.78 22.48 55.57 -0.36 -55.59 12.57 5.80 26.72 142.19*(t-stat) (1.57) (1.20) (1.31) (-0.02) (-0.66) (0.82) (0.26) (1.01) (1.85)
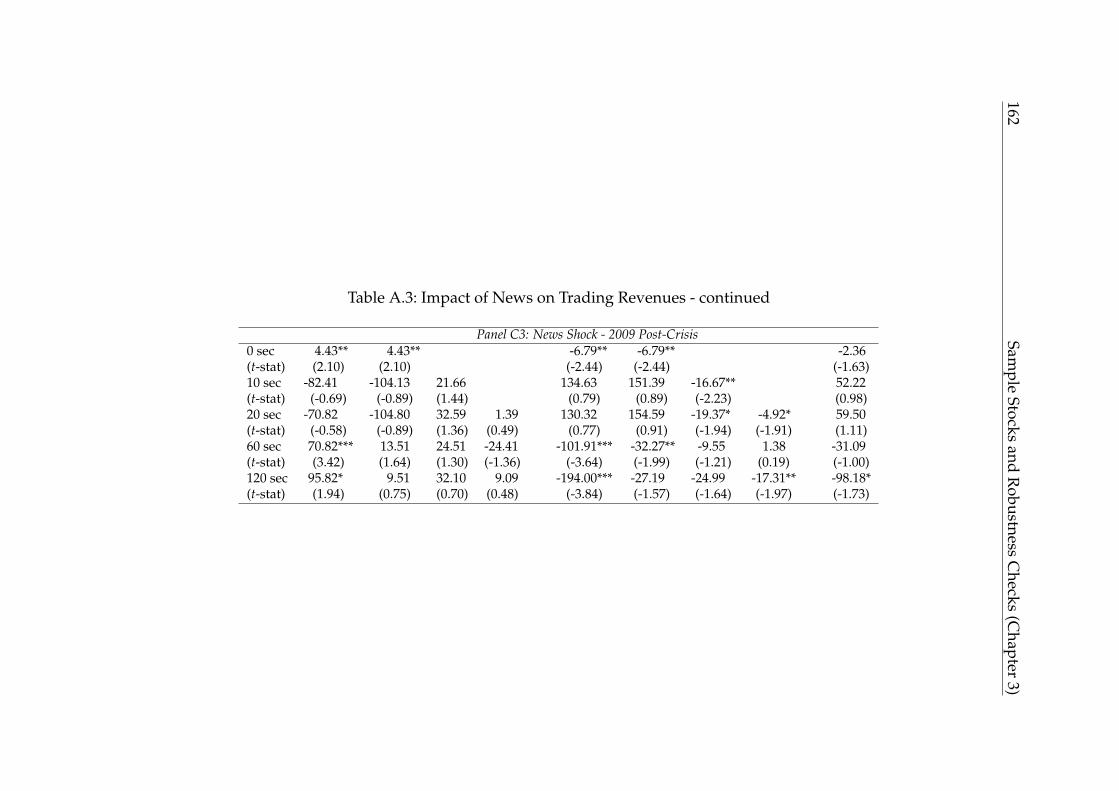
162Sam
pleStocks
andR
obustnessC
hecks(C
hapter3)
Table A.3: Impact of News on Trading Revenues - continued
Panel C3: News Shock - 2009 Post-Crisis0 sec 4.43** 4.43** -6.79** -6.79** -2.36(t-stat) (2.10) (2.10) (-2.44) (-2.44) (-1.63)10 sec -82.41 -104.13 21.66 134.63 151.39 -16.67** 52.22(t-stat) (-0.69) (-0.89) (1.44) (0.79) (0.89) (-2.23) (0.98)20 sec -70.82 -104.80 32.59 1.39 130.32 154.59 -19.37* -4.92* 59.50(t-stat) (-0.58) (-0.89) (1.36) (0.49) (0.77) (0.91) (-1.94) (-1.91) (1.11)60 sec 70.82*** 13.51 24.51 -24.41 -101.91*** -32.27** -9.55 1.38 -31.09(t-stat) (3.42) (1.64) (1.30) (-1.36) (-3.64) (-1.99) (-1.21) (0.19) (-1.00)120 sec 95.82* 9.51 32.10 9.09 -194.00*** -27.19 -24.99 -17.31** -98.18*(t-stat) (1.94) (0.75) (0.70) (0.48) (-3.84) (-1.57) (-1.64) (-1.97) (-1.73)

Appendix B
Experimental Design and Instructions
(Chapter 4)
B.1 Participant Instructions
163
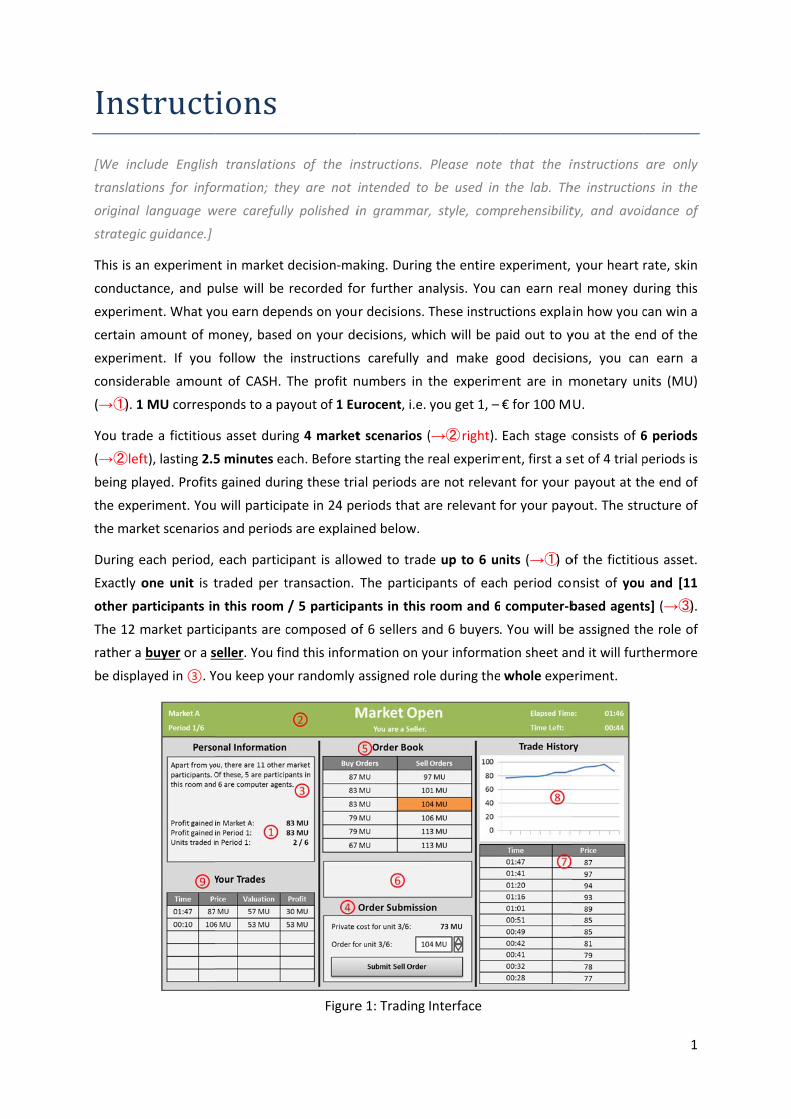
Inst [We inc
translati
original
strategic
This is a
conducta
experim
certain a
experim
consider
( ①→ ). 1
You trad
( ②→ lef
being pla
the expe
the mark
During e
Exactly o
other pa
The 12 m
rather a
be displa
truct
clude English
ions for info
language w
c guidance.]
n experimen
ance, and p
ent. What yo
amount of m
ent. If you
rable amoun
MU corresp
de a fictitiou
ft), lasting 2.5
ayed. Profits
eriment. You
ket scenarios
each period,
one unit is t
articipants in
market parti
buyer or a s
ayed in ③. Y
ions
h translation
ormation; th
were carefull
nt in market
ulse will be
ou earn depe
money, based
follow the
nt of CASH.
ponds to a pa
us asset duri
5 minutes ea
s gained dur
u will particip
s and period
each partic
traded per t
n this room
cipants are c
seller. You fin
You keep you
ns of the in
ey are not i
ly polished i
decision‐ma
recorded fo
ends on you
d on your de
instructions
The profit n
ayout of 1 Eu
ng 4 market
ach. Before s
ing these tri
pate in 24 pe
s are explain
ipant is allow
transaction.
/ 5 participa
composed o
nd this inform
ur randomly
Figure
nstructions.
intended to
in grammar,
aking. During
or further an
r decisions. T
ecisions, wh
s carefully a
numbers in t
urocent, i.e.
t scenarios (
starting the r
al periods ar
eriods that a
ned below.
wed to trad
The particip
ants in this
of 6 sellers a
mation on yo
assigned rol
e 1: Trading
Please note
be used in
, style, com
g the entire e
nalysis. You
These instru
ich will be p
and make g
the experim
you get 1, –
( ②→ right).
real experim
re not releva
are relevant f
e up to 6 un
pants of eac
room and 6
nd 6 buyers
our informat
e during the
Interface
e that the i
the lab. Th
prehensibilit
experiment,
can earn rea
ctions expla
paid out to y
good decisio
ent are in m
€ for 100 M
Each stage c
ent, first a se
ant for your
for your pay
nits ( ①→ ) o
h period co
computer‐b
. You will be
tion sheet an
whole expe
instructions
he instruction
ty, and avoi
your heart
al money du
in how you c
you at the en
ons, you can
monetary un
U.
consists of 6
et of 4 trial p
payout at th
yout. The str
of the fictitio
nsist of you
based agent
e assigned th
nd it will furt
eriment.
1
are only
ns in the
idance of
rate, skin
uring this
can win a
nd of the
n earn a
nits (MU)
6 periods
periods is
he end of
ucture of
ous asset.
u and [11
ts] ( ③→ ).
he role of
thermore
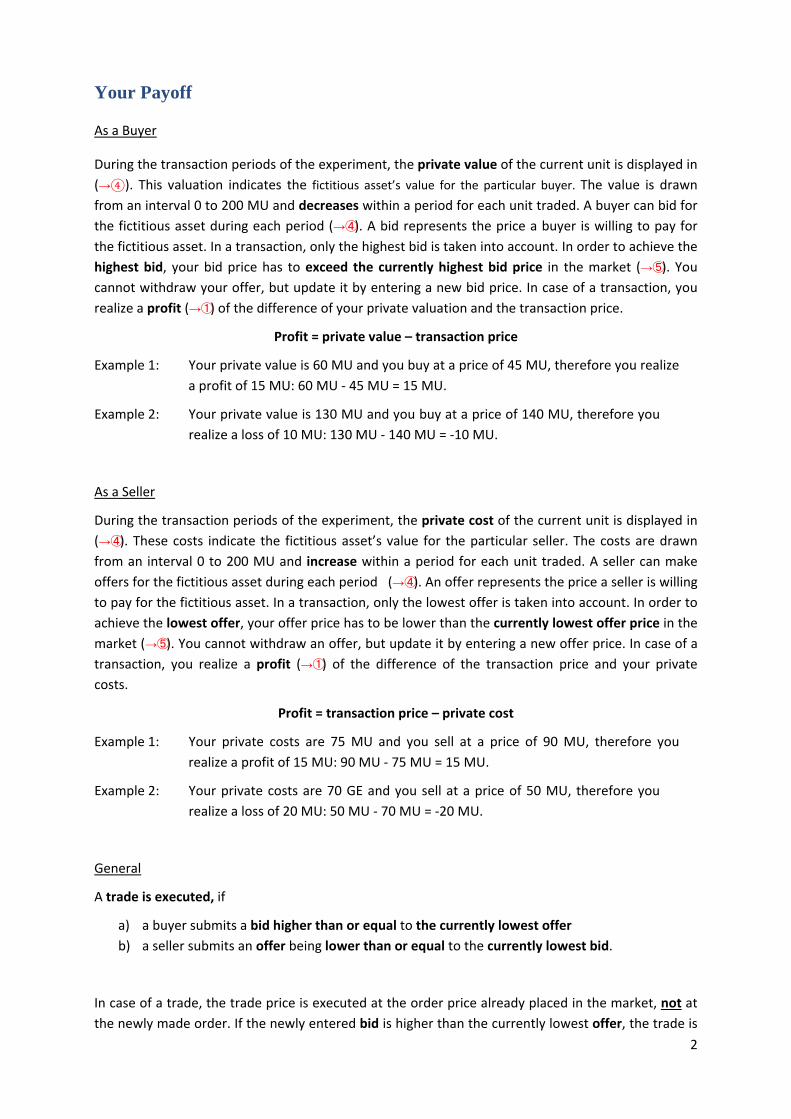
2
Your Payoff
As a Buyer
During the transaction periods of the experiment, the private value of the current unit is displayed in (→④). This valuation indicates the fictitious asset’s value for the particular buyer. The value is drawn from an interval 0 to 200 MU and decreases within a period for each unit traded. A buyer can bid for the fictitious asset during each period ( ④→ ). A bid represents the price a buyer is willing to pay for the fictitious asset. In a transaction, only the highest bid is taken into account. In order to achieve the highest bid, your bid price has to exceed the currently highest bid price in the market ( ⑤→ ). You cannot withdraw your offer, but update it by entering a new bid price. In case of a transaction, you realize a profit ( ①→ ) of the difference of your private valuation and the transaction price.
Profit = private value – transaction price
Example 1: Your private value is 60 MU and you buy at a price of 45 MU, therefore you realize a profit of 15 MU: 60 MU ‐ 45 MU = 15 MU.
Example 2: Your private value is 130 MU and you buy at a price of 140 MU, therefore you realize a loss of 10 MU: 130 MU ‐ 140 MU = ‐10 MU.
As a Seller
During the transaction periods of the experiment, the private cost of the current unit is displayed in ( ④→ ). These costs indicate the fictitious asset’s value for the particular seller. The costs are drawn from an interval 0 to 200 MU and increase within a period for each unit traded. A seller can make offers for the fictitious asset during each period ( ④→ ). An offer represents the price a seller is willing to pay for the fictitious asset. In a transaction, only the lowest offer is taken into account. In order to achieve the lowest offer, your offer price has to be lower than the currently lowest offer price in the market ( ⑤→ ). You cannot withdraw an offer, but update it by entering a new offer price. In case of a transaction, you realize a profit ( ①→ ) of the difference of the transaction price and your private costs.
Profit = transaction price – private cost
Example 1: Your private costs are 75 MU and you sell at a price of 90 MU, therefore you realize a profit of 15 MU: 90 MU ‐ 75 MU = 15 MU.
Example 2: Your private costs are 70 GE and you sell at a price of 50 MU, therefore you realize a loss of 20 MU: 50 MU ‐ 70 MU = ‐20 MU.
General
A trade is executed, if
a) a buyer submits a bid higher than or equal to the currently lowest offer b) a seller submits an offer being lower than or equal to the currently lowest bid.
In case of a trade, the trade price is executed at the order price already placed in the market, not at the newly made order. If the newly entered bid is higher than the currently lowest offer, the trade is
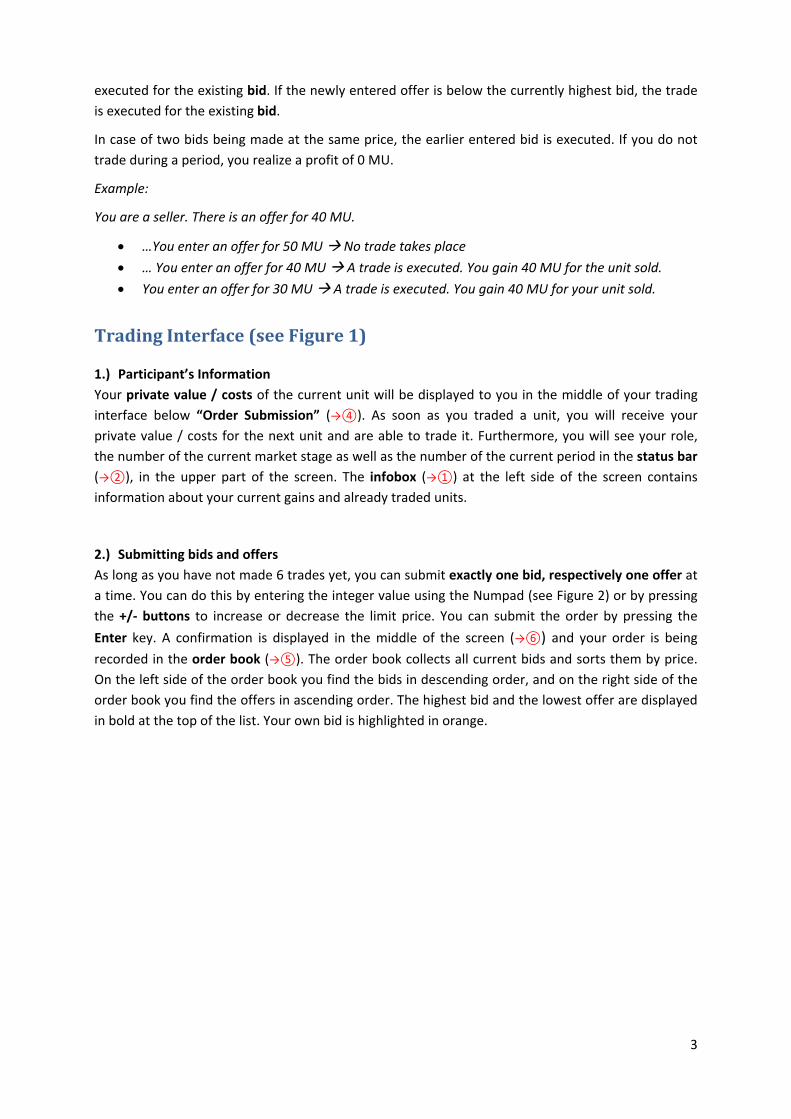
3
executed for the existing bid. If the newly entered offer is below the currently highest bid, the trade is executed for the existing bid.
In case of two bids being made at the same price, the earlier entered bid is executed. If you do not trade during a period, you realize a profit of 0 MU.
Example:
You are a seller. There is an offer for 40 MU.
…You enter an offer for 50 MU No trade takes place
… You enter an offer for 40 MU A trade is executed. You gain 40 MU for the unit sold.
You enter an offer for 30 MU A trade is executed. You gain 40 MU for your unit sold.
TradingInterface(seeFigure1)
1.) Participant’s Information Your private value / costs of the current unit will be displayed to you in the middle of your trading interface below “Order Submission” (→④). As soon as you traded a unit, you will receive your private value / costs for the next unit and are able to trade it. Furthermore, you will see your role, the number of the current market stage as well as the number of the current period in the status bar (→②), in the upper part of the screen. The infobox (→①) at the left side of the screen contains information about your current gains and already traded units.
2.) Submitting bids and offers As long as you have not made 6 trades yet, you can submit exactly one bid, respectively one offer at a time. You can do this by entering the integer value using the Numpad (see Figure 2) or by pressing the +/‐ buttons to increase or decrease the limit price. You can submit the order by pressing the Enter key. A confirmation is displayed in the middle of the screen (→⑥) and your order is being recorded in the order book (→⑤). The order book collects all current bids and sorts them by price. On the left side of the order book you find the bids in descending order, and on the right side of the order book you find the offers in ascending order. The highest bid and the lowest offer are displayed in bold at the top of the list. Your own bid is highlighted in orange.
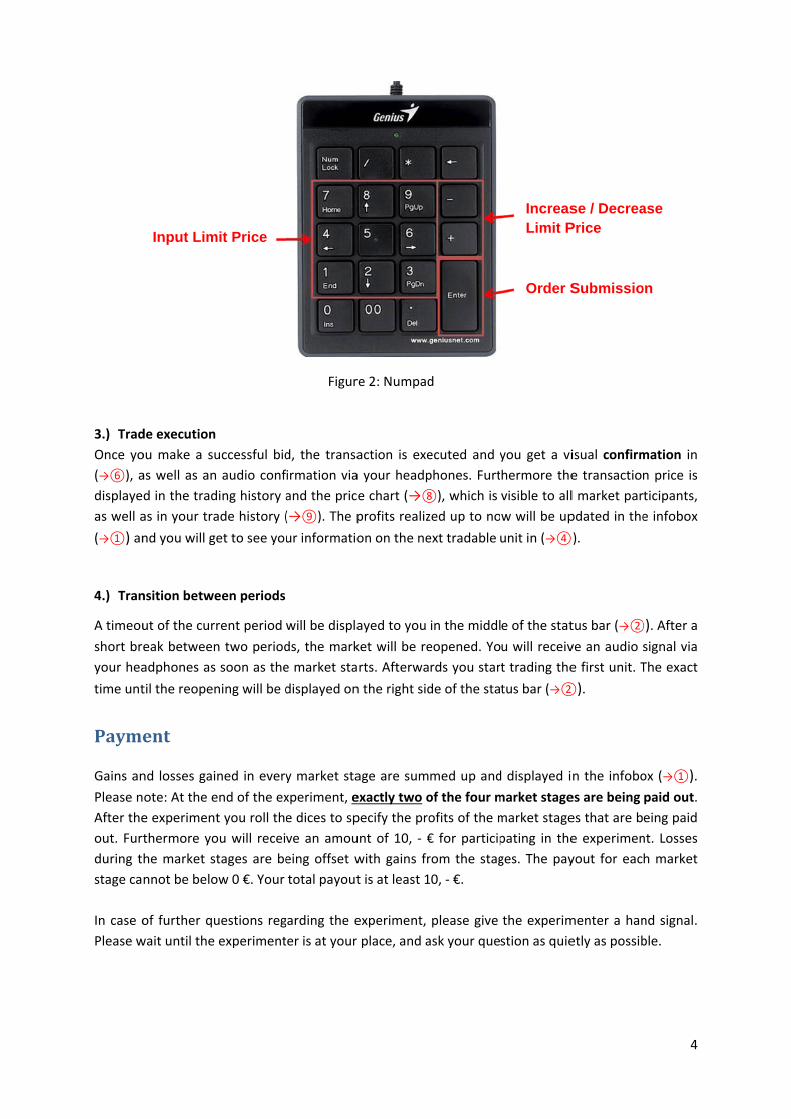
3.) TradOnce yo(→⑥), adisplayeas well a(→①) an
4.) Tran
A timeoushort bryour heatime unt
Payme
Gains anPlease nAfter theout. Furtduring tstage ca In case oPlease w
de executionou make a suas well as and in the tradas in your trand you will g
nsition betw
ut of the cureak betweenadphones astil the reopen
ent
nd losses gaiote: At the ee experimenthermore yohe market snnot be belo
of further quwait until the
Input Lim
n uccessful bidn audio confding history aade history (get to see yo
een periods
rrent period n two periods soon as thening will be d
ined in everyend of the ext you roll thou will receistages are beow 0 €. Your
uestions reg experiment
mit Price
d, the transairmation viaand the pric(→⑨). The pur informatio
will be displads, the marke market stadisplayed on
y market staxperiment, ee dices to spve an amoueing offset wtotal payout
garding the eter is at your
Figur
action is exea your headpe chart (→⑧
profits realizon on the ne
ayed to you ket will be rerts. Afterwan the right sid
age are sumexactly two opecify the prount of 10, ‐ €with gains frt is at least 1
experiment, place, and a
re 2: Numpad
ecuted and yphones. Furt⑧), which iszed up to noext tradable
in the middleopened. Yords you starde of the sta
med up andof the four mofits of the m€ for participrom the stag10, ‐ €.
please give ask your que
d
you get a vihermore thevisible to allw will be upunit in (→④
e of the statu will receivt trading thetus bar (→②
d displayed imarket stagemarket stagepating in theges. The pay
the experimstion as quie
IncreasLimit P
Order S
isual confirme transactionl market parpdated in the).
tus bar (→②
ve an audio se first unit. T
②).
n the infoboes are being es that are be experimenyout for eac
menter a hanetly as possib
se / DecreaPrice
Submissio
4
mation in n price is ticipants, e infobox
②). After a signal via The exact
ox (→①). paid out. eing paid nt. Losses h market
nd signal. ble.
ase
on

168 Experimental Design and Instructions (Chapter 4)
B.2 Emotion Regulation Questionnaire
erq01 When I want to feel more positive emotion, I change what I am thinkingabout.
erq02 I keep my emotions to myself.erq03 If I want to feel less negative emotion, I change what I am thinking about.erq04 If I am feeling positive emotions, I am careful not to express them.erq05 When I am faced with a stressful situation, I make myself think about it in a
way that helps me stay calm.erq06 I control my emotions by not expressing them.erq07 When I want to feel more positive emotion, I change the way I am thinking
about the situation.erq08 I control my emotions by changing the way I think about the situation I am
in.erq09 When I am feeling negative emotions, I make sure not to express them.erq10 When I want to feel less negative emotion, I change the way I’m thinking
about the situation.
References
Adam, M. T. P., M. Gamer, J. Krämer, and C. Weinhardt (2011). Measuring emotions
in electronic markets. In Proceedings of the International Conference on Information
Systems.
Adam, M. T. P., J. Krämer, C. Jähnig, S. Seifert, and C. Weinhardt (2011). Understand-
ing auction fever: A framework for emotional bidding. Electronic Markets 21(3),
197–207.
Adam, M. T. P., J. Krämer, and C. Weinhardt (2013). Excitement up! Price down! Mea-
suring emotions in Dutch auctions. International Journal of Electronic Commerce 17(2),
7–39.
Adam, M. T. P. and E. Kroll (2012). Physiological evidence of attraction to chance.
Journal of Neuroscience, Psychology, and Economics 5(3), 152–165.
Aldridge, I. (2010). High-Frequency Trading. Wiley Trading.
Andersen, T. G. and O. Bondarenko (2013). VPIN and the flash crash. Journal of
Financial Markets, forthcoming.
Andrade, E. B., T. Odean, and S. Lin (2012). Bubbling with excitement: An experi-
ment. Working Paper.
Angel, J. J., L. E. Harris, and C. S. Spatt (2011). Equity trading in the 21st century.
Quarterly Journal of Finance 1(1), 1–53.
Antweiler, W. and M. Z. Frank (2004). Is all that talk just noise? The information
content of internet stock message boards. Journal of Finance 59(3), 1259–1294.
169
170 References
Association for Financial Markets in Europe (2012). MiFID 2 - Algorithmic & High
Frequency Trading. Position Paper, April 2012.
Astor, P. J., M. T. P. Adam, P. Jercic, K. Schaaff, and C. Weinhardt (2013). Integrat-
ing biosignals into information systems: A NeuroIS tool for improving emotion
regulation. Journal of Management Information Systems, forthcoming.
Asur, S. (2010). Predicting the future with social media. In Agent Technology (WI-IAT),
2010 IEEE.
Barclay, M. J., T. Hendershott, and D. T. McCormick (2003). Competition among
trading venues: Information and trading on Electronic Communications Networks.
Journal of Finance 58(6), 2637–2666.
Baron, M., J. Brogaard, and A. Kirilenko (2012). The trading profits of high frequency
traders. Working Paper.
Bessembinder, H. (1999). Trade execution costs on NASDAQ and the NYSE: A post-
reform comparison. Journal of Financial and Quantitative Analysis 34(3), 387.
Biais, B., T. Foucault, and S. Moinas (2012). Equilibrium high frequency trading. Work-
ing Paper.
Biais, B., D. Hilton, K. Mazurier, and S. Pouget (2005). Judgemental overconfidence,
self-monitoring, and trading performance in an experimental financial market. Re-
view of Economic Studies 72(2), 287–312.
Biais, B. and P. Woolley (2011). High Frequency Trading. Working Paper.
Bloomberg (2013, Jul 22). Panther, Coscia fined over high-frequency trading al-
gorithms. http://www.bloomberg.com/news/2013-07-22/panther-coscia-fined-
over-high-frequency-trading-algorithms-1-.html. Accessed 2013-08-05.
Bloomberg Business Week (2012, April 23). High-speed trading: My laser is faster
than your laser. http://www.businessweek.com/articles/2012-04-23/high-speed-
trading-my-laser-is-faster-than-your-laser. Accessed 2013-08-05.
References 171
Bloomberg Businessweek (2013, Jun 6). How the robots lost: High-frequency trad-
ing’s rise and fall. http://www.businessweek.com/articles/2013-06-06/how-the-
robots-lost-high-frequency-tradings-rise-and-fall. Accessed 2013-08-05.
Bloomfield, R. and A. Anderson (2010). Experimental finance. Working Paper.
Bloomfield, R., M. O’Hara, and G. Saar (2009). How noise trading affects markets: An
experimental analysis. Review of Financial Studies 22(6), 2275–2302.
Bloomfield, R., M. O’Hara, and G. Saar (2011). Hidden Liquidity: Some new light on
dark trading December. Working Paper.
Boehmer, E., K. Fong, and J. Wu (2012). International evidence on algorithmic trading.
Working Paper.
Boehmer, E., G. Saar, and L. Yu (2005). Lifting the veil: An analysis of pre-trade
transparency at the NYSE. Journal of Finance 60(2), 783–815.
Bollen, J., H. Mao, and X.-J. Zeng (2011). Twitter mood predicts the stock market.
Journal of Computational Science, 1–8.
Brogaard, J., T. Hendershott, and R. Riordan (2013). High frequency trading and price
discovery. Working Paper.
Camerer, C. F. (2003). Behavioral game theory: Experiments in strategic interaction. Prince-
ton, NJ: Princeton University Press.
Cartea, A. and J. Penalva (2011). Where is the value in high frequency trading? Work-
ing Paper.
Chaboud, A., B. Chiquoine, E. Hjalmarsson, and C. Vega (2013). Rise of the machines:
Algorithmic trading in the foreign exchange market. Working Paper.
Chordia, T., R. Roll, and A. Subrahmanyam (2011). Recent trends in trading activity
and market quality. Journal of Financial Economics 101(2), 243–263.
Cliff, D. and J. Bruten (1997a). Minimal intelligence agents for bargaining behavior in
market-based environments. Technical report, HP Laboratories Bristol. HPL-97-91.
172 References
Cliff, D. and J. Bruten (1997b). Zero is not enough: On the lower limit of agent intel-
ligence for continuous double auction markets. Technical report, HP Laboratories
Bristol. HPL-97-131.
Colliard, J.-E. and P. Hoffmann (2013). Sand in the chips: Evidence on taxing transac-
tions in an electronic market. Working Paper.
Credit Suisse (2012). High Frequency Trading - The good, the bad, and the regulation.
Market Commentary, published 5 December 2012.
Das, R., J. Hanson, J. Kephart, and G. Tesauro (2001). Agent-human interactions in
the continuous double auction. In Proceedings of the IJCAI-01.
De Luca, M. and D. Cliff (2011). Agent-human interaction in the continuous double
auction, redux: Using the OpEx Lab-in-a-Box to explore ZIP and GDX. In Proceed-
ings of the 3rd International Conference on Agents and Artificial Intelligence (ICAART-
2011), Rome, Italy.
Decety, J., P. L. Jackson, J. A. Sommerville, T. Chaminade, and A. N. Meltzoff (2004,
October). The neural bases of cooperation and competition: an fMRI investigation.
NeuroImage 23(2), 744–51.
Degryse, H. (2009). Competition between financial markets in Europe: what can be
expected from MiFID? Financial Markets and Portfolio Management 23(1), 93–103.
Dimoka, A. (2010). What does the brain tell us about trust and distrust? Evidence
from a functional neuroimaging study. MIS Quarterly 34(2), 373–396.
Dimoka, A., R. D. Banker, I. Benbasat, F. D. Davis, A. R. Dennis, D. Gefen, A. Gupta,
A. Ischebeck, P. Kenning, P. A. Pavlou, G. Müller-Putz, R. Riedl, J. vom Brocke, and
B. Weber (2012). On the use of neurophysiological tools in IS research: Developing
a research agenda for NeuroIS. MIS Quarterly 36(3), 679–702.
Dimoka, A. and F. D. Davis (2008). Where does TAM reside in the brain? The neu-
ral mechanisms underlying technology adoption. In Proceedings of the International
Conference on Information Systems.
References 173
Dimoka, A., P. A. Pavlou, and F. D. Davis (2011, April). NeuroIS: The potential of
cognitive neuroscience for information systems research. Information Systems Re-
search 22(4), 687–702.
Easley, D., T. Hendershott, and T. Ramadorai (2013). Leveling the trading field. Journal
of Financial Markets, forthcoming.
Easley, D., M. M. Lopez de Prado, and M. O’Hara (2012). Flow toxicity and liquidity
in a high-frequency world. Review of Financial Studies 25(5), 1457–1493.
Egginton, J., B. Van Ness, and R. Van Ness (2012). Quote stuffing. Working Paper.
Engelberg, J. (2008). Costly information processing: Evidence from earnings an-
nouncements. Working Paper.
Fenton-O’Creevy, M., J. T. Lins, S. Vohra, D. W. Richards, G. Davies, and K. Schaaff
(2012). Emotion regulation and trader expertise: Heart rate variability on the trad-
ing floor. Journal of˜Neuroscience, Psychology, and Economics 5(4), 227–237.
Financial Times (2009, Dec 09). High-frequency trading benefits both large
and small investors. http://www.ft.com/cms/s/0/33881656-e918-11de-a756-
00144feab49a.html. Accessed 2013-08-01.
Forbes (2010, Sep 9). Wall Street’s speed war.
http://www.forbes.com/forbes/2010/0927/outfront-netscape-jim-barksdale-
daniel-spivey-wall-street-speed-war.html. Accessed 2013-08-05.
Forbes (2012, Aug 6). Knight Capital mess aside, High Frequency Trading is here to
stay. http://www.forbes.com/sites/chrisbarth/2012/08/06/knight-capital-mess-
aside-high-frequency-trading-is-here-to-stay/. Accessed 2013-08-05.
Foucault, T., J. Hombert, and I. Rosu (2013). News trading and speed. Working Paper.
Frame, W. S. and L. J. White (2004). Empirical studies of financial innovation: Lots of
talk, little action? Journal of Economic Literature 42(1), 116–144.
174 References
Gai, J., C. Yao, and M. Ye (2012). The externality of high frequency trading. Working
Paper.
Gallagher, H. L., A. I. Jack, A. Roepstorff, and C. D. Frith (2002). Imaging the inten-
tional stance in a competitive game. NeuroImage 16(3), 814–821.
Garvey, R. and F. Wu (2010). Speed, distance, and electronic trading: New evidence
on why location matters. Journal of Financial Markets 13(4), 367–396.
Gimpel, H., M. T. P. Adam, and T. Teubner (2013). Emotion regulation in manage-
ment: Harnessing the potential of NeuroIS tools. In Proceedings of the European
Conference on Information Systems.
Gode, D. K. and S. Sunder (1993). Allocative efficiency of markets with zero-
intelligence traders: Market as a partial substitute for individual rationality. Journal
of Political Economy 101(1), 119–137.
Gomber, P. and M. Gsell (2006). Catching up with technology: The impact of regula-
tory changes on ECNs & MTFs and the trading venue landscape in Europe. Com-
petition and Regulation in Network Industries, special issue on The Future of Alternative
Trading Systems and ECNs in Global Financial Markets 1(4), 535–557.
Greiner, B. (2004). An online recruitment system for economic experiments. In K. Kre-
mer and V. Macho (Eds.), Forschung und wissenschaftliches Rechnen, pp. 79–93.
Gross, J. J. and O. P. John (2003). Individual differences in two emotion regulation pro-
cesses: Implications for affect, relationships, and well-being. Journal of Personality
and Social Psychology 82(2), 348–362.
Gross-Klussmann, A. and N. Hautsch (2011). When machines read the news: Us-
ing automated text analytics to quantify high frequency news-implied market re-
actions. Journal of Empirical Finance 18(2), 321–340.
Grossklags, J. and C. Schmidt (2003). Artificial software agents on thin double auction
markets: a human trader experiment. In Proceedings of the IEEE/WIC International
Conference on Intelligent Agent Technology (IAT), pp. 400–407.
References 175
Güth, W., R. Schmittberger, and B. Schwarze (1982). An experimental analysis of
ultimatum bargaining. Journal of Economic Behavior & Organization 3(4), 367–388.
Guttmann, R. H., A. G. Moukas, and P. Maes (1998). Agent-mediated Electronic Com-
merce: A Survey. The Knowledge Engineering Review 13(2), 147 – 159.
Haferkorn, M. and K. Zimmermann (2013). Securities transaction tax and market
quality - The case of France. Working Paper.
Hagströmer, B. and L. Nordén (2012). The diversity of high frequency traders. Journal
of Financial Markets, forthcoming.
Hammer, S. (2013). Architects of Electronic Trading. John Wiley & Sons, Inc.
Harris, L. (2003). Trading and Exchanges: Market Microstructure for Practitioners. Fi-
nancial Management Association Survey and Synthesis Series. Oxford University
Press.
Hasbrouck, J. (1991a). Measuring the information content of stock trades. Journal of
Finance 46(1), 179–207.
Hasbrouck, J. (1991b). The summary informativeness of stock trades: An econometric
analysis. Review of Financial Studies 4(3), 571–595.
Hasbrouck, J. (2003). Intraday price formation in U.S. equity index markets. Journal
of Finance 58(6), 2375–2399.
Hasbrouck, J. and G. Saar (2013). Low-latency trading. Journal of Financial Markets,
forthcoming.
Hau, H. (2001). Location matters: An examination of trading profits. Journal of Fi-
nance 56(5), 1959–1983.
He, M., N. R. Jennings, and H. Leung (2003). On Agent-Mediated Electronic Com-
merce. IEEE Transactions on Knowledge and Data Engineering 15, 985–1003.
Hendershott, T., C. M. Jones, and A. J. Menkveld (2011). Does algorithmic trading
improve liquidity? Journal of Finance 66(1), 1–33.
176 References
Hendershott, T. and P. C. Moulton (2011). Automation, speed, and stock market qual-
ity: The NYSE’s Hybrid. Journal of Financial Markets 14(4), 568–604.
Hendershott, T. and R. Riordan (2009). Algorithmic trading and information. Working
Paper.
Hendershott, T. and R. Riordan (2013). Algorithmic trading and the market for liq-
uidity. Journal of Financial and Quantitative Analysis, forthcoming.
Hengelbrock, J. and E. Theissen (2009). Fourteen at one blow: The market entry of
Turquoise. Working Paper.
Hirschey, N. H. (2013). Do high-frequency traders anticipate buying and selling pres-
sure? Working Paper.
Holt, C. A. and S. K. Laury (2002). Risk aversion and incentive effects. The American
Economic Review 92(5), 1644–1655.
Huang, R. D. and H. R. Stoll (1996). Dealer versus auction markets: A paired com-
parison of execution costs on NASDAQ and the NYSE. Journal of Financial Eco-
nomics 41(3), 313–357.
IIROC (2012). Proposed guidance on certain manipulative and deceptive trading
practices. 12-0221, July 17, 2012.
Jain, P. K. (2005). Financial market design and the equity premium: Electronic versus
floor trading. Journal of Finance 60(6), 2955–2985.
Jones, C. (2013). What do we know about high-frequency trading? Working Paper.
Jovanovic, B. and A. J. Menkveld (2012). Middlemen in limit-order markets. Working
Paper.
Kagel, J. H. and A. E. Roth (1995). The Handbook of Experimental Economics. Princeton,
NJ, Princeton University Press.
Kirilenko, A., A. S. Kyle, M. Samadi, and T. Tuzun (2011). The Flash Crash: The
impact of high frequency trading on an electronic market. Working Paper.

References 177
Ku, G., D. Malhotra, and J. K. Murnighan (2005). Towards a competitive arousal
model of decision-making: A study of auction fever in live and internet auctions.
Organizational Behavior and Human Decision Processes 96(2), 89–103.
Kyle, A. S. (1985). Continuous auctions and insider trading. Econometrica 53(6), 1315–
1335.
Lee, C. M. C. and M. J. Ready (1991). Inferring Trade Direction from Intraday Data.
Journal of Finance 46(2), 733.
Lo, A. W. and D. V. Repin (2002). The psychophysiology of real-time financial risk
processing. Journal of Cognitive Neuroscience 14(3), 323–39.
Luca, M. D., C. Szostek, J. Cartlidge, and D. Cliff (2011). Studies of interactions be-
tween human traders and Algorithmic Trading Systems. In The Future of Computer
Trading in Financial Markets - Foresight Driver Review.
Malinova, K. and A. Park (2011). Subsidizing liquidity: The impact of make/take fees
on market quality. Working Paper.
Martinez, V. H. and I. Rosu (2013). High frequency traders, news, and volatility.
Working Paper.
Maule, A. J., G. R. J. Hockey, and L. Bdzola (2000). Effects of time-pressure on
decision-making under uncertainty: Changes in affective state and information
processing. Acta Psychologica 104, 283–301.
Menkveld, A. J. (2013). High frequency trading and the new-market makers. Journal
of Financial Markets, forthcoming.
Meyer, S., M. Wagener, and C. Weinhardt (2013). Politically motivated taxes in finan-
cial markets: The case of the french financial transaction tax. Journal of Financial
Services Research, forthcoming.
Muth, J. F. (1961). Rational expectations and the theory of price movements. Econo-
metrica 29(3), 315–335.
178 References
New York Times (2010, Dec 22). Computers that trade on the news.
http://www.nytimes.com/2010/12/23/business/23trading.html. Accessed 2013-
08-05.
O’Hara, M. (1997). Market Microstructure Theory. Blackwell Business. John Wiley &
Sons, Inc.
O’Hara, M., C. Yao, and M. Ye (2011). What’s not there: The odd-lot bias in TAQ data.
Working Paper.
One Market Data (2013, Jul 22). New survey points to growing influence of so-
cial media in trading. http://www.onetick.com/web1/pressRelease20130722-
SocialMediaSurvey.php. Accessed 2013-08-06.
Perold, A. F. (1988). The implementation shortfall: Paper versus reality. Journal of
Portfolio Management 14(3), 4–9.
Petersen, M. A. (2004). Information: Hard and soft. Working Paper.
Plott, C. R. and S. Sunder (1988). Rational expectations and the aggregation of diverse
information in laboratory security markets. Econometrica 56(5), 1085–1118.
Reuters (2013a, Aug 23). Exclusive: EBS take new step to rein in high-
frequency traders. http://www.reuters.com/article/2013/08/23/us-markets-
forex-hft-idUSBRE97M0YJ20130823. Accessed 2013-09-06.
Reuters (2013b, May 1). Lasers, microwave deployed in high-speed trad-
ing arms race. http://www.reuters.com/article/2013/05/01/us-highfrequency-
microwave-idUSBRE9400L920130501. Accessed 2013-08-05.
Riedl, R., R. D. Banker, I. Benbasat, F. D. Davis, and A. R. Dennis (2010). On the
Foundations of NeuroIS: Reflections on the Gmunden Retreat 2009. Communications
of the Association for Information Systems 27(1).
Riedl, R., M. Hubert, and P. H. Kenning (2010). Are there neural gender differences in
online trust? An fMRI Study on the perceived trustworthiness of eBay offers. MIS
Quarterly 34(2), 397–428.
References 179
Riedl, R., H. Kindermann, A. Auinger, and A. Javor (2012, February). Technostress
from a neurobiological perspective. Business & Information Systems Engineering 2,
61–69.
Riedl, R., P. N. C. Mohr, P. H. Kenning, F. D. Davis, and H. R. Heekeren (2011). Trust-
ing humans and avatars: Behavioral and neural evidence. In Proceedings of the
International Conference on Information Systems, pp. 1–23.
Riordan, R. and A. Storkenmaier (2012). Latency, liquidity and price discovery. Jour-
nal of Financial Markets 15(4), 416–437.
Riordan, R., A. Storkenmaier, M. Wagener, and S. S. Zhang (2013). Public information
arrival: Price discovery and liquidity in electronic limit order markets. Journal of
Banking & Finance 37(4), 1148–1159.
Rustichini, A., M. A. Satterthwaite, and S. R. Williams (1994). Convergence to effi-
ciency in a simple market with incomplete information. Econometrica 62(5), 1041–
1063.
Sanfey, A. G., J. K. Rilling, J. A. Aronson, L. E. Nystrom, and J. D. Cohen (2003).
The neural basis of economic decision-making in the ultimatum game. Sci-
ence 300(5626), 1755–1758.
Schmidt, H. and P. Iversen (1992). Automating German equity trading: Bid-Ask
spreads on competing systems. Journal of Financial Services Research 6(4), 373–397.
SEC (2010). Concept release on equity market structure. Release No. 34-61358, Jan-
uary 14th, 2010.
SEC (2012a). Approval order to proposed rule change to permit FINRA to halt trading
by FINRA Members otherwise than on an exchange where a primary listing market
has issued a trading pause due to extraordinary market conditions. Release No. 34-
62251, June 10, 2010.
SEC (2012b). Approval order to proposed rule changes relating to trading pauses due
to extraordinary market volatility. Release No. 34-62252, June 10, 2010.
180 References
SEC (2012c). Market-wide circuit breaker approval order. Release No. 34-67090, May
31st, 2012.
Smith, A. (1776). An inquiry into the nature and causes of the wealth of nations (1904 ed.).
Library of Economics and Liberty.
Smith, K. and J. Dickhaut (2005). Economics and emotion: Institutions matter. Games
and Economic Behavior 52(2), 316–335.
Smith, V. L. (1962). An experimental study of competitive market behavior. Journal of
Political Economy 70(2), 111–137.
Smith, V. L. (1976). Experimental economics: Induced value theory. American Eco-
nomic Review 66(2), 274–279.
Storkenmaier, A., M. Wagener, and C. Weinhardt (2012). Public Information in Frag-
mented Markets. Journal of Financial Market and Portfolio Management 26(2), 179–215.
Sussman, A. (2012). US equities market 2012: Mid-year review. Tabb Group Report.
Tetlock, P. C. (2007). Giving content to investor sentiment: The role of media in the
stock market. Journal of Finance 62(3), 1139–1168.
Tetlock, P. C. (2010). Does public financial news resolve asymmetric information?
Review of Financial Studies 23(9), 3520–3557.
Teubner, T., M. T. P. Adam, and R. Riordan (2012). Bidding against the machine:
Emotions in electronic markets. Working Paper.
The Guardian (2013, Apr 23). AP Twitter hack causes panic on Wall Street and sends
Dow plunging. http://www.theguardian.com/business/2013/apr/23/ap-tweet-
hack-wall-street-freefall. Accessed 2013-08-06.
Theissen, E. (2002). Floor versus screen trading: Evidence from the German stock
market. Journal of Institutional and Theoretical Economics 158(1), 32–54.
Theissen, E. (2012). Price discovery in spot and futures markets: A reconsideration.
European Journal of Finance.
References 181
Thompson, S. B. (2011). Simple formulas for standard errors that cluster by both firm
and time. Journal of Financial Economics 99(1), 1–10.
Timms, A. (2012). Feeding the Need for Speed. The Daily Deal 23(189), 5–12.
Tookes, H. (2008). Information, Trading and Product Market Interactions: Cross-
Sectional Implications of Insider Trading. Journal of Finance 63(1), 379–413.
Venkataraman, K. (2001). Automated Versus Floor Trading: An Analysis of Execution
Costs on the Paris and New York Exchanges. Journal of Finance 56(4), 1445–1485.
Wall Street and Technology (2011, Oct 31). CME’s colo service to go live on
Jan. 29. http://www.wallstreetandtech.com/data-latency/cmes-colo-service-to-
go-live-on-jan-29/231900756. Accessed 2013-08-05.
Wall Street Journal (2011a, Oct 9). Does high-speed trading hurt the small investor?
http://online.wsj.com/article/SB10001424052970204226204576600980170960802.html.
Accessed 2013-08-01.
Wall Street Journal (2011b, Dec 19). NASDAQ pushes into machine-readable news.
http://online.wsj.com/article/BT-CO-20111219-708019.html. Accessed 2013-08-
05.
Waters Technology (2013, July). Complex Event Processing Special Re-
port. http://www.theguardian.com/business/2013/apr/23/ap-tweet-hack-wall-
street-freefall. Accessed 2013-08-06.
Weber, M. and C. F. Camerer (1998). The disposition effect in securities trading: an
experimental analysis. Journal of Economic Behavior and Organization 33(2), 167–184.
Weinhardt, C., C. Holtmann, and D. Neumann (2003). Market-Engineering.
Wirtschaftsinformatik 45(6), 635–640.
Weinhardt, C., B. W. Weber, T. Hendershott, D. Neumann, and R. A. Schwartz (2006).
Preface to the focus theme section: “Financial Market Engineering”. Electronic Mar-
kets 16(2), 98–100.
182 References
Williams, R. B. and C. A. Clippinger (2002). Aggression, competition, and computer
games: Computer and human opponents. Computers in Human Behavior 18(5), 495–
506.
World Federation of Exchanges (2013). Understanding High Frequency Trading.
White Paper, published 29 May 2013, Paris.
Zhang, S. S. (2013). Need for speed: An empirical analysis of hard and soft informa-
tion in a high frequency world. Working Paper.
Zhang, S. S., M. Adam, and C. Weinhardt (2012). Humans versus agents: Competition
in financial markets of the 21st century. In Proceedings of International Conference on
Information Systems.
Zhang, S. S. and R. Riordan (2011). Technology and Market Quality: The Case of High
Frequency Trading. In Proceedings of the European Conference on Information Systems.
Zhang, S. S., M. Wagener, A. Storkenmaier, and C. Weinhardt (2011). The Quality of
Electronic Markets. In Proceedings of 44th Hawaii International Conference on System
Sciences.