Embed Size (px)
Citation preview
Defence R&D Canada – Atlantic
DEFENCE DÉFENSE&
High Frequency Propagation Loss and
Reverberation in Bedford Basin
B. Vasiliev
A.J. Collier
Technical Memorandum
DRDC Atlantic TM 2007-249
October 2007
Copy No. _____
Defence Research andDevelopment Canada
Recherche et développementpour la défense Canada

This page intentionally left blank.
High Frequency Propagation Loss and Reverberationin Bedford Basin
B. VasilievA. J. CollierDefence R&D Canada – Atlantic
Defence R&D Canada – AtlanticTechnical Memorandum
DRDC Atlantic TM 2007-249
October 2007
Principal Author
B. Vasiliev
Approved by
D. HopkinHead/Signatures
Approved for release by
Dr. J. L. KennedyA/Chair/Document Review Panel
c© Her Majesty the Queen in Right of Canada as represented by the Minister of NationalDefence, 2007
c© Sa Majeste la Reine (en droit du Canada), telle que representee par le ministre de laDefense nationale, 2007
Original signed by B. Vasiliev
Original signed by D. Hopkin
Original signed by J. L. Kennedy
Abstract
This report compares the propagation loss and reverberation measurements collected in theBedford Basin, Halifax, in February and March 2004 with the predictions of the acousticmodels CASS-GRAB and GSM-MULTIP. The agreement between the measurements andmodel outputs is satisfactory if the APL-UW models for surface and bottom characteristicsare used. The propagation loss and reverberation are shown to be affected by the range-dependent bathymetry and bottom composition of the Basin. Reverberation measurementssuggest that in the Basin the surface backscatter saturates at lower wind speeds than pre-dicted by the APL-UW models. Further work is needed to verify this tentative observationand its implication on the density of the wind-generated sub-surface bubble layer.
Resume
Dans ce rapport on compare les mesures de l’affaiblissement de propagation et de lareverberation recueillies dans le bassin de Bedford a Halifax en fevrier et en mars 2004 auxprevisions des modeles acoustiques CASS-GRAB et GSM-MULTIP. La concordance entreles mesures et les sorties des modeles est satisfaisante lorsque les modeles APL-UW descaracteristiques de la surface et du fond sont utilises. On montre que de l’affaiblissement depropagation et la reverberation sont influencees par la bathymetrie dont depend la distanceet par la composition du fond du bassin. Les mesures de la reverberation suggerent que dansle bassin la retrodiffusion par la surface devient saturee a des vitesses du vent inferieurea celles prevues par les modeles APL-UW. D’autres travaux sont necessaires pour verifierces observations provisoires et leur consequence en termes de densite de la couche de bullesengendree sous la surface par l’action du vent.
DRDC Atlantic TM 2007-249 i

This page intentionally left blank.
ii DRDC Atlantic TM 2007-249
Executive summary
High Frequency Propagation Loss and Reverberation in BedfordBasin
B. Vasiliev, A. J. Collier; DRDC Atlantic TM 2007-249; Defence R&D Canada – Atlantic;October 2007.
Background: Modeling propagation loss and reverberation in shallow water environmentsis a challenge due to complicated range-dependent bottom depth and composition as well asrapidly changing surface conditions. Comparison of observations to the model predictionsis further complicated by uncertainties in the bottom and surface reflection and scatteringcharacteristics. Nevertheless, it is important to analyze the factors influencing propagationloss and reverberation in shallow water as they impact trial design and torpedo performanceanalysis. This report compares 20–40 kHz propagation loss and reverberation measurementsin the Bedford Basin, Halifax, to predictions from two acoustic models, CASS-GRAB andGSM-MULTIP, and reviews the impact of wind and range-dependent bottom properties onthe observations. The measurements were collected in February–March, 2004, as a part ofthe HALIFAX class acoustic target strength trial.
Principal Results: CASS-GRAB predictions of the propagation loss reasonably agreewith the measurements. For reverberation, the agreement was also satisfactory if the bot-tom and surface scatterings strengths were increased slightly from the values predictedby the standard APL-UW models. Propagation loss and reverberation were found to besignificantly affected by the range-dependent bathymetry and bottom composition of theBedford Basin. The measured propagation loss and reverberation depended on wind speedas predicted by the APL-UW surface reflection and scattering models, although surfacescattering strength saturated at lower wind speeds than expected. Despite the agreementbetween CASS-GRAB predictions and measurements, use of the predicted CASS-GRABpropagation loss yielded unreasonable estimates of the ship target strength. As a result,the target strength was estimated with the GSM-MULTIP predictions of the propagationlosses.
Significance of Results: Agreement between the predicted and measured propagationloss and reverberation at 20–40 kHz provides insights into the effects of the range-dependentbottom properties and wind speed in shallow water environments. In particular, the reportdocuments these effects for the Bedford Basin that is an important test area for DRDCAtlantic and the Navy. Changes in the trial design suggested in the report will improvequality of the future propagation loss, reverberation, and target strength measurements insupport of torpedo engagement modeling.
Future work: Further analysis requires additional measurements of the propagation lossand reverberation in the Bedford Basin (or other shallow water environments) with moreeffort spent on the sampling of environmental conditions. At this time, no additional workis planned.
DRDC Atlantic TM 2007-249 iii
Sommaire
High Frequency Propagation Loss and Reverberation in BedfordBasin
B. Vasiliev, A. J. Collier; DRDC Atlantic TM 2007-249; R & D pour la defense Canada –Atlantique; octobre 2007.
Contexte: La modelisation de l’affaiblissement de propagation et de la reverberation eneau peu profonde pose un defi en raison de l’influence de la profondeur et de la composi-tion du fond sur la distance ainsi que du changement rapide des conditions de surface. Lacomparaison des observations aux previsions de modeles est davantage compliquee par desincertitudes quant aux caracteristiques de la reflexion et de la diffusion par le fond et lasurface. Il est neanmoins important d’analyser les facteurs influencant l’affaiblissement depropagation et la reverberation en eau peu profonde puisqu’elles ont une incidence sur laconception des essais et l’analyse du rendement des torpilles. Dans ce rapport on compareles mesures de l’affaiblissement de propagation et de la reverberation dans la plage de 20a 40 kHz dans le bassin de Bedford a Halifax aux previsions obtenues avec deux modelesacoustiques, CASS-GRAB et le GSM-MULTIP ; on examine en outre dans les observationsl’incidence du vent et des proprietes du fond en fonction de la distance. Les mesures ontete recueillies dans le cadre des essais sur l’intensite des cibles menes a bord d’un navire dela classe Halifax les 10 et 11 mars 2004.
Resultats: Les previsions de l’affaiblissement de propagation fournies par le CASS-GRABconcordent raisonnablement bien avec les mesures. Dans le cas de la reverberation, la concor-dance est egalement satisfaisante si l’intensite des diffusions par le fond et la surface estlegerement accrue par rapport aux valeurs normalement prevues par les modeles APL-UW.On a constate que l’affaiblissement de propagation et la reverberation subissaient une impor-tante influence de la bathymetrie en fonction de la distance et de la composition du fond dubassin de Bedford. L’affaiblissement de propagation et la reverberation mesures dependentde la vitesse du vent comme le prevoient les modeles APL-UW de la reflexion et de la diffu-sion par la surface, bien que l’intensite de la diffusion par la surface devenait saturee a desvitesses du vent inferieures a celles prevues par les modeles. Malgre la concordance entreles previsions du CASS-GRAB et les mesures, l’utilisation de l’affaiblissement de propaga-tion prevu par le CASS-GRAB fournissait des estimations deraisonnables de l’intensite descibles que constituent les navires. C’est pourquoi l’intensite des cibles etait estimee d’apresles previsions d’affaiblissement de propagation fournies par le GSM-MULTIP.
Portee: La concordance entre les valeurs prevues et mesurees de l’affaiblissement de pro-pagation et de la reverberation dans la plage de 20 a 40 kHz fournissent des apercus deseffets des proprietes du fond en fonction de la distance et de la vitesse du vent en eau peuprofonde. Dans le rapport on documente en particulier ces effets pour le bassin de Bedfordqui est une importante zone d’essais pour RDDC Atlantique et la Marine. Des modificationsde la conception des essais sont suggerees pour permettre d’ameliorer a l’avenir la qualitedes mesures de l’affaiblissement de propagation, de la reverberation et de l’intensite descibles a l’appui de la modelisation des combats sous-marins avec torpilles.
iv DRDC Atlantic TM 2007-249

Recherches futures: D’autres analyses exigent des mesures additionnelles de l’affaiblis-sement de propagation et de la reverberation dans le bassin de Bedford (ou ailleurs en eaupeu profonde) et des efforts supplementaires d’echantillonnage des conditions ambiantes.Aucun autre travail de recherche n’est prevu pour le moment.
DRDC Atlantic TM 2007-249 v

This page intentionally left blank.
vi DRDC Atlantic TM 2007-249

Table of contents
Abstract . . . . . . . . . . . . . . . . . . . . . . . . . . . . . . . . . . . . . . . . . . . i
Resume . . . . . . . . . . . . . . . . . . . . . . . . . . . . . . . . . . . . . . . . . . . i
Executive summary . . . . . . . . . . . . . . . . . . . . . . . . . . . . . . . . . . . . iii
Sommaire . . . . . . . . . . . . . . . . . . . . . . . . . . . . . . . . . . . . . . . . . . iv
Table of contents . . . . . . . . . . . . . . . . . . . . . . . . . . . . . . . . . . . . . . vii
List of figures . . . . . . . . . . . . . . . . . . . . . . . . . . . . . . . . . . . . . . . . ix
List of tables . . . . . . . . . . . . . . . . . . . . . . . . . . . . . . . . . . . . . . . . x
1 Introduction . . . . . . . . . . . . . . . . . . . . . . . . . . . . . . . . . . . . . . . 1
2 Environment . . . . . . . . . . . . . . . . . . . . . . . . . . . . . . . . . . . . . . 1
2.1 Sound Velocity & Salinity Profiles . . . . . . . . . . . . . . . . . . . . . . . 2
2.2 Volume Attenuation Model . . . . . . . . . . . . . . . . . . . . . . . . . . . 3
2.3 Bottom Properties . . . . . . . . . . . . . . . . . . . . . . . . . . . . . . . . 4
2.4 Surface Properties . . . . . . . . . . . . . . . . . . . . . . . . . . . . . . . . 7
3 Propagation Loss . . . . . . . . . . . . . . . . . . . . . . . . . . . . . . . . . . . . 9
3.1 Measurements . . . . . . . . . . . . . . . . . . . . . . . . . . . . . . . . . . 10
3.2 CASS-GRAB . . . . . . . . . . . . . . . . . . . . . . . . . . . . . . . . . . 11
3.3 GSM-MULTIP . . . . . . . . . . . . . . . . . . . . . . . . . . . . . . . . . . 14
3.4 Bearing Dependence . . . . . . . . . . . . . . . . . . . . . . . . . . . . . . 14
3.5 Beam Pattern Dependence . . . . . . . . . . . . . . . . . . . . . . . . . . . 18
4 Reverberation . . . . . . . . . . . . . . . . . . . . . . . . . . . . . . . . . . . . . . 19
4.1 Seahorse Sonar . . . . . . . . . . . . . . . . . . . . . . . . . . . . . . . . . 19
4.2 Wind Speed Dependence . . . . . . . . . . . . . . . . . . . . . . . . . . . . 21
4.3 Bearing Dependence . . . . . . . . . . . . . . . . . . . . . . . . . . . . . . 24
4.3.1 Bearing 090◦: Reverberation Over a Smooth Sloping Bottom . . . 25
DRDC Atlantic TM 2007-249 vii
4.3.2 Bearing 030◦: Reverberation Over Jonquiere Bank . . . . . . . . . 27
4.3.3 Bearing 115◦: Reverberation Along Gravel Ridge . . . . . . . . . . 30
5 Summary . . . . . . . . . . . . . . . . . . . . . . . . . . . . . . . . . . . . . . . . 32
References . . . . . . . . . . . . . . . . . . . . . . . . . . . . . . . . . . . . . . . . . . 34
Annex A: Basic Definitions . . . . . . . . . . . . . . . . . . . . . . . . . . . . . . . . 37
A.1 Propagation Loss . . . . . . . . . . . . . . . . . . . . . . . . . . . . 37
A.2 Reverberation . . . . . . . . . . . . . . . . . . . . . . . . . . . . . . 38
viii DRDC Atlantic TM 2007-249
List of figures
Figure 1: Sound velocity profiles on February 25, March 10–11, 2004 . . . . . . . . 3
Figure 2: Bedford Basin bathymetry and bottom composition . . . . . . . . . . . 5
Figure 3: APL-UW bottom reflection loss and scattering strength models . . . . . 6
Figure 4: Wind speed for February 25 and March 10–11, 2004 . . . . . . . . . . . 8
Figure 5: APL-UW surface reflection loss and scattering strength models . . . . . 8
Figure 6: Bathymetry along bearing 075◦ . . . . . . . . . . . . . . . . . . . . . . . 10
Figure 7: Propagation loss on bearing 075◦: measurements and predictions . . . . 12
Figure 8: Ray trace for bearing 075◦ . . . . . . . . . . . . . . . . . . . . . . . . . . 12
Figure 9: Propagation loss predictions on bearings 030◦, 090◦, 120◦ . . . . . . . . 15
Figure 10: Significant rays for bearings 030◦, 090◦ and 120◦ in high winds . . . . . 16
Figure 11: Significant rays for bearings 030◦, 090◦ and 120◦ in low winds . . . . . . 17
Figure 12: Seahorse sonar receive and transmit beams . . . . . . . . . . . . . . . . 20
Figure 13: Reverberation on bearing 075◦: wind dependence . . . . . . . . . . . . . 22
Figure 14: Significant rays on bearing 075◦ . . . . . . . . . . . . . . . . . . . . . . . 22
Figure 15: Reverberation on bearings 030◦, 090◦ and 115◦ . . . . . . . . . . . . . . 24
Figure 16: Bathymetry along bearing 090◦ . . . . . . . . . . . . . . . . . . . . . . . 26
Figure 17: Reverberation on bearing 090◦ . . . . . . . . . . . . . . . . . . . . . . . 26
Figure 18: Bathymetry along bearing 030◦ . . . . . . . . . . . . . . . . . . . . . . . 28
Figure 19: Reverberation along bearing 030◦ . . . . . . . . . . . . . . . . . . . . . . 28
Figure 20: Bathymetry along bearing 115◦ . . . . . . . . . . . . . . . . . . . . . . . 31
Figure 21: Reverberation along bearing 115◦ . . . . . . . . . . . . . . . . . . . . . . 31
DRDC Atlantic TM 2007-249 ix

List of tables
Table 1: Thorpe and Francoise Garrison volume attenuation models. . . . . . . . 4
x DRDC Atlantic TM 2007-249
1 Introduction
In March 2004, DRDC Atlantic and N02OR (MARLANT HQ) conducted measurements ofthe HMCS CHARLOTTETOWN’s acoustic target strength at frequencies between 20 and40 kHz in the Bedford Basin, Halifax. As part of the trial, DRDC Atlantic performed twopropagation loss experiments that were intended to quantify the propagation conditions dur-ing the trial. Furthermore, the target strength trial yielded extensive data on reverberationin the Basin. This report presents the propagation loss and reverberation measurements at20–40 kHz, compares the measurements with predictions of two underwater acoustic pre-diction models, GSM-MULTIP and CASS-GRAB, and reconciles the measurements withthe accepted models of bottom and surface acoustic properties.
The acoustic target strength and propagation loss trials were scheduled for late February andearly March (February 25 and March 10–11) when the sound velocity profile was expected tobe upward refracting and the propagation conditions in the Basin most favorable. However,the shallow and fetch-limited Bedford Basin was found to be a difficult environment forpropagation loss and reverberation modeling.
In addition to the sound speed profile, propagation loss and reverberation are determinedby the reflection and scattering characteristics of the sea surface and bottom. At thefrequencies of interest, these characteristics were studied extensively in 1980-90’s and semi-empirical models were developed, [1]. Nevertheless, the expected errors in the models canbe large, and in most cases model predictions have to be adjusted to ensure satisfactoryagreement between the measurements and output of underwater acoustic prediction models.An earlier attempt to describe the propagation conditions in the Bedford Basin was madein May 2004, [2]; unfortunately, the limited scope of measurements precluded the authorsfrom producing an accurate evaluation of the Basin’s underwater acoustic environment.This report remedies this deficiency.
Section 2 reviews the environment at the time of the experiments and discusses the avail-able high-frequency models for surface and bottom acoustic properties together with theirapplicability to the Bedford Basin. Section 3 presents the propagation loss measurementsand compares the data to GSM-MULTIP and CASS-GRAB predictions. Section 4 reviewsthe reverberation measurements, compares data to CASS-GRAB predictions and estimatessurface and bottom scattering properties. Section 5 summarizes the report’s findings andproposes improvements that would allow more accurate characterization of the propagationconditions in the Bedford Basin or other shallow water environments. Finally, Annex Apresents definitions of propagation loss and reverberation and reviews their dependence onthe environmental and sonar parameters.
2 Environment
The acoustic target strength trial on March 10–11, 2004, was conducted in the BedfordBasin near the DRDC Atlantic Acoustic Calibration Barge. As part of the trial, two
DRDC Atlantic TM 2007-249 1
propagation loss measurements were performed on February 25 and March 10. This sectionprovides an overview of the environmental conditions observed in the trials. Section 2.1presents measurements of the sound-velocity and temperature profiles together with theestimates of water salinity. Section 2.2 reviews common models for the volume attenuationcoefficient while Section 2.3 and Section 2.4 discuss models of the surface and bottomacoustic properties.
2.1 Sound Velocity & Salinity Profiles
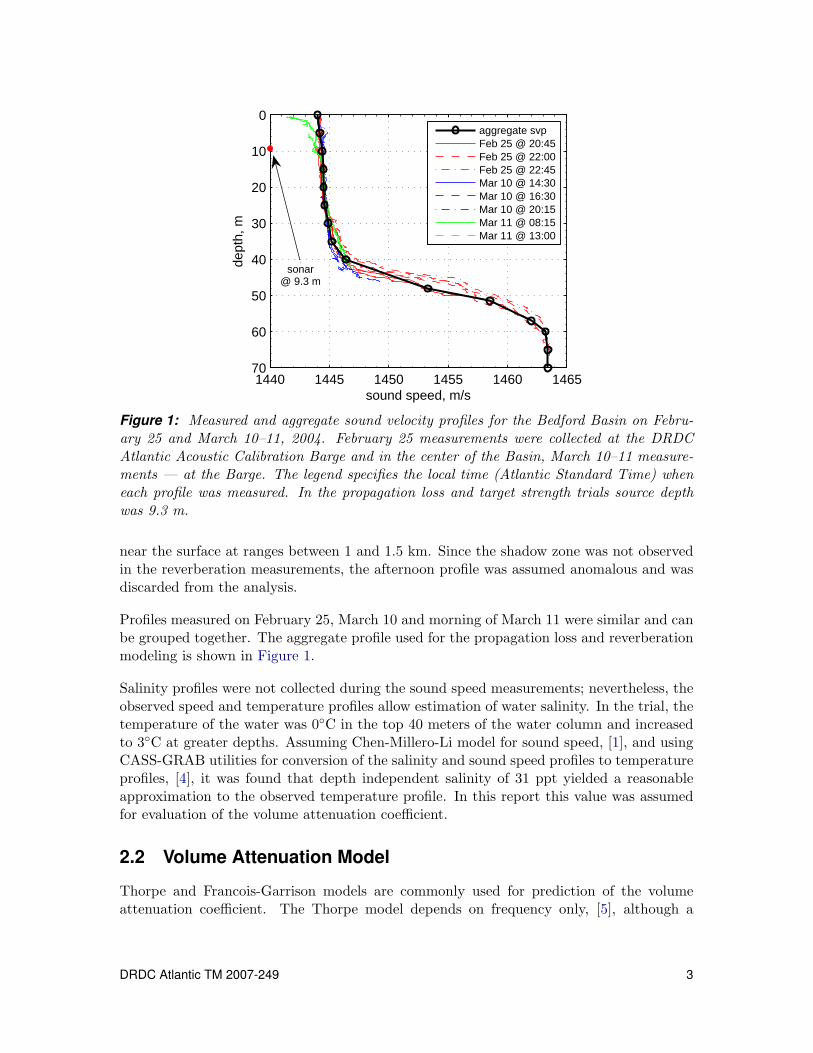
Sound velocity profiles measured during the trials on February 25 and March 10–11 areshown in Figure 1. The profiles on February 25 were taken at the DRDC Atlantic AcousticCalibration Barge and in the middle of the Bedford Basin. The profiles on March 10–11were collected only at the Barge. Depth resolution of all profiles was less than 0.2 m.
All sound speed profiles were examined for consistency and, if necessary, corrected. Inparticular, in several profiles, the sound speed near surface contained jumps of more than1 m/s between two consecutive samples. These jumps were considered unrealistic andthe offending segments were discarded from the profiles. In the corrected profiles twoconsecutive samples of sound speed differ by no more than 0.25 m/s. Figure 1 presents thecorrected profiles only.
The profiles collected at the center of the Basin (on February 25) extended to 65 m depthwhile profiles measured at the Barge (on February 25 and March 10–11) extended to 45 monly. Similarity of the profiles in the upper section of the water column suggests that theshallow March profiles would have followed the deeper February profiles if the measure-ments had been taken in the center of the Basin. In the following analysis, February 25measurements were used to extend March measurements to depths below 45 m.
On February 25 and March 10 the sound speed was measured in the afternoon and evening.All profiles showed a nearly iso-velocity layer in the top 30 m of the water column. Belowthe layer, the sound speed increased rapidly until 60 m depth; sound velocity was constantbetween 60 and 70 m. The large positive sound speed gradient resulted in upward refractionof rays launched toward the bottom. Ray traces for the February 25/March 10 profileshowed a near surface target to be well illuminated at ranges less than 2 km from a shallow(9.3 m deep) source.
The profiles on March 11 were collected in early morning and afternoon. They indicatedpresence of a strong positive gradient immediately below the sea surface. In the morningmeasurements the gradient can be attributed to a decrease in water salinity due to melting ofthe ice that formed around the Barge over night. Persistence of the gradient in the afternoonprofile cannot be easily explained. Figure 4 shows that the wind increased throughout theday and the gradient should have disappeared through mixing of the fresh water nearsurface and sea water below the surface. Since the near surface air temperature remainedapproximately the same for all sound speed measurements (−4–0◦C, [3]), the decrease inthe sound speed near the surface was not due to a lower sea surface temperature. Raytraces with the March 11 profile for a shallow (9.3 m deep) sonar showed a shadow zone
2 DRDC Atlantic TM 2007-249
1440 1445 1450 1455 1460 1465
0
10
20
30
40
50
60
70
sound speed, m/s
dept
h, m
aggregate svpFeb 25 @ 20:45Feb 25 @ 22:00Feb 25 @ 22:45Mar 10 @ 14:30Mar 10 @ 16:30Mar 10 @ 20:15Mar 11 @ 08:15Mar 11 @ 13:00
sonar@ 9.3 m
Figure 1: Measured and aggregate sound velocity profiles for the Bedford Basin on Febru-ary 25 and March 10–11, 2004. February 25 measurements were collected at the DRDCAtlantic Acoustic Calibration Barge and in the center of the Basin, March 10–11 measure-ments — at the Barge. The legend specifies the local time (Atlantic Standard Time) wheneach profile was measured. In the propagation loss and target strength trials source depthwas 9.3 m.
near the surface at ranges between 1 and 1.5 km. Since the shadow zone was not observedin the reverberation measurements, the afternoon profile was assumed anomalous and wasdiscarded from the analysis.
Profiles measured on February 25, March 10 and morning of March 11 were similar and canbe grouped together. The aggregate profile used for the propagation loss and reverberationmodeling is shown in Figure 1.
Salinity profiles were not collected during the sound speed measurements; nevertheless, theobserved speed and temperature profiles allow estimation of water salinity. In the trial, thetemperature of the water was 0◦C in the top 40 meters of the water column and increasedto 3◦C at greater depths. Assuming Chen-Millero-Li model for sound speed, [1], and usingCASS-GRAB utilities for conversion of the salinity and sound speed profiles to temperatureprofiles, [4], it was found that depth independent salinity of 31 ppt yielded a reasonableapproximation to the observed temperature profile. In this report this value was assumedfor evaluation of the volume attenuation coefficient.
2.2 Volume Attenuation Model
Thorpe and Francois-Garrison models are commonly used for prediction of the volumeattenuation coefficient. The Thorpe model depends on frequency only, [5], although a
DRDC Atlantic TM 2007-249 3
correction term (Lovett coefficient) has been added to the model to account for pH (orwater acidity) dependence of the volume attenuation coefficient, [6]. The Francois-Garrisonmodel is a more complex model that includes dependence on frequency and depth togetherwith water salinity, temperature and pH, [1].
Table 1 compares the volume attenuation predicted by two models for several frequenciesat 0 and 70 m depths. The Thorpe model attenuation coefficients were computed forLovett coefficient 0.1 dB/kyd (the original Thorpe model) while the input parameters tothe Francois-Garrison model were 0◦C for water temperature, 31 ppt for water salinity, and8 for water pH. The pH value is a typical value for the near surface ocean water, [1].
Table 1: Comparison of the Thorpe and Francois-Garrison models for volume attenuationcoefficients at 20, 30 and 40 kHz. Volume attenuation coefficient unit is dB/km.
Frequency(kHz) Thorpe Fran.-Gar.
0 m 70 m20 -4.00 -3.83 -3.8030 -7.98 -7.03 -6.9740 -12.39 -10.06 -9.96
At 20 kHz, the models predict the same volume attenuation coefficients; however, at higherfrequencies they diverge and the difference in the predicted volume attenuation coefficientsis significant — 2.5 dB at 40 kHz. Comparison of the measured and modeled propagationloss shows that the smaller attenuation predicted by Francois-Garrison model yields bet-ter agreement with the measurements. Consequently, Francois-Garrison model for volumeattenuation was adopted for propagation loss and reverberation modeling in this report.
2.3 Bottom Properties
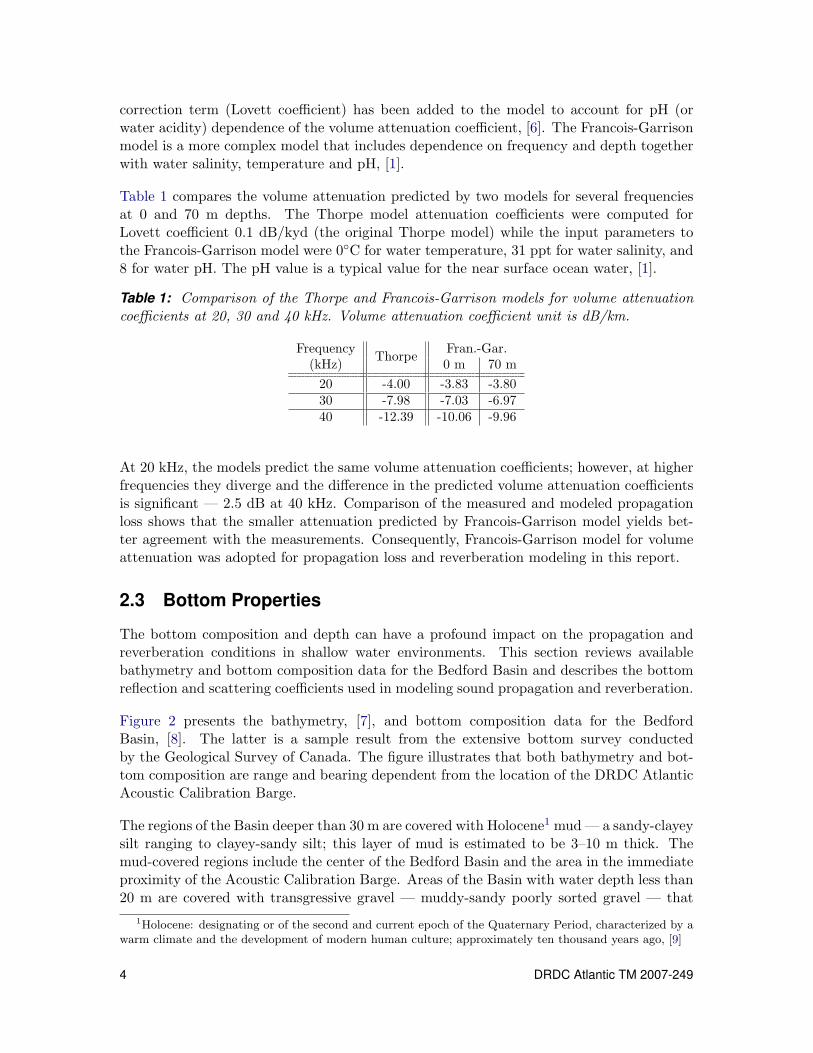
The bottom composition and depth can have a profound impact on the propagation andreverberation conditions in shallow water environments. This section reviews availablebathymetry and bottom composition data for the Bedford Basin and describes the bottomreflection and scattering coefficients used in modeling sound propagation and reverberation.
Figure 2 presents the bathymetry, [7], and bottom composition data for the BedfordBasin, [8]. The latter is a sample result from the extensive bottom survey conductedby the Geological Survey of Canada. The figure illustrates that both bathymetry and bot-tom composition are range and bearing dependent from the location of the DRDC AtlanticAcoustic Calibration Barge.
The regions of the Basin deeper than 30 m are covered with Holocene1 mud — a sandy-clayeysilt ranging to clayey-sandy silt; this layer of mud is estimated to be 3–10 m thick. Themud-covered regions include the center of the Bedford Basin and the area in the immediateproximity of the Acoustic Calibration Barge. Areas of the Basin with water depth less than20 m are covered with transgressive gravel — muddy-sandy poorly sorted gravel — that
1Holocene: designating or of the second and current epoch of the Quaternary Period, characterized by awarm climate and the development of modern human culture; approximately ten thousand years ago, [9]
4 DRDC Atlantic TM 2007-249
0 0.5 1 1.5 2−1
−0.5
0
0.5
1
1.5
2
east, km
nort
h, k
m
030°
075°
090°
115°
120°
depth, m
0 10 20 30 40 50 60 70
Nbedrock
mud
gravel
JonquiereBank
FairviewCove
030◦
090◦
075◦
115◦
120◦
0 1km
Figure 2: Bedford Basin bathymetry, [7] and bottom composition maps, [8]. Bathymetrydata is referenced to the location of the DRDC Atlantic Acoustic Calibration Barge. Bargeposition and location of the bathymetry data are shown on the bottom composition map.Shading patterns on the map denote different bottom types. Bearings used in propagationloss and reverberation modeling are shown on both maps.
overlays bedrock and till2. The shallow regions are found around the edges of the BedfordBasin with the notable exceptions of the Jonquiere Bank bank and the ridge separatingBedford Basin from Fairview Cove.
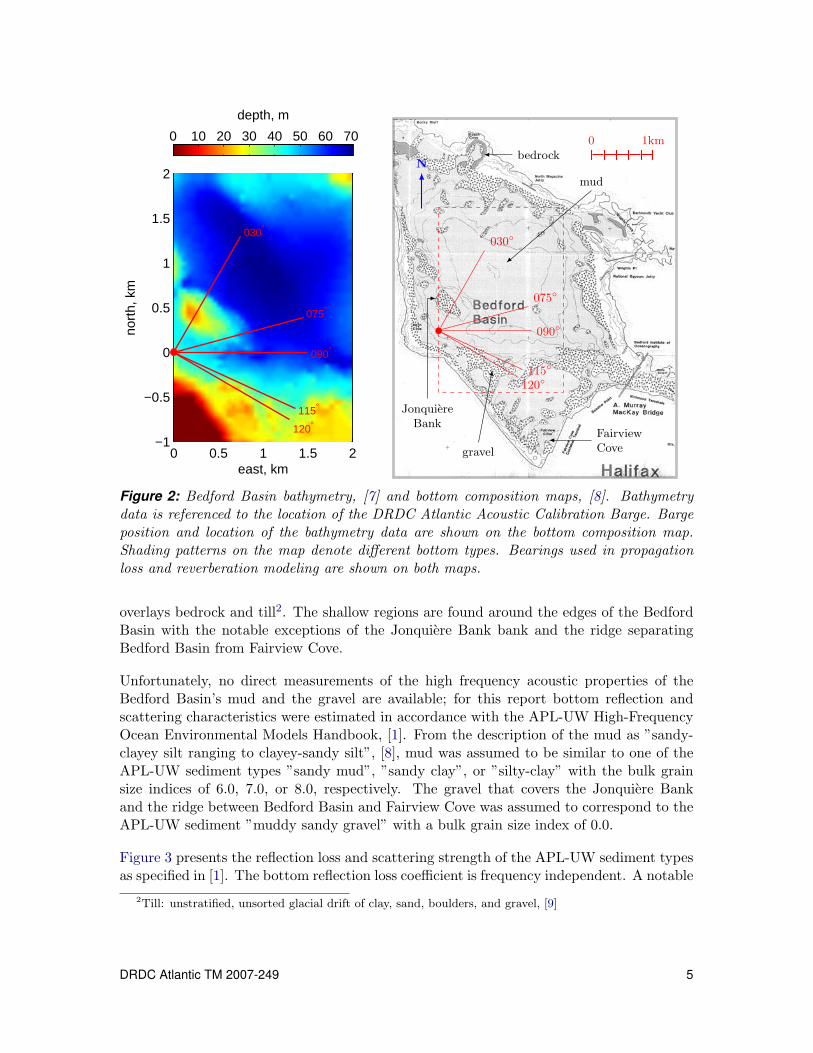
Unfortunately, no direct measurements of the high frequency acoustic properties of theBedford Basin’s mud and the gravel are available; for this report bottom reflection andscattering characteristics were estimated in accordance with the APL-UW High-FrequencyOcean Environmental Models Handbook, [1]. From the description of the mud as ”sandy-clayey silt ranging to clayey-sandy silt”, [8], mud was assumed to be similar to one of theAPL-UW sediment types ”sandy mud”, ”sandy clay”, or ”silty-clay” with the bulk grainsize indices of 6.0, 7.0, or 8.0, respectively. The gravel that covers the Jonquiere Bankand the ridge between Bedford Basin and Fairview Cove was assumed to correspond to theAPL-UW sediment ”muddy sandy gravel” with a bulk grain size index of 0.0.
Figure 3 presents the reflection loss and scattering strength of the APL-UW sediment typesas specified in [1]. The bottom reflection loss coefficient is frequency independent. A notable
2Till: unstratified, unsorted glacial drift of clay, sand, boulders, and gravel, [9]
DRDC Atlantic TM 2007-249 5
0 10 20 30 400
10
20
30
40
50
bottom grazing angle, deg
botto
m lo
ss, d
B/r
efle
ctio
n
0 5 10 15 20−60
−50
−40
−30
−20
bottom grazing angle, deg
botto
m s
catte
ring
stre
ngth
, dB
re
m2
gravelsandy mudsandy claysilty clay
Figure 3: APL-UW bottom reflection and scattering coefficients, [1]. Bottom reflectioncoefficient is independent of frequency. Bottom scattering strength depends weakly onfrequency between 20 and 40 kHz; scattering strength for 30 kHz is shown.
feature of the reflection loss model is that the reflection loss approaches zero as the grazingangle tends to zero. Such behavior is considered optimistic because it neglects losses dueto scattering from the bottom roughness. Following the recommendations of the reference,the minimum reflection loss was fixed at 1.5 dB/reflection for the propagation loss andreverberation modeling as shown in the figure. The uncertainty in the predicted bottomreflection loss is equal to the predicted values.
For soft bottom (clay and mud) the scattering strength is nearly frequency independent with1 dB variation between 20 and 40 kHz. For hard bottom (gravel) the scattering strengthat 20 kHz exceeds that at 40 kHz by 2–4 dB; however, the difference is probably negligibledue to large uncertainty in the predicted values. The uncertainty in the predicted bottomscattering strength is ±10 dB or more for gravel and ±5−10 dB for mud and clay.
Since the differences in the reflection and scattering properties of mud and gravel are large,propagation loss and reverberation modeling should consider the variation of the bottomproperties with range and bearing. In particular, the propagation directions from theAcoustic Calibration Barge to the center of the Bedford Basin can be divided into threegroups nominally centered on bearings 030◦, 090◦, and 120◦; within each group the prop-agation conditions are similar. Representative depth profiles and bottom composition foreach center bearing are shown in Figures 18, 16, and 20 respectively (pages 26–31.)
The first group is along the bearings 020–050◦ where the shallow Jonquiere Bank impedespropagation of sound from the Barge to the center of the Basin. Mud covers the bottombefore and after the Bank, while the Bank’s slopes are gravel. On these bearings, bottomdepth increases with range from the barge with the exception of the Jonquiere Bank. The
6 DRDC Atlantic TM 2007-249
second group is formed by bearings 050–115◦. Along these bearings the bottom is coveredwith mud and depth increases away from the Barge. The remaining group lies betweenbearings 115◦ and 130◦. In this group, the bottom is flat and covered with mud at rangesless than 0.5 km from the barge. At longer ranges, bottom depth decreases and bottomcomposition changes to gravel. These bearing groups were used for an evaluation of thebearing dependence of the propagation loss and reverberation in the Bedford Basin aspresented in Sections 3 and 4.
2.4 Surface Properties
The sound speed profile described in Section 2.1 refracts sound towards the surface whichmakes the surface reflection and scattering characteristics important for modeling the acous-tic environment. This section describes the sea-surface conditions during the propagationloss and reverberation experiments and reviews briefly models for the surface reflection andscattering coefficients.
At frequencies between 10 kHz and 80 kHz and grazing angles between 0◦ and 30◦, thesurface reflection and scattering are dominated by forward and back-scatter from the sub-surface air-bubble layer formed by breaking waves, [1, 10]. The references suggest thatthe wind speed threshold for the appearance of the sub-surface bubbles is 3–6 m/s. Thedensity of the bubbles in the layer is a function of depth, bubble radii and wind speed andit is known to be greater in proximity to shore than in open ocean, [10]. In low winds,the concentration of the sub-surface bubbles is low and the sea-surface is a perfect reflectorwith negligible forward-reflection loss and low back-scattering strength. In higher winds,the bubble layer is more prominent and forward-reflection loss and back-scattering strengthincrease with bubble concentration.
Although sub-surface bubble density determines the reflection and scattering properties atshallow grazing angles, bubble density measurements require specialized experiments andare not feasible in most trials. For general applications, the APL-UW High Frequency OceanEnvironmental Acoustic Models Handbook, [1], compiles data from several experimentsand characterizes surface properties as a function of wind speed only. For this report thesemodels were used to model the surface reflection and scattering characteristics.
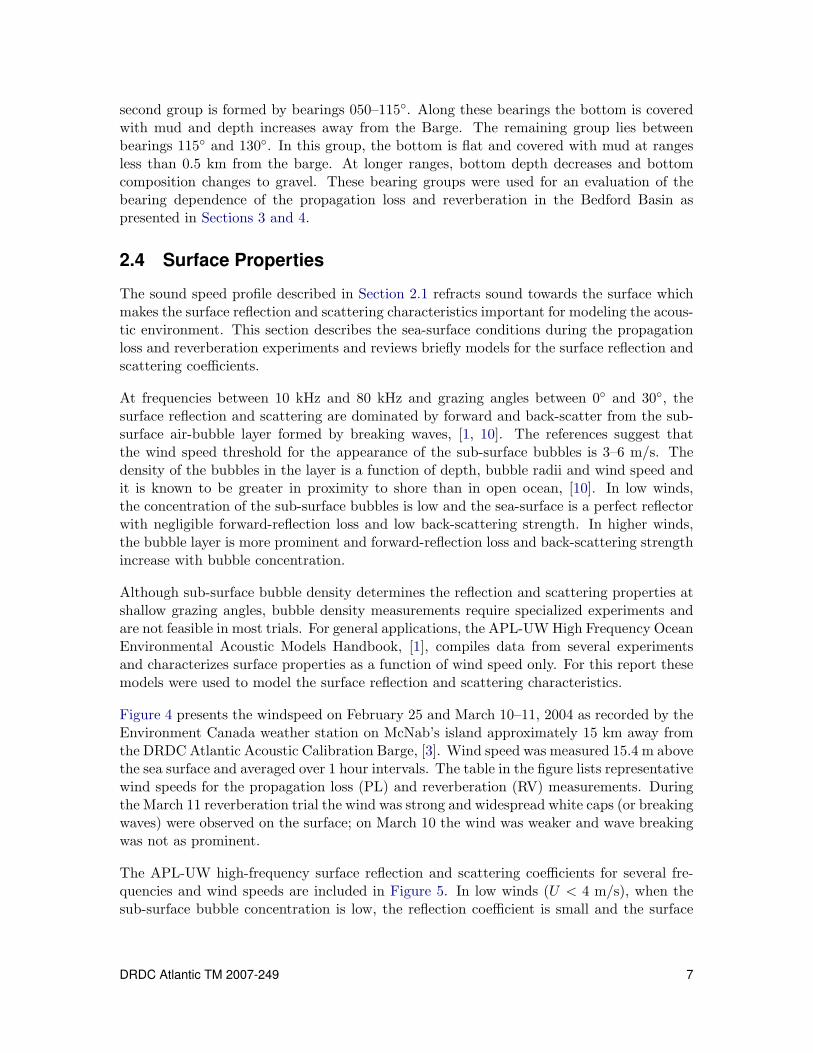
Figure 4 presents the windspeed on February 25 and March 10–11, 2004 as recorded by theEnvironment Canada weather station on McNab’s island approximately 15 km away fromthe DRDC Atlantic Acoustic Calibration Barge, [3]. Wind speed was measured 15.4 m abovethe sea surface and averaged over 1 hour intervals. The table in the figure lists representativewind speeds for the propagation loss (PL) and reverberation (RV) measurements. Duringthe March 11 reverberation trial the wind was strong and widespread white caps (or breakingwaves) were observed on the surface; on March 10 the wind was weaker and wave breakingwas not as prominent.
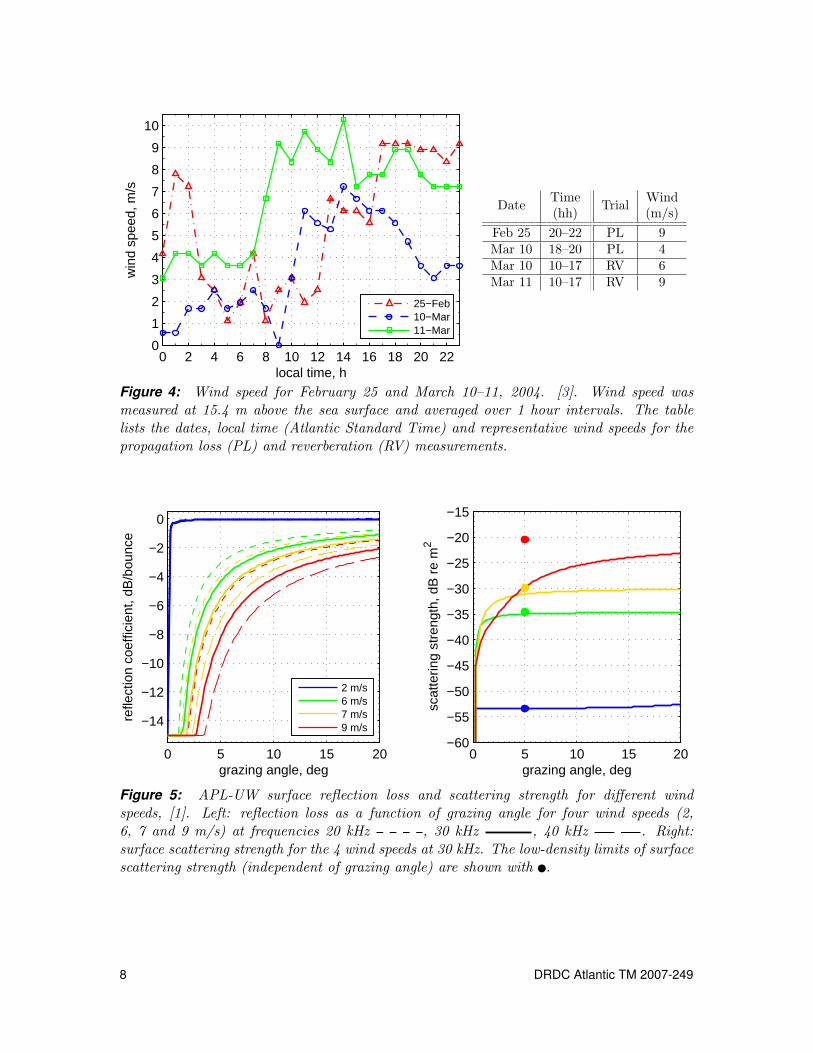
The APL-UW high-frequency surface reflection and scattering coefficients for several fre-quencies and wind speeds are included in Figure 5. In low winds (U < 4 m/s), when thesub-surface bubble concentration is low, the reflection coefficient is small and the surface
DRDC Atlantic TM 2007-249 7
0 2 4 6 8 10 12 14 16 18 20 220
1
2
3
4
5
6
7
8
9
10
local time, h
win
d sp
eed,
m/s
25−Feb10−Mar11−Mar
Date Time Trial Wind(hh) (m/s)
Feb 25 20–22 PL 9Mar 10 18–20 PL 4Mar 10 10–17 RV 6Mar 11 10–17 RV 9
Figure 4: Wind speed for February 25 and March 10–11, 2004. [3]. Wind speed wasmeasured at 15.4 m above the sea surface and averaged over 1 hour intervals. The tablelists the dates, local time (Atlantic Standard Time) and representative wind speeds for thepropagation loss (PL) and reverberation (RV) measurements.
0 5 10 15 20
−14
−12
−10
−8
−6
−4
−2
0
grazing angle, deg
refle
ctio
n co
effic
ient
, dB
/bou
nce
2 m/s6 m/s7 m/s9 m/s
0 5 10 15 20−60
−55
−50
−45
−40
−35
−30
−25
−20
−15
grazing angle, deg
scat
terin
g st
reng
th, d
B r
e m
2
Figure 5: APL-UW surface reflection loss and scattering strength for different windspeeds, [1]. Left: reflection loss as a function of grazing angle for four wind speeds (2,6, 7 and 9 m/s) at frequencies 20 kHz , 30 kHz , 40 kHz . Right:surface scattering strength for the 4 wind speeds at 30 kHz. The low-density limits of surfacescattering strength (independent of grazing angle) are shown with .
8 DRDC Atlantic TM 2007-249
is an almost perfect reflector. As the bubble concentration increases with increasing wind,(U > 6 m/s), the model predicts high reflection losses with significant frequency depen-dence. For the sound velocity profile in Figure 1, the surface-reflected rays are incident onthe surface at angles between 1–6◦. At these angles, the surface reflection loss is negligiblein low winds and 3–10 dB/reflection in winds above 6 m/s. In the latter case, the bub-ble layer diminishes the surface-reflected rays especially at high frequencies. The expectederrors in the reflection loss are ±4 dB.
Unlike the surface reflection coefficient, the surface scattering strength is nearly frequencyindependent between 20 and 40 kHz. Figure 5 shows that the scattering strength increaseswith wind speed in a peculiar fashion. For winds less than 8 m/s, scattering strength isindependent of the grazing angle for angles between 1◦ and 20◦ but increases quickly withwind speed. In contrast, for strong winds, the scattering strength’s dependence on thegrazing angle is greater and, at small angles, the scattering strength can be smaller than inlower winds. In addition, for winds greater than 9 m/s, surface scattering strength saturatesand does not increase with wind speed. For winds less than 8 m/s, the errors in the modelare ±5 dB while for higher winds the errors are ±4 dB.
High scattering strength, saturation with wind speed, and independence of the grazing angleare characteristic features of the scattering from the sub-surface bubble layer at low grazingangles, [10]. As will be shown in Section 4 our reverberation measurements in the BedfordBasin are consistent with these properties of scattering from the bubble layer. Anotherpeculiar feature of the APL-UW surface scattering model is the low bubble density limitshown in Figure 5 with solid circles. In the limit, the scattering strength is predicted to beindependent of the grazing angle for all wind speeds. The references, [1, 10], do not indicateconditions under which the low bubble concentration occurs; however, the approximationmaybe appropriate for the fetch-limited Bedford Basin where wind threshold for appearanceof breaking wave is lower, [10], and the bubble layer is not as deep as in the open ocean.
3 Propagation Loss
The propagation loss experiments in support of the HALIFAX class acoustic target strengthtrial, were conducted in the Bedford Basin on February 25, between 20:00 and 22:00 AST,and on March 10 between 18:00 and 20:00 AST. The previous section presented the environ-mental conditions during the experiments and the high-frequency boundary reflection mod-els. In the following sections the outputs from the underwater acoustic prediction modelsare compared to the experimental data. After a review of the propagation loss observationsin Section 3.1, the measurements are compared to the CASS-GRAB and GSM-MULTIPpredictions in Sections 3.2 and 3.3. The expected dependence of the propagation loss onbearing and sonar vertical beam patterns is discussed in Sections 3.4 and 3.5.
DRDC Atlantic TM 2007-249 9
3.1 Measurements
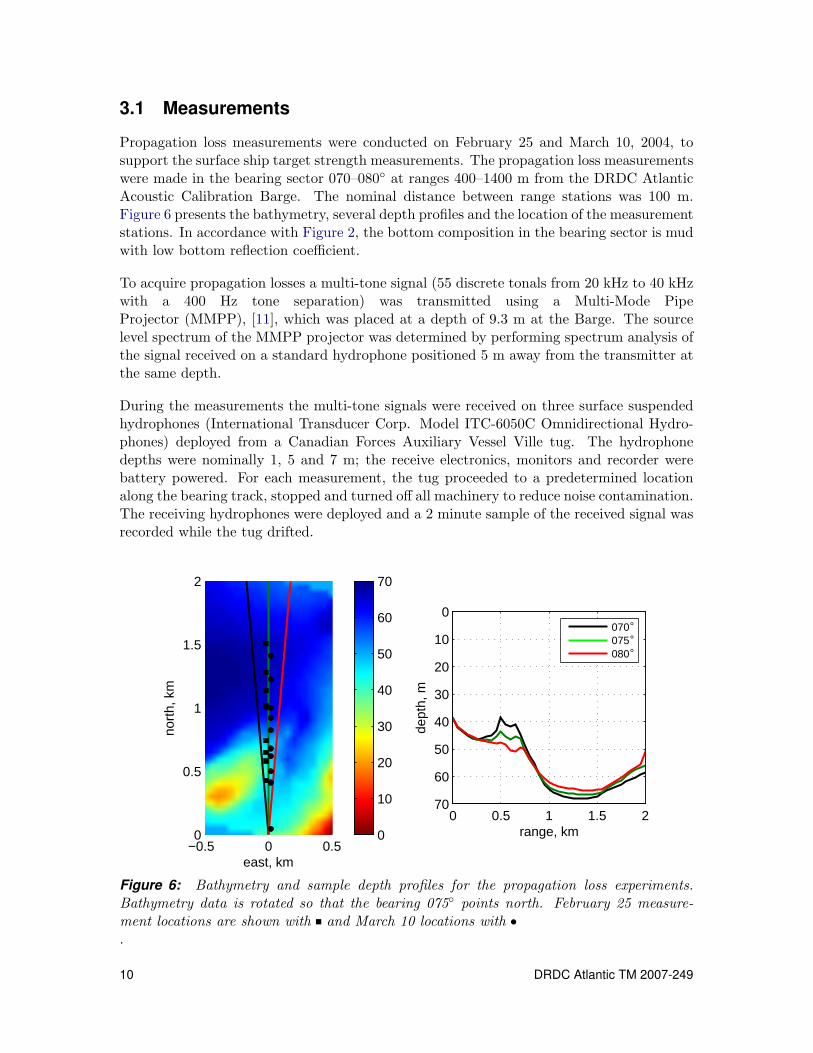
Propagation loss measurements were conducted on February 25 and March 10, 2004, tosupport the surface ship target strength measurements. The propagation loss measurementswere made in the bearing sector 070–080◦ at ranges 400–1400 m from the DRDC AtlanticAcoustic Calibration Barge. The nominal distance between range stations was 100 m.Figure 6 presents the bathymetry, several depth profiles and the location of the measurementstations. In accordance with Figure 2, the bottom composition in the bearing sector is mudwith low bottom reflection coefficient.
To acquire propagation losses a multi-tone signal (55 discrete tonals from 20 kHz to 40 kHzwith a 400 Hz tone separation) was transmitted using a Multi-Mode PipeProjector (MMPP), [11], which was placed at a depth of 9.3 m at the Barge. The sourcelevel spectrum of the MMPP projector was determined by performing spectrum analysis ofthe signal received on a standard hydrophone positioned 5 m away from the transmitter atthe same depth.
During the measurements the multi-tone signals were received on three surface suspendedhydrophones (International Transducer Corp. Model ITC-6050C Omnidirectional Hydro-phones) deployed from a Canadian Forces Auxiliary Vessel Ville tug. The hydrophonedepths were nominally 1, 5 and 7 m; the receive electronics, monitors and recorder werebattery powered. For each measurement, the tug proceeded to a predetermined locationalong the bearing track, stopped and turned off all machinery to reduce noise contamination.The receiving hydrophones were deployed and a 2 minute sample of the received signal wasrecorded while the tug drifted.
−0.5 0 0.50
0.5
1
1.5
2
east, km
nort
h, k
m
0
10
20
30
40
50
60
70
0 0.5 1 1.5 2
0
10
20
30
40
50
60
70
range, km
dept
h, m
070°075°080°
Figure 6: Bathymetry and sample depth profiles for the propagation loss experiments.Bathymetry data is rotated so that the bearing 075◦ points north. February 25 measure-ment locations are shown with and March 10 locations with.
10 DRDC Atlantic TM 2007-249
The recorded signals were digitized and their spectrum determined with the DRDC spectralanalysis software PRODAT, [12]. The received level for each of the 55 tonals was computedby applying the receiver sensitivities at each tonal frequency. The tonal powers were aver-aged over 2 kHz intervals to reduce the multi-path interference effects. Propagation lossescorresponding to each of the 2 kHz average received powers were calculated using the av-erage source levels over the 2 kHz intervals. It was assessed that between the drift of thehydrophones over the analysis intervals and the averaging received power over 6 discretefrequency tones (2 kHz) the resultant transmission losses were representative of incoherentpropagation. The measured propagation losses for the deep and middle depth hydrophonesare shown in Figure 7; the measured losses for the shallow hydrophone exhibited largevariability and were omitted from the analysis.
The measurements do not indicate dependence on the receiver depth. However, despite thespread in the experimental data, the propagation losses on February 25 appear higher thanon March 10. Since underwater parameters (sound speed profiles, bottom profiles) werevirtually the same for both dates, the difference was probably caused by the changes in thesea surface conditions. Indeed, the wind speed was a likely cause of the difference as duringthe February 25 measurements the average wind speed was 9 m/s while on March 10 it was4 m/s.
Figure 8 is a ray trace for the 075◦ bearing. Only one bottom-bounce and non-bottominteracting rays are shown; bottom interacting rays are terminated on the second bottomcontact. It is clear that one bottom-bounce rays contact the bottom at ranges less than500 m and the bottom grazing angle for these rays is between 8◦ and 10◦. The correspondingbottom reflection loss is 15–20 dB (see Figure 3) and thus the bottom reflected rays aredominated by the direct and surface reflected arrivals. The direct arrivals are unaffectedby the surface conditions. In contrast, the intensity of the surface reflected rays diminishesin strong winds since the surface reflection loss increases with wind speed. As a result, thepropagation loss is expected to increase with wind speed. These observations are supportedby CASS-GRAB modeling discussed in the next section.
3.2 CASS-GRAB
The CASS-GRAB predictions were computed on bearing 075◦ from the barge for windspeeds 2–4 and 6–9 m/s in 1 m/s increments and receiver depths 3, 5, and 7 m. In com-putations, the surface reflection model was APL-UW and volume attenuation model —Francois-Garrison; both models are described in Section 2. The parameters of the volumeattenuation model were 8 for water pH, 31 ppt for water salinity, and 0◦C for water temper-ature. In accordance with Figure 2, the bottom along the bearing is mud and bottom losswas assumed range independent. Since the measurements do not present a clear dependenceon the receiver depth, the modeled propagation loss was averaged over the receiver depths3, 5, and 7 m.
Figure 7 compares CASS-GRAB propagation loss with the measurements for wind speeds2–4 and 6–9 m/s. As Figure 5 shows, for wind speeds between 2 and 4 m/s, the surface
DRDC Atlantic TM 2007-249 11
0 0.25 0.5 0.75 1 1.25 1.5 1.75 2−80
−70
−60
−50
F = 22 kHz
range, km
−80
−70
−60
−50
F = 30 kHz
−80
−70
−60
−50
F = 38 kHz
tran
smis
sion
loss
, dB
deep Hp, Feb 25mid Hp, Feb 25deep Hp, Mar 10mid Hp, Mar 10
CASS: 075°, 9 m/s
CASS: 077°, 9 m/s
CASS: 075°, 2 m/s
CASS: 080°, 2 m/sGSM−MULTIP
Figure 7: Measured and modeled propagation loss for the Bedford Basin on February 25and March 10, 2004. Measurements were collected on bearings 070 ◦–080 ◦; they are shownwith symbols for the 5 m (mid) and 7 m (deep) hydrophones. CASS-GRAB predictions forwind speeds 2 and 9 m/s are shown with lines. Model predictions are averaged over receiversdepths 3, 5 and 7 m. GSM-MULTIP predictions are for a receiver at 5 m depth.
0.0 0.2 0.4 0.6 0.8 1.0 1.2 1.4 1.6 1.8 2.0
70
60
50
40
30
20
10
0
range, km
dep
th,m
Figure 1: Ray trace for bearing 090; number of bottom reflections is 1.
1
mud
Figure 8: Ray trace along bearing 075 ◦ from a 9.3 m deep source. Ray launch anglesare −10 ,−9 .8 , . . . , 10 ◦. Rays with at most one bottom reflection are shown; bottom reflectedrays are terminated at the second bottom bounce. Bottom slopes away from the source at1.7 ◦ between 0 and 200 m; it is flat between 200 and 400 m. Bottom reflected rays impactthe sea-floor at 8.3–10 ◦ grazing angles.12 DRDC Atlantic TM 2007-249
reflection loss is negligible and the propagation loss does not depend on wind speed. Simi-larly, in the 6–9 m/s interval, the propagation loss is wind speed independent because thesurface reflection losses are relatively large and all surface-reflected rays are attenuated. InFigure 7, the modeled propagation losses at 2 and 9 m/s are shown. Losses at other windspeeds in the 2–4 m/s and 6–9 m/s ranges do not deviate from these curves by more than1–2 dB.
On bearing 075◦ the predicted and measured propagation losses agree well except at 1 kmrange where, as Figure 8 shows, the bottom refracted rays first emerge. The discrepancyis caused by the sensitivity of the predictions to the bathymetry and exact location of themeasurement points. Figure 7 also shows the predicted propagation losses on bearings077◦ and 080◦ which agree well with the measurements even at 1 km range. The bearingsensitivity is caused by the south-east shoulder of the Jonquiere Bank (see Figure 6) thatcuts off deep-refracted rays. In particular, small changes in the propagation direction reducethe height of the ”bump” at 0.5 km allowing more deep-refracted rays to propagate. Asa result, the propagation loss is reduced at 1 km range where these rays reach the nearsurface hydrophones. It should be noted that the sharp decrease in the propagation loss at1 km range is probably an artifact of the modeling; in the measurements, the jump wouldbe smoothed by the drift of the measurement platform and reflections from the south sideof the Jonquiere Bank.
The agreement between the measurements and predictions supports the hypothesis thatthe higher propagation loss on February 25 was due to higher wind speed. During theexperiment on February 25 the wind speed was high (9 m/s) and the dense sub-surfacebubble layer generated by breaking waves attenuated all surface reflected rays and increasedpropagation loss. In contrast, on March 10, the wind speed was low (4 m/s) and thedensity of bubbles in the layer was small. As a result, the surface reflection loss was lessand propagation loss was reduced. Furthermore, the agreement demonstrates that thepropagation loss increases with frequency in accordance with the frequency dependencepredicted by the volume attenuation and surface reflection loss models.
It should be noted that the propagation loss measurements were performed only at a fewranges, the spread in the data is large, and only qualitative comparison between the CASS-GRAB predictions and the measurements was possible. Furthermore, analysis of the targetstrength data, [13], indicated that CASS-GRAB predictions yielded target strength thatwere either too high or range-dependent. This finding suggested that the CASS-GRABpredictions, which matched the propagation loss measurements well, were not representativeof the propagation environment at the time of the target strength measurements on March10 and 11, 2004.
Since the scope of the environmental assessment in the target strength and propagation losstrials was limited and no direct measurements of the propagation loss were made concur-rently with the target strength measurements, this contradiction could not be explained.As a result, GSM-MULTIP was used to construct a parametric fit to the propagation lossmeasurements for analysis of the ship target strength data and CASS-GRAB predictionswere used to explore the dependence of the propagation loss on bearing and sonar beampattern.
DRDC Atlantic TM 2007-249 13
3.3 GSM-MULTIP
Prior to the more detailed modeling effort that was undertaken with CASS-GRAB, propa-gation modeling had been conducted using the Multipath Expansion Eigenray Model in theGeneric Sonar Model (GSM-MULTIP) [14]. The parameters for bottom loss and surfaceloss were adjusted to give a reasonable fit to the experimental propagation loss data forFebruary 25 and March 10. The GSM-MULTIP modeling results are included in Figure 7.At short ranges the predictions agree with the March 10 measurements while at longerranges they are closer to the February 25 values. Overall, GSM-MULTIP agrees with thedata as well as the CASS-GRAB predictions.
Although the GSM-MULTIP predictions do not explain the difference in the February andMarch transmission loss measurements, they provide reasonable and range independentvalues for ship target strength. In contrast, if the CASS-GRAB modeled transmissionlosses were used to convert received signal levels to target strength then the resulting targetstrength values were too high and in some cases range-dependent, [13]. This indicates thatunlike CASS-GRAB predictions, the GSM-MULTIP modeled losses provide a good estimateof the propagation conditions at the time of the target strength measurements. In futuretarget strength trials provisions should be made to monitor the one way transmission loss ona continuous basis. This would reduce the dependence on using modeled losses to computetarget strength.
3.4 Bearing Dependence
On February 25 and March 10 the propagation loss measurements were performed onlyon bearing 075◦, a bearing favorable to sound propagation. In particular, along this prop-agation direction, the bottom is covered with soft mud and slopes away from the sonar.Along other bearings, the bottom bathymetry and composition are not as uniform. Forexample, Figure 2 shows that on bearings 030◦ and 120◦, the bottom profiles contain shal-low sea mounts and ridges which are covered with reflective gravel. On these bearings therange-dependent bottom characteristics will affect the propagation loss.
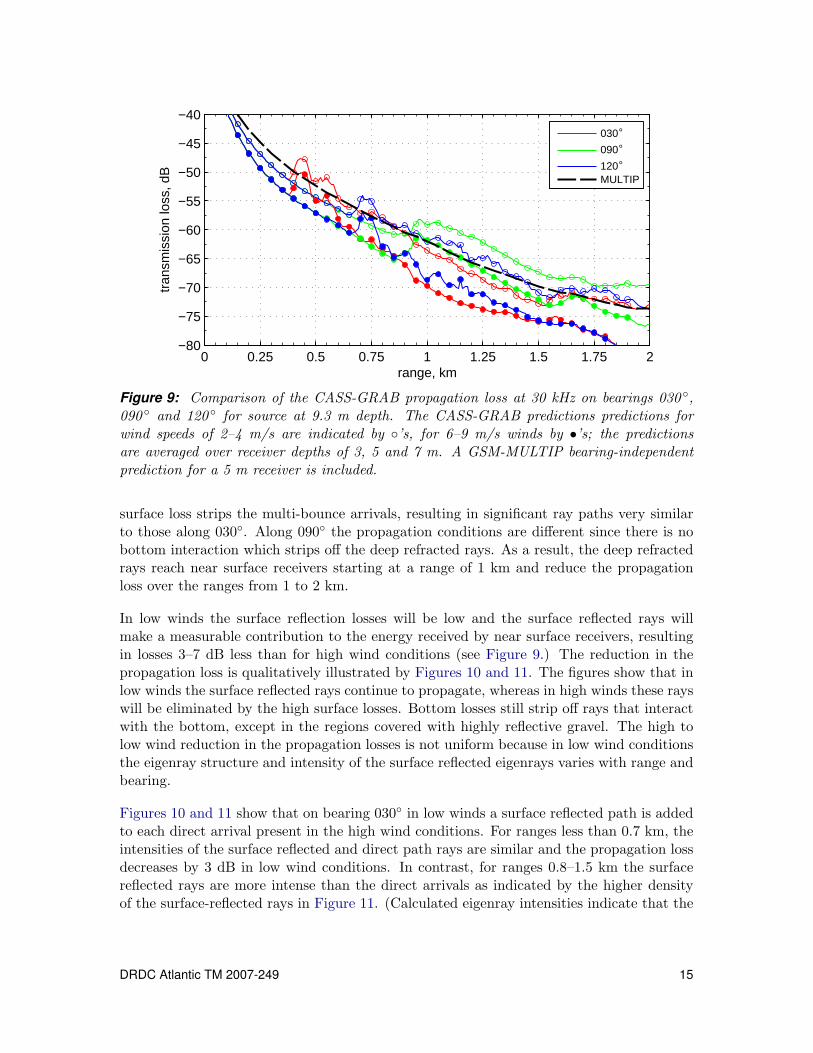
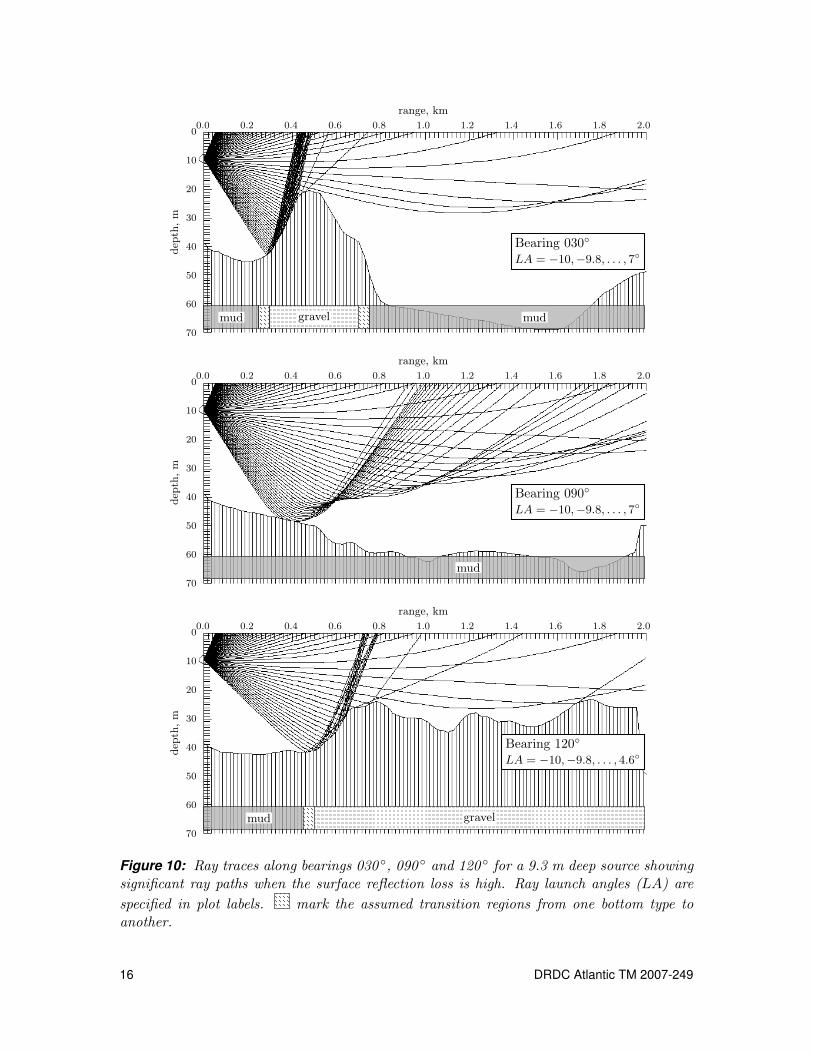
A comparison of the modeled losses along different bearings is instructive as to the mecha-nisms that affect the propagation loss in the Bedford Basin. Figure 9 presents the modeledlosses on bearings 030◦, 090◦, and 120◦ for high and low wind conditions. Ray traces alongthese bearings which illustrate the significant rays for the high surface reflection loss (highwind) case are presented in Figure 10. Ray traces for the low surface reflection loss (lowwind) case are shown in Figure 11.
Although the bathymetry is different on bearings 030◦ and 120◦, the high wind losses alongthese bearings were predicted to be similar aside from the local peaks at 0.4 km and 0.7 km.It is readily seen from the ray traces in Figure 10 that the local bumps in the loss curves aredue to the bottom arrivals from the reflective gravel on the slopes of the Jonquiere Bankand the ridge between Bedford Basin and Fairview Cove (see Figure 2.) Along the 030◦
track the high surface loss in combination with the high bottom loss beyond the Bank stripoff any surface and bottom reflected rays while the interaction with the bottom eliminatesdeep refracted arrivals. Along bearing 120◦ the bottom reflectivity is higher, but the high
14 DRDC Atlantic TM 2007-249
0 0.25 0.5 0.75 1 1.25 1.5 1.75 2−80
−75
−70
−65
−60
−55
−50
−45
−40
tran
smis
sion
loss
, dB
range, km
030°
090°
120°MULTIP
Figure 9: Comparison of the CASS-GRAB propagation loss at 30 kHz on bearings 030 ◦,090 ◦ and 120 ◦ for source at 9.3 m depth. The CASS-GRAB predictions predictions forwind speeds of 2–4 m/s are indicated by ◦’s, for 6–9 m/s winds by •’s; the predictionsare averaged over receiver depths of 3, 5 and 7 m. A GSM-MULTIP bearing-independentprediction for a 5 m receiver is included.
surface loss strips the multi-bounce arrivals, resulting in significant ray paths very similarto those along 030◦. Along 090◦ the propagation conditions are different since there is nobottom interaction which strips off the deep refracted rays. As a result, the deep refractedrays reach near surface receivers starting at a range of 1 km and reduce the propagationloss over the ranges from 1 to 2 km.
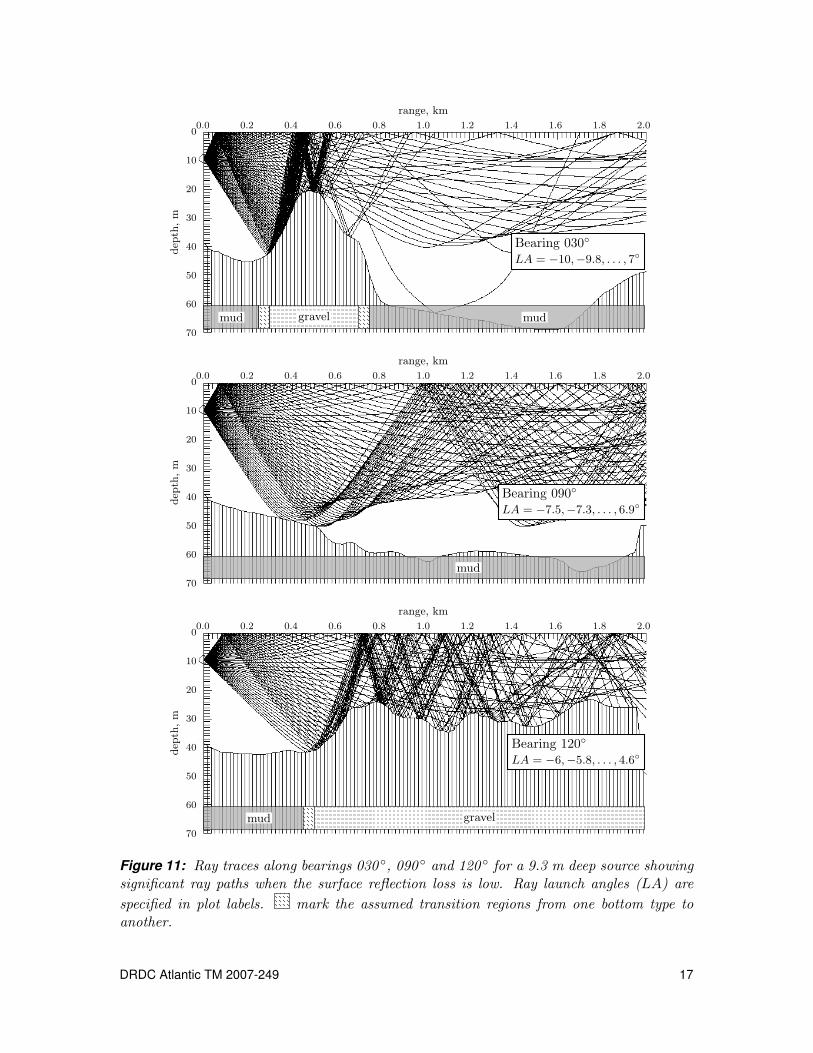
In low winds the surface reflection losses will be low and the surface reflected rays willmake a measurable contribution to the energy received by near surface receivers, resultingin losses 3–7 dB less than for high wind conditions (see Figure 9.) The reduction in thepropagation loss is qualitatively illustrated by Figures 10 and 11. The figures show that inlow winds the surface reflected rays continue to propagate, whereas in high winds these rayswill be eliminated by the high surface losses. Bottom losses still strip off rays that interactwith the bottom, except in the regions covered with highly reflective gravel. The high tolow wind reduction in the propagation losses is not uniform because in low wind conditionsthe eigenray structure and intensity of the surface reflected eigenrays varies with range andbearing.
Figures 10 and 11 show that on bearing 030◦ in low winds a surface reflected path is addedto each direct arrival present in the high wind conditions. For ranges less than 0.7 km, theintensities of the surface reflected and direct path rays are similar and the propagation lossdecreases by 3 dB in low wind conditions. In contrast, for ranges 0.8–1.5 km the surfacereflected rays are more intense than the direct arrivals as indicated by the higher densityof the surface-reflected rays in Figure 11. (Calculated eigenray intensities indicate that the
DRDC Atlantic TM 2007-249 15
0.0 0.2 0.4 0.6 0.8 1.0 1.2 1.4 1.6 1.8 2.0
70
60
50
40
30
20
10
0
range, km
dep
th,m
Figure 1: Ray trace for bearing 090; number of bottom reflections is 1.
1
mud gravel mud
Bearing 030◦
LA = −10,−9.8, . . . , 7◦
0.0 0.2 0.4 0.6 0.8 1.0 1.2 1.4 1.6 1.8 2.0
70
60
50
40
30
20
10
0
range, km
dep
th,m
Figure 1: Ray trace for bearing 090; number of bottom reflections is 1.
1
mud
Bearing 090◦
LA = −10,−9.8, . . . , 7◦
0.0 0.2 0.4 0.6 0.8 1.0 1.2 1.4 1.6 1.8 2.0
70
60
50
40
30
20
10
0
range, km
dep
th,m
Figure 1: Ray trace for bearing 090; number of bottom reflections is 1.
1
mud gravel
Bearing 120◦
LA = −10,−9.8, . . . , 4.6◦
Figure 10: Ray traces along bearings 030 ◦, 090 ◦ and 120 ◦ for a 9.3 m deep source showingsignificant ray paths when the surface reflection loss is high. Ray launch angles (LA) arespecified in plot labels. mark the assumed transition regions from one bottom type toanother.
16 DRDC Atlantic TM 2007-249
0.0 0.2 0.4 0.6 0.8 1.0 1.2 1.4 1.6 1.8 2.0
70
60
50
40
30
20
10
0
range, km
dep
th,m
Figure 1: Ray trace for bearing 090; number of bottom reflections is 1.
1
mud gravel mud
Bearing 030◦
LA = −10,−9.8, . . . , 7◦
0.0 0.2 0.4 0.6 0.8 1.0 1.2 1.4 1.6 1.8 2.0
70
60
50
40
30
20
10
0
range, km
dep
th,m
Figure 1: Ray trace for bearing 090; number of bottom reflections is 1.
1
mud
Bearing 090◦
LA = −7.5,−7.3, . . . , 6.9◦
0.0 0.2 0.4 0.6 0.8 1.0 1.2 1.4 1.6 1.8 2.0
70
60
50
40
30
20
10
0
range, km
dep
th,m
Figure 1: Ray trace for bearing 090; number of bottom reflections is 1.
1
mud gravel
Bearing 120◦
LA = −6,−5.8, . . . , 4.6◦
Figure 11: Ray traces along bearings 030 ◦, 090 ◦ and 120 ◦ for a 9.3 m deep source showingsignificant ray paths when the surface reflection loss is low. Ray launch angles (LA) arespecified in plot labels. mark the assumed transition regions from one bottom type toanother.
DRDC Atlantic TM 2007-249 17
level of the surface reflected arrivals exceeds that of the direct arrivals by up to 8 dB.)Consequently, in low winds the propagation loss is reduced by as much as 7 dB for ranges0.8–1.3 km. At longer ranges, the addition of surface reflected deep refracted rays in lowwinds reduces the propagation loss by 5–7 dB.
On bearings 030◦ and 090◦ at short ranges, the changes in eigenray structure due to re-duction in the surface loss are similar. Figures 10 and 11 show that in low wind a surfacereflected arrival is added for each direct arrival present in high wind conditions. Since in-tensities of the two rays are similar, the propagation loss decreases by approximately 3 dBat ranges less than 0.7 km on both bearings. At longer ranges, the effect of wind on thepropagation conditions on bearings 030◦ and 090◦ is not the same. As discussed earlier, onbearing 090◦ the deep refracted rays are the major contributors to energy propagation atranges beyond 0.9 km; on bearing 030◦, these rays are cut off by the Jonquiere Bank andthus losses are higher as shown in Figure 9. In particular, Figures 10 and 11 show thaton bearing 090◦ in low winds deep refracted paths with single surface bounce are added tothe high wind refracted paths and these added rays have similar intensity. The additionalpaths result in 3–5 dB reduction in the propagation loss for ranges beyond 0.8 km.
Finally, along the 120◦ bearing the high wind to low wind change in the propagation con-ditions is most pronounced. At short ranges, as along the other bearings, the reductionis approximately 3 dB but over the ridge it increases to 7 dB. The large reduction in thepropagation loss is the result of the reflective bottom along this bearing. Low surface re-flection losses in combination with the low bottom losses over the ridge result in significantmulti-bounce paths that decrease propagation loss over the ridge.
Since the propagation loss was measured only along bearing 075◦ the experimental datacannot be used to confirm the predicted dependence of propagation loss on bearing. How-ever, the reverberation measurements presented in Section 4 exhibit bearing dependenceconsistent with the modeled bearing effects described in this section.
3.5 Beam Pattern Dependence
In the propagation loss experiments the transmission losses were measured with omnidi-rectional sources and receivers. Since the Seahorse sonar used in the ship target strengthexperiment was not omnidirectional it was necessary to consider the effect of the sonarvertical beam pattern on the propagation loss.
It is convenient to evaluate the effect of the sonar beam patterns on bearing 090◦ first.Along this bearing, the bottom slopes away from the barge and supports existence of alarge number of eigenrays between the sonar and the target. For a target 5 m deep andat ranges 0 to 2 km, the eigenrays are launched at angles between ±6◦ to the horizontalexcept when the target is between 1 and 1.2 km. At these ranges there exist additionalbottom refracted eigenrays that are launched at angles ±6–8◦.
Since the minimum −3 dB width of the Seahorse vertical receive and transmit responsesis about 13◦ (see Figure 12, page 19) the vertical beam patterns do not affect propagation
18 DRDC Atlantic TM 2007-249
loss except at ranges between 1 and 1.2 km. At these ranges, the vertical beam patternreduces the contribution of the bottom refracted rays thus decreasing the jump in thepropagation loss at 1 km. At 20 kHz, the vertical transmit and receive beams are wide andthe reduction is 2 dB; at 40 kHz, where the vertical beam width is minimum, the reductionincreases to 5 dB.
On other bearings, the effect of the vertical beam pattern on the propagation loss is smallerbecause the bathymetry cuts off the more steeply launched deep refracted rays. On thesebearings, the correction of the propagation loss for the vertical receive and transmit beampatterns of Seahorse is negligible.
4 Reverberation
The previous section reviewed the propagation loss measurements collected on February25 and March 10, 2004, in the Bedford Basin and compared them to the CASS-GRABpredictions. Since the measurements were collected only at a few ranges along one bearing,the comparison was only qualitative; nevertheless, the agreement between the data andthe model is reasonable. However, the limited scope of the propagation loss experimentprevented validation of the hypothesis that the transmission losses were bearing dependent.Additional analysis was required to confirm the model predictions.
The HMCS CHARLOTTETOWN acoustic target strength trial yielded a large data setof the reverberation time series for the Bedford Basin that can be used to explore suchdependences. This section reviews the reverberation measurements and investigates theeffect of wind speed and bearing on the reverberation in the Bedford Basin. After a shortreview of the Seahorse sonar in Section 4.1, the observed dependence of the reverberationon wind speed and bearing are presented in Sections 4.2 and 4.3. In Sections 4.3.1–4.3.3 themeasurements are compared to the CASS-GRAB reverberation estimates and the effects ofthe bathymetry and bottom composition on the reverberation are explored.
4.1 Seahorse Sonar
The Seahorse sonar is an experimental active sonar system developed at DRDC Atlantic inthe mid-1990’s, [15]. The sonar is based on a Mk46 torpedo transducer but uses an expandedfrequency band 20–40 kHz. For the HMCS CHARLOTTETOWN target strength trial, thesonar was mounted on a rotation station at the DRDC Atlantic Acoustic Calibration Bargeat the depth of 9.3 m.
Figure 12 presents parametric representations of the Seahorse beam patterns which wereused in modeling the reverberation. The beam responses were simplified by approximatingthe main beam lobes by parabolas and setting the response outside the main lobe to a levelrepresentative of the sidelobe levels. The parametric representations were derived from themeasured beam response data presented in reference [13]. The data in the reference is acombination of March 2004 and April 1996 measurements. In 2004 the horizontal transmit
DRDC Atlantic TM 2007-249 19
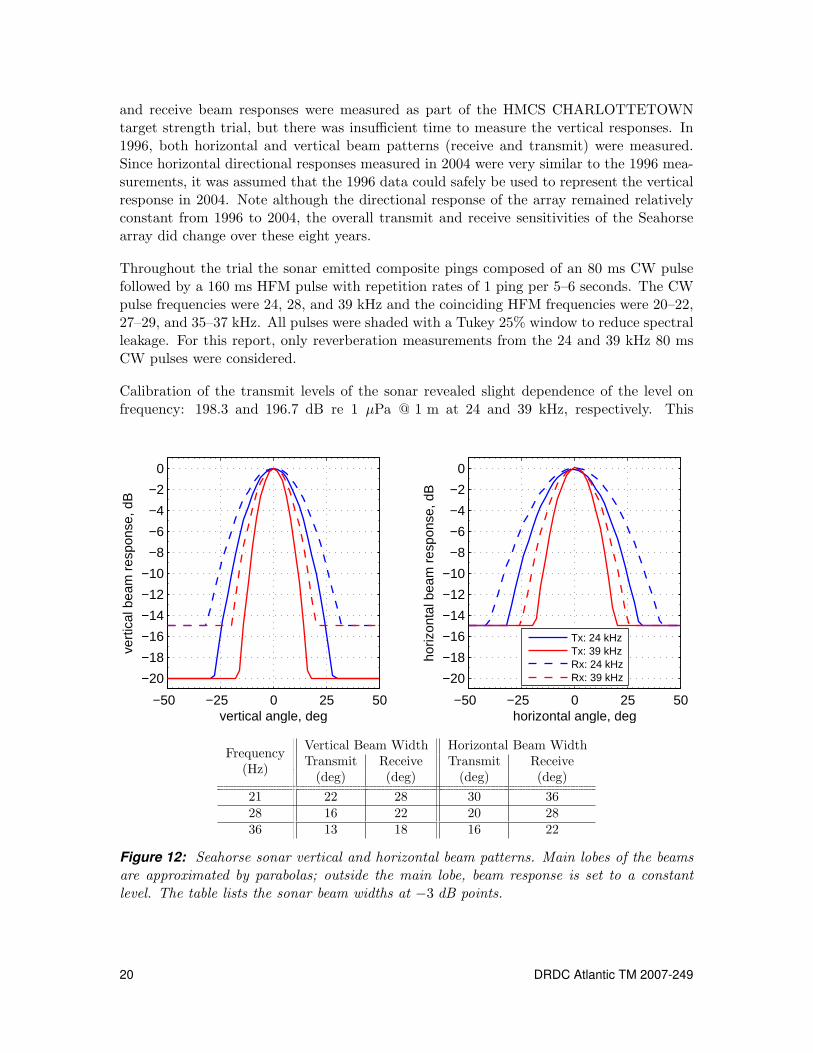
and receive beam responses were measured as part of the HMCS CHARLOTTETOWNtarget strength trial, but there was insufficient time to measure the vertical responses. In1996, both horizontal and vertical beam patterns (receive and transmit) were measured.Since horizontal directional responses measured in 2004 were very similar to the 1996 mea-surements, it was assumed that the 1996 data could safely be used to represent the verticalresponse in 2004. Note although the directional response of the array remained relativelyconstant from 1996 to 2004, the overall transmit and receive sensitivities of the Seahorsearray did change over these eight years.
Throughout the trial the sonar emitted composite pings composed of an 80 ms CW pulsefollowed by a 160 ms HFM pulse with repetition rates of 1 ping per 5–6 seconds. The CWpulse frequencies were 24, 28, and 39 kHz and the coinciding HFM frequencies were 20–22,27–29, and 35–37 kHz. All pulses were shaded with a Tukey 25% window to reduce spectralleakage. For this report, only reverberation measurements from the 24 and 39 kHz 80 msCW pulses were considered.
Calibration of the transmit levels of the sonar revealed slight dependence of the level onfrequency: 198.3 and 196.7 dB re 1 µPa @ 1 m at 24 and 39 kHz, respectively. This
−50 −25 0 25 50
−20
−18
−16
−14
−12
−10
−8
−6
−4
−2
0
vertical angle, deg
vert
ical
bea
m r
espo
nse,
dB
−50 −25 0 25 50
−20
−18
−16
−14
−12
−10
−8
−6
−4
−2
0
horizontal angle, deg
horiz
onta
l bea
m r
espo
nse,
dB
Tx: 24 kHzTx: 39 kHzRx: 24 kHzRx: 39 kHz
Frequency(Hz)
Vertical Beam Width Horizontal Beam WidthTransmit Receive Transmit Receive
(deg) (deg) (deg) (deg)21 22 28 30 3628 16 22 20 2836 13 18 16 22
Figure 12: Seahorse sonar vertical and horizontal beam patterns. Main lobes of the beamsare approximated by parabolas; outside the main lobe, beam response is set to a constantlevel. The table lists the sonar beam widths at −3 dB points.
20 DRDC Atlantic TM 2007-249
difference is insignificant when compared to the variability observed in the reverberationlevels; in this study, the sonar source level was assumed to be 200 dB re 1 µPa @ 1 m forall frequencies. Sonar sensitivity was −186.1 and −192.8 dB re V/µPa at 24 and 39 kHz,respectively.
A detailed description of the processing applied to the received signal is given in [13]. CWprocessing was accomplished by heterodyning the received signals down to a baseband andcomputing the power spectra for 82 ms snapshots. The received power at the ping’s centerfrequency was extracted by selecting two adjacent frequency bins with maximum powernear the pulse center frequency3. The power vs. time series at the selected frequency is thereverberation time series.
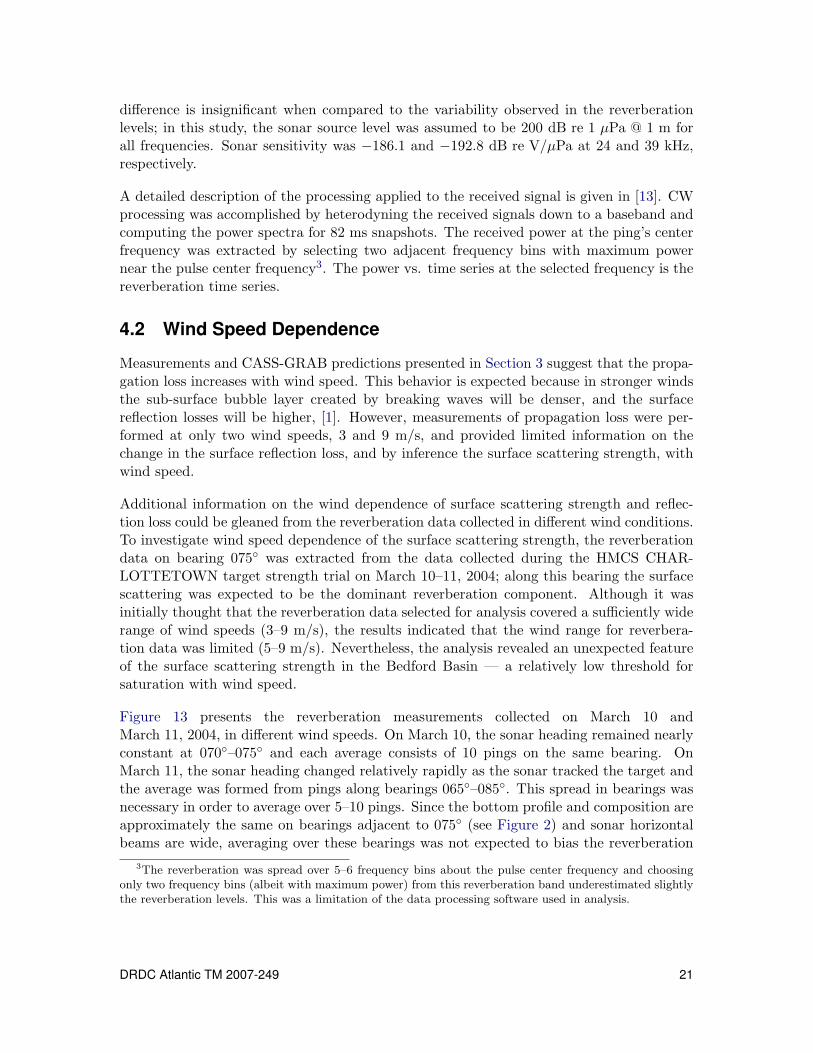
4.2 Wind Speed Dependence
Measurements and CASS-GRAB predictions presented in Section 3 suggest that the propa-gation loss increases with wind speed. This behavior is expected because in stronger windsthe sub-surface bubble layer created by breaking waves will be denser, and the surfacereflection losses will be higher, [1]. However, measurements of propagation loss were per-formed at only two wind speeds, 3 and 9 m/s, and provided limited information on thechange in the surface reflection loss, and by inference the surface scattering strength, withwind speed.
Additional information on the wind dependence of surface scattering strength and reflec-tion loss could be gleaned from the reverberation data collected in different wind conditions.To investigate wind speed dependence of the surface scattering strength, the reverberationdata on bearing 075◦ was extracted from the data collected during the HMCS CHAR-LOTTETOWN target strength trial on March 10–11, 2004; along this bearing the surfacescattering was expected to be the dominant reverberation component. Although it wasinitially thought that the reverberation data selected for analysis covered a sufficiently widerange of wind speeds (3–9 m/s), the results indicated that the wind range for reverbera-tion data was limited (5–9 m/s). Nevertheless, the analysis revealed an unexpected featureof the surface scattering strength in the Bedford Basin — a relatively low threshold forsaturation with wind speed.
Figure 13 presents the reverberation measurements collected on March 10 andMarch 11, 2004, in different wind speeds. On March 10, the sonar heading remained nearlyconstant at 070◦–075◦ and each average consists of 10 pings on the same bearing. OnMarch 11, the sonar heading changed relatively rapidly as the sonar tracked the target andthe average was formed from pings along bearings 065◦–085◦. This spread in bearings wasnecessary in order to average over 5–10 pings. Since the bottom profile and composition areapproximately the same on bearings adjacent to 075◦ (see Figure 2) and sonar horizontalbeams are wide, averaging over these bearings was not expected to bias the reverberation
3The reverberation was spread over 5–6 frequency bins about the pulse center frequency and choosingonly two frequency bins (albeit with maximum power) from this reverberation band underestimated slightlythe reverberation levels. This was a limitation of the data processing software used in analysis.
DRDC Atlantic TM 2007-249 21
0 0.25 0.5 0.75 1 1.25 1.5 1.75 2
60
80
100
120
F=39 kHz
range, km
60
80
100
120
F=24 kHz
reve
rber
atio
n, d
B r
e 1µ
Pa2
10 m/s, Mar 11 @ 14:008 m/s, Mar 11 @ 16:306 m/s, Mar 10 @ 17:003 m/s (?), Mar 10 @ 10:15
10 m/s, Mar 11 @ 14:158 m/s, Mar 11 @ 12:456 m/s, Mar 10 @ 17:003 m/s (?), Mar 10 @ 10:15
Figure 13: Measured reverberation on bearing 075 ◦ on March 10–11, 2004, for nominalwind speeds 3, 6, 8 and 10 m/s. Each curve is an average of 5–10 pings; individual pingsare shown with dotted lines. Wind speed rose between 09:00 and 11:00 on March 10 andwind speed during 10:15 measurements was probably greater than 3 m/s. No variation withwind speed is visible in the data. All times are given as local time (Atlantic Standard Time).
0.0 0.2 0.4 0.6 0.8 1.0 1.2 1.4 1.6 1.8 2.0
70
60
50
40
30
20
10
0
range, km
dep
th,m
Figure 1: Ray trace for bearing 090; number of bottom reflections is 1.
1
mud
Figure 14: Ray traces along bearing 075 ◦ for 9.3 m deep sonar showing the significant raypaths. Ray launch angles are −10 ,−9 .8 , . . . , 10 ◦. The bottom is highly absorbent alongthis bearing and most bottom interacting rays are highly attenuated. The reverberationmeasurements in Figure 13 suggest that the bumps in the bathymetry between 0.45 and0.7 km (south-east shoulder of the Jonquiere Bank) do contribute to the reverberation.
22 DRDC Atlantic TM 2007-249
estimate. This is corroborated by the similar, albeit large — 10 dB, spread in the scatter-ing levels on March 10 and March 11. The data in the figure was filtered to include onlysamples which exceeded the ambient noise by at least 5 dB. This restriction caused earlytermination of some reverberation curves.
Since volume reverberation in the Bedford Basin is negligible in early spring, [16], eitherbottom or surface scattering must dominate the background reverberation. On bearing075◦ bottom reverberation is negligible because the sea-floor is covered with soft mud.This is further corroborated by Figure 14 that shows the significant propagating rays alongbearing 075◦. The high loss bottom along this bearings effectively strips off any bottominteracting ray paths and the reverberation from the first interaction with the bottom isexpected to be very low due to the soft and muddy bottom. There is however, an indicationin the reverberation measurements in Figure 13 that bottom scattering does contribute tothe reverberation levels from about 0.45 to 0.7 km. Figure 14 shows that at these rangesthe rays interact with the south-east shoulder of Jonquiere Bank Bank. The bottom inthis region may be more reverberant than the surrounding mud. At other ranges, surfacescattering is the dominant reverberation component.
Comparison of the reverberation measurements to CASS-GRAB predictions in Section 4.3.1suggests that a high surface scattering strength of −25 dB re m2 is necessary to explainthe observations. This finding is consistent with the APL-UW models, [1], that indicatethat surface scattering is dominated by scattering from the sub-surface bubbles for shallowgrazing angles. However, the models predict that the surface scattering strength increasesrapidly for wind speed between 3 and 8 m/s and the apparent absence of the wind depen-dence in the measurements was unexpected.
Although reverberation in low winds should be much smaller than in high winds, the mea-sured levels for the 3 m/s samples were comparable to the measured levels at the higherwinds (see Figure 13.) The anomaly can be explained by examining the wind data moreclosely. No in-situ wind measurements were collected during the February–March 2004experiments in the Bedford Basin. In the absence of the in-situ measurements, the windspeeds were obtained from the meteorological database for the McNab’s Island weatherstation, [3]. Since this weather station is nearly 15 km from the DRDC Atlantic AcousticCalibration Barge, the hourly wind speed averages at the station can only be consideredrepresentative of the Basin wind speeds if the winds are steady. During times of changingwinds, the wind speed and direction in the Bedford Basin cannot be assumed to be thesame as at the McNab’s Island. An examination of the McNab’s Island data for March 10in Figure 4 shows that at 10:15 the wind speed was in transition, and thus the wind speedestimate of 3 m/s is suspect. It is likely that the wind speed in the Basin for the 10:15 rever-beration measurement was greater than the McNab’s Island speed; furthermore, measuredreverberation levels suggest that the wind speed was above the wave-breaking threshold.
It should also be noted that the APL-UW model for surface scattering strength predictssaturation for wind speeds above 9 m/s. In contrast, Figure 13 suggests that the surfacescattering strength saturates for wind speeds as low as 6 m/s. This anomaly can be ex-plained if it is recalled the surface scattering strength is a function of the sub-surface bubbledensity that depends on wind speed, proximity of land masses and presence of surfactants
DRDC Atlantic TM 2007-249 23
in the water, [10]. In open ocean measurements, such as those on which the APL-UWmodels are based, wind speed is the primary factor that controls the concentration of thesub-surface bubbles. However, in fetch-limited, shallow, near shore environments wherethe wind speed threshold for appearance of breaking waves is lower and concentration ofsurfactants is greater, the bubble concentration can be significantly higher than in openocean, [10, 17]. Consequently, it is possible that in the Bedford Basin, the bubble con-centrations necessary for the saturation of the surface scattering strengths were reached inwind speeds lower than predicted by the APL-UW models based on the open ocean data.As a result, the reverberation levels in wind speeds between 6 and 10 m/s did not exhibitany wind speed dependence.
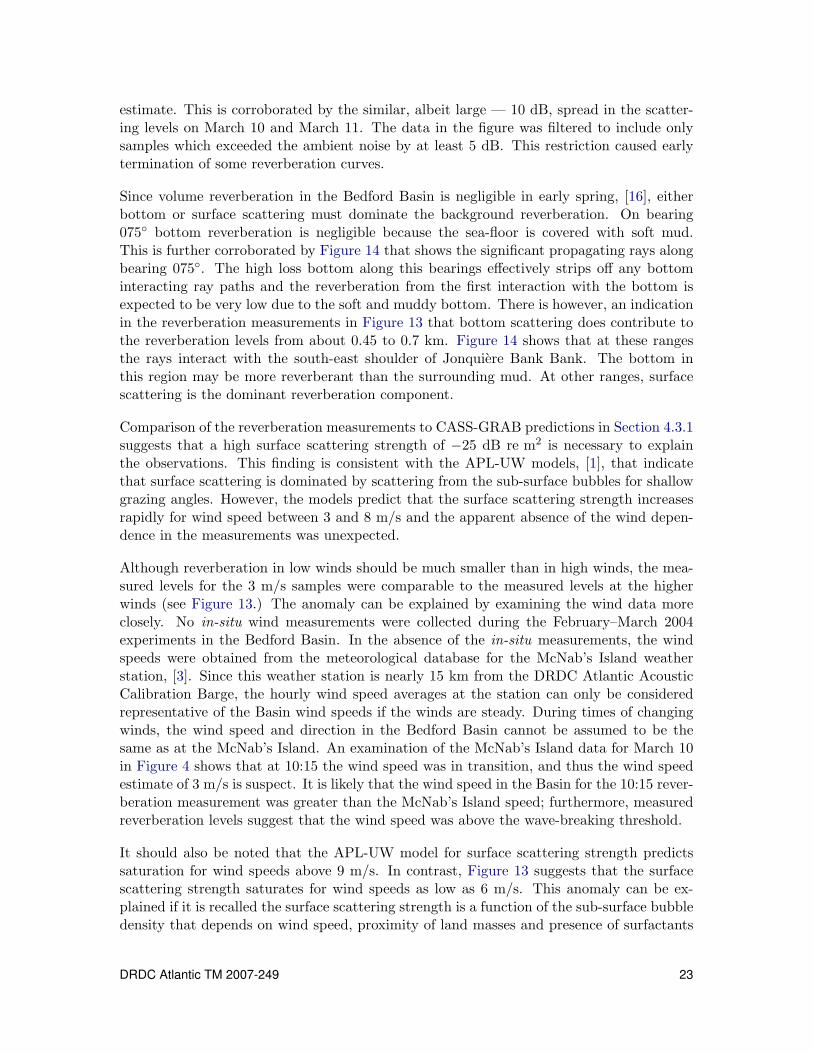
4.3 Bearing Dependence
Range-dependent bathymetry and bottom composition shown in Figure 2 are expected toaffect the reverberation and propagation loss in the Bedford Basin. Indeed, comparison ofthe reverberation on different bearings shown in Figure 15 confirms this hypothesis. Thefigure presents the reverberation observed on bearings 030◦, 090◦, and 115◦ from 80 ms24 kHz pulses; each average curve consists of 5–8 pings on the same bearing. A localmaximum in the reverberation on bearing 115◦ at 1.2 km range is the interference from a100 kHz sonar operating in close proximity to the Seahorse sonar.
Despite the large spread in the measurements, the average reverberation curves confirm thatthe reverberation and propagation loss conditions in the Bedford Basin depended strongly
0 0.25 0.5 0.75 1 1.25 1.5 1.75 260
70
80
90
100
110
120
130
range, km
reve
rber
atio
n, d
B r
e 1µ
Pa2
030°090°115°
interference from100 kHz sonar
Figure 15: Observed reverberation from 24 kHz 80 ms long CW pulse on bearings 030 ◦,090 ◦ and 115 ◦. Measurements on each bearing were taken approximately 30 minutes apart;average wind speed was 9 m/s. The dotted lines show single ping data; solid lines areaverages of the raw data (5–8 pings).
24 DRDC Atlantic TM 2007-249
on bearing. For example along bearings 030◦ and 090◦ the average reverberation curvesagreed only between 0.5 and 0.75 km; elsewhere the difference was 10–15 dB. Similarly,reverberation along bearings 090◦ and 115◦ agreed for ranges less than 0.5 km and greaterthan 1 km, while over the intermediate ranges the difference was 5–10 dB.
In the following sections 4.3.1, 4.3.2 and 4.3.3 the reverberation along bearings 090◦, 030◦
and 115◦, respectively, is compared to the CASS-GRAB predictions and the reasons forthe strong bearings dependence identified. In particular, it is shown that the differences inthe reverberation along these bearings are caused by the shallow, gravel-covered JonquiereBank and ridge that separates Bedford Basin from Fairview Cove.
4.3.1 Bearing 090◦: Reverberation Over a Smooth Sloping Bottom
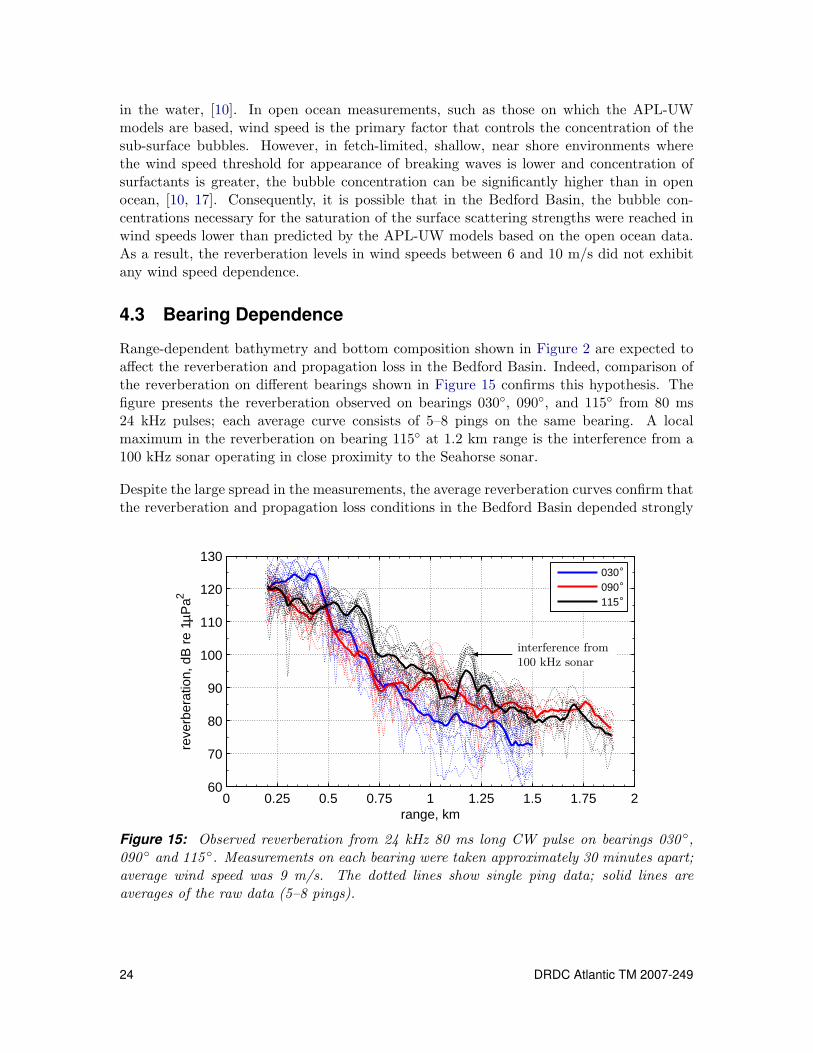
Bearing 090◦ is the most favorable bearing for propagation of sound towards the centerof the Bedford Basin. As shown in Figure 16, along this bearing the depth increaseswith distance out to 1 to 1.5 km from the DRDC Atlantic Acoustic Calibration Barge.This bathymetry supports the existence of the deep refracted rays (see Figures 10 and 11)that reduce propagation loss along this bearing. For modeling reverberation, the bottom isassumed homogeneous mud over the horizontal extent of the Seahorse beams (28◦ at 24 kHzand 18◦ at 39 kHz.)
Figure 17 compares the measured and modeled reverberation along bearing 090◦ for fre-quencies of 24 and 39 kHz. The measurements were collected throughout the day on11 March 2004 in winds between 7 and 10 m/s. The modeled reverberation was com-puted for wind speeds of 2, 7, and 9 m/s using default APL-UW surface scattering andreflection loss models as discussed in Section 2.4. The 2 m/s curve is included to show thatthe predicted reverberation for low wind conditions does not model the measured valueswell. Higher surface scattering strength resulting from higher wind speeds is needed tomodel the measured values. Note the inversion in the 7 and 9 m/s model curves showingthe reverberation levels for a 9 m/s wind to be less than for a 7 m/s wind. The inversion isa result of the APL-UW surface scattering model in which the surface scattering strengthdecreases faster with grazing angle for a 9 m/s wind than for a 7 m/s wind.
The modeled reverberation curves for 7 and 9 m/s wind speeds underestimate the scatteringstrength measurements by 3–10 dB. For ranges less than 1.5 km, a better agreement betweenthe measurements and the predictions was achieved if a constant −25 dB re m2 surface scat-tering strength and 9 m/s surface reflection loss were assumed. Although −25 dB re m2
surface scattering strength exceeds APL-UW model predictions by 2–15 dB and does notinclude any dependence on surface grazing angle, the uncertainty in the predictions encom-passes the proposed −25 dB re m2 value. The error uncertainty in the APL-UW modelfor surface scattering strength in open ocean model, [1], is ±4–5 dB while references [10]and [17] indicate that the scattering strength in near shore regions can exceed open oceanvalues by 5–10 dB.
Review of the significant ray paths along bearings 090◦ in Figure 10 facilitates comparisonbetween the assumed surface scattering strength and the APL-UW model. The bottomalong bearing 090◦ is soft mud so that surface scattering is the dominant reverberation
DRDC Atlantic TM 2007-249 25
0 0.5 1 1.5 2
0
10
20
30
40
50
60
70
range, km
dept
h, m
080°090°100°
−0.5 0 0.50
0.5
1
1.5
2
east, km
nort
h, k
m
0
10
20
30
40
50
60
70
Figure 16: Bathymetry on bearing 090 ◦ and bottom profiles on adjacent bearings. DRDCAtlantic Acoustic Calibration Barge is at (0,0). Bathymetry data is rotated so that bearing090 ◦ points north. Markers ◦ indicate that bottom composition along the bearing does notchange.
0 0.25 0.5 0.75 1 1.25 1.5 1.75 260
80
100
120
F=24 kHz
range, km
60
80
100
120
F=39 kHz
reve
rber
atio
n, d
B r
e 1µ
Pa2
Figure 17: Reverberation on bearing 090 ◦ on March 11, 2004. Raw data is shownwith , averaged measurements with . CASS-GRAB predictions with APL-UW models for surface scattering strength and reflection loss are given for wind speeds2 m/s , 7 m/s , and 9 m/s . Modeled reverberation for surface scat-tering strengths of −25 dB re m2 and APL-UW surface reflection model with wind speed9 m/s is shown with .
26 DRDC Atlantic TM 2007-249
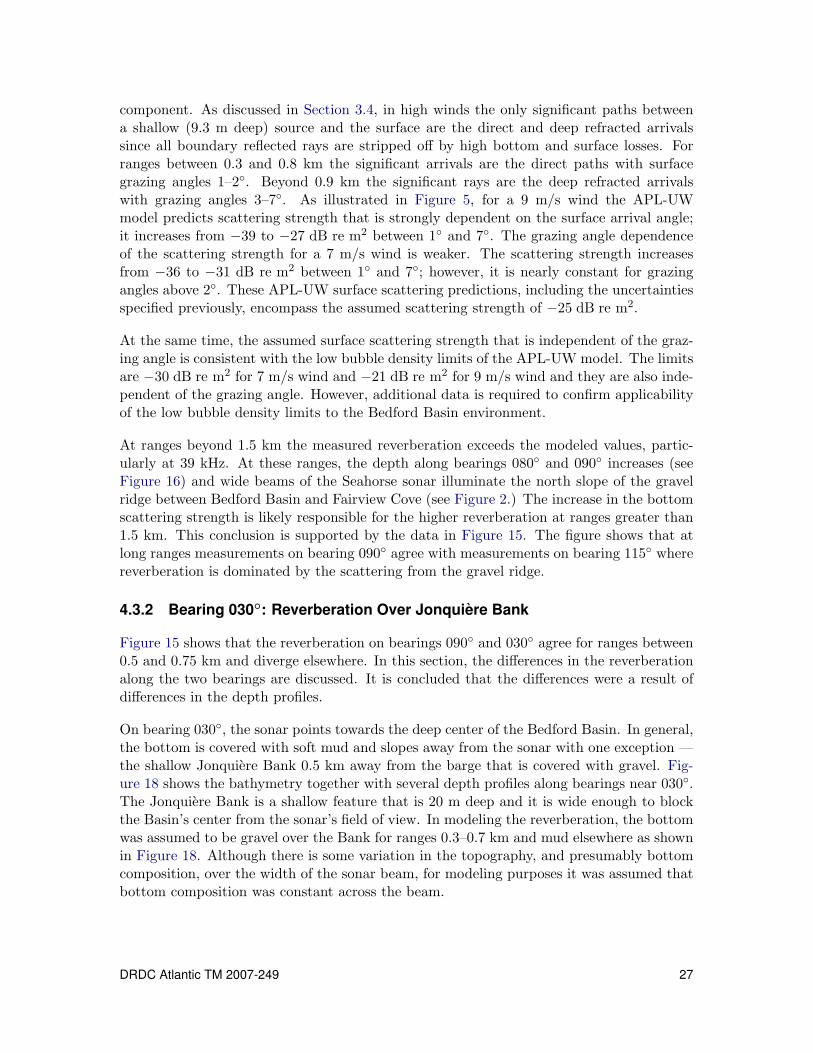
component. As discussed in Section 3.4, in high winds the only significant paths betweena shallow (9.3 m deep) source and the surface are the direct and deep refracted arrivalssince all boundary reflected rays are stripped off by high bottom and surface losses. Forranges between 0.3 and 0.8 km the significant arrivals are the direct paths with surfacegrazing angles 1–2◦. Beyond 0.9 km the significant rays are the deep refracted arrivalswith grazing angles 3–7◦. As illustrated in Figure 5, for a 9 m/s wind the APL-UWmodel predicts scattering strength that is strongly dependent on the surface arrival angle;it increases from −39 to −27 dB re m2 between 1◦ and 7◦. The grazing angle dependenceof the scattering strength for a 7 m/s wind is weaker. The scattering strength increasesfrom −36 to −31 dB re m2 between 1◦ and 7◦; however, it is nearly constant for grazingangles above 2◦. These APL-UW surface scattering predictions, including the uncertaintiesspecified previously, encompass the assumed scattering strength of −25 dB re m2.
At the same time, the assumed surface scattering strength that is independent of the graz-ing angle is consistent with the low bubble density limits of the APL-UW model. The limitsare −30 dB re m2 for 7 m/s wind and −21 dB re m2 for 9 m/s wind and they are also inde-pendent of the grazing angle. However, additional data is required to confirm applicabilityof the low bubble density limits to the Bedford Basin environment.
At ranges beyond 1.5 km the measured reverberation exceeds the modeled values, partic-ularly at 39 kHz. At these ranges, the depth along bearings 080◦ and 090◦ increases (seeFigure 16) and wide beams of the Seahorse sonar illuminate the north slope of the gravelridge between Bedford Basin and Fairview Cove (see Figure 2.) The increase in the bottomscattering strength is likely responsible for the higher reverberation at ranges greater than1.5 km. This conclusion is supported by the data in Figure 15. The figure shows that atlong ranges measurements on bearing 090◦ agree with measurements on bearing 115◦ wherereverberation is dominated by the scattering from the gravel ridge.
4.3.2 Bearing 030◦: Reverberation Over Jonquiere Bank
Figure 15 shows that the reverberation on bearings 090◦ and 030◦ agree for ranges between0.5 and 0.75 km and diverge elsewhere. In this section, the differences in the reverberationalong the two bearings are discussed. It is concluded that the differences were a result ofdifferences in the depth profiles.
On bearing 030◦, the sonar points towards the deep center of the Bedford Basin. In general,the bottom is covered with soft mud and slopes away from the sonar with one exception —the shallow Jonquiere Bank 0.5 km away from the barge that is covered with gravel. Fig-ure 18 shows the bathymetry together with several depth profiles along bearings near 030◦.The Jonquiere Bank is a shallow feature that is 20 m deep and it is wide enough to blockthe Basin’s center from the sonar’s field of view. In modeling the reverberation, the bottomwas assumed to be gravel over the Bank for ranges 0.3–0.7 km and mud elsewhere as shownin Figure 18. Although there is some variation in the topography, and presumably bottomcomposition, over the width of the sonar beam, for modeling purposes it was assumed thatbottom composition was constant across the beam.
DRDC Atlantic TM 2007-249 27
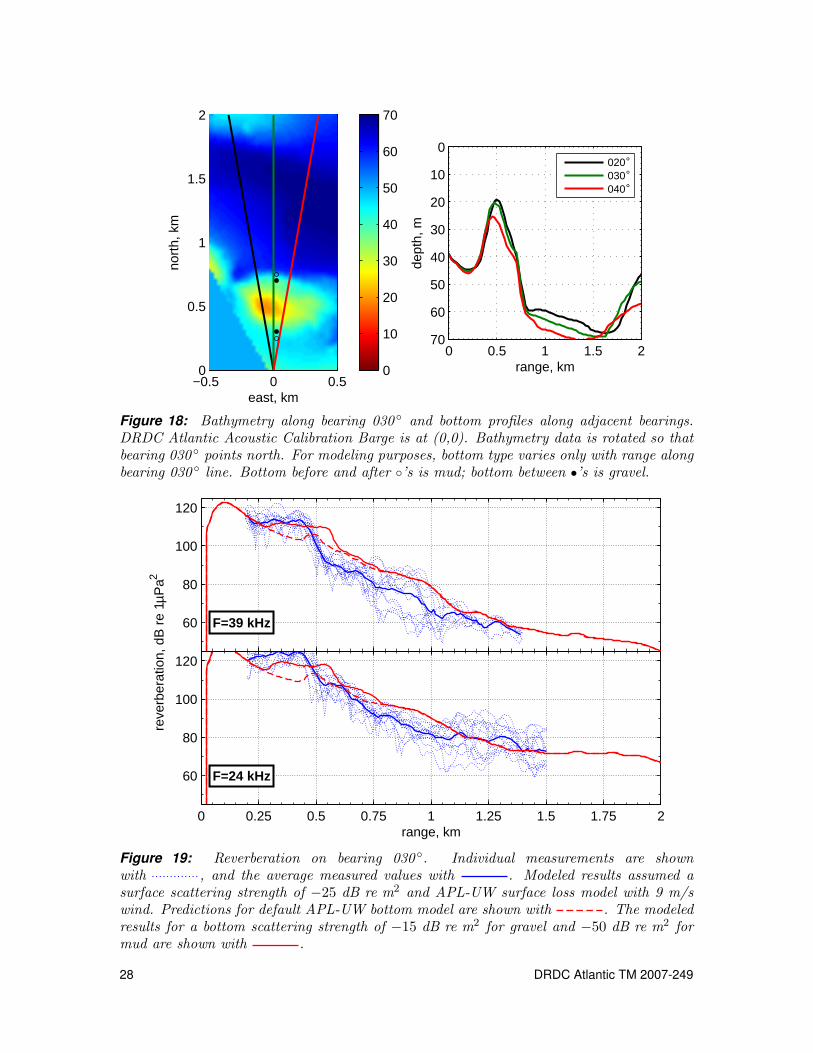
0 0.5 1 1.5 2
0
10
20
30
40
50
60
70
range, km
dept
h, m
020°030°040°
−0.5 0 0.50
0.5
1
1.5
2
east, km
nort
h, k
m
0
10
20
30
40
50
60
70
Figure 18: Bathymetry along bearing 030 ◦ and bottom profiles along adjacent bearings.DRDC Atlantic Acoustic Calibration Barge is at (0,0). Bathymetry data is rotated so thatbearing 030 ◦ points north. For modeling purposes, bottom type varies only with range alongbearing 030 ◦ line. Bottom before and after ◦’s is mud; bottom between •’s is gravel.
0 0.25 0.5 0.75 1 1.25 1.5 1.75 2
60
80
100
120
F=24 kHz
range, km
60
80
100
120
F=39 kHz
reve
rber
atio
n, d
B r
e 1µ
Pa2
Figure 19: Reverberation on bearing 030 ◦. Individual measurements are shownwith , and the average measured values with . Modeled results assumed asurface scattering strength of −25 dB re m2 and APL-UW surface loss model with 9 m/swind. Predictions for default APL-UW bottom model are shown with . The modeledresults for a bottom scattering strength of −15 dB re m2 for gravel and −50 dB re m2 formud are shown with .
28 DRDC Atlantic TM 2007-249
At short ranges scattering from the west-slope of the Jonquiere Bank was expected to causea peak in the reverberation which is shown by the data in Figure 15. The figure alsoshows the measured reverberation along bearings 030◦ and 090◦ to be similar for ranges0.5–0.8 km. The predicted dominant ray paths shown in Figure 10 are consistent with thesemeasurements since at the intermediate ranges, 0.5–0.9 km, the significant ray paths alongthe two bearings are similar. At ranges beyond 0.9 km along 030◦ bearing the reverberationis approximately 10 dB less than the reverberation along 090◦. This was a consequence ofthe elimination of the deep refracted paths along bearing 030◦ by the Jonquiere Bank andhigh surface reflection losses.
Figure 19 compares the measured and modeled reverberation on bearing 030◦. Basedon results for the 090◦ bearing in Section 4.3.1, surface scattering strength was set to−25 dB re m2. Along bearing 090◦, the assumed surface scattering strength yielded betteragreement between the measured and modeled reverberation than the default APL-UWsurface scattering strength model for winds 7–9 m/s. For reverberation predictions, theAPL-UW surface reflection model with 9 m/s wind was assumed. As in Section 4.3.1, thepredictions were not sensitive to the choice of wind speeds between 7 and 9 m/s.
The figure shows that the modeled reverberation overpredicts the measurements for rangesbeyond 0.6 km. A −30 dB re m2 surface scattering strength value will likely producebetter comparison with the data. This discrepancy was unexpected because along bearing090◦, the −25 dB re m2 estimate of the scattering strength yields reasonable agreementbetween the reverberation measurements and predictions. Although, the surface scatteringstrength in open ocean is expected to be independent of the azimuth, [1], it is possiblethat in near shore environments the surface scattering is not isotropic. However, additionalmeasurements are required to investigate this hypothesis.
When the APL-UW bottom scattering strength model in Figure 3 was used, the predictionsat shorter ranges, where reverberation is dominated by scattering from the west-slope of theJonquiere Bank, were less than the measurements. The model to measurement discrepancycan be eliminated by increasing the model scattering strength for a gravel bottom. The raytraces in Figure 10 show that the rays launched at angles between 2◦ and 6◦ are incidenton the Bank. Since the slope of the Bank is 9◦, the bottom grazing angles are between10◦ and 15◦ and for these angles, the APL-UW bottom scattering strength ranges from−30 to −25 dB re m2 with an uncertainty of 10 dB or more. Given the uncertainty in thevalues it is reasonable to increase the gravel scattering strength by 10 dB to −15 dB re m2.Alternatively, it is possible that the selected grain size index for gravel of 0 (see Section 2.3)underestimates the index (and mean grain diameter) of the Jonquiere Bank’s gravel and ahigher index would yield better agreement with the measurements.
With the new gravel scattering strength the predictions are closer to the measured levelsover the 0.25 to 0.5 km range, although the modeled bottom reverberation extends togreater range than the measurements indicate. This mismatch is likely due to an inexactrepresentation of the extent of the high reverberation gravel along the propagation path.
DRDC Atlantic TM 2007-249 29
4.3.3 Bearing 115◦: Reverberation Along Gravel Ridge
Bearing 115◦ is one of the more challenging bearings for modeling propagation loss andreverberation. The bathymetry along this bearing is shown in Figure 20 together withseveral depth profiles. To the north (left) of the 115◦ line the bottom is sloping away fromthe ridge and depth increases with range. To the south (right), depth is constant in thefirst 0.5 km; at longer ranges it decreases quickly from 40 to 20 m and varies slightly overthe ridge. It should be noted that on bearing 110◦ and greater the bathymetry data waslimited to ranges less than 1.75 km from the sonar and in this region water depth was setto 30 m for modeling purposes.
Using Figure 2 as a guide, the bottom to the north of the 115◦ bearing line was assumedto be mud. Similarly, in the first 0.5 km to the south of the bearing line, the bottomtype was set to mud. The sediment on top of the ridge is gravel with mud patches in thedepressions, [8]. Since exact distribution of the sediment is unknown, the ridge was assumedto be covered completely with gravel. In light of the results of section 4.3.2, the scatteringstrengths of gravel and mud were set to −15 and −50 dB re m2, respectively; the scatteringstrengths were assumed independent of the grazing angle.
Since the bathymetry and bottom composition vary across the sonar beam along the 115◦
bearing, the significant rays in the left and right halves of the beam are expected to bedifferent. To the north of the 115◦ bearing line, the bottom slopes away from the sonarand propagation conditions are similar to those on bearing 090◦ shown in Figures 10 and11. In this region, surface scattering is the dominant reverberation component for rangesless 1.5 km; at longer ranges the bottom scattering dominates. The significant rays in theregion to the south of the 115◦ bearing line are similar to those on bearing 120◦ shownin the same figures. For a high loss surface, such as on March 11 when the reverberationmeasurements were made, the reverberation at short and intermediate ranges (0–0.5 kmand 0.8–1.6 km) was dominated by the surface scattering. At other ranges, scattering fromthe slopes of the gravel ridge was the primary reverberation component.
Figure 21 compares the measured and modeled reverberation on bearing 115◦. When thesurface and gravel scattering strengths were set to −25 and −15 dB re m2, as per sections4.3.1 and 4.3.2, the agreement between the measurements and predictions was satisfactory.In contrast, if the scattering strengths were reduced by switching to the default APL-UWmodels in [1], the predictions underestimated the observed values.
Finally, it should be noted that modeled reverberation underestimates the measurementsat 24 kHz for ranges less than 0.5 km; this discrepancy is not present in the 39 kHz data.Since the Seahorse horizontal beams are almost twice as wide at 20 kHz as at 40 kHz (seeFigure 12) at lower frequencies the sonar illuminates the north slope of the gravel ridgeimmediately south of the sonar. As a result reverberation at 24 kHz could exceed that at39 kHz because at short ranges reverberation at lower frequencies is dominated by scatteringfrom the gravel rather than the sea surface. Furthermore, it is possible that the bottomto the south of the sonar consists of a thin layer of mud overlaying the gravel. At lowerfrequencies the sound can propagate deeper into the mud, scatter off the gravel and increasethe observed reverberation levels.
30 DRDC Atlantic TM 2007-249
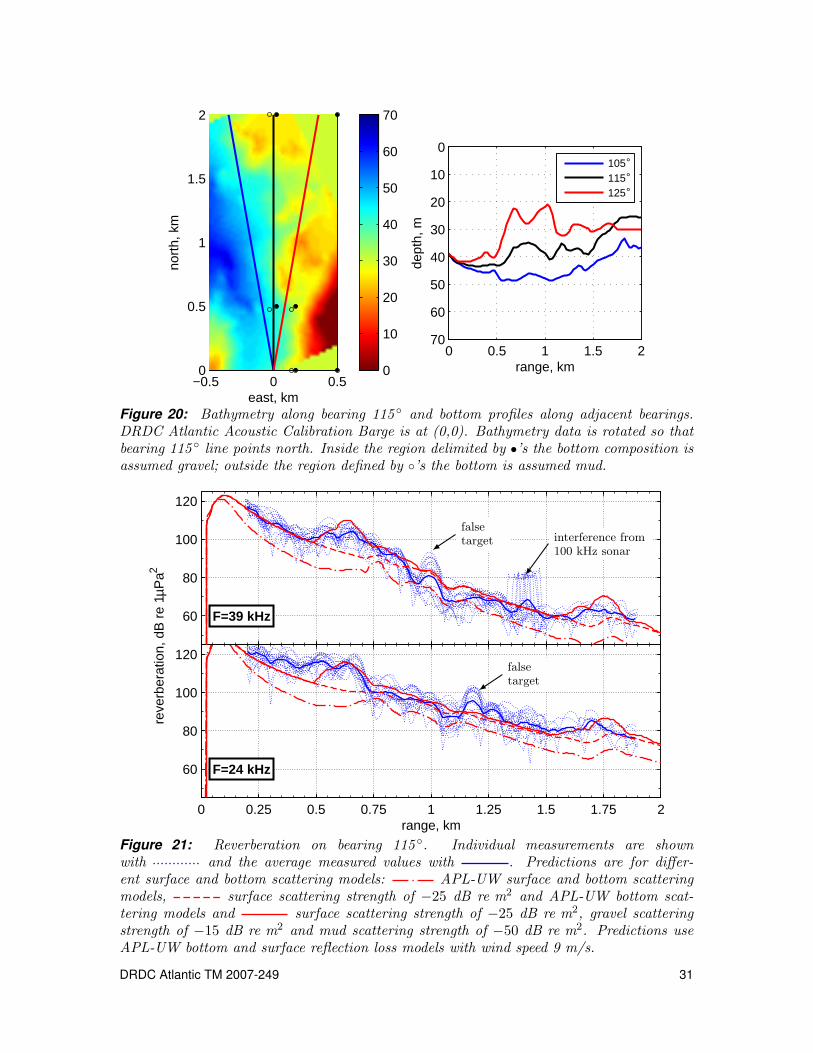
0 0.5 1 1.5 2
0
10
20
30
40
50
60
70
range, km
dept
h, m
105°115°125°
−0.5 0 0.50
0.5
1
1.5
2
east, km
nort
h, k
m
0
10
20
30
40
50
60
70
Figure 20: Bathymetry along bearing 115 ◦ and bottom profiles along adjacent bearings.DRDC Atlantic Acoustic Calibration Barge is at (0,0). Bathymetry data is rotated so thatbearing 115 ◦ line points north. Inside the region delimited by •’s the bottom composition isassumed gravel; outside the region defined by ◦’s the bottom is assumed mud.
0 0.25 0.5 0.75 1 1.25 1.5 1.75 2
60
80
100
120
F=24 kHz
range, km
60
80
100
120
F=39 kHz
reve
rber
atio
n, d
B r
e 1µ
Pa2
interference from100 kHz sonar
falsetarget
falsetarget
Figure 21: Reverberation on bearing 115 ◦. Individual measurements are shownwith and the average measured values with . Predictions are for differ-ent surface and bottom scattering models: APL-UW surface and bottom scatteringmodels, surface scattering strength of −25 dB re m2 and APL-UW bottom scat-tering models and surface scattering strength of −25 dB re m2, gravel scatteringstrength of −15 dB re m2 and mud scattering strength of −50 dB re m2. Predictions useAPL-UW bottom and surface reflection loss models with wind speed 9 m/s.
DRDC Atlantic TM 2007-249 31
5 Summary
This report presented analysis of the reverberation and propagation loss measurementscollected during the HMCS CHARLOTTETOWN acoustic target strength trial, [13], andtwo supporting propagation loss experiments in the Bedford Basin in February–March 2004.The measurements were made over the frequency range 20 to 40 kHz. The propagationmeasurements were modeled using two underwater acoustic models, CASS-GRAB, [4], andGSM-MULTIP, [14], and the reverberation was modeled using only CASS-GRAB. Thedependence of the propagation loss and reverberation on the wind speed and the bottomcharacteristics of the Bedford Basin was investigated.
The propagation loss measurements presented in this report were collected on February25 and March 10 while the reverberation measurements were obtained on March 10 and11, 2004. The sound velocity structure was nearly identical on these dates but the windconditions were different. Unfortunately, no in-situ wind measurements were made and windspeed estimates were based on the hourly averages from an Environment Canada weatherstation about 15 km away from the DRDC Atlantic Acoustic Calibration Barge. The windspeed estimates from the station do not always represent accurately the conditions in theBedford Basin; nevertheless, we estimate that the propagation loss measurements weremade in 4 m/s and 9 m/s winds while the reverberation was measured for 5–9 m/s winds.
The propagation measurements indicate that the transmission losses increased with windspeed. This is consistent with the APL-UW surface reflection model, [1], that predicts largesurface losses in strong winds due to attenuation of sound by the wind-generated sub-surfacebubble layer. The reverberation measurements did not exhibit any pronounced dependenceon wind speed. The APL-UW model for surface scattering, which depends on the densityof sub-surface bubble layer, predicts saturation for winds greater than 9 m/s, at least foropen water conditions. We did not observe an increase in reverberation with wind speed,so it would appear that the saturation conditions in the Basin were reached at a lower windspeed than predicted by the model. Further measurements with more rigorous collection ofsupporting environmental data are needed to address this issue.
The CASS-GRAB modeling of propagation loss indicated that the bathymetry and bottomcomposition of the Bedford Basin have a significant impact on the propagation loss. Al-though no propagation measurements were taken on bearings other than 075◦ to supportthe modeling, reverberation measurements were made along a number of bearings and theysupported the bearing dependent propagation model. For sources located on the DRDCAtlantic Acoustic Calibration Barge, the most favorable bearing for sound propagation was090◦ where the depth increases away from the Barge. Even though the bottom is soft mudwith very high reflection loss, the sloping bottom allowed the existence of deep refractingsound paths created by the sound velocity conditions in late February – middle of March2004. The deep refracted rays existed only on bearings near 090◦ and caused a 3–8 dBdecrease in the propagation loss when compared to other bearings.
Along bearings sufficiently away from 090◦ (for example, 030◦ and 115◦) rises in thebathymetry were predicted to cut off the deep refracting paths which resulted in increased
32 DRDC Atlantic TM 2007-249
propagation loss. On these bearings, the bottom composition affected propagation, al-though the magnitude of the effect was tempered by the surface conditions. If bottomreflected paths were not cut off by high surface losses, then the lower loss bottom generatedlower propagation losses over significant ranges. If surface losses were high the reducedpropagation loss due to bottom interacting ray paths was range limited. In the Basin theshoal areas are generally gravel with low reflection loss and high scattering strength, whereasdeeper portions are mud with high reflection loss and low scattering strength. The longestgravel bottomed paths from the Barge are along 115–125◦ bearing lines which transit theridge separating the Bedford Basin from Fairview Cove. It was along these bearings thatthe bottom type had the greatest effect on the propagation loss.
In general the propagation loss and reverberation measurements agreed well with the CASS-GRAB predictions, with some adjustments to the boundary scattering characteristics ofthe APL-UW models, [1], which are resident in CASS-GRAB. To obtain good agreementbetween the modeled reverberation and measurements it was found necessary to set thesurface scattering strength to −25 dB re m2 for grazing angles 1.5–7◦. This value is5–8 dB higher than the scattering strength predicted by the APL-UW model for 7 m/swinds. Similarly, the seabed scattering strength of the gravel regions was increased by10 dB from −25 dB re m2 to −15 dB re m2 for grazing angles 10–15◦. These changes tothe scattering strengths are within the expected model errors stated in the reference. Noadjustment was required for the surface and bottom reflection parameters defined in theAPL-UW models document.
Although CASS-GRAB modeling compared well with the measurements of the propagationloss and reverberation, the propagation loss predictions did not yield reasonable estimatesof the ship target strength which were the major focus of trials on March 10–11, 2004. Inparticular the target strength estimates derived from the CASS-GRAB predictions weretoo high and range dependent. For the purpose of the target strength trial, a parametricfit to the propagation loss was constructed with the Multipath Expansion Eigenray Modelin the Generic Sonar Model (GSM-MULTIP). Use of this propagation loss model yieldedrange-independent target strength with reasonable values. The apparent failure of theCASS-GRAB predictions to yield reasonable target strength estimates while agreeing wellwith both the reverberation and propagation measurements is puzzling and requires furtherinvestigation.
The detailed data analysis that was performed in the preparation of this report led to anumber of recommendations for future propagation and reverberation trials. In particular,the method used to collect the data during the propagation loss experiments requires im-provement. In the trial the propagation loss was sampled at discrete points rather thancontinuously due to constraints posed by the shallow depth of the hydrophones and dutycycle of the Low Frequency MMPP projector. Time constraints did not allow for prepara-tion of a vertically towed receiving system and the propagation loss had to be sampled atdiscrete points with stationary receivers. However if a towed receiving system were avail-able along with a projector with a 100% duty cycle, continuously sampling the propagationloss would have accelerated the data collection, permitted sampling of the propagation lossalong multiple bearings, and yielded more information on the variation of propagation losswith range.
DRDC Atlantic TM 2007-249 33
In addition to using an experimental set-up that would allow continuous sampling of thetransmission loss as a function of range, a number of other improvements should be pursuedin the future trials. An in-situ continuous recording of the wind speed and direction shouldbe performed. Sound velocity, temperature, and salinity profiles should be measured atseveral ranges and bearings throughout the experiment. Finally reverberation should bemeasured along several bearings, corresponding to the propagation loss bearings. Bothreverberation and propagation measurements should be made at approximately the sametime for several wind speeds.
References
[1] Applied Physics Laboratory University of Washington (1994), APL-UWHigh-Frequency Ocean Environmental Acoustic Models Handbook, (TechnicalReport APL-UW TR 9407, AEAS 9501) Applied Physics Laboratory University ofWashington, Seattle, Washington.
[2] Seyan, R. (2003), Transmission Loss in Bedford Basin, DRDC Atlantic StudentReport.
[3] National Climate Data and Information Archive (online), Environment Canada,www.climate.weatheroffice.ec.gc.ca (Access Date: March 2007).
[4] Weinberg, H. (2004), CASS V4.0 User’s Manual, Anteon International Corporation.
[5] Urick, R. J (1975), Principles of Underwater Sound, 2 ed, McGraw-Hill, Inc.
[6] Lovett, J. R. (1980), Geographic Variation Of Low-Frequency Sound Absoption Inthe Atlantic, Indian, and Pacific Oceans, J. Acoust. Soc. Am., 67(1), 338–340.
[7] Crawford, A. (2006), Private Communication.
[8] Fader, G. B., O., Miller R., and S., Pecore S. (1990), The Marine Geology of HalifaxHarbour and Adjacent Areas, (Open File 2384) Geological Survery of Canada.
[9] Agnes, M., (Ed.) (2000), Webster’s New World College Dictionary, 4 ed, IDG BooksWorldwide, Inc.
[10] McDaniel, S. T. (1993), Sea Surface Reverberation: A Review, J. Acoust. Soc. Am.,94(4), 1905–1922.
[11] Fleming, R. (2006), Low Frequency Muli-Mode Pipe Projector, (DRDC Atlantic TM2006-248) Defence R&D Canada – Atlantic.
[12] Chang, D. (2001), Final Report On the Port Of Signal Processing Software To Linux,(DREA/CR/2001-108) Defence R&D Canada – Atlantic.
[13] Collier, A. J. and Vasiliev, B., HALIFAX Class Target Strength at TorpedoFrequencies, (in preparation) Defence R&D Canada – Atlantic.
34 DRDC Atlantic TM 2007-249
[14] Weinberg, H. (1985), Generic Sonar Model, (Technical Report NUSC TechnicalDocument 59710) Naval Underwater Systems Center, Newport, RI.
[15] Hines, P. C., Hutton, J. S., and Collier, A. J. (1993), A Free-Floating, Steerable, HFSonar for Environmental Measurements, In Proceedings of IEEE OCEANS’93,pp. II/65–II/70.
[16] Osler, J. (2007). Private Communication.
[17] McDaniel, S. T. (1988), Acoustical Estimates of Subsurface Bubble Densities In theOpen Ocean and Coastal Waters, In Kerman, B. R., (Ed.), Sea Surface SoundNatural Mechanisms of Surface Generated Noise in the Ocean, NATO ASI Series,pp. 225–236, Kluwer Academic Publishers.
DRDC Atlantic TM 2007-249 35

This page intentionally left blank.
36 DRDC Atlantic TM 2007-249
Annex A: Basic Definitions
This annex presents basic definitions of the propagation loss and reverberation and describesthe environmental parameters that affect them. A thorough review of the propagation lossand reverberation can be found in [5].
A.1 Propagation Loss
Propagation loss describes quantitatively the attenuation of sound as it propagates fromthe sonar. If the intensity of sound 1 m away from the sonar is I1 m and at range r it is Ir
then the transmission loss at range r is
TL(r) = 10 logIr
I1 m= RL− SL (A.1)
where SL = 10 log I1m/Iref is the sonar source level and RL = 10 log Ir/Iref is the receivedsignal level. The units of intensity are W/m2 while the sound levels are computed relativeto the intensity of a sound wave with root-mean-square (rms) pressure of 1 µPa, Iref =0.65× 10⁻¹⁸ W/m2. In this definition, the transmission loss is a dimensionless quantity.
The transmission loss depends strongly on the environment where the sound propagates. Ingeneral, the loss can be separated into the losses due to sound spreading, volume attenuationand boundary reflections. The spreading losses are determined by the sound velocity profile;usually they are evaluated with underwater acoustic prediction models, for example CASS-GRAB, [4].
Volume attenuation loss describes the absorption of the sound energy by seawater caused bywater viscosity and relaxation of magnesium sulfate and boric acid molecules in the water.Volume attenuation loss is proportional to the distance between the source and receiverand the proportionality constant is called the volume attenuation coefficient. The units ofthe coefficient are dB/km. It depends on receiver depth, sound frequency as well as watertemperature, salinity and acidity (or pH value).
Sound propagating through the water is reflected from the sea surface and bottom and eachinteraction with the sea boundaries reduces sound intensity. The reduction is called eitherthe surface reflection loss or bottom reflection loss and it is expressed in dB/reflection. Thesurface reflection loss depends on the sea-surface conditions and it is a function of windspeed, fetch, proximity to land masses and frequency. The bottom reflection coefficientdepends on the bottom composition and frequency only.
Propagation loss is also affected by the vertical beam pattern of the sonar. For example,a narrow vertical beam may reduce the contribution of some propagation paths (or eigen-rays) to the total sound energy measured with the hydrophone. The effect that the verticalbeam pattern has on the propagation loss depends on the sound velocity profile and it isusually taken into account by the acoustic prediction models.
DRDC Atlantic TM 2007-249 37
A.2 Reverberation
Reverberation is the scattering of active sonar pings from the sea surface, sea bottom andinhomogeneities in the water column. If a sonar ping is transmitted at time t = 0, then ata later time t the reverberation level is
RV = 10 logIs + Ib + Iv
Iref= 10 log
(100.1RVs + 100.1RVb + 100.1RVv
)(A.2)
where Is, Ib and Iv are the intensities of the sound scattered from the sea-surface, seabedand water column and RVs, RVb and RVv are the corresponding surface, bottom and volumereverberation levels. The levels are computed relative to the intensity of a sound wave withroot-mean-square pressure of 1 µPa (see Section A.1).
The reverberation at time t is due to scattering from the boundary or volume elements atrange r = c t/2 where c ≈ 1500 m/s is the sound speed in water. In particular for a CWping,
RVs(t) = SL + 2 TLs(r) + 10 log(r ΘH
c τ
2
)+ SSs (A.3)
RVb(t) = SL + 2 TLb(r) + 10 log(r ΘH
c τ
2
)+ SSb (A.4)
RVv(t) = SL + 2 TLv(r) + 10 log(r ΘH
c τ
2H
)+ SSv (A.5)
where SL is the sonar source level in dB re 1 µPa @ 1 m and TLs,b,v is the transmissionloss between the sonar and surface, bottom or volume scattering elements. The third termof the equations specifies the area or volume insonified by the sonar ping. In this term, ΘH
is the horizontal sonar beam width in radians, τ is the sonar pulse length in seconds andH is the water depth in meters. The final term in each equation is the scattering strengthper unit area or volume.
The scattering strengths specify the energy that is scattered back towards the sonar perunit area of the insonified sea surface or seabed, or per unit volume of the water column.If the incident sound intensity is Ii and the scattered intensity reduced to 1 m away fromthe center of the scattering element is I1m, then the scattering strength is
SSs,b = 10 logI1m/As,b
Iior SSv = 10 log
I1m/V
Ii(A.6)
where As,b and V are surface and bottom areas or volume illuminated by the ping. Unitsof the surface and bottom scattering strengths, SSs and SSb, are dB re m2 while volumescattering strength, SSv, has units dB re m3. Surface scattering strength depends on windspeed, grazing angle and sound frequency. Bottom scattering strength depends on theseabed composition, grazing angle and frequency. Finally, volume scattering strength isdetermined primarily by the presence of the marine life in the water column and also varieswith frequency.
38 DRDC Atlantic TM 2007-249
Distribution list
DRDC Atlantic TM 2007-249
Internal distribution
1 A. Collier
1 B. Vasiliev
1 H/Sig
1 V. Crowe
1 D. Ellis
1 P. Hines
1 D. Hutt
1 J. Osler
1 S. Pecknold
1 M. Seto
1 M. Trevorrow
3 Library
Total internal copies: 14
External distribution
1 Attn: P. SaundersN02OR MARLANT HQHalifax, NS
1 ADM (S&T)/DRDKIM 3NDHQ305 Rideau StreetOttawa, ONK1A 0K2
Total external copies: 2
Total copies: 16
DRDC Atlantic TM 2007-249 39

This page intentionally left blank.
40 DRDC Atlantic TM 2007-249
DOCUMENT CONTROL DATA(Security classification of title, body of abstract and indexing annotation must be entered when document is classified)
1. ORIGINATOR (the name and address of the organization preparing thedocument. Organizations for whom the document was prepared, e.g. Centresponsoring a contractor’s report, or tasking agency, are entered in section 8.)
Defence R&D Canada – AtlanticP.O. Box 1012, Dartmouth, Nova Scotia, CanadaB2Y 3Z7
2. SECURITY CLASSIFICATION(overall security classification of thedocument including special warning terms ifapplicable).
UNCLASSIFIED
3. TITLE (the complete document title as indicated on the title page. Its classification should be indicated by the appropriateabbreviation (S,C,R or U) in parentheses after the title).
High Frequency Propagation Loss and Reverberation in Bedford Basin
4. AUTHORS (last name, first name, middle initial)
Vasiliev, B.; Collier, A.J.
5. DATE OF PUBLICATION (month and year of publication ofdocument)
October 2007
6a. NO. OF PAGES (totalcontaining information.Include Annexes,Appendices, etc).
52
6b. NO. OF REFS (totalcited in document)
17
7. DESCRIPTIVE NOTES (the category of the document, e.g. technical report, technical note or memorandum. If appropriate, enter thetype of report, e.g. interim, progress, summary, annual or final. Give the inclusive dates when a specific reporting period is covered).
Technical Memorandum
8. SPONSORING ACTIVITY (the name of the department project office or laboratory sponsoring the research and development.Include address).
Defence R&D Canada – AtlanticP.O. Box 1012, Dartmouth, Nova Scotia, Canada B2Y 3Z7
9a. PROJECT NO. (the applicable research and developmentproject number under which the document was written.Specify whether project).
11gs
9b. GRANT OR CONTRACT NO. (if appropriate, the applicablenumber under which the document was written).
10a. ORIGINATOR’S DOCUMENT NUMBER (the officialdocument number by which the document is identified by theoriginating activity. This number must be unique.)
DRDC Atlantic TM 2007-249
10b. OTHER DOCUMENT NOs. (Any other numbers which maybe assigned this document either by the originator or by thesponsor.)
11. DOCUMENT AVAILABILITY (any limitations on further dissemination of the document, other than those imposed by securityclassification)( X ) Unlimited distribution( ) Defence departments and defence contractors; further distribution only as approved( ) Defence departments and Canadian defence contractors; further distribution only as approved( ) Government departments and agencies; further distribution only as approved( ) Defence departments; further distribution only as approved( ) Other (please specify):
12. DOCUMENT ANNOUNCEMENT (any limitation to the bibliographic announcement of this document. This will normally correspondto the Document Availability (11). However, where further distribution beyond the audience specified in (11) is possible, a widerannouncement audience may be selected).
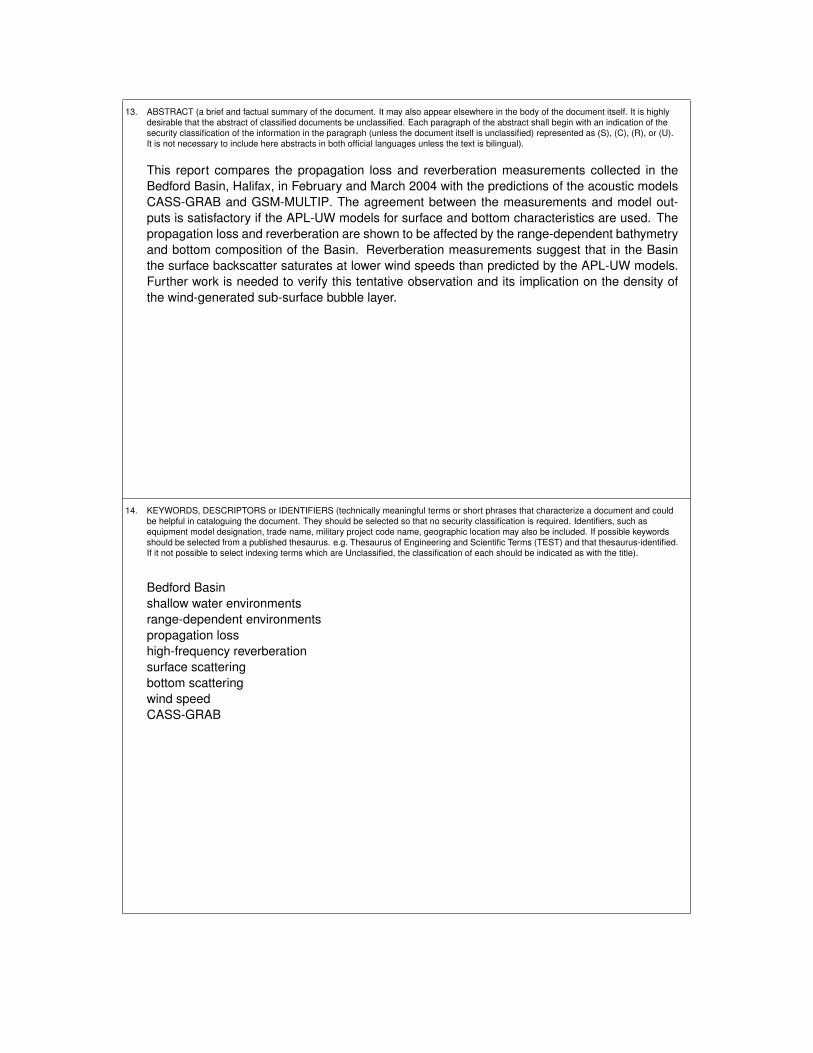
13. ABSTRACT (a brief and factual summary of the document. It may also appear elsewhere in the body of the document itself. It is highlydesirable that the abstract of classified documents be unclassified. Each paragraph of the abstract shall begin with an indication of thesecurity classification of the information in the paragraph (unless the document itself is unclassified) represented as (S), (C), (R), or (U).It is not necessary to include here abstracts in both official languages unless the text is bilingual).
This report compares the propagation loss and reverberation measurements collected in theBedford Basin, Halifax, in February and March 2004 with the predictions of the acoustic modelsCASS-GRAB and GSM-MULTIP. The agreement between the measurements and model out-puts is satisfactory if the APL-UW models for surface and bottom characteristics are used. Thepropagation loss and reverberation are shown to be affected by the range-dependent bathymetryand bottom composition of the Basin. Reverberation measurements suggest that in the Basinthe surface backscatter saturates at lower wind speeds than predicted by the APL-UW models.Further work is needed to verify this tentative observation and its implication on the density ofthe wind-generated sub-surface bubble layer.
14. KEYWORDS, DESCRIPTORS or IDENTIFIERS (technically meaningful terms or short phrases that characterize a document and couldbe helpful in cataloguing the document. They should be selected so that no security classification is required. Identifiers, such asequipment model designation, trade name, military project code name, geographic location may also be included. If possible keywordsshould be selected from a published thesaurus. e.g. Thesaurus of Engineering and Scientific Terms (TEST) and that thesaurus-identified.If it not possible to select indexing terms which are Unclassified, the classification of each should be indicated as with the title).
Bedford Basinshallow water environmentsrange-dependent environmentspropagation losshigh-frequency reverberationsurface scatteringbottom scatteringwind speedCASS-GRAB

This page intentionally left blank.