Embed Size (px)
DESCRIPTION
High-Frequency Dynamics in PEG+H 2 O System Mikołaj Pochylski Adam Mickiewicz University (UAM) Department of Physics, Poznań, Poland. Poznań. Poznań. Adam Mickiewicz University. Adam Mickiewicz University in numbers: 400 years of tradition 14 departments - PowerPoint PPT Presentation
Citation preview

High-Frequency Dynamics in High-Frequency Dynamics in PEG+HPEG+H22O SystemO System
Mikołaj Pochylski
Adam Mickiewicz University (UAM)Department of Physics,
Poznań, Poland

PoznańPoznań

PoznańPoznań
Adam Mickiewicz UniversityAdam Mickiewicz University
Adam Mickiewicz University in numbers:
400 years of tradition
14 departments
5000 employees (2700 academic teachers)
55 000 students

University Campus - Department of PhysicsUniversity Campus - Department of Physics
OutlineOutline
• PolyEthylene Glycol – PEGPolyEthylene Glycol – PEG
• Brillouin Light ScatteringBrillouin Light Scattering
• Relaxation processRelaxation process– Visco–elasticity– Relaxation functions
• Results for PEG+HResults for PEG+H22O system:O system:
– Temperature analysis– Frequency analysis– Comparison with dielectric results
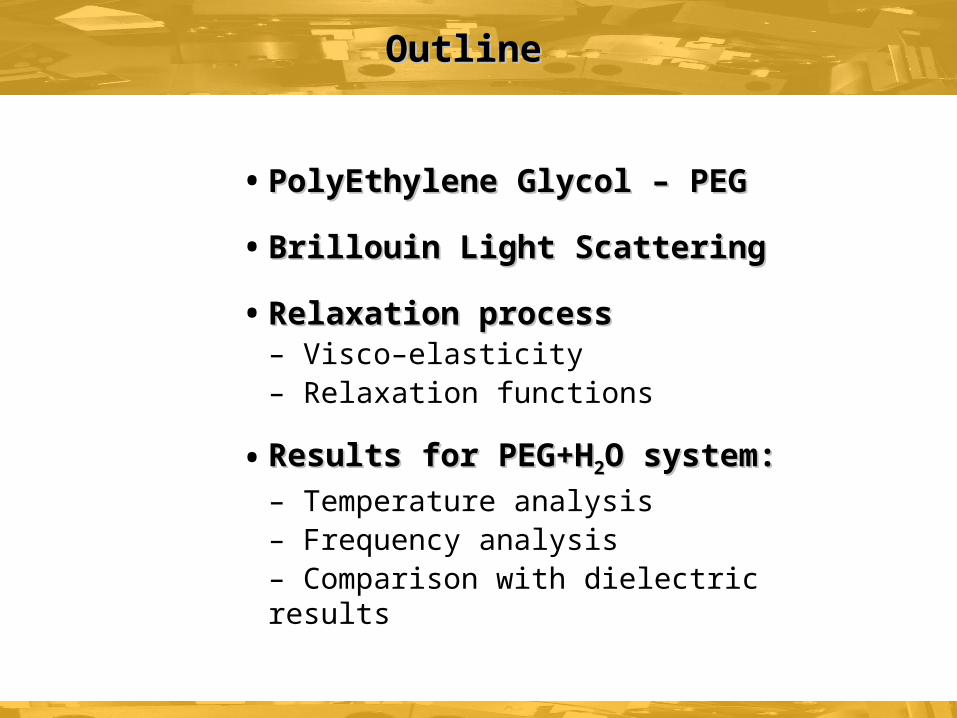
PolyEthylene Glycol - PEGPolyEthylene Glycol - PEG
OH-(CH2-CH2-O)n-H
PEG600(n=13)

PolyEthylene Glycol - PEGPolyEthylene Glycol - PEG
General properties:Non-toxic, flexible, hydrophilic (amphiphilic)
Application examples:• Separation, purification and fusion of biomolecules and cells,• Hydrophilic moiety in nonionic surfactants,• Matrix for ion conducting polymer electrolytes, • Coating of implants and ship hulls• ...
Industry fields:Biomedical, Pharmaceutical, Cosmetics, Textile, Paints, Food ...

PolyEthylene Glycol - PEGPolyEthylene Glycol - PEG
hydroxyl group
ether group

Light scatteringLight scattering
dtetqqqS ti
),()0,(2
1),(
( , ) ( , )I q S q
Dynamic structure factorDynamic structure factor
(shape of the spectrum)(shape of the spectrum)),(),( 0 trtr
– Dielectric constant fluctuations
),(),( trtrT
– density fluctuations

( , ) ?q t
0
2 22 2 2
0
2
0
0
0
( 1)0
S P SL
TP
t
v vT
t
T D Tt t
Linearized hydrodynamic equations for viscous fluid
)0,(),( qtq ),( qS
FT
Light scatteringLight scattering

Spectrum of scattered lightSpectrum of scattered light
2 2 2 2 2 2 2 2
2 2 2 2
2
2 2 2
2 2 2 2 2 2
0
2 2 2
2
2
1
( , )
1
1
(
( )
) ( )
( )
11
( )
B B B
B B
B B B
T
T
BB
B B B B B B B B
B T
B B B
S q
VD q
qk T
D
Frequency
Inten
sity
B
2 B

Brillouin Light ScatteringBrillouin Light Scattering
B Bv q Brillouin Frequency Shift

0
1.5
532
2000 /
90
B
n
nm
v m s
/ 2 8B GHz
Brillouin Light ScatteringBrillouin Light Scattering
B Bv q
21
2B L q
4sin( / 2)
nq q
Scattering Wave Vector:Brillouin Shift:(velocity of soundwave)
Brillouin Linewidth (HWHM):(attenuation of soundwave)
( 4 / 3 ) /L V S Kinematic longitudinal viscosity
Normalized attenuation
coefficient - /f2
Hypersound velocity - vB q
v BB
2 2
2 B
B Bf v
Acoustical parameters:
Brillouin Spectroscopy:
extension of Ultrasonic Spectroscopy for GHz
frequencies

Brillouin Light ScatteringBrillouin Light Scattering
Longitudinal Modulus, M:
Describes mechanical response of a medium (induced stress) subjected to longitudinal deformation
stress M deformation

Brillouin Light ScatteringBrillouin Light Scattering
Loss modulus – M”
Accumulation modulus – M’
Complex longitudinal modulus components:
2
BMq
2 B
B
M M
Normalized attenuation
coefficient - /f2
Hypersound velocity - vB
Acoustical parameters:
B
Mv
2
2
2
B B
M
f v M

Fabry-Perot SpectrometerFabry-Perot Spectrometer

3
7 1
100 0.1[ ]
1200[ / ]
3.5 10 [ ]
S cP Pa s
kg m
q m
2
2
1
24
433
2
3
B L
V SS
L
SB
q
q
2 140 !!!B GHz
Brillouin Light ScatteringBrillouin Light Scattering
2 3B GHz
/ 2 10B GHz

exp( / )t – Relaxation time
Visco-elasticityVisco-elasticity
( ); ( )L L M M

B
1B
[ ]B GHz
[ ]B ps
Peak conditionPeak condition
RelaxationRelaxation
0( )1
M MM i M
i
Debye relaxation functionDebye relaxation function
B
( )BM
( )BM

Results – PEG600Results – PEG600
vB , /f2
M’ , M”
Brillouin spectra for pure PEG600 at different temperatures
B , B
No
rmal
ized
in
ten
sity
Frequency shift [GHz]
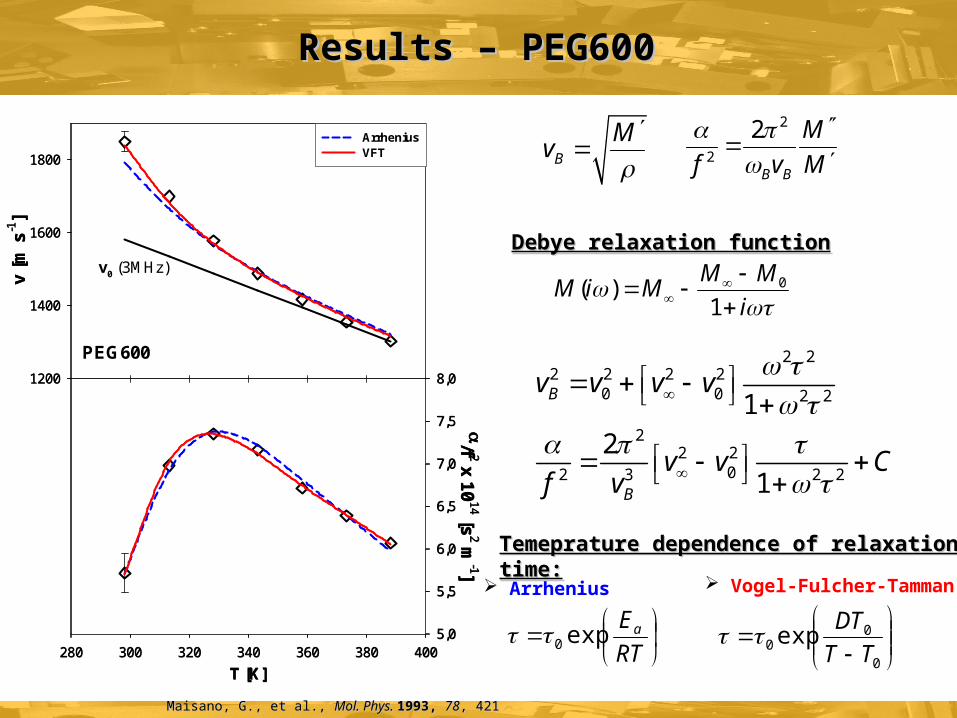
PEG600
v [m
s-1
]
1200
1400
1600
1800
T [K]280 300 320 340 360 380 400
/f 2 x 10
14 [s
2 m-1]
5,0
5,5
6,0
6,5
7,0
7,5
8,0
0( )1
M MM i M
i
Debye relaxation functionDebye relaxation function
B
Mv
2
2
2
B B
M
f v M
2 22 2 2 2
0 0 2 2
22 2
02 3 2 2
1
2
1
B
B
v v v v
v v Cf v
Vogel-Fulcher-Tamman
RT
Eaexp0
Arrhenius
0
00 exp TT
DT
Temeprature dependence of relaxation time:Temeprature dependence of relaxation time:
Results – PEG600Results – PEG600
PEG600
v [m
s-1
]
1200
1400
1600
1800
ArrheniusVFT
T [K]280 300 320 340 360 380 400
/f 2 x 10
14 [s2 m
-1]
5,0
5,5
6,0
6,5
7,0
7,5
8,0
v0 (3MHz)
Maisano, G.Maisano, G., et al.,, et al., Mol. Phys. Mol. Phys. 1993, 1993, 7878, 421, 421

Relaxation in complex liquidsRelaxation in complex liquids
Vogel-Fulcher-Tamman
0 expaE
RT
Arrhenius
0
00 exp TT
DT

ResultsResultsTemperature experiment for PEG400 solutionsTemperature experiment for PEG400 solutions
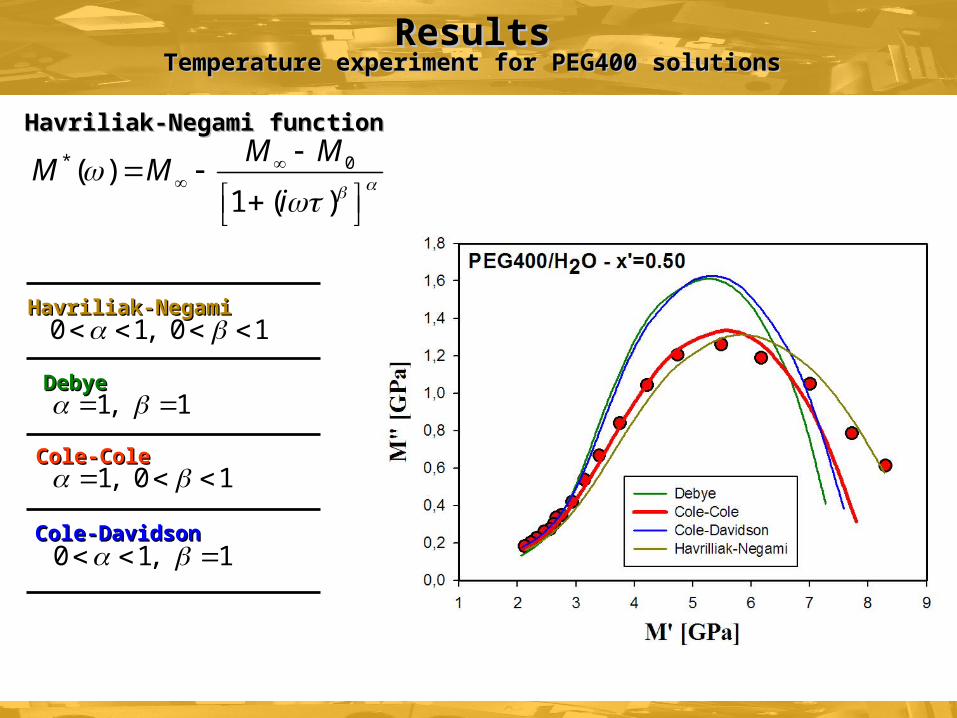
* 0( )1 ( )
M MM M
i
Havriliak-Negami functionHavriliak-Negami function
0 1, 0 1 Havriliak-NegamiHavriliak-Negami
DebyeDebye
Cole-ColeCole-Cole
Cole-DavidsonCole-Davidson
1, 1
1, 0 1
0 1, 1
ResultsResultsTemperature experiment for PEG400 solutionsTemperature experiment for PEG400 solutions

0( )1 ( ) CC
M MM i M
i
Vogel-Fulcher-TammanVogel-Fulcher-Tamman
00
0
( ) expDT
TT T
Cole-Cole functionCole-Cole function
ResultsResultsTemperature experiment for PEG400 solutionsTemperature experiment for PEG400 solutions

Brillouin Light ScatteringBrillouin Light ScatteringFull Spectrum AnalysisFull Spectrum Analysis
0
2 22 2
( )( , )
/ ( ) ( )
I MS q
q M M
Havriliak-Negami functionHavriliak-Negami function
Dynamic structure factor
0( )
1
M MM i M
i

Full Spectrum Analysis – PEG600Full Spectrum Analysis – PEG600
Debye relaxationDebye relaxation
Poor quality of fit: presence of the distribution
of relaxation times
More complicated relaxation function is needed
0( )1
M MM i M
i

Cole-Davidson Cole-Davidson relaxation functionrelaxation function
0( )
1 CD
CD
M MM i M
i
Full Spectrum Analysis – PEG600Full Spectrum Analysis – PEG600

Full Spectrum Analysis – PEG400Full Spectrum Analysis – PEG400

Havriliak-NegamiHavriliak-Negami
and taken directly from
dielectric experiment
0( )
1 B
J JJ i J
i
( ) 1/ ( )J i M i
T. Sato, T. Sato, et al.,et al., J. Chem. Phys.J. Chem. Phys. 1998, 108, 4138 1998, 108, 4138
Debye relaxationDebye relaxation
Full Spectrum Analysis – PEG400Full Spectrum Analysis – PEG400
Modulus expressed in terms of
the Longitudinal Compliance, J
(Havriliak-Negami function)

Relaxation times vs PEG concentrationRelaxation times vs PEG concentrationcomparison with Dielectric Spectroscopy resultscomparison with Dielectric Spectroscopy results
[1] M. Pochylski et al., [1] M. Pochylski et al., J.Phys. Chem. BJ.Phys. Chem. B 20062006, 110, 20533, 110, 20533[2] T. Sato et al, [2] T. Sato et al, J.Chem.Phys.J.Chem.Phys. 19981998, 108, 4138, 108, 4138[3] N. Shinyashiki et al, [3] N. Shinyashiki et al, J.Chem.Phys.J.Chem.Phys. 19901990, 93, 760, 93, 760[4] C.H. Wang et al., [4] C.H. Wang et al., J. Non-Cryst. SolidsJ. Non-Cryst. Solids 19911991, 131, 970., 131, 970.[5] T. Noudou et al., [5] T. Noudou et al., Jpn. J. Appl. Phys.Jpn. J. Appl. Phys. 19961996, 35, 2944., 35, 2944.

PEG282, x’=0.42
DVFT = 7.6
PEG400, x’=0.50
DVFT = 7.2
[1] Murthy, S.S.N. et al., [1] Murthy, S.S.N. et al., J. Phys. Chem. BJ. Phys. Chem. B 2000, 104, 6955 2000, 104, 6955[2] Sudo, S. et al., [2] Sudo, S. et al., J. Chem. Phys. J. Chem. Phys. 2004, 121, 73322004, 121, 7332
Relaxation times vs TemperatureRelaxation times vs Temperaturecomparison with Dielectric Spectroscopy resultscomparison with Dielectric Spectroscopy results

Thanks for Your Thanks for Your Attention !Attention !