Embed Size (px)
Citation preview

High-entropy alloychallenges and prospectsYe, Y.F.; Wang, Q.; Lu, J.; Liu, C.T.; Yang, Y.
Published in:Materials Today
Published: 01/07/2016
Document Version:Final Published version, also known as Publisher’s PDF, Publisher’s Final version or Version of Record
License:CC BY-NC-ND
Publication record in CityU Scholars:Go to record
Published version (DOI):10.1016/j.mattod.2015.11.026
Publication details:Ye, Y. F., Wang, Q., Lu, J., Liu, C. T., & Yang, Y. (2016). High-entropy alloy: challenges and prospects.Materials Today, 19(6), 349-362. https://doi.org/10.1016/j.mattod.2015.11.026
Citing this paperPlease note that where the full-text provided on CityU Scholars is the Post-print version (also known as Accepted AuthorManuscript, Peer-reviewed or Author Final version), it may differ from the Final Published version. When citing, ensure thatyou check and use the publisher's definitive version for pagination and other details.
General rightsCopyright for the publications made accessible via the CityU Scholars portal is retained by the author(s) and/or othercopyright owners and it is a condition of accessing these publications that users recognise and abide by the legalrequirements associated with these rights. Users may not further distribute the material or use it for any profit-making activityor commercial gain.Publisher permissionPermission for previously published items are in accordance with publisher's copyright policies sourced from the SHERPARoMEO database. Links to full text versions (either Published or Post-print) are only available if corresponding publishersallow open access.
Take down policyContact [email protected] if you believe that this document breaches copyright and provide us with details. We willremove access to the work immediately and investigate your claim.
Download date: 25/10/2021
RESEARCH:Review
Materials Today � Volume 19, Number 6 � July/August 2016 RESEARCH
High-entropy alloy: challenges andprospectsY.F. Ye, Q. Wang, J. Lu, C.T. Liu and Y. Yang*
Centre for Advanced Structural Materials, Department of Mechanical and Biomedical Engineering, City University of Hong Kong, Tat Chee Avenue, Kowloon Tong,
Kowloon, Hong Kong
High-entropy alloys (HEAs) are presently of great research interest in materials science and engineering.
Unlike conventional alloys, which contain one and rarely two base elements, HEAs comprise multiple
principal elements, with the possible number of HEA compositions extending considerably more than
conventional alloys. With the advent of HEAs, fundamental issues that challenge the proposed theories,
models, and methods for conventional alloys also emerge. Here, we provide a critical review of the recent
studies aiming to address the fundamental issues related to phase formation in HEAs. In addition, novel
properties of HEAs are also discussed, such as their excellent specific strength, superior mechanical
performance at high temperatures, exceptional ductility and fracture toughness at cryogenic
temperatures, superparamagnetism, and superconductivity. Due to their considerable structural and
functional potential as well as richness of design, HEAs are promising candidates for new applications,
which warrants further studies.
IntroductionFrom ancient times, human civilization has striven to develop new
materials [1], discovering new metals and inventing new alloys
that have played a pivotal role for more than thousands of years.
Since the Bronze Age, alloys have traditionally been developed
according to a ‘base element’ paradigm. This strategy begins with
one and rarely two principal elements, such as iron in steels or
nickel in superalloys, and a minor alloying approach is used to
obtain alloys with enhanced properties. In sharp contrast, a novel
paradigm for alloy design was proposed about a decade ago [2,3],
which involves merely the mixing of multiple elements in an
equimolar or near-equimolar composition to form alloys, thus
eschewing the ‘base element’ concept. These designed multicom-
ponent alloys were termed as ‘high-entropy alloys’ (HEAs) by Yeh
et al. [2], which suggests the high configurational entropy of the
random mixing of elements in these alloys. Presently, HEAs are
being increasingly studied [2,4–8]. Nevertheless, given the short
history of research on HEA, the field is still in its infant stage in
comparison to that of conventional alloys.
*Corresponding author:. Yang, Y. ([email protected])
1369-7021/� 2015 The Authors. Published by Elsevier Ltd. This is an open access article under the CC BY-N
j.mattod.2015.11.026
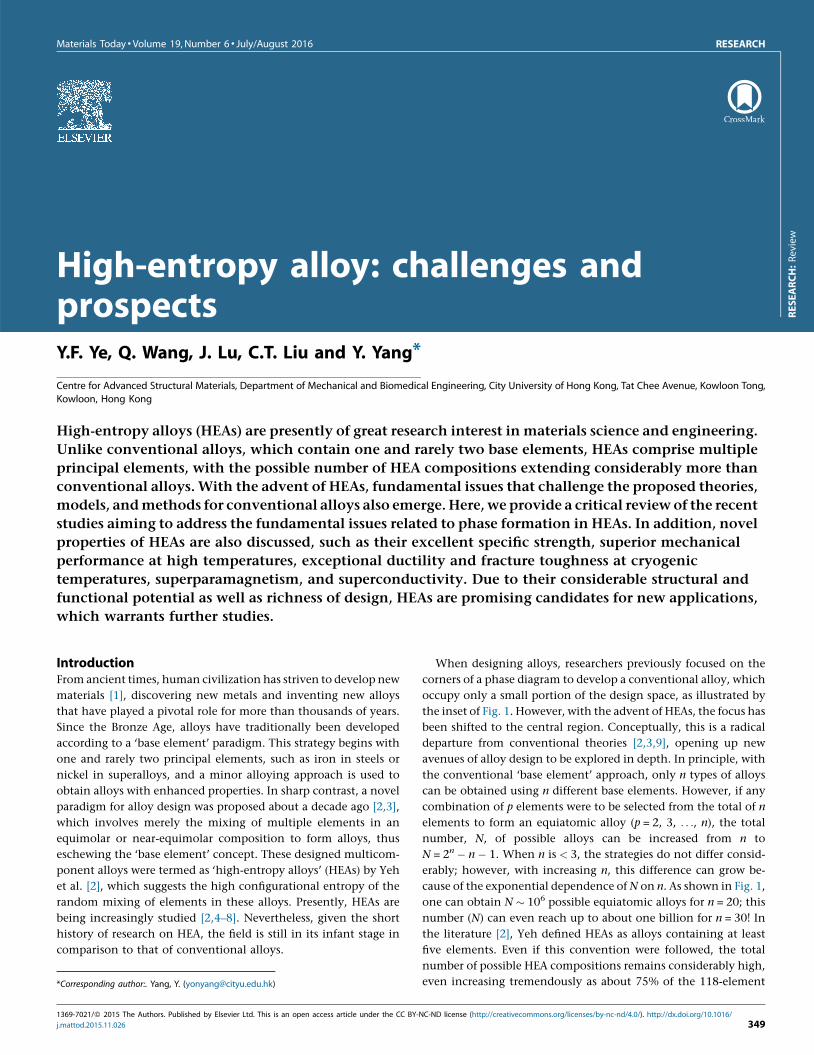
When designing alloys, researchers previously focused on the
corners of a phase diagram to develop a conventional alloy, which
occupy only a small portion of the design space, as illustrated by
the inset of Fig. 1. However, with the advent of HEAs, the focus has
been shifted to the central region. Conceptually, this is a radical
departure from conventional theories [2,3,9], opening up new
avenues of alloy design to be explored in depth. In principle, with
the conventional ‘base element’ approach, only n types of alloys
can be obtained using n different base elements. However, if any
combination of p elements were to be selected from the total of n
elements to form an equiatomic alloy (p = 2, 3, . . ., n), the total
number, N, of possible alloys can be increased from n to
N = 2n � n � 1. When n is < 3, the strategies do not differ consid-
erably; however, with increasing n, this difference can grow be-
cause of the exponential dependence of N on n. As shown in Fig. 1,
one can obtain N � 106 possible equiatomic alloys for n = 20; this
number (N) can even reach up to about one billion for n = 30! In
the literature [2], Yeh defined HEAs as alloys containing at least
five elements. Even if this convention were followed, the total
number of possible HEA compositions remains considerably high,
even increasing tremendously as about 75% of the 118-element
C-ND license (http://creativecommons.org/licenses/by-nc-nd/4.0/). http://dx.doi.org/10.1016/
349
RESEARCH Materials Today � Volume 19, Number 6 � July/August 2016
FIGURE 1
The variation in the total number of equiatomic compositions with the total
number of principal elements. The inset illustrates the difference between
the design of conventional alloys and high-entropy alloys on a ternary plot.
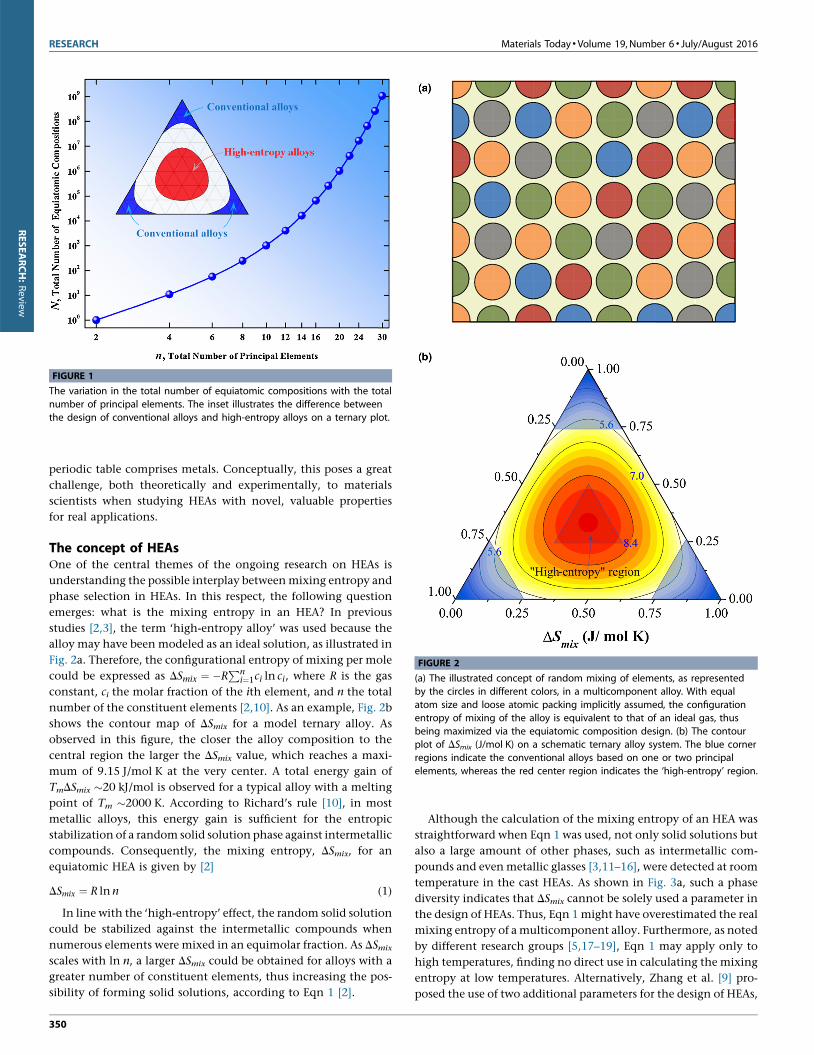
FIGURE 2
(a) The illustrated concept of random mixing of elements, as representedby the circles in different colors, in a multicomponent alloy. With equal
atom size and loose atomic packing implicitly assumed, the configuration
entropy of mixing of the alloy is equivalent to that of an ideal gas, thus
being maximized via the equiatomic composition design. (b) The contourplot of DSmix (J/mol K) on a schematic ternary alloy system. The blue corner
regions indicate the conventional alloys based on one or two principal
elements, whereas the red center region indicates the ‘high-entropy’ region.
RESEARCH:Review
periodic table comprises metals. Conceptually, this poses a great
challenge, both theoretically and experimentally, to materials
scientists when studying HEAs with novel, valuable properties
for real applications.
The concept of HEAsOne of the central themes of the ongoing research on HEAs is
understanding the possible interplay between mixing entropy and
phase selection in HEAs. In this respect, the following question
emerges: what is the mixing entropy in an HEA? In previous
studies [2,3], the term ‘high-entropy alloy’ was used because the
alloy may have been modeled as an ideal solution, as illustrated in
Fig. 2a. Therefore, the configurational entropy of mixing per mole
could be expressed as DSmix ¼ �RPn
i¼1ci ln ci, where R is the gas
constant, ci the molar fraction of the ith element, and n the total
number of the constituent elements [2,10]. As an example, Fig. 2b
shows the contour map of DSmix for a model ternary alloy. As
observed in this figure, the closer the alloy composition to the
central region the larger the DSmix value, which reaches a maxi-
mum of 9.15 J/mol K at the very center. A total energy gain of
TmDSmix �20 kJ/mol is observed for a typical alloy with a melting
point of Tm �2000 K. According to Richard’s rule [10], in most
metallic alloys, this energy gain is sufficient for the entropic
stabilization of a random solid solution phase against intermetallic
compounds. Consequently, the mixing entropy, DSmix, for an
equiatomic HEA is given by [2]
DSmix ¼ R ln n (1)
In line with the ‘high-entropy’ effect, the random solid solution
could be stabilized against the intermetallic compounds when
numerous elements were mixed in an equimolar fraction. As DSmix
scales with ln n, a larger DSmix could be obtained for alloys with a
greater number of constituent elements, thus increasing the pos-
sibility of forming solid solutions, according to Eqn 1 [2].
350
Although the calculation of the mixing entropy of an HEA was
straightforward when Eqn 1 was used, not only solid solutions but
also a large amount of other phases, such as intermetallic com-
pounds and even metallic glasses [3,11–16], were detected at room
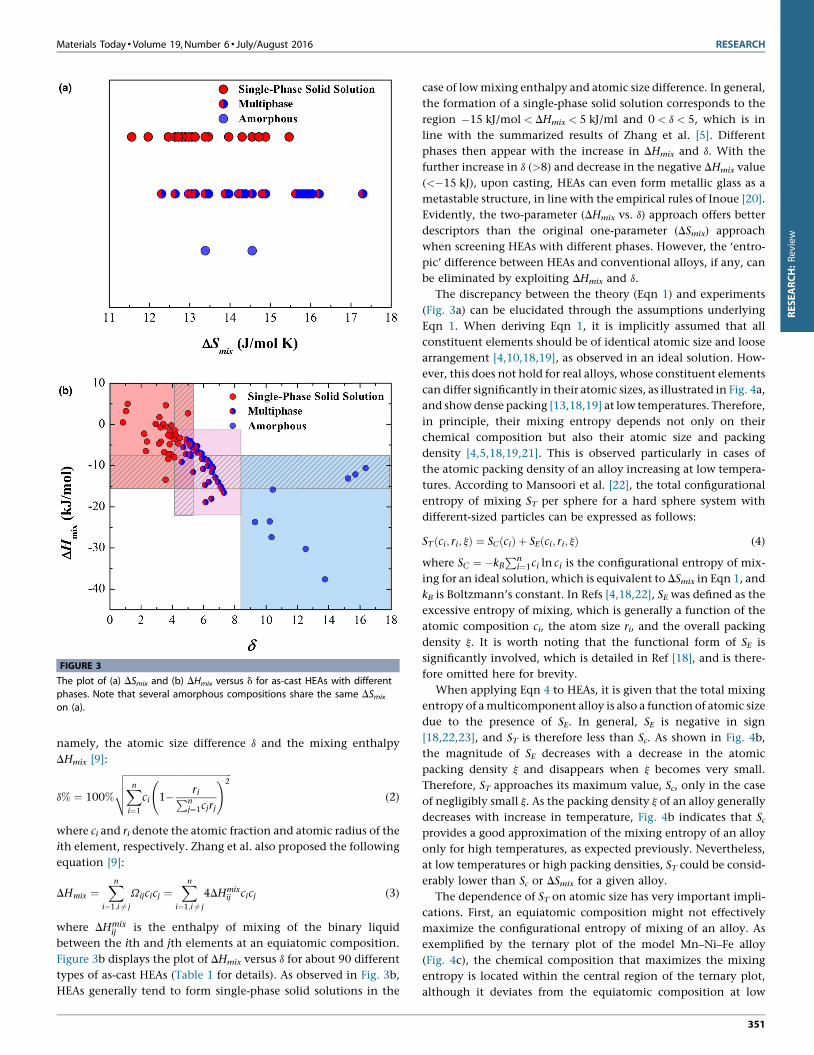
temperature in the cast HEAs. As shown in Fig. 3a, such a phase
diversity indicates that DSmix cannot be solely used a parameter in
the design of HEAs. Thus, Eqn 1 might have overestimated the real
mixing entropy of a multicomponent alloy. Furthermore, as noted
by different research groups [5,17–19], Eqn 1 may apply only to
high temperatures, finding no direct use in calculating the mixing
entropy at low temperatures. Alternatively, Zhang et al. [9] pro-
posed the use of two additional parameters for the design of HEAs,
Materials Today � Volume 19, Number 6 � July/August 2016 RESEARCH
FIGURE 3
The plot of (a) DSmix and (b) DHmix versus d for as-cast HEAs with different
phases. Note that several amorphous compositions share the same DSmix
on (a).
RESEARCH:Review
namely, the atomic size difference d and the mixing enthalpy
DHmix [9]:
d% ¼ 100%
ffiffiffiffiffiffiffiffiffiffiffiffiffiffiffiffiffiffiffiffiffiffiffiffiffiffiffiffiffiffiffiffiffiffiffiffiffiffiffiffiffiffiffiffiffiXn
i¼1
ci 1� riPnj¼1cjrj
!2vuut (2)
where ci and ri denote the atomic fraction and atomic radius of the
ith element, respectively. Zhang et al. also proposed the following
equation [9]:
DHmix ¼Xn
i¼1;i 6¼ j
Vijcicj ¼Xn
i¼1;i 6¼ j
4DHmixij cicj (3)
where DHmixij is the enthalpy of mixing of the binary liquid
between the ith and jth elements at an equiatomic composition.
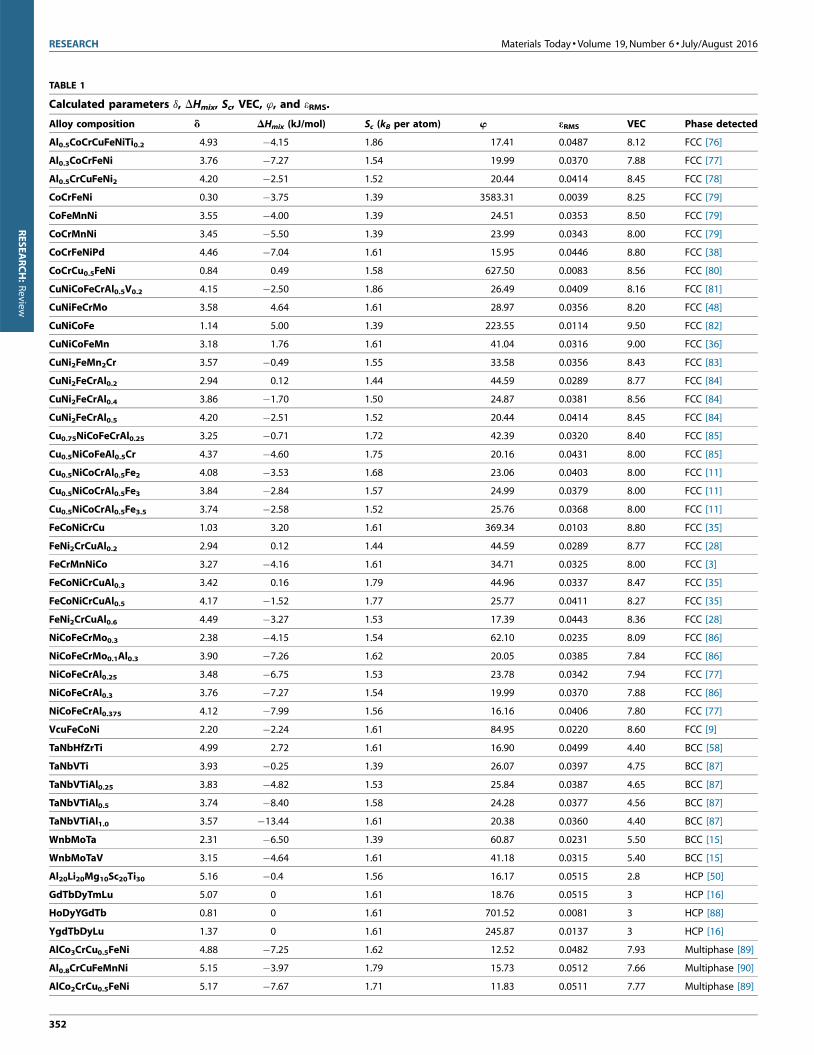
Figure 3b displays the plot of DHmix versus d for about 90 different
types of as-cast HEAs (Table 1 for details). As observed in Fig. 3b,
HEAs generally tend to form single-phase solid solutions in the
case of low mixing enthalpy and atomic size difference. In general,
the formation of a single-phase solid solution corresponds to the
region �15 kJ/mol < DHmix < 5 kJ/ml and 0 < d < 5, which is in
line with the summarized results of Zhang et al. [5]. Different
phases then appear with the increase in DHmix and d. With the
further increase in d (>8) and decrease in the negative DHmix value
(<�15 kJ), upon casting, HEAs can even form metallic glass as a
metastable structure, in line with the empirical rules of Inoue [20].
Evidently, the two-parameter (DHmix vs. d) approach offers better
descriptors than the original one-parameter (DSmix) approach
when screening HEAs with different phases. However, the ‘entro-
pic’ difference between HEAs and conventional alloys, if any, can
be eliminated by exploiting DHmix and d.
The discrepancy between the theory (Eqn 1) and experiments
(Fig. 3a) can be elucidated through the assumptions underlying
Eqn 1. When deriving Eqn 1, it is implicitly assumed that all
constituent elements should be of identical atomic size and loose
arrangement [4,10,18,19], as observed in an ideal solution. How-
ever, this does not hold for real alloys, whose constituent elements
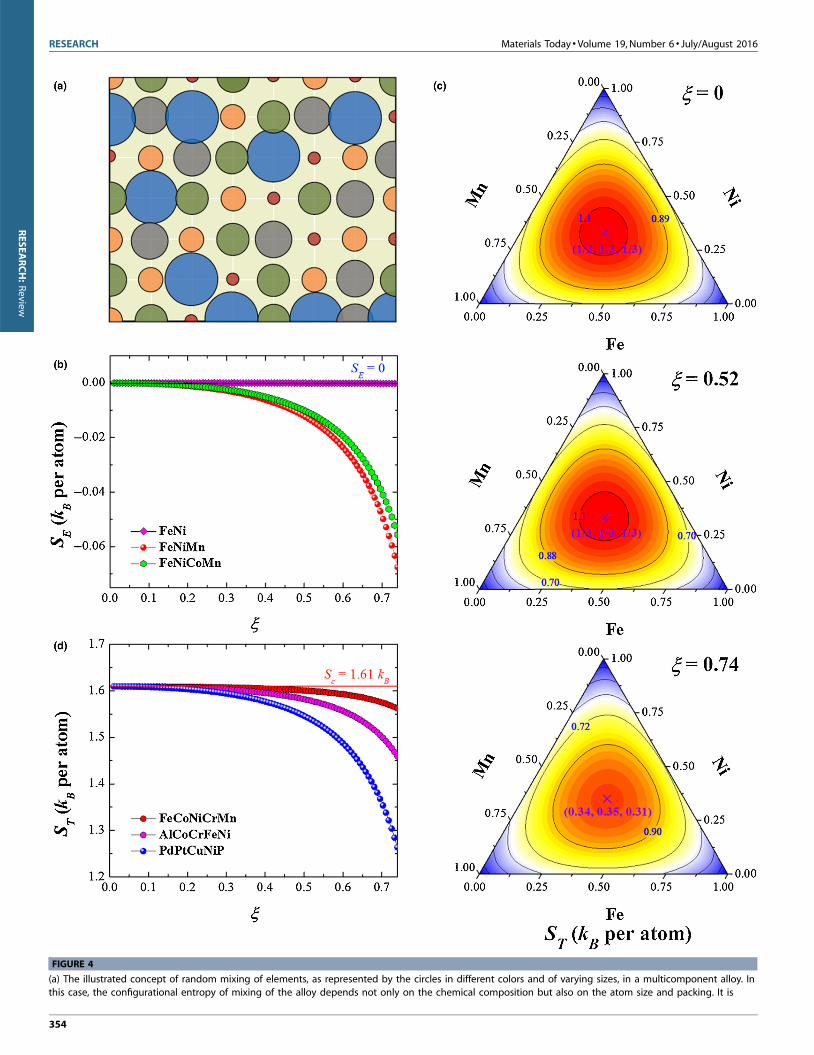
can differ significantly in their atomic sizes, as illustrated in Fig. 4a,
and show dense packing [13,18,19] at low temperatures. Therefore,
in principle, their mixing entropy depends not only on their
chemical composition but also their atomic size and packing
density [4,5,18,19,21]. This is observed particularly in cases of
the atomic packing density of an alloy increasing at low tempera-
tures. According to Mansoori et al. [22], the total configurational
entropy of mixing ST per sphere for a hard sphere system with
different-sized particles can be expressed as follows:
ST ðci; ri; jÞ ¼ SCðciÞ þ SEðci; ri; jÞ (4)
where SC ¼ �kBPn
i¼1ci ln ci is the configurational entropy of mix-
ing for an ideal solution, which is equivalent to DSmix in Eqn 1, and
kB is Boltzmann’s constant. In Refs [4,18,22], SE was defined as the
excessive entropy of mixing, which is generally a function of the
atomic composition ci, the atom size ri, and the overall packing
density j. It is worth noting that the functional form of SE is
significantly involved, which is detailed in Ref [18], and is there-
fore omitted here for brevity.
When applying Eqn 4 to HEAs, it is given that the total mixing
entropy of a multicomponent alloy is also a function of atomic size
due to the presence of SE. In general, SE is negative in sign
[18,22,23], and ST is therefore less than Sc. As shown in Fig. 4b,
the magnitude of SE decreases with a decrease in the atomic
packing density j and disappears when j becomes very small.
Therefore, ST approaches its maximum value, Sc, only in the case
of negligibly small j. As the packing density j of an alloy generally
decreases with increase in temperature, Fig. 4b indicates that Sc
provides a good approximation of the mixing entropy of an alloy
only for high temperatures, as expected previously. Nevertheless,
at low temperatures or high packing densities, ST could be consid-
erably lower than Sc or DSmix for a given alloy.
The dependence of ST on atomic size has very important impli-
cations. First, an equiatomic composition might not effectively
maximize the configurational entropy of mixing of an alloy. As
exemplified by the ternary plot of the model Mn–Ni–Fe alloy
(Fig. 4c), the chemical composition that maximizes the mixing
entropy is located within the central region of the ternary plot,
although it deviates from the equiatomic composition at low
351
RESEARCH Materials Today � Volume 19, Number 6 � July/August 2016
TABLE 1
Calculated parameters d, DHmix, Sc, VEC, w, and eRMS.
Alloy composition d DHmix (kJ/mol) Sc (kB per atom) w eRMS VEC Phase detected
Al0.5CoCrCuFeNiTi0.2 4.93 �4.15 1.86 17.41 0.0487 8.12 FCC [76]
Al0.3CoCrFeNi 3.76 �7.27 1.54 19.99 0.0370 7.88 FCC [77]
Al0.5CrCuFeNi2 4.20 �2.51 1.52 20.44 0.0414 8.45 FCC [78]
CoCrFeNi 0.30 �3.75 1.39 3583.31 0.0039 8.25 FCC [79]
CoFeMnNi 3.55 �4.00 1.39 24.51 0.0353 8.50 FCC [79]
CoCrMnNi 3.45 �5.50 1.39 23.99 0.0343 8.00 FCC [79]
CoCrFeNiPd 4.46 �7.04 1.61 15.95 0.0446 8.80 FCC [38]
CoCrCu0.5FeNi 0.84 0.49 1.58 627.50 0.0083 8.56 FCC [80]
CuNiCoFeCrAl0.5V0.2 4.15 �2.50 1.86 26.49 0.0409 8.16 FCC [81]
CuNiFeCrMo 3.58 4.64 1.61 28.97 0.0356 8.20 FCC [48]
CuNiCoFe 1.14 5.00 1.39 223.55 0.0114 9.50 FCC [82]
CuNiCoFeMn 3.18 1.76 1.61 41.04 0.0316 9.00 FCC [36]
CuNi2FeMn2Cr 3.57 �0.49 1.55 33.58 0.0356 8.43 FCC [83]
CuNi2FeCrAl0.2 2.94 0.12 1.44 44.59 0.0289 8.77 FCC [84]
CuNi2FeCrAl0.4 3.86 �1.70 1.50 24.87 0.0381 8.56 FCC [84]
CuNi2FeCrAl0.5 4.20 �2.51 1.52 20.44 0.0414 8.45 FCC [84]
Cu0.75NiCoFeCrAl0.25 3.25 �0.71 1.72 42.39 0.0320 8.40 FCC [85]
Cu0.5NiCoFeAl0.5Cr 4.37 �4.60 1.75 20.16 0.0431 8.00 FCC [85]
Cu0.5NiCoCrAl0.5Fe2 4.08 �3.53 1.68 23.06 0.0403 8.00 FCC [11]
Cu0.5NiCoCrAl0.5Fe3 3.84 �2.84 1.57 24.99 0.0379 8.00 FCC [11]
Cu0.5NiCoCrAl0.5Fe3.5 3.74 �2.58 1.52 25.76 0.0368 8.00 FCC [11]
FeCoNiCrCu 1.03 3.20 1.61 369.34 0.0103 8.80 FCC [35]
FeNi2CrCuAl0.2 2.94 0.12 1.44 44.59 0.0289 8.77 FCC [28]
FeCrMnNiCo 3.27 �4.16 1.61 34.71 0.0325 8.00 FCC [3]
FeCoNiCrCuAl0.3 3.42 0.16 1.79 44.96 0.0337 8.47 FCC [35]
FeCoNiCrCuAl0.5 4.17 �1.52 1.77 25.77 0.0411 8.27 FCC [35]
FeNi2CrCuAl0.6 4.49 �3.27 1.53 17.39 0.0443 8.36 FCC [28]
NiCoFeCrMo0.3 2.38 �4.15 1.54 62.10 0.0235 8.09 FCC [86]
NiCoFeCrMo0.1Al0.3 3.90 �7.26 1.62 20.05 0.0385 7.84 FCC [86]
NiCoFeCrAl0.25 3.48 �6.75 1.53 23.78 0.0342 7.94 FCC [77]
NiCoFeCrAl0.3 3.76 �7.27 1.54 19.99 0.0370 7.88 FCC [86]
NiCoFeCrAl0.375 4.12 �7.99 1.56 16.16 0.0406 7.80 FCC [77]
VcuFeCoNi 2.20 �2.24 1.61 84.95 0.0220 8.60 FCC [9]
TaNbHfZrTi 4.99 2.72 1.61 16.90 0.0499 4.40 BCC [58]
TaNbVTi 3.93 �0.25 1.39 26.07 0.0397 4.75 BCC [87]
TaNbVTiAl0.25 3.83 �4.82 1.53 25.84 0.0387 4.65 BCC [87]
TaNbVTiAl0.5 3.74 �8.40 1.58 24.28 0.0377 4.56 BCC [87]
TaNbVTiAl1.0 3.57 �13.44 1.61 20.38 0.0360 4.40 BCC [87]
WnbMoTa 2.31 �6.50 1.39 60.87 0.0231 5.50 BCC [15]
WnbMoTaV 3.15 �4.64 1.61 41.18 0.0315 5.40 BCC [15]
Al20Li20Mg10Sc20Ti30 5.16 �0.4 1.56 16.17 0.0515 2.8 HCP [50]
GdTbDyTmLu 5.07 0 1.61 18.76 0.0515 3 HCP [16]
HoDyYGdTb 0.81 0 1.61 701.52 0.0081 3 HCP [88]
YgdTbDyLu 1.37 0 1.61 245.87 0.0137 3 HCP [16]
AlCo3CrCu0.5FeNi 4.88 �7.25 1.62 12.52 0.0482 7.93 Multiphase [89]
Al0.8CrCuFeMnNi 5.15 �3.97 1.79 15.73 0.0512 7.66 Multiphase [90]
AlCo2CrCu0.5FeNi 5.17 �7.67 1.71 11.83 0.0511 7.77 Multiphase [89]
352
RESEARCH:Review

Materials Today � Volume 19, Number 6 � July/August 2016 RESEARCH
TABLE 1 (Continued )
Alloy composition d DHmix (kJ/mol) Sc (kB per atom) w eRMS VEC Phase detected
AlCrCuFeMnNi 5.39 �5.11 1.79 13.54 0.0536 7.50 Multiphase [90]
Al0.5CoCrFeNi 4.60 �9.09 1.58 12.23 0.0454 7.67 Multiphase [77]
Al0.5CoCrCuFeNiTi0.4 5.49 �6.42 1.90 13.02 0.0543 7.98 Multiphase [76]
Al0.5CrFeNiCoCuTi0.6 5.92 �8.40 1.92 10.36 0.0586 7.85 Multiphase [76]
Al0.5CrFeNiCoCuTi0.8 6.26 �10.11 1.92 8.54 0.0621 7.73 Multiphase [76]
Al0.5CoCrCuFeNiTi1.0 6.53 �11.60 1.93 7.23 0.0649 7.62 Multiphase [76]
Al0.5CoCrCuFeNiTi1.2 6.76 �12.89 1.92 6.26 0.0671 7.51 Multiphase [76]
Al0.5CoCrCuFeNiTi1.4 6.94 �14.02 1.91 5.47 0.0690 7.41 Multiphase [76]
Al0.5CoCrCuFeNiTi1.6 7.09 �15.01 1.90 4.85 0.0706 7.31 Multiphase [76]
Al0.5CoCrCuFeNiTi1.8 7.21 �15.86 1.89 4.34 0.0719 7.22 Multiphase [76]
Al0.5CoCrCuFeNiTi2.0 7.31 �16.60 1.88 3.91 0.0729 7.13 Multiphase [76]
CoCrFeNiTi0.5 5.33 �11.56 1.58 7.91 0.0525 7.78 Multiphase [91]
CoCrFeNiAlNb0.25 6.10 �14.66 1.72 5.26 0.0605 7.10 Multiphase [9]
CoCrFeNiAlNb0.75 6.50 �18.03 1.79 3.95 0.0648 6.91 Multiphase [9]
CoCrCuFeNiTi0.8 5.70 �6.75 1.79 11.12 0.0563 8.14 Multiphase [70]
CoCrCuFeNiTi 6.12 �8.44 1.79 8.92 0.0605 8.00 Multiphase [70]
CuAlNiCoCrFeSi 6.13 �18.86 1.95 4.15 0.0610 7.29 Multiphase [33]
CuNi2FeCrAl0.9 5.15 �5.22 1.56 12.08 0.0509 8.08 Multiphase [84]
CuNi2FeCrAl1.2 5.60 �6.78 1.57 9.25 0.0556 7.83 Multiphase [84]
CuNi2FeCrAl1.5 5.93 �8.05 1.57 7.47 0.0589 7.62 Multiphase [84]
Cu0.5Ti0.5CrFeCoNiAl0.5 5.97 �10.84 1.89 8.79 0.0591 7.64 Multiphase [92]
CuCoNiCrAlFeTiV 6.34 �13.94 2.08 7.73 0.0631 7.00 Multiphase [34]
FeNi2CrCuAl 5.32 �5.78 1.56 10.94 0.0526 8.00 Multiphase [28]
FeNi2CrCuAl1.2 5.60 �6.78 1.57 9.25 0.0555 7.84 Multiphase [28]
FeCoNiCrCuAl0.8 4.92 �3.61 1.79 17.15 0.0487 8.00 Multiphase [35]
FeCoNiCrCuAl 5.28 �4.78 1.79 14.12 0.0523 7.83 Multiphase [35]
FeCoNiCrCuAl1.5 5.89 �7.05 1.78 9.90 0.0585 7.46 Multiphase [35]
FeCoNiCrCuAl2.0 6.26 �8.65 1.75 7.62 0.0623 7.14 Multiphase [35]
FeCoNiCrCuAl2.3 6.40 �9.38 1.73 6.70 0.0638 6.97 Multiphase [35]
FeCoNiCrCuAl2.8 6.57 �10.28 1.68 5.53 0.0656 6.71 Multiphase [35]
FeCoNiCrCuAl3.0 6.61 �10.56 1.67 5.17 0.0661 6.63 Multiphase [35]
FeCoNiCuAl 5.61 �5.28 1.61 10.44 0.0556 8.20 Multiphase [93]
MnCrFe1.5Ni0.5Al0.3 4.70 �5.51 1.48 13.89 0.0470 7.19 Multiphase [94]
MnCrFe1.5Ni0.5Al0.5 5.16 �7.26 1.52 10.62 0.0510 7.00 Multiphase [94]
ErTbDyNiAl 13.74 �37.60 1.61 �2.24 0.1429 4.40 Amorphous [95]
PdPtCuNiP 9.29 �23.68 1.61 �1.26 0.0952 9.20 Amorphous [25]
SrCaYbMgZn 15.25 �13.12 1.61 �0.017 0.1565 4.20 Amorphous [84]
SrCaYbMgZn0.5Cu0.5 16.37 �10.60 1.75 0.61 0.1699 4.10 Amorphous [95]
SrCaYbLi0.55Mg0.45Zn 15.71 �12.15 1.75 0.2 0.1612 4.09 Amorphous [95]
TiZrCuNiBe 12.53 �30.24 1.61 �0.9 0.1268 6.20 Amorphous [12]
ZrHfTiCuNi 10.34 �27.36 1.61 �0.27 0.1049 6.60 Amorphous [96]
ZrHfTiCuFe 10.43 �15.84 1.61 1.73 0.1059 6.20 Amorphous [96]
ZrHfTiCuCo 10.24 �23.52 1.61 0.42 0.1039 6.40 Amorphous [96]
RESEARCH:Review
temperatures. Takeuchi et al. [19] recently reported similar pre-
dictions. Second, alloys with the same number of constituting
elements may not exhibit the same configuration entropy of
mixing ST. Figure 4d shows the total entropy of mixing, ST, as a
function of j calculated for FeCrMnNiCo, AlCoCrFeNi, and
PdPtCuNiP, respectively. Although all of these alloys have five
constituent elements and share the same Sc value of 1.6 kB, in the
as-cast state, FeCrMnNiCo displays a single-phased face-centered
cubic (FCC) structure [3] and AlCoCrFeNi a mixed body-centered
cubic (BCC) and FCC structure [24], whereas PdPtCuNiP becomes
353
RESEARCH Materials Today � Volume 19, Number 6 � July/August 2016
FIGURE 4
(a) The illustrated concept of random mixing of elements, as represented by the circles in different colors and of varying sizes, in a multicomponent alloy. In
this case, the configurational entropy of mixing of the alloy depends not only on the chemical composition but also on the atom size and packing. It is
354
RESEARCH:Review
Materials Today � Volume 19, Number 6 � July/August 2016 RESEARCH
RESEARCH:Review
an excellent bulk metallic glass former [25]. Evidently, the formu-
lation of the total entropy of mixing, ST, can identify HEAs that
exhibit phase diversity unexplained by the formulation of Sc or
DSmix alone.
Phase selection in HEAs: the theoretical approachThe equilibrium thermodynamic method aims to determine the
phase stability in an HEA by computing the Gibbs free energy of
different phases that could possibly form in a certain HEA. A direct
comparison identifies the phase that is more energetically favorable.
This direct approach enables the prediction of the exact phases,
although this requires data on all possible phases for that alloy;
further, it is generally difficult to perform for multicomponent
alloys using simulation methods based on physical potentials, such
as classical molecular dynamics simulations [5,26]. Consideration of
metastable phases, such as metallic glasses, introduces more chal-
lenges. Alternatively, empirical and semiempirical rules have also
been proposed to understand phase stability and guide the design of
HEAs [4,8,18,19,27,28]. Compared with the direct computational
approach [5,14,26,29,30], discussed subsequently, these rules have
been mainly established by comparing the theoretical models with
the existing experimental data; therefore, they can be applied to
both equilibrium and metastable phases.
Thermodynamic rulesAccording to Yeh and coworkers [2], HEAs are alloys comprising
multiple principal elements whose configurational entropy of
mixing dominates the thermodynamics of solidification, which
thus favors the formation of a random solid solution against
intermetallic compounds. Symbolically, the proposal by Yeh
et al. [2] may be translated as follows:
TSsys� maxfjHijg ði ¼ 1; 2; . . .; mÞ (5)
where Ssys is the configurational entropy of mixing of the alloy
system and Hi the formation enthalpy of the ith phase, assuming m
possible phases in total. As a result, the HEAs that satisfy Eqn 5 are
solidified into a single-phase structure because of the negligible
effect of formation enthalpy as hypothesized previously. It should
be noted that Eqn 5 was not strictly derived based on the existing
rules of thermodynamics; however, it has been proven useful for
one to claim the entropic dominance in a multicomponent alloy
according to the results reported in the literature [2,3,14,19,21,31–
34]. The phase selection rule for HEAs is discussed in detail
subsequently.
In their early work, Yeh et al. [2] proposed a criterion of
DSmix � ln(5)R = 1.6R for casting an HEA, which corresponds to
the mixing of at least five elements in an equiatomic composition.
Comparing this criterion with Eqn 5 and assuming Ssys� DSmix, the
simple criterion of Yeh et al. appears to hold if the temperature T is
much higher than the critical value Tc = max{jHij}/1.6R. If
max{jHij} � jDHmixj is assumed, as in Refs [5,13,21,27], Tc is estimated
to be on the order of a few hundred Kelvins for typical HEAs, such as
worth noting that there may be overlapping areas or empty spaces between adjwhen all atoms are closely packed in a common lattice. (b) The variation of the e
two-, three-, and four-component model alloys of equiatomic composition. (c) Th
atom) for the model Mn–Ni–Fe system at different atomic packing fractions of j
with the maximum ST. (d) The variation of the total entropy of mixing ST with thecomposition.
FeCoNiCrCu [35], FeCoNiCrMn [3], and CuNiCoFeMn [36]. How-
ever, for HEAs with low jDHmixj, the estimated Tc could be as small as
a few Kelvins. Alternatively, the entropic gain can be computed
relative to the magnitude of the mixing enthalpy jDHmixj by fixing T
at Tm, the alloy’s melting point, which can be approximated based
on the rule of mixture [27]. Similarly, Zhang et al. [27,37] proposed
using the following parameter V to guide the design of HEAs:
V ¼ TmDSmix
jDHmixj(6)
Comparing Eqn 6 with Eqn 5, one can infer that, by assuming
max{jHij} � jDHmixj and Ssys � DSmix, the dimensionless parameter
V measures the energy gain as the mixing entropy is relative to
that of enthalpy. The corollary in this case is that the larger the V
the higher the probability of forming a single-phase random solid
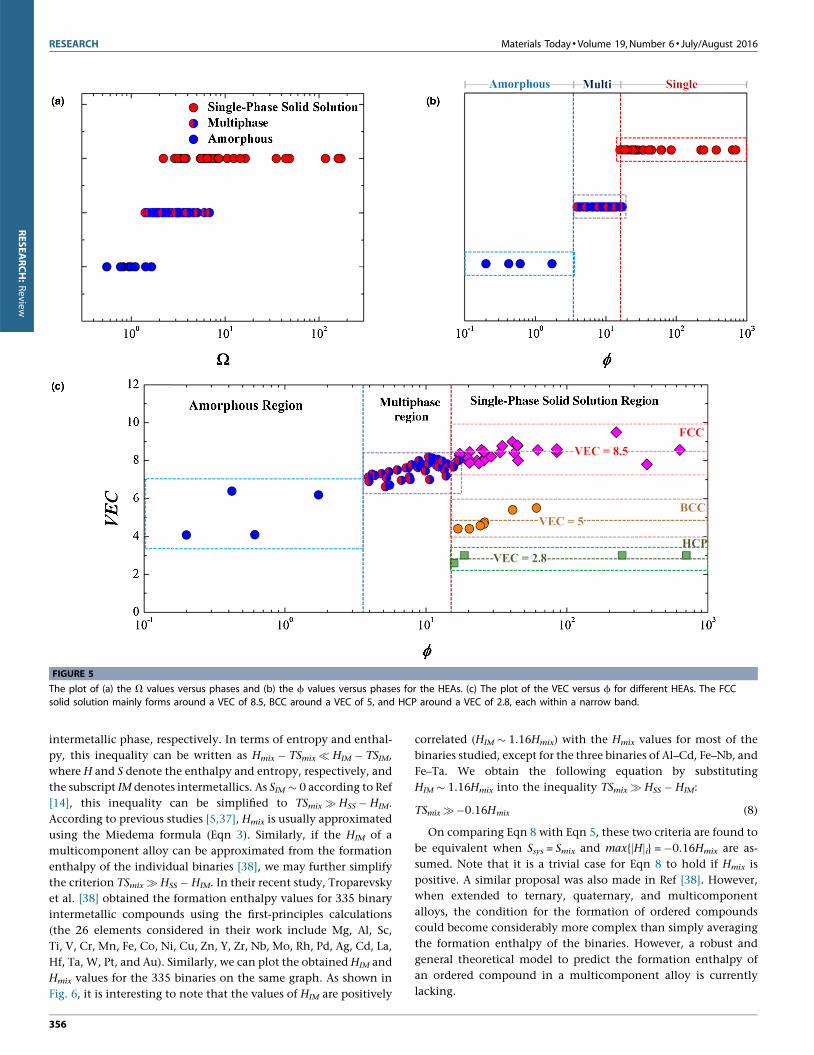
solution in HEAs and vice versa. However, as noted in Fig. 5a, the V
values computed for the HEAs with different phases significantly
overlap. This behavior suggests that, similar to Sc (Fig. 3a), V
cannot be used as the sole descriptor of phase selection in HEAs
either; instead, it should be used in combination with other
thermodynamic and topological parameters related to the constit-
uent elements [37].
Taking account of the generality of ST in formulating the
configuration entropy of mixing of HEAs at both high and low
packing densities [4,18]. Ye et al. assumed Ssys � ST = Sc � jSEj (Eqn
4). Consequently, they proposed a new parameter f by assuming
T = Tm and max{jHij} � jDHmixj to guide the design of HEAs [4]:
f ¼ Sc�jDHmixj=Tm
jSEj(7)
In line with Eqn 5, it can be expected that the larger the f the
higher the probability of forming a single-phase solid solution in
HEAs. As clearly observed in Fig. 5b, the HEAs show different
groupings according to their corresponding f values. HEAs with
different phases are separated at a critical value of fc = 20. Evident-
ly, the HEAs display single-phase solid solutions when f > fc and
multiphased and even amorphous structures when f < fc. This
behavior suggests that f is a promising descriptor for ranking HEAs
by their propensity to form single-phase solid solutions. Here, it is
worth noting that the fc value is empirically determined by
comparison with the experimental data on the X-ray diffraction
(XRD) spectra of as-cast HEAs. Therefore, the fc value may change
if these alloys are subsequently subjected to annealing. Apart from
the empirical determination of fc, the f criterion can be better
improved by approximating max{jHij} as the average formation
enthalpy jHfj of the HEAs based on the data provided by Tropar-
evsky et al. [38]. However, this question remains unanswered.
Further, the validity of the inequality Eqn 5 as a legitimate base
for developing the phase selection rules for HEAs is discussed. In
the strictest sense, a solid solution phase is preferred to an inter-
metallic phase for a multicomponent alloy if GSS� GIM, where GSS
and GIM denote the Gibbs free energy of the solid solution and
acent atoms due to the size misfit, which leads to intrinsic residual strainxcess entropy of mixing SE with the atomic packing fraction j for three
e contour plots of the total configurational entropy of mixing ST (kB per
= 0, 0.52, and 0.74, respectively. Note that ‘�’ represents the composition
atomic packing fraction j for three five-component alloys of equiatomic
355
RESEARCH Materials Today � Volume 19, Number 6 � July/August 2016
FIGURE 5
The plot of (a) the V values versus phases and (b) the f values versus phases for the HEAs. (c) The plot of the VEC versus f for different HEAs. The FCCsolid solution mainly forms around a VEC of 8.5, BCC around a VEC of 5, and HCP around a VEC of 2.8, each within a narrow band.
RESEARCH:Review
intermetallic phase, respectively. In terms of entropy and enthal-
py, this inequality can be written as Hmix � TSmix� HIM � TSIM,
where H and S denote the enthalpy and entropy, respectively, and
the subscript IM denotes intermetallics. As SIM � 0 according to Ref
[14], this inequality can be simplified to TSmix� HSS � HIM.
According to previous studies [5,37], Hmix is usually approximated
using the Miedema formula (Eqn 3). Similarly, if the HIM of a
multicomponent alloy can be approximated from the formation
enthalpy of the individual binaries [38], we may further simplify
the criterion TSmix� HSS � HIM. In their recent study, Troparevsky
et al. [38] obtained the formation enthalpy values for 335 binary
intermetallic compounds using the first-principles calculations
(the 26 elements considered in their work include Mg, Al, Sc,
Ti, V, Cr, Mn, Fe, Co, Ni, Cu, Zn, Y, Zr, Nb, Mo, Rh, Pd, Ag, Cd, La,
Hf, Ta, W, Pt, and Au). Similarly, we can plot the obtained HIM and
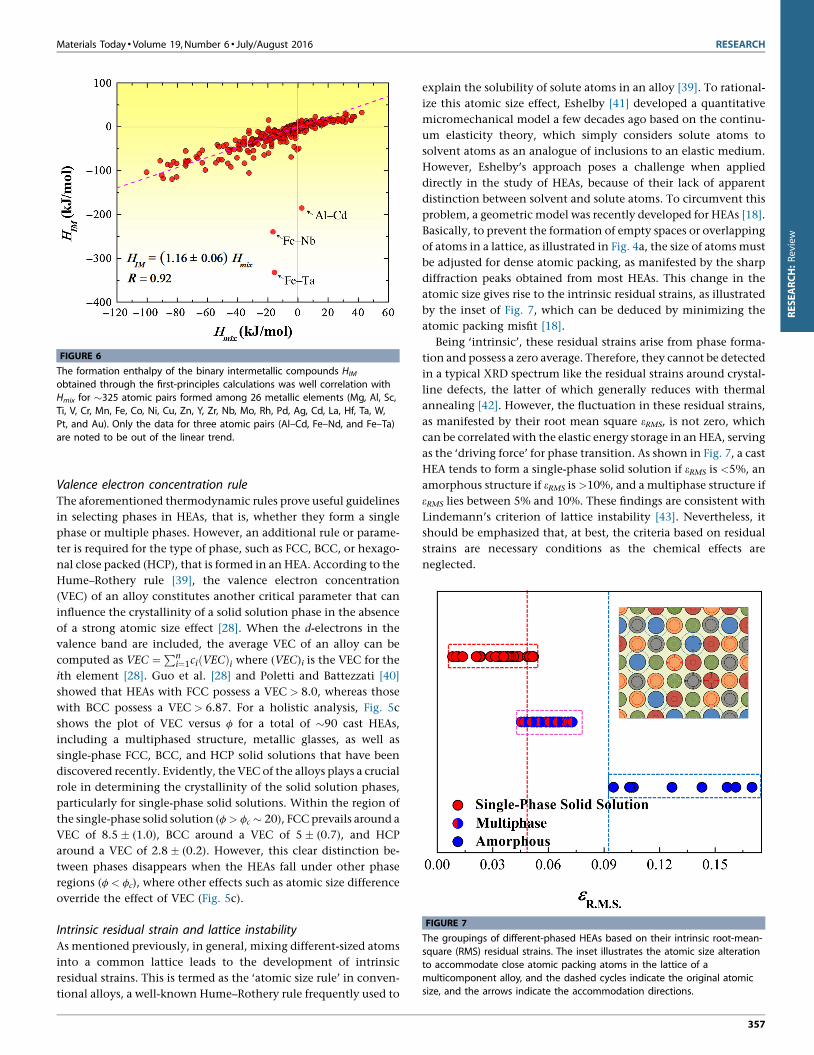
Hmix values for the 335 binaries on the same graph. As shown in
Fig. 6, it is interesting to note that the values of HIM are positively
356
correlated (HIM � 1.16Hmix) with the Hmix values for most of the
binaries studied, except for the three binaries of Al–Cd, Fe–Nb, and
Fe–Ta. We obtain the following equation by substituting
HIM � 1.16Hmix into the inequality TSmix� HSS � HIM:
TSmix� �0:16Hmix (8)
On comparing Eqn 8 with Eqn 5, these two criteria are found to
be equivalent when Ssys = Smix and max{jHji} = �0.16Hmix are as-
sumed. Note that it is a trivial case for Eqn 8 to hold if Hmix is
positive. A similar proposal was also made in Ref [38]. However,
when extended to ternary, quaternary, and multicomponent
alloys, the condition for the formation of ordered compounds
could become considerably more complex than simply averaging
the formation enthalpy of the binaries. However, a robust and
general theoretical model to predict the formation enthalpy of
an ordered compound in a multicomponent alloy is currently
lacking.
Materials Today � Volume 19, Number 6 � July/August 2016 RESEARCH
FIGURE 6
The formation enthalpy of the binary intermetallic compounds HIM
obtained through the first-principles calculations was well correlation withHmix for �325 atomic pairs formed among 26 metallic elements (Mg, Al, Sc,
Ti, V, Cr, Mn, Fe, Co, Ni, Cu, Zn, Y, Zr, Nb, Mo, Rh, Pd, Ag, Cd, La, Hf, Ta, W,
Pt, and Au). Only the data for three atomic pairs (Al–Cd, Fe–Nd, and Fe–Ta)
are noted to be out of the linear trend.
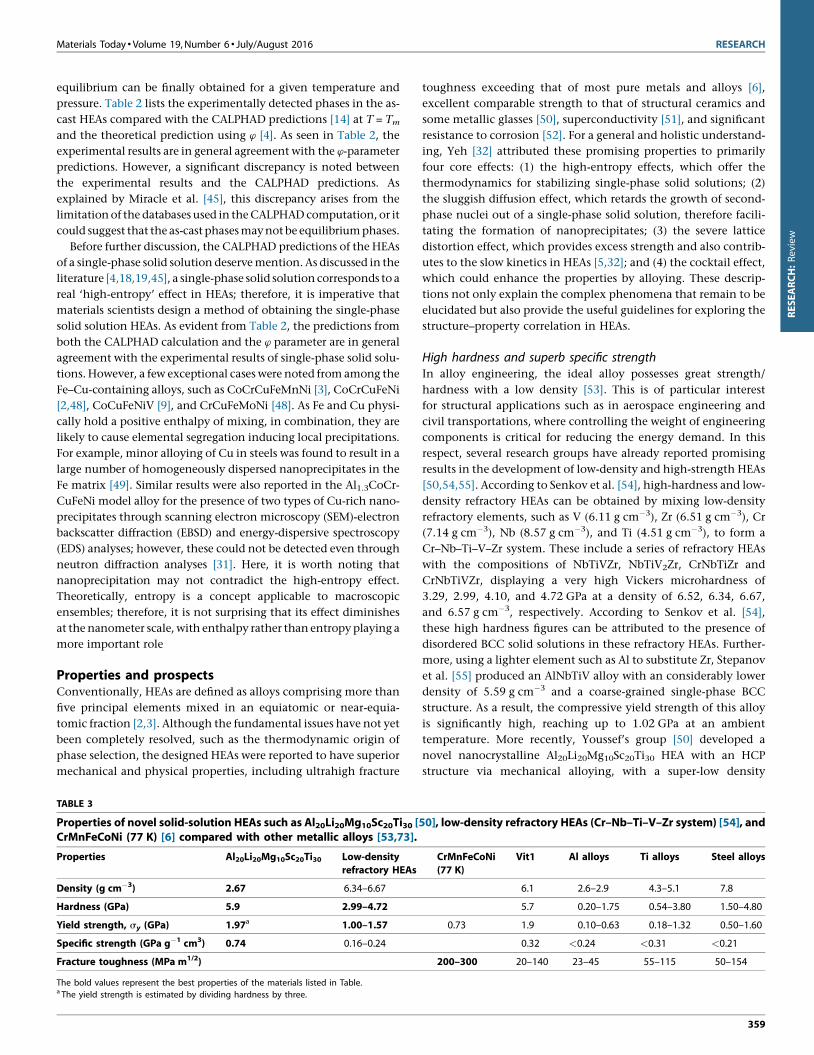
FIGURE 7
The groupings of different-phased HEAs based on their intrinsic root-mean-
square (RMS) residual strains. The inset illustrates the atomic size alterationto accommodate close atomic packing atoms in the lattice of a
multicomponent alloy, and the dashed cycles indicate the original atomic
size, and the arrows indicate the accommodation directions.
RESEARCH:Review
Valence electron concentration ruleThe aforementioned thermodynamic rules prove useful guidelines
in selecting phases in HEAs, that is, whether they form a single
phase or multiple phases. However, an additional rule or parame-
ter is required for the type of phase, such as FCC, BCC, or hexago-
nal close packed (HCP), that is formed in an HEA. According to the
Hume–Rothery rule [39], the valence electron concentration
(VEC) of an alloy constitutes another critical parameter that can
influence the crystallinity of a solid solution phase in the absence
of a strong atomic size effect [28]. When the d-electrons in the
valence band are included, the average VEC of an alloy can be
computed as VEC ¼Pn
i¼1ciðVECÞi where (VEC)i is the VEC for the
ith element [28]. Guo et al. [28] and Poletti and Battezzati [40]
showed that HEAs with FCC possess a VEC > 8.0, whereas those
with BCC possess a VEC > 6.87. For a holistic analysis, Fig. 5c
shows the plot of VEC versus f for a total of �90 cast HEAs,
including a multiphased structure, metallic glasses, as well as
single-phase FCC, BCC, and HCP solid solutions that have been
discovered recently. Evidently, the VEC of the alloys plays a crucial
role in determining the crystallinity of the solid solution phases,
particularly for single-phase solid solutions. Within the region of
the single-phase solid solution (f > fc � 20), FCC prevails around a
VEC of 8.5 (1.0), BCC around a VEC of 5 (0.7), and HCP
around a VEC of 2.8 (0.2). However, this clear distinction be-
tween phases disappears when the HEAs fall under other phase
regions (f < fc), where other effects such as atomic size difference
override the effect of VEC (Fig. 5c).
Intrinsic residual strain and lattice instabilityAs mentioned previously, in general, mixing different-sized atoms
into a common lattice leads to the development of intrinsic
residual strains. This is termed as the ‘atomic size rule’ in conven-
tional alloys, a well-known Hume–Rothery rule frequently used to
explain the solubility of solute atoms in an alloy [39]. To rational-
ize this atomic size effect, Eshelby [41] developed a quantitative
micromechanical model a few decades ago based on the continu-
um elasticity theory, which simply considers solute atoms to
solvent atoms as an analogue of inclusions to an elastic medium.
However, Eshelby’s approach poses a challenge when applied
directly in the study of HEAs, because of their lack of apparent
distinction between solvent and solute atoms. To circumvent this
problem, a geometric model was recently developed for HEAs [18].
Basically, to prevent the formation of empty spaces or overlapping
of atoms in a lattice, as illustrated in Fig. 4a, the size of atoms must
be adjusted for dense atomic packing, as manifested by the sharp
diffraction peaks obtained from most HEAs. This change in the
atomic size gives rise to the intrinsic residual strains, as illustrated
by the inset of Fig. 7, which can be deduced by minimizing the
atomic packing misfit [18].
Being ‘intrinsic’, these residual strains arise from phase forma-
tion and possess a zero average. Therefore, they cannot be detected
in a typical XRD spectrum like the residual strains around crystal-
line defects, the latter of which generally reduces with thermal
annealing [42]. However, the fluctuation in these residual strains,
as manifested by their root mean square eRMS, is not zero, which
can be correlated with the elastic energy storage in an HEA, serving
as the ‘driving force’ for phase transition. As shown in Fig. 7, a cast
HEA tends to form a single-phase solid solution if eRMS is <5%, an
amorphous structure if eRMS is >10%, and a multiphase structure if
eRMS lies between 5% and 10%. These findings are consistent with
Lindemann’s criterion of lattice instability [43]. Nevertheless, it
should be emphasized that, at best, the criteria based on residual
strains are necessary conditions as the chemical effects are
neglected.
357
RESEARCH Materials Today � Volume 19, Number 6 � July/August 2016
RESEARCH:Review
Phase selection in HEAs: the computational approachAs mentioned previously, because of the large number of possible
HEAs, it would be impossible to look for useful alloys by a trial-and-
error method by examining every alloy composition [5,44,45].
Furthermore, the more elements in an alloy the more difficult the
construction of its phase diagram. In such cases, in addition to
theoretical modeling [4,18,19,27,28], computational approaches,
such as density functional theory (DFT) calculations [46] and ab
initio molecular dynamics (AIMD) [26] simulations, can be used to
study phase formation in HEAs. However, due to the significant
cost and computational time required for the current technology,
among other limitations [5], these approaches are not suitable for
high-throughput large-scale screening of alloy compositions in
the design of HEAs. Alternatively, a semiempirical computational
approach, generally termed as calculations of phase diagrams
(CALPHAD), can be used to predict equilibrium phases in HEAs
[14,26,30,45]. Based on the existing data obtained from binary and
ternary systems, CALPHAD can predict the equilibrium phase(s) of
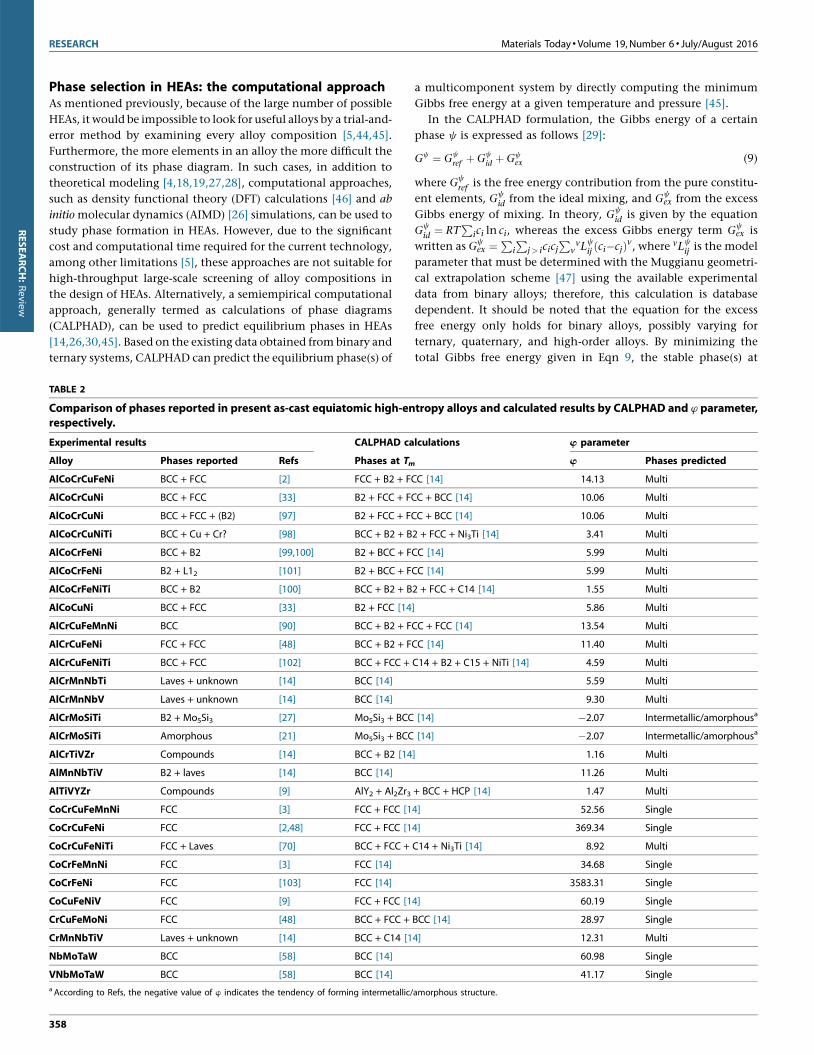
TABLE 2
Comparison of phases reported in present as-cast equiatomic high-enrespectively.
Experimental results CALPHAD ca
Alloy Phases reported Refs Phases at Tm
AlCoCrCuFeNi BCC + FCC [2] FCC + B2 + FC
AlCoCrCuNi BCC + FCC [33] B2 + FCC + FC
AlCoCrCuNi BCC + FCC + (B2) [97] B2 + FCC + FC
AlCoCrCuNiTi BCC + Cu + Cr? [98] BCC + B2 + B
AlCoCrFeNi BCC + B2 [99,100] B2 + BCC + F
AlCoCrFeNi B2 + L12 [101] B2 + BCC + F
AlCoCrFeNiTi BCC + B2 [100] BCC + B2 + B
AlCoCuNi BCC + FCC [33] B2 + FCC [14
AlCrCuFeMnNi BCC [90] BCC + B2 + F
AlCrCuFeNi FCC + FCC [48] BCC + B2 + F
AlCrCuFeNiTi BCC + FCC [102] BCC + FCC +
AlCrMnNbTi Laves + unknown [14] BCC [14]
AlCrMnNbV Laves + unknown [14] BCC [14]
AlCrMoSiTi B2 + Mo5Si3 [27] Mo5Si3 + BCC
AlCrMoSiTi Amorphous [21] Mo5Si3 + BCC
AlCrTiVZr Compounds [14] BCC + B2 [14
AlMnNbTiV B2 + laves [14] BCC [14]
AlTiVYZr Compounds [9] AlY2 + Al2Zr3
CoCrCuFeMnNi FCC [3] FCC + FCC [1
CoCrCuFeNi FCC [2,48] FCC + FCC [1
CoCrCuFeNiTi FCC + Laves [70] BCC + FCC +
CoCrFeMnNi FCC [3] FCC [14]
CoCrFeNi FCC [103] FCC [14]
CoCuFeNiV FCC [9] FCC + FCC [1
CrCuFeMoNi FCC [48] BCC + FCC +
CrMnNbTiV Laves + unknown [14] BCC + C14 [1
NbMoTaW BCC [58] BCC [14]
VNbMoTaW BCC [58] BCC [14]
a According to Refs, the negative value of w indicates the tendency of forming intermetallic/
358
a multicomponent system by directly computing the minimum
Gibbs free energy at a given temperature and pressure [45].
In the CALPHAD formulation, the Gibbs energy of a certain
phase c is expressed as follows [29]:
Gc ¼ Gcref þ Gc
id þ Gcex (9)
where Gcref is the free energy contribution from the pure constitu-
ent elements, Gcid from the ideal mixing, and Gc
ex from the excess
Gibbs energy of mixing. In theory, Gcid is given by the equation
Gcid ¼ RT
Pici ln ci, whereas the excess Gibbs energy term Gc
ex is
written as Gcex ¼
Pi
Pj > icicj
Pv
vLcij ðci�cjÞv, where vLc
ij is the model
parameter that must be determined with the Muggianu geometri-
cal extrapolation scheme [47] using the available experimental
data from binary alloys; therefore, this calculation is database
dependent. It should be noted that the equation for the excess
free energy only holds for binary alloys, possibly varying for
ternary, quaternary, and high-order alloys. By minimizing the
total Gibbs free energy given in Eqn 9, the stable phase(s) at
tropy alloys and calculated results by CALPHAD and w parameter,
lculations w parameter
w Phases predicted
C [14] 14.13 Multi
C + BCC [14] 10.06 Multi
C + BCC [14] 10.06 Multi
2 + FCC + Ni3Ti [14] 3.41 Multi
CC [14] 5.99 Multi
CC [14] 5.99 Multi
2 + FCC + C14 [14] 1.55 Multi
] 5.86 Multi
CC + FCC [14] 13.54 Multi
CC [14] 11.40 Multi
C14 + B2 + C15 + NiTi [14] 4.59 Multi
5.59 Multi
9.30 Multi
[14] �2.07 Intermetallic/amorphousa
[14] �2.07 Intermetallic/amorphousa
] 1.16 Multi
11.26 Multi
+ BCC + HCP [14] 1.47 Multi
4] 52.56 Single
4] 369.34 Single
C14 + Ni3Ti [14] 8.92 Multi
34.68 Single
3583.31 Single
4] 60.19 Single
BCC [14] 28.97 Single
4] 12.31 Multi
60.98 Single
41.17 Single
amorphous structure.
Materials Today � Volume 19, Number 6 � July/August 2016 RESEARCH
RESEARCH:Review
equilibrium can be finally obtained for a given temperature and
pressure. Table 2 lists the experimentally detected phases in the as-
cast HEAs compared with the CALPHAD predictions [14] at T = Tm
and the theoretical prediction using w [4]. As seen in Table 2, the
experimental results are in general agreement with the w-parameter
predictions. However, a significant discrepancy is noted between
the experimental results and the CALPHAD predictions. As
explained by Miracle et al. [45], this discrepancy arises from the
limitation of the databases used in the CALPHAD computation, or it
could suggest that the as-cast phases may not be equilibrium phases.
Before further discussion, the CALPHAD predictions of the HEAs
of a single-phase solid solution deserve mention. As discussed in the
literature [4,18,19,45], a single-phase solid solution corresponds to a
real ‘high-entropy’ effect in HEAs; therefore, it is imperative that
materials scientists design a method of obtaining the single-phase
solid solution HEAs. As evident from Table 2, the predictions from
both the CALPHAD calculation and the w parameter are in general
agreement with the experimental results of single-phase solid solu-
tions. However, a few exceptional cases were noted from among the
Fe–Cu-containing alloys, such as CoCrCuFeMnNi [3], CoCrCuFeNi
[2,48], CoCuFeNiV [9], and CrCuFeMoNi [48]. As Fe and Cu physi-
cally hold a positive enthalpy of mixing, in combination, they are
likely to cause elemental segregation inducing local precipitations.
For example, minor alloying of Cu in steels was found to result in a
large number of homogeneously dispersed nanoprecipitates in the
Fe matrix [49]. Similar results were also reported in the Al1.3CoCr-
CuFeNi model alloy for the presence of two types of Cu-rich nano-
precipitates through scanning electron microscopy (SEM)-electron
backscatter diffraction (EBSD) and energy-dispersive spectroscopy
(EDS) analyses; however, these could not be detected even through
neutron diffraction analyses [31]. Here, it is worth noting that
nanoprecipitation may not contradict the high-entropy effect.
Theoretically, entropy is a concept applicable to macroscopic
ensembles; therefore, it is not surprising that its effect diminishes
at the nanometer scale, with enthalpy rather than entropy playing a
more important role
Properties and prospectsConventionally, HEAs are defined as alloys comprising more than
five principal elements mixed in an equiatomic or near-equia-
tomic fraction [2,3]. Although the fundamental issues have not yet
been completely resolved, such as the thermodynamic origin of
phase selection, the designed HEAs were reported to have superior
mechanical and physical properties, including ultrahigh fracture
TABLE 3
Properties of novel solid-solution HEAs such as Al20Li20Mg10Sc20Ti30 [5CrMnFeCoNi (77 K) [6] compared with other metallic alloys [53,73].
Properties Al20Li20Mg10Sc20Ti30 Low-density
refractory HEAs
Density (g cm�3) 2.67 6.34–6.67
Hardness (GPa) 5.9 2.99–4.72
Yield strength, sy (GPa) 1.97a 1.00–1.57
Specific strength (GPa g�1 cm3) 0.74 0.16–0.24
Fracture toughness (MPa m1/2)
The bold values represent the best properties of the materials listed in Table.a The yield strength is estimated by dividing hardness by three.
toughness exceeding that of most pure metals and alloys [6],
excellent comparable strength to that of structural ceramics and
some metallic glasses [50], superconductivity [51], and significant
resistance to corrosion [52]. For a general and holistic understand-
ing, Yeh [32] attributed these promising properties to primarily
four core effects: (1) the high-entropy effects, which offer the
thermodynamics for stabilizing single-phase solid solutions; (2)
the sluggish diffusion effect, which retards the growth of second-
phase nuclei out of a single-phase solid solution, therefore facili-
tating the formation of nanoprecipitates; (3) the severe lattice
distortion effect, which provides excess strength and also contrib-
utes to the slow kinetics in HEAs [5,32]; and (4) the cocktail effect,
which could enhance the properties by alloying. These descrip-
tions not only explain the complex phenomena that remain to be
elucidated but also provide the useful guidelines for exploring the
structure–property correlation in HEAs.
High hardness and superb specific strengthIn alloy engineering, the ideal alloy possesses great strength/
hardness with a low density [53]. This is of particular interest
for structural applications such as in aerospace engineering and
civil transportations, where controlling the weight of engineering
components is critical for reducing the energy demand. In this
respect, several research groups have already reported promising
results in the development of low-density and high-strength HEAs
[50,54,55]. According to Senkov et al. [54], high-hardness and low-
density refractory HEAs can be obtained by mixing low-density
refractory elements, such as V (6.11 g cm�3), Zr (6.51 g cm�3), Cr
(7.14 g cm�3), Nb (8.57 g cm�3), and Ti (4.51 g cm�3), to form a
Cr–Nb–Ti–V–Zr system. These include a series of refractory HEAs
with the compositions of NbTiVZr, NbTiV2Zr, CrNbTiZr and
CrNbTiVZr, displaying a very high Vickers microhardness of
3.29, 2.99, 4.10, and 4.72 GPa at a density of 6.52, 6.34, 6.67,
and 6.57 g cm�3, respectively. According to Senkov et al. [54],
these high hardness figures can be attributed to the presence of
disordered BCC solid solutions in these refractory HEAs. Further-
more, using a lighter element such as Al to substitute Zr, Stepanov
et al. [55] produced an AlNbTiV alloy with an considerably lower
density of 5.59 g cm�3 and a coarse-grained single-phase BCC
structure. As a result, the compressive yield strength of this alloy
is significantly high, reaching up to 1.02 GPa at an ambient
temperature. More recently, Youssef’s group [50] developed a
novel nanocrystalline Al20Li20Mg10Sc20Ti30 HEA with an HCP
structure via mechanical alloying, with a super-low density
0], low-density refractory HEAs (Cr–Nb–Ti–V–Zr system) [54], and
CrMnFeCoNi
(77 K)
Vit1 Al alloys Ti alloys Steel alloys
6.1 2.6–2.9 4.3–5.1 7.8
5.7 0.20–1.75 0.54–3.80 1.50–4.80
0.73 1.9 0.10–0.63 0.18–1.32 0.50–1.60
0.32 <0.24 <0.31 <0.21
200–300 20–140 23–45 55–115 50–154
359
RESEARCH Materials Today � Volume 19, Number 6 � July/August 2016
RESEARCH:Review
(<3 g cm�3) but ultra-high strength (�2 GPa), as estimated by
dividing the hardness value by three. As seen in Table 3, this
low-density Al20Li20Mg10Sc20Ti30 HEA is about two to three times
stronger than nanocrystalline Al alloys and even stronger than the
metallic glass Vit1. Furthermore, because of its ultralow density
(�2.67 g cm�3), the Al20Li20Mg10Sc20Ti30 HEA exhibits excellent
specific strength of �0.74 GPa g cm�3, which is comparable to that
of SiC ceramics [50] and several times higher than those of
conventional light alloys, such as Al alloys and Ti alloys (Table 3).
Superior mechanical performance at elevated temperaturesAs discussed earlier, the high mixing entropy in HEAs at elevated
temperatures promotes the formation of single-phase solid solutions
[5,15,51,56,57]. Therefore, this is conducive to the development of
high-temperature structural alloys [5,15,56,57], which can achieve
excellent mechanical performance at high temperatures due to the
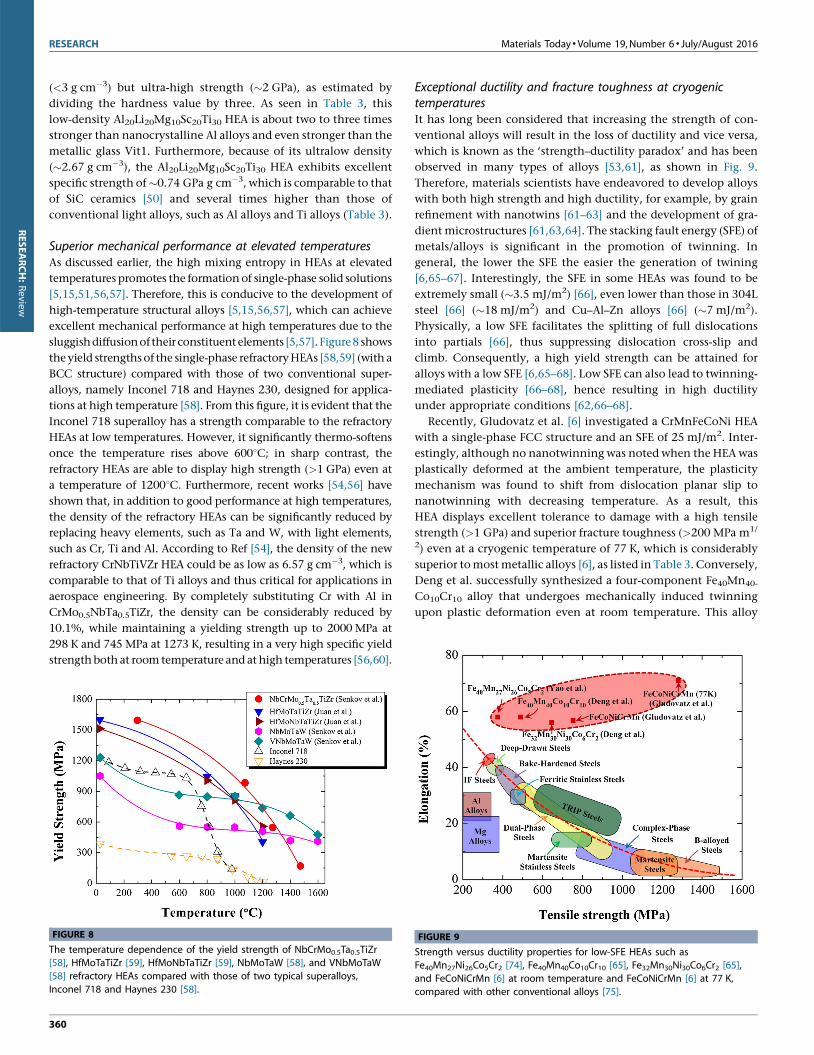
sluggish diffusion oftheir constituent elements [5,57]. Figure 8 shows
the yield strengths of the single-phase refractory HEAs [58,59] (with a
BCC structure) compared with those of two conventional super-
alloys, namely Inconel 718 and Haynes 230, designed for applica-
tions at high temperature [58]. From this figure, it is evident that the
Inconel 718 superalloy has a strength comparable to the refractory
HEAs at low temperatures. However, it significantly thermo-softens
once the temperature rises above 6008C; in sharp contrast, the
refractory HEAs are able to display high strength (>1 GPa) even at
a temperature of 12008C. Furthermore, recent works [54,56] have
shown that, in addition to good performance at high temperatures,
the density of the refractory HEAs can be significantly reduced by
replacing heavy elements, such as Ta and W, with light elements,
such as Cr, Ti and Al. According to Ref [54], the density of the new
refractory CrNbTiVZr HEA could be as low as 6.57 g cm�3, which is
comparable to that of Ti alloys and thus critical for applications in
aerospace engineering. By completely substituting Cr with Al in
CrMo0.5NbTa0.5TiZr, the density can be considerably reduced by
10.1%, while maintaining a yielding strength up to 2000 MPa at
298 K and 745 MPa at 1273 K, resulting in a very high specific yield
strength both at room temperature and at high temperatures [56,60].
FIGURE 8
The temperature dependence of the yield strength of NbCrMo0.5Ta0.5TiZr[58], HfMoTaTiZr [59], HfMoNbTaTiZr [59], NbMoTaW [58], and VNbMoTaW
[58] refractory HEAs compared with those of two typical superalloys,
Inconel 718 and Haynes 230 [58].
360
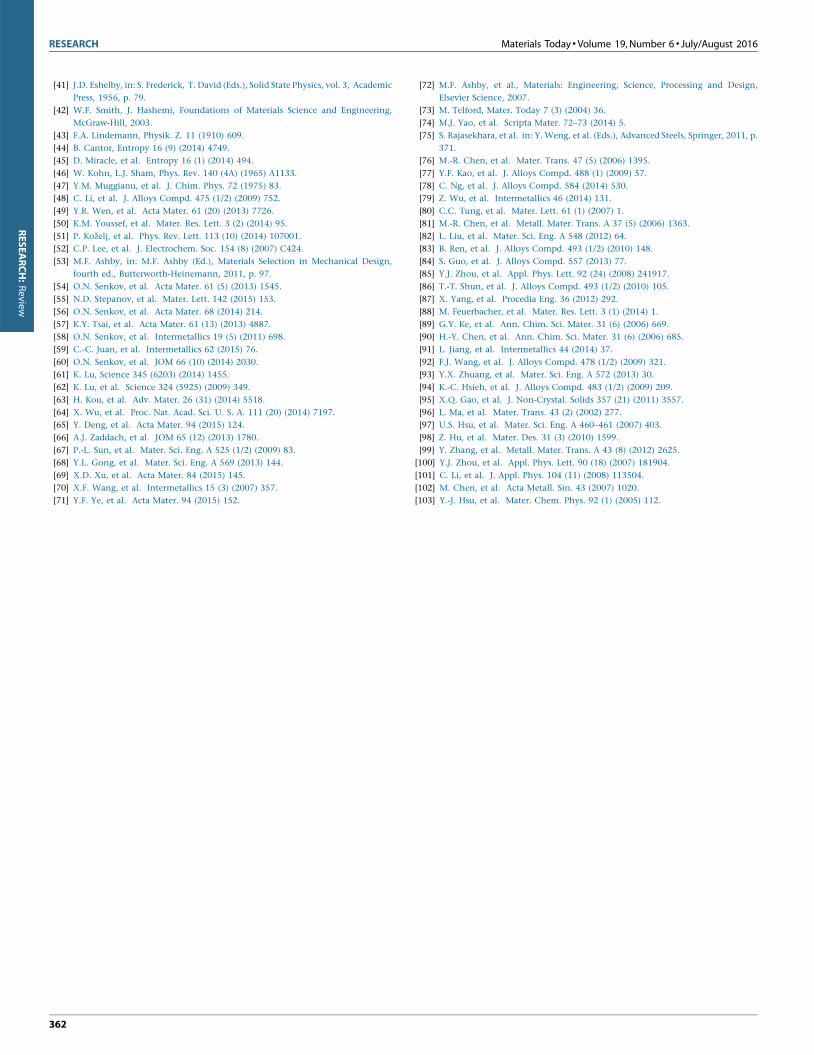
Exceptional ductility and fracture toughness at cryogenictemperaturesIt has long been considered that increasing the strength of con-
ventional alloys will result in the loss of ductility and vice versa,
which is known as the ‘strength–ductility paradox’ and has been
observed in many types of alloys [53,61], as shown in Fig. 9.
Therefore, materials scientists have endeavored to develop alloys
with both high strength and high ductility, for example, by grain
refinement with nanotwins [61–63] and the development of gra-
dient microstructures [61,63,64]. The stacking fault energy (SFE) of
metals/alloys is significant in the promotion of twinning. In
general, the lower the SFE the easier the generation of twining
[6,65–67]. Interestingly, the SFE in some HEAs was found to be
extremely small (�3.5 mJ/m2) [66], even lower than those in 304L
steel [66] (�18 mJ/m2) and Cu–Al–Zn alloys [66] (�7 mJ/m2).
Physically, a low SFE facilitates the splitting of full dislocations
into partials [66], thus suppressing dislocation cross-slip and
climb. Consequently, a high yield strength can be attained for
alloys with a low SFE [6,65–68]. Low SFE can also lead to twinning-
mediated plasticity [66–68], hence resulting in high ductility
under appropriate conditions [62,66–68].
Recently, Gludovatz et al. [6] investigated a CrMnFeCoNi HEA
with a single-phase FCC structure and an SFE of 25 mJ/m2. Inter-
estingly, although no nanotwinning was noted when the HEA was
plastically deformed at the ambient temperature, the plasticity
mechanism was found to shift from dislocation planar slip to
nanotwinning with decreasing temperature. As a result, this
HEA displays excellent tolerance to damage with a high tensile
strength (>1 GPa) and superior fracture toughness (>200 MPa m1/
2) even at a cryogenic temperature of 77 K, which is considerably
superior to most metallic alloys [6], as listed in Table 3. Conversely,
Deng et al. successfully synthesized a four-component Fe40Mn40-
Co10Cr10 alloy that undergoes mechanically induced twinning
upon plastic deformation even at room temperature. This alloy
FIGURE 9
Strength versus ductility properties for low-SFE HEAs such asFe40Mn27Ni26Co5Cr2 [74], Fe40Mn40Co10Cr10 [65], Fe32Mn30Ni30Co6Cr2 [65],
and FeCoNiCrMn [6] at room temperature and FeCoNiCrMn [6] at 77 K,
compared with other conventional alloys [75].

Materials Today � Volume 19, Number 6 � July/August 2016 RESEARCH
RESEARCH:Review
possesses a single-phase FCC solid solution structure with compa-
rable tensile properties to that of the CrMnFeCoNi HEA [65]. As
seen in Fig. 9, the single-phase low-SFE HEAs clearly exhibit a trend
of ‘the stronger being more ductile’, which is contrary to the
behaviors of most conventional alloys known to date. Here, it is
worth noting that nanotwinning may not be the only strength-
ening mechanism responsible for this unusual mechanical behav-
ior; solid solution strengthening has also been found to play an
important role.
Novel functional propertiesIn addition to their promising mechanical properties, some HEAs
also exhibit interesting functional properties due to their high
configurational entropy, which limits precipitation, if any, at a
nanometer scale [69]. For instance, both Ti0.8CoCrCuFeNi and
TiCoCrCuFeNi HEAs were reported to have superparamagnetic
properties [70], and the Ta34Nb33Hf8Zr14Ti11 HEA [51] with an
average BCC structure was also found to display superconductivity
at the critical temperature of Tc 7.3 K. This suggests that the HEA
could be used in strong superconducting electromagnets such as
magnetic resonance imaging (MRI) scanners, nuclear magnetic
resonance (NMR) machines, and particle accelerators, like several
other type II superconductors. Although the physical mechanisms
underlying these interesting phenomena remain to be elucidated
[51], the combination of promising physical properties, such as
high saturation magnetization, electrical resistivity, and mallea-
bility, as well as low coercivity, points to the great potential of
HEAs as functional materials.
Summary and outlookThe advent of HEAs, which are composed of multiple principal
elements unlike conventional alloys with one and rarely two base
elements, point to a paradigmatic shift in the design of modern
alloys. The mechanical/physical/chemical properties of HEAs, as
novel alloys, are yet to be investigated. However, challenges
related to the fundamental issues have emerged, such as the
formation of different phases in HEAs. In addition, due to the
exceedingly high number of possible compositions for HEAs,
although only a few may prove useful, identifying useful alloy
compositions via the traditional trial-and-error method has be-
come difficult, which calls for an efficient high-throughput meth-
od for alloy screening [4,14,38]. In turn, this has led to the recent
development of new theories, models, and methods that apply not
only to conventional alloys but also to HEAs [4,18,28,38,40,71].
Despite these recent advancements, the atomistic mechanisms
governing phase formation in HEAs must be investigated further.
In spite of these challenges, the HEAs were found to have novel
properties such as superb specific strength, excellent mechanical
performance at high temperature, exceptional ductility and fracture
toughness at cryogenic temperatures, superparamagnetism, and
superconductivity. These properties are promising for new discov-
eries and inventions in future, which may ultimately lead to new
applications. For instance, HEAs as light as Al alloys but stronger
than some metallic glasses [50] can be used in the transportation
industry and energy sectors, where lightweight high-strength mate-
rials are in great demand [45]. HEAs containing refractory elements
such as Nb, Mo, and Ta can maintain their high strength even above
12008C, superior to traditional superalloys such as Inconel 718 and
Haynes 230 [58]. These HEAs can be used in high-temperature
applications, such as gas turbines, rocket nozzles, and nuclear
construction [72]. Low-density refractory HEAs can also be applied
in the aerospace industry, where lightweight materials tolerant to
high temperatures are in demand [58]. The outstanding cryogenic
properties of HEAs make them an excellent choice for cryogenic
applications such as rocket casings, pipework, and liquid O2 or N2
equipment [72]. In view of these promising findings, we believe that
more HEAs with promising properties can be discovered with fur-
ther advancements, thereby promoting the applications of metallic
material in industries, which were previously limited.
AcknowledgmentsYY is grateful for the financial support provided by the Hong Kong
Government through the General Research Fund (GRF) with the
grant number of CityU11207215 and through the joint GRF-NSFC
fund with the grant number of N_CityU116/14.
References
[1] R.E. Hummel, Understanding Materials Science, second ed., Springer-Verlag,
2004.
[2] J.W. Yeh, et al. Adv. Eng. Mater. 6 (5) (2004) 299.
[3] B. Cantor, et al. Mater. Sci. Eng. A 375–377 (2004) 213.
[4] Y.F. Ye, et al. Scripta Mater. 104 (2015) 53.
[5] Y. Zhang, et al. Progr. Mater. Sci. 61 (2014) 1.
[6] B. Gludovatz, et al. Science 345 (6201) (2014) 1153.
[7] M.A. Hemphill, et al. Acta Mater. 60 (16) (2012) 5723.
[8] S.Q. Xia, et al. JOM (2015) 1.
[9] Y. Zhang, et al. Adv. Eng. Mater. 10 (6) (2008) 534.
[10] R.A. Swalin, Thermodynamics of Solids, Wiley, 1962.
[11] K. Guan-Yu, et al., FCC and BCC equivalents in as-cast solid solutions of
Al[x]Co[y]Cr[z]Cu[0.5]Fe[v]Ni[w] high-entropy alloys, Cachan, France, 2006.
p. 669.
[12] H.Y. Ding, K.F. Yao, J. Non-Crystal. Solids 364 (1) (2013) 9.
[13] J.Y. He, et al. Acta Mater. 62 (2014) 105.
[14] O.N. Senkov, et al. Nat Commun. (2015) 6.
[15] O.N. Senkov, et al. Intermetallics 18 (9) (2010) 1758.
[16] A. Takeuchi, et al. JOM 66 (10) (2014) 1984.
[17] R.A. Oriani, Advances in Chemical Physics, John Wiley & Sons, Inc., 2007. p.
119.
[18] Y.F. Ye, et al. Intermetallics 59 (2015) 75.
[19] A. Takeuchi, et al. Entropy 15 (2013) 3810.
[20] A. Inoue, et al. J. Non-Crystal. Solids 156–158 (Pt 2) (1993) 473.
[21] S. Guo, C.T. Liu, Progr. Nat. Sci.: Mater. Int. 21 (6) (2011) 433.
[22] G.A. Mansoori, et al. J. Chem. Phys. 54 (4) (1971) 1523.
[23] A. Luca, F. Giuseppe, J. Phys.: Condens. Matter 19 (25) (2007) 256207.
[24] S. Singh, et al. Acta Mater. 59 (2011) 182.
[25] A. Takeuchi, et al. Intermetallics 19 (10) (2011) 1546.
[26] M. Gao, D. Alman, Entropy 15 (10) (2013) 4504.
[27] X. Yang, Y. Zhang, Mater. Chem. Phys. 132 (2/3) (2012) 233.
[28] S. Guo, et al. J. Appl. Phys. 109 (10) (2011).
[29] H. Lukas, Suzana G. Fries, B. Sundman, Computational Thermodynamics, Cam-
bridge University Press, 2007.
[30] C. Zhang, et al. JOM 64 (7) (2012) 839.
[31] L.J. Santodonato, et al. Nat Commun. (2015) 6.
[32] J.W. Yeh, Eur. J. Control 31 (6) (2006) 633.
[33] J.W. Yeh, et al. Mater. Chem. Phys. 103 (1) (2007) 41.
[34] J.W. Yeh, et al. Metall. Mater. Trans. A: Phys. Metall. Mater. Sci. 35 (8) (2004)
2533.
[35] C.J. Tong, et al. Metall. Mater. Trans. A: Phys. Metall. Mater. Sci. 36 (4) (2005)
881.
[36] L. Liu, et al. Mater. Des. 44 (2013) 223.
[37] Y. Zhang, et al. MRS Commun. 4 (2) (2014) 57.
[38] M.C. Troparevsky, et al. Phys. Rev. X 5 (1) (2015) 011041.
[39] U. Mizutani, Hume–Rothery Rules for Structurally Complex Alloy Phases, CRC
Press, 2010.
[40] M.G. Poletti, L. Battezzati, Acta Mater. 75 (2014) 297.
361
RESEARCH Materials Today � Volume 19, Number 6 � July/August 2016
RESEARCH:Review
[41] J.D. Eshelby, in: S. Frederick, T. David (Eds.), Solid State Physics, vol. 3, Academic
Press, 1956, p. 79.
[42] W.F. Smith, J. Hashemi, Foundations of Materials Science and Engineering,
McGraw-Hill, 2003.
[43] F.A. Lindemann, Physik. Z. 11 (1910) 609.
[44] B. Cantor, Entropy 16 (9) (2014) 4749.
[45] D. Miracle, et al. Entropy 16 (1) (2014) 494.
[46] W. Kohn, L.J. Sham, Phys. Rev. 140 (4A) (1965) A1133.
[47] Y.M. Muggianu, et al. J. Chim. Phys. 72 (1975) 83.
[48] C. Li, et al. J. Alloys Compd. 475 (1/2) (2009) 752.
[49] Y.R. Wen, et al. Acta Mater. 61 (20) (2013) 7726.
[50] K.M. Youssef, et al. Mater. Res. Lett. 3 (2) (2014) 95.
[51] P. Kozelj, et al. Phys. Rev. Lett. 113 (10) (2014) 107001.
[52] C.P. Lee, et al. J. Electrochem. Soc. 154 (8) (2007) C424.
[53] M.F. Ashby, in: M.F. Ashby (Ed.), Materials Selection in Mechanical Design,
fourth ed., Butterworth-Heinemann, 2011, p. 97.
[54] O.N. Senkov, et al. Acta Mater. 61 (5) (2013) 1545.
[55] N.D. Stepanov, et al. Mater. Lett. 142 (2015) 153.
[56] O.N. Senkov, et al. Acta Mater. 68 (2014) 214.
[57] K.Y. Tsai, et al. Acta Mater. 61 (13) (2013) 4887.
[58] O.N. Senkov, et al. Intermetallics 19 (5) (2011) 698.
[59] C.-C. Juan, et al. Intermetallics 62 (2015) 76.
[60] O.N. Senkov, et al. JOM 66 (10) (2014) 2030.
[61] K. Lu, Science 345 (6203) (2014) 1455.
[62] K. Lu, et al. Science 324 (5925) (2009) 349.
[63] H. Kou, et al. Adv. Mater. 26 (31) (2014) 5518.
[64] X. Wu, et al. Proc. Nat. Acad. Sci. U. S. A. 111 (20) (2014) 7197.
[65] Y. Deng, et al. Acta Mater. 94 (2015) 124.
[66] A.J. Zaddach, et al. JOM 65 (12) (2013) 1780.
[67] P.-L. Sun, et al. Mater. Sci. Eng. A 525 (1/2) (2009) 83.
[68] Y.L. Gong, et al. Mater. Sci. Eng. A 569 (2013) 144.
[69] X.D. Xu, et al. Acta Mater. 84 (2015) 145.
[70] X.F. Wang, et al. Intermetallics 15 (3) (2007) 357.
[71] Y.F. Ye, et al. Acta Mater. 94 (2015) 152.
362
[72] M.F. Ashby, et al., Materials: Engineering, Science, Processing and Design,
Elsevier Science, 2007.
[73] M. Telford, Mater. Today 7 (3) (2004) 36.
[74] M.J. Yao, et al. Scripta Mater. 72–73 (2014) 5.
[75] S. Rajasekhara, et al. in: Y. Weng, et al. (Eds.), Advanced Steels, Springer, 2011, p.
371.
[76] M.-R. Chen, et al. Mater. Trans. 47 (5) (2006) 1395.
[77] Y.F. Kao, et al. J. Alloys Compd. 488 (1) (2009) 57.
[78] C. Ng, et al. J. Alloys Compd. 584 (2014) 530.
[79] Z. Wu, et al. Intermetallics 46 (2014) 131.
[80] C.C. Tung, et al. Mater. Lett. 61 (1) (2007) 1.
[81] M.-R. Chen, et al. Metall. Mater. Trans. A 37 (5) (2006) 1363.
[82] L. Liu, et al. Mater. Sci. Eng. A 548 (2012) 64.
[83] B. Ren, et al. J. Alloys Compd. 493 (1/2) (2010) 148.
[84] S. Guo, et al. J. Alloys Compd. 557 (2013) 77.
[85] Y.J. Zhou, et al. Appl. Phys. Lett. 92 (24) (2008) 241917.
[86] T.-T. Shun, et al. J. Alloys Compd. 493 (1/2) (2010) 105.
[87] X. Yang, et al. Procedia Eng. 36 (2012) 292.
[88] M. Feuerbacher, et al. Mater. Res. Lett. 3 (1) (2014) 1.
[89] G.Y. Ke, et al. Ann. Chim. Sci. Mater. 31 (6) (2006) 669.
[90] H.-Y. Chen, et al. Ann. Chim. Sci. Mater. 31 (6) (2006) 685.
[91] L. Jiang, et al. Intermetallics 44 (2014) 37.
[92] F.J. Wang, et al. J. Alloys Compd. 478 (1/2) (2009) 321.
[93] Y.X. Zhuang, et al. Mater. Sci. Eng. A 572 (2013) 30.
[94] K.-C. Hsieh, et al. J. Alloys Compd. 483 (1/2) (2009) 209.
[95] X.Q. Gao, et al. J. Non-Crystal. Solids 357 (21) (2011) 3557.
[96] L. Ma, et al. Mater. Trans. 43 (2) (2002) 277.
[97] U.S. Hsu, et al. Mater. Sci. Eng. A 460–461 (2007) 403.
[98] Z. Hu, et al. Mater. Des. 31 (3) (2010) 1599.
[99] Y. Zhang, et al. Metall. Mater. Trans. A 43 (8) (2012) 2625.
[100] Y.J. Zhou, et al. Appl. Phys. Lett. 90 (18) (2007) 181904.
[101] C. Li, et al. J. Appl. Phys. 104 (11) (2008) 113504.
[102] M. Chen, et al. Acta Metall. Sin. 43 (2007) 1020.
[103] Y.-J. Hsu, et al. Mater. Chem. Phys. 92 (1) (2005) 112.