Embed Size (px)
Citation preview
UCRL-JRNL-217367
High Energy K(alpha)Radiography UsingHigh-intensity, Short-pulseLasers
H.-S. Park, N. Izumi, M. H. Key, J. A. King, J. A. Koch, O. L. Landen, P.K. Patel, D. F. Price, B. A. Remington, H. F. Robey, R. A. Snavely, M.Tabak, R. P. J. Town, J. E. Wickersham, C. Stoeckl, M. Storm, W.Theobald, D. M. Chambers, R. Eagelton, T. Goldsack, R. J. Clarke, R.Heathcote, E. Giraldez, A. Nikroo, D. A. Steinman, R. B. Stephens, B.B. Zhang
November 29, 2005
Physics of Plasmas

Disclaimer
This document was prepared as an account of work sponsored by an agency of the United States Government. Neither the United States Government nor the University of California nor any of their employees, makes any warranty, express or implied, or assumes any legal liability or responsibility for the accuracy, completeness, or usefulness of any information, apparatus, product, or process disclosed, or represents that its use would not infringe privately owned rights. Reference herein to any specific commercial product, process, or service by trade name, trademark, manufacturer, or otherwise, does not necessarily constitute or imply its endorsement, recommendation, or favoring by the United States Government or the University of California. The views and opinions of authors expressed herein do not necessarily state or reflect those of the United States Government or the University of California, and shall not be used for advertising or product endorsement purposes.

1
High Energy Kα Radiography Using High-intensity, Short-pulse Lasers
H.-S. Park, N. Izumi, M. H. Key, J. A. King, J. A. Koch, O. L. Landen, P. K. Patel, D. F. Price, B.A. Remington, H. F. Robey, R. A. Snavely, M. Tabak, R. P. J. Town, J. E. Wickersham
LLNL, Livermore, CA, USA
C. Stoeckl, M. Storm, W. TheobaldLLE, Rochester, NY, USA
D. M. Chambers, R. Eagleton, T. GoldsackAWE, Aldermaston, Reading, RG7 4PR, UK
R. J. Clarke, R. HeathcoteCCLRC/RAL, Chilton, Didcot, OX11 0QX, UK
E. Giraldez, A. Nikroo, D. A. Steinman, R. B. StephensGA, San Diego, CA, USA
B. B. ZhangUC Davis, Davis, CA, USA
Abstract
We have performed experiments using Callisto, the Vulcan 100 TW and the Vulcan Petawatt
high intensity lasers to understand the characteristics of high energy, Kα x-ray sources and to
implement workable radiography solutions at 20-100 keV. Our measurements show that the Kα
size from a simple foil target is larger than 60 µm, far larger than the experiment resolution
requirement. The total Kα yield is independent of target thicknesses verifying that refluxing
plays a major role in photon generation. Smaller radiating volumes emit brighter Kα radiation. 1-
D radiography experiments using small-edge-on foils resolved 10 µm features with high contrast.
We tested a variety of small volume 2-D point sources such as cones, wires, and embedded
wires, measuring photon yields and comparing our measurements with predictions from hybrid-
PIC LSP simulations. In addition to high-energy, high-resolution backlighters, future
experiments will also need imaging detectors and diagnostic tools that are workable in the 20-
100 keV energy range. An initial look at some of these detector issues is also presented.
2
1. Introduction
Many high energy density (HED) facilities utilize x-ray backlighters to diagnose and image
the evolution of planar, convergent, and other more complex geometry hydrodynamic
experiments. To date, these backlighters have EX < 9 keV, as they are emitted by thermal
plasmas created with long-pulse lasers. In the future, experiments at new facilities such as
Omega-EP, ZR, and NIF will have larger and denser targets, which will require x-ray probes
with 20-100 keV x-rays (and perhaps up to 1 MeV) and need better than 10 µm spatial
resolution. High-energy Kα x-ray sources can be created through energetic electron interactions
in the target material after irradiation by high-intensity, short-pulse lasers with intensities IL
>1017 W/cm2.
In this work we present high resolution high energy radiography results with >20 keV x-rays
generated from high-energy, high-intensity, short pulse lasers. The paper is organized as
follows: In section 2, we describe how these experiments were motivated by the radiography
requirements for the next generation high energy density (HED) experiments. Section 3
describes the experimental set-up. Section 4 describes experimental results on the high energy
Kα conversion efficiencies as function of various laser parameters and compares the results to
model calculations; Section 5 describes the application to 1D and 2 D radiography and Section 6
summarizes the paper
2. Motivation and Radiographic Requirements
Time-resolved radiography is an essential diagnostic capability in many HED experiments.
We take as an example a material strength experiment that measures the Rayleigh-Taylor

3
instability growth rate in an Al sample using a 4.3 keV backlighter to derive material strength
parameters under high pressure [Lorenz05, Remington04] A second example is a study of
hydrodynamic jets where induced symmetric and asymmetric jets and turbulence under
hydrodynamic condition are radiographed using a 4.7 keV backlighter to obtain the density
evolution. [Blue05; Foster05] A third example involves radiography of imploding capsules. The
instability between 2 different materials is imaged using a 6.175 keV crystal monochromatic
imaging system at the Z facility. [Sinars04] The 1-9 keV backlighters used in these experiments
is a proven and well-established application of the thermal emission of plasmas created by long-
pulse lasers.
Future experiments on new facilities such as NIF, [Hogan01], however, will have larger,
denser, and higher-Z targets than previously fielded. These will require x-ray probes with 20-100
keV x rays and possibly up to 1 MeV. Such research includes the study of material strength
[Remington06] and EOS under high pressure [Celliers04, Koenig04], mid to high Z capsule
implosion experiments [Dittrich99], and studies of high ρR cores for double-shell ignition
experiments [Amendt05]. The requirements on the probing x-ray photon energy, spatial
resolution and signal to noise ratio needed to yield quantitative measurements from the
radiographic images are derived from the planned HED experiments for NIF. The x-ray photon
energy requirement depends on the target density, thickness, and Z, and typically corresponds to
a total optical depth of about one mean free path. The spatial resolution requirement comes from
the feature sizes that need to be resolved. If we apply a point projection radiography technique,
we will need the effective x-ray spot size smaller than the desired spatial resolution. The signal
to noise ratio requirement comes from the need to obtain an observable contrast between features
of different thicknesses. In most of the HED experiments, we need to differentiate small features
4
on top of a thick substrate. An example of features needing to be diagnosed could be Rayleigh-
Taylor induced growth of capsule surface imperfections. In order to probe the thick substrate
layer, we need high flux; in order to differentiate the small thickness variation, we will need a
high signal to noise ratio for the lowest transmitting object in the image.
Before we develop practical radiography techniques, we need to understand the high energy
x-ray source characteristics from the laser-plasma interactions: the mechanism of the high-
energy x-ray photon generation, the x-ray spot size, the conversion efficiency from laser energy
to x-ray photon energy, the angular distribution, and the background spectrum. We will also need
the capability for comprehensive simulations to understand the underlying physics in these
processes and to scale to the higher energy petawatt lasers planned for Omega-EP, Z-Petawatt,
and NIF-ARC.
The Kα emission mechanism using high intensity lasers is a promising way of creating 20-
100 keV high energy photons. As depicted in Fig 1 when a laser with intensity >1017 W/cm2
strikes a target, a forward directed “spray” of energetic electrons is created, with energies as high
as ~100 MeV. [Key98]. This forward current draws a return current, and a very strong azimuthal
magnetic field is created, with strengths predicted to be 10-100 MG or higher, as illustrated
schematically in Fig. 1. As these energetic electrons traverse the target, bound electrons can be
knocked out by electron-electron scattering. If a K-shell electron is knocked out, this inner shell
vacancy is quickly filled by an L-shell or M-shell electron, generating isotropic Kα or Kβ
radiation. This monoenergetic line radiation sits on top of a smooth Brehsstrahlung background.
For mid-to-high Z elements, these Kα x-rays can have energies of 20-100 keV, making them
ideally suited for high energy radiography. Indeed researchers in the medical community have
developed techniques for coronary angiography using x-rays from lasers with 100 fs to 5 ps

5
pulse duration [Anderson01, Toth05] However, the laser energies for these applications are
typically ~10 mJ yielding relatively few x-ray photons per pulse. This quantity is not enough to
do single-shot radiographic imaging; the medical community uses multiple pulses to accumulate
enough photons per resolution element. In addition, the required spatial resolution for medical
imaging is modest (100 – 500 µm.) For our HED experiments, we need to radiograph a
dynamically evolving object in a single shot, which requires a high-energy, high-intensity, short-
pulse lasers.
3. Experimental Set-Up
In order to understand the Kα source characteristics and to test high energy radiography
concepts, we performed several experiments using short pulse high intensity lasers at the Callisto
laser at LLNL and the Vulcan 100 TW and Vulcan Petawatt lasers at Rutherford Appleton
Laboratory, UK. The Vulcan petawatt laser energy was varied between 100 to 400 J with pulse
duration between 0.4 ps to 70 ps. The spot size diameter (defined to contain 50% of the laser
energy) was varied between 7 µm at best focus to 42 µm by moving the target 300 µm towards
the focusing parabola. We fielded imaging detectors and spectrometers to measure the high
energy x-ray spot sizes and x-ray spectra, and to radiograph test targets. Specifically, we
employed single photon counting camera, a crystal Kα imager, a HOPG spectrometer, and
CsI/CCD or Imaging Plate detectors to measure the absolute Kα yields and the x-ray source size.
3.1 Single Photon Counting Camera
The use of a low-noise CCD camera as an x-ray spectrometer is a well established technique
[Nishiuchi99] where the x-ray photon hits are captured in a single or a few adjacent pixels and
6
the total deposited intensity is proportional to the incoming x-ray photon energy. For a CCD
camera, the bandgap of the Si material is 3.65 eV; a 1 keV x-ray photon, if absorbed completely
in one pixel, will produce 274 photoelectrons (pe). For scientific-grade CCD cameras, a typical
digitization level is ~1 pe per digitization level (ADU) and the noise is <10 pe enabling us to
detect multiple keV x-rays with ease. In this operation, the x-ray hits should be sparse on the
CCD so that individual photon hits are well resolved and not overlapping with neighboring x-ray
hits. For this experiment we employed a commercial CCD camera, SI-800, manufactured by
Spectral Instruments, AZ. We have calibrated the single photon detection efficiency using
radioactive Fe55 and Cd109 sources. The dominant radiation from the Fe55 isotope is 5.9 keV
Mn Kα x-rays, and from the Cd109 source 22.0 keV Ag Kα x-rays. The absolute x-ray level is
measured with calibrated silicon and CdTe detectors from Amptek using a multichannel
analyzer, allowing the detection efficiency of our diagnostics to be determined. After thus
calibrating our diagnostics, we are able to determine the absolute conversion efficiencies in our
Kα experiments.
3.2 Cu Ka Crystal Imager
The Cu Kα crystal imager utilizes a spherically-bent RAP crystal to selectively diffract and
focus x-rays at the Cu Kα energy of 8.0 keV +/- 0.056 eV onto a back-thinned and cooled CCD
camera. The Cu Kα imaging diagnostic consists of a RAP crystal optic spherically bent to a
radius of 38 cm and cut with the reflecting surface parallel to the 2131 plane. The crystal was
positioned to Bragg reflect at second order and image Cu Kα radiation from the target at TCC
onto a Princeton Instruments, 1 square inch, 1024 x 1024 pixel internally cooled CCD. The
second order Bragg reflection of 8.0 keV Cu Kα from the 2131 planes of spacing 2d = 3.08Å
7
required a Bragg angle of 88.7º. An object distance of 20.1 cm and an image distance of 350.4
cm resulted in a magnification of 17.4. A 25 µm thick Cu foil (with the cold K-edge at 8.9 keV)
placed at the CCD was used as a K-edge filter to selectively pass the 8.0 keV Cu Kα radiation
(with mean free path length of ~22 µm), but filter out higher energy x-rays. To minimize optical
aberrations while maintaining a reasonable collection angle, the crystal was apertured to a
diameter of 16mm. Astigmatism and spherical aberration limited spatial resolution to ~10 µm.
With the given magnification, the 1 square inch CCD provided a field of view of ~1.4 mm at the
target. The geometry of this imaging system [Koch03] is such that the point source from the
laser interaction is placed on the Rowland circle and the imaging device is placed to yield a
magnification of 17.4. The crystal imager was oriented at 26o off the axis defined by the laser
incidence direction. When we interpret the data, we correct for the viewing angle. This
diagnostic has a narrow spectral band pass, tuned to the cold Kα line. This discriminates against
contamination from other energies, but also means that if there are Ka line shifts due to
significant target heating, the Kα emission may move outside the band pass of the imager and
not be recorded. The relative brightness of different target geometries is measured as well.
3.3 HOPG Spectrometer:
The Cu Kα radiation is also spectrally resolved with a high efficiency, sagittally curved
highly oriented pyrolitic graphite (HOPG) crystal [Pak04] coupled to an image plate detector.
The crystal collects x-rays emitted from the back surface at 42 degrees from the foil normal.
Because of the detector’s close proximity to the target center (10 cm from the center) and the
fine crystal spacing, this detector has a higher sensitivity and higher spectral resolution compared

8
to the single photon counting camera. We used it to measure the relative brightness of targets
with small Kα yields.
3.4 Imaging Detector
We utilized two different types of imaging detectors: CsI/CCD cameras and Imaging Plates.
We use a commercially available x-ray scintillator from Hamamatsu consisting of columnar
grown Thalium doped CsI crystal on a fiber optic plate to convert incoming high-energy x-rays
into visible photons. We glued this x-ray scintillator to an EEV 2k x 2k CCD camera. We tested
the spatial resolution of this camera using the Cd109 radioactive source and measured the
contrast to be better than 50% at 9 line pairs per mm (corresponding to 55 µm resolution)
[Wickersham04.] We also use non-electronic imaging devices, Image Plates [Amemiya97], that
are commonly used for medical imaging. A Ditabis scanner is used to scan and digitize the
Image Plate data. The CsI/CCD camera is an electronic imaging device, more sensitive, reliable,
and reproducible but subject to radiation backgrounds. The image plate, by comparison, is more
radiation hardened and has higher dynamic range, but its sensitivity and reproducibility can vary
depending on the scanner.
4. Experimental Results
4.1 22 keV Ag Kα Spot Size Measurement
The required spatial resolution for many of the next-generation laser experiments is better
than 10 µm. If we want to apply point projection imaging, we will need an x-ray source with
effective spot size smaller than 10 µm. Most short pulse lasers have laser spot sizes smaller than
10 µm due to the use of short focal length, off-axis parabolas. We measured the spot size of the
9
OPCPA output for the Vulcan petawatt and the result is FWHM ~ 7 µm, as shown in Figs. 2a
and 2b. We then measured the 22 keV Ag Kα source size generated by this laser, using a pinhole
camera filtered with a 50µm Ag foil. The pinhole array was made of 500 µm thick Ta substrate
and the pinholes were laser-drilled to 20 µm diameters. The result is shown in Figs 2c and 2d.
Our measured high-energy x-ray spot size generated by this laser is 57 µm FWHM. The x-ray
source sizes are factors of 5-10 larger than the laser spot size, due to the spreading of the
relativistic electrons. As an independent check on the x-ray spot size, we recorded a point
projection radiograph of a 3 mm outer diameter, 25 µm thick Au hohlraum and a knife-edge
(disk). The spatial resolution inferred from these images is ~60 µm, as determined from the
blurring of their edges [Park04.] We performed x-ray source size measurements of Ag targets
with thicknesses of 25, 50 and 100 µm and laser intensities of 1018 - 1020 W/cm2. We find that
the source size is independent of target thickness and laser intensity.
We also measured the source size for higher energy 40 keV Sm Kα radiation using the
Callisto laser at LLNL. Direct pinhole imaging was not possible because of the high energy
background transmitted through the pinhole substrate (500 µm thick) dominated the direct
pinhole throughput. Instead we analyzed point projection radiographs of a 3 mm thick Ta knife-
edge. Our analysis shows that the size of the Sm x-ray source is also ~60 µm [Wickersham04.]
Our measured ~60 µm x-ray source size is much larger than the laser spot size (<10 µm)
suggesting that the hot electrons produced by the laser have spread outside of the region of direct
laser illumination. Similar results have been observed in low energy Kα experiments such as in
Stephens et al [Stephens04] for 8.0 keV Cu Kα and Reich et al [Reich03] for 4.5 keV Ti Kα.
This spreading needs to be taken into account for high energy point projection radiography
concepts, since most experiments require better than 10 µm spatial resolution.
10
4.2 Ag Kα Conversion Efficiency Measurement
The absolute conversion efficiency from the laser energy to the Kα source was measured
using data from the single photon counting CCD detector. Figure 3a shows the image of x-ray
hits from a laser shot with EL = 161J and 10 ps pulse duration on a 5 mm x 5 mm x 50 µm thick
Ag foil. The pixel intensity is proportional to the incoming x-ray energy. For our CCD camera,
the depletion layer is ~16 µm thick; we were able to measure the x-ray hits up to a maximum x-
ray energy of ~30 keV. Figure 3b shows the pixel intensity histogram from this image. In these
large and relatively thick target materials, only inner-shell Kα emissions are observed at these
high energies. The thermal contribution (He_α or Ly_α lines) for Ag is negligible. In this figure
the Ag Kα and Ag Kβ signals are clearly distinguished. Note that the Kα peak shows some
asymmetry on the low energy side. When an x-ray hits the CCD array, the photoelectrons can
spill over into neighboring pixels causing low pixel intensity registration. For conversion
efficiency measurement, we ignore the hits that are spread more than one pixel but include the
low energy tail. We do the same when calibrating the detection efficiency of our single hit
algorithm. Hence, our conversion efficiency analysis is self consistent.
From the pixel intensity histogram, we subtract the background by fitting it to a polynomial
(blue line) then correct for the detector efficiency, filter transmission and the solid angle. Using
the detection efficiencies described in the earlier section, the conversion efficiency is then
calculated by the ratio of the total emitted Kα energy to the total incident laser energy. In
functional form:
εconv=EKα(total) / Elaser
11
EKα(total) =( EKα(measured) . 4 π)/(εdetector.εsingle_hit
. Tfilter. Ωdetector)
where εconv is the conversion efficiency, EKα(total) is the total energy in the Kα x rays emitted
into 4π, EKα(measured) is the measured energy in Kα x rays, εdetector is detector quantum
efficiency εsingle_hit is the probability that all 22 keV energy is captured in one pixel, Tfilter is
transmission factor through the filter materials, and Ωdetector is the detector solid angle. From the
radioactive source calibration described in the previous section, we measure the combined
efficiency εdetector x εsingle_hit.to be 5% for Cu Kα and 0.3% for Ag Kα.
The largest uncertainty in this measurement comes from εdetector. The εdetector is measured
using the isotope source: we expose the detector for a specific time that provides the total
number of x-ray photons. The absolute calibration of our detectors is known to only within a
factor of 2; thus our absolute conversion efficiency is known to only within a factor of 2.
4.3 Dependency of Kα Conversion Efficiency on Laser Intensity
During our experiments, we varied laser conditions such as laser energy, pulse duration, and
laser focus resulting in different laser intensities. The conversion efficiency from laser energy to
Kα energy for both the Vulcan and Callisto experiments are plotted versus laser intensity in Fig.
4 as red circles. We measure the absolute conversion efficiency to be ~10-4 for Ag Kα for laser
intensities above mid x 1017 W/cm2. For comparison, we also show the results from similar Kα
measurements from the references: Yasuike01, Beg97, Warton98, Guo01, Anderson01,
Rousse94, Jiang95, Tillman97, Schnurer96, Feurer01, Yu99, Eder00 and Theobald05. Different
symbols represent different range of materials (diamonds: Z=10-30; circles: Z=31-50; squares:
Z=51-80.) Note that these measurements are from different lasers (including low energy short
12
pulse lasers) and different diagnostic instrumentation. The large systematic differences cause the
large spread in the measurements. Nevertheless, the conversion efficiency appears to slightly
increase with laser intensity until IL ~ 1018 W/cm2, above which it remains roughly flat.
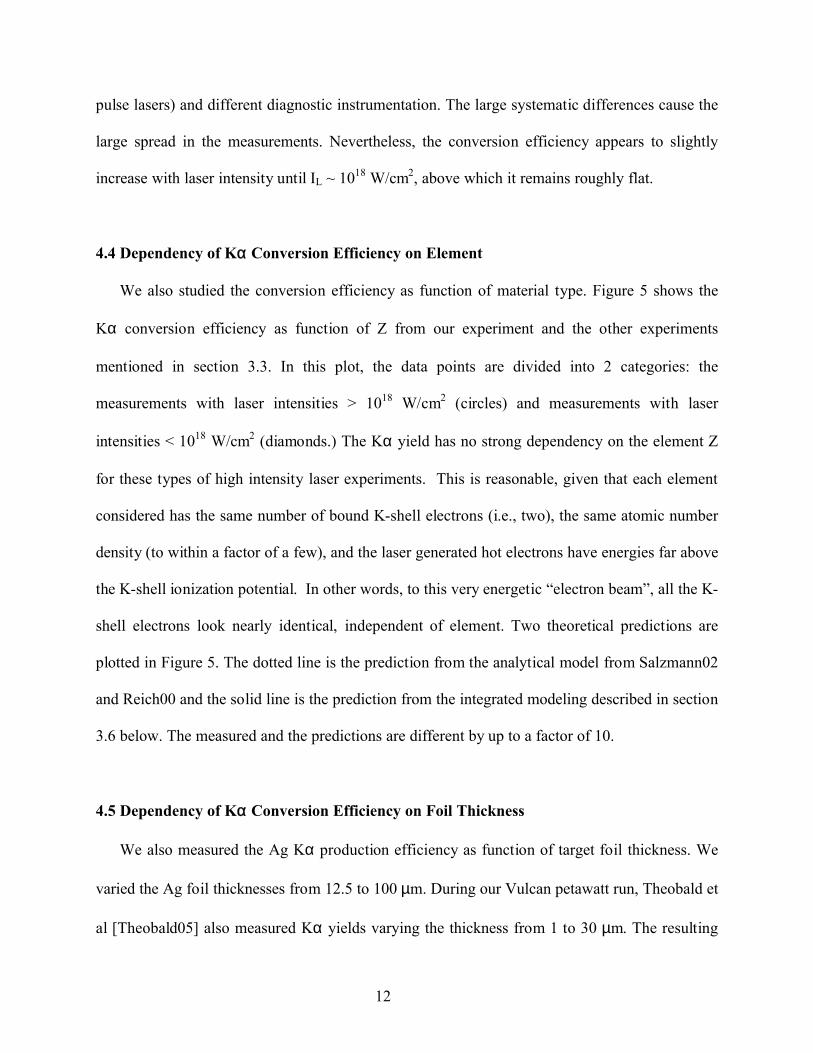
4.4 Dependency of Kα Conversion Efficiency on Element
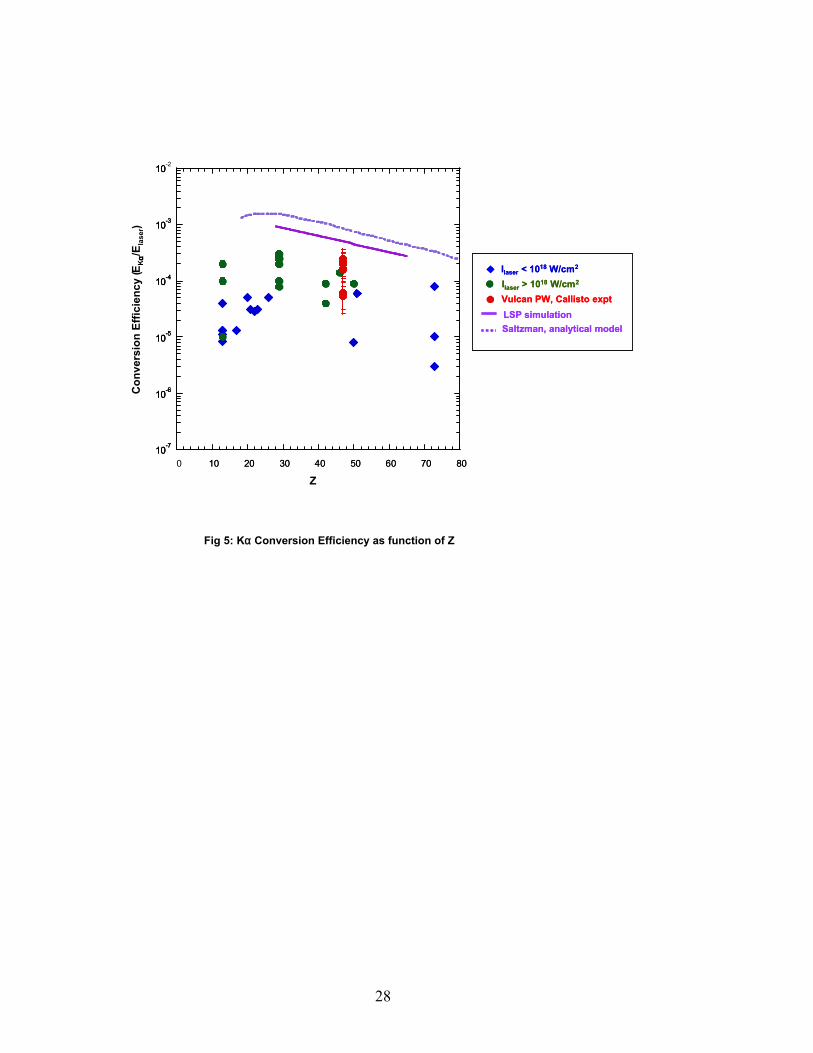
We also studied the conversion efficiency as function of material type. Figure 5 shows the
Kα conversion efficiency as function of Z from our experiment and the other experiments
mentioned in section 3.3. In this plot, the data points are divided into 2 categories: the
measurements with laser intensities > 1018 W/cm2 (circles) and measurements with laser
intensities < 1018 W/cm2 (diamonds.) The Kα yield has no strong dependency on the element Z
for these types of high intensity laser experiments. This is reasonable, given that each element
considered has the same number of bound K-shell electrons (i.e., two), the same atomic number
density (to within a factor of a few), and the laser generated hot electrons have energies far above
the K-shell ionization potential. In other words, to this very energetic “electron beam”, all the K-
shell electrons look nearly identical, independent of element. Two theoretical predictions are
plotted in Figure 5. The dotted line is the prediction from the analytical model from Salzmann02
and Reich00 and the solid line is the prediction from the integrated modeling described in section
3.6 below. The measured and the predictions are different by up to a factor of 10.
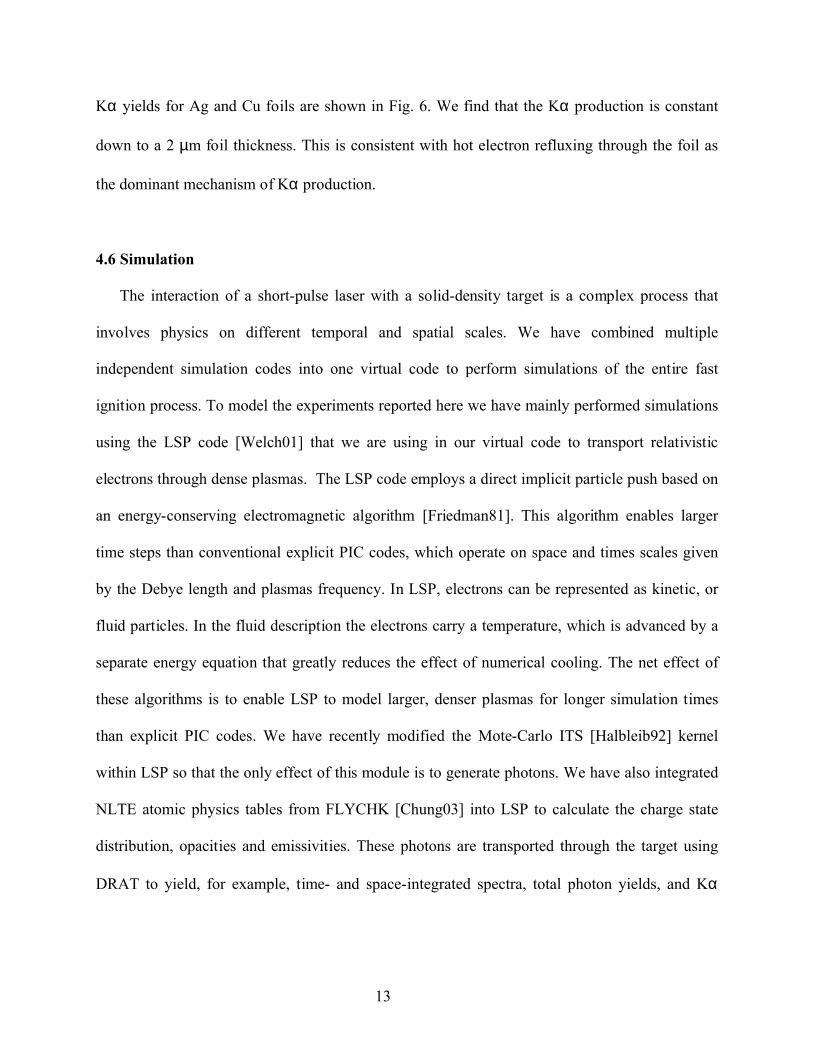
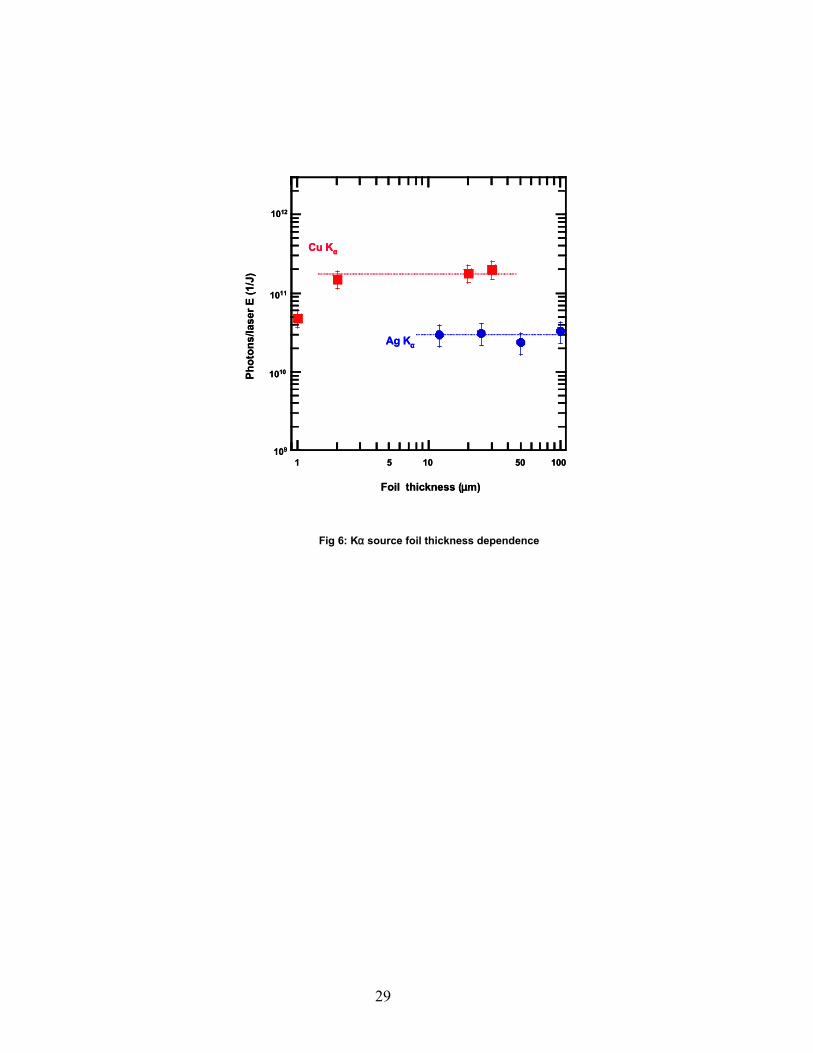
4.5 Dependency of Kα Conversion Efficiency on Foil Thickness
We also measured the Ag Kα production efficiency as function of target foil thickness. We
varied the Ag foil thicknesses from 12.5 to 100 µm. During our Vulcan petawatt run, Theobald et
al [Theobald05] also measured Kα yields varying the thickness from 1 to 30 µm. The resulting
13
Kα yields for Ag and Cu foils are shown in Fig. 6. We find that the Kα production is constant
down to a 2 µm foil thickness. This is consistent with hot electron refluxing through the foil as
the dominant mechanism of Kα production.
4.6 Simulation
The interaction of a short-pulse laser with a solid-density target is a complex process that
involves physics on different temporal and spatial scales. We have combined multiple
independent simulation codes into one virtual code to perform simulations of the entire fast
ignition process. To model the experiments reported here we have mainly performed simulations
using the LSP code [Welch01] that we are using in our virtual code to transport relativistic
electrons through dense plasmas. The LSP code employs a direct implicit particle push based on
an energy-conserving electromagnetic algorithm [Friedman81]. This algorithm enables larger
time steps than conventional explicit PIC codes, which operate on space and times scales given
by the Debye length and plasmas frequency. In LSP, electrons can be represented as kinetic, or
fluid particles. In the fluid description the electrons carry a temperature, which is advanced by a
separate energy equation that greatly reduces the effect of numerical cooling. The net effect of
these algorithms is to enable LSP to model larger, denser plasmas for longer simulation times
than explicit PIC codes. We have recently modified the Mote-Carlo ITS [Halbleib92] kernel
within LSP so that the only effect of this module is to generate photons. We have also integrated
NLTE atomic physics tables from FLYCHK [Chung03] into LSP to calculate the charge state
distribution, opacities and emissivities. These photons are transported through the target using
DRAT to yield, for example, time- and space-integrated spectra, total photon yields, and Kα
14
images. This enables us to directly compare the simulation output to the experimental
measurements.
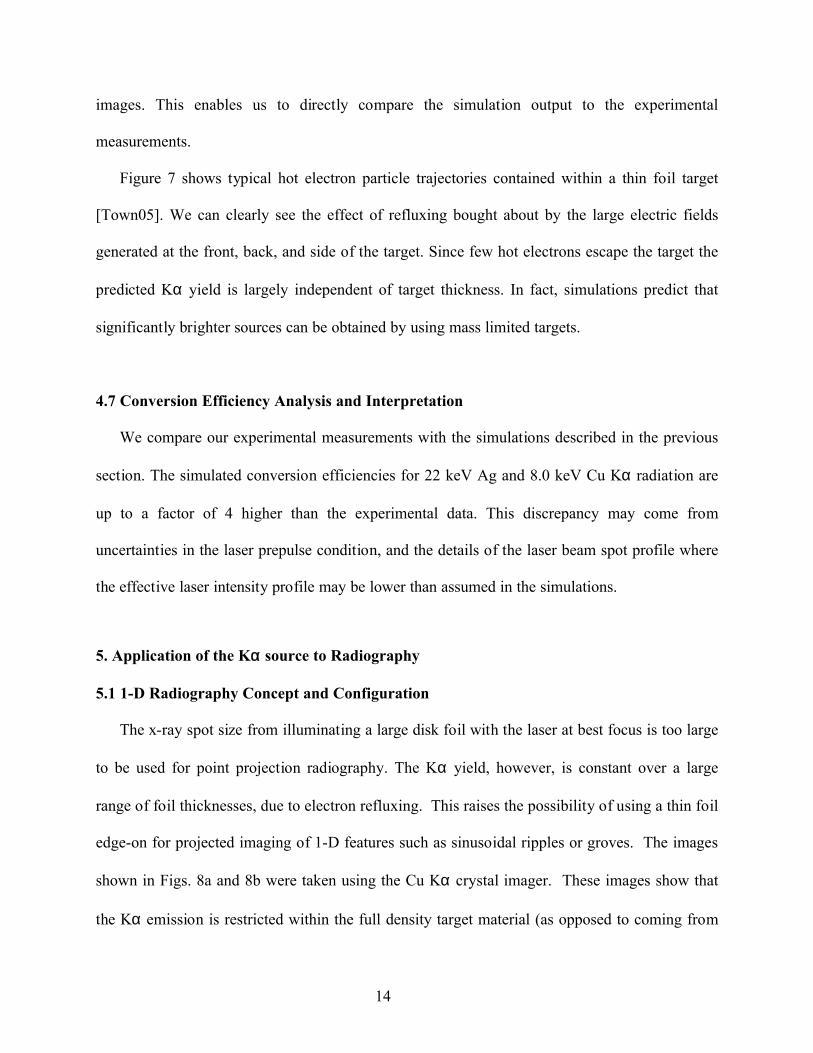
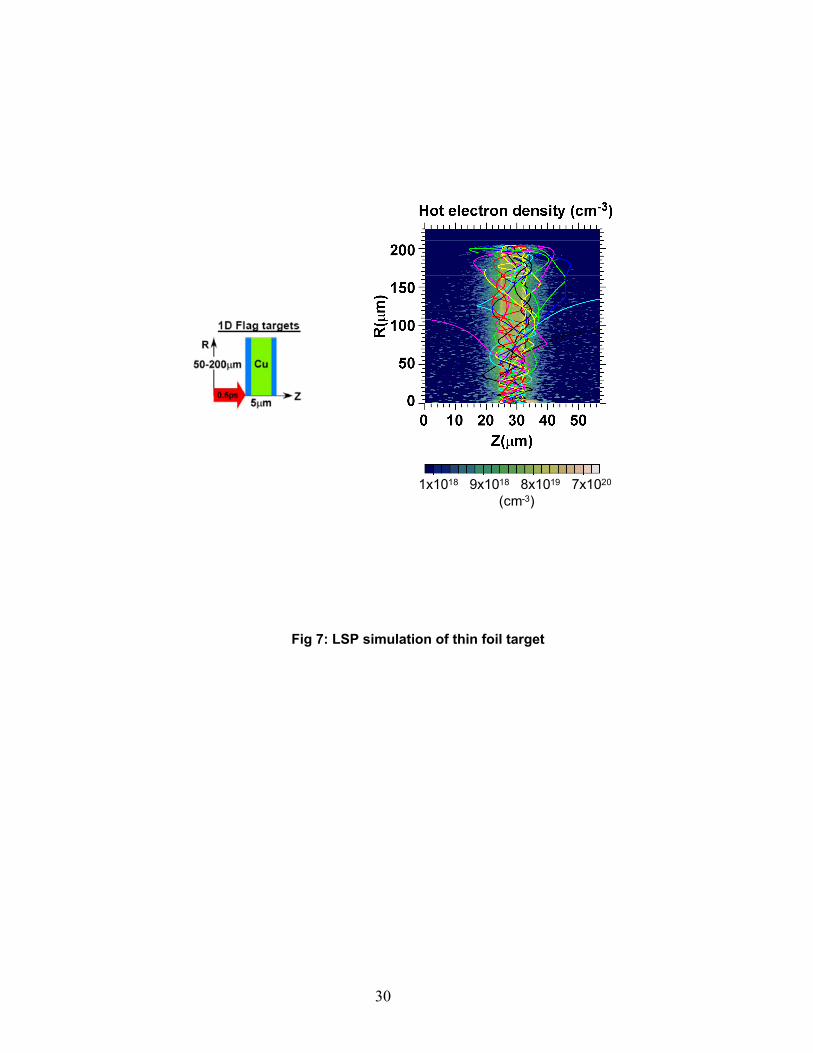
Figure 7 shows typical hot electron particle trajectories contained within a thin foil target
[Town05]. We can clearly see the effect of refluxing bought about by the large electric fields
generated at the front, back, and side of the target. Since few hot electrons escape the target the
predicted Kα yield is largely independent of target thickness. In fact, simulations predict that
significantly brighter sources can be obtained by using mass limited targets.
4.7 Conversion Efficiency Analysis and Interpretation
We compare our experimental measurements with the simulations described in the previous
section. The simulated conversion efficiencies for 22 keV Ag and 8.0 keV Cu Kα radiation are
up to a factor of 4 higher than the experimental data. This discrepancy may come from
uncertainties in the laser prepulse condition, and the details of the laser beam spot profile where
the effective laser intensity profile may be lower than assumed in the simulations.
5. Application of the Kα source to Radiography
5.1 1-D Radiography Concept and Configuration
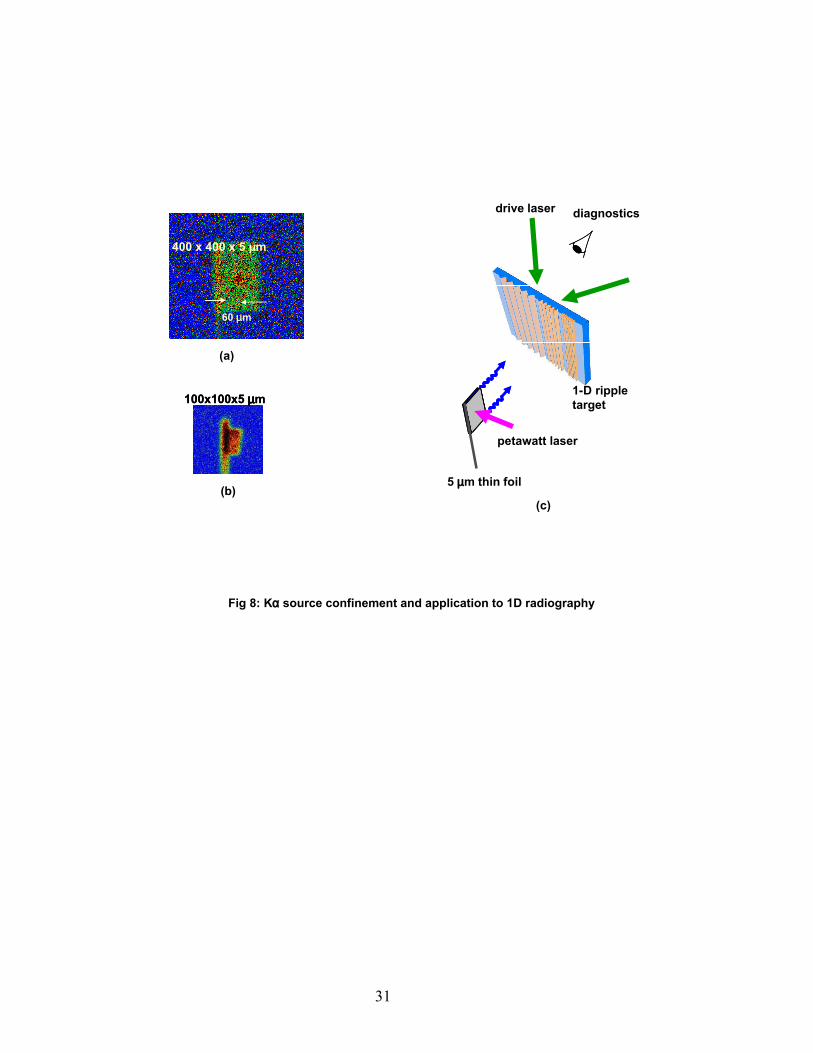
The x-ray spot size from illuminating a large disk foil with the laser at best focus is too large
to be used for point projection radiography. The Kα yield, however, is constant over a large
range of foil thicknesses, due to electron refluxing. This raises the possibility of using a thin foil
edge-on for projected imaging of 1-D features such as sinusoidal ripples or groves. The images
shown in Figs. 8a and 8b were taken using the Cu Kα crystal imager. These images show that
the Kα emission is restricted within the full density target material (as opposed to coming from
15
an expanding plasma plume) and the smaller target is brighter and more uniformly emitting x-
rays. The target stalks were inadvertently made of Cu wire thus also emitting Cu Kα radiation.
High resolution 1-D radiography can then be achieved by “line projection imaging” with a 5-
10 µm thin foil, aligned edge-on, parallel with the 1-D rippled targets, as illustrated by the sketch
in Fig 8c. In this configuration, the spatial resolution in the lateral direction will be determined
by the thickness of the radiating foil.
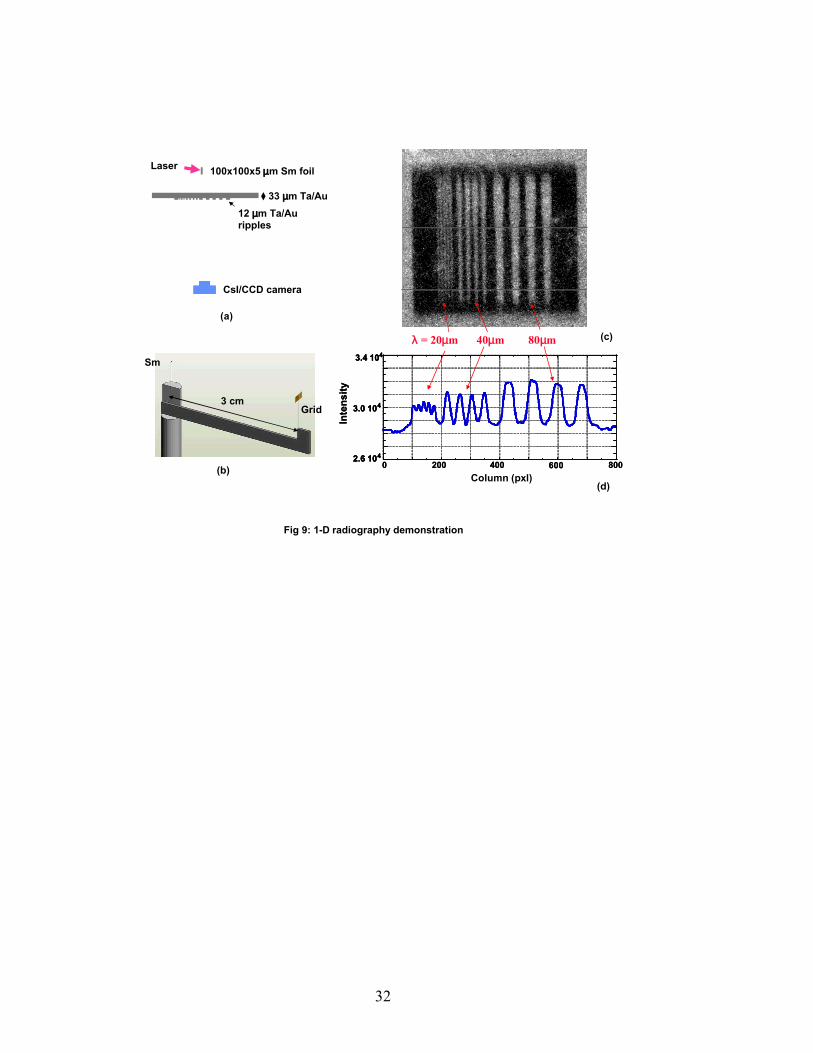
5.2 40 keV 1-D Radiography Demonstration
We performed proof-of-principle laser shots to demonstrate the edge-on 1-D radiography
concept. The schematic of the laser and the radiography target setup is shown in Figs. 9a and 9b.
The 100 x 100 x 5 µm samarium (Sm) foils were prepared by laser cutting to the square shape
and mounting on a 6 µm carbon fiber stalk, as shown in the figure. Since 1-D edge-on
radiography relies on having a minimum lateral (edge-on) cross section, care had to be taken to
cut the edges cleanly and to mount the foils so that they were flat. To minimize sensitivity to tilt,
one would like very small foils. Finite laser pointing accuracy, however, prevents the disks from
being too small The 100 x 100 µm target size was a compromise between these two
considerations. Fortunately due to the electron refluxing mechanism, the overall Kα emitted flux
is not sensitive to foil thickness or lateral extent, to first order. Note, the mean free path length
of the Sm 40 keV Kα x-rays in cold Sm is ~200 µm, so that x-ray re-absorption is minimal.
We fabricated special slits made of 12 µm thick Ta and Au substrates. These slits were made
by laser cutting and they had 20, 40, 80 and 160 µm periods. Then, we added 35 to 37 µm thick
Ta or Au substrate behind the 12 µm thick resolution slits. This is to simulate the expected
optical depths of typical targets anticipated for laser experiments at NIF or other facilities. The

16
distance between the laser target, the Sm edge-on foil, and the resolution radiography object was
set to 3~4 cm while the desired imaging magnification is a factor of 10 to 15 for optimal signal
per resolution element. We used a 200 µm thick Sm foil as a filter to transmit 40 keV Kα
radiation while greatly reducing the lower energy and higher energy background creating a
quasi-monochromatic transmission.
Figure 9c shows the resulting radiography image of the Ta slits with the CsI/CCD camera
using the Vulcan TAW laser. The laser energies were 75 J for Ta with 10 ps pulse duration. For
the 1-D radiography analysis, we summed and averaged the pixel intensity values along the slits
to increase the signal-to-noise ratio. The resulting lineouts are shown in Figure 9d. All the
resolutions patterns are clearly visible down to the 20 µm period slits in the CsI/CCD camera
data.
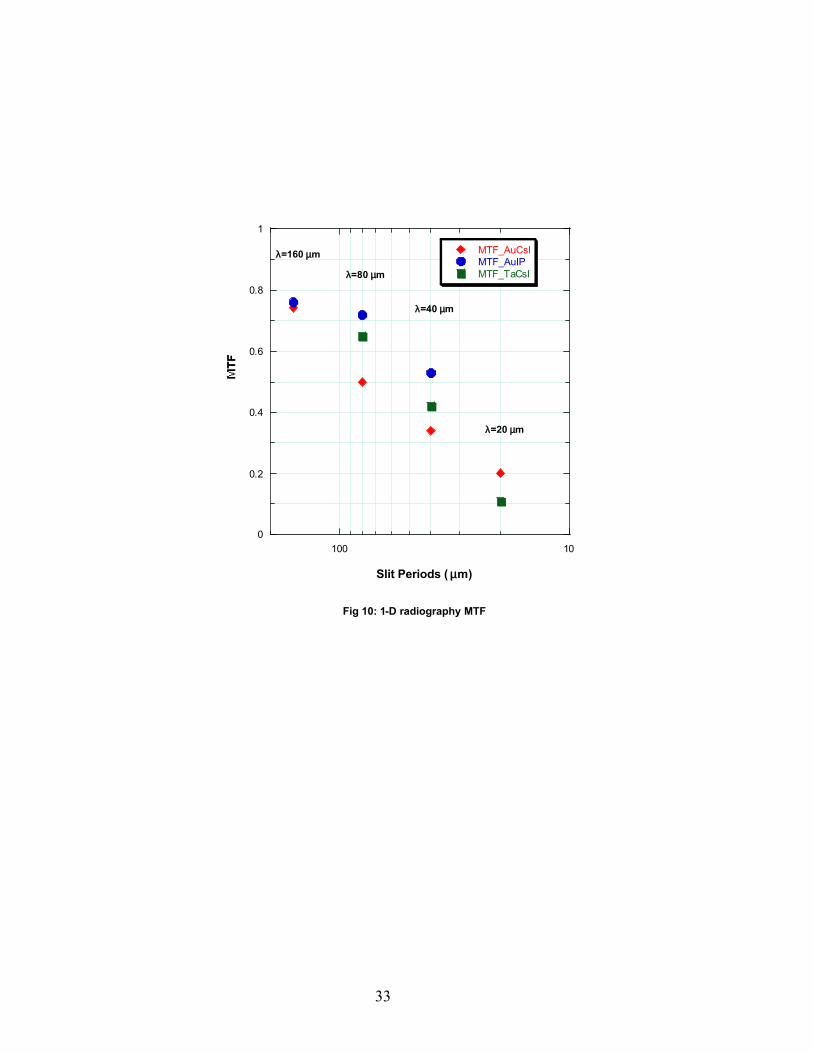
Since our resolution patterns are square form rather than sinusoidal, from this lineout data we
calculated the modulation transfer function (MTF) using a contrast transfer function (CTF)
definition [Coltman54]. The modulation transfer function is derived by:
MTF(f) = π/4 [CTF(f) + CTF(3f/3) – CTF(5f/5) + CTF(7f/7)….]
Figure 10 shows the resulting MTF from different slit sizes and many different laser shot
images. The spatial resolution, as quantified by the average MTF, was approximately 0.15, 0.4,
0.6, and 0.75 at λ = 20, 40, 80, and 160 µm.. Higher MTF will be achieved when we use high-
energy lasers (>2000J for NIF petawatt [Barty04] and Omega-EP [Bagnoud03]). The image
contrast, MTF, also depends on the signal to noise ratio (SNR). By scaling the laser energy from
our experiment, we expect to have at least 7 times more signal and 2.5 times higher SNR at NIF,
17
assuming the noise is mostly from photon statistics. In addition the angular alignment was only
good to ~1° for the premounted targets in these experiments, which degrades the resolution
measurements. This alignment accuracy can clearly be improved. With these improvements, we
expect to be able to obtain high MTF for the NIF experiments.
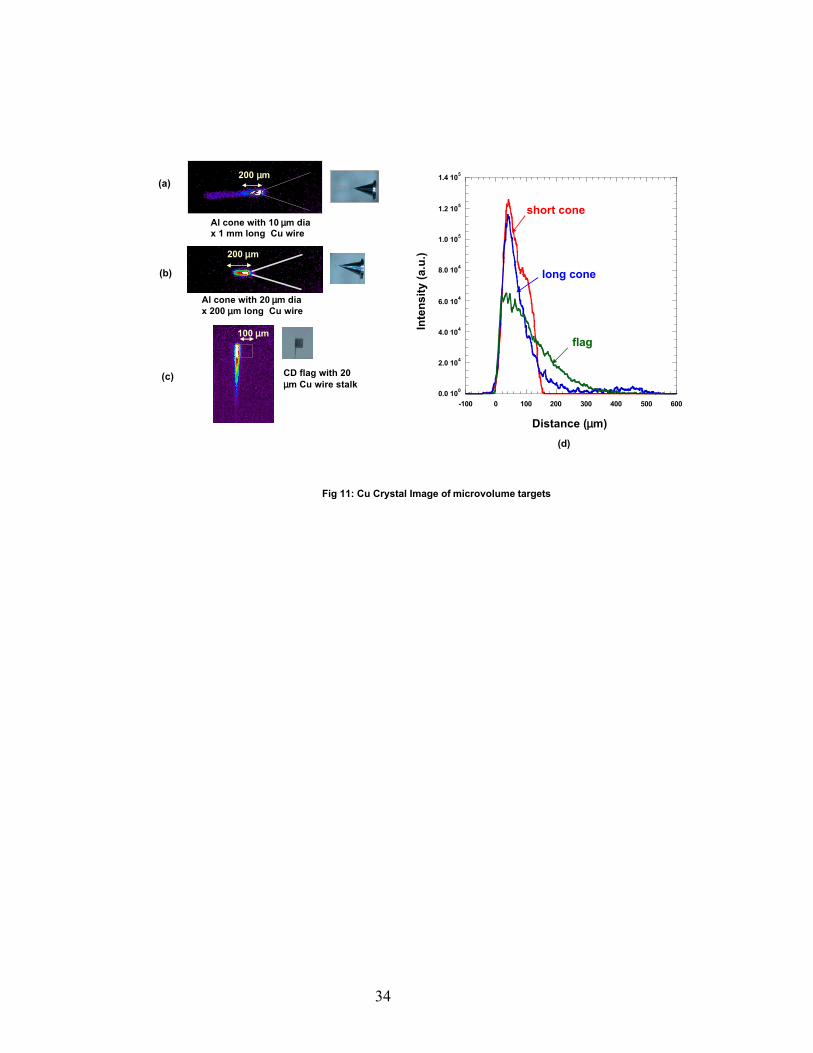
5.3 Micro-volume Kα conversion Efficiency
Extending our observation that the high energy x-ray sources can be confined within the
target volume, we made many small targets with wires buried in different geometric shapes to
create a small point source for 2-D radiography. The tested geometries are a 100 µm long Cu
wire embedded in a flat Al substrate disk, a cone with a 200 µm long wire tip, a cone with a 1
mm long wire tip, a flag stalk, and a V-shaped Al substrate with a 100 µm long wire at the vertex
in a “bookend” configuration. Examples of the Cu Kα emissions from three of these targets is
shown in Fig 11 for (a) a 30o Al cone with a 1 mm x 10 µm Cu wire, (b) a 30o Al cone with a
200 µm x 10 µm Cu wire, and (c) a plastic disk with a 20 µm diameter Cu wire stalk. From this
data we see that the Kα emission is mainly from the initial laser interaction region where the hot
electrons are created, as shown in Fig. 11d. This implies that shorter wires will not degrade the
total yields of Kα photons enabling us to create a smaller localized source. We also had the
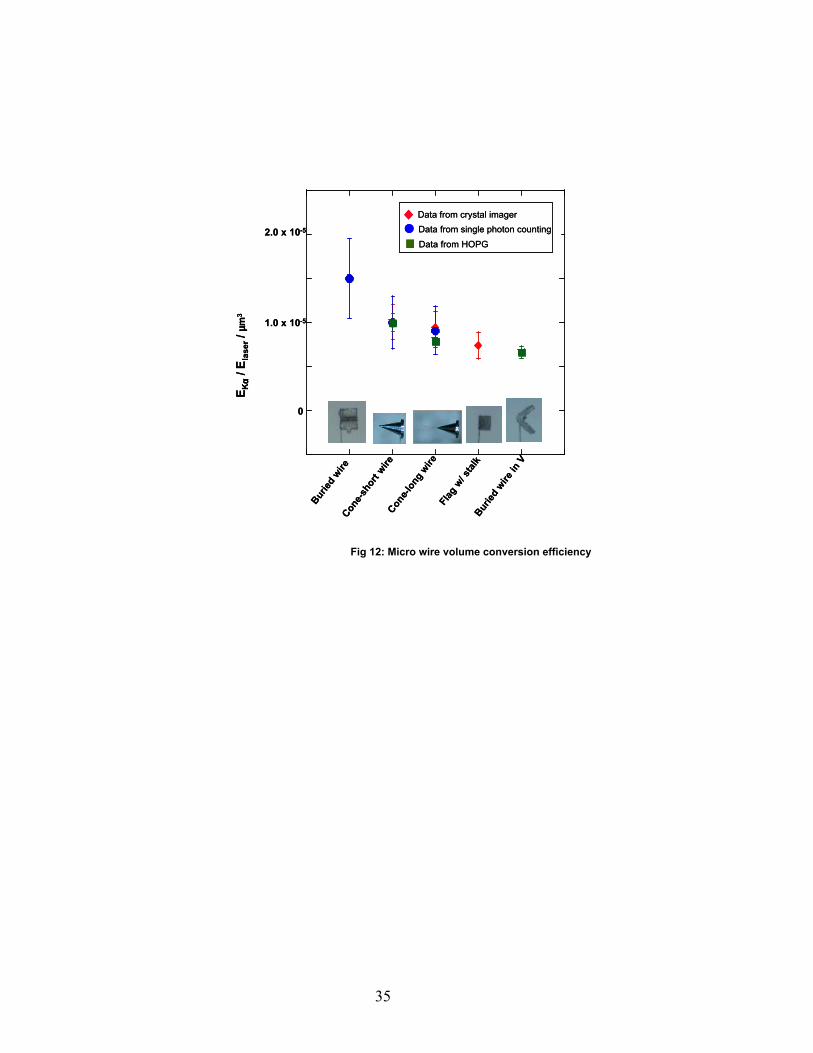
HOPG spectrometer and a single photon counting camera for these targets. By combining their
data sets, we measured the absolute Kα yields (Fig 12.) While the target volume was varied from
15,700 µm3 to 157000 µm3 in this experiment, we observed that smaller volume targets generate
brighter sources, such that the total Kα yield per target volume is nearly constant, to within a
factor of 2.

18
One big difference between the foil target and micro volume target is the total yield. In the
foil target, the Kα conversion efficiency (energy in Kα x-rays over the laser energy) is ~10-4. In
contrast, we measure the conversion efficiency for the wire targets to be ~10-5. One possible
explanation for this low conversion efficiency may be due to the high Ohmic barrier created by
the strong return current along the wire length direction (>100 µm long), which limits the length
of wire that sees the hot electron flux. The thin foils (≤10 µm), on the other hand, create their
return current in the form of the refluxing hot electrons, so the effects of an Ohmic barrier are
greatly reduced. [Key06]
In our first attempts at these small volume targets, the results of which are shown in Figs. 11
and 12, we have not yet optimized the coupling between the wire and the target substrate for the
best contact. For the cone/wire targets, we have also not examined systematically the cone
parameters, namely, opening angle, material, and thickness. We hope to do these optimization
studies in the near future.
6. Conclusion
We have characterized high-energy Kα source characteristics using the Vulcan and Callisto
lasers. We find that the high energy Kα source size is factors of 5-10 larger than the laser spot
size. We find that the Kα conversion efficiency is constant at ~10-4 in the range of laser
intensities between 1018 W/cm2 to 1020 W/cm2 and target foil thickness in the range between 2
to 100 µm. We have demonstrated high-resolution 1-D radiography at 40 keV using a thin edge-
on foil. No evidence for significant degradation of spatial resolution from a plasma plume was
observed, that is, the Kα emission seems localized to the high density target region. We have
also conducted initial experiments with small micro-volume wire targets embedded in various
19
shapes of substrate material as possible sources for 2-D radiography. The conversion efficiencies
for these sources were ~10-5, which is a factor of 10 lower than the simple foil targets.
References
[Amemiya97]: Y. Amemiya, Methods Enzymol. 276, 233 (1997)
[Amendt05]: P. A. Amendt et al., Phys. Rev. Lett. 94, 065004 (2005)
[Anderson01]: E. Andersson et al., J. Appl. Phys. 90, 3048 (2001)
[Bagnoud03]: V. Bagnoud et al., IFSA conference proceedings (2003)
[Barty04]: C. P. J. Barty et al., Nucl. Fusion 44, No 12, S266-S275 (2004)
[Beg97]: F. Beg et al., Phys Plasmas 4, 447 (1997)
[Blue05]: B. Blue et al., Phys. Rev. Lett. 94, 95005 (2005)
[Celliers04]: P. M. Celliers et al., Phys. Plasmas 11, L41 (2004)
[Chung03]: H.-K. Chung et al., J. Quant. Spectroscopy & Radiative Transfer 81, 107 (2003)
[Coltman54]: J. W. Coltman, J. Optical Society of America 44, No. 6, pp. 468-471 (1954)
[Dittrich00]: T. R. Dittrich et al., Phys Plasmas 6, No. 5, 2164 (1999)
[Eder00]: D. C. Eder et al., Appl. Phys. B 70, 211 (2000)
[Feurer01]: Feurer et al., Phys. Rev. E 65, 01412 (2001)
[Foster05]: J. Foster et al., Ap. J. Lett., in press (2005)
[Friedman81]: A. Friedman et al., Cohen. Comment Plasma Phys. Contr. Fusion 6, 225 (1981)
[Guo01]: Guo et al., Rev. Sci. Instrum 72, 41 (2001)
[Halbleib92]: J.A. Halbleib et al., IEEE Trans. Nucl. Sci. NS-39, 1025 (1992)
[Hogan01]: W.J. Hogan et al., Nucl. Fusion 41, 567 (2001)
[Jiang95]: Jiang et al., Phys Plasmas 2, 1702 (1995)
[Key98]: M. H. Key et al., Phys Plasmas 5, 1996 (1998)
20
[Key06]: M. H. Key et al., IFSA 2005 Proceedings (2006)
[Koch03]: J. A. Koch et al., Rev. Sci. Instrum 74, No 3, 2130 (2003)
[Koenig04]: M. Koenig et al., Nucl. Fusion 44, 5208 (2004)
[Lorenz05]: K.T. Lorenz et al., Phys. Plasmas 12, 056309 (2005)
[Nishiuchi99]: M. Nishiuchi et al., Nucl. Instrum. Meth. Phys. Res. A 436, 79 (1999)
[Pak04]: A. Pak et al., Rev. Sci. Instrum 75, No 10, 3747 (2004)
[Park04]: H. S. Park et al., Rev. Sci. Instrum 75, 4048 (2004)
[Reich00]: Ch. Reich et al., Phys. Rev. Lett. 84, 4846 (2000)
[Reich03]: Ch. Reich et al., Phys. Rev. E 68, 056408 (2003)
[Remington04]: B. A. Remington et al., Met. Mat. Trans. A 35A, 2587 (2004)
[Remington06]: B. A. Remington et al., in press, proceedings, APS-SCCM (2006)
[Rousse94]: A. Rousse et al., Phys. Rev. E 50, 2200 (1994)
[Salzmann02]: D. Salzmann et al., Phys. Rev. E 65, 036403 (2002)
[Schnerer96]: Schnurer et la., J. Appl. Phys 80, 5604, (1996)
[Sinars04]: D. B. Sinars et al., Rev. Sci. Instrum 75, 3672 (2004)
[Stephens04]: R. B. Stephens et al., Phys. Rev. E 69, 066414, (2004)
[Theobald05]: W. Theobald et al., private communication, Phys. Plasmas, to be submitted (2005)
[Tillman97]: Tillman et al., Nuc. Instrum Meth. Phys. Res. A 394, 387 (1997)
[Toth05]: R. Toth et al., Proc. of SPIE, 591813 (2005)
[Town05]: R. P. J. Town et al., Nucl. Inst. Meth. Phys. Res. A 544, 61 (2005)
[Warton98]: K. Wharton, Phys. Rev. Lett. 81, 822 (1998)
[Welch01]: D. R. Welch et al., Nucl. Inst. Meth. Phys. Res. A 464, 134 (2001)
[Wickersham04]: J. E. Wickersham et al., Rev. Sci. Instrum 75, No 10, 4051 (2004)
21
[Yashike01]: K. Yasuike et al., Rev. Sci. Instrum 72, 1236 (2001)
[Yu99]: J. Yu et al., Phys Plasmas 6, 1318 (1999)
Figure Captions
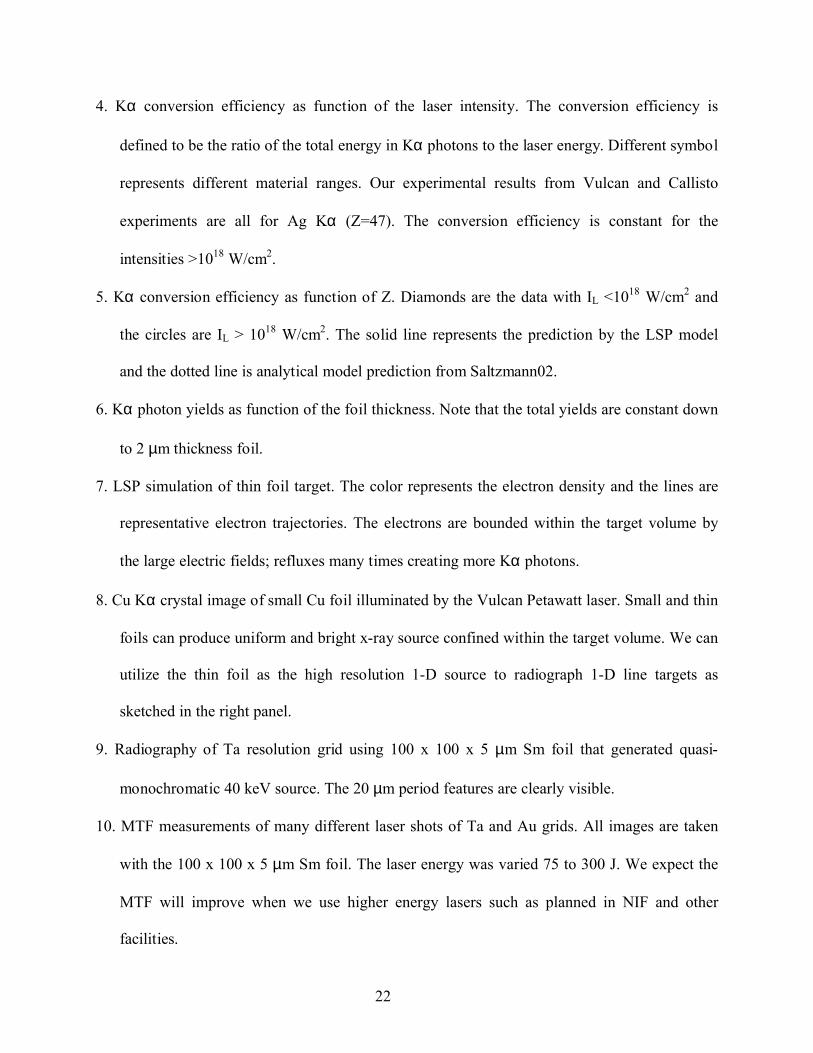
1. Schematic of Kα production mechanism. The high-intensity laser with >1017 W/cm2 creates
superthermal to relativistic hot electrons. These hot electrons travel through the target
material while producing Kα and Bremsstrahlung photons. Because of the self-generated
electric fields from the ions, the hot electrons reflux at the material boundary creating more
photons. This mechanism is known to be much more efficient way of generating high energy
photons (>10 keV) compared to the thermally driven He-like ion transitions.
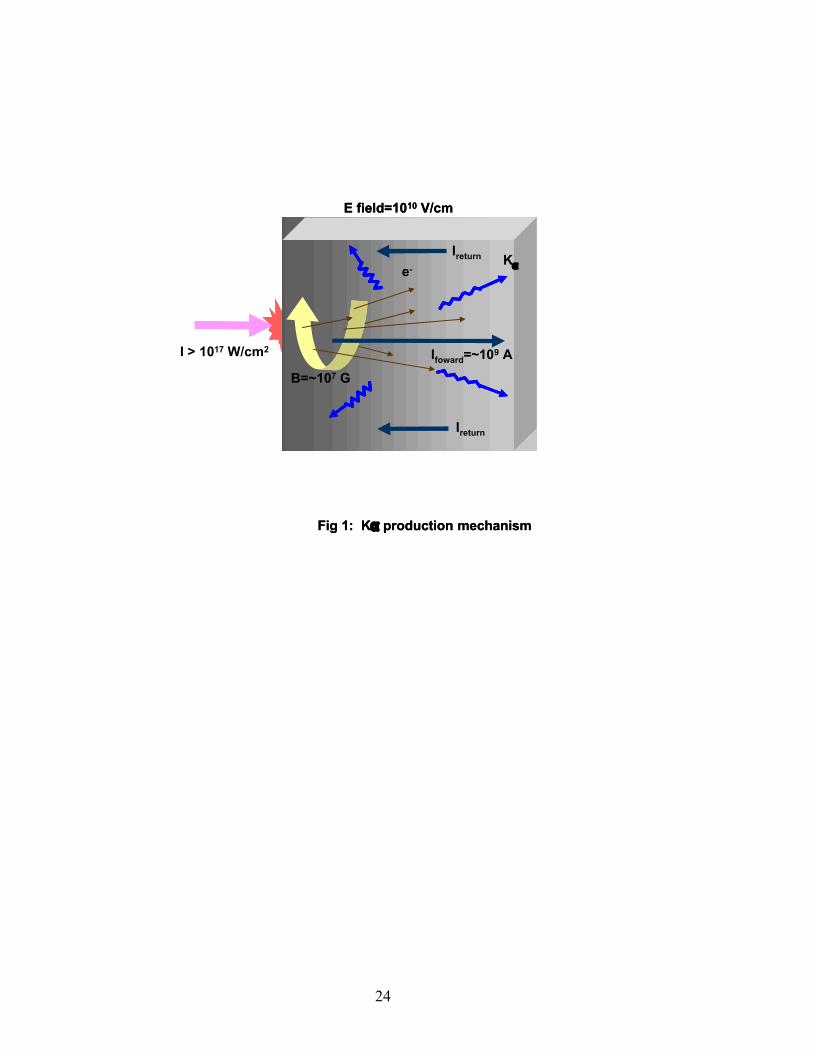
2. Measured Ag Kα source size. The left panel shows the laser spot size from Vulcan petawatt
OPCPA output. Even though the laser spot is <10 mm FWHM, the x-ray spot size is much
bigger than the laser spot size. This is due to the hot electron spreading and refluxing in the
target medium.
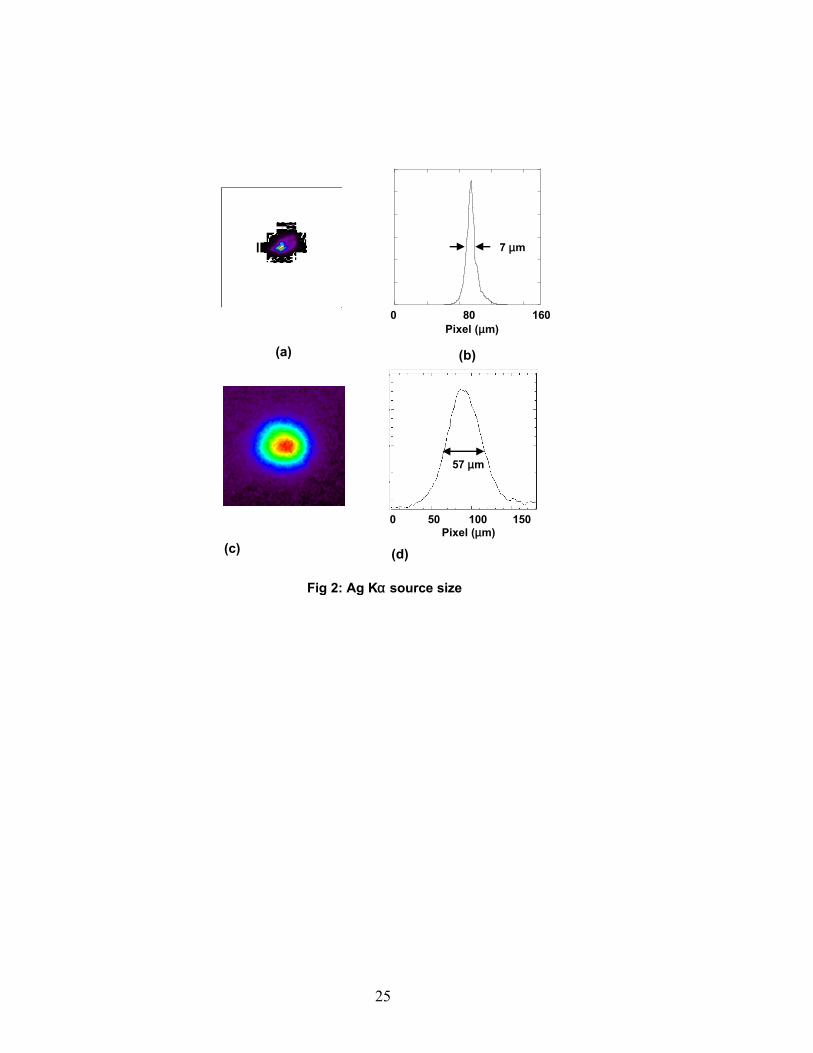
3. Single photon counting image of x-ray hits from a laser interaction with a silver target. The
intensity of each blob is proportional to the x-ray energy. The right panel is a histogram of
pixel intensity from the CCD directly exposed to the x-rays generated from the laser
interaction. The Ag Kα and Kβ peaks are clearly detected above the backgrounds. The
absolute conversion efficiencies are derived from the hits above the background and
convolving it with the detector efficiency and the solid angle. Note that the Kα peak has the
asymmetry towards low energy end. This is from the pixels that didn’t capture all the photo
electrons from the x-ray interactions; but some photo electrons are spilled over to the
neighboring pixels.
22
4. Kα conversion efficiency as function of the laser intensity. The conversion efficiency is
defined to be the ratio of the total energy in Kα photons to the laser energy. Different symbol
represents different material ranges. Our experimental results from Vulcan and Callisto
experiments are all for Ag Kα (Z=47). The conversion efficiency is constant for the
intensities >1018 W/cm2.
5. Kα conversion efficiency as function of Z. Diamonds are the data with IL <1018 W/cm2 and
the circles are IL > 1018 W/cm2. The solid line represents the prediction by the LSP model
and the dotted line is analytical model prediction from Saltzmann02.
6. Kα photon yields as function of the foil thickness. Note that the total yields are constant down
to 2 µm thickness foil.
7. LSP simulation of thin foil target. The color represents the electron density and the lines are
representative electron trajectories. The electrons are bounded within the target volume by
the large electric fields; refluxes many times creating more Kα photons.
8. Cu Kα crystal image of small Cu foil illuminated by the Vulcan Petawatt laser. Small and thin
foils can produce uniform and bright x-ray source confined within the target volume. We can
utilize the thin foil as the high resolution 1-D source to radiograph 1-D line targets as
sketched in the right panel.
9. Radiography of Ta resolution grid using 100 x 100 x 5 µm Sm foil that generated quasi-
monochromatic 40 keV source. The 20 µm period features are clearly visible.
10. MTF measurements of many different laser shots of Ta and Au grids. All images are taken
with the 100 x 100 x 5 µm Sm foil. The laser energy was varied 75 to 300 J. We expect the
MTF will improve when we use higher energy lasers such as planned in NIF and other
facilities.

23
11. Cu Kα crystal image of various micro volume wire targets attached to the cone or substrate
geometry. Note that the Kα emission is mainly confined near the initial laser interaction
region.
12. Kα yields of micro wire targets with various substrate geometries. We measure the absolute
conversion efficiency of these targets are ~10-5.
24
e-
B=~107 G
Ifoward=~109 A
Ireturn
E field=1010 V/cm
Kα
I > 1017 W/cm2
Fig 1: Kα production mechanism
Ireturn
e-
B=~107 G
Ifoward=~109 A
Ireturn
E field=1010 V/cm
Kα
I > 1017 W/cm2
Fig 1: Kα production mechanism
Ireturn
25
7 µm
0 80 160Pixel (µm)
0 50 100 150Pixel (µm)
57 µm
Fig 2: Ag Kα source size
(a) (b)
(c) (d)
26
Fig 3: Ag Kα single photon counting camera data
(a) (b)
22.1 keV Ag Kα
24.9 keV Ag Kβ
Bremsstrahlungbackground

27
Fig 4: Kα Conversion Efficiency as function of Intensity
10-7
10-6
10-5
10-4
10-3
10-2
1016 1017 1018 1019 1020 102110-7
10-6
10-5
10-4
10-3
10-2
1016 1017 1018 1019 1020 1021
Con
vers
ion
Effic
ienc
y (E
Kα/E
lase
r)
Laser Intensity (W/cm2)
Z 10 - 30Z 31 - 50Z 51 - 80Vulcan PW, Callisto exptZ = 47 (Ag)
Z 10 - 30Z 31 - 50Z 51 - 80Vulcan PW, Callisto exptZ = 47 (Ag)
28
Fig 5: Kα Conversion Efficiency as function of Z
-2
010-7
10-6
10-5
10-4
10-3
10
10 20 30 40 50 60 70 8010-7
10-6
10-5
10-4
10-3
10
10-7
10-6
10-5
10-4
10-3
10
10 20 30 40 50 60 70 80
Z
Con
vers
ion
Effic
ienc
y (E
Kα/E
lase
r)
Ilaser < 1018 W/cm2
Ilaser > 1018 W/cm2
Vulcan PW, Callisto exptLSP simulationSaltzman, analytical model
Ilaser < 1018 W/cm2
Ilaser > 1018 W/cm2
Vulcan PW, Callisto exptLSP simulationSaltzman, analytical model
29
1 5 10 50 100
Foil thickness (µm)
109
Phot
ons/
lase
r E (1
/J)
1010
1011
1012
Cu Kα
Ag Kα
1 5 10 50 100
Foil thickness (µm)
109
Phot
ons/
lase
r E (1
/J)
1010
1011
1012
Cu Kα
Ag Kα
Fig 6: Kα source foil thickness dependence
30
Hot Electron density
Fig 7: LSP simulation of thin foil target
1x10¹⁸ 9x10¹⁸ 8x10¹⁹ 7x10²⁰
(cm-3)
31
400 x 400 x 5 µm
60 µm
petawatt laser
5 µm thin foil
1-D ripple target
drive laser diagnostics
100x100x5 µm100x100x5 µm
Fig 8: Kα source confinement and application to 1D radiography
(a)
(b)(c)
32
λ = 20µm 40µm 80µm
Column (pxl)0 200 400 600 800
Inte
nsity
2.6 104
3.0 104
3.4 104
0 200 400 600 800
Inte
nsity
2.6 1042.6 104
3.0 1043.0 104
3.4 1043.4 104
Laser 100x100x5 µm Sm foil
33 µm Ta/Au12 µm Ta/Au ripples
CsI/CCD camera
Sm
Grid3 cm
Fig 9: 1-D radiography demonstration
(a)
(b)
(c)
(d)
33
0
0.2
0.4
0.6
0.8
1
10100
MTF_AuCsIMTF_AuIPMTF_TaCsI
Slit Periods ( µm)
λ=40 µm
λ=20 µm
λ=80 µm
λ=160 µm
Fig 10: 1-D radiography MTF
34
0.0 100
2.0 104
4.0 104
6.0 104
8.0 104
1.0 105
1.2 105
1.4 105
-100 0 100 200 300 400 500 600
short cone
long cone
flag
200 µm
200 µm
100 µm
CD flag with 20 µm Cu wire stalk
Al cone with 20 µm diax 200 µm long Cu wire
Al cone with 10 µm diax 1 mm long Cu wire
Distance (µm)In
tens
ity (a
.u.)
Fig 11: Cu Crystal Image of microvolume targets
(a)
(b)
(c)
(d)
35
Fig 12: Micro wire volume conversion efficiency
Cone-
shor
t wire
Cone-l
ong w
ire
Relative Ka yield_fromXtalImagerRelative Ka yield_fromSPCRelative Ka yield_fromHopg
Buried
wire
E Kα
/ Ela
ser/ µ
m3
Flag
w/ stal
kBur
ied w
ire in
V
1.0 x 10⁻⁵
2.0 x 10⁻⁵
0
Cone-
shor
t wire
Cone-l
ong w
ire
Relative Ka yield_fromXtalImagerRelative Ka yield_fromSPCRelative Ka yield_fromHopg
Buried
wire
E Kα
/ Ela
ser/ µ
m3
Flag
w/ stal
kBur
ied w
ire in
V
1.0 x 10⁻⁵
2.0 x 10⁻⁵
0
Data from crystal imagerData from single photon countingData from HOPG
Data from crystal imagerData from single photon countingData from HOPG


![High-intensity versus low-intensity physical activity or ... · [Intervention Review] High-intensity versus low-intensity physical activity or exercise in people with hip or knee](https://img.pdfslide.us/doc/110x75/602e37b7b5faa56d200b56dc/high-intensity-versus-low-intensity-physical-activity-or-intervention-review.jpg)