Embed Size (px)
Citation preview
Julie N. Kadrmas and Julie C. Liu High Efficiency Low Cost
Electrochemical Ammonia Production
Julie N. Renner, Steve Szymanski, Proton OnSite Lauren Greenlee, NIST/University of Arkansas
Andrew Herring, Colorado School of Mines Douglas Tiffany, University of Minnesota
NH3 Fuel Conference
Chicago, IL September 22nd 2015

Outline
2
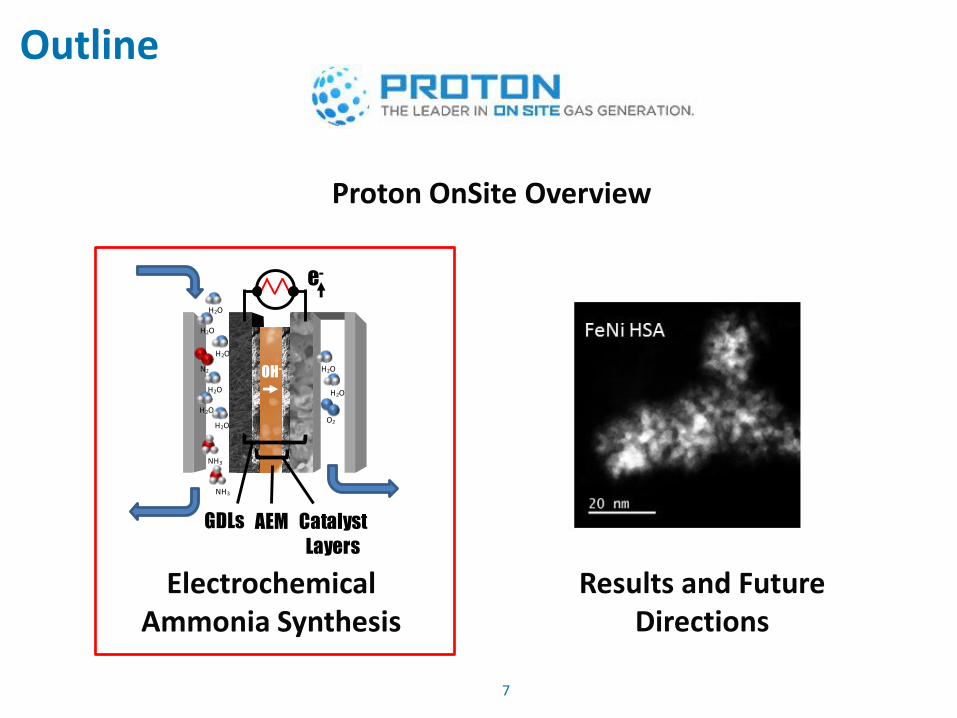
Proton OnSite Overview
Electrochemical Ammonia Synthesis
Results and Future Directions
0.00.51.01.52.02.53.03.54.04.55.0
Hour 1 Hour 2 Hour 3 Hour 4(after water
rinse)
Effi
cie
ncy
, % (
1.2
V)
Pt black
Fe-Ni LSA (1)
Fe-Ni LSA (2)
Fe-Ni HSA
Ni only
Fe only
Fe-Pt
0.00.51.01.52.02.53.03.54.04.55.0
Hour 1 Hour 2 Hour 3 Hour 4(after water
rinse)
Effi
cie
ncy
, % (
1.2
V)
Pt black
Fe-Ni LSA (1)
Fe-Ni LSA (2)
Fe-Ni HSA
Ni only
Fe only
Fe-Pt0.00.51.01.52.02.53.03.54.04.55.0
Hour 1 Hour 2 Hour 3 Hour 4(after water
rinse)
Effi
cie
ncy
, % (
1.2
V)
Pt black
Fe-Ni LSA (1)
Fe-Ni LSA (2)
Fe-Ni HSA
Ni only
Fe only
Fe-Pt0.00.51.01.52.02.53.03.54.04.55.0
Hour 1 Hour 2 Hour 3 Hour 4(after water
rinse)
Effi
cie
ncy
, % (
1.2
V)
Pt black
Fe-Ni LSA (1)
Fe-Ni LSA (2)
Fe-Ni HSA
Ni only
Fe only
Fe-Pt
H2O
H2O
O2
H2O
H2O
H2O
N2
H2O
H2O
H2O
NH3
NH3
AEM Catalyst
Layers
GDLs
OH-
e-
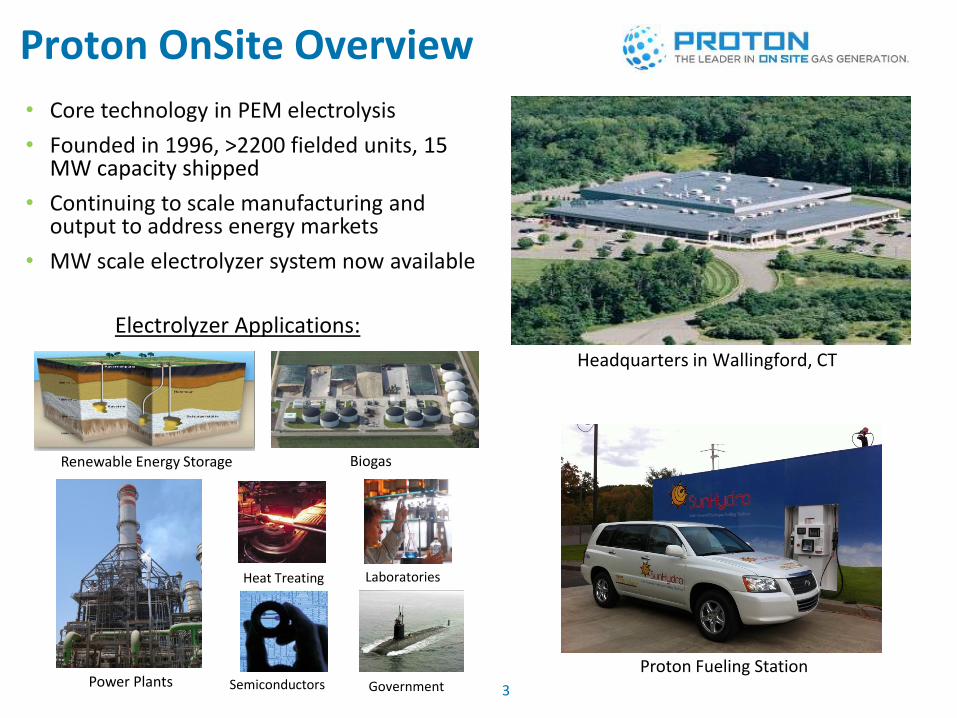
• Core technology in PEM electrolysis
• Founded in 1996, >2200 fielded units, 15 MW capacity shipped
• Continuing to scale manufacturing and output to address energy markets
• MW scale electrolyzer system now available
Proton OnSite Overview
Headquarters in Wallingford, CT
Electrolyzer Applications:
Power Plants Government
Heat Treating Laboratories
Semiconductors Proton Fueling Station
3
Renewable Energy Storage Biogas
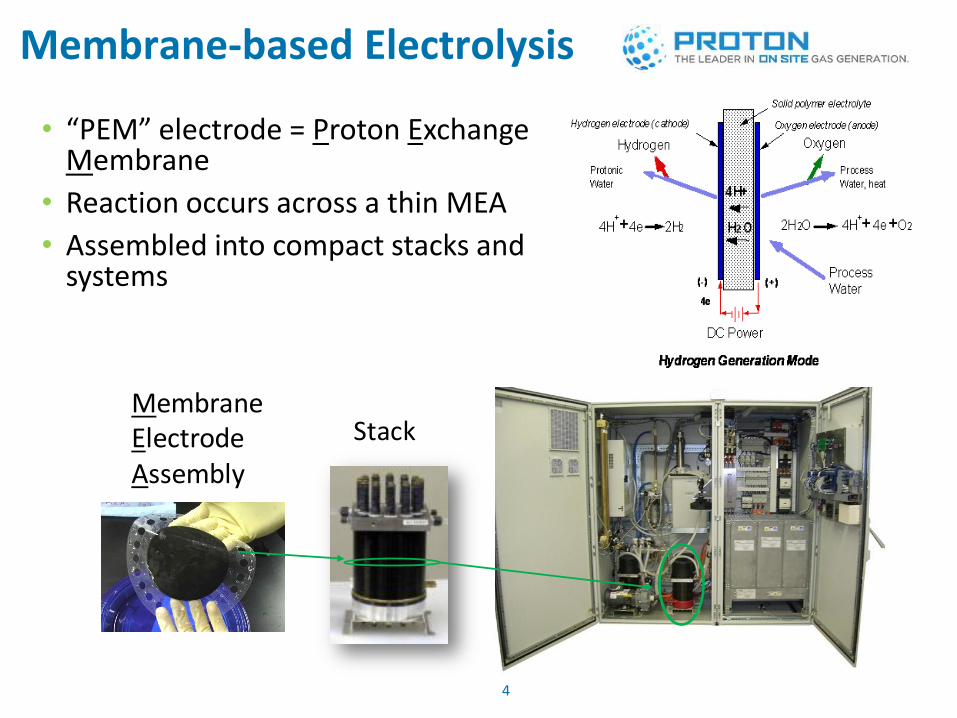
Membrane-based Electrolysis
4
MembraneElectrode Assembly
Stack
• “PEM” electrode = Proton Exchange Membrane
• Reaction occurs across a thin MEA
• Assembled into compact stacks and systems
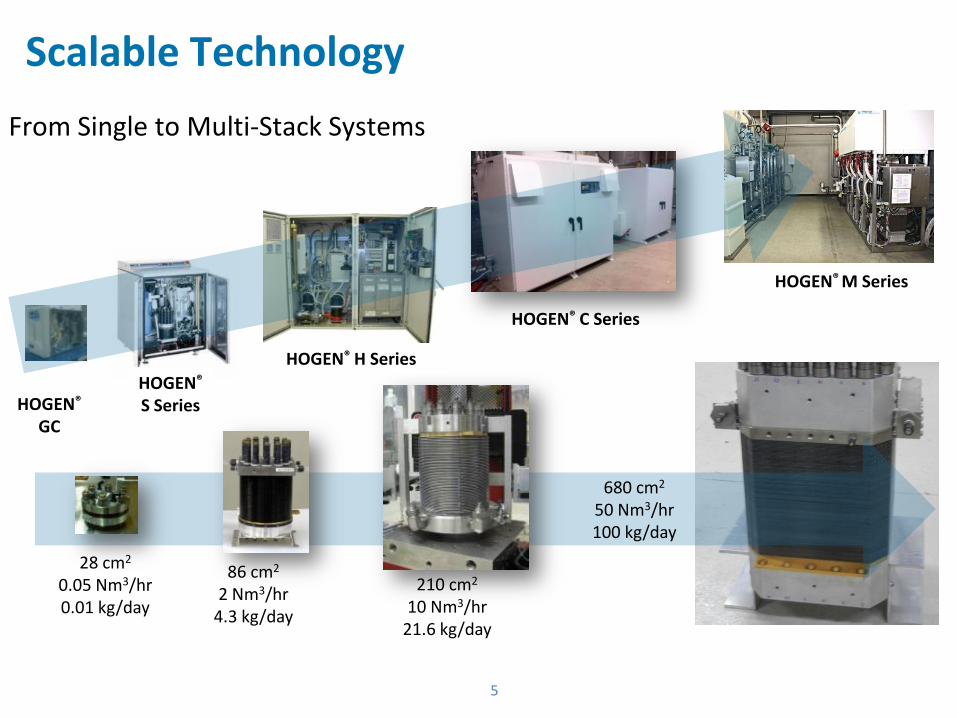
28 cm2
0.05 Nm3/hr 0.01 kg/day
86 cm2
2 Nm3/hr 4.3 kg/day
210 cm2
10 Nm3/hr 21.6 kg/day
680 cm2
50 Nm3/hr 100 kg/day
Up to three stacks per system
Scalable Technology
5
HOGEN® H Series
HOGEN® C Series
HOGEN® S Series HOGEN®
GC
From Single to Multi-Stack Systems
HOGEN® M Series
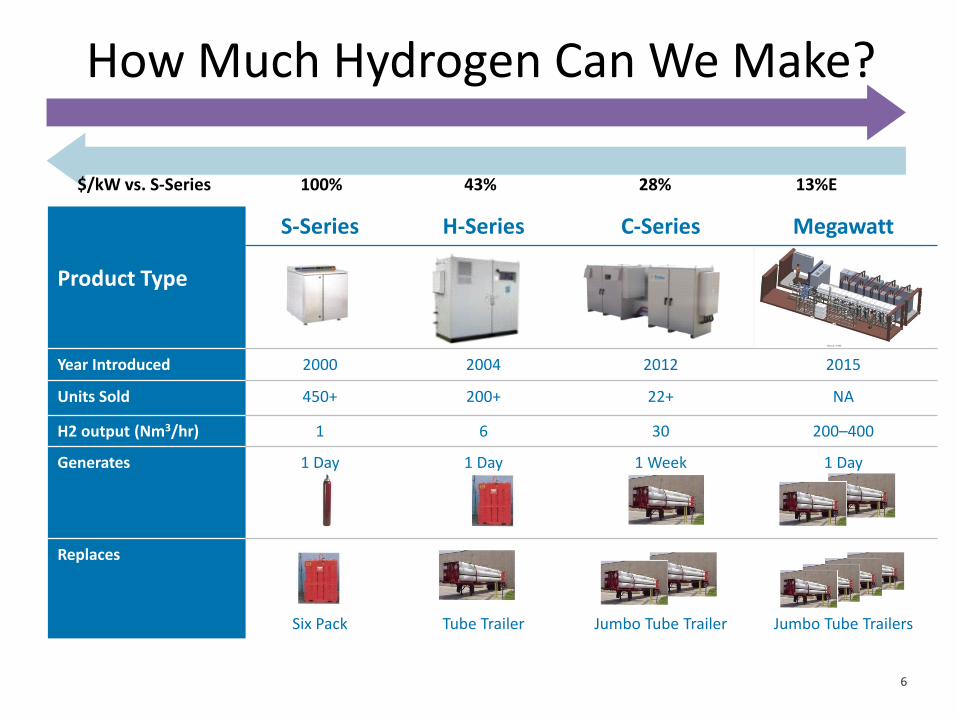
Product Type
S-Series H-Series C-Series Megawatt
Year Introduced 2000 2004 2012 2015
Units Sold 450+ 200+ 22+ NA
H2 output (Nm3/hr) 1 6 30 200–400
Generates 1 Day 1 Day 1 Week 1 Day
Replaces
Six Pack Tube Trailer Jumbo Tube Trailer Jumbo Tube Trailers
How Much Hydrogen Can We Make?
Input Power 6 kW 36 kW 180 kW 1 - 2 MW
$/kW vs. S-Series 100% 43% 28% 13%E
6
Outline
7
Proton OnSite Overview
Electrochemical Ammonia Synthesis
Results and Future Directions
0.00.51.01.52.02.53.03.54.04.55.0
Hour 1 Hour 2 Hour 3 Hour 4(after water
rinse)
Effi
cie
ncy
, % (
1.2
V)
Pt black
Fe-Ni LSA (1)
Fe-Ni LSA (2)
Fe-Ni HSA
Ni only
Fe only
Fe-Pt
0.00.51.01.52.02.53.03.54.04.55.0
Hour 1 Hour 2 Hour 3 Hour 4(after water
rinse)
Effi
cie
ncy
, % (
1.2
V)
Pt black
Fe-Ni LSA (1)
Fe-Ni LSA (2)
Fe-Ni HSA
Ni only
Fe only
Fe-Pt0.00.51.01.52.02.53.03.54.04.55.0
Hour 1 Hour 2 Hour 3 Hour 4(after water
rinse)
Effi
cie
ncy
, % (
1.2
V)
Pt black
Fe-Ni LSA (1)
Fe-Ni LSA (2)
Fe-Ni HSA
Ni only
Fe only
Fe-Pt0.00.51.01.52.02.53.03.54.04.55.0
Hour 1 Hour 2 Hour 3 Hour 4(after water
rinse)
Effi
cie
ncy
, % (
1.2
V)
Pt black
Fe-Ni LSA (1)
Fe-Ni LSA (2)
Fe-Ni HSA
Ni only
Fe only
Fe-Pt
H2O
H2O
O2
H2O
H2O
H2O
N2
H2O
H2O
H2O
NH3
NH3
AEM Catalyst
Layers
GDLs
OH-
e-

Ammonia Production History
8
0
1000
2000
3000
4000
5000
6000
7000
8000
0 100 200 300 400 500 600 700 800 900 1000 1100 1200 1300 1400 1500 1600 1700 1800 1900 2000
Est
imat
ed P
op
luat
ion
(m
illio
ns)
Year
mining
manufacturing
Fritz Haber Carl Bosch
mid 1800’s: mining
(1) History Today Volume 30 Issue 6 June 1980 (2) Dept. of the Interior US Geological Survey Bulletin 523, 1912
Guano mining1 Nitrate salt mining2
1899: Crooks raises alarm
1913: Haber-Bosch
• Haber-Bosch supports about half of the people on earth3
(3) J.W. Erisman, M.A. Sutton, J. Galloway, Z. Klimont, W. Winiwarter, Nat. Geosci., 1 (2008) 636-639.

Haber-Bosch (HB) Process
9
• H2 obtained from fossil fuels, high temp and high pressure, high capital cost
• Inefficient (consumes ~1% of the worlds energy)
• High-polluting (~3% GHG emissions) Ammonia Production: Moving Towards Maximum Efficiency and Lower GHG Emissions http://www.fertilizer.org/, 2014.
Feeding the Earth, International Fertilizer Industry Association, http://www.fertilizer.org/, 2009.
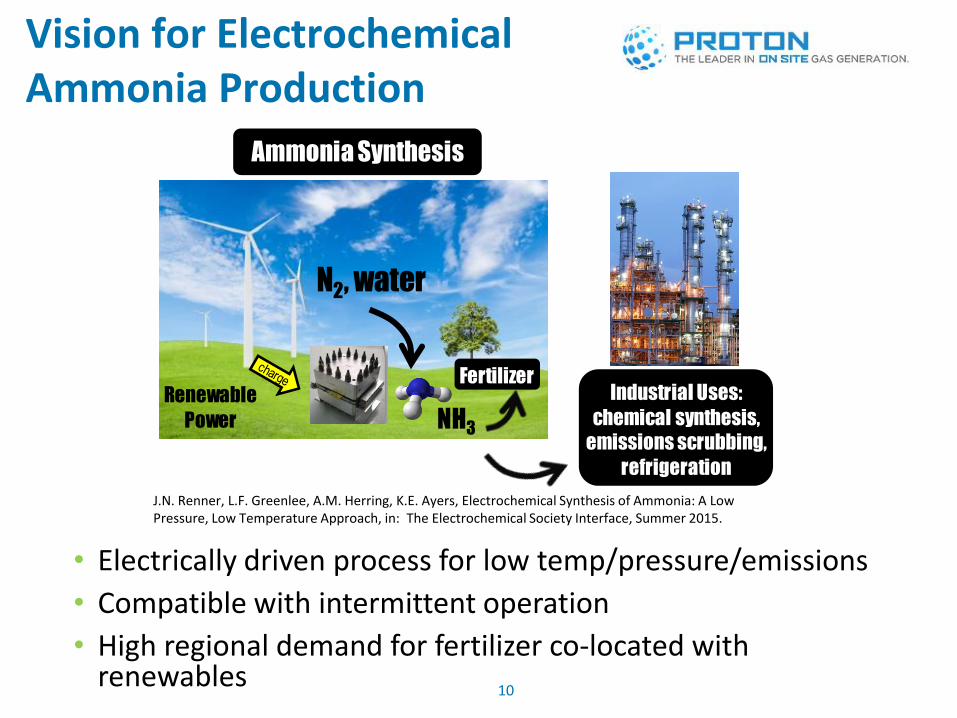
Vision for Electrochemical Ammonia Production
10
Ammonia Synthesis
Renewable
Power NH3
N2, water
Industrial Uses:
chemical synthesis,
emissions scrubbing,
refrigeration
Fertilizer
• Electrically driven process for low temp/pressure/emissions
• Compatible with intermittent operation
• High regional demand for fertilizer co-located with renewables
J.N. Renner, L.F. Greenlee, A.M. Herring, K.E. Ayers, Electrochemical Synthesis of Ammonia: A Low Pressure, Low Temperature Approach, in: The Electrochemical Society Interface, Summer 2015.
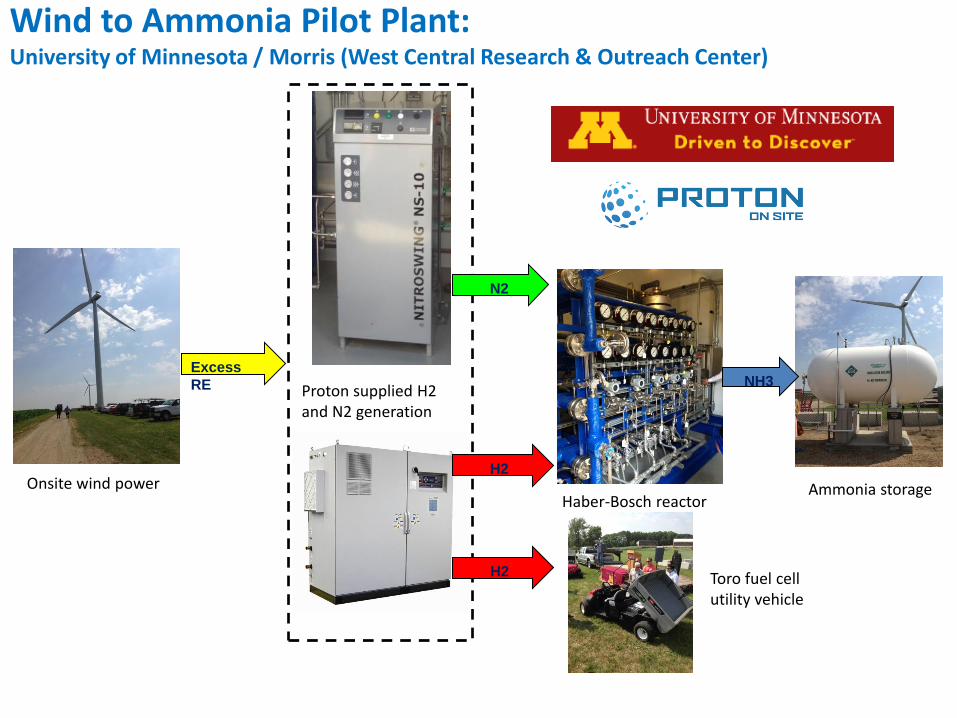
Wind to Ammonia Pilot Plant: University of Minnesota / Morris (West Central Research & Outreach Center)
Ammonia storage
Proton supplied H2 and N2 generation
Excess
RE
N2
Haber-Bosch reactor
NH3
Onsite wind power H2
H2 Toro fuel cell utility vehicle

Scalable Technology
12
• Enables networks of distributed scale and near point-of-use
• Proton developing MW-scale
A 5 MW system could produce 10 tons/day ammonia (@ 500 mA/cm2, 50% efficiency, 1.5 V)
HOGEN® H Series HOGEN® C Series
Up to three stacks per systemHOGEN®
S Series
HOGEN®
GC
From Single to Multi-Stack SystemsAmmonia Production Technology Plan
PHASE I
Bench Scale Size: 25 cm2
Proof-of-Concept PhaseBench Scale
TargetsCurrent Efficiency: > 1%
PHASE II
GC Size: 28-84 cm2
Breadboard PhaseGarden Capacity (100 g/year)
TargetsCurrent Efficiency: 10%Current Density: 10 mA/cm2
FUTURE
M Series: 250,000-500,000 cm2
Product PhaseSmall Farm (260 acres – 12,500 kg/year)
TargetsCurrent Efficiency: 50%Current Density: 50 mA/cm2
M Series

Background/Key Obstacles
13
• PEM demonstrated feasibility
• At 1.5 V and below, need ~50% Faradaic efficiency to match HB
• Key obstacle: selective catalyst • low NH3 overpotential
• high H2 overpotential
A volcano plot predicting metal performance for nitrogen electroreduction
Ap
plie
d P
ote
nti
al (
V)
Binding Energy
E. Skúlason, et. al, Phys. Chem. Chem. Phys., 14 (2012).
R. Lan, J.T.S. Irvine, S. Tao, Scientific Reports, 3 (2013).
Applied Potential (V)
Faradaic Efficien
cy (%)
NH
3 F
orm
atio
n R
ate
(X1
0-5
mo
l m-2
s-1
)

AEM-based Approach
14
• AEM enables wider range of efficient catalysts vs. PEM
• Lower cost materials of construction in alkaline environment
H2O
H2O
O2
Anode:
H2O
H2O
H2O
N2
H2O
H2O
H2O
NH3
NH3
12 OH- 3 O2 + 6 H2O + 12 e-
Cathode:
12 H2O + 2 N2 + 12 e- 4 NH3 + 12 OH-
AEM Catalyst
Layers
GDLs
OH-
e-
More Catalyst Options:
• Non-noble
• Blended metals
• Core-shell
• Ligands

Outline
15
Proton OnSite Overview
Electrochemical Ammonia Synthesis
Results and Future Directions
0.00.51.01.52.02.53.03.54.04.55.0
Hour 1 Hour 2 Hour 3 Hour 4(after water
rinse)
Effi
cie
ncy
, % (
1.2
V)
Pt black
Fe-Ni LSA (1)
Fe-Ni LSA (2)
Fe-Ni HSA
Ni only
Fe only
Fe-Pt
0.00.51.01.52.02.53.03.54.04.55.0
Hour 1 Hour 2 Hour 3 Hour 4(after water
rinse)
Effi
cie
ncy
, % (
1.2
V)
Pt black
Fe-Ni LSA (1)
Fe-Ni LSA (2)
Fe-Ni HSA
Ni only
Fe only
Fe-Pt0.00.51.01.52.02.53.03.54.04.55.0
Hour 1 Hour 2 Hour 3 Hour 4(after water
rinse)
Effi
cie
ncy
, % (
1.2
V)
Pt black
Fe-Ni LSA (1)
Fe-Ni LSA (2)
Fe-Ni HSA
Ni only
Fe only
Fe-Pt0.00.51.01.52.02.53.03.54.04.55.0
Hour 1 Hour 2 Hour 3 Hour 4(after water
rinse)
Effi
cie
ncy
, % (
1.2
V)
Pt black
Fe-Ni LSA (1)
Fe-Ni LSA (2)
Fe-Ni HSA
Ni only
Fe only
Fe-Pt
H2O
H2O
O2
H2O
H2O
H2O
N2
H2O
H2O
H2O
NH3
NH3
AEM Catalyst
Layers
GDLs
OH-
e-

Ammonia Generation Rig
16
• Design reviewed by senior engineers, safety qualified
• Test bed to compare multiple configurations and catalysts
• Sensitive colorimetric assay for ammonia (verified independently)
Increasing ammonia concentration
Ammonia Capture via Acid Trap and Determination via Colorimetric Assay:
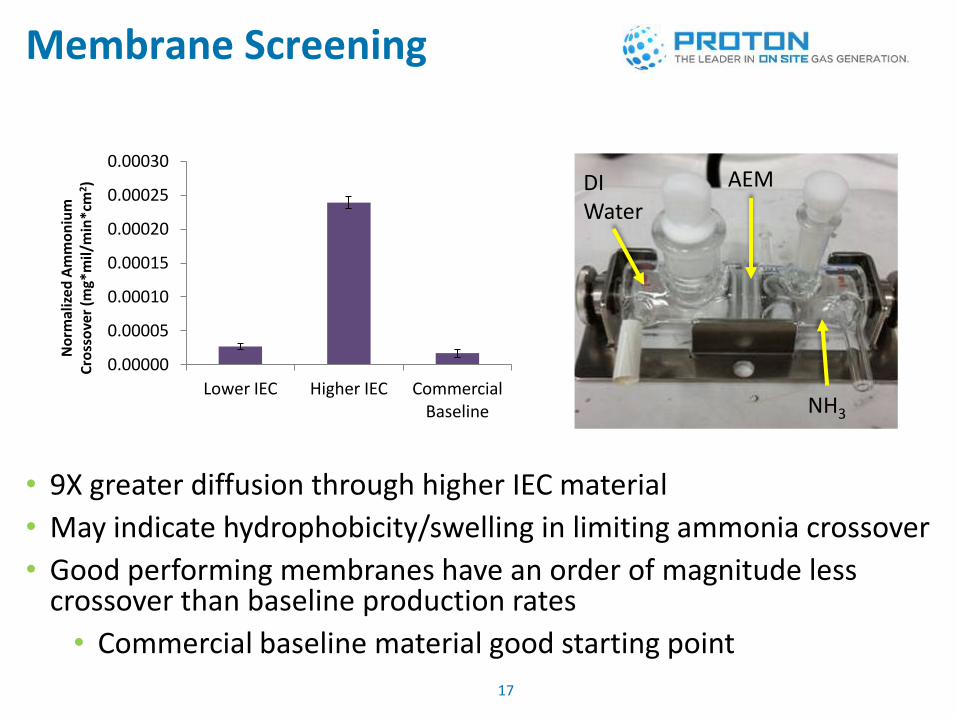
Membrane Screening
17
• 9X greater diffusion through higher IEC material
• May indicate hydrophobicity/swelling in limiting ammonia crossover
• Good performing membranes have an order of magnitude less crossover than baseline production rates
• Commercial baseline material good starting point
AEM
NH3
DI Water
0.00000
0.00005
0.00010
0.00015
0.00020
0.00025
0.00030
Lower IEC Higher IEC Commercial Baseline
No
rmal
ized
Am
mo
niu
m
Cro
sso
ver
(mg*
mil/
min
*cm
2)
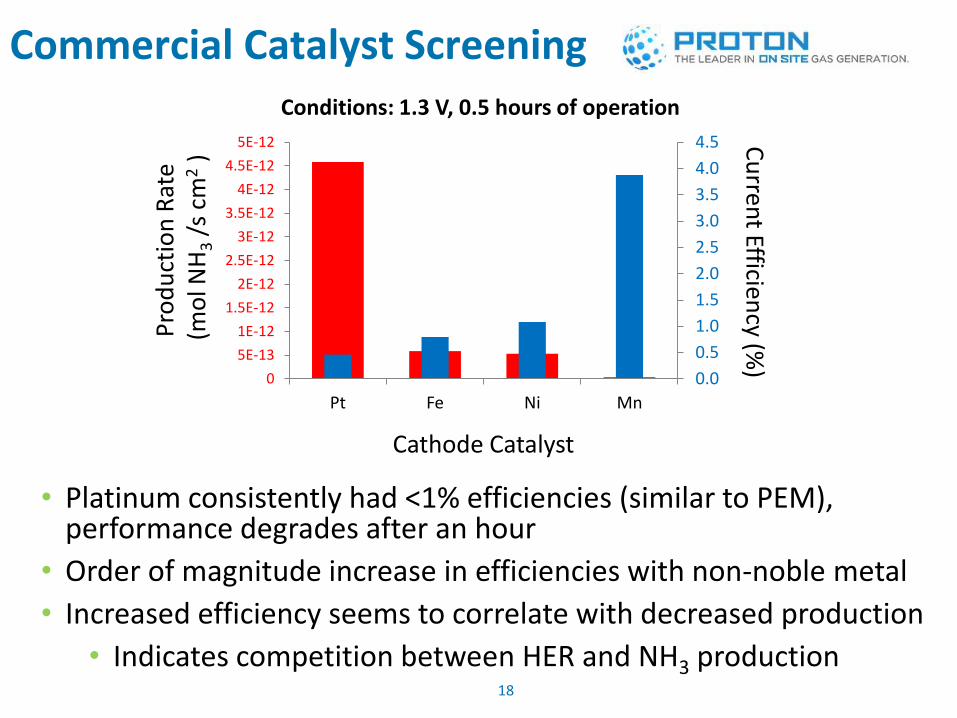
Commercial Catalyst Screening
18
• Platinum consistently had <1% efficiencies (similar to PEM), performance degrades after an hour
• Order of magnitude increase in efficiencies with non-noble metal
• Increased efficiency seems to correlate with decreased production
• Indicates competition between HER and NH3 production
0.0
0.5
1.0
1.5
2.0
2.5
3.0
3.5
4.0
4.5
0
5E-13
1E-12
1.5E-12
2E-12
2.5E-12
3E-12
3.5E-12
4E-12
4.5E-12
5E-12
Pt Fe Ni Mn
Cathode Catalyst
Pro
du
ctio
n R
ate
(m
ol N
H3 /
s cm
2 )
Cu
rrent Efficien
cy (%)
Conditions: 1.3 V, 0.5 hours of operation
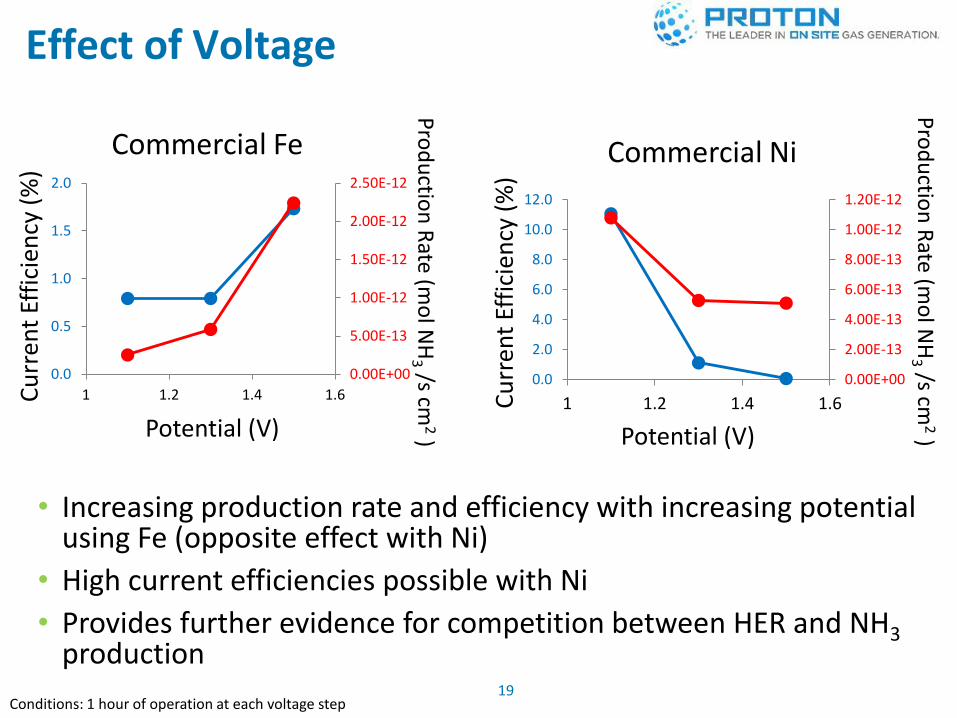
Effect of Voltage
19
• Increasing production rate and efficiency with increasing potential using Fe (opposite effect with Ni)
• High current efficiencies possible with Ni
• Provides further evidence for competition between HER and NH3 production
0.00E+00
5.00E-13
1.00E-12
1.50E-12
2.00E-12
2.50E-12
0.0
0.5
1.0
1.5
2.0
1 1.2 1.4 1.6
Potential (V)
Pro
du
ction
Rate (m
ol N
H3 /s cm
2 )
Cu
rren
t Ef
fici
ency
(%
)
Conditions: 1 hour of operation at each voltage step
0.00E+00
2.00E-13
4.00E-13
6.00E-13
8.00E-13
1.00E-12
1.20E-12
0.0
2.0
4.0
6.0
8.0
10.0
12.0
1 1.2 1.4 1.6
Potential (V)
Cu
rren
t Ef
fici
ency
(%
)
Pro
du
ction
Rate (m
ol N
H3 /s cm
2 )
Commercial Fe Commercial Ni
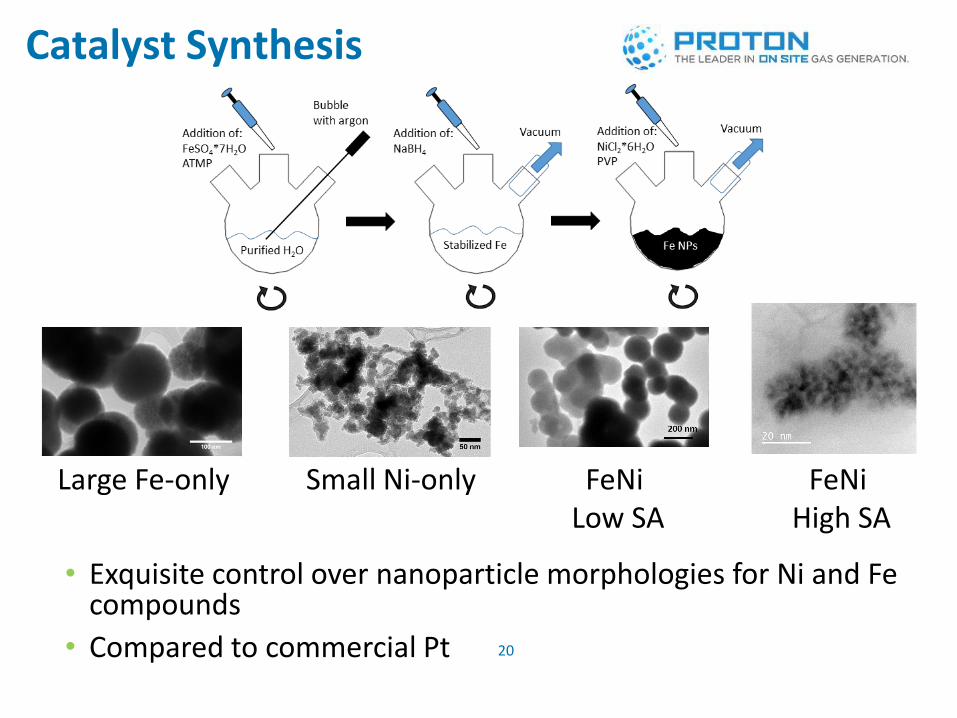
Catalyst Synthesis
20
FeNi Low SA
FeNi High SA
Large Fe-only Small Ni-only
• Exquisite control over nanoparticle morphologies for Ni and Fe compounds
• Compared to commercial Pt
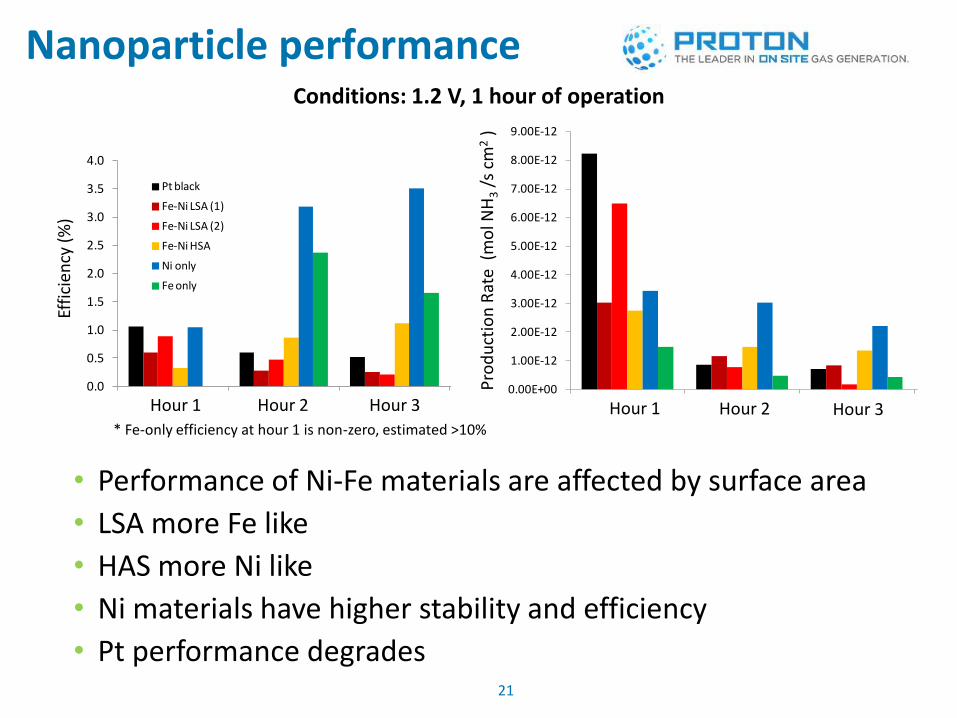
Nanoparticle performance
21
• Performance of Ni-Fe materials are affected by surface area
• LSA more Fe like
• HAS more Ni like
• Ni materials have higher stability and efficiency
• Pt performance degrades
0.0
0.5
1.0
1.5
2.0
2.5
3.0
3.5
4.0
Hour 1 Hour 2 Hour 3 Hour 4(after water rinse)
Effi
cie
ncy
, % (
1.2
V)
Pt black
Fe-Ni LSA (1)
Fe-Ni LSA (2)
Fe-Ni HSA
Ni only
Fe only
0.00E+00
1.00E-12
2.00E-12
3.00E-12
4.00E-12
5.00E-12
6.00E-12
7.00E-12
8.00E-12
9.00E-12
Hour 1 Hour 2 Hour 3 Hour 4(after water rinse)
Am
mo
nia
Pro
du
ctio
n R
ate
(m
ol c
m-2
s-1
)
Pt black
Fe-Ni LSA (1)
Fe-Ni LSA (2)
Fe-Ni HSA
Ni only
Fe only
* Fe-only efficiency at hour 1 is non-zero, estimated >10%
Conditions: 1.2 V, 1 hour of operation
Pro
du
ctio
n R
ate
(m
ol N
H3 /
s cm
2 )
Effi
cien
cy (
%)
Hour 1 Hour 1 Hour 2 Hour 3 Hour 2 Hour 3
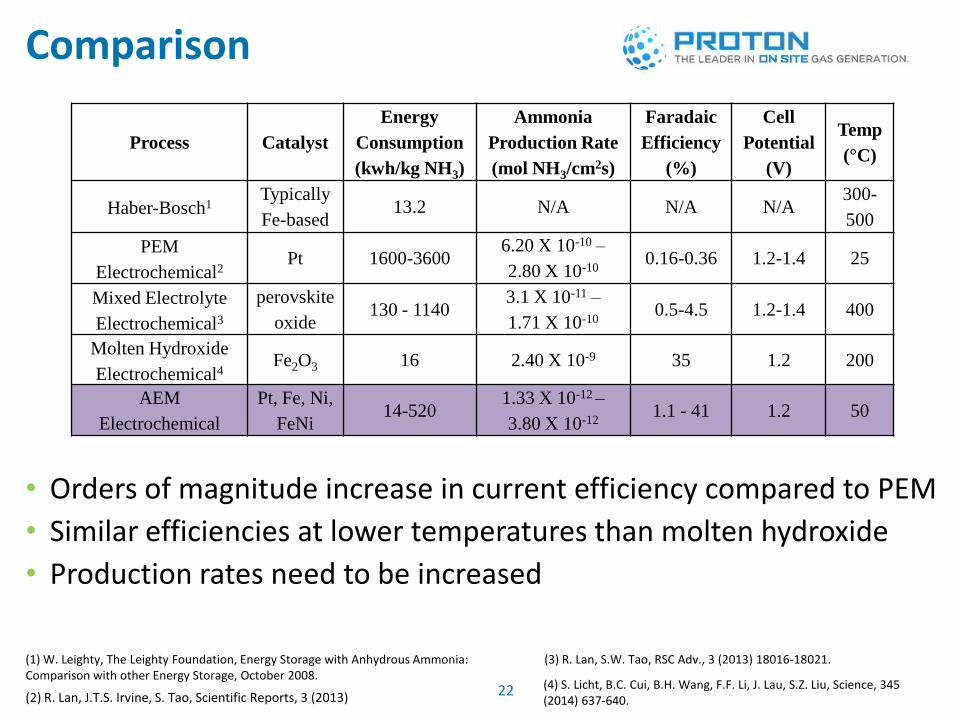
Comparison
22
• Orders of magnitude increase in current efficiency compared to PEM
• Similar efficiencies at lower temperatures than molten hydroxide
• Production rates need to be increased
Process Catalyst
Energy
Consumption
(kwh/kg NH3)
Ammonia
Production Rate
(mol NH3/cm2s)
Faradaic
Efficiency
(%)
Cell
Potential
(V)
Temp
(°C)
Haber-Bosch1 Typically
Fe-based 13.2 N/A N/A N/A
300-
500
PEM
Electrochemical2 Pt 1600-3600
6.20 X 10⁻¹⁰ –
2.80 X 10⁻¹⁰ 0.16-0.36 1.2-1.4 25
Mixed Electrolyte
Electrochemical3
perovskite
oxide 130 - 1140
3.1 X 10⁻¹¹ –
1.71 X 10⁻¹⁰ 0.5-4.5 1.2-1.4 400
Molten Hydroxide
Electrochemical4 Fe2O3 16 2.40 X 10⁻⁹ 35 1.2 200
AEM
Electrochemical
Pt, Fe, Ni,
FeNi 14-520
1.33 X 10⁻¹² –
3.80 X 10⁻¹² 1.1 - 41 1.2 50
(1) W. Leighty, The Leighty Foundation, Energy Storage with Anhydrous Ammonia: Comparison with other Energy Storage, October 2008.
(2) R. Lan, J.T.S. Irvine, S. Tao, Scientific Reports, 3 (2013)
(3) R. Lan, S.W. Tao, RSC Adv., 3 (2013) 18016-18021.
(4) S. Licht, B.C. Cui, B.H. Wang, F.F. Li, J. Lau, S.Z. Liu, Science, 345 (2014) 637-640.

Conclusions
23
• The developed system provided an adequate test bed
• Proof-of-concept was established for AEM-based ammonia generation
• An order of magnitude increase in efficiency was observed compared literature at similar conditions
H2O
H2O
O2
H2O
H2O
H2O
N2
H2O
H2O
H2O
NH3
NH3
AEM Catalyst
Layers
GDLs
OH-
e-
• AEM-based technology is promising for efficient ammonia production at low temperatures
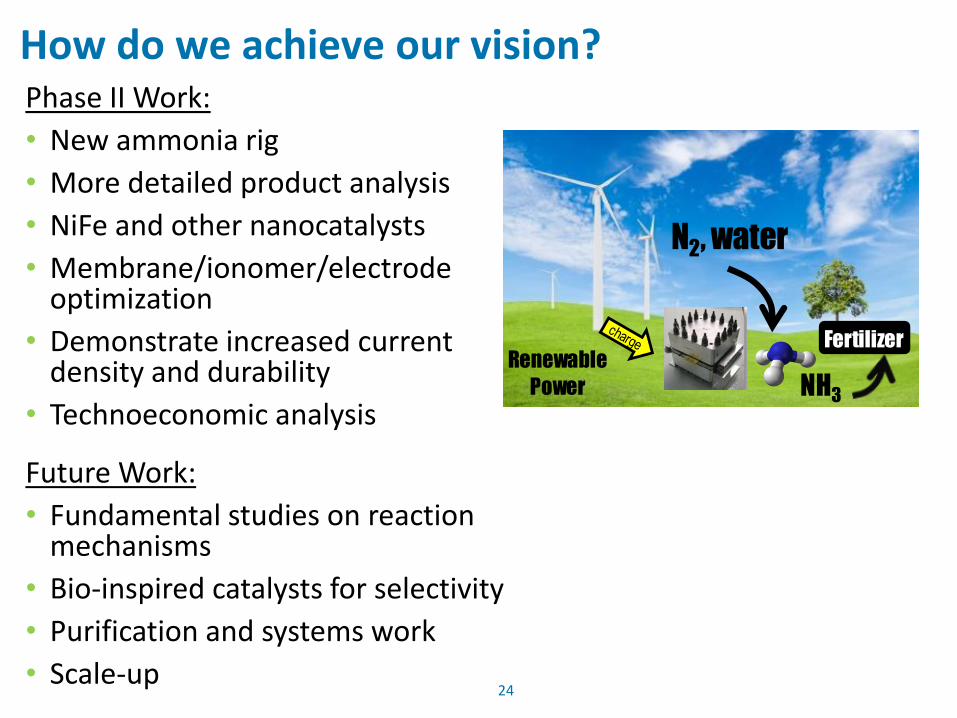
How do we achieve our vision?
24
Ammonia Synthesis
Renewable
Power NH3
N2, water
Industrial Uses:
chemical synthesis,
emissions scrubbing,
refrigeration
Fertilizer
Phase II Work:
• New ammonia rig
• More detailed product analysis
• NiFe and other nanocatalysts
• Membrane/ionomer/electrode optimization
• Demonstrate increased current density and durability
• Technoeconomic analysis
Future Work:
• Fundamental studies on reaction mechanisms
• Bio-inspired catalysts for selectivity
• Purification and systems work
• Scale-up
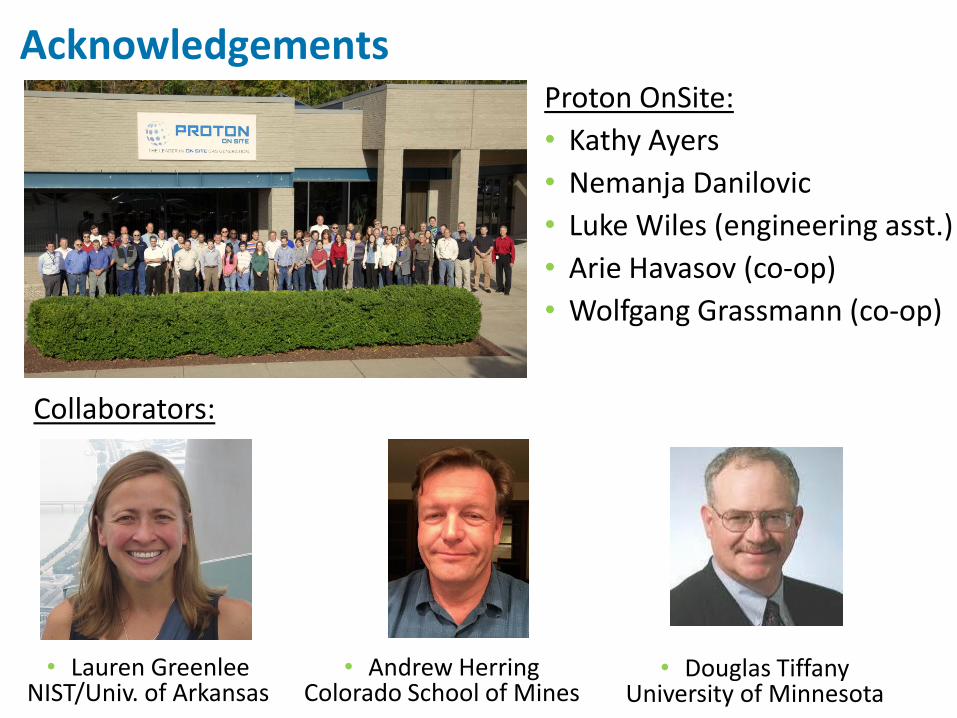
Acknowledgements Proton OnSite:
• Kathy Ayers
• Nemanja Danilovic
• Luke Wiles (engineering asst.)
• Arie Havasov (co-op)
• Wolfgang Grassmann (co-op)
Collaborators:
• Lauren Greenlee NIST/Univ. of Arkansas
• Andrew Herring Colorado School of Mines
• Douglas Tiffany University of Minnesota
Questions and Discussion
Funding: •USDA Phase I/II SBIR
•NSF/ASEE Postdoctoral Fellowship