Embed Size (px)
Citation preview
R-10-018E 010.6-Rev.2
High-Damping Rubber Bearings for Base Isolation
Technical Report Product Code: HDR-X0.6R
Bridgestone Corporation Seismic Isolation & Vibration Control Products Development

Contents
Page
1. Construction 1
2. Horizontal Properties (Numerical Model) 3
3. Variation of Horizontal Properties 5
4. Vertical Properties 6
5. Nominal Long-Term Compressive Stress 7
6. Ultimate Properties 8
Annex-A Temperature Dependence on Shear Properties 11
Annex-B Change of Restoring Force Characteristics by Ageing 12
Annex-C Creep Properties 14
Annex-D Frequency Dependency of Restoring Force
Characteristics 15
Annex-E Shear Strain Dependency of Restoring Force
Characteristics 16
Annex-F Tensile Fracture Strain 17
Annex-G Repeated Loading Dependency of Restoring Force
Characteristics 18
Annex-H Ultimate Property Diagram 19
H.1 HH-Series (Total Rubber Height: 200mm) 19
H.2 HL-Series (Total Rubber Height: 160mm) 22
H.3 HT-Series (Total Rubber Height: 250mm) 24
Annex-I Compressive Stress Dependency of Restoring Force
Characteristics 25

1. Construction □Basic construction
Basic construction of High Damping Rubber Bearings (HDR-X0.6R) is shown in Figure-1.
HDR consists of alternate rubber layers and reinforcing steel plates. The inner rubber composed of the high
damping materials, to demonstrate spring and damping capabilities itself.
Basic dimensional range of High Damping Rubber Bearings is shown in Table-1. As shown in table,
HDR-X0.6R supplied a wide range of sizes according to axial forces and required responsibility.
Bolt Hole
Flange
Cover Rubber
Reinforcing Steel Plate
Inner Rubber
Figure-1 Basic Structure of High Damping Rubber Bearing
Table-1 Dimensional characteristics
Items Characteristics
Compound name X0.6R
Shear modulus N/mm2 0.62 Rubber
Equivalent damping ratio 0.24
Outer diameter, mm φ500~1600 Dimension
Inner diameter, mm φ15~80
First shape factor 35~40 Shape factor
Secondary shape factor 3.0~10.0
【Note】
(1)Dimensions and product performance of each Bridgestone standard size is shown in Catalogue.
(2)Dimensional tolerance is shown in Table 2.
Table-2 Dimensional tolerance
Item Standard
Isolator height *1 Design height ±1.5% and ± 6mm
Isolator slope *2 0.5% of Flange diameter and < 3mm
Horizontal offset < 5mm
Rubber diameter Design v. ±0.5% and <±4mm
Flange diameter Design v. ±3.0mm
Flange thickness Design v.±0.9mm
Bolt pitch center diameter Design v. ±1.2mm
*1: Average on 4 points, temperature = 20 Degrees Celsius
*2: Difference of height located in diagonal position
1
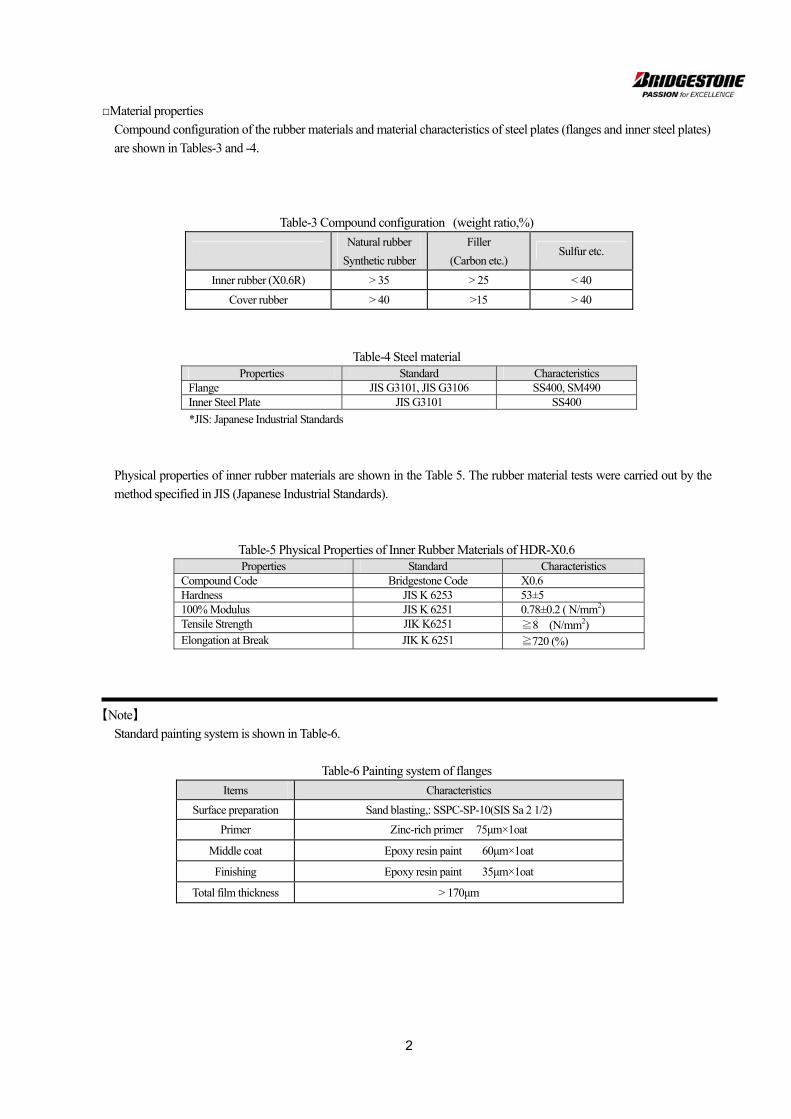
□Material properties
Compound configuration of the rubber materials and material characteristics of steel plates (flanges and inner steel plates)
are shown in Tables-3 and -4.
Table-3 Compound configuration (weight ratio,%)
Natural rubber
Synthetic rubber
Filler
(Carbon etc.) Sulfur etc.
Inner rubber (X0.6R) > 35 > 25 < 40
Cover rubber > 40 >15 > 40
Table-4 Steel material Properties Standard Characteristics
Flange JIS G3101, JIS G3106 SS400, SM490 Inner Steel Plate JIS G3101 SS400
*JIS: Japanese Industrial Standards
Physical properties of inner rubber materials are shown in the Table 5. The rubber material tests were carried out by the
method specified in JIS (Japanese Industrial Standards).
Table-5 Physical Properties of Inner Rubber Materials of HDR-X0.6 Properties Standard Characteristics
Compound Code Bridgestone Code X0.6 Hardness JIS K 6253 53±5 100% Modulus JIS K 6251 0.78±0.2 ( N/mm2) Tensile Strength JIK K6251 ≧8 (N/mm2) Elongation at Break JIK K 6251 ≧720 (%)
【Note】
Standard painting system is shown in Table-6.
Table-6 Painting system of flanges
Items Characteristics
Surface preparation Sand blasting,: SSPC-SP-10(SIS Sa 2 1/2)
Primer Zinc-rich primer 75μm×1oat
Middle coat Epoxy resin paint 60μm×1oat
Finishing Epoxy resin paint 35μm×1oat
Total film thickness > 170μm
2
2. Horizontal Properties (Numerical Model)
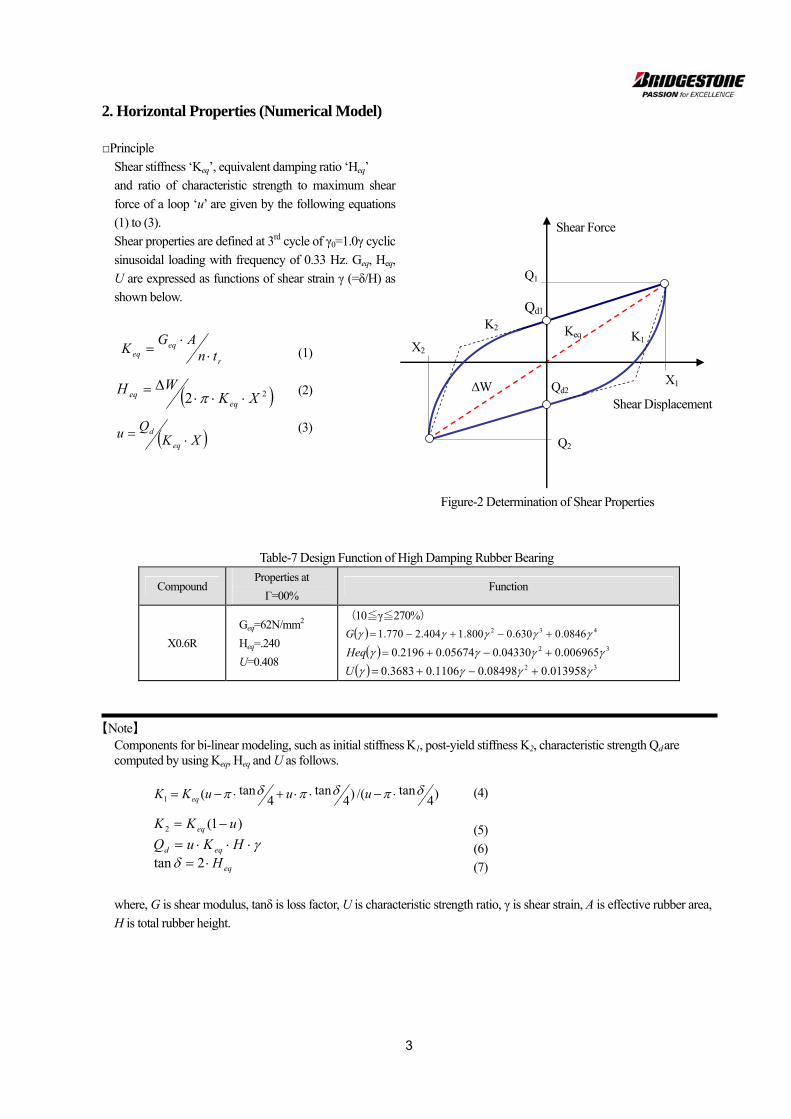
□Principle
Shear stiffness ‘Keq’, equivalent damping ratio ‘Heq’
and ratio of characteristic strength to maximum shear
force of a loop ‘u’ are given by the following equations
(1) to (3).
Shear properties are defined at 3rd cycle of γ0=1.0γ cyclic
sinusoidal loading with frequency of 0.33 Hz. Geq, Heq,
U are expressed as functions of shear strain γ (=δ/H) as
shown below.
(1)
(2)
(3)
Figure-2 Determination of Shear Properties
Table-7 Design Function of High Damping Rubber Bearing
Compound Properties at
Γ=00% Function
X0.6R
Geq=62N/mm2
Heq=.240
U=0.408
(10≦γ≦270%)
432 0846.0630.0800.1404.2770.1 G
32 006965.004330.005674.02196.0 Heq
32 013958.008498.01106.03683.0 U
【Note】 Components for bi-linear modeling, such as initial stiffness K1, post-yield stiffness K2, characteristic strength Qd are computed by using Keq, Heq and U as follows.
(4)
(5)
(6)
(7)
where, G is shear modulus, tanδ is loss factor, U is characteristic strength ratio, γ is shear strain, A is effective rubber area,
H is total rubber height.
Shear Displacement
Shear Force
ΔW
Q1
Qd1 K2 Keq K1
r
eqeq tn
AGK
X2
X1
Q2
Qd2 22 XKWH
eqeq
XKQu
eq
d
tan/()4tan
4tan(1 )4
uuuKK eq
1(2 uKK eq )
HKuQ eqd
eqH 2tan
3
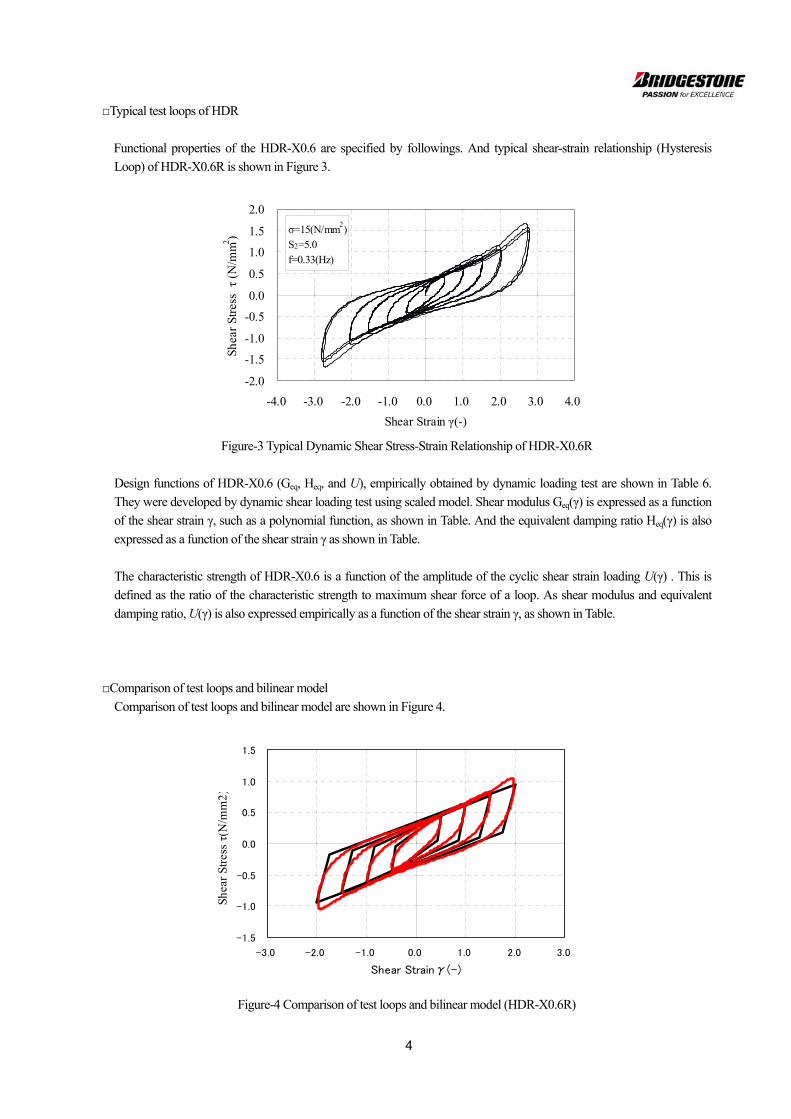
□Typical test loops of HDR
Functional properties of the HDR-X0.6 are specified by followings. And typical shear-strain relationship (Hysteresis
Loop) of HDR-X0.6R is shown in Figure 3.
σ=15(N/mm2)
S2=5.0
f=0.33(Hz)
-2.0
-1.5
-1.0
-0.5
0.0
0.5
1.0
1.5
2.0
-4.0 -3.0 -2.0 -1.0 0.0 1.0 2.0 3.0 4.0
Shear Strain γ(-)
Shea
r St
ress
τ (
N/m
m2 )
Figure-3 Typical Dynamic Shear Stress-Strain Relationship of HDR-X0.6R
Design functions of HDR-X0.6 (Geq, Heq, and U), empirically obtained by dynamic loading test are shown in Table 6.
They were developed by dynamic shear loading test using scaled model. Shear modulus Geq(γ) is expressed as a function
of the shear strain γ, such as a polynomial function, as shown in Table. And the equivalent damping ratio Heq(γ) is also
expressed as a function of the shear strain γ as shown in Table.
The characteristic strength of HDR-X0.6 is a function of the amplitude of the cyclic shear strain loading U(γ) . This is
defined as the ratio of the characteristic strength to maximum shear force of a loop. As shear modulus and equivalent
damping ratio, U(γ) is also expressed empirically as a function of the shear strain γ, as shown in Table.
□Comparison of test loops and bilinear model
Comparison of test loops and bilinear model are shown in Figure 4.
-1.5
-1.0
-0.5
0.0
0.5
1.0
1.5
-3.0 -2.0 -1.0 0.0 1.0
Shear Strainγ(-)
Shea
r St
ress
τ(N
/mm
2
2.0 3.0
)
Figure-4 Comparison of test loops and bilinear model (HDR-X0.6R)
4

3. Variation of Horizontal Properties
Factors of variation of horizontal properties are as shown as follows.
(1) Manufacturing tolerance
(2) Temperature dependency
(3) Ageing (degradation)
Change ratio of each factor is shown in Table.
Table-8 Design Function of High Damping Rubber Bearing Compound Factor Change Remarks
Manufacturing tolerance
Keq: global±10% (individual±20%) Heq: global±10% (individual±20%)
Temperature Keq: +21%(0 Degrees Celsius), -16%(40 Degrees Celsius)
Heq: +7%(0 Degrees Celsius), -13%(40 Degrees Celsius)
Standard temp 20 Degrees Celsius X0.6R
Ageing Keq: +10% Heq: -10%
20 Degrees Celsius x 60 years
Table-9 Example of variation-combination Compound X0.6R
Keq +10% -10% Manufacturing tolerance *1 Heq -10% +10%
Keq +10% 0% Aging
Heq -10% 0%
Keq +21% -16% Temperature depend.20 Degrees Celsius
±20 Degrees Celsius Heq +7% -13%
Keq +41% -26% Total
Heq -13% -3%
*1: Empirically, the manufacturing tolerance of Keq and Heq is related such as when Keq is (+) side,
Heq is in (-) side.
5
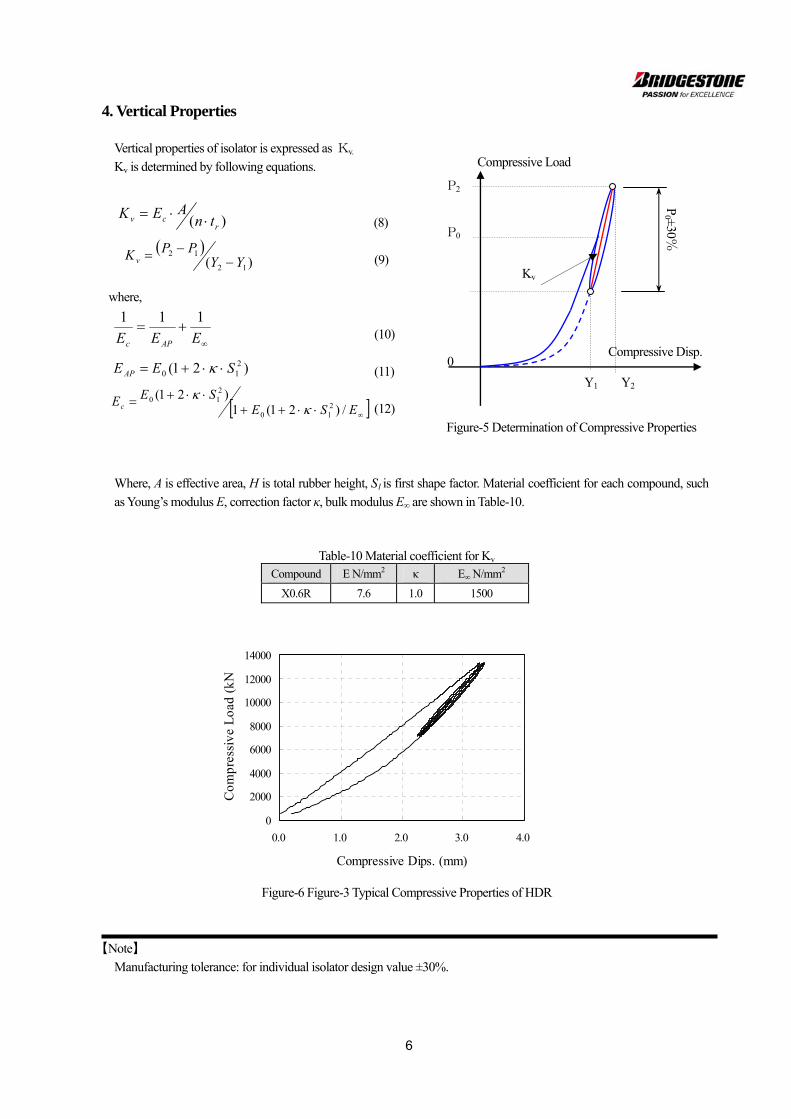
4. Vertical Properties
Vertical properties of isolator is expressed as Kv. Compressive Load Kv is determined by following equations.
(8)
(9)
where,
(10)
(11)
(12)
Figure-5 Determination of Compressive Properties
Where, A is effective area, H is total rubber height, S1 is first shape factor. Material coefficient for each compound, such
as Young’s modulus E, correction factor κ, bulk modulus E∞ are shown in Table-10.
Table-10 Material coefficient for Kv
Compound E N/mm2 κ E∞ N/mm2
X0.6R 7.6 1.0 1500
Figure-6 Figure-3 Typical Compressive Properties of HDR
【Note】
Manufacturing tolerance: for individual isolator design value ±30%.
P2
)( rcv tn
AEK
P0 ±30%
P0
Y1
Compressive Disp.
Kv
Y2
0
)( 12
12YY
PPKv
EEE APc
111
ESESEEc /)21(1
)21(2
10
210
)21( 210 SEE AP
0
2000
4000
6000
8000
10000
12000
14000
0.0 1.0 2.0
Compressive Dips. (m
Com
pres
sive
Loa
d (k
3.0 4.0
m)
N
6

5. Nominal Long-Term Compressive Stress
Nominal long-term compressive stress for each compound and each secondary shape factor is shown in Tables.
Table-11 Nominal compressive stress for X0.6
X0.6R 35≦S1≦40
3.00≦S2≦4.55 σS=5.43×S2-9.70
4.55<S2≦10.0 σS=15.0
7

6. Ultimate Properties
□Ultimate properties under compressive stress Ultimate properties of isolators are defined as fracture of rubber and buckling (instability).
Typical force-displacement curves of failure behavior of the isolators are shown in Figure 7.
(13) H
H
AP0 (14)
where, H is total rubber height, A is effective area of isolator.
Shear Force
breaking Qbuk ▼
Figure-7 Determination of Ultimate Properties
Ultimate property of each standard isolator is determined by the Ultimate Property Diagram (UPD).
Figure-8 Ultimate Property Diagram
buckling ▼
Qb
Shear Displacement
Xbuk Xb
Compressive Stress σcr
σL Ultimate
Compressive Stressσc
<Stable>
γb0 Shear Strain
8
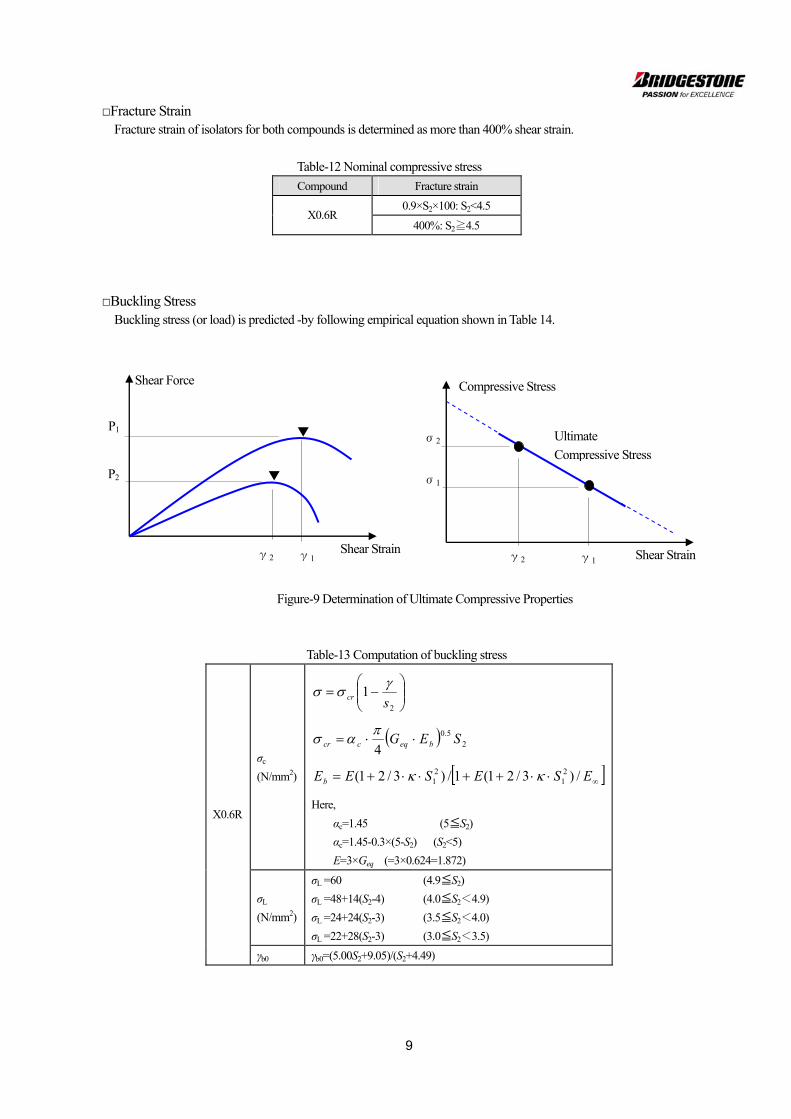
□Fracture Strain Fracture strain of isolators for both compounds is determined as more than 400% shear strain.
Table-12 Nominal compressive stress
Compound Fracture strain
0.9×S2×100: S2<4.5 X0.6R
400%: S2≧4.5
□Buckling Stress
Buckling stress (or load) is predicted -by following empirical equation shown in Table 14.
Shear Strainγ1
Shear Force
γ2
▼
▼
Compressive Stress
Shear Strain
σ1
σ2 Ultimate
Compressive Stress
γ1
P1
P2
γ2
Figure-9 Determination of Ultimate Compressive Properties
Table-13 Computation of buckling stress
σc
(N/mm2)
2
1scr
25.0
4SEG beqccr
ESESEEb /)3/21(1/)3/21( 21
21
Here,
αc=1.45 (5≦S2)
αc=1.45-0.3×(5-S2) (S2<5)
E=3×Geq (=3×0.624=1.872)
σL
(N/mm2)
σL =60 (4.9≦S2)
σL =48+14(S2-4) (4.0≦S2<4.9)
σL =24+24(S2-3) (3.5≦S2<4.0)
σL =22+28(S2-3) (3.0≦S2<3.5)
X0.6R
γb0 γb0=(5.00S2+9.05)/(S2+4.49)
9
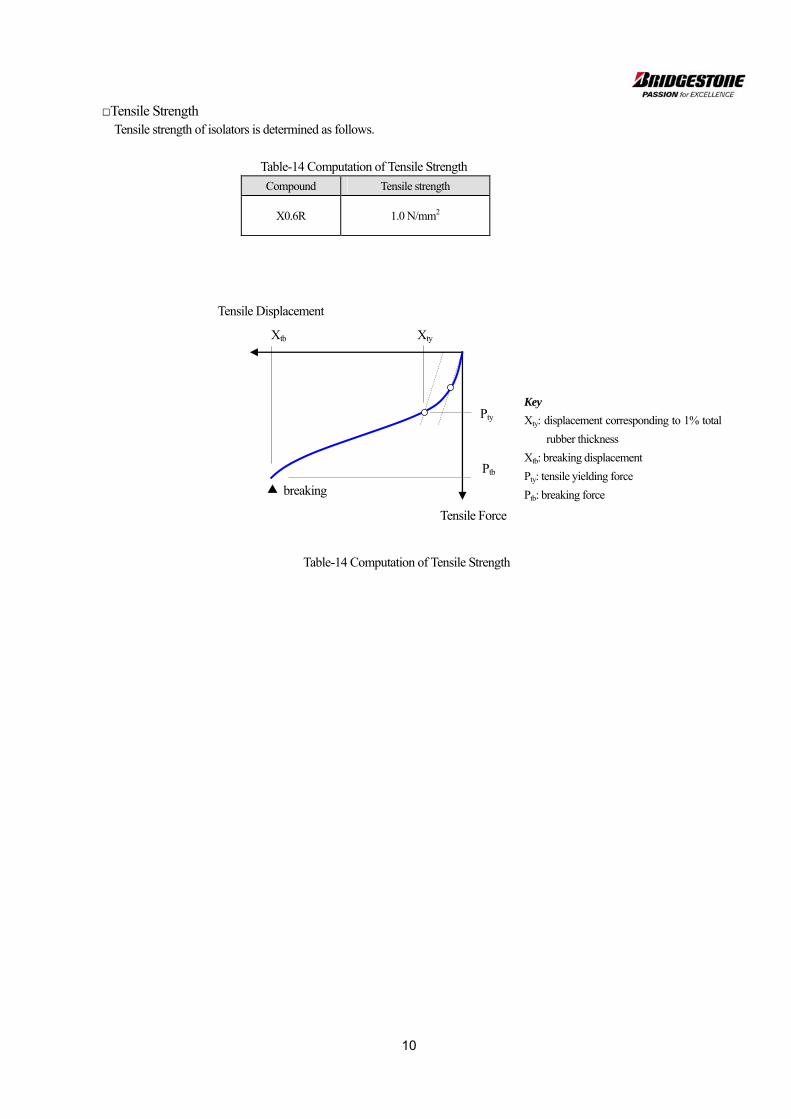
□Tensile Strength Tensile strength of isolators is determined as follows.
Table-14 Computation of Tensile Strength
Compound Tensile strength
X0.6R 1.0 N/mm2
Tensile Displacement
Xtb Xty
▲ breaking
Key
Xty: displacement corresponding to 1% total
rubber thickness
Xtb: breaking displacement
Pty: tensile yielding force
Ptb: breaking force
Pty
Ptb
Tensile Force
Table-14 Computation of Tensile Strength
10

Annex-A Temperature Dependence on Shear Properties
Shear modulus and equivalent damping ratio of high-damping rubber bearings becomes harder as temperature becomes
lower. Following table shows the test results by the scaled model specimen.
Table-1A Temperature dependence of shear modulus and damping ratio
Compound Items -10
Degrees Celsius
0 Degrees Celsius
30 Degrees Celsius
40 Degrees Celsius
Geq +46% +21% -6% -16% X0.6R
Heq +12% +7% -5% -13% (n=7)
The relationship between temperature and change rate of properties is shown in Figure-1. The standard temperature is 20 Degrees Celsius.
Figure-1A Relationship between Temperature and Change Rate of Shear Properties of HDR-X0.6R Temperature-correction factor is computed by following equation.
For shear modulus: 32
1
dtctbtak
(1A)
For Equivalent damping ratio: 32
1
htgtfteh
(2A)
where, t is test temperature (Degrees Celsius). The value for a, b, c, d, e, f, g and h are shown in Table 2A.
Table-2A Temperature Correction Factor for Compound X0.6R Compound a b C d
X0.6R 1.21 -1.86×10⁻² 5.99×10⁻⁴ -8.99×10⁻⁶
Compound e f g H X0.6R 1.06 -4.13×10⁻³ 1.10×10⁻⁴ -3.10×10⁻⁶
0.2
0.6
1.0
1.4
1.8
-20 -10 0 10 20 3
Temperature (℃)
Cha
nge
Rat
Geq
0 40 50
e
Heq
○: Test Results
11
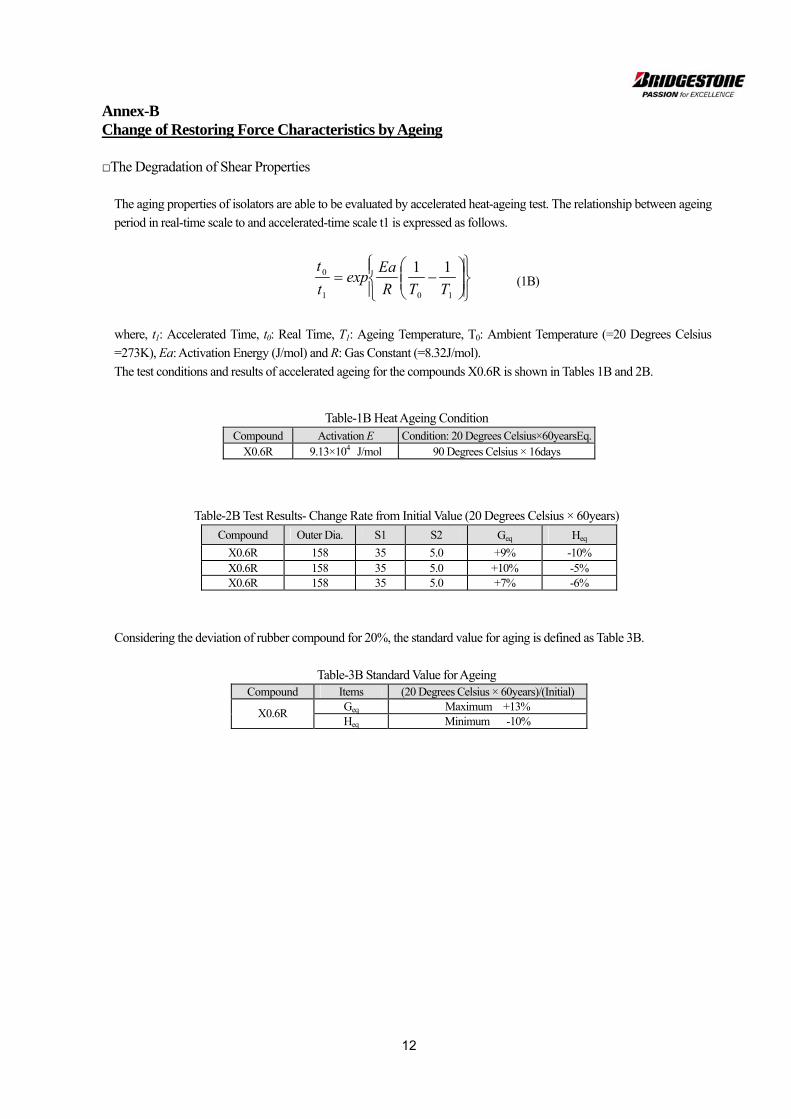
Annex-B Change of Restoring Force Characteristics by Ageing
□The Degradation of Shear Properties
The aging properties of isolators are able to be evaluated by accelerated heat-ageing test. The relationship between ageing
period in real-time scale to and accelerated-time scale t1 is expressed as follows.
101
0 11
TTR
Eaexp
t
t (1B)
where, t1: Accelerated Time, t0: Real Time, T1: Ageing Temperature, T0: Ambient Temperature (=20 Degrees Celsius
=273K), Ea: Activation Energy (J/mol) and R: Gas Constant (=8.32J/mol).
The test conditions and results of accelerated ageing for the compounds X0.6R is shown in Tables 1B and 2B.
Table-1B Heat Ageing Condition Compound Activation E Condition: 20 Degrees Celsius×60yearsEq.
X0.6R 9.13×10⁴ J/mol 90 Degrees Celsius × 16days
Table-2B Test Results- Change Rate from Initial Value (20 Degrees Celsius × 60years)
Compound Outer Dia. S1 S2 Geq Heq
X0.6R 158 35 5.0 +9% -10% X0.6R 158 35 5.0 +10% -5% X0.6R 158 35 5.0 +7% -6%
Considering the deviation of rubber compound for 20%, the standard value for aging is defined as Table 3B.
Table-3B Standard Value for Ageing Compound Items (20 Degrees Celsius × 60years)/(Initial)
Geq Maximum +13% X0.6R
Heq Minimum -10%
12
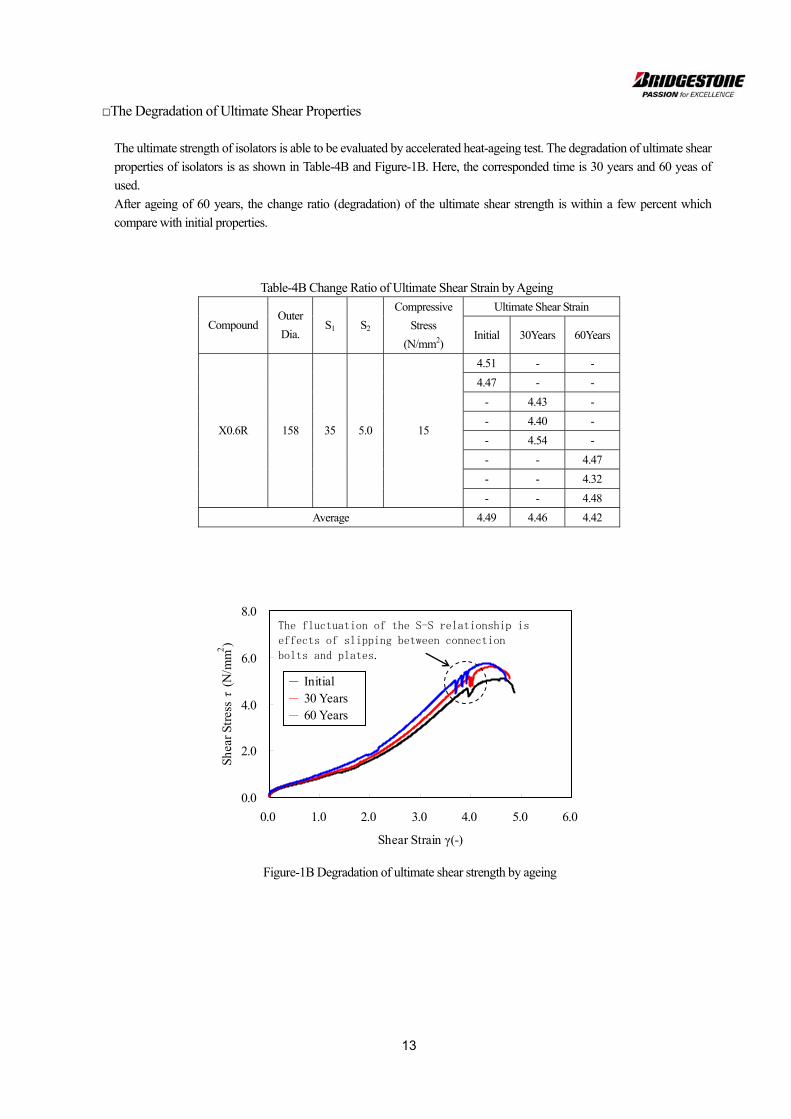
□The Degradation of Ultimate Shear Properties
The ultimate strength of isolators is able to be evaluated by accelerated heat-ageing test. The degradation of ultimate shear
properties of isolators is as shown in Table-4B and Figure-1B. Here, the corresponded time is 30 years and 60 yeas of
used.
After ageing of 60 years, the change ratio (degradation) of the ultimate shear strength is within a few percent which
compare with initial properties.
Table-4B Change Ratio of Ultimate Shear Strain by Ageing
Ultimate Shear Strain
Compound Outer
Dia. S1 S2
Compressive
Stress
(N/mm2) Initial 30Years 60Years
4.51 - -
4.47 - -
- 4.43 -
- 4.40 -
- 4.54 -
- - 4.47
- - 4.32
X0.6R 158 35 5.0 15
- - 4.48
Average 4.49 4.46 4.42
Figure-1B Degradation of ultimate shear strength by ageing
0.0
2.0
4.0
6.0
8.0
0.0 1.0 2.0
Sh
Shea
r Str
ess τ
(N/m
m2 )
3.0 4.0 5.0 6.0
ear Strain γ(-)
The fluctuation of the S-S relationship is
effects of slipping between connection
bolts and plates.
- InitialYears
- 60 Years- 30
13
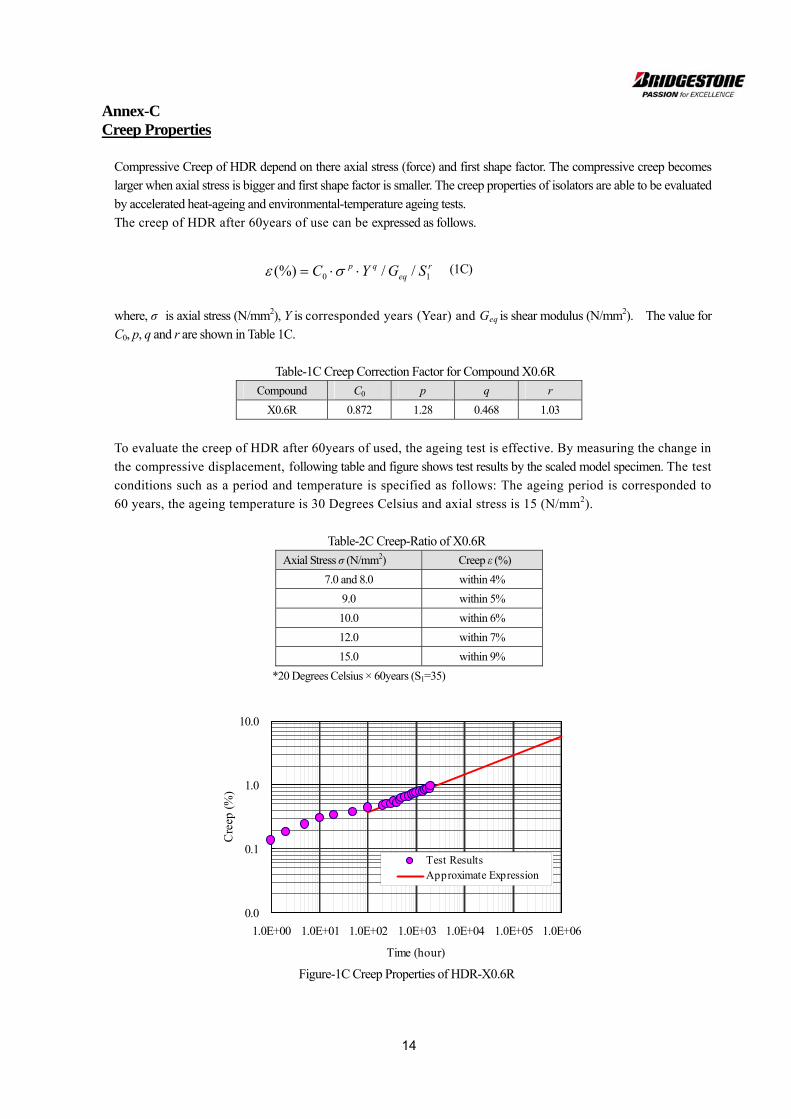
Annex-C Creep Properties
Compressive Creep of HDR depend on there axial stress (force) and first shape factor. The compressive creep becomes
larger when axial stress is bigger and first shape factor is smaller. The creep properties of isolators are able to be evaluated
by accelerated heat-ageing and environmental-temperature ageing tests.
The creep of HDR after 60years of use can be expressed as follows.
(1C) req
p SGY 10(%) qC //
where, σ is axial stress (N/mm2), Y is corresponded years (Year) and Geq is shear modulus (N/mm2). The value for
C0, p, q and r are shown in Table 1C.
Table-1C Creep Correction Factor for Compound X0.6R
Compound C0 p q r
X0.6R 0.872 1.28 0.468 1.03
To evaluate the creep of HDR after 60years of used, the ageing test is effective. By measuring the change in
the compressive displacement, following table and figure shows test results by the scaled model specimen. The test
conditions such as a period and temperature is specified as follows: The ageing period is corresponded to
60 years, the ageing temperature is 30 Degrees Celsius and axial stress is 15 (N/mm2).
Table-2C Creep-Ratio of X0.6R
Axial Stress σ (N/mm2) Creep ε (%)
7.0 and 8.0 within 4%
9.0 within 5%
10.0 within 6%
12.0 within 7%
15.0 within 9%
*20 Degrees Celsius × 60years (S1=35)
0.0
0.1
1.0
10.0
1.0E+00 1.0E+01 1.0E+02 1.0E+03 1.0E+04 1.0E+05 1.0E+06
Time (hour)
Cre
ep (%
)
Test ResultsApproximate Expression
Figure-1C Creep Properties of HDR-X0.6R
14
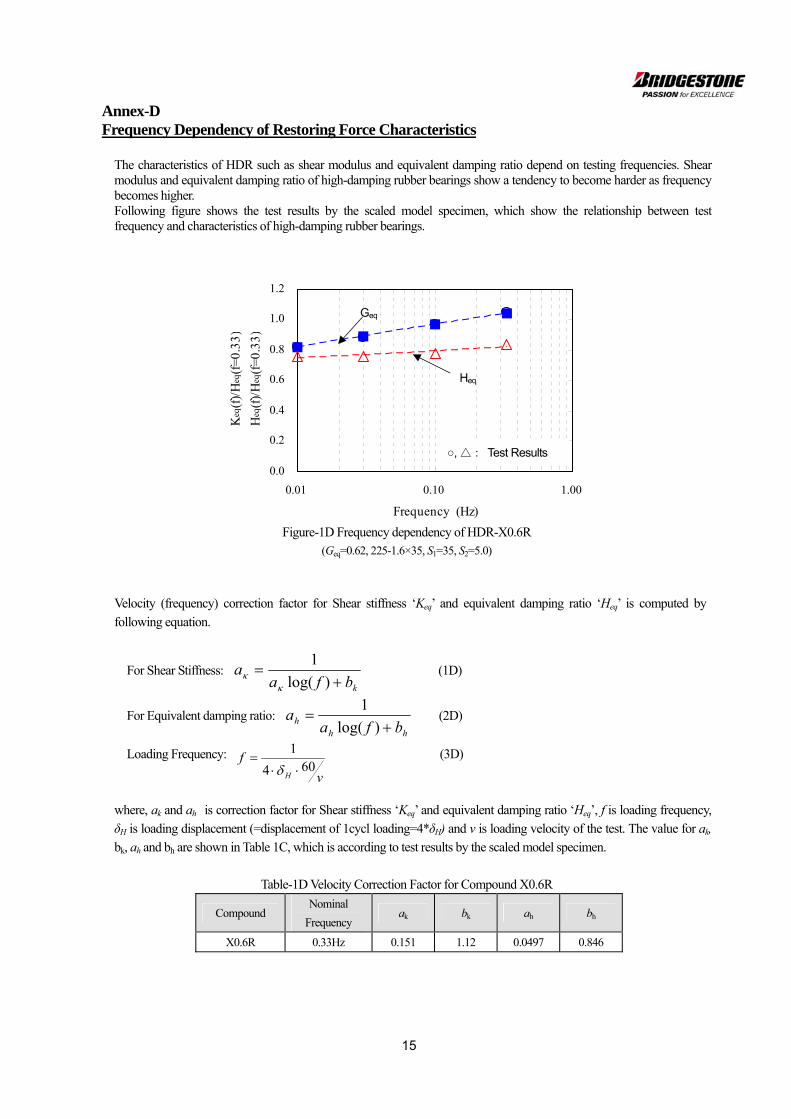
Annex-D Frequency Dependency of Restoring Force Characteristics
The characteristics of HDR such as shear modulus and equivalent damping ratio depend on testing frequencies. Shear modulus and equivalent damping ratio of high-damping rubber bearings show a tendency to become harder as frequency becomes higher. Following figure shows the test results by the scaled model specimen, which show the relationship between test frequency and characteristics of high-damping rubber bearings.
0.0
0.2
0.4
0.6
0.8
1.0
1.2
0.01 0.10 1.00
Frequency (Hz)
Keq
(f)/
Heq
(f=0
.33)
Heq
(f)/
Heq
(f=0
.33)
○, △: Test Results
Heq
Geq
Figure-1D Frequency dependency of HDR-X0.6R (Geq=0.62, 225-1.6×35, S1=35, S2=5.0)
Velocity (frequency) correction factor for Shear stiffness ‘Keq’ and equivalent damping ratio ‘Heq’ is computed by
following equation.
For Shear Stiffness: kbfa
a
)log(
1
(1D)
For Equivalent damping ratio: hh
h bfaa
)log(
1 (2D)
Loading Frequency:
v
fH
604
1
(3D)
where, ak and ah is correction factor for Shear stiffness ‘Keq’ and equivalent damping ratio ‘Heq’, f is loading frequency,
δH is loading displacement (=displacement of 1cycl loading=4*δH) and v is loading velocity of the test. The value for ak,
bk, ah and bh are shown in Table 1C, which is according to test results by the scaled model specimen.
Table-1D Velocity Correction Factor for Compound X0.6R
Compound Nominal
Frequency ak bk ah bh
X0.6R 0.33Hz 0.151 1.12 0.0497 0.846
15

Annex-E Shear Strain Dependency of Restoring Force Characteristics
Restoring force performance of high-damping rubber bearings show nonlinear behavior and its shear modulus becomes harder at the area of less than 100% of shear strain. On the other hand, to compare with shear strain dependency of shear modulus and equivalent damping ratio of high-damping rubber bearings, the dependency of shear strain amplitude to equivalent damping ratio is smaller than shear modulus. Following figure shows the test results by the scaled model specimen, which show the relationship between test shear strain amplitude and characteristics of high-damping rubber bearings. Here, in the figure, dotted lines show the design formula of high-damping rubber bearing which shown in Table-7 on page 5.
Figure-1E Shear strain dependency of restoring force performance of HDR-X0.6
Geq
Heq
0.0
0.5
1.0
1.5
2.0
2.5
3.0
0.0 0.5 1.0 1.5 2.0
Shear Strain γ (-)
Geq
(γ)/
Geq
(γ=
100%
)
Heq
(γ)/
Heq
(γ=
100%
)
2.5 3.0
○ Ave.
2=8.3
□ S2=5.0①
× S2=5.0②
◇ S2=3.3
△ S
16

Annex-F Tensile Fracture Strength
Tensile stiffness (tensile stress and tensile strain relationship) of high-damping rubber bearings show linear behavior when tensile stress is smaller than 1 N/mm2.
Therefore, as long as tensile stress becomes larger than 1 N/mm2, tensile restoring force performance of high-damping rubber bearing changes dramatically and tensile stiffness starts to show nonlinear behavior and also tensile strain shows a sharp increase with yielding of tensile rubber strength. (Yielding of tensile rubber strength arise from voids of inner rubber which arise from a tensile stress.)
Table-1F Relationship between tensile yield stress and shear strain
Characteristics Shear strain (%)
Compound Outer Dia. S1 S2 0 100 200
800 36 4 - 1.9 1.4 X0.6R
600 36 3 - 1.4 -
0.0
1.0
2.0
3.0
4.0
5.0
0.00 0.05 0.10 0.15 0.20 0.25 0.30
Tensile Strain ε (-)
Ten
sile
Str
ess
(N/m
m2 )
0.0
0.5
1.0
1.5
2.0
2.5
3.0
3.5
0.000 0.005 0.010 0.015 0.020 0.025 0.030
Tensile Straine ε (-)
Ten
sile
Str
ess
(N/m
m2 )
1.9 (N/mm2)
Figure-1F Tensile performance of HDR-X0.6 at γ=100% G=0.62, φ800-5.4×37, (S1=36, S2=4.0)
0.0
0.5
1.0
1.5
2.0
2.5
3.0
3.5
0.00 0.05 0.10 0.15 0.20 0.25 0.30
Tensile Strain ε (-)
Ten
sile
Str
ess
(N/m
m2 )
0.0
0.5
1.0
1.5
2.0
2.5
0.000 0.005 0.010 0.015 0.020 0.025 0.030
Tensile Strain ε (-)
Ten
sile
Str
ess
(N/m
m2 )
1.4 (N/mm2)
Figure-2F Tensile performance of HDR-X0.6 at γ=200% G=0.62, φ800-5.4×37, (S1=36, S2=4.0)
17
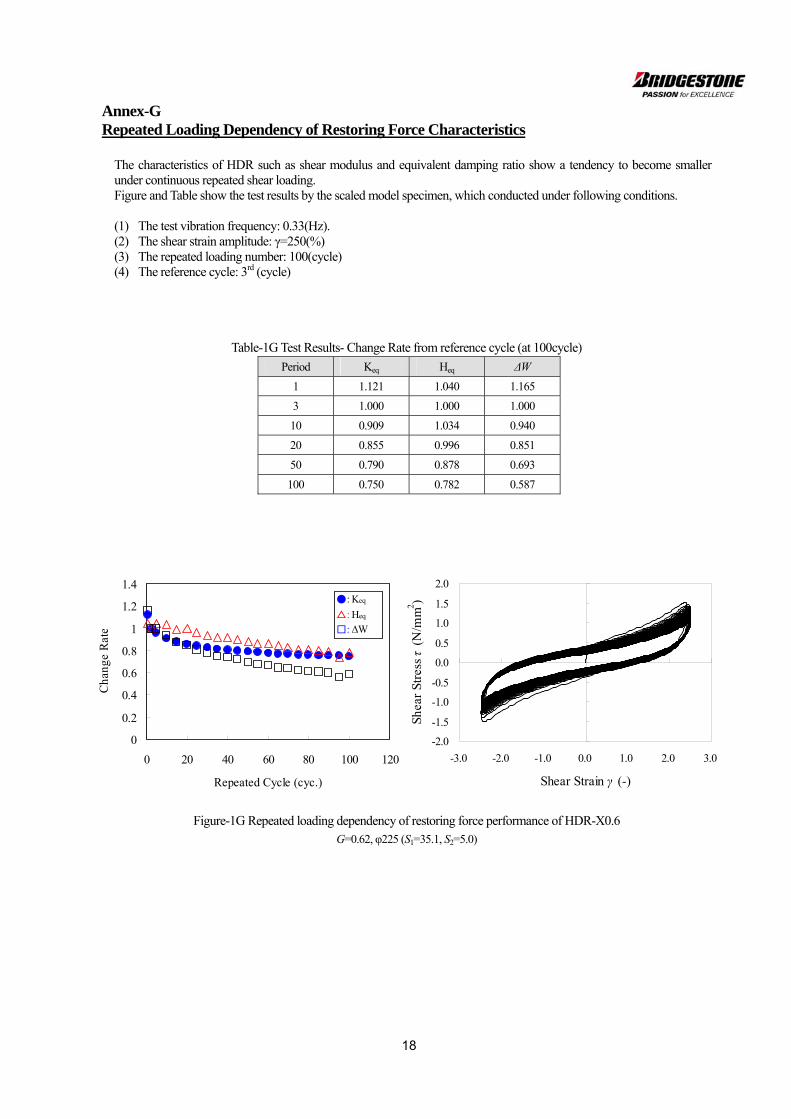
Annex-G Repeated Loading Dependency of Restoring Force Characteristics
The characteristics of HDR such as shear modulus and equivalent damping ratio show a tendency to become smaller under continuous repeated shear loading. Figure and Table show the test results by the scaled model specimen, which conducted under following conditions. (1) The test vibration frequency: 0.33(Hz). (2) The shear strain amplitude: γ=250(%) (3) The repeated loading number: 100(cycle) (4) The reference cycle: 3rd (cycle)
Table-1G Test Results- Change Rate from reference cycle (at 100cycle)
Period Keq Heq ΔW
1 1.121 1.040 1.165
3 1.000 1.000 1.000
10 0.909 1.034 0.940
20 0.855 0.996 0.851
50 0.790 0.878 0.693
100 0.750 0.782 0.587
0
0.2
0.4
0.6
0.8
1
1.2
1.4
0 20 40 60 80 100 120
Repeated Cycle (cyc.)
Cha
nge
Rat
e
●: Keq
-2.0
-1.5
-1.0
-0.5
0.0
0.5
1.0
1.5
2.0
-3.0 -2.0 -1.0 0.0 1.0 2.0 3.0
Shear Strain γ (-)
Shea
r St
ress
τ (
N/m
m2 )
△: Heq
□: ΔW
Figure-1G Repeated loading dependency of restoring force performance of HDR-X0.6 G=0.62, φ225 (S1=35.1, S2=5.0)
18

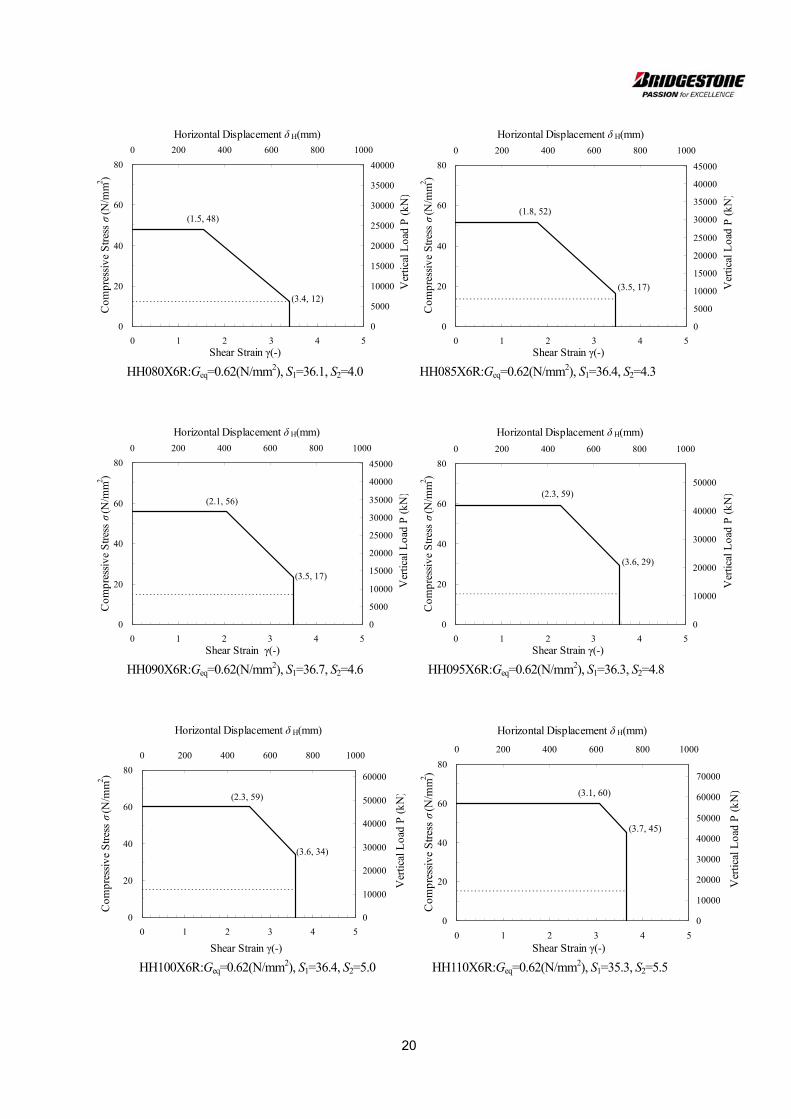
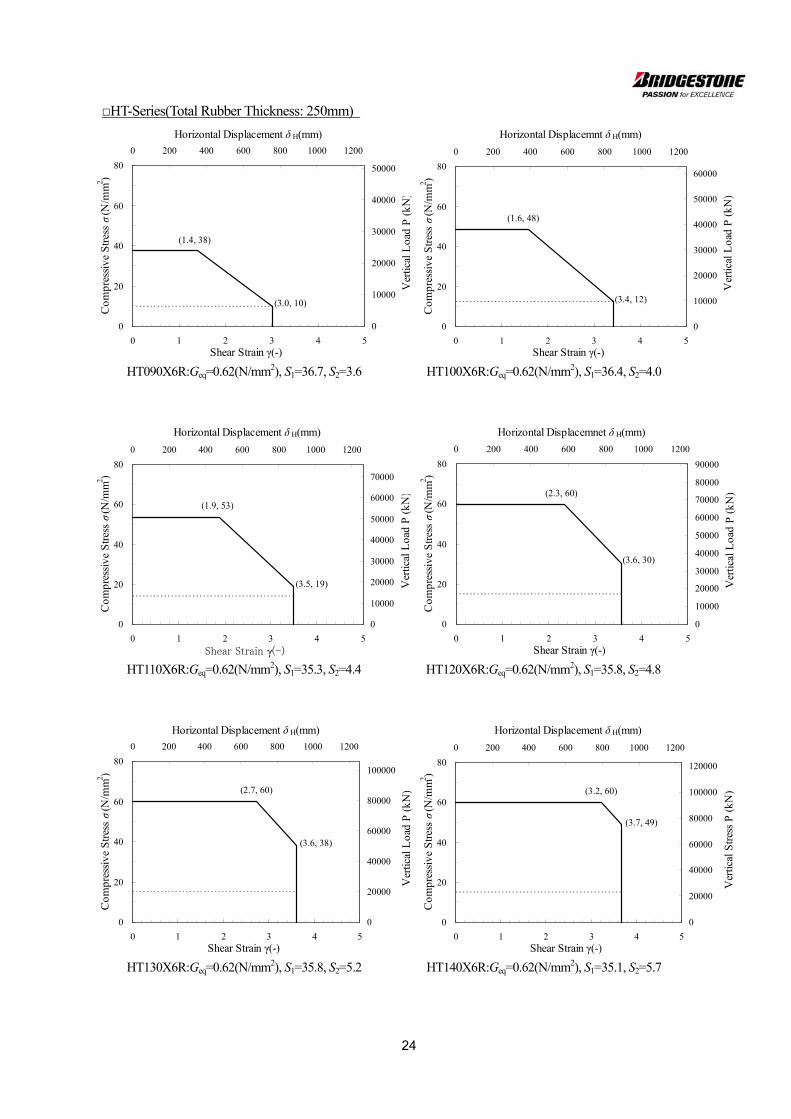
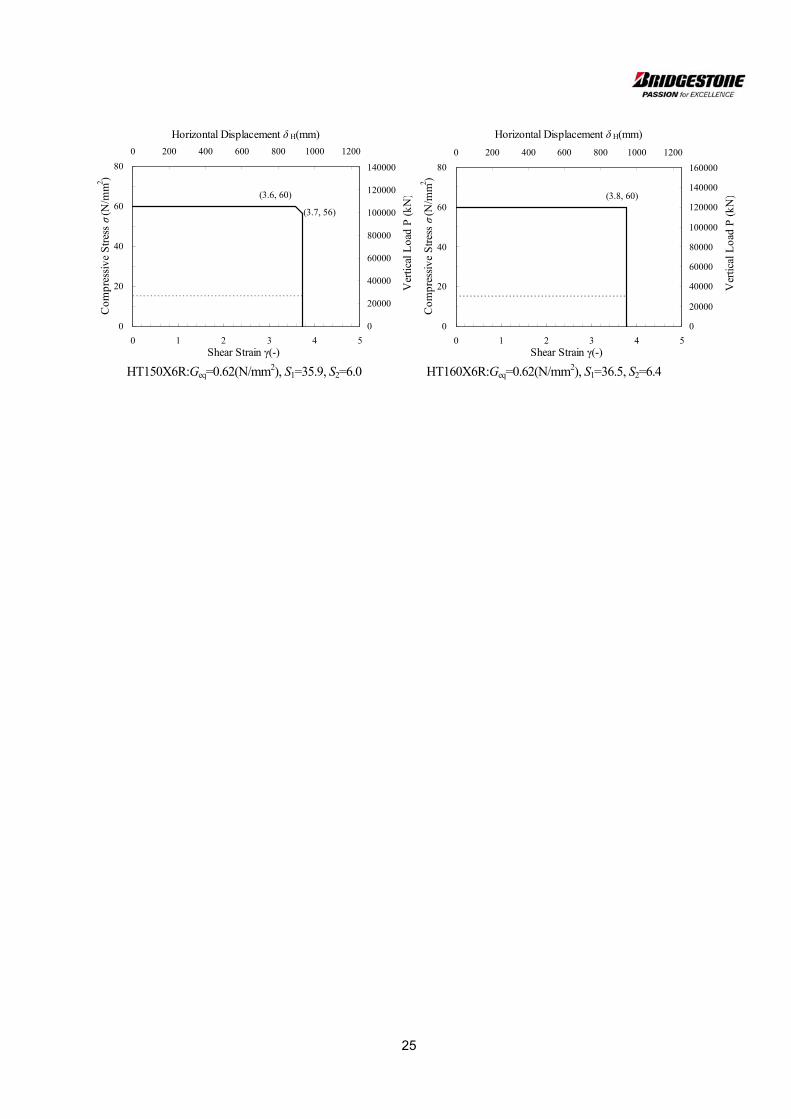
Annex-H Ultimate Property Diagram
The relationship of shear strain and compressive stress amplitude of standard isolators are as shown as follows. Ultimate
property of each standard isolator is determined by the Ultimate Property Diagram (UPD) as shown in Figure-8 (page10).
Here, the dotted line shows a nominal stress of each isolator.
□HH-Series (Total Rubber Thickness: 200mm)
0
20
40
60
80
0 1 2 3 4 5Shear Strain γ(-)
Com
pres
sive
Str
ess σ
(N/m
m2 )
0
5000
10000
15000
20000
0 200 400 600 800 1000
Horizontal Displacement δ H(mm)
Ver
tical
Loa
d P
(kN
)
(1.5, 22)
(2.5, 7)
0
20
40
60
80
0 1 2 3 4 5Shear Strain γ(-)
Com
pres
sive
Str
ess σ
(N/m
m2 )
0
5000
10000
15000
20000
25000
0 200 400 600 800 1000
Horizaontal Displacement δ H(mm)
Ver
tical
Loa
d P
(kN
)
(1.4, 30)
(2.8, 8.0)
HH060X6R:Geq=0.62(N/mm2), S1=36.6, S2=3.0 HH065X6R:Geq=0.62(N/mm2), S1=36.1, S2=3.3
0
20
40
60
80
0 1 2 3 4 5Shear Strain γ(-)
Com
pres
sive
Str
ess σ
(N/m
m2 )
0
5000
10000
15000
20000
25000
30000
0 200 400 600 800 1000
Horizontal Displacement δ H(mm)
Ver
tical
Loa
d P
(kN
)
(1.4, 35)
(2.9, 9.0)
0
20
40
60
80
0 1 2 3 4 5Shear Strain γ(-)
Com
pres
sive
Str
ess σ
(N/m
m2 )
0
5000
10000
15000
20000
25000
30000
35000
0 200 400 600 800 1000
Horizontal Displacement δ H(mm)
Ver
tical
Loa
d P
(kN
)(1.5, 42)
(3.2, 11)
HH070X6R:Geq=0.62(N/mm2), S1=36.4, S2=3.5 HH075X6R:Geq=0.62(N/mm2), S1=36.8, S2=3.8
19
0
20
40
60
80
0 1 2 3 4 5Shear Strain γ(-)
Com
pres
sive
Str
ess σ
(N/m
m2 )
0
5000
10000
15000
20000
25000
30000
35000
40000
0 200 400 600 800 1000
Horizontal Displacement δ H(mm)
Ver
tical
Loa
d P
(kN
)
(1.5, 48)
(3.4, 12)
0
20
40
60
80
0 1 2 3 4 5Shear Strain γ(-)
Com
pres
sive
Str
ess σ
(N/m
m2 )
0
5000
10000
15000
20000
25000
30000
35000
40000
45000
0 200 400 600 800 1000
Horizontal Displacement δ H(mm)
Ver
tical
Loa
d P
(kN
)
(1.8, 52)
(3.5, 17)
HH080X6R:Geq=0.62(N/mm2), S1=36.1, S2=4.0 HH085X6R:Geq=0.62(N/mm2), S1=36.4, S2=4.3
0
20
40
60
80
0 1 2 3 4 5Shear Strain γ(-)
Com
pres
sive
Str
ess σ
(N/m
m2 )
0
5000
10000
15000
20000
25000
30000
35000
40000
45000
0 200 400 600 800 1000
Horizontal Displacement δ H(mm)
Ver
tical
Loa
d P
(kN
)
(2.1, 56)
(3.5, 17)
0
20
40
60
80
0 1 2 3 4 5Shear Strain γ(-)
Com
pres
sive
Str
ess σ
(N/m
m2 )
0
10000
20000
30000
40000
50000
0 200 400 600 800 1000
Horizontal Displacement δ H(mm)
Ver
tical
Loa
d P
(kN
)(2.3, 59)
(3.6, 29)
HH090X6R:Geq=0.62(N/mm2), S1=36.7, S2=4.6 HH095X6R:Geq=0.62(N/mm2), S1=36.3, S2=4.8
0
20
40
60
80
0 1 2 3 4 5
Shear Strain γ(-)
Com
pres
sive
Str
ess σ
(N/m
m2 )
0
10000
20000
30000
40000
50000
60000
0 200 400 600 800 1000
Horizontal Displacement δ H(mm)
Ver
tical
Loa
d P
(kN
)(2.3, 59)
(3.6, 34)
0
20
40
60
80
0 1 2 3 4 5Shear Strain γ(-)
Com
pres
sive
Str
ess σ
(N/m
m2 )
0
10000
20000
30000
40000
50000
60000
70000
0 200 400 600 800 1000
Horizontal Displacement δ H(mm)V
ertic
al L
oad
P (
kN)(3.1, 60)
(3.7, 45)
HH100X6R:Geq=0.62(N/mm2), S1=36.4, S2=5.0 HH110X6R:Geq=0.62(N/mm2), S1=35.3, S2=5.5
20
0
20
40
60
80
0 1 2 3 4 5Shear Strain γ(-)
Com
pres
sive
Str
ess σ
(N/m
m2 )
0
10000
20000
30000
40000
50000
60000
70000
80000
90000
0 200 400 600 800 1000
Horizontal Displacement δ H(mm)
Ver
tical
Loa
d P
(kN
)(3.6, 60)
(3.7, 56)
0
20
40
60
80
0 1 2 3 4 5Shear Strain γ(-)
Com
pres
sive
Str
ess σ
(N/m
m2 )
0
20000
40000
60000
80000
100000
0 200 400 600 800 1000
Horizontal Displacement δ H(mm)
Ver
tical
Loa
d P
(kN
)(3.8, 60)
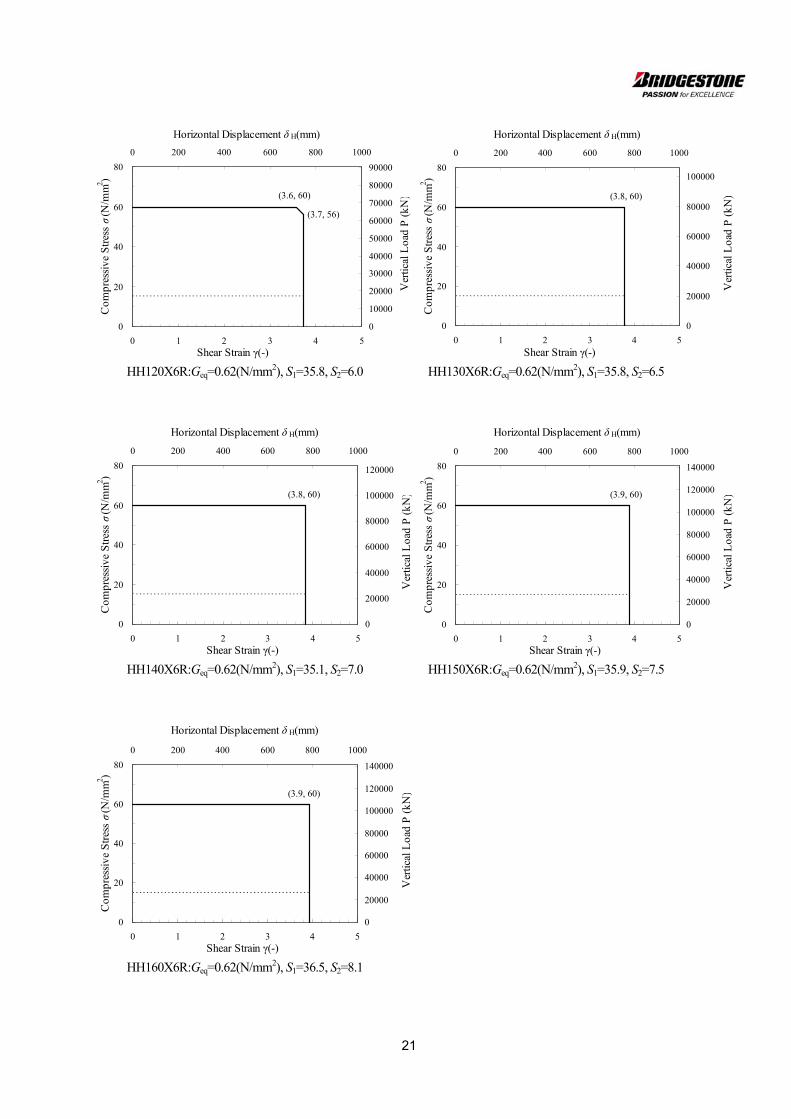
HH120X6R:Geq=0.62(N/mm2), S1=35.8, S2=6.0 HH130X6R:Geq=0.62(N/mm2), S1=35.8, S2=6.5
0
20
40
60
80
0 1 2 3 4 5Shear Strain γ(-)
Com
pres
sive
Str
ess σ
(N/m
m2 )
0
20000
40000
60000
80000
100000
120000
0 200 400 600 800 1000
Horizontal Displacement δ H(mm)
Ver
tical
Loa
d P
(kN
)(3.8, 60)
0
20
40
60
80
0 1 2 3 4 5Shear Strain γ(-)
Com
pres
sive
Str
ess σ
(N/m
m2 )
0
20000
40000
60000
80000
100000
120000
140000
0 200 400 600 800 1000
Horizontal Displacement δ H(mm)
Ver
tical
Loa
d P
(kN
)(3.9, 60)
HH140X6R:Geq=0.62(N/mm2), S1=35.1, S2=7.0 HH150X6R:Geq=0.62(N/mm2), S1=35.9, S2=7.5
0
20
40
60
80
0 1 2 3 4 5Shear Strain γ(-)
Com
pres
sive
Str
ess σ
(N/m
m2 )
0
20000
40000
60000
80000
100000
120000
140000
0 200 400 600 800 1000
Horizontal Displacement δ H(mm)
Ver
tical
Loa
d P
(kN
)(3.9, 60)
HH160X6R:Geq=0.62(N/mm2), S1=36.5, S2=8.1
21
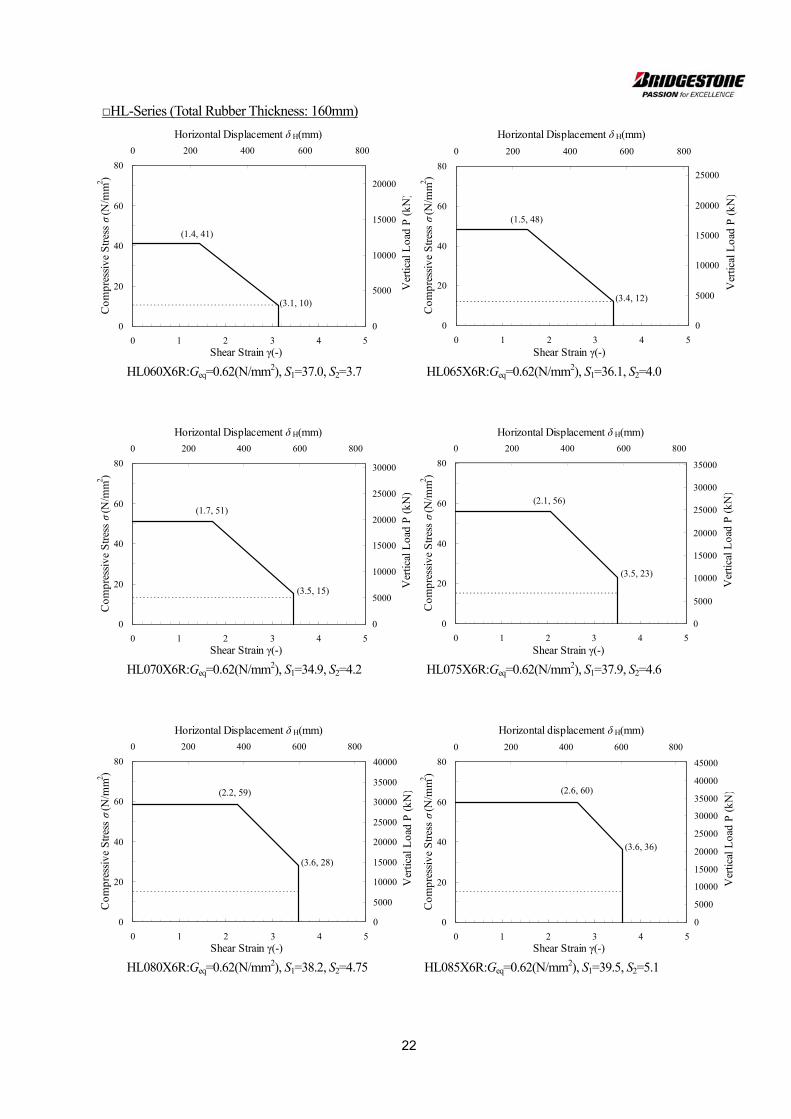
□HL-Series (Total Rubber Thickness: 160mm)
0
20
40
60
80
0 1 2 3 4 5Shear Strain γ(-)
Com
pres
sive
Str
ess σ
(N/m
m2 )
0
5000
10000
15000
20000
25000
0 200 400 600 800
Horizontal Displacement δ H(mm)
Ver
tical
Loa
d P
(kN
)
(1.5, 48)
(3.4, 12)
0
20
40
60
80
0 1 2 3 4 5Shear Strain γ(-)
Com
pres
sive
Str
ess σ
(N/m
m2 )
0
5000
10000
15000
20000
0 200 400 600 800
Horizontal Displacement δ H(mm)
Ver
tical
Loa
d P
(kN
)
(1.4, 41)
(3.1, 10)
HL060X6R:Geq=0.62(N/mm2), S1=37.0, S2=3.7 HL065X6R:Geq=0.62(N/mm2), S1=36.1, S2=4.0
0
20
40
60
80
0 1 2 3 4 5Shear Strain γ(-)
Com
pres
sive
Str
ess σ
(N/m
m2 )
0
5000
10000
15000
20000
25000
30000
0 200 400 600 800
Horizontal Displacement δ H(mm)
Ver
tical
Loa
d P
(kN
)
(1.7, 51)
(3.5, 15)
0
20
40
60
80
0 1 2 3 4 5Shear Strain γ(-)
Com
pres
sive
Str
ess σ
(N/m
m2 )
0
5000
10000
15000
20000
25000
30000
35000
0 200 400 600 800
Horizontal Displacement δ H(mm)
Ver
tical
Loa
d P
(kN
)
(2.1, 56)
(3.5, 23)
HL070X6R:Geq=0.62(N/mm2), S1=34.9, S2=4.2 HL075X6R:Geq=0.62(N/mm2), S1=37.9, S2=4.6
0
20
40
60
80
0 1 2 3 4 5Shear Strain γ(-)
Com
pres
sive
Str
ess σ
(N/m
m2 )
0
5000
10000
15000
20000
25000
30000
35000
40000
0 200 400 600 800
Horizontal Displacement δ H(mm)
Ver
tical
Loa
d P
(kN
)(2.2, 59)
(3.6, 28)
0
20
40
60
80
0 1 2 3 4 5Shear Strain γ(-)
Com
pres
sive
Str
ess σ
(N/m
m2 )
0
5000
10000
15000
20000
25000
30000
35000
40000
45000
0 200 400 600 800
Horizontal displacement δ H(mm)V
ertic
al L
oad
P (
kN)(2.6, 60)
(3.6, 36)
HL080X6R:Geq=0.62(N/mm2), S1=38.2, S2=4.75 HL085X6R:Geq=0.62(N/mm2), S1=39.5, S2=5.1
22
0
20
40
60
80
0 1 2 3 4 5Shear Strain γ(-)
Com
pres
sive
Str
ess σ
(N/m
m2 )
0
5000
10000
15000
20000
25000
30000
35000
40000
45000
0 200 400 600 800
Horizontal Displacement δ H(mm)
Ver
tical
Loa
d P
(kN
)(2.9, 60)
(3.6, 41)
0
20
40
60
80
0 1 2 3 4 5Shear Strain γ(-)
Com
pres
sive
Str
ess σ
(N/m
m2 )
0
10000
20000
30000
40000
50000
60000
0 200 400 600 800
Horizontal Displacement δ H(mm)
Ver
tical
Loa
d P
(kN
)(3.6, 60)
(3.7, 57)
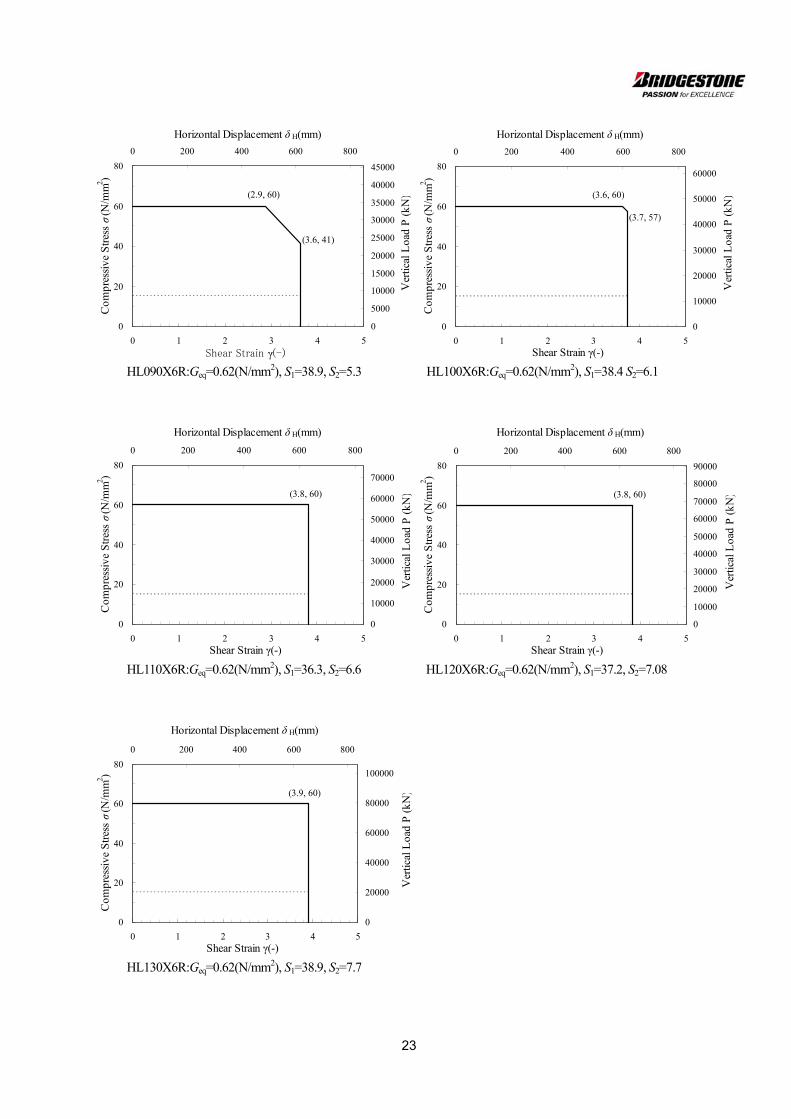
HL090X6R:Geq=0.62(N/mm2), S1=38.9, S2=5.3 HL100X6R:Geq=0.62(N/mm2), S1=38.4 S2=6.1
0
20
40
60
80
0 1 2 3 4 5Shear Strain γ(-)
Com
pres
sive
Str
ess σ
(N/m
m2 )
0
10000
20000
30000
40000
50000
60000
70000
0 200 400 600 800
Horizontal Displacement δ H(mm)
Ver
tical
Loa
d P
(kN
)(3.8, 60)
0
20
40
60
80
0 1 2 3 4 5Shear Strain γ(-)
Com
pres
sive
Str
ess σ
(N/m
m2 )
0
10000
20000
30000
40000
50000
60000
70000
80000
90000
0 200 400 600 800
Horizontal Displacement δ H(mm)
Ver
tical
Loa
d P
(kN
)(3.8, 60)
HL110X6R:Geq=0.62(N/mm2), S1=36.3, S2=6.6 HL120X6R:Geq=0.62(N/mm2), S1=37.2, S2=7.08
0
20
40
60
80
0 1 2 3 4 5Shear Strain γ(-)
Com
pres
sive
Str
ess σ
(N/m
m2 )
0
20000
40000
60000
80000
100000
0 200 400 600 800
Horizontal Displacement δ H(mm)
Ver
tical
Loa
d P
(kN
)(3.9, 60)
HL130X6R:Geq=0.62(N/mm2), S1=38.9, S2=7.7
23
□HT-Series(Total Rubber Thickness: 250mm)
0
20
40
60
80
0 1 2 3 4 5Shear Strain γ(-)
Com
pres
sive
Str
ess σ
(N/m
m2 )
0
10000
20000
30000
40000
50000
60000
0 200 400 600 800 1000 1200
Horizontal Displacemnt δ H(mm)
Ver
tical
Loa
d P
(kN
)
(1.6, 48)
(3.4, 12)
0
20
40
60
80
0 1 2 3 4 5Shear Strain γ(-)
Com
pres
sive
Str
ess σ
(N/m
m2 )
0
10000
20000
30000
40000
50000
0 200 400 600 800 1000 1200
Horizontal Displacement δ H(mm)
Ver
tical
Loa
d P
(kN
)
(1.4, 38)
(3.0, 10)
HT090X6R:Geq=0.62(N/mm2), S1=36.7, S2=3.6 HT100X6R:Geq=0.62(N/mm2), S1=36.4, S2=4.0
0
20
40
60
80
0 1 2 3 4 5Shear Strain γ(-)
Com
pres
sive
Str
ess σ
(N/m
m2 )
0
10000
20000
30000
40000
50000
60000
70000
0 200 400 600 800 1000 1200
Horizontal Displacement δ H(mm)
Ver
tical
Loa
d P
(kN
)
(1.9, 53)
(3.5, 19)
0
20
40
60
80
0 1 2 3 4 5Shear Strain γ(-)
Com
pres
sive
Str
ess σ
(N/m
m2 )
0
10000
20000
30000
40000
50000
60000
70000
80000
90000
0 200 400 600 800 1000 1200
Horizontal Displacemnet δ H(mm)
Ver
tical
Loa
d P
(kN
)(2.3, 60)
(3.6, 30)
HT110X6R:Geq=0.62(N/mm2), S1=35.3, S2=4.4 HT120X6R:Geq=0.62(N/mm2), S1=35.8, S2=4.8
0
20
40
60
80
0 1 2 3 4 5Shear Strain γ(-)
Com
pres
sive
Str
ess σ
(N/m
m2 )
0
20000
40000
60000
80000
100000
0 200 400 600 800 1000 1200
Horizontal Displacement δ H(mm)
Ver
tical
Loa
d P
(kN
)(2.7, 60)
(3.6, 38)
0
20
40
60
80
0 1 2 3 4 5Shear Strain γ(-)
Com
pres
sive
Str
ess σ
(N/m
m2 )
0
20000
40000
60000
80000
100000
120000
0 200 400 600 800 1000 1200
Horizontal Displacement δ H(mm)V
ertic
al S
tres
s P
(kN
)(3.2, 60)
(3.7, 49)
HT130X6R:Geq=0.62(N/mm2), S1=35.8, S2=5.2 HT140X6R:Geq=0.62(N/mm2), S1=35.1, S2=5.7
24
0
20
40
60
80
0 1 2 3 4 5Shear Strain γ(-)
Com
pres
sive
Str
ess σ
(N/m
m2 )
0
20000
40000
60000
80000
100000
120000
140000
0 200 400 600 800 1000 1200
Horizontal Displacement δ H(mm)
Ver
tical
Loa
d P
(kN
)(3.6, 60)
(3.7, 56)
0
20
40
60
80
0 1 2 3 4 5Shear Strain γ(-)
Com
pres
sive
Str
ess σ
(N/m
m2 )
0
20000
40000
60000
80000
100000
120000
140000
160000
0 200 400 600 800 1000 1200
Horizontal Displacement δ H(mm)
Ver
tical
Loa
d P
(kN
)(3.8, 60)
HT150X6R:Geq=0.62(N/mm2), S1=35.9, S2=6.0 HT160X6R:Geq=0.62(N/mm2), S1=36.5, S2=6.4
25

26
Annex-I Compressive Stress Dependency of Restoring Force Characteristics
The Shear modulus of high-damping rubber bearings shows a tendency to become harder as compressive stress becomes larger. In contrast, the equivalent damping ratio of high-damping rubber bearings shows a tendency to decrease as compressive stress becomes larger.
These properties are deeply depends on their shapes, such as a first and secondly shape factors.
As shown in Table and Figure, the compressive dependencies of restoring force characteristics vary with shape factors.
Hence, as long as the isolator has enough shape factors, an effect of compressive dependency becomes slightly and the
isolator shows a stable performance. Figure and Table show the test results, which conducted under following conditions. (1)The shear strain amplitude: γ=100(%) (2)The reference cycle: 3rd (cycle)
Table-1I Test Results- Compressive Stress Dependency of HDR (change ratio)
Construction of Isolators Change Ratio
Compound Outer Dia. S1 S2
Nominal
Compressive
Stress σs
(N/mm2)
Total
Thickness
of Rubber
(mm)
Characteristicsσ=0.5σs σ=1.0σs σ=2σs
Keq 3.89% 0% -4.39%600(15) 36.6 3.0 6.6 200
Heq -2.30% 0% 12.6%
Keq 2.13% 0% -6.81%800(20) 36.1 4.0 12.1 200
Heq -4.76% 0% 21.5%
Keq -3.06% 0% -8.47%
X0.6R
1200(55) 35.8 6.0 15.0 200 Heq -10.5% 0% 11.6%
0.0
0.5
1.0
1.5
2.0
0 5 10 15 20 25 30
Compressive Stress σ (N/mm2)
Geq
/ G
eq,0
○: φ600, S2=3.0
0.0
0.5
1.0
1.5
2.0
0 5 10 15 20 25 30
Compressive Stress σ (N/mm2)
Heq
/ H
eq,0
○: φ600, S2=3.0
▲: φ800, S2=4.0
□: φ1200, S2=6.0
▲: φ800, S2=4.0
□: φ1200, S2=6.0
Figure-1I Test Results- Compressive Stress Dependency of HDR (change ratio)