Embed Size (px)
Citation preview
E
Hp
AI
a
ARRAA
KLSPNFL
1
irM2eelt
BpflFtaa
m
h0
ARTICLE IN PRESSG ModelEB-2826; No. of Pages 10
Environmental and Experimental Botany xxx (2014) xxx–xxx
Contents lists available at ScienceDirect
Environmental and Experimental Botany
jo ur nal homep ag e: www.elsev ier .com/ locate /envexpbot
igh blue light improves acclimation and photosynthetic recovery ofepper plants exposed to UV stress
nna M. Hoffmann, Georg Noga, Mauricio Hunsche ∗
nstitute of Crop Science and Resource Conservation—Horticultural Science, University of Bonn, Auf dem Huegel 6, 53121 Bonn, Germany
r t i c l e i n f o
rticle history:eceived 25 January 2014eceived in revised form 17 June 2014ccepted 27 June 2014vailable online xxx
eywords:ight stresstress physiologylant performanceon-destructive measurementsluorescence
a b s t r a c t
Intensity of photosynthetic active radiation (PAR) plays an important role in the acclimation of plantsto UV radiation. Thereby, specific morphological and physiological characteristics influenced by highirradiance are also affected by blue light. With this background we conducted two experiments to eval-uate the impact of light intensity and the relevance of blue light for the acclimation of pepper plants toUV. In this context we hypothesized that higher amount of blue light in the PAR spectrum significantlyimproves the plant acclimation and recovery to UV radiation. Our results demonstrate that UV stressedplants cultivated either under the higher light intensity (PAR 300 �mol m−2 s−1) or under higher amountof blue light (62%) show better photosynthetic performance (i.e., higher photosynthetic rate (Pn), highermaximal photochemical efficiency of PSII (Fv/Fm) and lower non-photochemical quenching (NPQ)) thanUV stressed plants grown under lower light intensity (PAR 100 �mol m−2 s−1) or lower amount of bluelight (30%). Contents of chlorophyll a and b, as well as carotenoids, had a stronger decrease due to UV in
EDs those plants cultivated either under the lower light intensity or under the lower amount of blue light.In contrast, plants grown either under 300 �mol m−2 s−1 or 62% blue light accumulated more epider-mal flavonols. Analogous to the well described effects of high PAR intensity, we demonstrate here thathigh amount of blue light triggers specific biochemical and physiological processes resulting in betteracclimation and recovery of plants to UV stress.
. Introduction
The effects of UV on plant development, morphology and phys-ology have been intensively studied and summarized in severaleviews (e.g., Teramura, 1983; Stapleton, 1992; Jordan, 1996;ackerness, 2000; Frohnmeyer and Staiger, 2003; Kakani et al.,
003; Vass et al., 2005; Jenkins, 2009; Schreiner et al., 2012; Hidegt al., 2013). In general, energy-rich UV radiation leads to the gen-
Please cite this article in press as: Hoffmann, A.M., et al., High blue ligplants exposed to UV stress. Environ. Exp. Bot. (2014), http://dx.doi.or
ration of free radicals which damage DNA, proteins, membraneipids and the photosynthetic machinery including chloroplasts andhe degradation of photosynthetic pigments (a detailed review is
Abbreviations: Abs., absorbance; Anth, anthocyanins; AOIs, areas of interest;E, biologically effective; Car, carotenoids; CHS, chalcone synthase; Chl, chloro-hyll; Chl-index, chlorophyll index; das, days after sowing; DW, dry weight; Flav,avonoids; FLAV-index, flavonol-index; Fm, maximum chlorophyll fluorescence;o, ground chlorophyll fluorescence; Fv/Fm, maximum photochemical efficiency ofhe photosystem II; FW, fresh weight; LED, light emitting diodes; LMA, leaf mass perrea; NPQ, non-photochemical quenching; n.s., non significant; PAR, photosyntheticctive radiation; Pn, net photosynthetic rate; UV, ultraviolet.∗ Corresponding author. Tel.: +49 0228 73 6540.
E-mail addresses: [email protected] (A.M. Hoffmann),[email protected] (M. Hunsche).
ttp://dx.doi.org/10.1016/j.envexpbot.2014.06.017098-8472/© 2014 Elsevier B.V. All rights reserved.
© 2014 Elsevier B.V. All rights reserved.
presented by Hideg et al., 2013). In the sum, photosynthesis isimpaired leading to a decrease in biomass accumulation (Smithet al., 2000; Kakani et al., 2003).
The damaging potential of UV irradiation forces plants to adaptto high energy fluxes. Typical morphological adaptations comprisethe lower leaf area (Teramura, 1983) and higher leaf mass per area(LMA) resulting in lower penetration of UV light in the deeperlayers of the tissue (see reviews of Teramura, 1983 and Kakaniet al., 2003). Acclimation processes include also the accumulationof secondary metabolites in the tissues, particularly in the epider-mal layer (Müller et al., 2013). Of particular note are flavonoidsand hydroxycinnamic acids that screen UV radiation and shieldthe underlying tissues (Olsson et al., 1998; Cerovic et al., 2002;Falcone Ferreyra et al., 2012). Finally, the susceptibility of plants toUV strongly depends on their acclimation- and recovery-capacitywhich are also strongly influenced by the growth conditions (Ziskaet al., 1992).
In general, plants cultivated under elevated intensities of PARare better adapted to UV than plants cultivated under lower
ht improves acclimation and photosynthetic recovery of pepperg/10.1016/j.envexpbot.2014.06.017
intensities of PAR (Walters, 2005). This phenomenon was eluci-dated very early, more than 30 years ago. For example Teramura(1980) found that soybeans cultivated under low PAR regimes weremore affected by UV-B light, as shown by a stronger reduction in
IN PRESSG ModelE
2 nd Experimental Botany xxx (2014) xxx–xxx
bfLt
catllgpNpucaagKemhb1UqpsiW
pNliIqLl(1ybIomrp
fsttr(ce
2
2
t
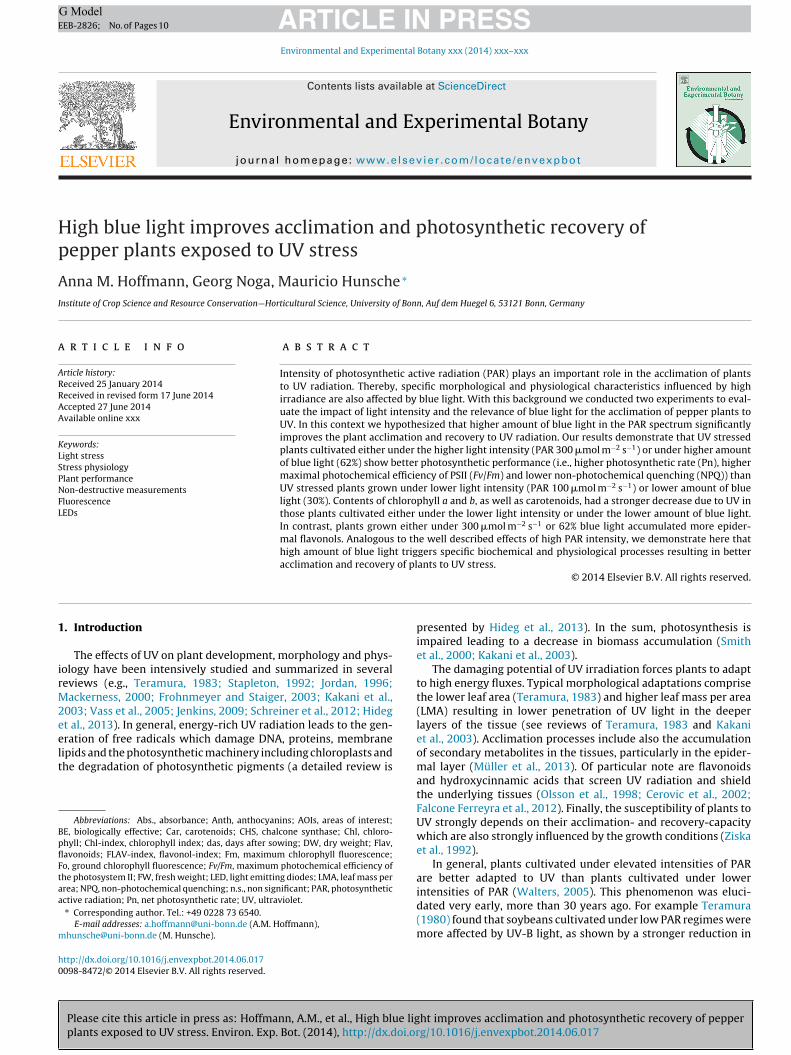
Fig. 1. Light spectrum of the UV-tube (UV-XEFL 290BB, Ushio Lighting Inc., Japan);
ARTICLEEB-2826; No. of Pages 10
A.M. Hoffmann et al. / Environmental a
iomass. Also, classical works demonstrating the structural andunctional adaptations of sun and shade leaves to UV-radiation (e.g.,ichtenthaler et al., 1980) contribute for a better understanding ofhe role of light intensity.
Apart from the impact of light intensity recent studies indi-ate that the light quality also regulates a variety of pathwayss related to plant development, and might also influence cer-ain acclimation processes. Photoreceptors such as the UV-A/blueight receptors cryptochrome and phototropin or the red/far redight receptor phytochrome perceive specific wavelengths and trig-er morphological and functional adaptations at chloroplast andlant level (Banerjee and Batschauer, 2005; Taulavuori et al., 2005;agatani, 2010). As indicated, blue light (400–500 nm) can initiatelant responses and induce leaf characteristics that also developnder high irradiance (Hogewoning et al., 2010). Amongst others,hloroplast movement was induced by enhanced light intensitiess well as by increased percentage of blue light, a process medi-ted by the phototropin (UV-A/blue light receptor) related NPL1ene that controls the chloroplast relocation (Jarillo et al., 2001;agawa et al., 2001; Banás et al., 2012; Wada, 2013). In addition,xperiments with barley and radish seedlings have shown that for-ation of sun type chloroplasts, which typically happens under
igh light conditions, can also be initiated at low intensities oflue light (Buschmann et al., 1978; Lichtenthaler and Buschmann,978). Similarly, the biosynthesis of phenolic compounds such asV-screening flavonoids depends on both light intensity and lightuality (Taulavuori et al., 2013). Cryptochrome and phytochromehotoreceptors are involved in the induction of CHS gene expres-ion that leads to the formation of chalcone synthase (CHS) whichs the first step in flavonoid biosynthesis (Feinbaum et al., 1991;
ade et al., 2001).Up to now, the impact of light quality on the acclimation of
lants to abiotic stress factors has hardly been taken into account.owadays LEDs providing ‘consumer-tailored’ light can be used as
ight sources for the commercial cultivation of horticultural cropsn controlled and semi-controlled environments (Morrow, 2008).n parallel, basic and applied research evaluate the impact of lightuality on plant development and physiology, more recently usingEDs as light sources. Thereby, most studies focus on the impact ofight composition on biomass production and photomorphogenesise.g. germination, growth habit, flower production) (Brown et al.,995; Carvalho et al., 2011; Abidi et al., 2013). Already about 20ears ago Adamse et al. (1994) demonstrated that supplementallue light alleviates UV-B induced growth inhibition in cucumber.
n a more recent study it is suggested that in diatoms the perceptionf blue light might be of central importance for high light accli-ation. (Schellenberger Costa et al., 2013). However, besides the
elevance of this topic, this research field remains widely underex-lored.
In the present study we investigate the relevance of blue lightor the UV acclimation of pepper plants (Capsicum annuum L.). Ourtudies base on the hypothesis that higher amount of blue light inhe light spectrum induces similar structural and functional adapta-ions at chloroplast, leaf and plant level as observed for high light,esulting in lower susceptibility to UV. Non-destructive methodsfluorescence and gas exchange measurements) as well as bio-hemical indicators and biometric parameters were adopted tovaluate the effects of light intensity, light quality and UV.
. Material and methods
Please cite this article in press as: Hoffmann, A.M., et al., High blue ligplants exposed to UV stress. Environ. Exp. Bot. (2014), http://dx.doi.or
.1. Plant material, growth conditions and experimental setup
Two experiments were conducted in order to evaluate the pho-osynthetic acclimation of pepper plants as affected by different
inset indicates the normalized spectrum (200–700 nm) in percent. The measure-ment was done under standardized conditions (distance = 0.35 m; T = 22 ◦C) withthe spectroradiometer OL 756 (Gooch and Housego’s, Ilminster, UK).
light intensities and light qualities. The experiments were per-formed in a custom-built climate chamber that can be divided inup to six light compartments. During pre-cultivation, plants wereilluminated with white fluorescence lamps (Master PL-L 4P, Philips,The Netherlands). As the different light treatments were initiatedlight emitting diodes (LEDs) from a prototype optimized for ourresearch purposes (Ushio Lighting Inc., Japan) were used for illumi-nation. The LED-modules are characterized by a 2:1 combinationof red and blue LEDs with single peaks, respectively, at 665 nmand 445 nm. The LED settings (intensity and spectral composition)are controlled by the equipment-specific software. Interspacingthe LED-modules we installed UV tubes (UV-XEFL 290BB, UshioLighting Inc., Japan). The tubes emit mostly (60%) in the UV-Bregion (280–320 nm) with a dominant peak at 290 nm; 30% is emit-ted in the UV-A spectrum (320–400 nm), 4% in the UV-C region(200–280 nm) and 6% in the visible spectrum (400–700 nm) (Fig. 1).Plants were grown under a photoperiod of 12 h, with day/nighttemperature of 21 ◦C/20 ◦C and relative humidity of 82%. Duringthe experiments plants were irrigated with a standard Hoaglandnutrient solution (pH 6.2).
Before running light treatments, seeds of the pepper (C. annuumL.) genotype Ziegenhorn Bello (Austrosaat AG, Austria) were sownin trays filled with a mixture of peat, sand and perlite and allo-cated under 100 �mol m−2 s−1 white fluorescence lamps (Philips,MASTER PL-L 4P). Four weeks after sowing in the 1st experimentand five weeks after sowing in the 2nd experiment, plantlets weretransferred into standard pots (7 × 7 × 8 cm) and cultivated undersame environmental conditions for four more weeks.
2.1.1. Impact of light intensityIn the first experiment we analysed the relevance of light
intensity without any changes in the spectral quality. For thispurpose, eight-week old plants were placed under LED lamps(45% blue light, 55% red light) either under 100 ± 5 �mol m−2 s−1
or 300 ± 5 �mol m−2 s−1. Light intensities were measured andmonitored with a radiometer (RM21, Dr. Gröbel UV Elektronik,Germany). One week after acclimation (58–64 das) to the new lightintensities half of the plants of each light intensity were exposedto UV light of 4.98 kJ m−2 per hour per day which is equivalent to
ht improves acclimation and photosynthetic recovery of pepperg/10.1016/j.envexpbot.2014.06.017
a biologically effective UV radiation of 5.53 kJ m−2 per hour perday (UV-BBE = 4.5, UV-CBE = 1.0, UV-ABE = 0.03 per hour per day).The biologically effective UV was calculated using the action spec-trum of Flint and Caldwell (2003). UV radiation was supplied during
ARTICLE IN PRESSG ModelEEB-2826; No. of Pages 10
A.M. Hoffmann et al. / Environmental and Experimental Botany xxx (2014) xxx–xxx 3
F m wia 3 (AS
oUiOpu
2
c(6hwa3em
2
ietwd10Nft
tpWlecem(r(mTa
phases had separated (10 min, 3000 rpm, 15 ◦C). After determina-
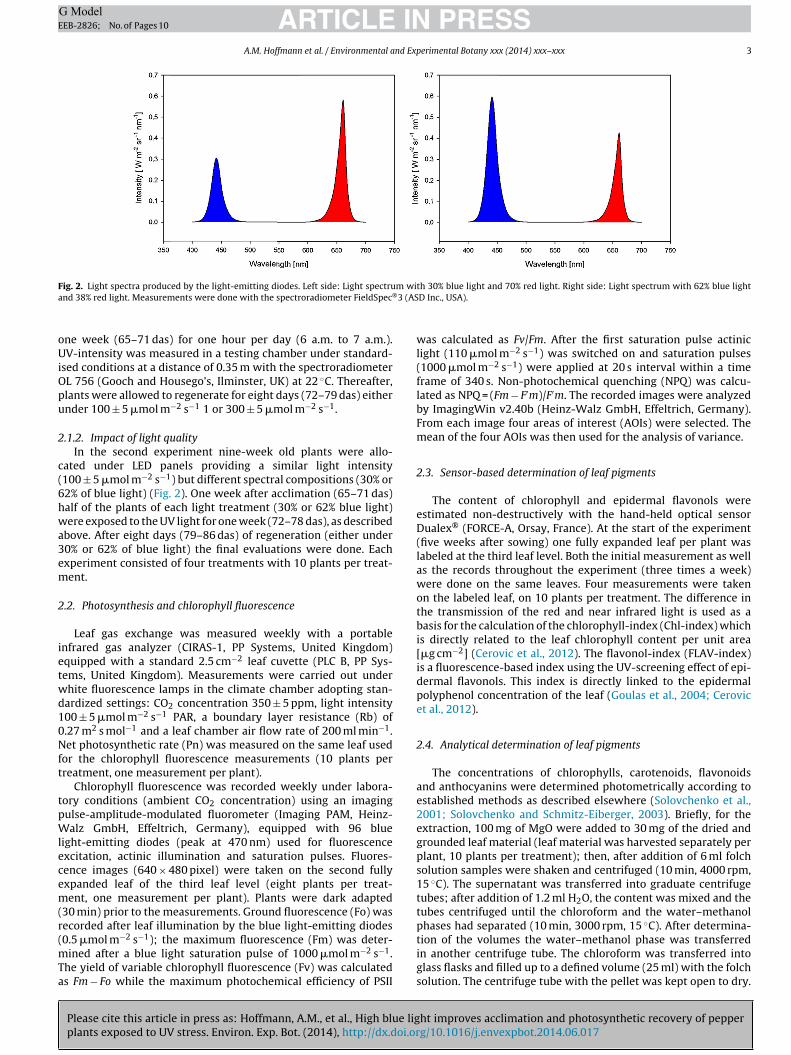
ig. 2. Light spectra produced by the light-emitting diodes. Left side: Light spectrund 38% red light. Measurements were done with the spectroradiometer FieldSpec®
ne week (65–71 das) for one hour per day (6 a.m. to 7 a.m.).V-intensity was measured in a testing chamber under standard-
sed conditions at a distance of 0.35 m with the spectroradiometerL 756 (Gooch and Housego’s, Ilminster, UK) at 22 ◦C. Thereafter,lants were allowed to regenerate for eight days (72–79 das) eithernder 100 ± 5 �mol m−2 s−1 1 or 300 ± 5 �mol m−2 s−1.
.1.2. Impact of light qualityIn the second experiment nine-week old plants were allo-
ated under LED panels providing a similar light intensity100 ± 5 �mol m−2 s−1) but different spectral compositions (30% or2% of blue light) (Fig. 2). One week after acclimation (65–71 das)alf of the plants of each light treatment (30% or 62% blue light)ere exposed to the UV light for one week (72–78 das), as described
bove. After eight days (79–86 das) of regeneration (either under0% or 62% of blue light) the final evaluations were done. Eachxperiment consisted of four treatments with 10 plants per treat-ent.
.2. Photosynthesis and chlorophyll fluorescence
Leaf gas exchange was measured weekly with a portablenfrared gas analyzer (CIRAS-1, PP Systems, United Kingdom)quipped with a standard 2.5 cm−2 leaf cuvette (PLC B, PP Sys-ems, United Kingdom). Measurements were carried out underhite fluorescence lamps in the climate chamber adopting stan-ardized settings: CO2 concentration 350 ± 5 ppm, light intensity00 ± 5 �mol m−2 s−1 PAR, a boundary layer resistance (Rb) of.27 m2 s mol−1 and a leaf chamber air flow rate of 200 ml min−1.et photosynthetic rate (Pn) was measured on the same leaf used
or the chlorophyll fluorescence measurements (10 plants perreatment, one measurement per plant).
Chlorophyll fluorescence was recorded weekly under labora-ory conditions (ambient CO2 concentration) using an imagingulse-amplitude-modulated fluorometer (Imaging PAM, Heinz-alz GmbH, Effeltrich, Germany), equipped with 96 blue
ight-emitting diodes (peak at 470 nm) used for fluorescencexcitation, actinic illumination and saturation pulses. Fluores-ence images (640 × 480 pixel) were taken on the second fullyxpanded leaf of the third leaf level (eight plants per treat-ent, one measurement per plant). Plants were dark adapted
30 min) prior to the measurements. Ground fluorescence (Fo) wasecorded after leaf illumination by the blue light-emitting diodes
Please cite this article in press as: Hoffmann, A.M., et al., High blue ligplants exposed to UV stress. Environ. Exp. Bot. (2014), http://dx.doi.or
0.5 �mol m−2 s−1); the maximum fluorescence (Fm) was deter-ined after a blue light saturation pulse of 1000 �mol m−2 s−1.
he yield of variable chlorophyll fluorescence (Fv) was calculateds Fm − Fo while the maximum photochemical efficiency of PSII
th 30% blue light and 70% red light. Right side: Light spectrum with 62% blue lightD Inc., USA).
was calculated as Fv/Fm. After the first saturation pulse actiniclight (110 �mol m−2 s−1) was switched on and saturation pulses(1000 �mol m−2 s−1) were applied at 20 s interval within a timeframe of 340 s. Non-photochemical quenching (NPQ) was calcu-lated as NPQ = (Fm − F′m)/F′m. The recorded images were analyzedby ImagingWin v2.40b (Heinz-Walz GmbH, Effeltrich, Germany).From each image four areas of interest (AOIs) were selected. Themean of the four AOIs was then used for the analysis of variance.
2.3. Sensor-based determination of leaf pigments
The content of chlorophyll and epidermal flavonols wereestimated non-destructively with the hand-held optical sensorDualex® (FORCE-A, Orsay, France). At the start of the experiment(five weeks after sowing) one fully expanded leaf per plant waslabeled at the third leaf level. Both the initial measurement as wellas the records throughout the experiment (three times a week)were done on the same leaves. Four measurements were takenon the labeled leaf, on 10 plants per treatment. The difference inthe transmission of the red and near infrared light is used as abasis for the calculation of the chlorophyll-index (Chl-index) whichis directly related to the leaf chlorophyll content per unit area[�g cm−2] (Cerovic et al., 2012). The flavonol-index (FLAV-index)is a fluorescence-based index using the UV-screening effect of epi-dermal flavonols. This index is directly linked to the epidermalpolyphenol concentration of the leaf (Goulas et al., 2004; Cerovicet al., 2012).
2.4. Analytical determination of leaf pigments
The concentrations of chlorophylls, carotenoids, flavonoidsand anthocyanins were determined photometrically according toestablished methods as described elsewhere (Solovchenko et al.,2001; Solovchenko and Schmitz-Eiberger, 2003). Briefly, for theextraction, 100 mg of MgO were added to 30 mg of the dried andgrounded leaf material (leaf material was harvested separately perplant, 10 plants per treatment); then, after addition of 6 ml folchsolution samples were shaken and centrifuged (10 min, 4000 rpm,15 ◦C). The supernatant was transferred into graduate centrifugetubes; after addition of 1.2 ml H2O, the content was mixed and thetubes centrifuged until the chloroform and the water–methanol
ht improves acclimation and photosynthetic recovery of pepperg/10.1016/j.envexpbot.2014.06.017
tion of the volumes the water–methanol phase was transferredin another centrifuge tube. The chloroform was transferred intoglass flasks and filled up to a defined volume (25 ml) with the folchsolution. The centrifuge tube with the pellet was kept open to dry.
ING ModelE
4 nd Ex
tq6ataMattta
cc
C
af(
bf(
C
Col (C
Ca
F
−phas
FuV
A
eOH−H
Fc
2
(od
ARTICLEEB-2826; No. of Pages 10
A.M. Hoffmann et al. / Environmental a
The absorbencies were measured with a UV/vis spectropho-ometer (Lambda 35, Perkin-Elmer, USA) using dissolvent resistantuarz-glass cuvettes. The chloroform phase was measured at 750,65.6, 647.6 and 480 nm. The water–methanol phase was measuredt 750 and 360 nm; afterwards a drop of HCL (37%) was added tohe water–methanol solution which was then measured at 750nd 530 nm. Four milliliter of a methanol–HCL solution (100 mleOH + 1 ml 37% HCL) was added to the dried pellet, well shaken
nd centrifuged (10 min, 4000 rpm, 4 ◦C). The supernatant wasransferred to a graduate centrifuge tube. This process was donewice. The supernatant (8 ml) was measured at 750 and 360 nm,hen acidified with one drop of HCL (37%) and measured once againt 750 and 530 nm.
Concentrations of chlorophyll a (Chl a), chlorophyll b (Chl b),arotenoids (Car), flavonoids (Flav) and anthocyanins (Anth) werealculated according to the following equations:
hlorophyll:
C (Chl a) = A × Vol (chloroform) × 103
M(Chl a) × DW
A = 11.47 × (Abs. 665.6 − Abs. 750) − 2 × (Abs. 647.6 − Abs. 750)
A: Chlorophyll a concentration in �g ml−1; C (Chl a): Chlorophyll in nmol g−1 DW; Vol (chloroform): Volume of the chloro-orm phase in ml; M (Chl a): Molar mass of chlorophyll a893.49 g mol−1).
C (Chl. b) = B × Vol (chloroform) × 103
M (Chl b) × DW
B=21.85× (Abs. 647.6 − Abs. 750) − 4.53× (Abs. 665.6 − Abs. 750)
B: Chlorophyll b concentration in �g ml−1; C (Chl b): Chlorophyll in nmol g−1 DW; Vol (Chloroform): Volume of the chloro-orm phase in ml; M (Chl b): Molare mass of chlorophyll b907.47 g mol−1).
arotenoids:
(Car) = [1000 × (Abs. 480 − Abs. 750) − 1.33 × A − 23.93 × B] × V202 × M(Car) × DW
(Car): Carotenoid concentration in nmol g−1 DW; M (Car): Aver-ge of the molar mass of carotenoids (536.87 g mol−1).
lavonoids:
C (Flav) = 106 × F1
23500 × DW(g)F1 = Vol(MeOH−H2O−phase) × (Abs. 360 − Abs. 750) + Vol(pellet MeOH−HCl
F1: Combined absorption of the extract at 360 nm; C (Flav):lavonoid concentration in nmol g−1 DW; Vol(MeOH−H2O-phase): Vol-me of the water–methanol-phase in ml; Vol(pellet MeOH-HCl-phase):olume of the methanol–HCl-phase of the pellet.
nthocyanins:
C (Anth) = 106 × F2
30000 × DW(g)F2 = Vol(MeOH−H2O−phase, acidified) × (Abs. 530 − Abs. 750) + Vol(pellet M
2: Combined absorption of the extracts at 530 nm; C (Anth): Antho-yanin concentration in nmol g−1 DW.
.5. Biomass and leaf mass per area (LMA)
Please cite this article in press as: Hoffmann, A.M., et al., High blue ligplants exposed to UV stress. Environ. Exp. Bot. (2014), http://dx.doi.or
At the end of the experiments leaves and stalks of each plant10 plants per treatment) were harvested separately into previ-usly weighed plastic bags. Fresh weight (FW) was determinedirectly using a precision scale (BP210S, Sartorius, Chicago, USA)
PRESSperimental Botany xxx (2014) xxx–xxx
hloroform) × 102
e) × (Abs. 360 − Abs. 750)
Cl−phase,acidified) × (Abs. 530 − Abs. 750)
while leaf area was measured with a leaf area meter (LI-COR, Lin-coln, Nebraska, USA). Stems and leaves were then frozen at −25 ◦C,lyophilized (Gamma 1-16 LSC; Christ, Osterode am Harz, Germany)and weighed again in order to quantify their dry weight (DW). Leafmass per area (LMA) was calculated according to the equation
LMA[g cm−2
]= leaf-DW [g]
leaf area[cm2
] .
2.6. Statistics
Data were checked for normal distribution (Kolmogorov–Smirnov-test) and homogeneity of variance (Levene-test). If bothconditions were fulfilled statistical analyses were performed byone-way analysis of variance (ANOVA, p ≤ 0.05) using SPSS statis-tic software (PASW statistics version 20.0, SPSS Inc., Chicago, USA).Where applicable, the Duncan’s multiple range test (p ≤ 0.05) wasused to determine the differences among the four treatments.The impact of light intensity and light quality as well as theinteraction between light intensity or light quality and the UV-Btreatment was determined by a two-factor analysis of variance. Inthose cases where homogeneity of variance was not given non-parametric tests were performed (Kruskal–Wallis-test (p ≤ 0.05)and Mann–Whitney-U-test). The use of non-parametric tests isindicated in the subtitles of the respective figures. Graphs weredrawn with SigmaPlot 11.0 (Systat Software Inc., Richmond, CA,USA).
3. Results
3.1. Impact of light intensity
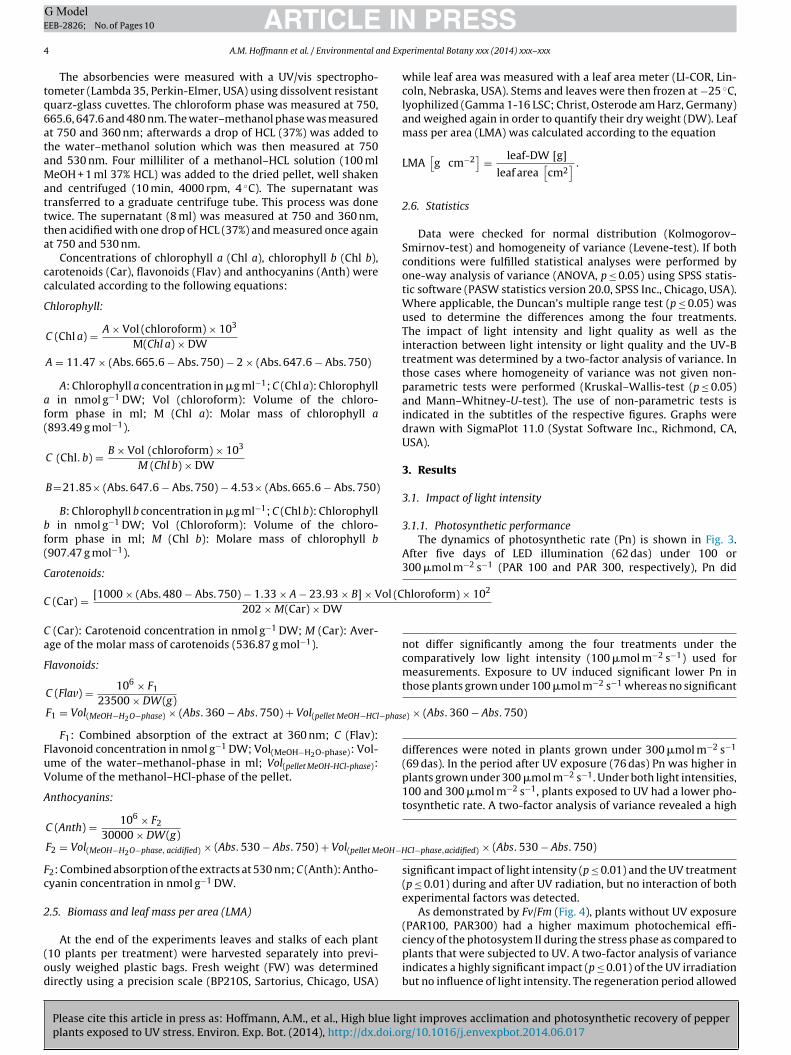
3.1.1. Photosynthetic performanceThe dynamics of photosynthetic rate (Pn) is shown in Fig. 3.
After five days of LED illumination (62 das) under 100 or300 �mol m−2 s−1 (PAR 100 and PAR 300, respectively), Pn did
not differ significantly among the four treatments under thecomparatively low light intensity (100 �mol m−2 s−1) used formeasurements. Exposure to UV induced significant lower Pn inthose plants grown under 100 �mol m−2 s−1 whereas no significant
differences were noted in plants grown under 300 �mol m−2 s−1
(69 das). In the period after UV exposure (76 das) Pn was higher inplants grown under 300 �mol m−2 s−1. Under both light intensities,100 and 300 �mol m−2 s−1, plants exposed to UV had a lower pho-tosynthetic rate. A two-factor analysis of variance revealed a high
significant impact of light intensity (p ≤ 0.01) and the UV treatment(p ≤ 0.01) during and after UV radiation, but no interaction of bothexperimental factors was detected.
As demonstrated by Fv/Fm (Fig. 4), plants without UV exposure(PAR100, PAR300) had a higher maximum photochemical effi-
ht improves acclimation and photosynthetic recovery of pepperg/10.1016/j.envexpbot.2014.06.017
ciency of the photosystem II during the stress phase as compared toplants that were subjected to UV. A two-factor analysis of varianceindicates a highly significant impact (p ≤ 0.01) of the UV irradiationbut no influence of light intensity. The regeneration period allowed
ARTICLE IN PRESSG ModelEEB-2826; No. of Pages 10
A.M. Hoffmann et al. / Environmental and Experimental Botany xxx (2014) xxx–xxx 5
Days afte r sowing55 58 62 65 69 71 76
Pho
tosy
nthe
sis
[m
ol m
-2 s
-1]
0.00.5
1.0
1.5
2.0
2.5
3.0
3.5PAR10 0PAR100 +UVPAR30 0PAR300 +UV
UV1h per day
a
bb
c
a
b
bc
c
n.s.
cbcaba
CFL LED
Fig. 3. Influence of light intensity and UV irradiation on the development ofnet photosynthesis. Pepper plants were cultivated under 100 �mol m−2 s−1 or300 �mol m−2 s−1, with or without supplemental UV (UVBE = 5.53 kJ m−2 per hourpen
Pp
cheiimtes((fi
Fmu(sD
Time [s]0 50 10 0 15 0 20 0 25 0 30 0 350
NP
Q
0.00
0.05
0.10
0.15
0.20
0.25PAR10 0PAR100+U VPAR30 0PAR300+U V
aababb
A
n.s.
n.s.
n.s.
n.s.
n.s.
n.s.n.s. n.s. n.s. n.s. n.s. n.s. n.s.
56 das
Time [s]0 50 10 0 15 0 20 0 25 0 30 0 350
NP
Q
0.00
0.05
0.10
0.15
0.20
0.25PAR100PAR100+U VPAR300PAR300+U V
aaabb
aaab
aaab
aaabb
aabb
B
n.s.
n.s.n.s.
n.s.n.s.n.s. n.s. n.s.
n.s.
70 das
0.25PAR100PAR100+U VPAR300
C
er day, 65–71 das). Means ± SE (n = 10) followed by the same letters (within thevaluation day) do not differ significantly according to the Duncan test (p ≤ 0.05);.s., non significant.
AR300+UV to approach the same level as control, non-stressedlants, whereas Fv/Fm decreased further in PAR100+UV.
Evaluations of the non-photochemical quenching (NPQ) indi-ate the impact of both the light intensity and UV exposure on theeat dissipation by the leaves (Fig. 5A–C). Here, we observe a gen-ral increase of NPQ in those plants grown under 100 �mol m−2 s−1,rrespective of the UV irradiation. However, a more detailed viewndicates higher NPQ values at 70 das for the plants of the treat-
ent PAR100+UV (Fig. 5B). In contrast, no differences betweenhe PAR300 and PAR300+UV groups could be observed during thexperiment. During the UV period (70 das) the two-factor analy-is of variance indicated a high significant impact of light intensityp ≤ 0.01) from 120 s until 180 s, a high significant impact of UV light
Please cite this article in press as: Hoffmann, A.M., et al., High blue ligplants exposed to UV stress. Environ. Exp. Bot. (2014), http://dx.doi.or
p ≤ 0.01) from 80 s until 100 s and a significant interaction of bothactors (p ≤ 0.05) from 80 s until 100 s. At 77 das a high significantmpact of light intensity (p ≤ 0.01) could be proven from 100 s until
Days after sowing56 58 63 65 71 77
Fv /
Fm
0.000.66
0.68
0.70
0.72
0.74
0.76
0.78
0.80
0.82
0.84PAR100PAR100+UVPAR300PAR300+UV
UV1h pe r d ay
a
bb
abn.s. n.s.
b
baa
CFL LED
ig. 4. Influence of light intensity and UV irradiation on the development of theaximum photochemical efficiency of PSII (Fv/Fm). Pepper plants were cultivated
nder 100 �mol m−2 s−1 or 300 �mol m−2 s−1, with or without supplemental UVUVBE = 5.53 kJ m−2 per hour per day, 65–71 das). Means ± SE (n = 8) followed by theame letters (within the evaluation day) do not differ significantly according to theuncan test (p ≤ 0.05); n.s., non significant.
Time [s]0 50 10 0 15 0 20 0 25 0 30 0 350
NP
Q
0.00
0.05
0.10
0.15
0.20 PAR300+U V
aababb
aababb
aabbcc
aa
aa
aa
aa
aa
aa
bb
bb
bb
bb
bb
bb
n.s. n.s. n.s. n.s. n.s.
77 das
Fig. 5. Influence of light intensity and UV irradiation on the developmentof the non-photochemical quenching (NPQ). Pepper plants were cultivatedunder 100 �mol m−2 s−1 or 300 �mol m−2 s−1, with or without supplemental UV(UVBE = 5.53 kJ m−2 per hour per day, 65–71 das). Evaluation was done before LED-
treatment initiation (56 das, A), during the UV period (70 das, B) and after the UVperiod (77 das, C). Means ± SE (n = 8) followed by the same letters do not differsignificantly according to the Duncan test (p ≤ 0.05); n.s., non significant.220 s. There was no longer a significant UV effect, although an inter-action of light intensity and UV irradiation could be seen at 60 s.
ht improves acclimation and photosynthetic recovery of pepperg/10.1016/j.envexpbot.2014.06.017
3.1.2. Leaf pigmentsAlterations in the content of leaf pigments were determined
non-destructively with an optical sensor in the time-course of the
ARTICLE IN PRESSG ModelEEB-2826; No. of Pages 10
6 A.M. Hoffmann et al. / Environmental and Experimental Botany xxx (2014) xxx–xxx
Days afte r sowing 54 58 65 71 79
Chl
- in
dex
[rel.
units
]
020
22
24
26
28
30
32
34PAR10 0PAR100 +UVPAR300PAR300+UV
UV1h per day
a
bbb
baaa
cbcba
CFL LED
Days afte r sowing54 58 65 71 79
FLAV
- in
dex
[rel.
units
]
0.00.1
0.2
0.3
0.4
0.5
0.6
0.7PAR100 PAR100 +UV PAR300 PAR300+UV
UV1h per day
aa
b
c
cbaa
c
b
a
a
CFL LED
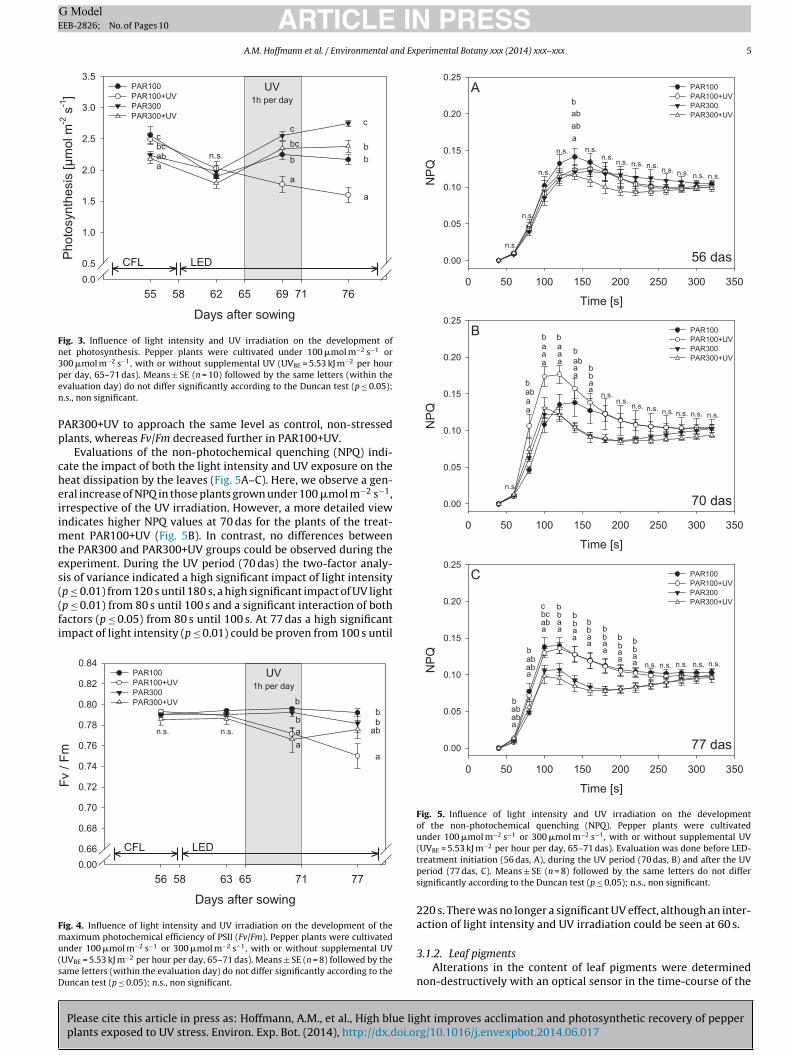
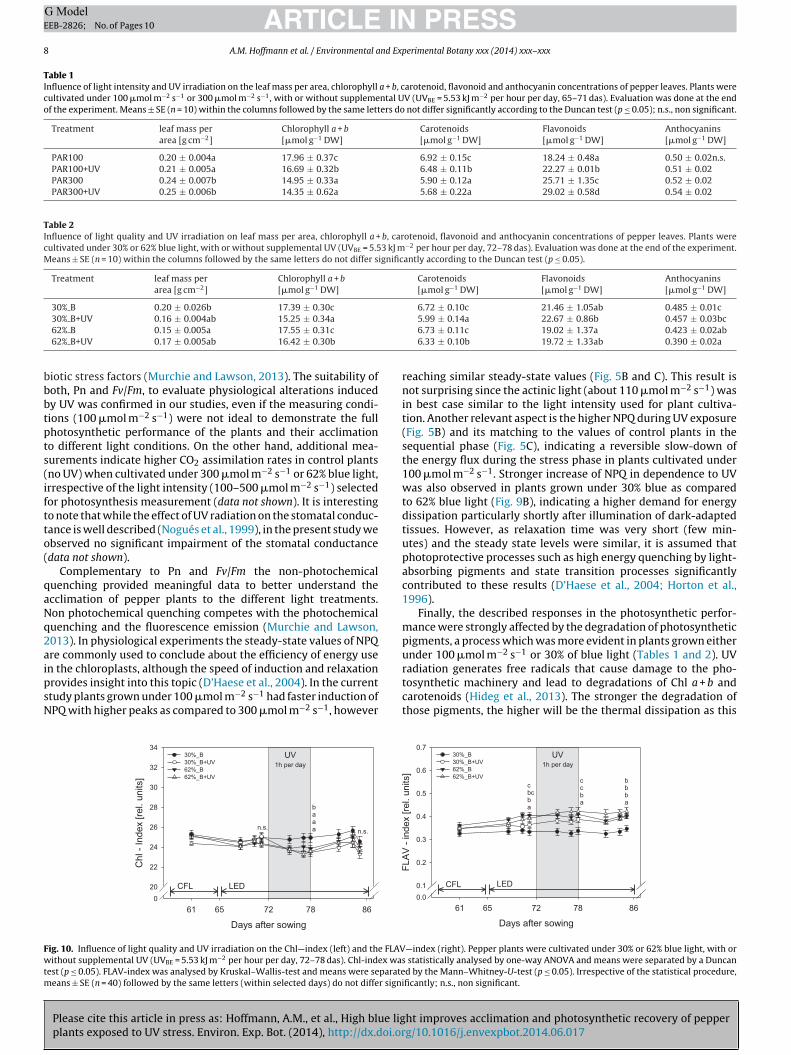
Fig. 6. Influence of light intensity and UV irradiation on the development of the Chl—index (left) and the FLAV—index (right). Pepper plants were cultivated under1 .53 kJ m−2 per hour per day, 65–71 das). Chl-index was statistically analysed by one-wayA alysed by Kruskal–Wallis-test and means were separated by the Mann–Whitney-U-test( the same letters (within selected days) do not differ significantly.
ec
a(pCdeitbtdcflit
mui((Fefilat
3
3
mtd(ipeuvpg
Days afte r sowing 62 65 69 72 76 78 83
Pho
tosy
nthe
sis
[m
ol m
-2 s
-1]
0.00.5
1.0
1.5
2.0
2.5
3.0
3.530%_B30%_B+UV62%_B62%_B+UV
a
b
b
c
UV1h per day
a
b
b
cn.s.
a
ab
b
b
CFL LED
Fig. 7. Influence of light quality and UV irradiation on the development of netphotosynthesis. Pepper plants were cultivated under 30% or 62% blue light, withor without supplemental UV (UVBE = 5.53 kJ m−2 per hour per day, 72–78 das).
00 �mol m−2 s−1 or 300 �mol m−2 s−1, with or without supplemental UV (UVBE = 5NOVA and means were separated by a Duncan test (p ≤ 0.05). FLAV-index was an
p ≤ 0.05). Irrespective of the statistical procedure, means ± SE (n = 40) followed by
xperiment (Chl-index and FLAV-index) and compared to a wet-hemical analysis at the end of the experiment.
Irrespective of light intensity and UV irradiation we observedn increase of the Chl-index in the time-course of the experimentFig. 6). A negative impact of UV was observed particularly in thelants grown under 100 �mol m−2 s−1, which presented a lowerhl-index after the period of UV exposure (71 das). Differently, theestructive analysis of the chlorophyll content at the end of thexperiment reveal a significantly lower chlorophyll concentrationn those plants cultivated under 300 �mol m−2 s−1 (Table 1). Sincehe concentration of Chl a and Chl b was affected in a similar wayy the treatments (data not shown), we pooled the data to calculatehe total chlorophyll content. The UV irradiation led to a significantecrease in the content of chlorophyll and carotenoids in plantsultivated under 100 �mol m−2 s−1, whereas this was not the caseor plants grown under 300 �mol m−2 s−1 (Table 1). Moreover, theeaf mass per unit area (LMA) indicates a significant impact of lightntensity, and supports the results of the Chl-index recorded withhe optical sensor.
Also the other leaf pigments were affected by the experi-ental treatments, although in a different way. Plants grown
nder 300 �mol m−2 s−1 revealed a strong increase in the FLAV-ndex, which was more accentuated after irradiation with UVPAR300+UV). In contrast, plants grown under 100 �mol m−2 s−1
PAR100, PAR100+UV) showed no significant changes in theLAV-index, which remained at the same level throughout thexperiment. The stronger impact of light intensity was also con-rmed with the determination of the flavonoid content in the
eaves. However, here we also observed a positive effect of UV radi-tion on the accumulation of flavonoids (Table 1), but no effect onhe concentration of anthocyanins.
.2. Impact of light quality
.2.1. Photosynthetic performanceAlthough Pn showed unexpected discrepancies in the initial
easurement, after seven days of illumination with the LEDshe four treatments (30% B, 30% B+UV, 62% B, 62% B+UV) did notiffer significantly under the comparatively low light intensity100 �mol m−2 s−1) used for measurements. Four days after start-ng UV radiation significant effects could be observed but the mostronounced influence of the applied treatments became appar-nt at the end of the experiment (Fig. 7). Here, plants cultivated
Please cite this article in press as: Hoffmann, A.M., et al., High blue ligplants exposed to UV stress. Environ. Exp. Bot. (2014), http://dx.doi.or
nder 62% of blue light showed a higher Pn than those culti-ated under 30% of blue light. Furthermore, the UV irradiatedlants had significant lower Pn values than the respective controlroups.
Means ± SE (n = 10) followed by the same letters (within the evaluation day) donot differ significantly according to the Mann–Whitney-U-test (p ≤ 0.05); n.s., nonsignificant.
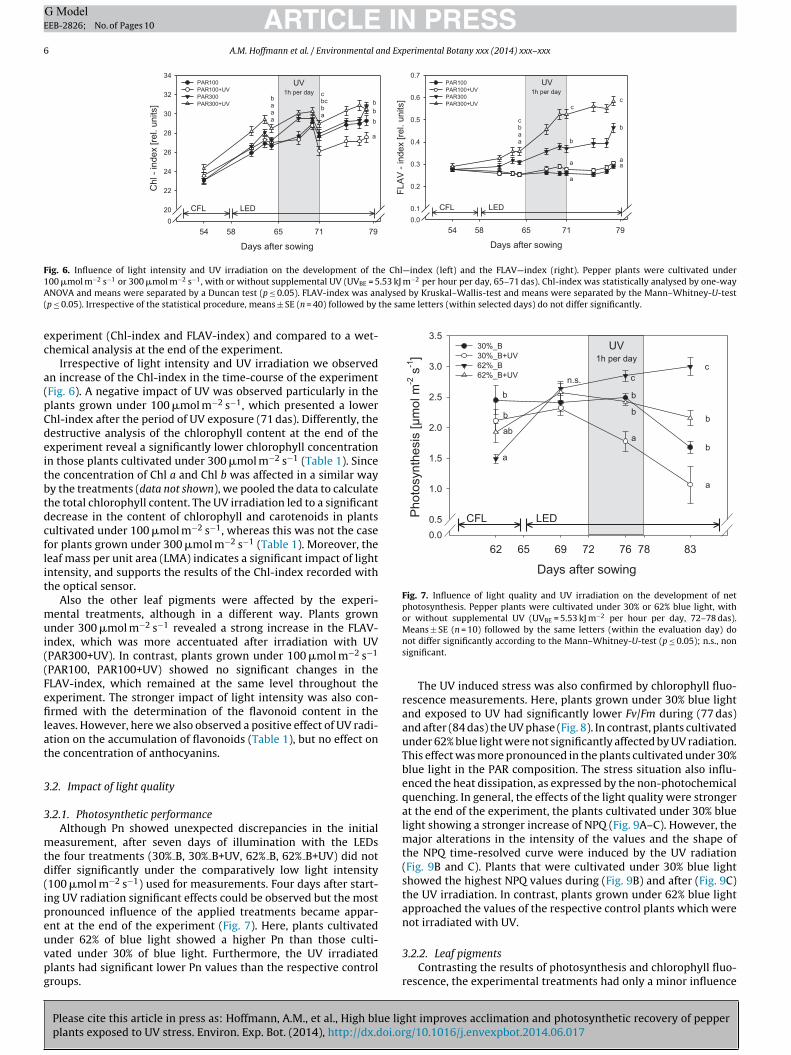
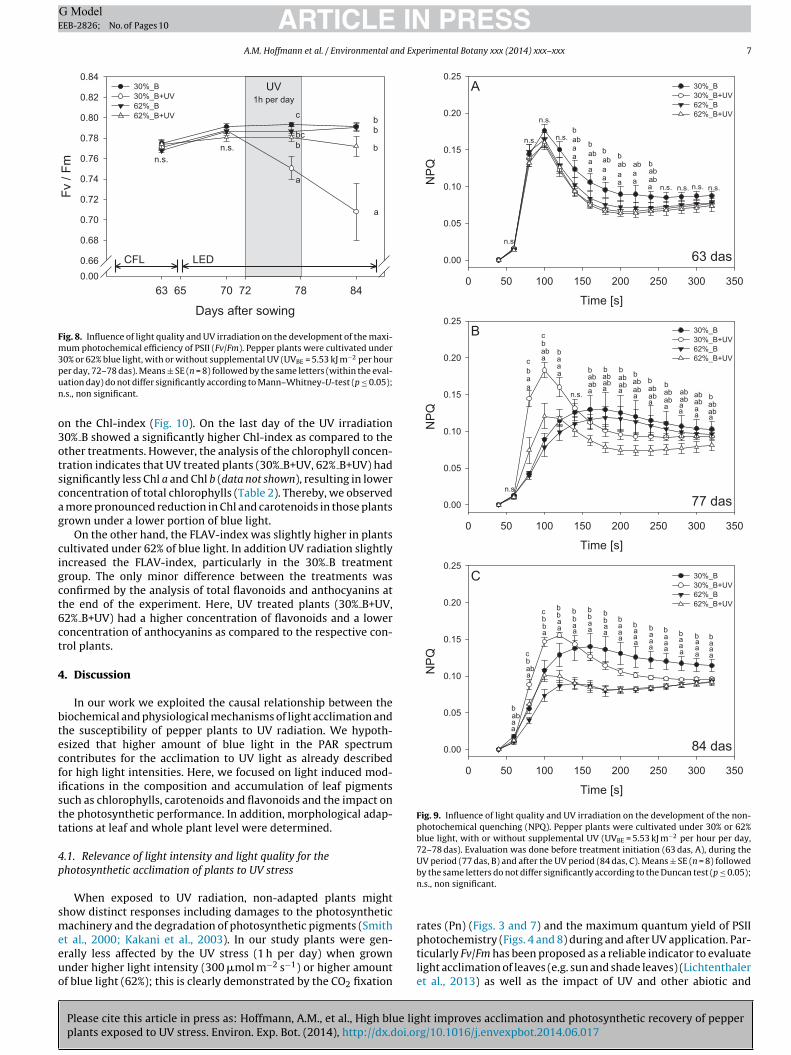
The UV induced stress was also confirmed by chlorophyll fluo-rescence measurements. Here, plants grown under 30% blue lightand exposed to UV had significantly lower Fv/Fm during (77 das)and after (84 das) the UV phase (Fig. 8). In contrast, plants cultivatedunder 62% blue light were not significantly affected by UV radiation.This effect was more pronounced in the plants cultivated under 30%blue light in the PAR composition. The stress situation also influ-enced the heat dissipation, as expressed by the non-photochemicalquenching. In general, the effects of the light quality were strongerat the end of the experiment, the plants cultivated under 30% bluelight showing a stronger increase of NPQ (Fig. 9A–C). However, themajor alterations in the intensity of the values and the shape ofthe NPQ time-resolved curve were induced by the UV radiation(Fig. 9B and C). Plants that were cultivated under 30% blue lightshowed the highest NPQ values during (Fig. 9B) and after (Fig. 9C)the UV irradiation. In contrast, plants grown under 62% blue lightapproached the values of the respective control plants which werenot irradiated with UV.
ht improves acclimation and photosynthetic recovery of pepperg/10.1016/j.envexpbot.2014.06.017
3.2.2. Leaf pigmentsContrasting the results of photosynthesis and chlorophyll fluo-
rescence, the experimental treatments had only a minor influence
ARTICLE IN PRESSG ModelEEB-2826; No. of Pages 10
A.M. Hoffmann et al. / Environmental and Experimental Botany xxx (2014) xxx–xxx 7
Days after sowing63 65 70 72 78 84
Fv /
Fm
0.000.66
0.68
0.70
0.72
0.74
0.76
0.78
0.80
0.82
0.8430%_B30%_B+UV62%_B62%_B+UV
UV1h per day
a
b
bb
n.s.n.s.
a
b
c
bc
CFL LED
Fig. 8. Influence of light quality and UV irradiation on the development of the maxi-mum photochemical efficiency of PSII (Fv/Fm). Pepper plants were cultivated under30% or 62% blue light, with or without supplemental UV (UVBE = 5.53 kJ m−2 per hourpun
o3otscag
cigct6ct
4
btecfistt
4p
smeeuo
Time [s]0 50 10 0 15 0 200 25 0 30 0 35 0
NPQ
0.00
0.05
0.10
0.15
0.20
0.2530%_B30%_B+UV62%_B62%_B+UV
aaabb
aaabb
a a
aa
aa
ab ab ab
bb
b
a
abab
A
n.s.n.s.n.s. n.s.
n.s.
n.s.
n.s.
n.s.
63 das
Time [s]0 50 10 0 15 0 200 25 0 30 0 35 0
NPQ
0.00
0.05
0.10
0.15
0.20
0.2530%_B30%_B+UV62%_B62%_B+UV
a
ba
c aabbc
aaab
aababb
aababb
aa
a a
abab
abab
ababab ab
b bbb
aaa
aaba
ab abab
ababb
B
n.s.
n.s.
77 das
Time [s]0 50 10 0 15 0 200 25 0 30 0 35 0
NP
Q
0.00
0.05
0.10
0.15
0.20
0.2530%_B30%_B+UV62%_B62%_B+UV
aaabb
aabbc
abbc
aa
aa a
a aa
bb
bb b
b bb
aa
a aa a
aa a
a
a a a a
a
aa a
aaabb
bbb
b b
C
84 das
Fig. 9. Influence of light quality and UV irradiation on the development of the non-photochemical quenching (NPQ). Pepper plants were cultivated under 30% or 62%blue light, with or without supplemental UV (UVBE = 5.53 kJ m−2 per hour per day,72–78 das). Evaluation was done before treatment initiation (63 das, A), during theUV period (77 das, B) and after the UV period (84 das, C). Means ± SE (n = 8) followed
er day, 72–78 das). Means ± SE (n = 8) followed by the same letters (within the eval-ation day) do not differ significantly according to Mann–Whitney-U-test (p ≤ 0.05);.s., non significant.
n the Chl-index (Fig. 10). On the last day of the UV irradiation0% B showed a significantly higher Chl-index as compared to thether treatments. However, the analysis of the chlorophyll concen-ration indicates that UV treated plants (30% B+UV, 62% B+UV) hadignificantly less Chl a and Chl b (data not shown), resulting in loweroncentration of total chlorophylls (Table 2). Thereby, we observed
more pronounced reduction in Chl and carotenoids in those plantsrown under a lower portion of blue light.
On the other hand, the FLAV-index was slightly higher in plantsultivated under 62% of blue light. In addition UV radiation slightlyncreased the FLAV-index, particularly in the 30% B treatmentroup. The only minor difference between the treatments wasonfirmed by the analysis of total flavonoids and anthocyanins athe end of the experiment. Here, UV treated plants (30% B+UV,2% B+UV) had a higher concentration of flavonoids and a loweroncentration of anthocyanins as compared to the respective con-rol plants.
. Discussion
In our work we exploited the causal relationship between theiochemical and physiological mechanisms of light acclimation andhe susceptibility of pepper plants to UV radiation. We hypoth-sized that higher amount of blue light in the PAR spectrumontributes for the acclimation to UV light as already describedor high light intensities. Here, we focused on light induced mod-fications in the composition and accumulation of leaf pigmentsuch as chlorophylls, carotenoids and flavonoids and the impact onhe photosynthetic performance. In addition, morphological adap-ations at leaf and whole plant level were determined.
.1. Relevance of light intensity and light quality for thehotosynthetic acclimation of plants to UV stress
When exposed to UV radiation, non-adapted plants mighthow distinct responses including damages to the photosyntheticachinery and the degradation of photosynthetic pigments (Smith
Please cite this article in press as: Hoffmann, A.M., et al., High blue ligplants exposed to UV stress. Environ. Exp. Bot. (2014), http://dx.doi.or
t al., 2000; Kakani et al., 2003). In our study plants were gen-rally less affected by the UV stress (1 h per day) when grownnder higher light intensity (300 �mol m−2 s−1) or higher amountf blue light (62%); this is clearly demonstrated by the CO2 fixation
by the same letters do not differ significantly according to the Duncan test (p ≤ 0.05);n.s., non significant.
rates (Pn) (Figs. 3 and 7) and the maximum quantum yield of PSIIphotochemistry (Figs. 4 and 8) during and after UV application. Par-
ht improves acclimation and photosynthetic recovery of pepperg/10.1016/j.envexpbot.2014.06.017
ticularly Fv/Fm has been proposed as a reliable indicator to evaluatelight acclimation of leaves (e.g. sun and shade leaves) (Lichtenthaleret al., 2013) as well as the impact of UV and other abiotic and
ARTICLE IN PRESSG ModelEEB-2826; No. of Pages 10
8 A.M. Hoffmann et al. / Environmental and Experimental Botany xxx (2014) xxx–xxx
Table 1Influence of light intensity and UV irradiation on the leaf mass per area, chlorophyll a + b, carotenoid, flavonoid and anthocyanin concentrations of pepper leaves. Plants werecultivated under 100 �mol m−2 s−1 or 300 �mol m−2 s−1, with or without supplemental UV (UVBE = 5.53 kJ m−2 per hour per day, 65–71 das). Evaluation was done at the endof the experiment. Means ± SE (n = 10) within the columns followed by the same letters do not differ significantly according to the Duncan test (p ≤ 0.05); n.s., non significant.
Treatment leaf mass perarea [g cm−2]
Chlorophyll a + b[�mol g−1 DW]
Carotenoids[�mol g−1 DW]
Flavonoids[�mol g−1 DW]
Anthocyanins[�mol g−1 DW]
PAR100 0.20 ± 0.004a 17.96 ± 0.37c 6.92 ± 0.15c 18.24 ± 0.48a 0.50 ± 0.02n.s.PAR100+UV 0.21 ± 0.005a 16.69 ± 0.32b 6.48 ± 0.11b 22.27 ± 0.01b 0.51 ± 0.02PAR300 0.24 ± 0.007b 14.95 ± 0.33a 5.90 ± 0.12a 25.71 ± 1.35c 0.52 ± 0.02PAR300+UV 0.25 ± 0.006b 14.35 ± 0.62a 5.68 ± 0.22a 29.02 ± 0.58d 0.54 ± 0.02
Table 2Influence of light quality and UV irradiation on leaf mass per area, chlorophyll a + b, carotenoid, flavonoid and anthocyanin concentrations of pepper leaves. Plants werecultivated under 30% or 62% blue light, with or without supplemental UV (UVBE = 5.53 kJ m−2 per hour per day, 72–78 das). Evaluation was done at the end of the experiment.Means ± SE (n = 10) within the columns followed by the same letters do not differ significantly according to the Duncan test (p ≤ 0.05).
Treatment leaf mass perarea [g cm−2]
Chlorophyll a + b[�mol g−1 DW]
Carotenoids[�mol g−1 DW]
Flavonoids[�mol g−1 DW]
Anthocyanins[�mol g−1 DW]
30% B 0.20 ± 0.026b 17.39 ± 0.30c 6.72 ± 0.10c 21.46 ± 1.05ab 0.485 ± 0.01c
bbbtpts(iftto(
qaNq2aipsN
Fwtm
30% B+UV 0.16 ± 0.004ab 15.25 ± 0.34a
62% B 0.15 ± 0.005a 17.55 ± 0.31c
62% B+UV 0.17 ± 0.005ab 16.42 ± 0.30b
iotic stress factors (Murchie and Lawson, 2013). The suitability ofoth, Pn and Fv/Fm, to evaluate physiological alterations inducedy UV was confirmed in our studies, even if the measuring condi-ions (100 �mol m−2 s−1) were not ideal to demonstrate the fullhotosynthetic performance of the plants and their acclimationo different light conditions. On the other hand, additional mea-urements indicate higher CO2 assimilation rates in control plantsno UV) when cultivated under 300 �mol m−2 s−1 or 62% blue light,rrespective of the light intensity (100–500 �mol m−2 s−1) selectedor photosynthesis measurement (data not shown). It is interestingo note that while the effect of UV radiation on the stomatal conduc-ance is well described (Nogués et al., 1999), in the present study webserved no significant impairment of the stomatal conductancedata not shown).
Complementary to Pn and Fv/Fm the non-photochemicaluenching provided meaningful data to better understand thecclimation of pepper plants to the different light treatments.on photochemical quenching competes with the photochemicaluenching and the fluorescence emission (Murchie and Lawson,013). In physiological experiments the steady-state values of NPQre commonly used to conclude about the efficiency of energy use
Please cite this article in press as: Hoffmann, A.M., et al., High blue ligplants exposed to UV stress. Environ. Exp. Bot. (2014), http://dx.doi.or
n the chloroplasts, although the speed of induction and relaxationrovides insight into this topic (D’Haese et al., 2004). In the currenttudy plants grown under 100 �mol m−2 s−1 had faster induction ofPQ with higher peaks as compared to 300 �mol m−2 s−1, however
Days after sowing61 65 72 78 86
Chl
- In
dex
[rel.
units
]
020
22
24
26
28
30
32
3430%_B30%_B+UV62%_B62%_B+UV
UV1h per day
n.s.n.s.
baaa
CFL LED
ig. 10. Influence of light quality and UV irradiation on the Chl—index (left) and the FLAVithout supplemental UV (UVBE = 5.53 kJ m−2 per hour per day, 72–78 das). Chl-index wa
est (p ≤ 0.05). FLAV-index was analysed by Kruskal–Wallis-test and means were separateeans ± SE (n = 40) followed by the same letters (within selected days) do not differ signi
5.99 ± 0.14a 22.67 ± 0.86b 0.457 ± 0.03bc6.73 ± 0.11c 19.02 ± 1.37a 0.423 ± 0.02ab6.33 ± 0.10b 19.72 ± 1.33ab 0.390 ± 0.02a
reaching similar steady-state values (Fig. 5B and C). This result isnot surprising since the actinic light (about 110 �mol m−2 s−1) wasin best case similar to the light intensity used for plant cultiva-tion. Another relevant aspect is the higher NPQ during UV exposure(Fig. 5B) and its matching to the values of control plants in thesequential phase (Fig. 5C), indicating a reversible slow-down ofthe energy flux during the stress phase in plants cultivated under100 �mol m−2 s−1. Stronger increase of NPQ in dependence to UVwas also observed in plants grown under 30% blue as comparedto 62% blue light (Fig. 9B), indicating a higher demand for energydissipation particularly shortly after illumination of dark-adaptedtissues. However, as relaxation time was very short (few min-utes) and the steady state levels were similar, it is assumed thatphotoprotective processes such as high energy quenching by light-absorbing pigments and state transition processes significantlycontributed to these results (D’Haese et al., 2004; Horton et al.,1996).
Finally, the described responses in the photosynthetic perfor-mance were strongly affected by the degradation of photosyntheticpigments, a process which was more evident in plants grown eitherunder 100 �mol m−2 s−1 or 30% of blue light (Tables 1 and 2). UV
ht improves acclimation and photosynthetic recovery of pepperg/10.1016/j.envexpbot.2014.06.017
radiation generates free radicals that cause damage to the pho-tosynthetic machinery and lead to degradations of Chl a + b andcarotenoids (Hideg et al., 2013). The stronger the degradation ofthose pigments, the higher will be the thermal dissipation as this
Days afte r sowing61 65 72 78 86
FLAV
- in
dex
[rel.
units
]
0.00.1
0.2
0.3
0.4
0.5
0.6
0.730%_B30%_B+UV62%_B62%_B+UV
UV1h pe r day
cbcba
bbba
ccba
CFL LED
—index (right). Pepper plants were cultivated under 30% or 62% blue light, with ors statistically analysed by one-way ANOVA and means were separated by a Duncand by the Mann–Whitney-U-test (p ≤ 0.05). Irrespective of the statistical procedure,ficantly; n.s., non significant.
ING ModelE
nd Exp
p(
4c
spcasslwflCctCUlwSaeaicscifcdLiaisqtbatBtbbn
rieiotetbas(ofif
ARTICLEEB-2826; No. of Pages 10
A.M. Hoffmann et al. / Environmental a
rotects PSII reaction centers against photoinhibitory damagesMoon et al., 2011).
.2. Light intensity and high blue light influence pigmentomposition in distinct ways
The lower UV susceptibility induced by both higher light inten-ity and higher amount of blue light, and characterized by thehotosynthetic performance, relies on specific acclimation pro-esses that include pigments which contribute the photochemicaldaptation (Chl a, Chl b, Car) as well as pigments that serve ashielding compounds (e.g. epidermal flavonols). In the presenttudy light intensity and light quality had different effects oneaf pigment compositions. While the photochemical acclimation
as particularly influenced by light quality, the accumulation ofavonoids was affected by both light intensity and light quality.ontrol plants grown under 100 �mol m−2 s−1 had a 17% higheroncentration of Chl a + b and a 15% higher concentration of Carhan control plants grown under 300 �mol m−2 s−1 (Table 1). Both,hl a + b and Car improve light harvesting (Matsubara et al., 2009).nder low light conditions (PAR100) plants invest more energy in
ight harvesting than in biomass production (Matsubara et al., 2009)hich was also proven by us in terms of biometric data (Tables
1 and S2). Thinner leaves with larger chloroplasts and highermounts of chlorophyll improve light harvesting in a light-limitednvironment (Boardman, 1977). In our study the morphologicaldaptations induced changes in the LMA which was 17% lowern plants grown under 100 �mol m−2 s−1 (Table 1). The modifi-ations in LMA explain why the area based Chl-index was lessuitable to detect modifications in the chlorophyll concentration,ontrasting the dry weight based analytics. It must also be takennto consideration that alterations in LMA leads to changes in therequency of photosynthetic reaction centers per leaf area unit thatonsequently influences net photosynthesis and Fv/Fm as alreadyescribed for sun and shade leaves (Lichtenthaler and Babani, 2004;ichtenthaler et al., 2013). In contrast to light intensity, light qual-ty did not affect the amount of photosynthetic related pigmentss demonstrated by wet-chemical analysis (Table 2) and the non-nvasive measurements (Fig. 10). The ratio of Chl a/Chl b (data nothown) which is known to be sensitive to light intensity and lightuality was not affected in both experiments. The results suggesthat adaptations in the pigment composition are strongly limitedy the amount of blue light. According to Buschmann et al. (1978)nd Lichtenthaler and Buschmann (1978), the formation of sunype chloroplasts is already induced at low percentage of blue light.oth light qualities used in our study (30% and 62% blue light) con-ained comparatively high amounts of blue light. It must thereforee assumed that sun type chloroplasts were formed also under 30%lue light since the composition of photosynthetic pigments didot differ between plants grown under 30% and 62% of blue light.
Irrespective of that, flavonoids working as UV screeners andeactive oxygen species (ROS) scavengers, are of central importancen the context of UV acclimation (see review of Falcone Ferreyrat al., 2012; Gould, 2004). Flavonoid synthesis depends on lightntensity as well as on light quality (Feinbaum et al., 1991). More-ver, we point out that light intensity and light quality influencehe ability to accumulate epidermal flavonols during and after UVxposure. It is conspicuous that the FLAV-index (Fig. 6) and theotal flavonoid concentration followed a similar trend as affectedy different light intensities whereas this was not the case whennalyzing the effect of light quality. In contrast to light inten-ity high blue light increased the amount of epidermal flavonols
Please cite this article in press as: Hoffmann, A.M., et al., High blue ligplants exposed to UV stress. Environ. Exp. Bot. (2014), http://dx.doi.or
Fig. 10), whereas the amount of anthocyanins and the total amountf flavonoids were not affected (Table 2). Hereby, the results con-rm that the light dependent accumulation of flavonoids is specific
or each single component of the flavonoid family. Furthermore,
PRESSerimental Botany xxx (2014) xxx–xxx 9
we observed that light intensity (1st experiment) had no sig-nificant effect while light quality (2nd experiment) significantlyaffected the anthocyanin accumulation. This suggests that particu-larly under low fluence rates light quality is an important factor thatdetermines anthocyanin synthesis and accumulation. This hypoth-esis is also supported by Sarala et al. (2011) who found that theremoval of blue light from the normal light spectrum significantlyreduced anthocyanin concentration in different plant species.
5. Conclusion
In our study we demonstrate that high amount of blue lighttriggers specific biochemical and physiological processes resultingin better acclimation and recovery of plants to UV stress. Amongstothers this was clearly proven by gas exchange and fluorescencemeasurements. UV induced degradation of photosynthetic relatedpigments (chlorophyll a and b, as well as carotenoids) was strongerin those plants cultivated either under lower light intensity orlower amount of blue light, whereas plants grown either under300 �mol m−2 s or 62% blue light accumulated more epidermalflavonols.
Acknowledgements
The authors thank Mr. Toshihiko Oishi, Ushio Europe B.V. (TheNetherlands), and the group of technical engineers from UshioLighting Inc. (Japan) for developing and making the LED pan-els available for this study. Many thanks to Stefan Heinzl, UshioDeutschland GmbH, for his support with the UV-light measure-ments. We are grateful to Dr. Zoran G. Cerovic (Laboratoire ÉcologieSystématique et Évolution, Université Paris-Sud, France) for hisvaluable support in interpreting the Dualex® data. Furthermore, theauthors are indepted to Libeth Schwager for her support in pigmentanalysis and to Franziska Möhl and Lara Poß for their assistance dur-ing the experimental phase. We also thank the three anonymousreviewers for their constructive comments on the manuscript.Finally, we acknowledge the Theodor-Brinkmann-Graduate School(Faculty of Agriculture, University of Bonn) for providing a scholar-ship to the first author.
Appendix A. Supplementary data
Supplementary data associated with this article can befound, in the online version, at http://dx.doi.org/10.1016/j.envexpbot.2014.06.017.
References
Abidi, F., Girault, T., Douillet, O., Guillemain, G., Sintes, G., Laffaire, M., Ben Ahmed,H., Smiti, S., Huché-Thélier, L., Leduc, N., 2013. Blue light effects on rose photo-synthesis and photomorphogenesis. Plant Biol. 15, 67–74.
Adamse, P., Britz, S.J., Caldwell, C.R., 1994. Amelioration of UV-B damage underhigh irradiance, II: Role of blue light photoreceptors. Photochem. Photobiol. 60,110–115.
Banás, A.K., Aggarwal, C., Labuz, J., Sztatelman, O., Gabrys, H., 2012. Blue lightsignalling in chloroplast movements. J. Exp. Bot. 63, 1559–1574.
Banerjee, R., Batschauer, A., 2005. Plant blue-light receptors. Planta 220, 498–502.Boardman, N.K., 1977. Comparative photosynthesis of sun and shade plants. Annu.
Rev. Plant Physiol. 28, 355–377.Brown, C.S., Schuerger, A.C., Sager, J.C., 1995. Growth and photomorphogenesis of
pepper plants under red light-emitting diodes with supplemental blue or far-redlighting. J. Am. Soc. Hortic. Sci. 120, 808–813.
Buschmann, C., Meier, D., Kleudgen, H.K., Lichtenthaler, H.K., 1978. Regulationof chloroplast development by red and blue light. Photochem. Photobiol. 27,195–198.
Carvalho, R.F., Takaki, M., Azevedo, R.A., 2011. Plant pigments: the many faces of
ht improves acclimation and photosynthetic recovery of pepperg/10.1016/j.envexpbot.2014.06.017
light perception. Acta Physiol. Plant. 33, 241–248.Cerovic, Z.G., Ounis, A., Cartelat, A., Latouche, G., Goulas, Y., Meyer, S., Moya, I., 2002.
The use of chlorophyll fluorescence excitation spectra for the non-destructivein situ assessment of UV-absorbing compounds in leaves. Plant Cell Environ. 25,1663–1676.
ING ModelE
1 nd Ex
C
D
F
F
F
F
G
G
H
H
H
J
J
J
K
K
L
L
L
L
M
M
ARTICLEEB-2826; No. of Pages 10
0 A.M. Hoffmann et al. / Environmental a
erovic, Z.G., Masdoumier, G., Ghozlen, N.B., Latouche, G., 2012. A new optical leaf-clip meter for simultaneous non-destructive assessment of leaf chlorophyll andepidermal flavonoids. Physiol. Plant. 146, 251–260.
’Haese, D., Vandermeiren, K., Caubergs, R.J., Guisez, Y., De Temmerman, L., Hore-mans, N., 2004. Non-photochemical quenching kinetics during the dark to lighttransition in relation to the formation of antheraxanthin and zeaxanthin. J.Theor. Biol. 227, 175–186.
alcone Ferreyra, M.L., Rius, S.P., Casati, P., 2012. Flavonoids: biosynthesis, biologicalfunctions, and biotechnological applications. Front. Plant Sci. 3, 1–15.
einbaum, R.L., Storz, G., Ausubel, F.M., 1991. High intensity and blue light regu-lated expression of chimeric chalcone synthase genes in transgenic Arabidopsisthaliana plants. Mol. Gen. Genet. 226, 449–456.
lint, S.D., Caldwell, M.M., 2003. A biological spectral weighting function for ozonedepletion research with higher plants. Physiol. Plant. 117, 137–144.
rohnmeyer, H., Staiger, D., 2003. Ultraviolet-B radiation-mediated responses inplants, balancing damage and protection. Plant Physiol. 133, 1420–1428.
oulas, Y., Cerovic, Z.G., Cartelat, A., Moya, I., 2004. Dualex: a new instrument for fieldmeasurements of epidermal ultraviolet absorbance by chlorophyll fluorescence.Appl. Opt. 43, 4488–4496.
ould, K.S., 2004. Nature’s Swiss army knife: the diverse protective roles of antho-cyanins in leaves. J. Biomed. Biotechnol. 5, 314–320.
ideg, E., Jansen, M.A.K., Strid, A., 2013. UV-B exposure, ROS, and stress: inseparablecompanions or loosely linked associates? Trends Plant Sci. 18, 107–115.
ogewoning, S.W., Trouwborst, G., Maljaars, H., Poorter, H., van Ieperen, W., Harbin-son, J., 2010. Blue light dose-response of leaf photosynthesis, morphology, andchemical composition of Cucumis sativus grown under different combinationsof red and blue light. J. Exp. Bot. 61, 3107–3117.
orton, P., Ruban, A.V., Walters, R.G., 1996. Regulation of light harvesting in greenplants. Annu. Rev. Plant Physiol. Plant Mol. Biol. 47, 655–684.
arillo, J.A., Gabrys, H., Capel, J., Alonso, J.M., Ecker, J.E., Cashmore, A.R., 2001.Phototropin-related NPL1 controls chloroplast relocation induced by blue light.Nature 410, 952–954.
enkins, G.I., 2009. Signal transduction in response to UV-B radiation. Annu. Rev.Plant Biol. 60, 407–431.
ordan, B.R., 1996. The effects of ultraviolet-B radiation on plants: a molecular per-spective. Adv. Bot. Res. 22, 97–162.
agawa, T., Sakai, T., Suetsugu, N., Oikawa, K., Ishiguro, S., Kato, T., Tabata, S., Okada,K., Wada, M., 2001. Arabidopsis NPL1: a phototropin homolog controlling thechloroplast high-light avoidance response. Science 291, 2138–2141.
akani, V.G., Reddy, K.R., Zhao, D., Sailaja, K., 2003. Field crop responses toultraviolet-B radiation: a review. Agric. For. Meteorol. 120, 191–218.
ichtenthaler, H.K., Buschmann, C., 1978. Control of chloroplast development by redlight, blue light and phytohormones. In: Akoyunoglou, G., et al. (Eds.), Chloro-plast Development. Elsevier/North-Holland Biomedical Press, Amsterdam, pp.801–816.
ichtenthaler, H.K., Buschmann, C., Rahmsdorf, U., 1980. The importance of blue lightfor the development of sun-type chloroplasts. In: Senger, H. (Ed.), The Blue LightSyndrome. Springer-Verlag, Berlin Heidelberg, pp. 485–494.
ichtenthaler, H.K., Babani, F., 2004. Light adaptation and senescence of the photo-synthetic apparatus: changes in pigment composition, chlorophyll fluorescenceparameters and photosynthetic activity during light adaptation and senescenceof leaves. In: Papageorgiou, G., Govindjee (Eds.), Chlorophyll Fluorescence: ASignature of Photosynthesis. Springer, Dordrecht, pp. 713–736.
ichtenthaler, H.K., Babani, F., Navrátil, M., Buschmann, C., 2013. Chlorophyll fluores-cence kinetics, photosynthetic activity, and pigment composition of blue-shadeand half-shade leaves as compared to sun and shade leaves of different trees.Photosynth. Res., http://dx.doi.org/10.1007/s11120-013-9834-1.
Please cite this article in press as: Hoffmann, A.M., et al., High blue ligplants exposed to UV stress. Environ. Exp. Bot. (2014), http://dx.doi.or
ackerness, S.A-H., 2000. Plant responses to ultraviolet-B (UV-B: 280–320 nm)stress: what are the key regulators? Plant Growth Regul. 32, 27–39.
atsubara, S., Krause, G.H., Arande, J., Virgo, A., Beisel, K.G., Jahns, P., Winter, K., 2009.Sun-shade patterns of leaf carotenoid composition in 86 species of neotropicalforest plants. Funct. Plant Biol. 36, 20–36.
PRESSperimental Botany xxx (2014) xxx–xxx
Moon, Y.R., Lee, M.H., Tovuu, A., Lee, C.-H., Chung, B.Y., Park, Y.-l., Kim, J.-H., 2011.Acute exposure to UV-B sensitizes cucumber, tomato, and Arabidopsis plants tophotooxidative stress by inhibiting thermal energy dissipation and antioxidantdefense. J. Radiat. Res. 52, 238–248.
Morrow, R.C., 2008. LED lighting in horticulture. HortScience 43, 1947–1950.Murchie, E.H., Lawson, T., 2013. Chlorophyll fluorescence analysis: a guide to
good practice and understanding some new applications. J. Exp. Bot. 64 (13),3983–3998.
Müller, V., Albert, A., Barbro Winkler, J., Lankes, C., Noga, G., Hunsche, M., 2013. Eco-logically relevant UV-B dose combined with high PAR intensity distinctly affectplant growth and accumulation of secondary metabolites in leaves of Centellaasiatica L. Urban. J. Photochem. Photobiol., B: Biol. 127, 161–169.
Nagatani, A., 2010. Phytochrome: structural basis for its functions. Curr. Opin. PlantBiol. 13, 565–570.
Nogués, S., Allen, D.J., Morison, J.I.L., Baker, N.R., 1999. Characterization of stomatalclosure caused by ultraviolet-b radiation. Plant Physiol. 121, 489–496.
Olsson, L.C., Veit, M., Weissenböck, G., Bornman, J.F., 1998. Differential flavonoidresponse to enhanced UV-B radiation in Brassica napus. Phytochemistry 49,1021–1028.
Sarala, M., Taulavuori, E., Karhu, J., Laine, K., Taulavuori, K., 2011. Growth and pig-mentation of various species under blue light depletion. Boreal Environ. Res. 16,381–394.
Schreiner, M., Mewis, I., Huyskens-Keil, S., Jansen, M.A.K., Zrenner, R., Win-kler, J.B., O′Brien, N., Krumbein, A., 2012. UV-B-induced secondary plantmetabolites—potential benefits for plant and human health. Crit. Rev. Plant Sci.31, 229–240.
Schellenberger Costa, B., Jungandreas, A., Jakob, T., Weisheit, W., Mittag, M., Wilhelm,C., 2013. Blue light is essential for high light acclimation and photoprotection inthe diatom Phaeodactylum tricornutum. J. Exp. Bot. 64, 483–493.
Smith, J.L., Burritt, D.J., Bannister, P., 2000. Shoot dry weight, chlorophyll and UV-Babsorbing compounds as indicators of a plant’s sensitivity to UV-B radiation.Ann. Bot. 86, 1057–1063.
Solovchenko, A.E., Chivkunova, O.B., Merzlyak, M.N., Reshetnikova, I.V., 2001. Aspectrophotometric analysis of pigments in apples. Russ. J. Plant Physiol. 48,693–700.
Solovchenko, A.E., Schmitz-Eiberger, M., 2003. Significance of skin flavonoids forUV-B-protection in apple fruits. J. Exp. Bot. 54, 1977–1984.
Stapleton, A.E., 1992. Ultraviolet radiation and plants: burning questions. Plant Cell4, 1353–1358.
Taulavuori, K., Sarala, M., Karhu, J., Taulavuori, E., Kubin, E., Laine, K., Poikolainen, J.,Personen, E., 2005. Elongation of scots pine seedlings under blue light depletion.Silva Fennica 39 (1), 131–136.
Taulavuori, K., Julkunen-Tiitto, R., Hyöky, V., Taulavuori, E., 2013. Blue mood forsuperfood. Nat. Prod. Commun. 8 (6), 791–794.
Teramura, A.H., 1980. Effects of ultraviolet-B irradiances on soybean, II. Interactionbetween ultraviolet-B and photosynthetically active radiation on net photosyn-thesis, dark respiration, and transpiration. Plant Physiol. 65, 483–488.
Teramura, A.H., 1983. Effects of ultraviolet-B radiation on the growth and yield ofcrop plants. Physiol. Plant. 58, 415–427.
Ziska, L.H., Teramura, A.H., Sullivan, J.H., 1992. Physiological sensitivity of plantsalong an elevational gradient to UV-B radiation. Am. J. Bot. 79, 863–871.
Vass, I., Szilárd, A., Sicora, C., 2005. Adverse effects of UV-B light on the structureand function of the photosynthetic apparatus. In: Pessarakli, M. (Ed.), Handbookof Photosynthesis. , second ed. Taylor and Francis Group, Boca Raton, FL, pp.827–845.
Wade, H.K., Bibikova, T.N., William, J.V., Jenkins, G.I., 2001. Interactions within anetwork of phytochrome, cryptochrome and UV-B phototransduction pathways
ht improves acclimation and photosynthetic recovery of pepperg/10.1016/j.envexpbot.2014.06.017
regulate chalcone synthase gene expression in Arabidopsis leaf tissue. Plant J. 25,675–685.
Wada, M., 2013. Chloroplast movement. Plant Sci. 210, 177–182.Walters, R.G., 2005. Towards an understanding of photosynthetic acclimation. J. Exp.
Bot. 56, 435–447.