Embed Size (px)
Citation preview

EMANUEL BOMBASARO
TITAN 1
TITANHigh
Altitude Balloon - Miss
ion1
FLIGHT DATA REPORT
Copyright c⃝ 2016 Emanuel Bombasaro
contact via e-mail at [email protected].
This document is distributed in the hope that it will be useful, but without any warranty,without even the implied warranty of merchantability or fitness for a particular purpose.No guarantee is given for the accuracy, precision or reliability of the calculations, codeand data stated, and you use it entirely at your own risk.
Permission is granted to distribute verbatim copies of this document and included sourcecode. You are allowed to modify one or all of the source code files if and only if youchange the name of the modified file. You are allowed to distribute the modified files butonly together with the unmodified versions. You have to document all changes and thename of the author of the changes. No other permissions to copy or distribute this file inany form are granted. You are not allowed to take money for the distribution or use ofeither this file or a changed version, except for a nominal charge for copying etc..
Update published, April 2016

Titan
1. Greek Mythology any of the older gods who preceded the Olympians and were thechildren of Uranus (Heaven) and Gaia (Earth). Led by Cronus, they overthrewUranus; Cronus’ son, Zeus, then rebelled against his father and eventually defeatedthe Titans.(as nouna titan) a person or thing of very great strength, intellect, or importance:a titan of American industry.
2. Astronomy the largest satellite of Saturn (diameter 5150 km), the fifteenth closestto the planet, discovered by C. Huygens in 1655. It is unique in having a hazyatmosphere of nitrogen, methane, and oily hydrocarbons.
Contents
1 Preliminaries 6
2 Mission Log 7
2.1 06:15 UTC till 10:00 UTC - Preparation in Mission Base and Trip to LaunchSite . . . . . . . . . . . . . . . . . . . . . . . . . . . . . . . . . . . . . . . . 7
2.2 10:00 UTC till 10:57 UTC - Launch Site Preparation . . . . . . . . . . . . 7
2.3 10:57 UTC till 14:14 UTC - Tracking . . . . . . . . . . . . . . . . . . . . . 9
2.4 14:15 UTC - Recovery . . . . . . . . . . . . . . . . . . . . . . . . . . . . . 9
3 Equipment Operation Review 10
3.1 Flight Computer, GPS and Transmission . . . . . . . . . . . . . . . . . . . 10
3.2 Image Capturing . . . . . . . . . . . . . . . . . . . . . . . . . . . . . . . . 10
3.3 Sensors . . . . . . . . . . . . . . . . . . . . . . . . . . . . . . . . . . . . . . 11
3.4 Flight Control Centre . . . . . . . . . . . . . . . . . . . . . . . . . . . . . . 11
3.5 Flight Characteristics . . . . . . . . . . . . . . . . . . . . . . . . . . . . . . 11
3.5.1 Ascent . . . . . . . . . . . . . . . . . . . . . . . . . . . . . . . . . . 13
3.5.2 Descent . . . . . . . . . . . . . . . . . . . . . . . . . . . . . . . . . 14
4 Flight Path 15
4.1 Flight Path Comparison . . . . . . . . . . . . . . . . . . . . . . . . . . . . 15
4.2 Flight Velocity and Direction . . . . . . . . . . . . . . . . . . . . . . . . . 19
5 Tracking 20
6 Image Analysis 22
6.1 Moon . . . . . . . . . . . . . . . . . . . . . . . . . . . . . . . . . . . . . . . 22
Copyright c⃝ 2016 Emanuel Bombasaro, Titan – High Altitude Balloon Mission 1 4/44
6.2 Balloon Burst . . . . . . . . . . . . . . . . . . . . . . . . . . . . . . . . . . 24
6.3 Cloud . . . . . . . . . . . . . . . . . . . . . . . . . . . . . . . . . . . . . . 24
7 Sensed Parameters 25
7.1 Temperature . . . . . . . . . . . . . . . . . . . . . . . . . . . . . . . . . . . 25
7.2 Relative Humidity . . . . . . . . . . . . . . . . . . . . . . . . . . . . . . . 27
7.3 Pressure and Altitude . . . . . . . . . . . . . . . . . . . . . . . . . . . . . 28
8 Payload Motion 29
9 Conclusion 33
A Diagrams of Raw Logged Data 34
A.1 Flight Computer Data . . . . . . . . . . . . . . . . . . . . . . . . . . . . . 34
A.2 GPS Location . . . . . . . . . . . . . . . . . . . . . . . . . . . . . . . . . . 35
A.3 Check Status GPS . . . . . . . . . . . . . . . . . . . . . . . . . . . . . . . 36
A.4 Luminosity, Temperature and Relative Humidity Sensor . . . . . . . . . . . 37
A.5 External Pressure Sensors Readings . . . . . . . . . . . . . . . . . . . . . . 38
A.6 Precision Temperature Sensor . . . . . . . . . . . . . . . . . . . . . . . . . 39
A.7 Internal Pressure Sensor Readings . . . . . . . . . . . . . . . . . . . . . . . 40
A.8 Gyroscope Sensor Readings . . . . . . . . . . . . . . . . . . . . . . . . . . 41
A.9 Accelerometer Sensor Readings . . . . . . . . . . . . . . . . . . . . . . . . 42
A.10 Magnetometer Sensor Readings . . . . . . . . . . . . . . . . . . . . . . . . 43
A.11 Roll, Pitch and Heading . . . . . . . . . . . . . . . . . . . . . . . . . . . . 44
Copyright c⃝ 2016 Emanuel Bombasaro, Titan – High Altitude Balloon Mission 1 5/44
1 Preliminaries
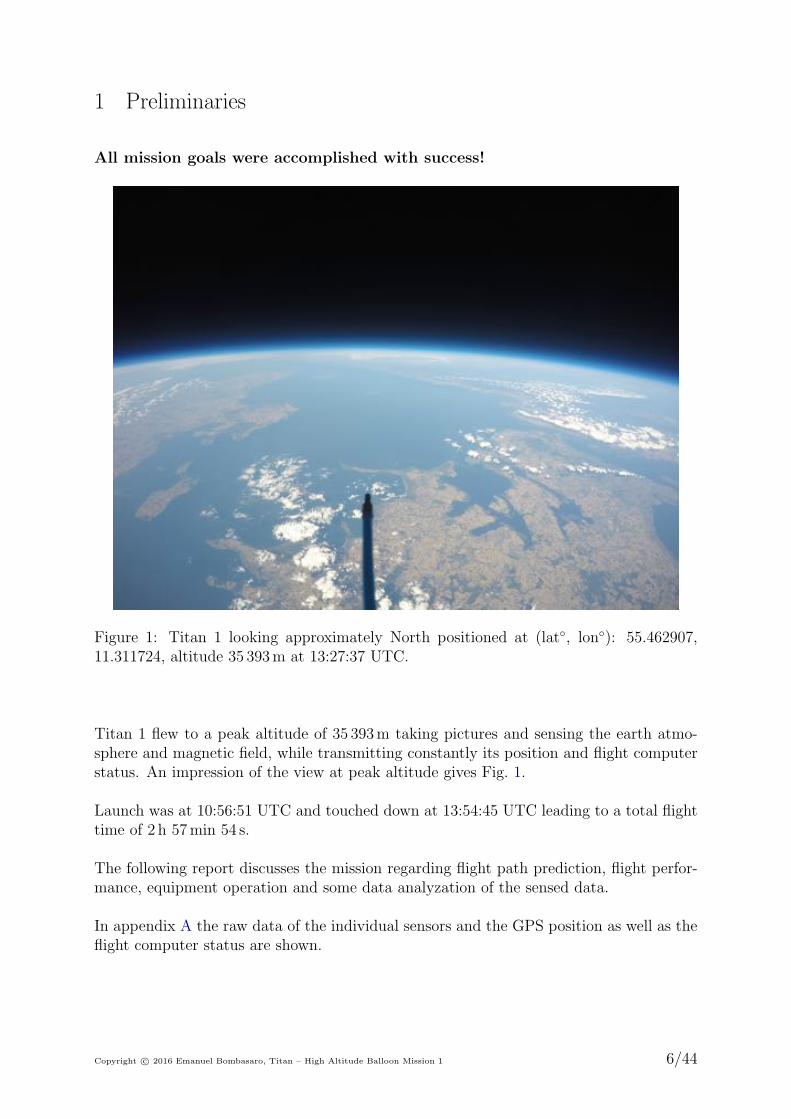
All mission goals were accomplished with success!
Figure 1: Titan 1 looking approximately North positioned at (lat◦, lon◦): 55.462907,11.311724, altitude 35 393m at 13:27:37 UTC.
Titan 1 flew to a peak altitude of 35 393m taking pictures and sensing the earth atmo-sphere and magnetic field, while transmitting constantly its position and flight computerstatus. An impression of the view at peak altitude gives Fig. 1.
Launch was at 10:56:51 UTC and touched down at 13:54:45 UTC leading to a total flighttime of 2 h 57min 54 s.
The following report discusses the mission regarding flight path prediction, flight perfor-mance, equipment operation and some data analyzation of the sensed data.
In appendix A the raw data of the individual sensors and the GPS position as well as theflight computer status are shown.
Copyright c⃝ 2016 Emanuel Bombasaro, Titan – High Altitude Balloon Mission 1 6/44
2 Mission Log
2.1 06:15 UTC till 10:00 UTC - Preparation in Mission Baseand Trip to Launch Site
Before driving to the launch site all system were checked at the mission base. Especiallytransmission, power and image capturing. After the checks Titan 1 was assembled andpacked to be ready for transport to launch site. The total weight of the payload withlines and parachute was checked resulting to 729 g, thus 9 g more than the design.
Further, a new prediction of the flight path was done to see possible deviations air trafficcontrol should be informed about.
After packing all the individual parts, strictly following the checklists, the launch teamdrove to the launch site and arrived before the target time of 10:00 UTC.
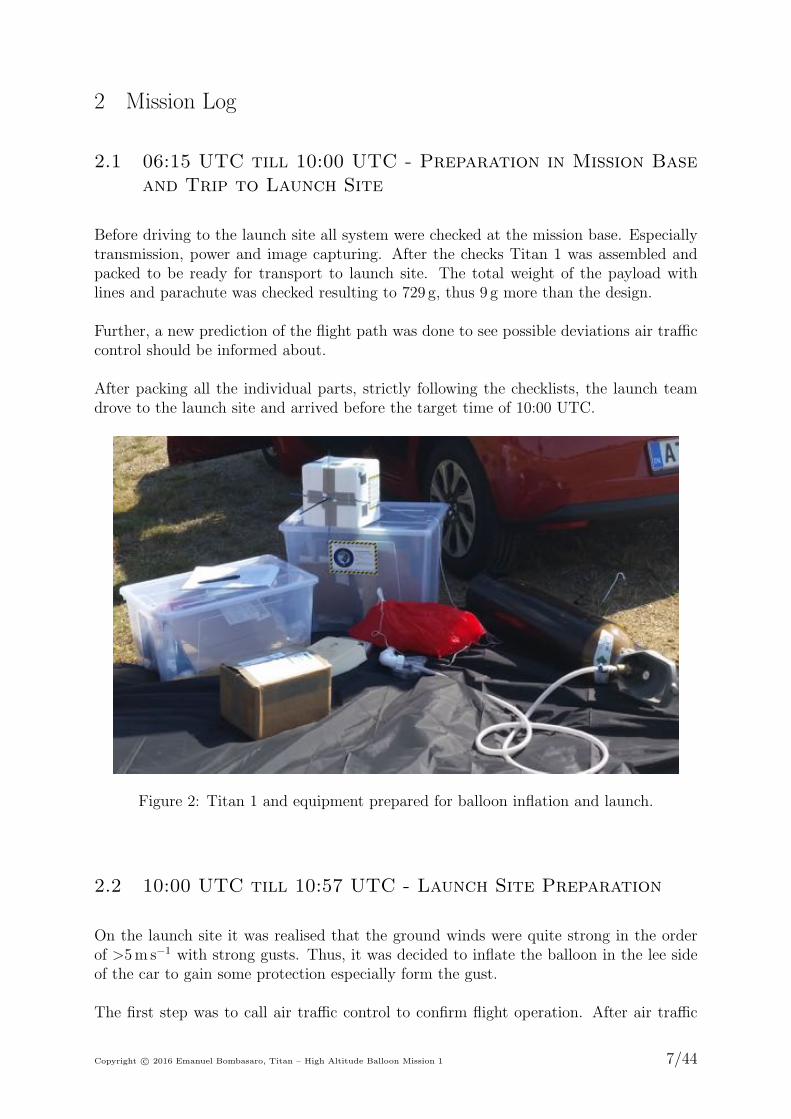
Figure 2: Titan 1 and equipment prepared for balloon inflation and launch.
2.2 10:00 UTC till 10:57 UTC - Launch Site Preparation
On the launch site it was realised that the ground winds were quite strong in the orderof >5m s−1 with strong gusts. Thus, it was decided to inflate the balloon in the lee sideof the car to gain some protection especially form the gust.
The first step was to call air traffic control to confirm flight operation. After air traffic
Copyright c⃝ 2016 Emanuel Bombasaro, Titan – High Altitude Balloon Mission 1 7/44
control stated free to go, the equipment was unpacked and everything prepared for ballooninflation and launch. Fig. 2 shows Titan 1 after startup and with hatch already sealed.Before sealing the hatch transmission and image capturing was checked carefully.
The strong wind gust made the inflation of the balloon very difficult. Not only was itdifficult to hold the balloon stable and away from obstacles, but a lot of care had to betaken in order to distinguish balloon lift from air drag lift.
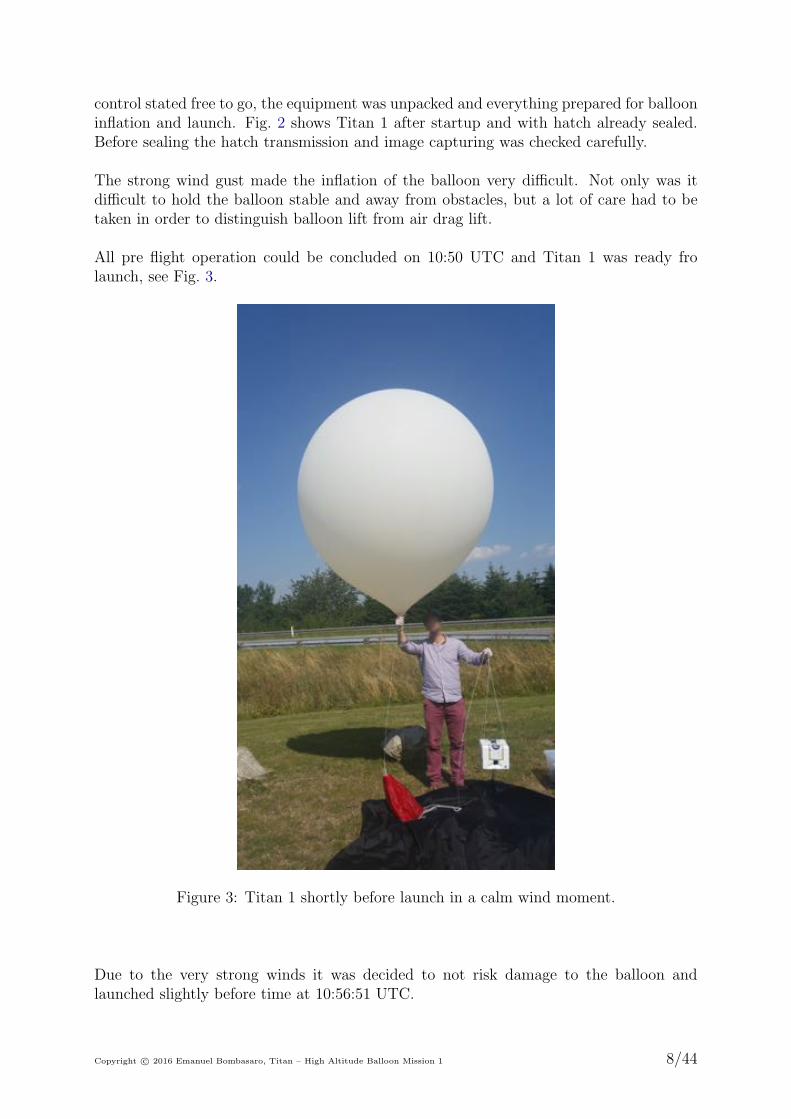
All pre flight operation could be concluded on 10:50 UTC and Titan 1 was ready frolaunch, see Fig. 3.
Figure 3: Titan 1 shortly before launch in a calm wind moment.
Due to the very strong winds it was decided to not risk damage to the balloon andlaunched slightly before time at 10:56:51 UTC.
Copyright c⃝ 2016 Emanuel Bombasaro, Titan – High Altitude Balloon Mission 1 8/44
2.3 10:57 UTC till 14:14 UTC - Tracking
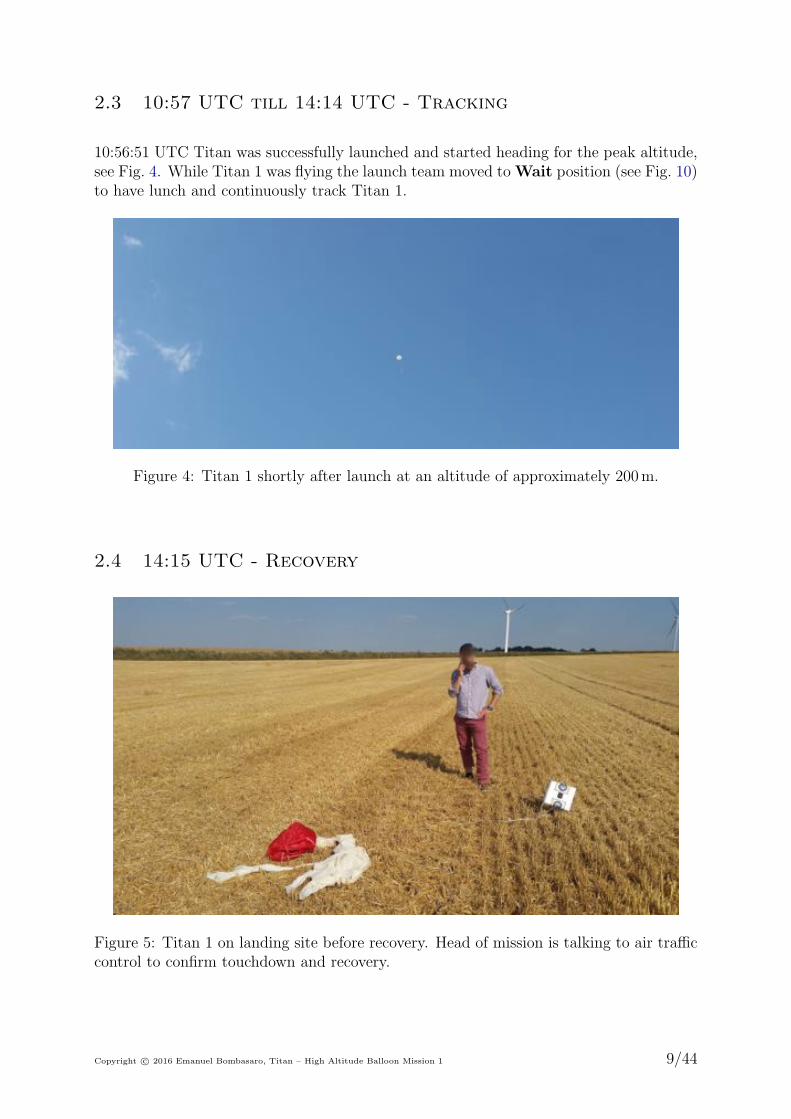
10:56:51 UTC Titan was successfully launched and started heading for the peak altitude,see Fig. 4. While Titan 1 was flying the launch team moved to Wait position (see Fig. 10)to have lunch and continuously track Titan 1.
Figure 4: Titan 1 shortly after launch at an altitude of approximately 200m.
2.4 14:15 UTC - Recovery
Figure 5: Titan 1 on landing site before recovery. Head of mission is talking to air trafficcontrol to confirm touchdown and recovery.
Copyright c⃝ 2016 Emanuel Bombasaro, Titan – High Altitude Balloon Mission 1 9/44
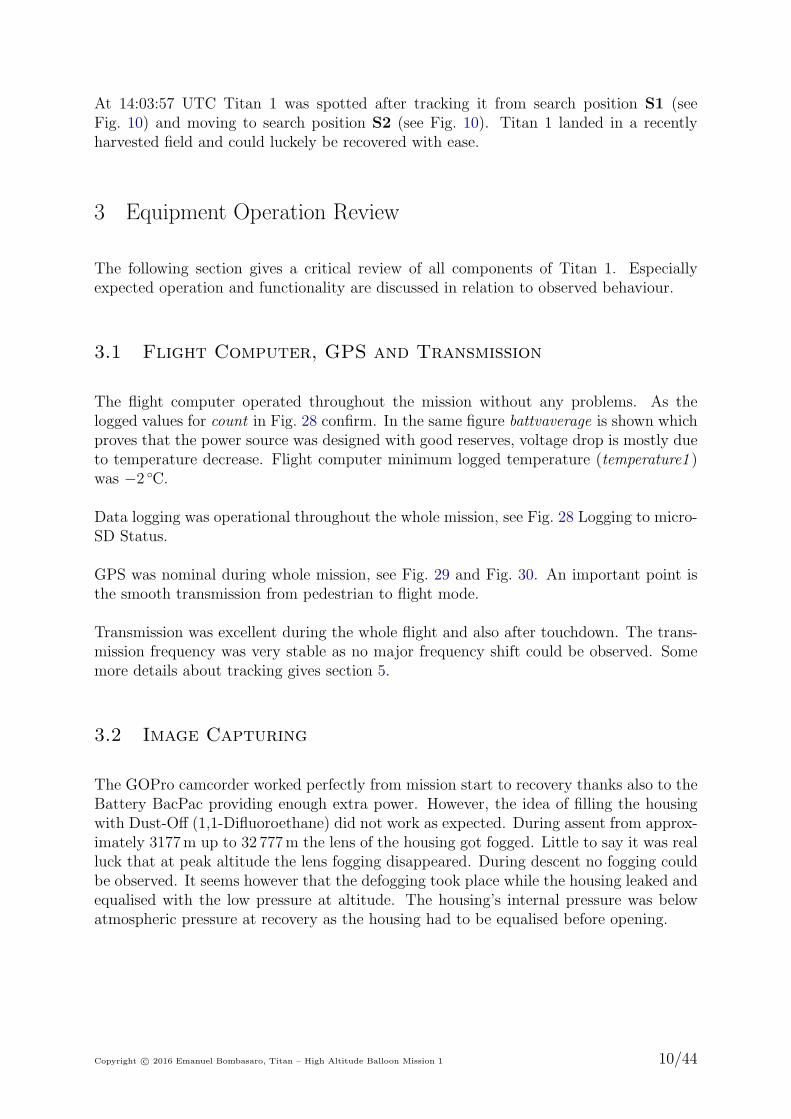
At 14:03:57 UTC Titan 1 was spotted after tracking it from search position S1 (seeFig. 10) and moving to search position S2 (see Fig. 10). Titan 1 landed in a recentlyharvested field and could luckely be recovered with ease.
3 Equipment Operation Review
The following section gives a critical review of all components of Titan 1. Especiallyexpected operation and functionality are discussed in relation to observed behaviour.
3.1 Flight Computer, GPS and Transmission
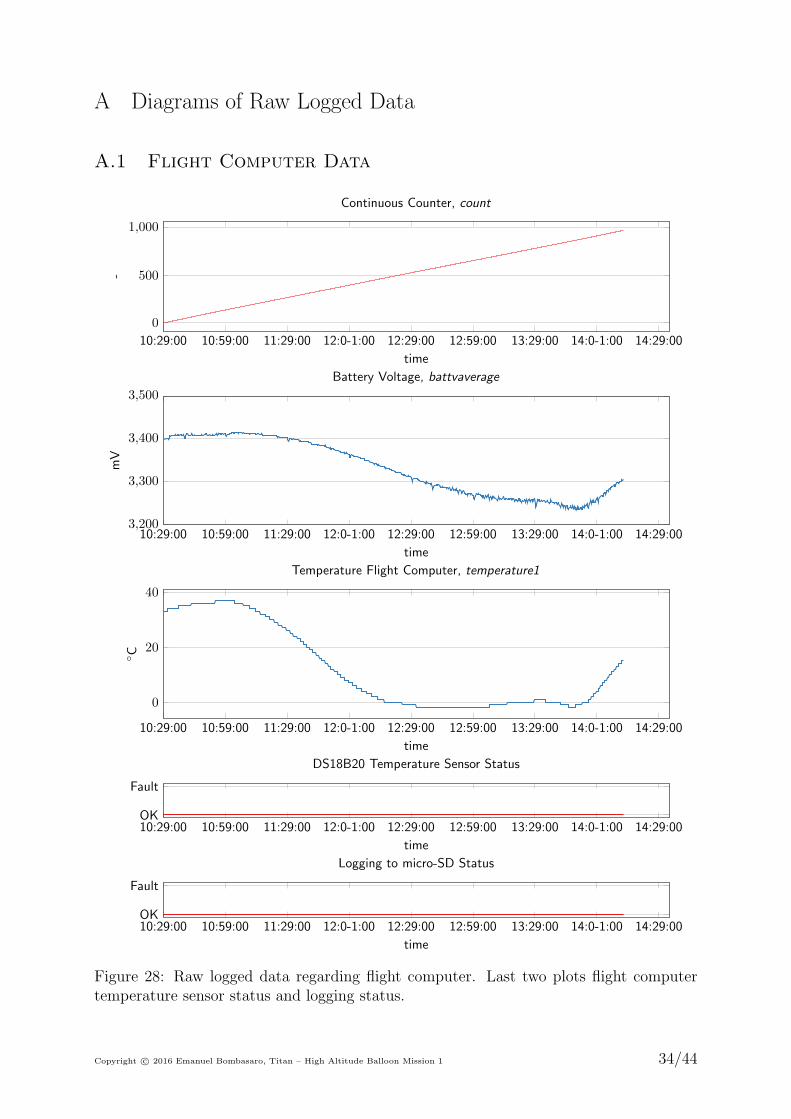
The flight computer operated throughout the mission without any problems. As thelogged values for count in Fig. 28 confirm. In the same figure battvaverage is shown whichproves that the power source was designed with good reserves, voltage drop is mostly dueto temperature decrease. Flight computer minimum logged temperature (temperature1 )was −2 ◦C.
Data logging was operational throughout the whole mission, see Fig. 28 Logging to micro-SD Status.
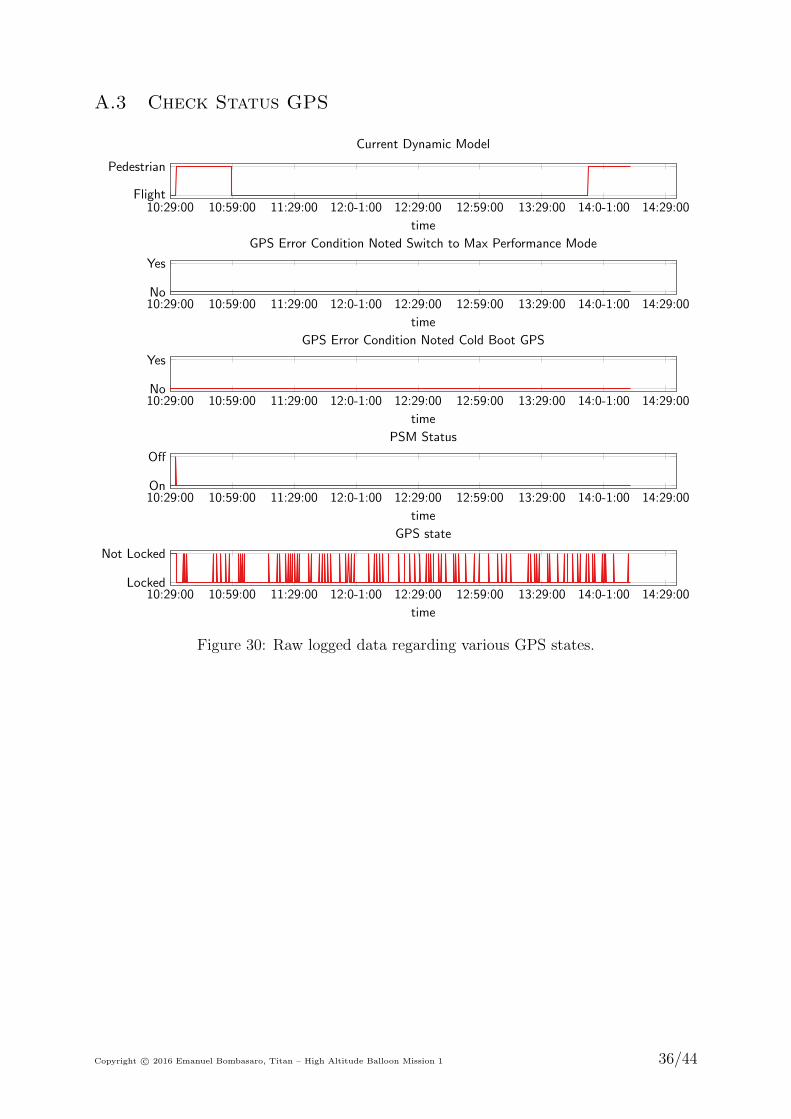
GPS was nominal during whole mission, see Fig. 29 and Fig. 30. An important point isthe smooth transmission from pedestrian to flight mode.
Transmission was excellent during the whole flight and also after touchdown. The trans-mission frequency was very stable as no major frequency shift could be observed. Somemore details about tracking gives section 5.
3.2 Image Capturing
The GOPro camcorder worked perfectly from mission start to recovery thanks also to theBattery BacPac providing enough extra power. However, the idea of filling the housingwith Dust-Off (1,1-Difluoroethane) did not work as expected. During assent from approx-imately 3177m up to 32 777m the lens of the housing got fogged. Little to say it was realluck that at peak altitude the lens fogging disappeared. During descent no fogging couldbe observed. It seems however that the defogging took place while the housing leaked andequalised with the low pressure at altitude. The housing’s internal pressure was belowatmospheric pressure at recovery as the housing had to be equalised before opening.
Copyright c⃝ 2016 Emanuel Bombasaro, Titan – High Altitude Balloon Mission 1 10/44
3.3 Sensors
Apart from the luminosity sensor TSL2561 and the pressure sensor MPL3115A2 all sensorsperformed exceptionally well.
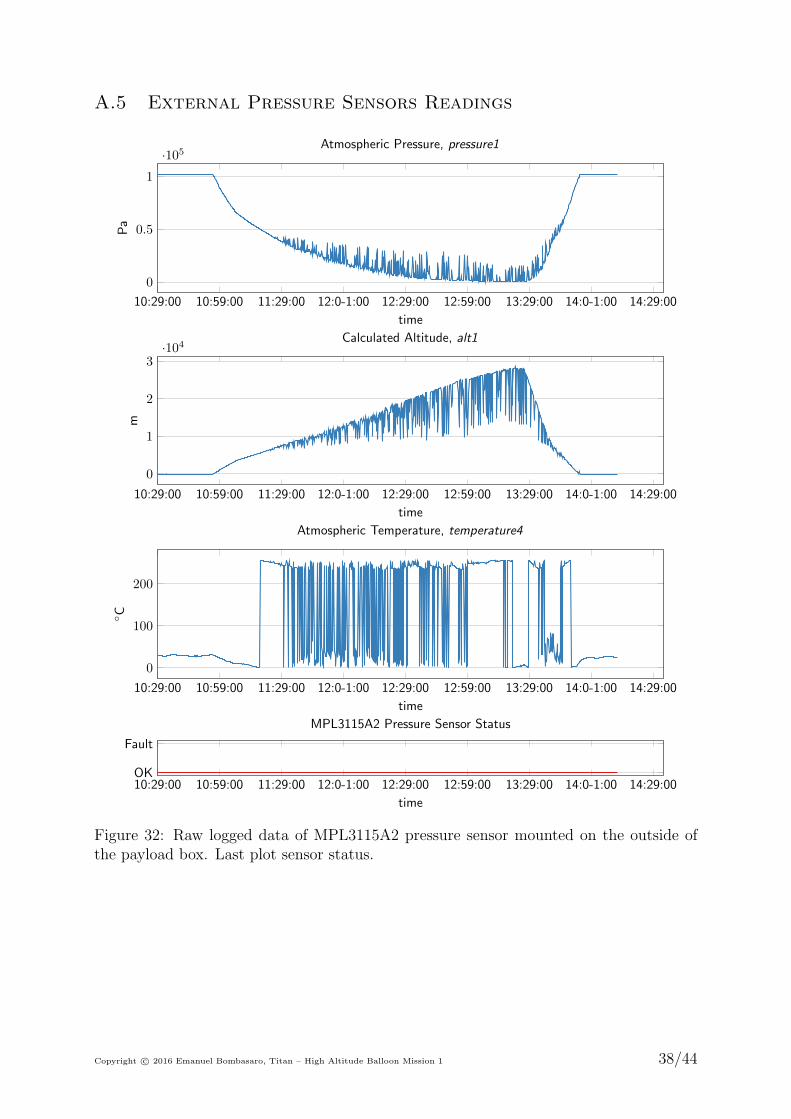
What caused the strange jumps and errors in the MPL3115A2 pressure and temperaturereadings is not fully clear. However, it looks like reading from the sensor is not donecorrectly, this holds particularly for the temperature reading were temperature valuesbelow zero are all ambiguous, whereas positive temperatures are shown correctly, seeFig. 32.
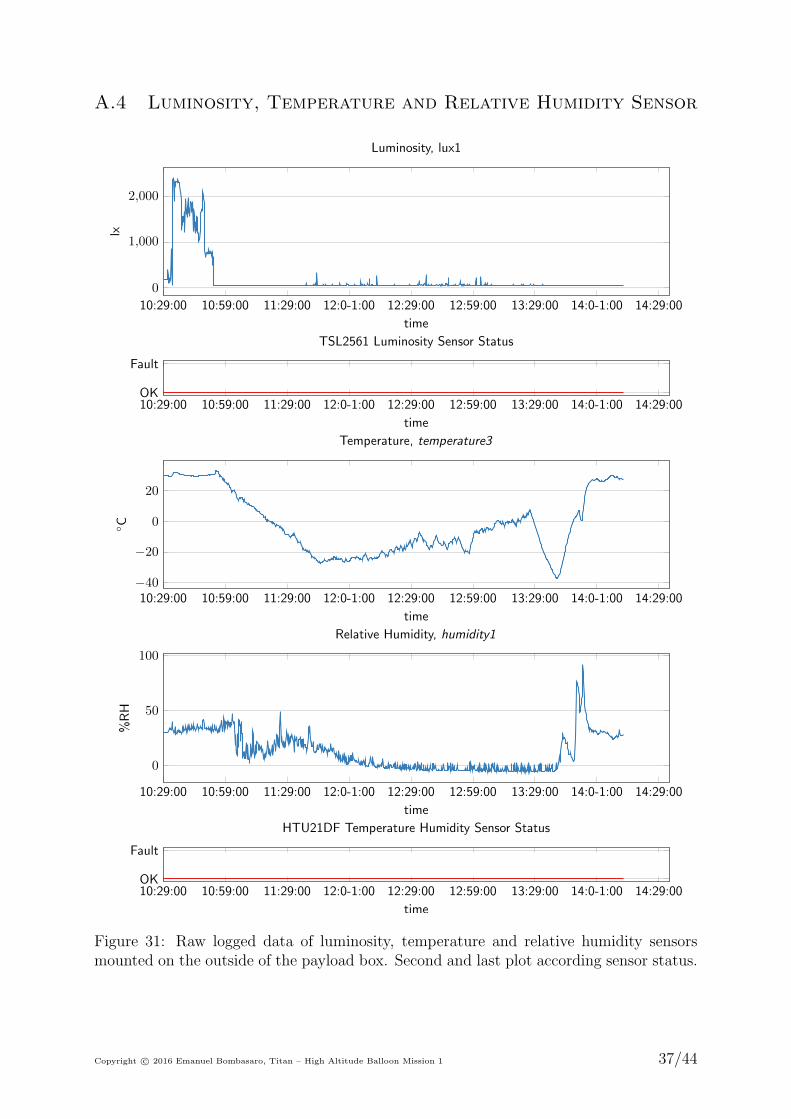
Tests conducted after the flight with the luminosity sensor TSL2561 resulted in followingexplanation for the errors readings. It seems as if too strong light hits the sensors it getsaturated resulting in an ambiguous reading of 53 lx, see Fig. 31.
Before using both sensors in future mission a careful check will be conducted in order tounderstand operability during high altitude missions.
A remark has to be given on the calibration the magnetometer sensor readings. Thesensor was calibrated the morning before driving to the launch site. However, (as notreally surprising) the calibration is not too accurate when at the launch site. It wastried to calibrate from the raw logged magnetometer sensor readings, but leading to notsatisfying results. Next time the calibration will take place on site before launch.
3.4 Flight Control Centre
During flight operation a bug was identified in the Flight Control Centre. The defaultvariable in case the user location could not be obtained was not set properly and leadingto the map to not visualise properly. Defining the variable properly solved the problem.
3.5 Flight Characteristics
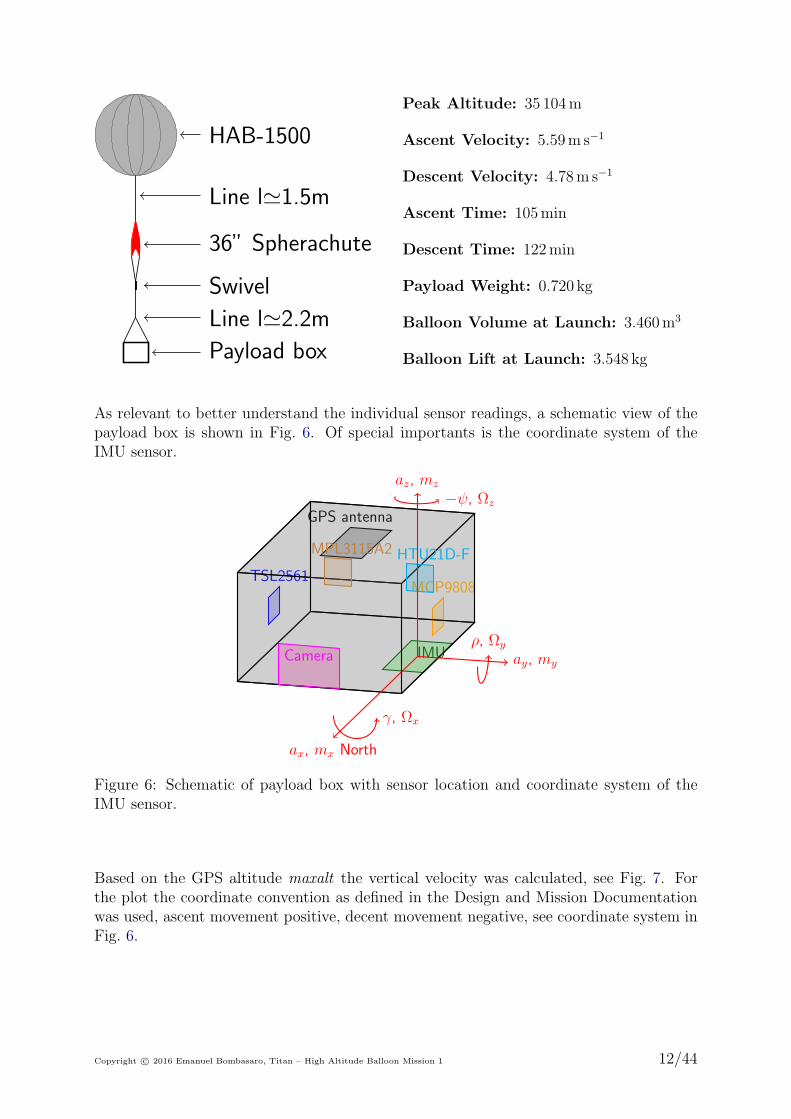
Probably the most difficult part during design of a high altitude balloon is the predictionof its behaviour. In the Design and Mission Documentation the main technical charac-teristics of Titan 1 are stated and the most relevant parameter as per design are:
Copyright c⃝ 2016 Emanuel Bombasaro, Titan – High Altitude Balloon Mission 1 11/44
HAB-1500
Line l'1.5m
36” Spherachute LT
Swivel
Line l'2.2m
Payload box
Peak Altitude: 35 104m
Ascent Velocity: 5.59m s−1
Descent Velocity: 4.78m s−1
Ascent Time: 105min
Descent Time: 122min
Payload Weight: 0.720 kg
Balloon Volume at Launch: 3.460m3
Balloon Lift at Launch: 3.548 kg
As relevant to better understand the individual sensor readings, a schematic view of thepayload box is shown in Fig. 6. Of special importants is the coordinate system of theIMU sensor.
IMU
MCP9808TSL2561
GPS antenna
Camera
HTU21D-FMPL3115A2
ax
, mx
North
ay
, my
az
, mz
� , ⌦z
⇢, ⌦y
�, ⌦x
Figure 6: Schematic of payload box with sensor location and coordinate system of theIMU sensor.
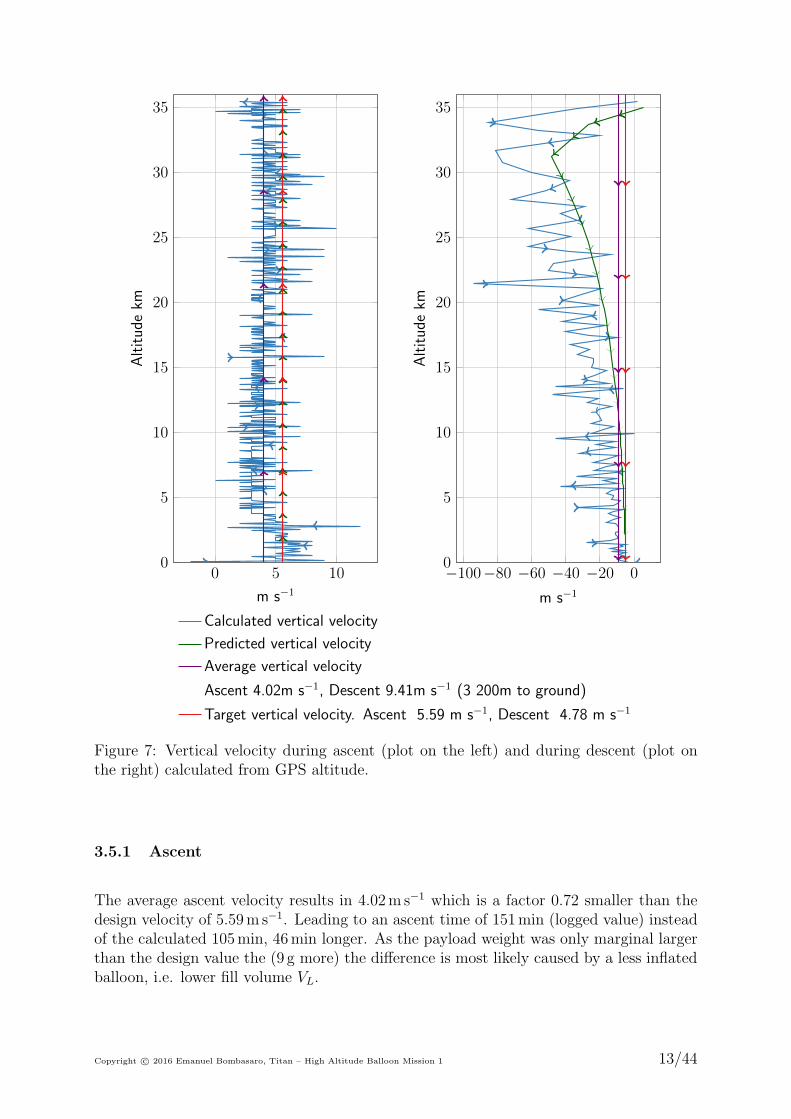
Based on the GPS altitude maxalt the vertical velocity was calculated, see Fig. 7. Forthe plot the coordinate convention as defined in the Design and Mission Documentationwas used, ascent movement positive, decent movement negative, see coordinate system inFig. 6.
Copyright c⃝ 2016 Emanuel Bombasaro, Titan – High Altitude Balloon Mission 1 12/44
0 5 100
5
10
15
20
25
30
35
m s�1
Altitud
ekm
Calculated vertical velocity
Predicted vertical velocity
Average vertical velocity
Ascent 4.02m s�1, Descent 9.41m s�1 (3 200m to ground)
Target vertical velocity. Ascent 5.59 m s�1, Descent 4.78 m s�1
�100�80 �60 �40 �20 00
5
10
15
20
25
30
35
m s�1
Altitud
ekm
Figure 7: Vertical velocity during ascent (plot on the left) and during descent (plot onthe right) calculated from GPS altitude.
3.5.1 Ascent
The average ascent velocity results in 4.02m s−1 which is a factor 0.72 smaller than thedesign velocity of 5.59m s−1. Leading to an ascent time of 151min (logged value) insteadof the calculated 105min, 46min longer. As the payload weight was only marginal largerthan the design value the (9 g more) the difference is most likely caused by a less inflatedballoon, i.e. lower fill volume VL.
Copyright c⃝ 2016 Emanuel Bombasaro, Titan – High Altitude Balloon Mission 1 13/44

Back calculating with the formula for the burst altitude
HB = −RTB
gMln
!d3L,reald3B
"= −RTB
gMln
#$dL,real9.45m
%3&= 35393m, (1)
results in dL,real = 1.740m with TB estimated as 238.15K. All other values kindly seeDesign and Mission Documentation. The launch volume results in
VL,real =4
3π
$dL,real
2
%3
=4
3π
$1.740m
2
%3
≈ 2.756m3. (2)
The balloon volume at launch was designed to be 3.460m3 which is 1.25 times more. Thusthe real balloon gross lift GL,real at launch is
GL,real = ρ̇4
3π
$dLr
2
%3
= 1.0255kgm−3 · 2.756m3 = 2.827kg (3)
and thus the free lift FL,real
FL,real = (GL,real −mP −mB) g = (2.827kg − 0.729kg − 1.500kg) g = 5.86N. (4)
The ascent velocity va,real results to
va,real =
'2 FL,real
Cd ρAir π (dL,real/2)2 =
'2 · 5.86N
0.25 · 1.2041 · π (1.740m/2)2= 4.05ms−1, (5)
which correspond perfectly to the average ascent velocity of 4.02m s−1.
3.5.2 Descent
The average descent velocity is 9.41m s−1, which is 1.97 times lager than the calculateddescent speed of 4.78m s−1. The descent time was 27min instead of the calculated 122min,thus 95min shorter. This is as such not suppressing as the average descent velocity ismore like a target touchdown velocity and as such only true for the last couple of hundredmeters above ground.
The faster descent is caused partly by the additional weight of the remains of the burstballoon mB which is 920 g and the fact that the lines got wrapped around the parachute’sline, see Fig. 8. When looking at Fig. 7 it becomes clear that the descent velocity (notsurprisingly) reduced as more Titan 1 descent into denser atmospheric layers. Thus, theaverage descent velocity is taken only for 3200m altitude to ground.
Estimating the descent velocity vd,real with reduced parachute opening diameter dP,realleads to
vd,real =
'2 (mP +mB) g
Cd,P ρAir π (dP,real/2)2 =
'2 · (0.729 + 0.920) · g
0.78 · 1.2041 · π (0.700m/2)2= 9.46ms−1. (6)
Copyright c⃝ 2016 Emanuel Bombasaro, Titan – High Altitude Balloon Mission 1 14/44

The parachute opening diameter dP,real was chosen with 0.700m to fit the average descentvelocity of 9.41m s−1. Comparing with the parachute opening in Fig. 8 the value seemsabout correct. Some more discussion regarding descent behaviour is given in section 8.
Figure 8: Titan’s parachute with balloon remains wrapped around the parachute’s lines.This image proofs that the parachute opened during descent, even if not fully.
4 Flight Path
Following paragraph discussed the the flight path of Titan 1 especially in comparisonwith the prediction made prior to the flight. Further, the flight direction and velocity isdiscussed, see section 4.2.
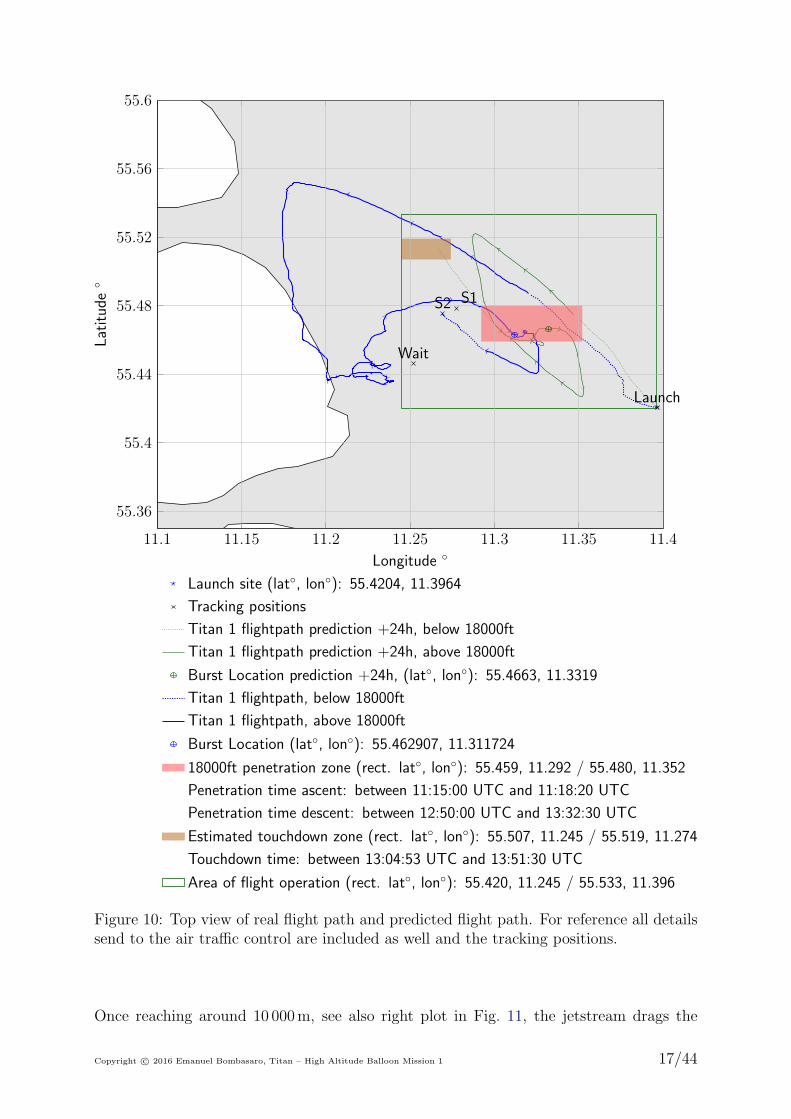
4.1 Flight Path Comparison
In section 3.5.1 the ascent velocity and in section 3.5.2 the descent velocity were discussed.These two values are fundamental in order to understand deviations from the flight pathdocumented in Fig. 9, Fig. 10 and Fig. 11.
Staring with Fig. 10 allows to get a fast inside into what caused deviations from the
Copyright c⃝ 2016 Emanuel Bombasaro, Titan – High Altitude Balloon Mission 1 15/44
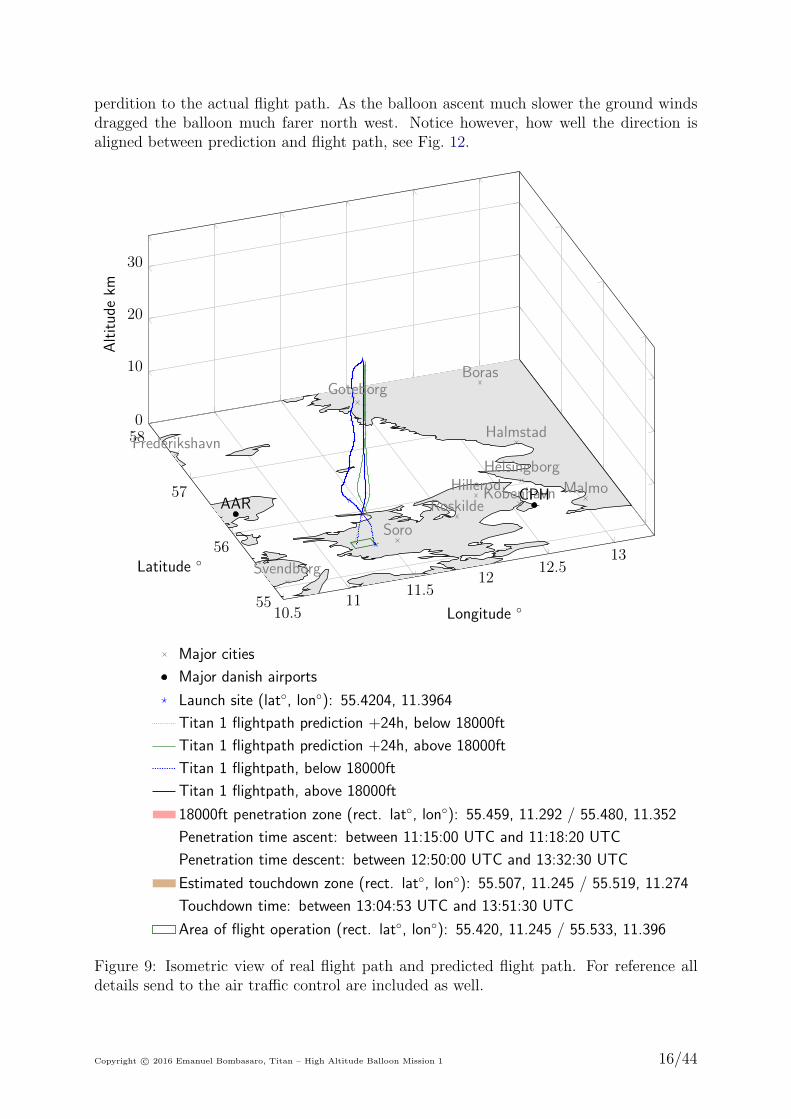
perdition to the actual flight path. As the balloon ascent much slower the ground windsdragged the balloon much farer north west. Notice however, how well the direction isaligned between prediction and flight path, see Fig. 12.
10.511
11.512
12.513
55
56
57
580
10
20
30
Hillerod
Soro
Roskilde
Halmstad
Boras
Helsingborg
Svendborg
Frederikshavn
Goteborg
MalmoKobenhavnAAR
CPH
Longitude �
Latitude �
Altitud
ekm
Major cities
Major danish airports
Launch site (lat�, lon�): 55.4204, 11.3964
Titan 1 flightpath prediction +24h, below 18000ft
Titan 1 flightpath prediction +24h, above 18000ft
Titan 1 flightpath, below 18000ft
Titan 1 flightpath, above 18000ft
18000ft penetration zone (rect. lat�, lon�): 55.459, 11.292 / 55.480, 11.352
Penetration time ascent: between 11:15:00 UTC and 11:18:20 UTC
Penetration time descent: between 12:50:00 UTC and 13:32:30 UTC
Estimated touchdown zone (rect. lat�, lon�): 55.507, 11.245 / 55.519, 11.274
Touchdown time: between 13:04:53 UTC and 13:51:30 UTC
Area of flight operation (rect. lat�, lon�): 55.420, 11.245 / 55.533, 11.396
Figure 9: Isometric view of real flight path and predicted flight path. For reference alldetails send to the air traffic control are included as well.
Copyright c⃝ 2016 Emanuel Bombasaro, Titan – High Altitude Balloon Mission 1 16/44
11.1 11.15 11.2 11.25 11.3 11.35 11.4
55.36
55.4
55.44
55.48
55.52
55.56
55.6
Launch
Wait
S1
S2
Longitude
�
Latitude
�
Launch site (lat
�, lon
�): 55.4204, 11.3964
Tracking positions
Titan 1 flightpath prediction +24h, below 18000ft
Titan 1 flightpath prediction +24h, above 18000ft
Burst Location prediction +24h, (lat
�, lon
�): 55.4663, 11.3319
Titan 1 flightpath, below 18000ft
Titan 1 flightpath, above 18000ft
Burst Location (lat
�, lon
�): 55.462907, 11.311724
18000ft penetration zone (rect. lat
�, lon
�): 55.459, 11.292 / 55.480, 11.352
Penetration time ascent: between 11:15:00 UTC and 11:18:20 UTC
Penetration time descent: between 12:50:00 UTC and 13:32:30 UTC
Estimated touchdown zone (rect. lat
�, lon
�): 55.507, 11.245 / 55.519, 11.274
Touchdown time: between 13:04:53 UTC and 13:51:30 UTC
Area of flight operation (rect. lat
�, lon
�): 55.420, 11.245 / 55.533, 11.396
Figure 10: Top view of real flight path and predicted flight path. For reference all detailssend to the air traffic control are included as well and the tracking positions.
Once reaching around 10 000m, see also right plot in Fig. 11, the jetstream drags the
Copyright c⃝ 2016 Emanuel Bombasaro, Titan – High Altitude Balloon Mission 1 17/44
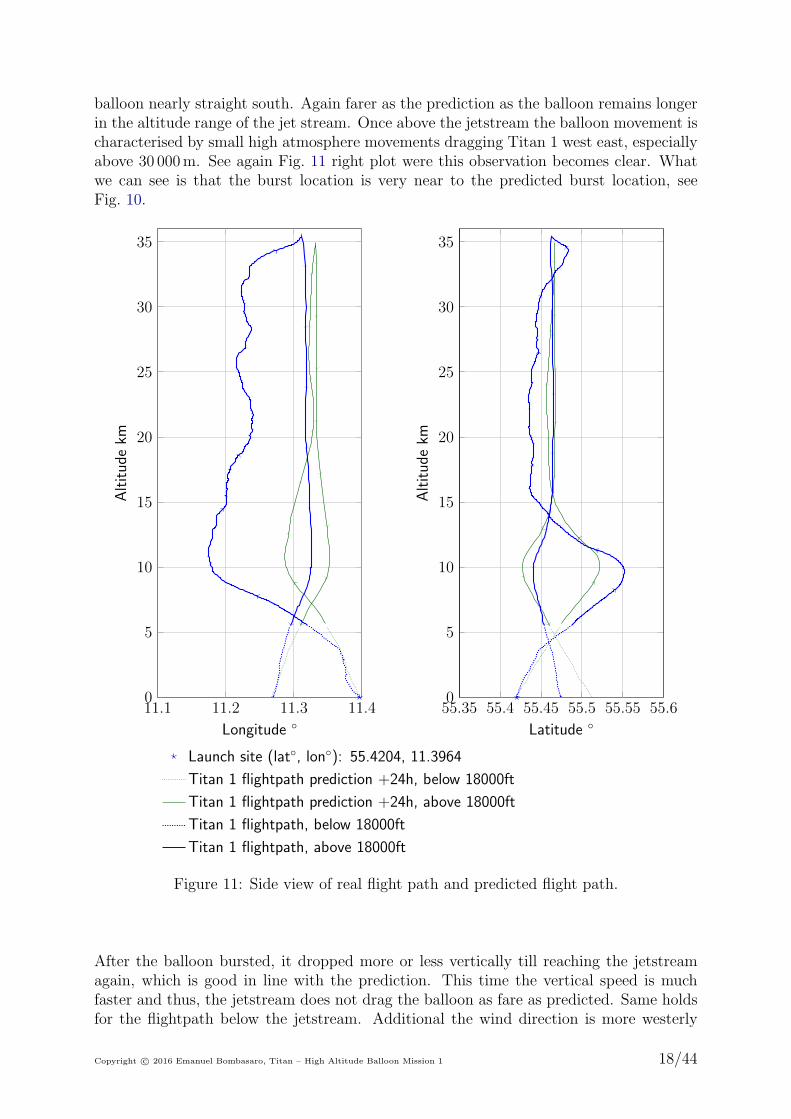
balloon nearly straight south. Again farer as the prediction as the balloon remains longerin the altitude range of the jet stream. Once above the jetstream the balloon movement ischaracterised by small high atmosphere movements dragging Titan 1 west east, especiallyabove 30 000m. See again Fig. 11 right plot were this observation becomes clear. Whatwe can see is that the burst location is very near to the predicted burst location, seeFig. 10.
11.1 11.2 11.3 11.40
5
10
15
20
25
30
35
Longitude
�
Altitudekm
Launch site (lat
�, lon
�): 55.4204, 11.3964
Titan 1 flightpath prediction +24h, below 18000ft
Titan 1 flightpath prediction +24h, above 18000ft
Titan 1 flightpath, below 18000ft
Titan 1 flightpath, above 18000ft
55.35 55.4 55.45 55.5 55.55 55.60
5
10
15
20
25
30
35
Latitude
�
Altitudekm
Figure 11: Side view of real flight path and predicted flight path.
After the balloon bursted, it dropped more or less vertically till reaching the jetstreamagain, which is good in line with the prediction. This time the vertical speed is muchfaster and thus, the jetstream does not drag the balloon as fare as predicted. Same holdsfor the flightpath below the jetstream. Additional the wind direction is more westerly
Copyright c⃝ 2016 Emanuel Bombasaro, Titan – High Altitude Balloon Mission 1 18/44
than in the prediction, see Fig. 13. This lead to Titan 1 touchdown more south thanpredicted.
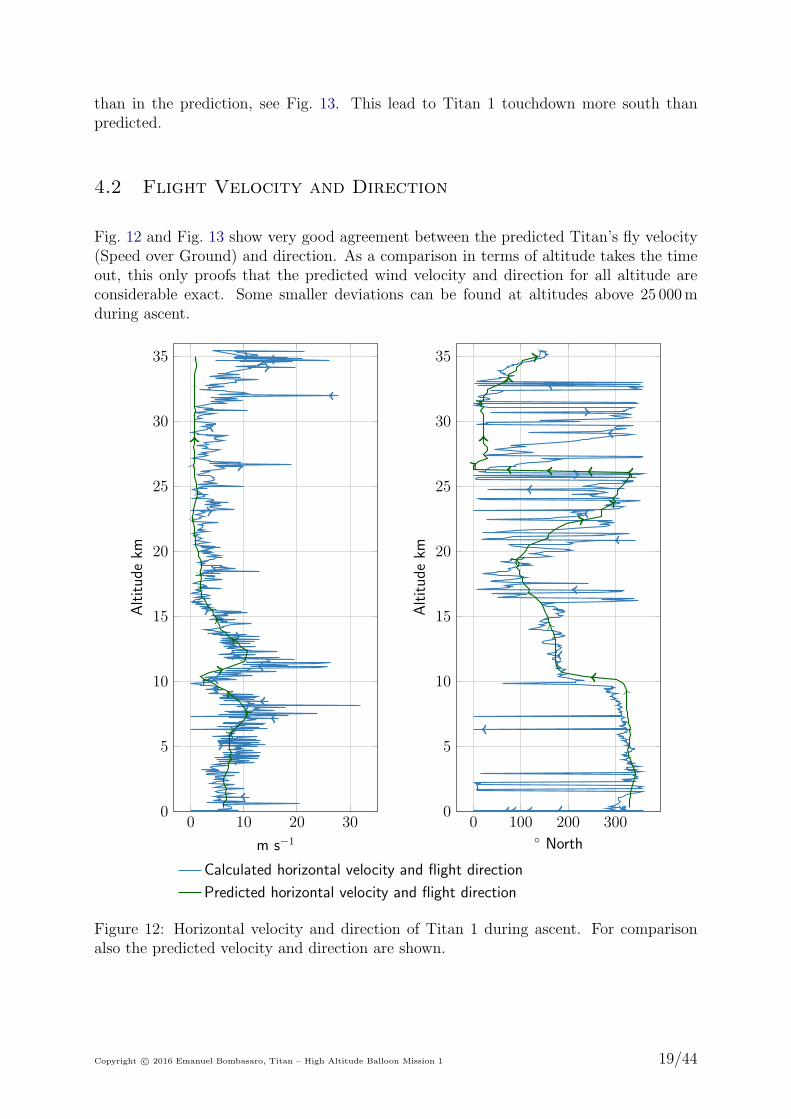
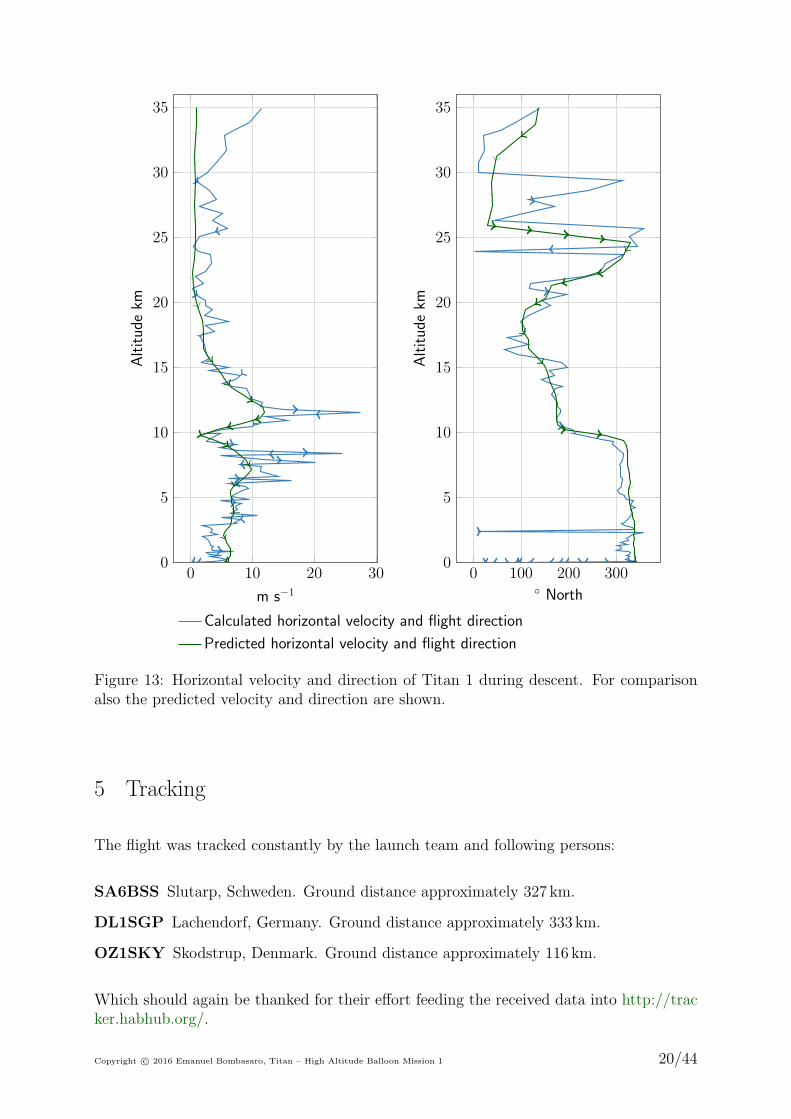
4.2 Flight Velocity and Direction
Fig. 12 and Fig. 13 show very good agreement between the predicted Titan’s fly velocity(Speed over Ground) and direction. As a comparison in terms of altitude takes the timeout, this only proofs that the predicted wind velocity and direction for all altitude areconsiderable exact. Some smaller deviations can be found at altitudes above 25 000mduring ascent.
0 10 20 300
5
10
15
20
25
30
35
m s�1
Altitud
ekm
Calculated horizontal velocity and flight direction
Predicted horizontal velocity and flight direction
0 100 200 3000
5
10
15
20
25
30
35
� North
Altitud
ekm
Figure 12: Horizontal velocity and direction of Titan 1 during ascent. For comparisonalso the predicted velocity and direction are shown.
Copyright c⃝ 2016 Emanuel Bombasaro, Titan – High Altitude Balloon Mission 1 19/44
0 10 20 300
5
10
15
20
25
30
35
m s�1
Altitud
ekm
Calculated horizontal velocity and flight direction
Predicted horizontal velocity and flight direction
0 100 200 3000
5
10
15
20
25
30
35
� North
Altitud
ekm
Figure 13: Horizontal velocity and direction of Titan 1 during descent. For comparisonalso the predicted velocity and direction are shown.
5 Tracking
The flight was tracked constantly by the launch team and following persons:
SA6BSS Slutarp, Schweden. Ground distance approximately 327 km.
DL1SGP Lachendorf, Germany. Ground distance approximately 333 km.
OZ1SKY Skodstrup, Denmark. Ground distance approximately 116 km.
Which should again be thanked for their effort feeding the received data into http://tracker.habhub.org/.
Copyright c⃝ 2016 Emanuel Bombasaro, Titan – High Altitude Balloon Mission 1 20/44
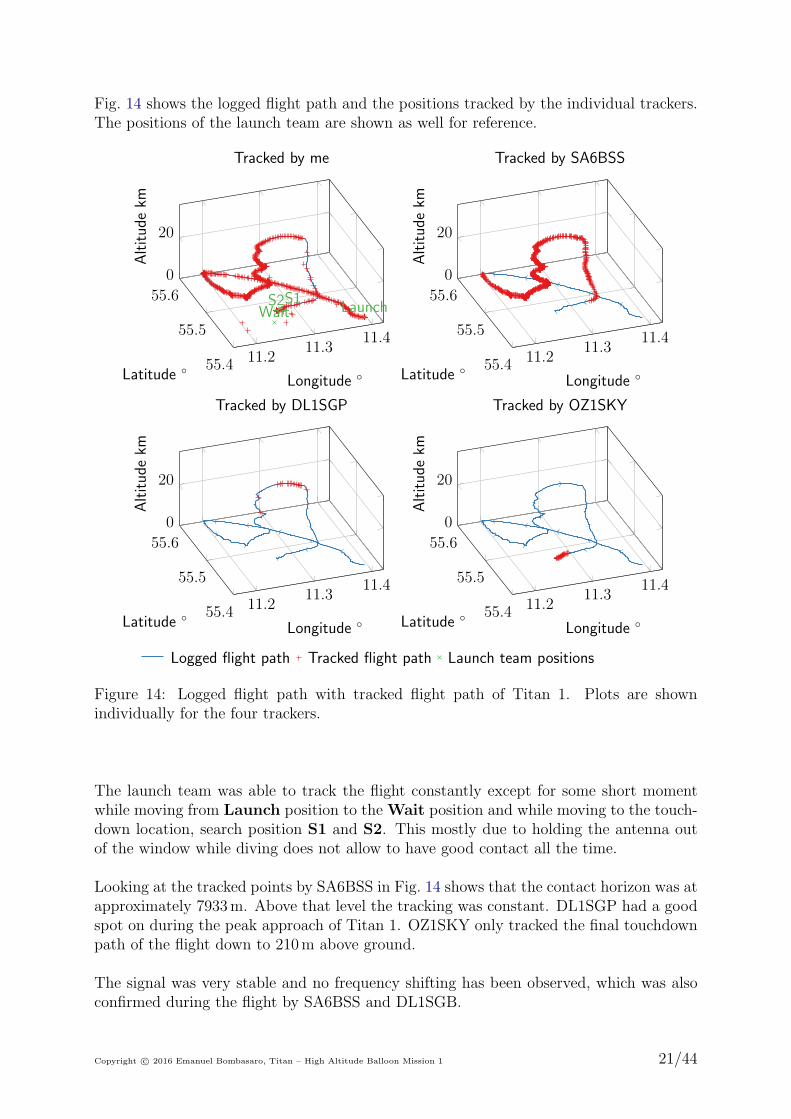
Fig. 14 shows the logged flight path and the positions tracked by the individual trackers.The positions of the launch team are shown as well for reference.
11.211.3
11.4
55.4
55.5
55.60
20
LaunchWaitS1S2
Longitude �Latitude �
Altitud
ekm
Tracked by me
11.211.3
11.4
55.4
55.5
55.60
20
Longitude �Latitude �
Altitud
ekm
Tracked by SA6BSS
11.211.3
11.4
55.4
55.5
55.60
20
Longitude �Latitude �
Altitud
ekm
Tracked by DL1SGP
11.211.3
11.4
55.4
55.5
55.60
20
Longitude �Latitude �
Altitud
ekm
Tracked by OZ1SKY
Logged flight path Tracked flight path Launch team positions
Figure 14: Logged flight path with tracked flight path of Titan 1. Plots are shownindividually for the four trackers.
The launch team was able to track the flight constantly except for some short momentwhile moving from Launch position to the Wait position and while moving to the touch-down location, search position S1 and S2. This mostly due to holding the antenna outof the window while diving does not allow to have good contact all the time.
Looking at the tracked points by SA6BSS in Fig. 14 shows that the contact horizon was atapproximately 7933m. Above that level the tracking was constant. DL1SGP had a goodspot on during the peak approach of Titan 1. OZ1SKY only tracked the final touchdownpath of the flight down to 210m above ground.
The signal was very stable and no frequency shifting has been observed, which was alsoconfirmed during the flight by SA6BSS and DL1SGB.
Copyright c⃝ 2016 Emanuel Bombasaro, Titan – High Altitude Balloon Mission 1 21/44
6 Image Analysis
During the flight an images was taken every second leading to a total amount of 11 489images taken from shortly before launch up to shortly after recovery. An infinity amountof images could be shown and discussed here, but the author wanted to concentrated onthe few most impressive images.
6.1 Moon
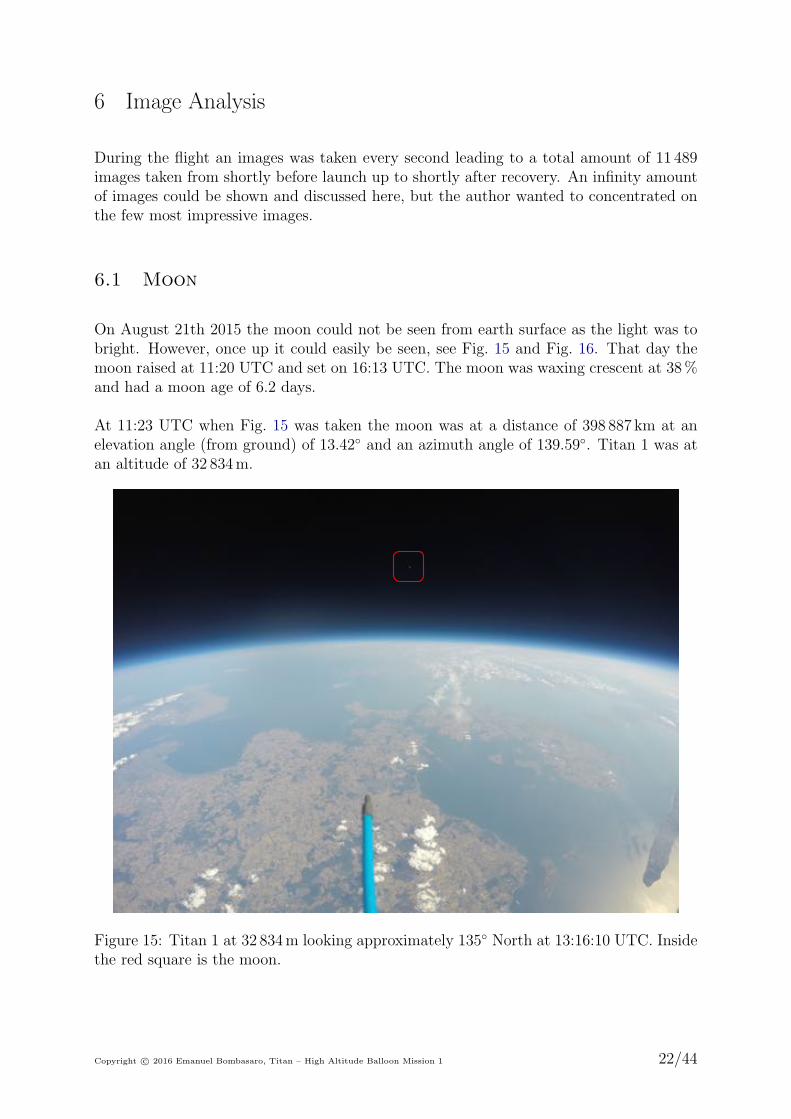
On August 21th 2015 the moon could not be seen from earth surface as the light was tobright. However, once up it could easily be seen, see Fig. 15 and Fig. 16. That day themoon raised at 11:20 UTC and set on 16:13 UTC. The moon was waxing crescent at 38%and had a moon age of 6.2 days.
At 11:23 UTC when Fig. 15 was taken the moon was at a distance of 398 887 km at anelevation angle (from ground) of 13.42◦ and an azimuth angle of 139.59◦. Titan 1 was atan altitude of 32 834m.
Figure 15: Titan 1 at 32 834m looking approximately 135◦ North at 13:16:10 UTC. Insidethe red square is the moon.
Copyright c⃝ 2016 Emanuel Bombasaro, Titan – High Altitude Balloon Mission 1 22/44
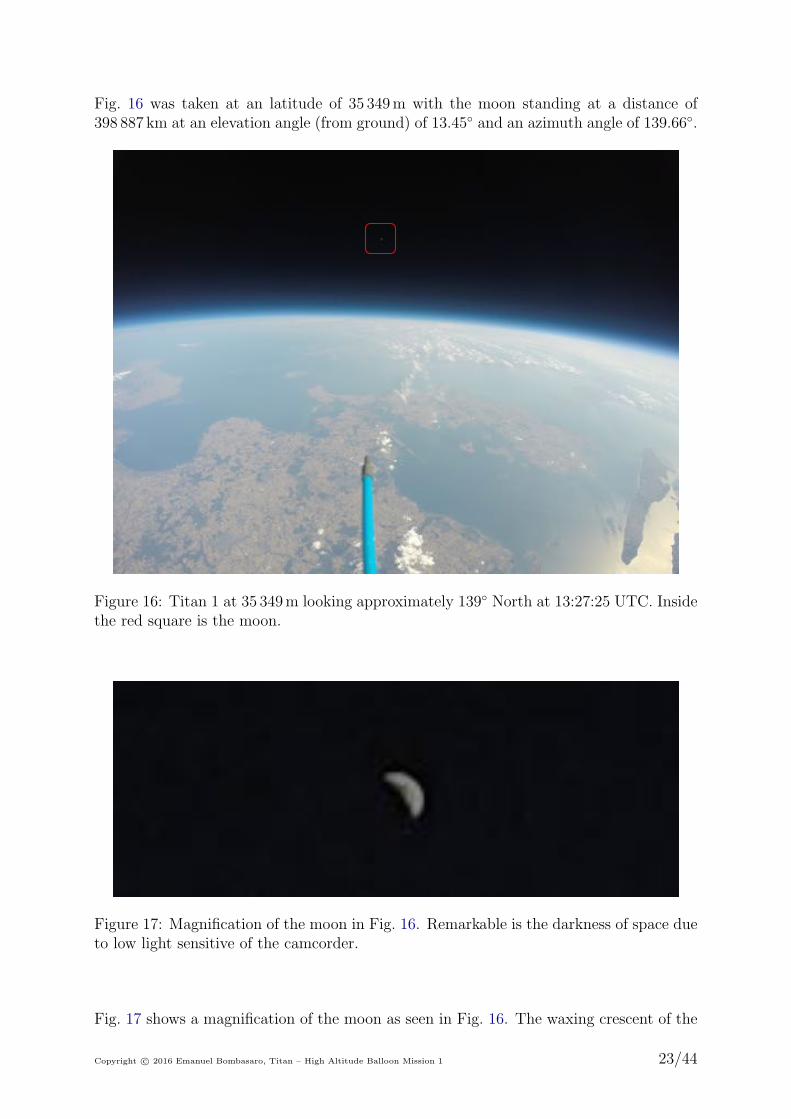
Fig. 16 was taken at an latitude of 35 349m with the moon standing at a distance of398 887 km at an elevation angle (from ground) of 13.45◦ and an azimuth angle of 139.66◦.
Figure 16: Titan 1 at 35 349m looking approximately 139◦ North at 13:27:25 UTC. Insidethe red square is the moon.
Figure 17: Magnification of the moon in Fig. 16. Remarkable is the darkness of space dueto low light sensitive of the camcorder.
Fig. 17 shows a magnification of the moon as seen in Fig. 16. The waxing crescent of the
Copyright c⃝ 2016 Emanuel Bombasaro, Titan – High Altitude Balloon Mission 1 23/44

moon can be nicely observed. The resolution of the image is impressive, remember thedistance to the moon is 398 887 km, as still the moon’s dark spots can be identified.
6.2 Balloon Burst
The second major event, after the launch, is when the balloon bursts at peak altitude.The first image taken after the balloon’s burst is shown in Fig. 18. Titan 1 ended upupside down before returning in normal flight position.
Figure 18: First image taken after burst of the balloon, Titan 1 ending upside down.Some fragments of the balloon can be seen. Image taken at 13:27:38 UTC.
6.3 Cloud
Clouds, known for the particular beauty, should not be missed out, see Fig. 19. Titan 1penetrated through clouds during ascent, but through even more intense clouds duringdescent. The image is taken at a altitude of 2825m. The sun stands at 228.95◦ Northat an elevation angle (from ground) of 37.83◦. The clouds seem to be of the altocumulustype.
Copyright c⃝ 2016 Emanuel Bombasaro, Titan – High Altitude Balloon Mission 1 24/44

Figure 19: Titan 1 penetrating through the altocumulus cloud layer during descent at13:49:28 UTC, altitude 2825m.
7 Sensed Parameters
This section states and discusses in short the measured atmospheric parameters temper-ature, relative humidity and pressure as well as the measured values for the magneticfield.
7.1 Temperature
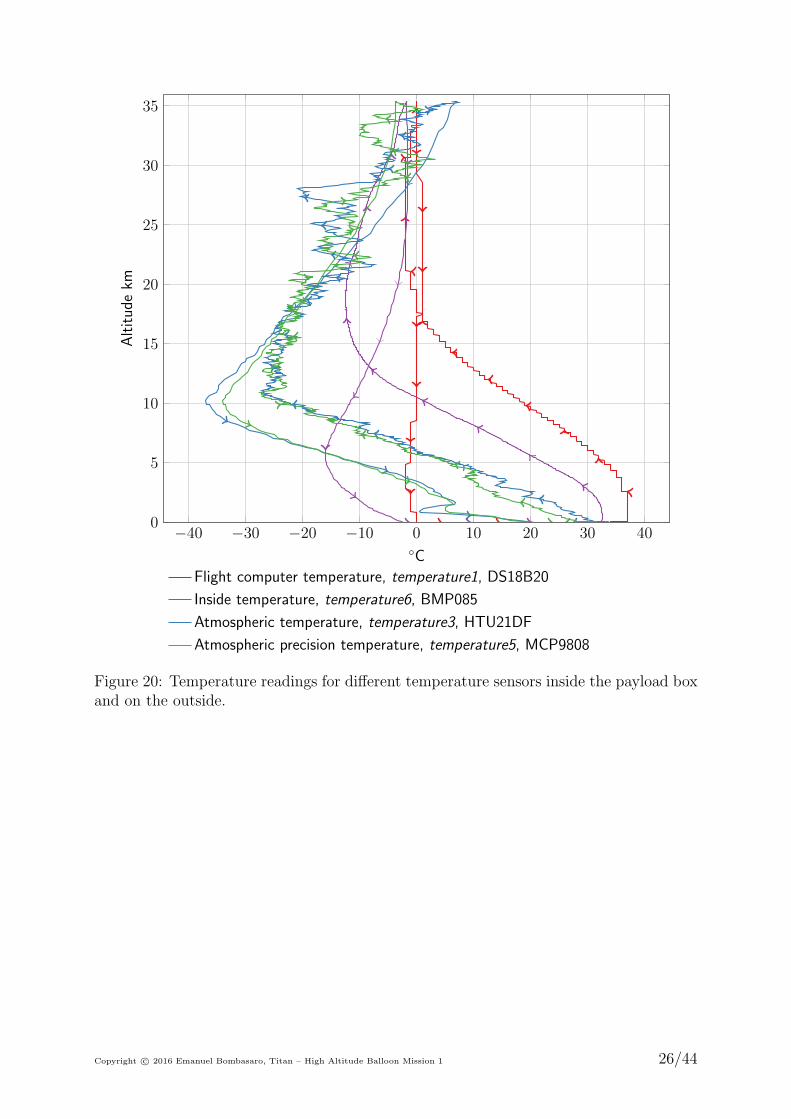
Fig. 20 shows the external (atmospheric) and internal temperature. The external tem-perature is a little above of what would have been expected (minimum around −50 ◦C) isprobably due to the fact the sensors being exposed to sun light. In a future mission thesensors will be mounted without direct light impact. The internal temperature followsthe external temperature with a time delay. The minimum flight computer is logged with−2 ◦C.
Copyright c⃝ 2016 Emanuel Bombasaro, Titan – High Altitude Balloon Mission 1 25/44
�40 �30 �20 �10 0 10 20 30 400
5
10
15
20
25
30
35
�C
Altitud
ekm
Flight computer temperature, temperature1, DS18B20
Inside temperature, temperature6, BMP085
Atmospheric temperature, temperature3, HTU21DF
Atmospheric precision temperature, temperature5, MCP9808
Figure 20: Temperature readings for different temperature sensors inside the payload boxand on the outside.
Copyright c⃝ 2016 Emanuel Bombasaro, Titan – High Altitude Balloon Mission 1 26/44
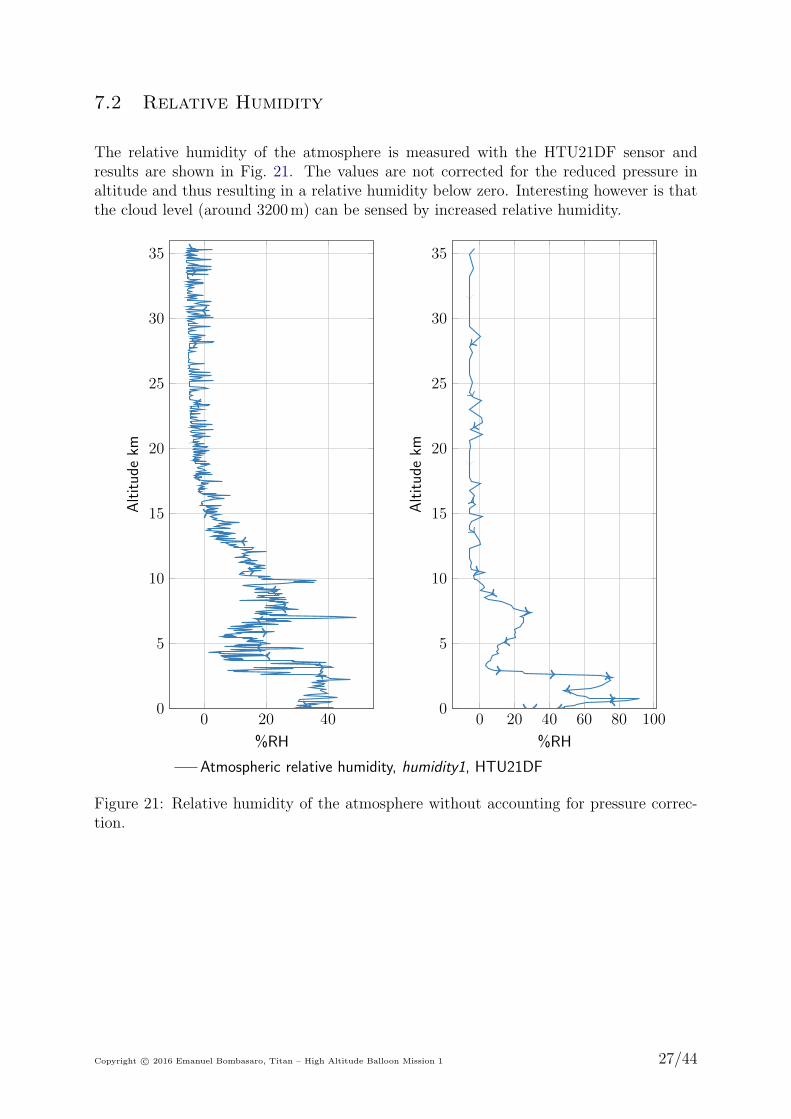
7.2 Relative Humidity
The relative humidity of the atmosphere is measured with the HTU21DF sensor andresults are shown in Fig. 21. The values are not corrected for the reduced pressure inaltitude and thus resulting in a relative humidity below zero. Interesting however is thatthe cloud level (around 3200m) can be sensed by increased relative humidity.
0 20 400
5
10
15
20
25
30
35
%RH
Altitud
ekm
Atmospheric relative humidity, humidity1, HTU21DF
0 20 40 60 80 1000
5
10
15
20
25
30
35
%RH
Altitud
ekm
Figure 21: Relative humidity of the atmosphere without accounting for pressure correc-tion.
Copyright c⃝ 2016 Emanuel Bombasaro, Titan – High Altitude Balloon Mission 1 27/44
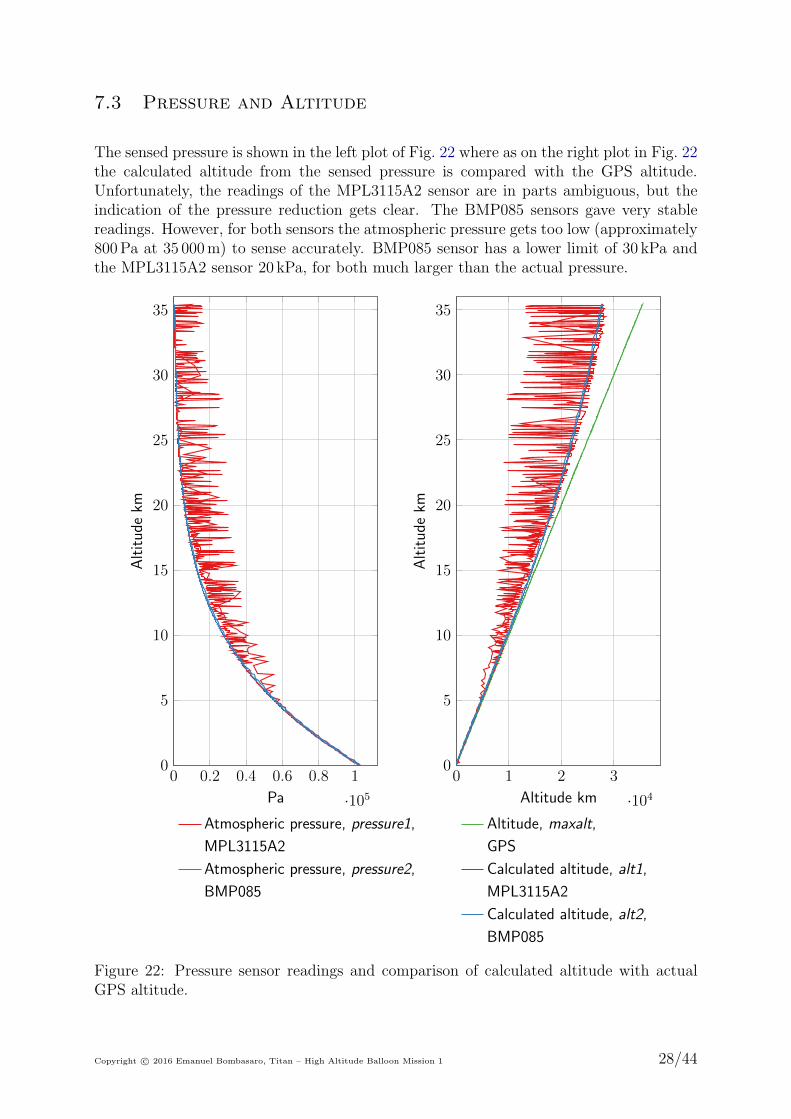
7.3 Pressure and Altitude
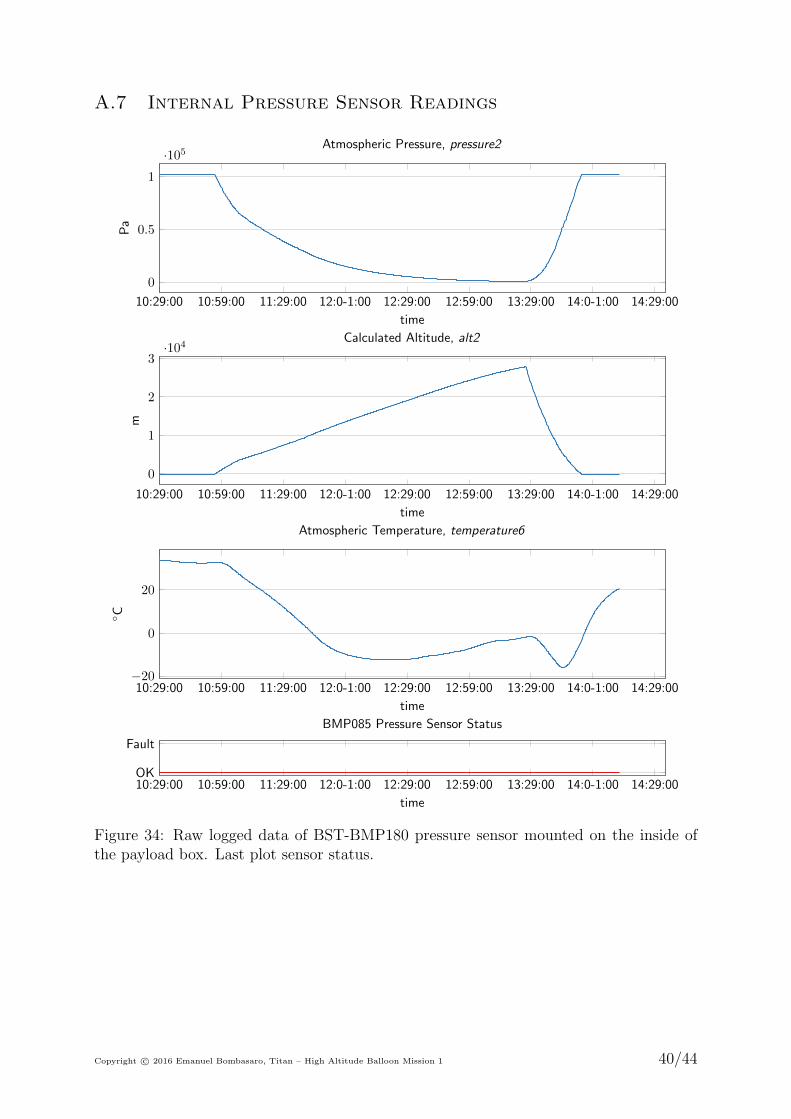
The sensed pressure is shown in the left plot of Fig. 22 where as on the right plot in Fig. 22the calculated altitude from the sensed pressure is compared with the GPS altitude.Unfortunately, the readings of the MPL3115A2 sensor are in parts ambiguous, but theindication of the pressure reduction gets clear. The BMP085 sensors gave very stablereadings. However, for both sensors the atmospheric pressure gets too low (approximately800Pa at 35 000m) to sense accurately. BMP085 sensor has a lower limit of 30 kPa andthe MPL3115A2 sensor 20 kPa, for both much larger than the actual pressure.
0 0.2 0.4 0.6 0.8 1
·105
0
5
10
15
20
25
30
35
Pa
Altitud
ekm
Atmospheric pressure, pressure1,
MPL3115A2
Atmospheric pressure, pressure2,
BMP085
0 1 2 3
·104
0
5
10
15
20
25
30
35
Altitude km
Altitud
ekm
Altitude, maxalt,
GPS
Calculated altitude, alt1,
MPL3115A2
Calculated altitude, alt2,
BMP085
Figure 22: Pressure sensor readings and comparison of calculated altitude with actualGPS altitude.
Copyright c⃝ 2016 Emanuel Bombasaro, Titan – High Altitude Balloon Mission 1 28/44

8 Payload Motion
In this section a short investigation of the payload motion is given. The coordinate systemof the IMU sensor is shown in Fig. 6. The fundamental movements are roll, pitch andheading, the relative values over hight are shown in Fig. 23, Fig. 24 and Fig. 25.
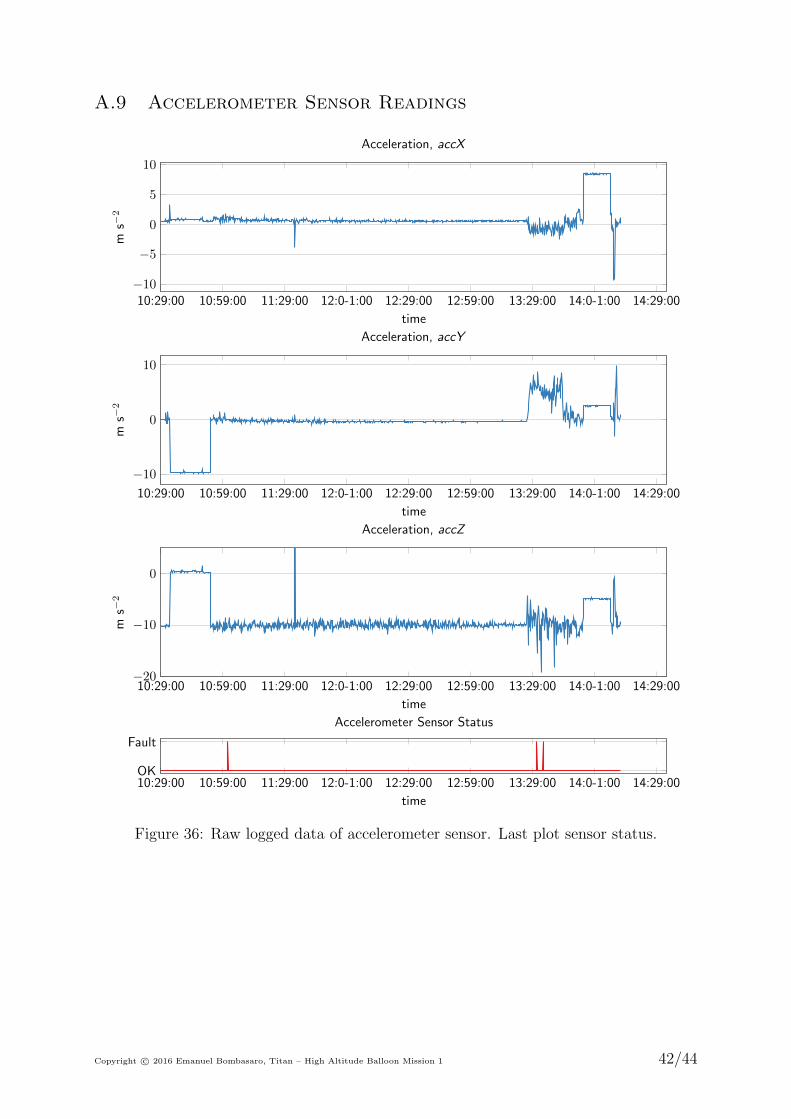
Looking at roll and pitch, it becomes clear that during ascent the payload box remainedmostly horizontal. Some small mean angular deviation can be observed in Fig. 23 andFig. 24, however it looks like they are caused by a sensor offset, see Fig. 36 as from thetaken images it can be undertstood that the payload box was considerable horizontal.
During descent through the upper atmosphere the payload box is rolled to the left andand pitched up. I.e. the corner where the IMU sensor is located is lower than the oppositecorner and the camera is looking up, see Fig. 6.
�10 �5 0 5 100
5
10
15
20
25
30
35
� roll
Altitud
ekm
Roll �, roll
�60 �40 �20 00
5
10
15
20
25
30
35
� roll
Altitud
ekm
Figure 23: Roll of Titan 1’s payload box during ascent and descent. Values derived fromearth acceleration readings.
Copyright c⃝ 2016 Emanuel Bombasaro, Titan – High Altitude Balloon Mission 1 29/44

0 2 4 6 8 100
5
10
15
20
25
30
35
� pitch
Altitud
ekm
Pitch ⇢, pitch
�10 0 100
5
10
15
20
25
30
35
� pitch
Altitud
ekm
Figure 24: Pitch of Titan 1’s payload box during ascent and descent. Values derived fromearth acceleration readings.
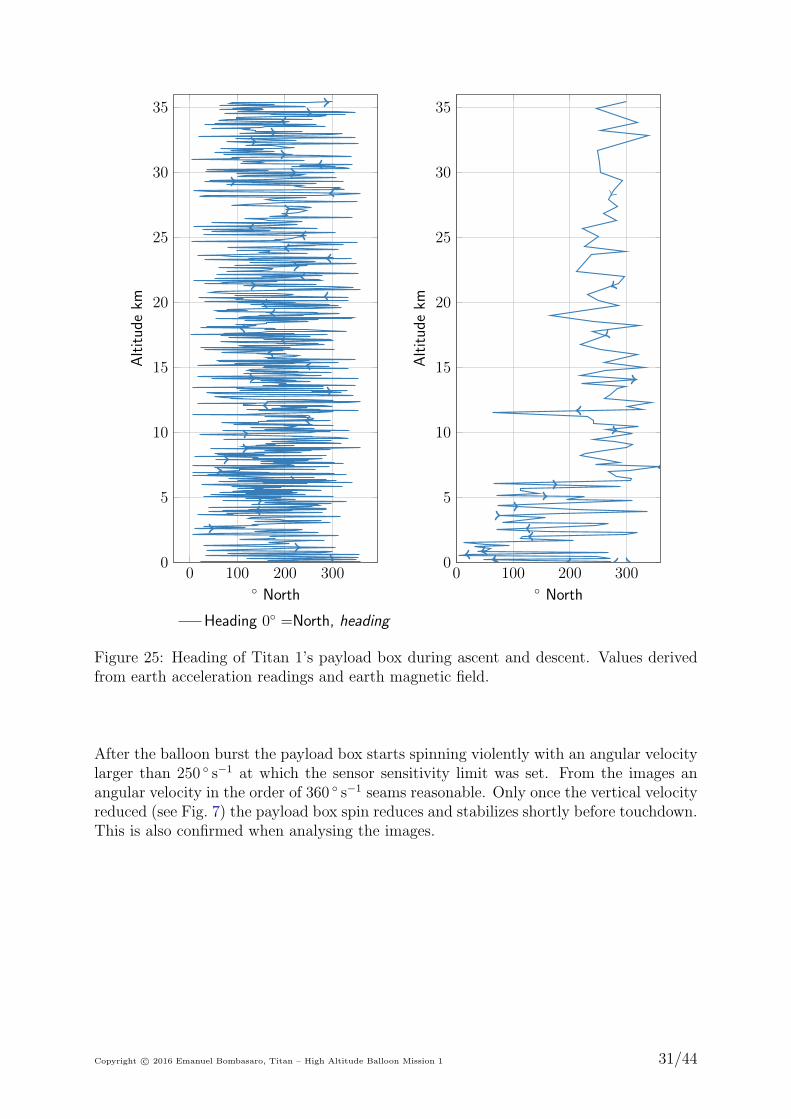
As already pointed out the calibration of the magnetic sensor was done before driving tothe launch site, this lead to a poorly calibrated magnetic sensor and thus to ambiguousheading values. However, the values are shown in Fig. 25. The heading becomes moreinteresting when compared to the vertical payload spin, see Fig. 27. The payload box ro-tates more or less in one direction and then rotates back, quite strong at the beginning butonce reaching high altitude the angular velocity reduces. This, somehow proofs that theinstalled swivel increases rotational stability (less spin is transferred form the parachuteand or balloon to the payload box) of the payload box. Further, this is confirmed byanalysing the images taken by the camcorder.
Copyright c⃝ 2016 Emanuel Bombasaro, Titan – High Altitude Balloon Mission 1 30/44
0 100 200 3000
5
10
15
20
25
30
35
� North
Altitud
ekm
Heading 0� =North, heading
0 100 200 3000
5
10
15
20
25
30
35
� North
Altitud
ekm
Figure 25: Heading of Titan 1’s payload box during ascent and descent. Values derivedfrom earth acceleration readings and earth magnetic field.
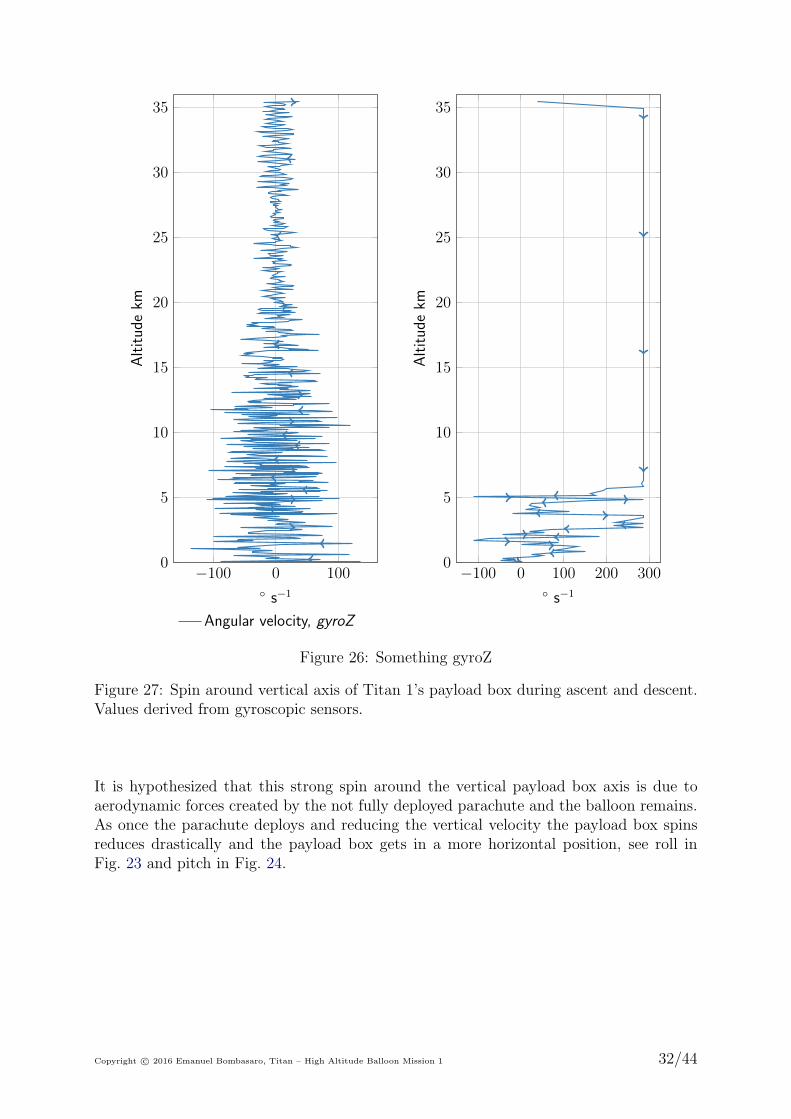
After the balloon burst the payload box starts spinning violently with an angular velocitylarger than 250 ◦ s−1 at which the sensor sensitivity limit was set. From the images anangular velocity in the order of 360 ◦ s−1 seams reasonable. Only once the vertical velocityreduced (see Fig. 7) the payload box spin reduces and stabilizes shortly before touchdown.This is also confirmed when analysing the images.
Copyright c⃝ 2016 Emanuel Bombasaro, Titan – High Altitude Balloon Mission 1 31/44
�100 0 1000
5
10
15
20
25
30
35
� s�1
Altitud
ekm
Angular velocity, gyroZ
�100 0 100 200 3000
5
10
15
20
25
30
35
� s�1
Altitud
ekm
Figure 26: Something gyroZ
Figure 27: Spin around vertical axis of Titan 1’s payload box during ascent and descent.Values derived from gyroscopic sensors.
It is hypothesized that this strong spin around the vertical payload box axis is due toaerodynamic forces created by the not fully deployed parachute and the balloon remains.As once the parachute deploys and reducing the vertical velocity the payload box spinsreduces drastically and the payload box gets in a more horizontal position, see roll inFig. 23 and pitch in Fig. 24.
Copyright c⃝ 2016 Emanuel Bombasaro, Titan – High Altitude Balloon Mission 1 32/44
9 Conclusion
In general it can be concluded that the mission went very well, especially as it was thefirst mission. The most critical components, flight computer, transmission, balloon andparachute, worked nominal throughout the flight. Equipping Titan 1 with a variety ofsensors allowed to evaluate the performance of these sensors under the extrema conditionsin hight altitude and gain confidence in the individual system components. Further, alot could be learned of how the components work together in a system exposed to highaltitude.
However improvements are necessary for following missions.
• Filling the camera housing with Dust-Off (1,1-Difluoroethane) could not preventfogging. Thus next time the camera will not be placed inside a closed hosing.
• Less of an issue, but an important point is how to fill the balloon correctly whileexposed to wind. The prediction should be done with a larger coefficient of variation.
• Sensor operation has to be checked even more, especially if the software drivers areworking correctly and in the full operation range.
• The descent time should be estimated not based on the target touchdown velocity.
Some targets for following missions could be:
• Reduce payload weight as much as possible smaller 50 g.
• Go as close to 45 000m as possible.
• Make a floater and try to get as fare as possible for as long as possible.
• Install a repeater to allow communication via a HAB.
• And many more. . .
Copyright c⃝ 2016 Emanuel Bombasaro, Titan – High Altitude Balloon Mission 1 33/44
A Diagrams of Raw Logged Data
A.1 Flight Computer Data
10:29:00 10:59:00 11:29:00 12:0-1:00 12:29:00 12:59:00 13:29:00 14:0-1:00 14:29:00
0
500
1,000
time
-
Continuous Counter, count
10:29:00 10:59:00 11:29:00 12:0-1:00 12:29:00 12:59:00 13:29:00 14:0-1:00 14:29:003,200
3,300
3,400
3,500
time
mV
Battery Voltage, battvaverage
10:29:00 10:59:00 11:29:00 12:0-1:00 12:29:00 12:59:00 13:29:00 14:0-1:00 14:29:00
0
20
40
time
� C
Temperature Flight Computer, temperature1
10:29:00 10:59:00 11:29:00 12:0-1:00 12:29:00 12:59:00 13:29:00 14:0-1:00 14:29:00OK
Fault
time
DS18B20 Temperature Sensor Status
10:29:00 10:59:00 11:29:00 12:0-1:00 12:29:00 12:59:00 13:29:00 14:0-1:00 14:29:00OK
Fault
time
Logging to micro-SD Status
Figure 28: Raw logged data regarding flight computer. Last two plots flight computertemperature sensor status and logging status.
Copyright c⃝ 2016 Emanuel Bombasaro, Titan – High Altitude Balloon Mission 1 34/44

A.2 GPS Location
10:29:00 10:59:00 11:29:00 12:0-1:00 12:29:00 12:59:00 13:29:00 14:0-1:00 14:29:0055.3
55.4
55.5
55.6
time
�lat
Latitude, lat
10:29:00 10:59:00 11:29:00 12:0-1:00 12:29:00 12:59:00 13:29:00 14:0-1:00 14:29:0011.1
11.2
11.3
11.4
11.5
time
�lon
Longitude, lon
10:29:00 10:59:00 11:29:00 12:0-1:00 12:29:00 12:59:00 13:29:00 14:0-1:00 14:29:000
1
2
3
·104
time
altitude
m
Altitude, maxalt
10:29:00 10:59:00 11:29:00 12:0-1:00 12:29:00 12:59:00 13:29:00 14:0-1:00 14:29:000
5
10
15
time
�
Number of Satellites, stats
10:29:00 10:59:00 11:29:00 12:0-1:00 12:29:00 12:59:00 13:29:00 14:0-1:00 14:29:00Flight
Pedestrian
time
Current Dynamic Model
Figure 29: GPS logged location and number of satellites. Last plot GPS dynamic model.
Copyright c⃝ 2016 Emanuel Bombasaro, Titan – High Altitude Balloon Mission 1 35/44
A.3 Check Status GPS
10:29:00 10:59:00 11:29:00 12:0-1:00 12:29:00 12:59:00 13:29:00 14:0-1:00 14:29:00Flight
Pedestrian
time
Current Dynamic Model
10:29:00 10:59:00 11:29:00 12:0-1:00 12:29:00 12:59:00 13:29:00 14:0-1:00 14:29:00No
Yes
time
GPS Error Condition Noted Switch to Max Performance Mode
10:29:00 10:59:00 11:29:00 12:0-1:00 12:29:00 12:59:00 13:29:00 14:0-1:00 14:29:00No
Yes
time
GPS Error Condition Noted Cold Boot GPS
10:29:00 10:59:00 11:29:00 12:0-1:00 12:29:00 12:59:00 13:29:00 14:0-1:00 14:29:00On
O↵
time
PSM Status
10:29:00 10:59:00 11:29:00 12:0-1:00 12:29:00 12:59:00 13:29:00 14:0-1:00 14:29:00Locked
Not Locked
time
GPS state
Figure 30: Raw logged data regarding various GPS states.
Copyright c⃝ 2016 Emanuel Bombasaro, Titan – High Altitude Balloon Mission 1 36/44
A.4 Luminosity, Temperature and Relative Humidity Sensor
10:29:00 10:59:00 11:29:00 12:0-1:00 12:29:00 12:59:00 13:29:00 14:0-1:00 14:29:000
1,000
2,000
time
lx
Luminosity, lux1
10:29:00 10:59:00 11:29:00 12:0-1:00 12:29:00 12:59:00 13:29:00 14:0-1:00 14:29:00OK
Fault
time
TSL2561 Luminosity Sensor Status
10:29:00 10:59:00 11:29:00 12:0-1:00 12:29:00 12:59:00 13:29:00 14:0-1:00 14:29:00�40
�20
0
20
time
� C
Temperature, temperature3
10:29:00 10:59:00 11:29:00 12:0-1:00 12:29:00 12:59:00 13:29:00 14:0-1:00 14:29:00
0
50
100
time
%RH
Relative Humidity, humidity1
10:29:00 10:59:00 11:29:00 12:0-1:00 12:29:00 12:59:00 13:29:00 14:0-1:00 14:29:00OK
Fault
time
HTU21DF Temperature Humidity Sensor Status
Figure 31: Raw logged data of luminosity, temperature and relative humidity sensorsmounted on the outside of the payload box. Second and last plot according sensor status.
Copyright c⃝ 2016 Emanuel Bombasaro, Titan – High Altitude Balloon Mission 1 37/44
A.5 External Pressure Sensors Readings
10:29:00 10:59:00 11:29:00 12:0-1:00 12:29:00 12:59:00 13:29:00 14:0-1:00 14:29:00
0
0.5
1
·105
time
Pa
Atmospheric Pressure, pressure1
10:29:00 10:59:00 11:29:00 12:0-1:00 12:29:00 12:59:00 13:29:00 14:0-1:00 14:29:00
0
1
2
3·104
time
m
Calculated Altitude, alt1
10:29:00 10:59:00 11:29:00 12:0-1:00 12:29:00 12:59:00 13:29:00 14:0-1:00 14:29:00
0
100
200
time
� C
Atmospheric Temperature, temperature4
10:29:00 10:59:00 11:29:00 12:0-1:00 12:29:00 12:59:00 13:29:00 14:0-1:00 14:29:00OK
Fault
time
MPL3115A2 Pressure Sensor Status
Figure 32: Raw logged data of MPL3115A2 pressure sensor mounted on the outside ofthe payload box. Last plot sensor status.
Copyright c⃝ 2016 Emanuel Bombasaro, Titan – High Altitude Balloon Mission 1 38/44
A.6 Precision Temperature Sensor
10:29:00 10:59:00 11:29:00 12:0-1:00 12:29:00 12:59:00 13:29:00 14:0-1:00 14:29:00�40
�20
0
20
40
time
� C
Atmospheric Precision Temperature, temperature5
10:29:00 10:59:00 11:29:00 12:0-1:00 12:29:00 12:59:00 13:29:00 14:0-1:00 14:29:00OK
Fault
time
MCP9808 Precision Temperature Sensor Status
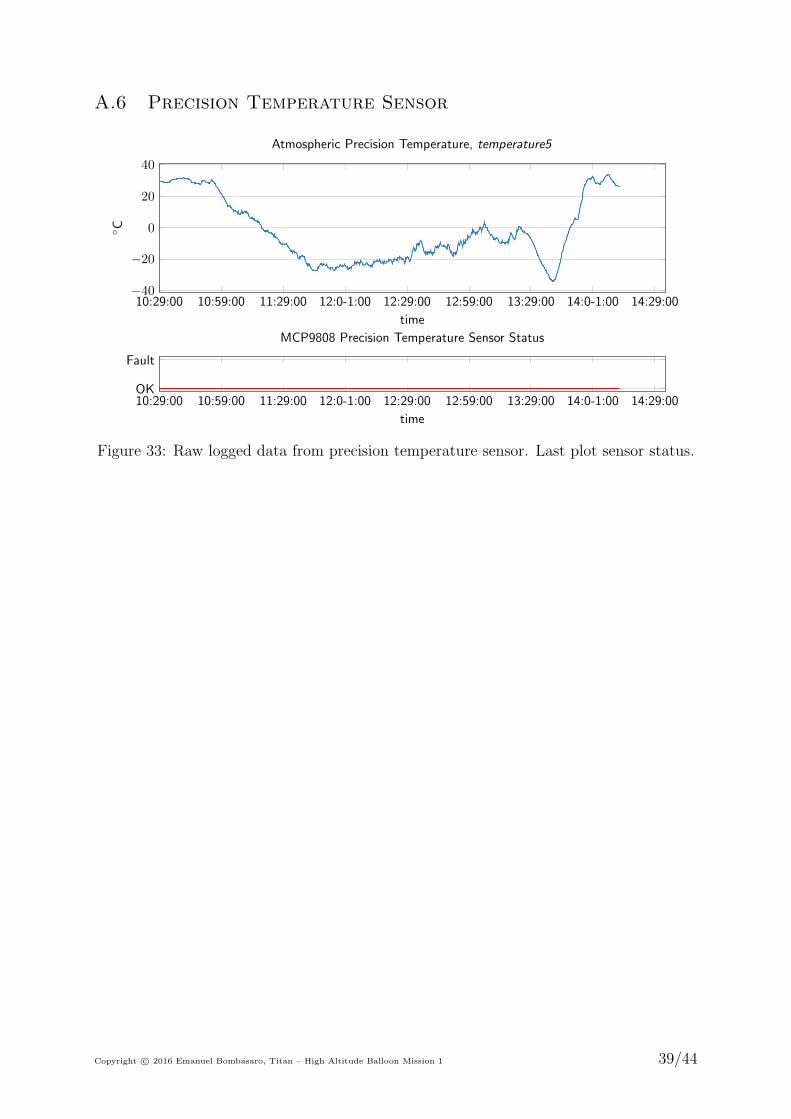
Figure 33: Raw logged data from precision temperature sensor. Last plot sensor status.
Copyright c⃝ 2016 Emanuel Bombasaro, Titan – High Altitude Balloon Mission 1 39/44
A.7 Internal Pressure Sensor Readings
10:29:00 10:59:00 11:29:00 12:0-1:00 12:29:00 12:59:00 13:29:00 14:0-1:00 14:29:00
0
0.5
1
·105
time
Pa
Atmospheric Pressure, pressure2
10:29:00 10:59:00 11:29:00 12:0-1:00 12:29:00 12:59:00 13:29:00 14:0-1:00 14:29:00
0
1
2
3·104
time
m
Calculated Altitude, alt2
10:29:00 10:59:00 11:29:00 12:0-1:00 12:29:00 12:59:00 13:29:00 14:0-1:00 14:29:00�20
0
20
time
� C
Atmospheric Temperature, temperature6
10:29:00 10:59:00 11:29:00 12:0-1:00 12:29:00 12:59:00 13:29:00 14:0-1:00 14:29:00OK
Fault
time
BMP085 Pressure Sensor Status
Figure 34: Raw logged data of BST-BMP180 pressure sensor mounted on the inside ofthe payload box. Last plot sensor status.
Copyright c⃝ 2016 Emanuel Bombasaro, Titan – High Altitude Balloon Mission 1 40/44

A.8 Gyroscope Sensor Readings
10:29:00 10:59:00 11:29:00 12:0-1:00 12:29:00 12:59:00 13:29:00 14:0-1:00 14:29:00
�50
0
50
100
time
�s�
1
Angular velocity, gyroX
10:29:00 10:59:00 11:29:00 12:0-1:00 12:29:00 12:59:00 13:29:00 14:0-1:00 14:29:00
�50
0
50
time
�s�
1
Angular velocity, gyroY
10:29:00 10:59:00 11:29:00 12:0-1:00 12:29:00 12:59:00 13:29:00 14:0-1:00 14:29:00
0
200
time
�s�
1
Angular velocity, gyroZ
10:29:00 10:59:00 11:29:00 12:0-1:00 12:29:00 12:59:00 13:29:00 14:0-1:00 14:29:00OK
Fault
time
Gyroscope Sensor Status
Figure 35: Raw logged data of gyroscope sensor. Last plot sensor status.
Copyright c⃝ 2016 Emanuel Bombasaro, Titan – High Altitude Balloon Mission 1 41/44
A.9 Accelerometer Sensor Readings
10:29:00 10:59:00 11:29:00 12:0-1:00 12:29:00 12:59:00 13:29:00 14:0-1:00 14:29:00�10
�5
0
5
10
time
ms�
2
Acceleration, accX
10:29:00 10:59:00 11:29:00 12:0-1:00 12:29:00 12:59:00 13:29:00 14:0-1:00 14:29:00
�10
0
10
time
ms�
2
Acceleration, accY
10:29:00 10:59:00 11:29:00 12:0-1:00 12:29:00 12:59:00 13:29:00 14:0-1:00 14:29:00�20
�10
0
time
ms�
2
Acceleration, accZ
10:29:00 10:59:00 11:29:00 12:0-1:00 12:29:00 12:59:00 13:29:00 14:0-1:00 14:29:00OK
Fault
time
Accelerometer Sensor Status
Figure 36: Raw logged data of accelerometer sensor. Last plot sensor status.
Copyright c⃝ 2016 Emanuel Bombasaro, Titan – High Altitude Balloon Mission 1 42/44
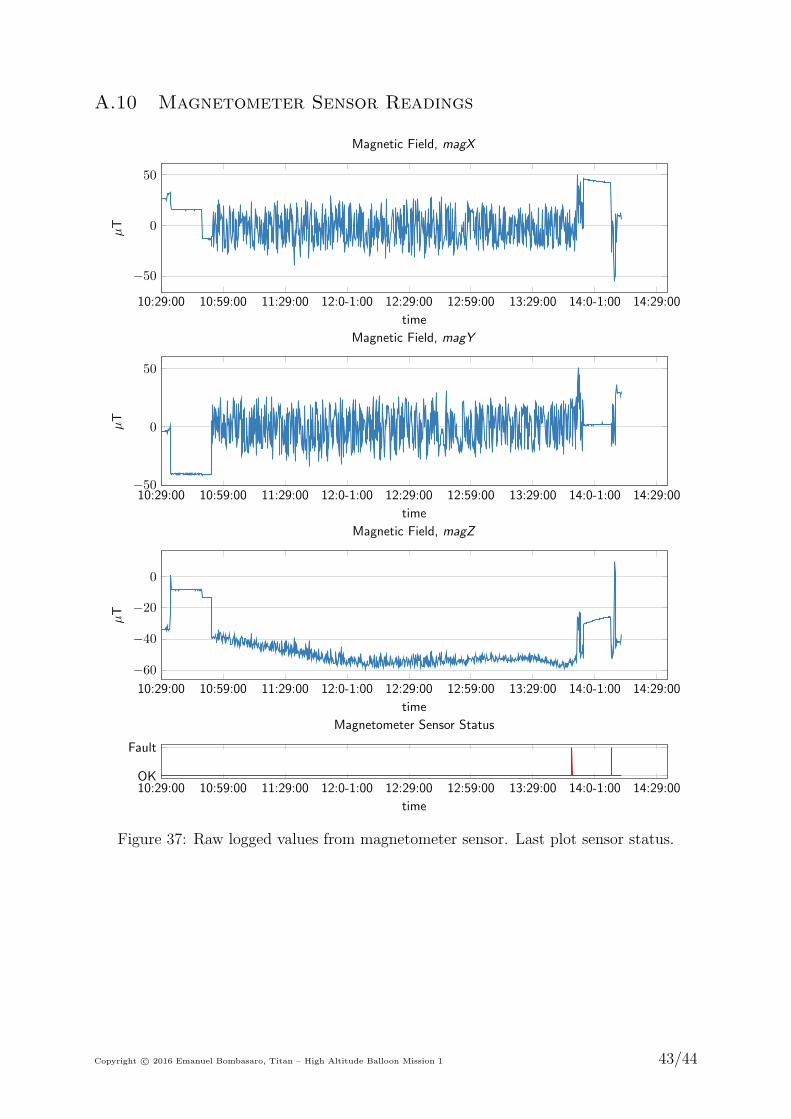
A.10 Magnetometer Sensor Readings
10:29:00 10:59:00 11:29:00 12:0-1:00 12:29:00 12:59:00 13:29:00 14:0-1:00 14:29:00
�50
0
50
time
µT
Magnetic Field, magX
10:29:00 10:59:00 11:29:00 12:0-1:00 12:29:00 12:59:00 13:29:00 14:0-1:00 14:29:00�50
0
50
time
µT
Magnetic Field, magY
10:29:00 10:59:00 11:29:00 12:0-1:00 12:29:00 12:59:00 13:29:00 14:0-1:00 14:29:00
�60
�40
�20
0
time
µT
Magnetic Field, magZ
10:29:00 10:59:00 11:29:00 12:0-1:00 12:29:00 12:59:00 13:29:00 14:0-1:00 14:29:00OK
Fault
time
Magnetometer Sensor Status
Figure 37: Raw logged values from magnetometer sensor. Last plot sensor status.
Copyright c⃝ 2016 Emanuel Bombasaro, Titan – High Altitude Balloon Mission 1 43/44
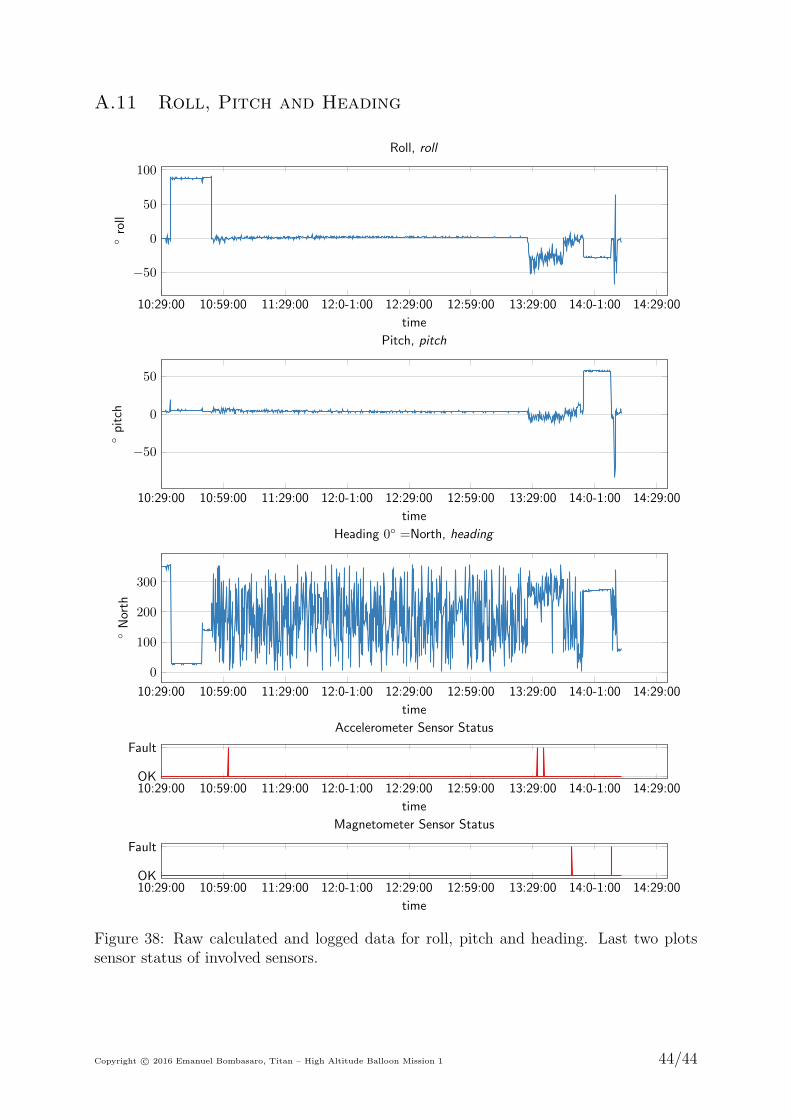
A.11 Roll, Pitch and Heading
10:29:00 10:59:00 11:29:00 12:0-1:00 12:29:00 12:59:00 13:29:00 14:0-1:00 14:29:00
�50
0
50
100
time
�roll
Roll, roll
10:29:00 10:59:00 11:29:00 12:0-1:00 12:29:00 12:59:00 13:29:00 14:0-1:00 14:29:00
�50
0
50
time
�pitch
Pitch, pitch
10:29:00 10:59:00 11:29:00 12:0-1:00 12:29:00 12:59:00 13:29:00 14:0-1:00 14:29:00
0
100
200
300
time
�North
Heading 0� =North, heading
10:29:00 10:59:00 11:29:00 12:0-1:00 12:29:00 12:59:00 13:29:00 14:0-1:00 14:29:00OK
Fault
time
Accelerometer Sensor Status
10:29:00 10:59:00 11:29:00 12:0-1:00 12:29:00 12:59:00 13:29:00 14:0-1:00 14:29:00OK
Fault
time
Magnetometer Sensor Status
Figure 38: Raw calculated and logged data for roll, pitch and heading. Last two plotssensor status of involved sensors.
Copyright c⃝ 2016 Emanuel Bombasaro, Titan – High Altitude Balloon Mission 1 44/44