Embed Size (px)
Citation preview

ARKANSAS EDUCATION REPORT Volume 10, Issue 1
OUTSTANDING EDUCATIONAL PERFORMANCE AWARDS: HIGHLIGHTING HIGH-ACHIEVING ARKANSAS SCHOOLS, 2013
HIGH-ACHIEVING ELEMENTARY SCHOOLS
October 9, 2013
By:
Vera E. DeBerg Sarah M. Burks Gary W. Ritter
Office for Education Policy University of Arkansas
211 Graduate Education Building Fayetteville, AR 72701 Phone: (479) 575-3773
Fax: (479) 575-3196 E-mail: [email protected]

Outstanding Educational Performance Awards 2013 Page 2
TABLE OF CONTENTS
Introduction ..................................................................................................................................... 1
III. 2013 OEP Awards: High-Achieving Elementary Schools ................................................ 24
G. Elementary Math by Grade, 2013 ....................................................................................25
H. Elementary Literacy by Grade, 2013 ...............................................................................28
I. Elementary Combined Math and Literacy by Grade, 2013 ............................................30
J. Northwest Region, Elementary Schools, 2013 ..................................................................32
K. Northeast Region, Elementary Schools, 2013 ..................................................................34
L. Central Region, Elementary Schools, 2013 ....................................................................36
M. Southwest Region, Elementary Schools, 2013.................................................................38
N. Southeast Region, Elementary Schools, 2013 ..................................................................40
Appendix ....................................................................................................................................... A1

Outstanding Educational Performance Awards 2013 Page 3
INTRODUCTION
Since our founding in 2003, the mission of the Office for Education Policy has been to look at
pressing issues through the lens of academic research and disseminate our findings to educators,
policymakers, and other stakeholders around Arkansas. Every once in a while, however, we think
it is okay to stray from issue analysis and simply share some good news!
In this Arkansas Education Report (AER), we aim to highlight excellent performance and offer
our congratulations. To that end, we are happy to highlight many excellent schools around the
state in our now-annual AER entitled the Outstanding Educational Performance Awards or the
OEP awards.
Over a three month period this fall, a new set of OEP Awards will be released every couple of
weeks to highlight the high-performing schools in Arkansas on the Benchmark exam in math and
literacy, and End-Of-Course (EOC) exams in Algebra, Geometry, Literacy (Grade 11), and
Biology.
Last year, we first introduced a new academic performance indicator, the “GPA” rating system,
to rank the highest-performing schools. In the past, the rankings were created based on the
percentage of students scoring at the proficient or advanced level on each assessment. Generally,
when discussing academic achievement on the Benchmark exams, policymakers focus on this
figure. However, this indicator suffers from being an “all-or-nothing” measure, in which a
student is either proficient or not.
The percent proficient and advanced measure disregards real information provided by student
scores that are placed into the four different performance categories: below basic, basic,
proficient, and advanced. Additionally, this mark does not differentiate between a school in
which 100% of students score proficient and a school in which 100% of students score advanced.
Both of these schools would show 100% of students performing at proficient and advanced
levels; however, in the latter school, students actually performed at a significantly higher level.
Thus, a slightly more informative indicator gives the most credit to students who score at the
advanced level and the least credit to students who score at the below basic level. For these
purposes then, we have created the “GPA” rating system. In this GPA measure, parallel to the
familiar grade point average for individual students, we treat the benchmark test scores in a
similar way, whereby a 4.0 is a perfect score!
Category GPA Points Awarded
Advanced 4.0
Proficient 3.0
Basic 2.0
Below Basic 1.0
The GPA measure, we believe, is a better representation of student achievement on statewide
standardized exams. In this report, we are presenting a list of the top 25 schools in each area. In
some cases, these "top 25 lists" will contain more than 25 schools as some schools' GPA scores
will be identical. This is not a new phenomenon, as we also exceeded 25 schools in previous

Outstanding Educational Performance Awards 2013 Page 4
reports when using the percent proficient and advanced metric as an indicator for student
achievement; however, there are fewer ties using the more precise GPA measure.
After we present our overall snapshot of high-performing schools, we will release subsequent
reports every few weeks focusing on different subsets of schools. For example, in section two of
the OEP Awards AER, we will feature schools that are beating the odds (that is, schools that
have high levels of student achievement while serving a high percentage of low-income
students). In the following weeks, we will focus on high-performing elementary schools, middle
schools, and high schools in the various regions across the state. Finally, we will conclude our
report by focusing on the schools with the greatest improvement in test scores. Our release
schedule is:
High-Achieving “Overall” Schools in Arkansas
Beating the Odds – High-Achieving Schools Serving Low Income Communities
High-Achieving Elementary Schools by Region
High-Achieving Middle Schools by Region
High-Achieving High Schools Across Arkansas
Most Improved Schools
Stay tuned over the next ten weeks to see which schools in your area are recognized for our OEP
Awards!

Outstanding Educational Performance Awards 2013 Page 24
III. 2013 OEP AWARDS: HIGH-ACHIEVING ELEMENTARY SCHOOLS
This section provides a deeper look at the high-achieving elementary schools and grades within
schools based on the Arkansas Benchmark exam.1
The Benchmark exams in math and literacy
were administered to students in grades 3-8 in April 2013.
Each table presents the high-achieving schools for the noted grade and subject. These tables
include the region in which the school is located, the number of test takers, the percent of
students scoring at the proficient and advanced levels, and the GPA of the school in that
particular subject. Because we already listed our overall top-performing elementary schools in
Section I of the OEP Awards, we move directly into listing the top-performing elementary
schools by grade. We then highlight the top-performing elementary schools and grades within
schools in each region.2
1 In this section, we highlight the top-performing grade levels for grades three through five. We did not distinguish
between elementary or middle school but simply highlight the top grade levels overall. Therefore, a middle school
may be listed if it includes one of these grades. The next installment of OEP Awards, High-Achieving Middle
Schools by Region, will cover grades six through eight. 2 Schools are divided into five regions in Arkansas: Northwest (NW), Northeast (NE), Central (CN), Southwest
(SW), and Southeast (SE).

Outstanding Educational Performance Awards 2013 Page 25
G. Elementary Math by Grade, 2013
Table 15: Top 10 Arkansas Schools: Grade Three Math Achievement
Indicates school placed on list in 2011-12.
School (District) Region # of Test
Takers
%
Proficient/
Advanced
GPA
1 Don Roberts Elementary School (Little
Rock)
CN 148 100% 3.95
2 Spring Hill Elementary School (Spring
Hill)
SW 29 100% 3.93
3 Forest Park Elementary School (Little
Rock)
CN 75 100% 3.91
3 Lisa Academy North Elementary School
(Lisa Academy – North Little Rock)
CN 46 100% 3.91
3 Park Magnet School (Hot Springs) CN 45 100% 3.91
6 Mount Pleasant Elementary School
(Melbourne)
NE 29 100% 3.90
7 Mt. Vernon/Enola Elementary School
(Mt. Vernon-Enola)
CN 37 97% 3.89
8 Eagle Heights Elementary School
(Harrison)
NW 32 97% 3.88
9 Bergman Elementary School (Bergman) NW 90 98% 3.87
9 Elm Tree Elementary School
(Bentonville)
NW 121 98% 3.87

Outstanding Educational Performance Awards 2013 Page
27
Table 16: Top 10 Arkansas Schools: Grade Four Math Achievement
School (District) Region # of Test
Takers
%
Proficient/
Advanced
GPA
1 Park Magnet School (Hot Springs) CN 40 100% 4.00
2 Mount Pleasant Elementary School
(Melbourne)
NE 26 100% 3.88
2 London Elementary School (Russellville) NW 25 96% 3.88
4 Vandergriff Elementary School
(Fayetteville)
NW 95 98% 3.84
5 Charleston Elementary School (Charleston)
NW 55 99% 3.83
6 Richland Elementary School (West
Memphis)
NE 76 97% 3.82
7 Elza R. Tucker Elementary School (Rogers) NW 84 96% 3.79
8 Gillett Elementary School (DeWitt) 13 100% 3.77
9 Evening Shade Elementary School (Cave
City)
17 94% 3.76
9 Hardin Elementary School (White Hall) CN 37 95% 3.76
Table 17: Top 10 Arkansas Schools: Grade Five
Math Achievement
School (District) Region # of Test
Takers
%
Proficient/
Advanced
GPA
1 Mount Pleasant Elementary School
(Melbourne)
NE 17 94% 3.88
2 Richland Elementary School (West
Memphis)
NE 71 100% 3.77
3 Vandergriff Elementary School
(Fayetteville)
NW 115 95% 3.74
4 Bellview Elementary School (Rogers) NW 100 93% 3.62
5 Pottsville Middle Grades (Pottsville) NW 123 94% 3.57
6 Holly Harshman Elementary School
(Mena)
SW 124 93% 3.56
7 Don Roberts Elementary School (Little
Rock)
CN 106 85% 3.52
7 Forest Park Elementary School (Little
Rock)
CN 71 92% 3.52
7 Salem Elementary School (Salem) NE 49 91% 3.52
10 Hunt Elementary School (Springdale) NW 103 89% 3.48

Outstanding Educational Performance Awards 2013 Page
28
H. Elementary Literacy by Grade, 2013
Table 18: Top 10 Arkansas Schools: Grade Three
Literacy Achievement
School (District) Region # of Test
Takers
%
Proficient/
Advanced
GPA
1 Park Magnet School (Hot Springs) CN 45 98% 3.87
2 Spring Hill Elementary (Spring Hill) SE 29 96% 3.84
3 Taylor Elementary School (Emerson-
Taylor)
SE 23 96% 3.83
4 Don Roberts Elementary School (Little
Rock)
CN 148 96% 3.82
4 Amorel Elementary School (Amorel) NE 33 94% 3.82
6 Mount Pleasant Elementary School
(Melbourne)
NE 29 97% 3.80
6 Vandergriff Elementary School
(Fayetteville)
NW 105 97% 3.80
6 Forest Heights Elementary School
(Harrison)
NW 83 99% 3.80
6 Carnall Elementary School (Fort Smith) NW 25 96% 3.80
10 Hoxie Elementary School (Hoxie) NE 54 96% 3.79
10 Norfork Elementary School (Norfork) NW 33 100% 3.79
10 St. Paul Elementary School (Huntsville) NW 21 96% 3.79
Table 19: Top 10 Arkansas Schools: Grade Four
Literacy Achievement
School (District) Region # of Test
Takers
%
Proficient/
Advanced
GPA
1 Vandergriff Elementary School
(Fayetteville)
NW 95 99% 3.91
2 Park Magnet School (Hot Springs) CN 40 100% 3.86
3 Van-Cove Elementary School (Cossatot
River)
SW 24 96% 3.84
4 Mount Pleasant Elementary School
(Melbourne)
NE 26 100% 3.81
5 London Elementary School (Russellville) NW 25 100% 3.80
5 Emerson Elementary School (Emerson-
Taylor)
SW 20 95% 3.80
7 Eastside Elementary School (Rogers) NW 98 95% 3.79
8 Forest Park Elementary School (Little Rock) CN 71 99% 3.78
9 Ellen Smith Elementary School (Conway) CN 90 96% 3.76
9 John P. Woods Elementary School (Fort
Smith)
NW 78 99% 3.76

Outstanding Educational Performance Awards 2013 Page
29
Table 20: Top 10 Arkansas Schools: Grade Five Literacy Achievement
School (District) Region
# of
Test
Takers
%
Proficient/
Advanced
GPA
1 Richland Elementary School (West
Memphis)
NE 71 100% 3.85
2 Weiner Elementary School (Harrisburg) NE 12 100% 3.83
2 Kirby Elementary School (Kirby) SW 18 100% 3.83
4 Forest Park Elementary School (Little Rock)
CN 71 94% 3.81
5 Salem Elementary School (Salem) NE 49 96% 3.80
6 Bellview Elementary School (Rogers) NW 100 95% 3.79
7 Valley View Elementary School (Valley
View)
NE 206 97% 3.78
8 Jefferson Elementary School (Little Rock) CN 42 96% 3.77
8 Norfork Elementary School (Norfork) NW 23 92% 3.77
10 Woodlawn Elementary School (Woodlawn) 45 98% 3.76

Outstanding Educational Performance Awards 2013 Page
30
I. Elementary Combined3 Math and Literacy by Grade, 2013
Table 21: Top 10 Arkansas Schools: Grade Three
Combined Math and Literacy Achievement
School (District) Region
# of
Test
Takers
%
Proficient/
Advanced
GPA
1 Park Magnet School (Hot Springs) CN 45 99% 3.89
1 Don Roberts Elementary School (Little
Rock)
CN 148 99% 3.89
1 Spring Hill Elementary School (Spring
Hill)
SW 29 98% 3.89
4 Mount Pleasant Elementary School
(Melbourne)
NE 29 99% 3.85
4 Forest Park Elementary School (Little
Rock)
CN 75 98% 3.85
6 Vandergriff Elementary School
(Fayetteville)
NW 105 97% 3.83
7 Hoxie Elementary School (Hoxie) NE 54 97% 3.82
7 Norfork Elementary School (Norfork) NW 33 100% 3.82
7 Amorel Elementary School (Amorel) NE 33 94% 3.82
7 Eagle Heights Elementary School
(Harrison)
NW 32 95% 3.82
3 Combined score is a simple average of Math and Literacy for the % Proficient/Advanced measure and the GPA
measure.

Outstanding Educational Performance Awards 2013 Page
31
Table 22: Top 10 Arkansas Schools: Grade Four Combined Math and Literacy Achievement
School (District) Region
# of
Test
Takers
%
Proficient/
Advanced
GPA
1 Park Magnet School (Hot Springs) CN 40 100% 3.93
2 Vandergriff Elementary School
(Fayetteville)
NW 95 99% 3.88
3 Mount Pleasant Elementary School
(Melbourne)
NE 26 100% 3.85
4 London Elementary School (Russellville) NW 25 98% 3.84
5 Richland Elementary School (West
Memphis)
NE 76 97% 3.78
5 Van-Cove Elementary School (Cossatot
River)
SW 24 98% 3.78
7 Emerson Elementary School (Emerson-
Taylor)
SW 20 98% 3.75
7 Eastside Elementary School (Rogers) NW 98 94% 3.75
7 Lowell Elementary School (Rogers) NW 72 96% 3.75
10 Carolyn Lewis Elementary School
(Conway)
CN 77 97% 3.74
10 Don Roberts Elementary School (Little
Rock)
CN 124 94% 3.74
Table 23: Top 10 Arkansas Schools: Grade Five
Combined Math and Literacy Achievement
School (District) Region
# of
Test
Takers
%
Proficient/
Advanced
GPA
1 Richland Elementary School (West Memphis)
NE 71 100% 3.81
2 Mount Pleasant Elementary School
(Melbourne)
NE 17 94% 3.79
3 Vandergriff Elementary School (Fayetteville) NW 115 95% 3.75
4 Bellview Elementary School (Rogers) NW 100 94% 3.71
5 Forest Park Elementary School (Little Rock) CN 71 93% 3.67
6 Salem Elementary School (Salem) NE 49 93% 3.66
7 Pottsville Middle Grades (Pottsville) NW 123 96% 3.63
8 Valley View Elementary School (Valley
View)
NE 206 95% 3.62
9 Jefferson Elementary School (Little Rock) CN 42 91% 3.61
10 Holly Harshman Elementary School (Mena) SW 124 94% 3.59
10 Hunt Elementary School (Springdale) NW 103 92% 3.59

Outstanding Educational Performance Awards 2013 Page
32
The sections below present the high-achieving schools for the noted grade and subject in each
region in 2013.
J. Northwest Region, Elementary Schools, 2013
Table 24: Top 5 Overall Elementary Schools in Northwest Arkansas Based on Benchmark Math
Achievement
School (District) Grades
Served
# of
Test
Takers
%
Proficient/
Advanced
GPA
1 Vandergriff Elementary School (Fayetteville) K-5 315 97% 3.81
2 Pottsville Elementary School (Pottsville) K-3 129 95% 3.79
3 Elm Tree Elementary School (Bentonville) K-4 255 96% 3.78
3 Central Park at Morning Star Elementary
(Bentonville)
K-4 284 97% 3.78
5 Cooper Elementary School (Bentonville) K-4 259 95% 3.74
5 Willowbrook Elementary School (Bentonville) K-4 233 94% 3.74
Table 25: Top 3 Schools by Grade Level in Northwest Arkansas Based on Benchmark Math
Achievement
School (District) # of Test
Takers
%
Proficient/
Advanced
GPA
3rd Grade
1 Eagle Heights Elementary School (Harrison) 32 97% 3.88
2 Elm Tree Elementary School (Bentonville) 121 98% 3.87
2 Bergman Elementary School (Bergman) 90 98% 3.87
4th Grade
1 London Elementary School (Russellville) 25 96% 3.88
2 Vandergriff Elementary School (Fayetteville) 95 98% 3.84
3 Charleston Elementary School (Charleston) 55 99% 3.83
5th Grade
1 Vandergriff Elementary School (Fayetteville) 115 95% 3.74
2 Bellview Elementary School (Rogers) 100 93% 3.62
3 Pottsville Middle Grades (Pottsville) 123 94% 3.57

Outstanding Educational Performance Awards 2013 Page
33
Table 26: Top 5 Overall Elementary Schools in Northwest Arkansas Based on Benchmark
Literacy Achievement
School (District) Grades
Served
# of Test
Takers
%
Proficient/
Advanced
GPA
1 Vandergriff Elementary School (Fayetteville) K-5 315 97% 3.81
2 Forest Heights Elementary School (Harrison) K-4 152 99% 3.75
3 Pottsville Elementary School (Pottsville) K-3 129 93% 3.73
4 Bellview Elementary School (Rogers) K-5 296 94% 3.72
5 Elm Tree Elementary School (Bentonville) K-4 255 97% 3.71
5 Hunt Elementary School (Springdale) K-5 306 96% 3.71
5 Norfork Elementary School (Norfork) K-6 125 95% 3.71
Table 27: Top 3 Schools by Grade Level in Northwest Arkansas Based on Benchmark Literacy
Achievement
School (District) # of Test
Takers
%
Proficient/
Advanced
GPA
3rd Grade
1 Vandergriff Elementary School (Fayetteville) 105 97% 3.80
1 Forest Heights Elementary School (Harrison) 83 99% 3.80
1 Carnall Elementary School (Fort Smith) 25 96% 3.80
4th Grade
1 Vandergriff Elementary School (Fayetteville) 95 99% 3.91
2 London Elementary School (Russellville) 25 100% 3.80
3 Eastside Elementary School (Rogers) 98 95% 3.79
5th Grade
1 Bellview Elementary School (Rogers) 100 93% 3.79
2 Norfork Elementary School (Norfork) 23 92% 3.77
3 Vandergriff Elementary School (Fayetteville) 115 94% 3.75
Outstanding Educational Performance Awards 2013 Page
34
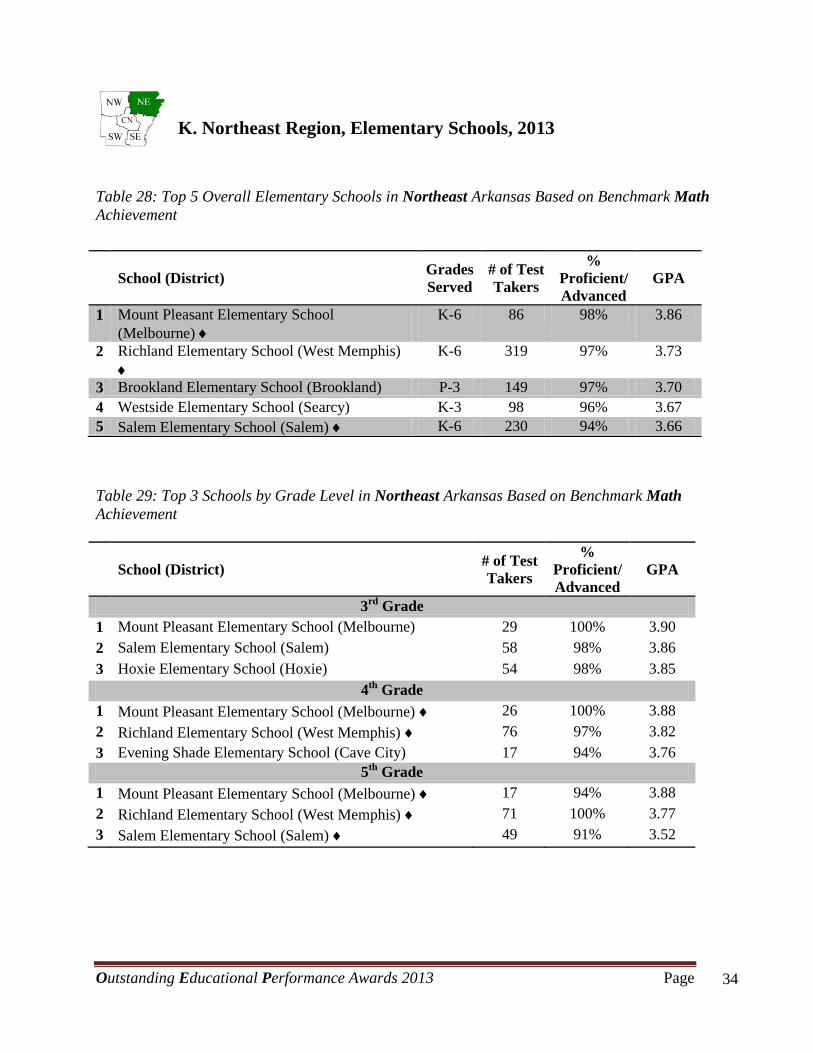
K. Northeast Region, Elementary Schools, 2013
Table 28: Top 5 Overall Elementary Schools in Northeast Arkansas Based on Benchmark Math
Achievement
Table 29: Top 3 Schools by Grade Level in Northeast Arkansas Based on Benchmark Math
Achievement
School (District) # of Test
Takers
%
Proficient/
Advanced
GPA
3rd Grade
1 Mount Pleasant Elementary School (Melbourne) 29 100% 3.90
2 Salem Elementary School (Salem) 58 98% 3.86
3 Hoxie Elementary School (Hoxie) 54 98% 3.85
4th Grade
1 Mount Pleasant Elementary School (Melbourne) 26 100% 3.88
2 Richland Elementary School (West Memphis) 76 97% 3.82
3 Evening Shade Elementary School (Cave City) 17 94% 3.76
5th Grade
1 Mount Pleasant Elementary School (Melbourne) 17 94% 3.88
2 Richland Elementary School (West Memphis) 71 100% 3.77
3 Salem Elementary School (Salem) 49 91% 3.52
School (District) Grades
Served
# of Test
Takers
%
Proficient/
Advanced
GPA
1 Mount Pleasant Elementary School
(Melbourne)
K-6 86 98% 3.86
2 Richland Elementary School (West Memphis)
K-6 319 97% 3.73
3 Brookland Elementary School (Brookland) P-3 149 97% 3.70
4 Westside Elementary School (Searcy) K-3 98 96% 3.67
5 Salem Elementary School (Salem) K-6 230 94% 3.66

Outstanding Educational Performance Awards 2013 Page
35
Table 30: Top 5 Overall Elementary Schools in Northeast Arkansas Based on Benchmark
Literacy Achievement
Table 31: Top 3 Schools by Grade Level in Northeast Arkansas Based on Benchmark Literacy
Achievement
School (District) # of Test
Takers
%
Proficient/
Advanced
GPA
3rd Grade
1 Amorel Elementary School (Amorel) 33 94% 3.82
2 Mount Pleasant Elementary School (Melbourne) 29 97% 3.80
2 Hoxie Elementary School (Hoxie) 54 96% 3.79
4th Grade
1 Mount Pleasant Elementary School (Melbourne) 26 100% 3.81
2 Richland Elementary School (West Memphis) 76 96% 3.73
3
3
Amorel Elementary School (Amorel)
Valley View Elementary School (Valley View)
30
185
97%
98%
3.67
3.67
5th Grade
1 Richland Elementary School (West Memphis) 71 100% 3.85
2 Weiner Elementary School (Harrisburg) 12 100% 3.83
3 Salem Elementary School (Salem) 49 96% 3.80
School (District) Grades
Served
# of Test
Takers
%
Proficient/
Advanced
GPA
1 Westside Elementary School (Searcy) K-3 98 94% 3.73
2 Mount Pleasant Elementary School
(Melbourne)
K-6 86 98% 3.72
3 Richland Elementary School (West Memphis)
K-6 319 95% 3.71
4 Valley View Elementary School (Valley
View)
P-6 802 95% 3.64
5 Salem Elementary School (Salem) K-6 230 92% 3.63

Outstanding Educational Performance Awards 2013 Page
36
L. Central Region, Elementary Schools, 2013
Table 32: Top 5 Overall Elementary Schools in Central Arkansas Based on Benchmark Math
Achievement
Table 33: Top 3 Schools by Grade Level in Central Arkansas Based on Benchmark Math
Achievement
School (District) # of Test
Takers
%
Proficient/
Advanced
GPA
3rd Grade
1 Don Roberts Elementary School (Little Rock) 148 100% 3.95
2 Park Magnet School (Hot Springs) 45 100% 3.91
2
2
Forest Park Elementary School (Little Rock)
Lisa Academy North Elementary School (Lisa Academy
–North Little Rock)
75
46
100%
100%
3.91
3.91
4th Grade
1 Park Magnet School (Hot Springs) 40 100% 4.00
2 Hardin Elementary School (White Hall) 37 95% 3.76
3 Don Roberts Elementary School (Little Rock) 124 94% 3.75
5th Grade
1 Forest Park Elementary School (Little Rock) 71 92% 3.52
1 Don Roberts Elementary School (Little Rock) 106 85% 3.52
3 Poyen Elementary School (Poyen) 43 84% 3.46
School (District) Grades
Served
# of Test
Takers
%
Proficient/
Advanced
GPA
1 Park Magnet School (Hot Springs) K-5 85 100% 3.96
2 Julia Lee Moore Elementary School (Conway) K-4 105 96% 3.77
3 Don Roberts Elementary School (Little Rock) P-5 378 94% 3.76
3 Academy of Technology (Vilonia) 2-4 52 100% 3.75
4 Ellen Smith Elementary School (Conway) K-4 187 93% 3.71
5 Forest Park Elementary School (Little Rock) P-5 217 95% 3.70
5 Woodrow Cummins Elementary School
(Conway)
K-4 207 96% 3.70

Outstanding Educational Performance Awards 2013 Page
37
Table 34: Top 5 Overall Elementary Schools in Central Arkansas Based on Benchmark Literacy
Achievement
Table 35: Top 3 Schools by Grade Level in Central Arkansas Based on Benchmark Literacy
Achievement
School (District) # of Test
Takers
%
Proficient/
Advanced
GPA
3rd Grade
1 Park Magnet School (Hot Springs) 45 98% 3.87
2 Don Roberts Elementary School (Little Rock) 148 96% 3.82
3
3
Forest Park Elementary School (Little Rock)
Julia Lee Moore Elementary School (Conway)
75
49
96%
98%
3.78
3.78
4th Grade
1 Park Magnet School (Hot Springs) 40 100% 3.86
2 Forest Park Elementary School (Little Rock) 71 99% 3.78
3 Ellen Smith Elementary (Conway) 90 96% 3.76
5th Grade
1 Forest Park Elementary School (Little Rock) 71 94% 3.81
2 Jefferson Elementary School (Little Rock) 42 96% 3.77
3
3
Magnet Cove Elementary School (Magnet Cove)
Perrin Elementary School (Benton)
54
102
99%
95%
3.70
3.70
School (District) Grades
Served
# of Test
Takers
%
Proficient/
Advanced
GPA
1 Park Magnet School (Hot Springs) K-5 85 99% 3.87
2 Forest Park Elementary School (Little Rock) P-5 217 96% 3.79
3 Ellen Smith Elementary School (Conway) K-4 187 95% 3.73
4 Don Roberts Elementary School (Little Rock) P-5 378 93% 3.73
5 Julia Lee Moore Elementary School (Conway) K-4 105 93% 3.71
5 Hardin Elementary School (White Hall) K-5 125 94% 3.68

Outstanding Educational Performance Awards 2013 Page
38
M. Southwest Region, Elementary Schools, 2013
Table 36: Top 5 Overall Elementary Schools in Southwest Arkansas Based on Benchmark Math
Achievement
Table 37: Top 3 Schools by Grade Level in Southwest Arkansas Based on Benchmark Math
Achievement
School (District) # of Test
Takers
%
Proficient/
Advanced
GPA
3rd Grade
1 Spring Hill Elementary School (Spring Hill) 29 100% 3.93
2 Caddo Hills Elementary School (Caddo Hills) 39 95% 3.85
2 Oscar Hamilton Elementary School (Foreman) 32 97% 3.85
4th Grade
1 Spring Hill Elementary School (Spring Hill) 38 97% 3.73
2 Van-Cove Elementary School (Cossatot River) 24 100% 3.71
3
3
Emerson Elementary School (Emerson-Taylor)
Wickes Elementary School (Cossatot River)
20
51
100%
94%
3.70
3.70
5th Grade
1 Holly Harshman Elementary School (Mena) 124 93% 3.56
2 Acorn Elementary School (Ouachita River) 40 93% 3.47
3 Parkers Chapel Elementary School (Parkers Chapel) 52 91% 3.45
School (District) Grades
Served
# of Test
Takers
%
Proficient/
Advanced
GPA
1 Centerpoint Primary School (Centerpoint) P-3 72 98% 3.79
2 College Hill Elementary School (Texarkana) K-4 132 95% 3.69
3 Genoa Central Elementary School (Genoa
Central)
K-4 138 95% 3.59
4 De Queen Elementary School (De Queen) 3-5 547 94% 3.56
5 Hugh Goodwin Elementary School (El Dorado) K-4 191 90% 3.54
Outstanding Educational Performance Awards 2013 Page
39
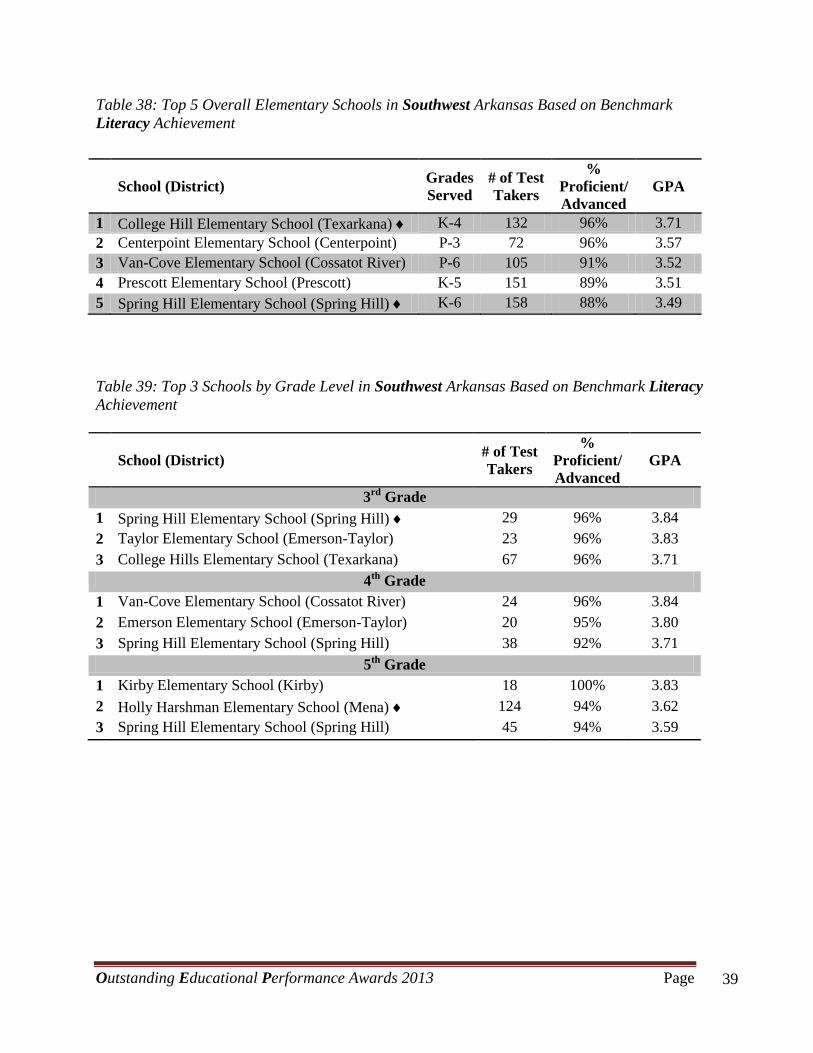
Table 38: Top 5 Overall Elementary Schools in Southwest Arkansas Based on Benchmark
Literacy Achievement
Table 39: Top 3 Schools by Grade Level in Southwest Arkansas Based on Benchmark Literacy
Achievement
School (District) # of Test
Takers
%
Proficient/
Advanced
GPA
3rd Grade
1 Spring Hill Elementary School (Spring Hill) 29 96% 3.84
2 Taylor Elementary School (Emerson-Taylor) 23 96% 3.83
3 College Hills Elementary School (Texarkana) 67 96% 3.71
4th Grade
1 Van-Cove Elementary School (Cossatot River) 24 96% 3.84
2 Emerson Elementary School (Emerson-Taylor) 20 95% 3.80
3 Spring Hill Elementary School (Spring Hill) 38 92% 3.71
5th Grade
1 Kirby Elementary School (Kirby) 18 100% 3.83
2 Holly Harshman Elementary School (Mena) 124 94% 3.62
3 Spring Hill Elementary School (Spring Hill) 45 94% 3.59
School (District) Grades
Served
# of Test
Takers
%
Proficient/
Advanced
GPA
1 College Hill Elementary School (Texarkana) K-4 132 96% 3.71
2 Centerpoint Elementary School (Centerpoint) P-3 72 96% 3.57
3 Van-Cove Elementary School (Cossatot River) P-6 105 91% 3.52
4 Prescott Elementary School (Prescott) K-5 151 89% 3.51
5 Spring Hill Elementary School (Spring Hill) K-6 158 88% 3.49
Outstanding Educational Performance Awards 2013 Page
40
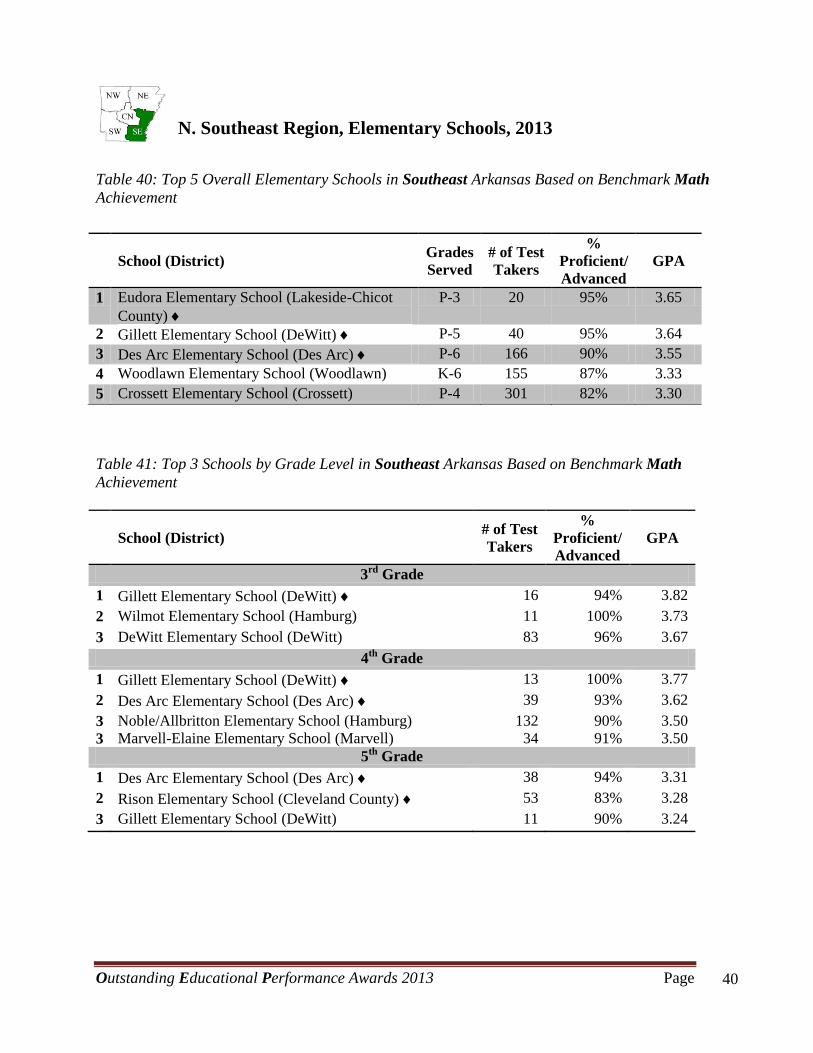
N. Southeast Region, Elementary Schools, 2013
Table 40: Top 5 Overall Elementary Schools in Southeast Arkansas Based on Benchmark Math
Achievement
Table 41: Top 3 Schools by Grade Level in Southeast Arkansas Based on Benchmark Math
Achievement
School (District) # of Test
Takers
%
Proficient/
Advanced
GPA
3rd Grade
1 Gillett Elementary School (DeWitt) 16 94% 3.82
2 Wilmot Elementary School (Hamburg) 11 100% 3.73
3 DeWitt Elementary School (DeWitt) 83 96% 3.67
4th Grade
1 Gillett Elementary School (DeWitt) 13 100% 3.77
2 Des Arc Elementary School (Des Arc) 39 93% 3.62
3
3
Noble/Allbritton Elementary School (Hamburg)
Marvell-Elaine Elementary School (Marvell)
132
34
90%
91%
3.50
3.50
5th Grade
1 Des Arc Elementary School (Des Arc) 38 94% 3.31
2 Rison Elementary School (Cleveland County) 53 83% 3.28
3 Gillett Elementary School (DeWitt) 11 90% 3.24
School (District) Grades
Served
# of Test
Takers
%
Proficient/
Advanced
GPA
1 Eudora Elementary School (Lakeside-Chicot
County)
P-3 20 95% 3.65
2 Gillett Elementary School (DeWitt) P-5 40 95% 3.64
3 Des Arc Elementary School (Des Arc) P-6 166 90% 3.55
4 Woodlawn Elementary School (Woodlawn) K-6 155 87% 3.33
5 Crossett Elementary School (Crossett) P-4 301 82% 3.30

Outstanding Educational Performance Awards 2013 Page
41
Table 42: Top 5 Overall Elementary Schools in Southeast Arkansas Based on Benchmark
Literacy Achievement
Table 41: Top 3 Schools by Grade Level in Southeast Arkansas Based on Benchmark Literacy
Achievement
School (District) # of Test
Takers
%
Proficient/
Advanced
GPA
3rd Grade
1 Gillett Elementary School (DeWitt) 16 94% 3.75
2 C. B. Partee Elementary School (Brinkley) 40 91% 3.61
3 Kingsland Elementary School (Cleveland County) 24 88% 3.53
4th Grade
1 Kingsland Elementary School (Cleveland County) 11 91% 3.73
2 Gillett Elementary School (DeWitt) 13 100% 3.62
3 C. B. Partee Elementary School (Brinkley) 41 88% 3.54
5th Grade
1 Woodlawn Elementary School (Woodlawn) 45 98% 3.76
2 Gillett Elementary School (DeWitt) 11 91% 3.55
3 Des Arc Elementary School (Des Arc) 38 89% 3.54
This concludes the High-Achieving Elementary Schools Outstanding Educational Performance
Awards. We would like to congratulate ALL of the schools on our high-achieving lists. Our next
installment, High-Achieving Middle Schools, takes a deeper look at middle schools and
highlights schools by grade levels and by regions.
School (District) Grades
Served
# of Test
Takers
%
Proficient/
Advanced
GPA
1 Gillett Elementary School (DeWitt) P-5 40 95% 3.65
2 Des Arc Elementary School (Des Arc) P-6 166 88% 3.42
3 C.B. Partee Elementary School (Brinkley) K-6 153 83% 3.36
4 Eudora Elementary School (Lakeside-Chicot
County)
P-3 20 80% 3.35
5 Noble/Allbritton Elementary School
(Hamburg)
K-5 373 86% 3.32

Outstanding Educational Performance Awards 2013 Page A1
APPENDIX A. Methods
The Office for Education Policy strives to make all of our calculations and publications
transparent to our readers. Thus, in this appendix we describe our data source, calculations
performed on these data for the purposes of our reporting, and our method for determining a
school’s classification as an elementary, middle, or high school.
All data used in this report were obtained from the Arkansas Department of Education.
Benchmark and End-of-Course exam scores were obtained from the testing section
(http://www.arkansased.org/divisions/learning-services/student-assessment). Other data, such as
the percent of students eligible for free and reduced lunch, were obtained from the Arkansas
Department of Education Data Center (http://adedata.arkansas.gov).
All data were analyzed at the school level; however, the ADE provides the percentage of scores
at the proficient and advanced level by grade. Therefore, in order to present an accurate school-
level percentage of students scoring proficient and advanced across all grades, a weighted
average for each school was calculated to account for different levels of enrollment at each grade
level. In an effort to highlight schools that were strong in both subject areas, we calculated a
simple average of the school level percent proficient and advanced in math and literacy at the
elementary and middle school levels.
As previously discussed in the introduction, in order to calculate the GPA measure we treat the
benchmark test scores similar to the existing grade point system.
We calculated the GPA measure for every schools math, literacy, and combined math and
literacy scores. The GPA measure is comprehensive in that it takes into account all of the test
score levels (advanced, proficient, basic, and below basic), instead of lumping together advanced
and proficient scores.
Category GPA Points
Awarded
Advanced 4.0
Proficient 3.0
Basic 2.0
Below Basic 1.0

Outstanding Educational Performance Awards 2013 Page A2
B. School Classification
For the OEP Awards, we classified schools based on the following rules:
Elementary School: primarily grades 3-5 (minimum grade P, K, 1, 2, 3, or 4)
Middle School: primarily grades 6-8 (minimum grade of 4, 5, or 6 and maximum grade
of 7, 8, or 9)
There were also a few “comprehensive schools,” such as K-8 or K-12 schools, that we included
as either middle schools or elementary schools based on their enrollment numbers. The following
table lists every grade configuration and their classifications.
Table A: School Classifications
Elementary
Schools
Middle Schools
1-4 4-6
1-5 4-8
1-6 5-6
1-8 5-7
2-3 5-8
2-4 5-9
2-5 5-12
2-6 6
3-4 6-12
3-5 6-7
3-6 6-8
4-5 7-12
5 7-8
K-3 7-9
K-4 8
K-5 8-9
K-6 K-12
K-7 8-12
K-8
P-2
P-3
P-4
P-5
P-6
P-7
P-8