Embed Size (px)
Citation preview
1
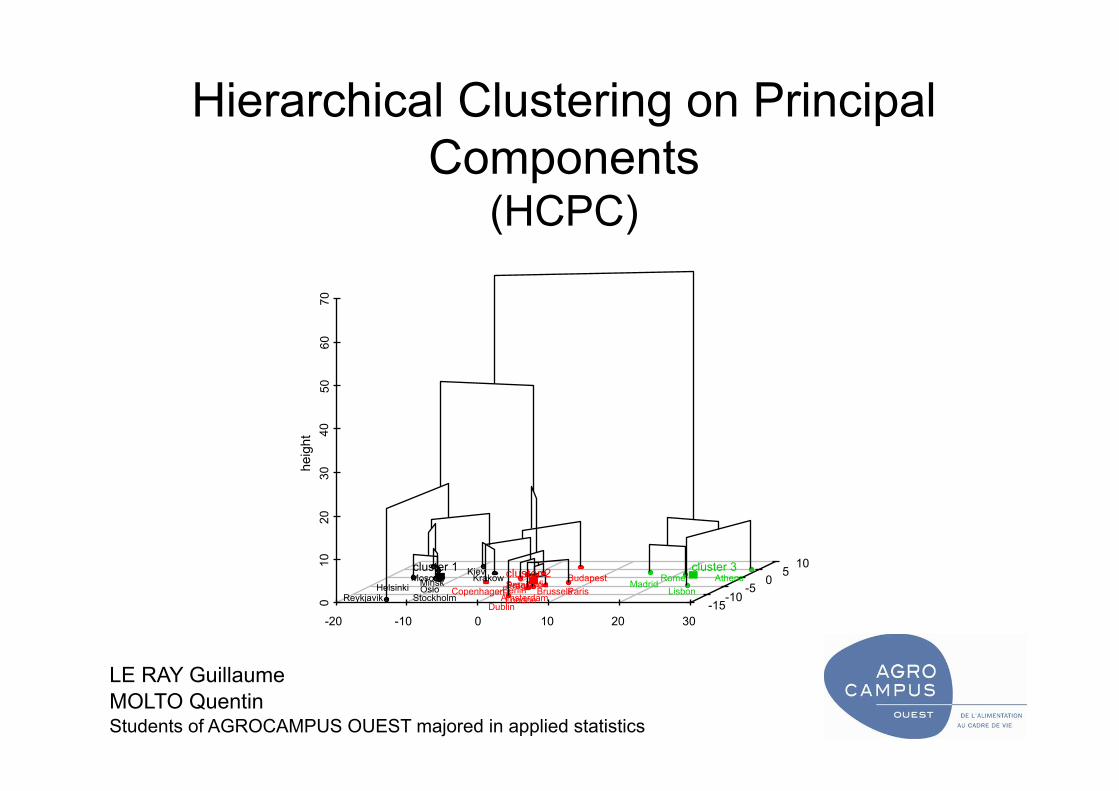
Hierarchical Clustering on Principal Components
(HCPC)
LE RAY Guillaume MOLTO Quentin Students of AGROCAMPUS OUEST majored in applied statistics
-20 -10 0 10 20 30 0
10
20
30
40
50
60
70
-15 -10 -5 0 5
10
heig
ht
Moscow Helsinki Minsk
Reykjavik Oslo Stockholm
Kiev Krakow
Copenhagen Prague Berlin Sarajevo Sofia Dublin London Amsterdam
Budapest Brussels Paris Madrid Rome
Lisbon Athens cluster 1 cluster 2 cluster 3
2
Context
• R: A free, opensource software for statistics (1875 packages).
• FactoMineR: a R package, developped in Agrocampus-Ouest, dedicated to factorial analysis.
• The aim is to create a complementary tool to this package, dedicated to clustering, especially after a factorial analysis.
• Wide range of choices and uses, results, and graphical representations.
Le Ray, Molto - Agrocampus-Ouest Students - Feb. 09 - "HCPC"

3
Clustering and factorial analysis
• Factorial analysis and hierarchical clustering are very complementary tools to explore data.
• Removing the last factors of a factorial analysis remove noise and makes the clustering robuster.
Analyses factorielles simples et multiples 4éme édition, Escofier,Pagès 2008
Le Ray, Molto - Agrocampus-Ouest Students - Feb. 09 - "HCPC"
4
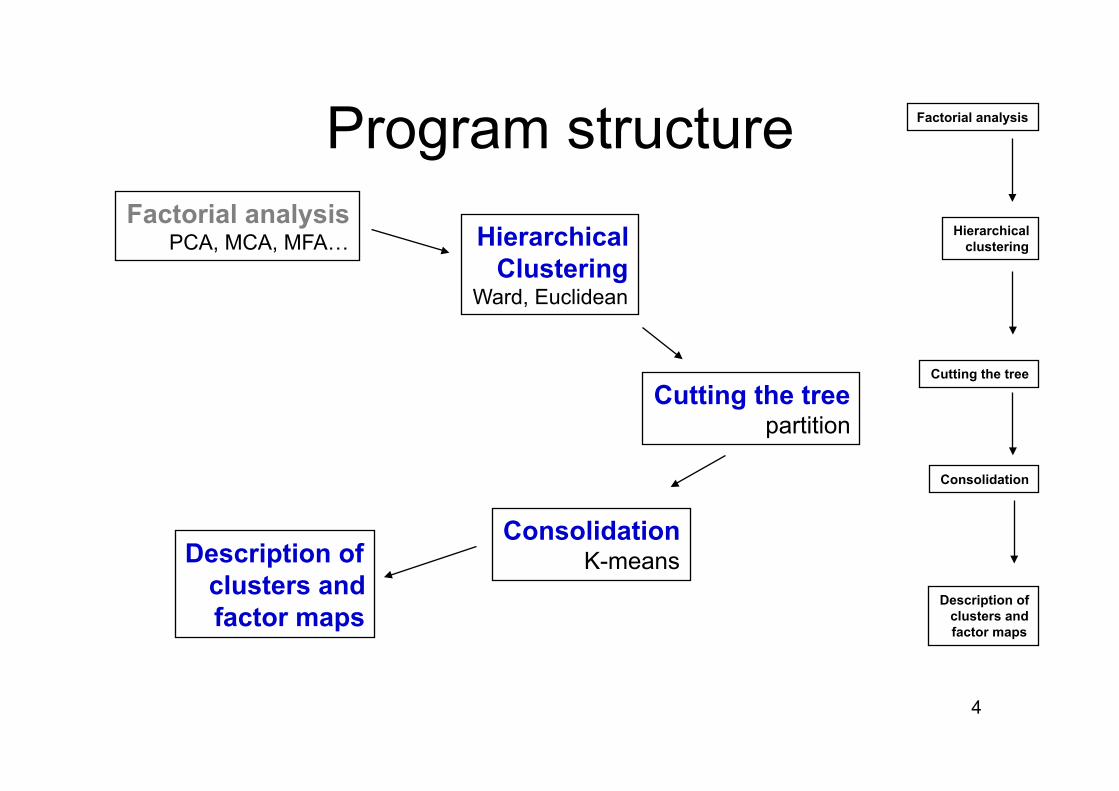
Program structure Factorial analysis
Hierarchical clustering
Cutting the tree
Consolidation
Description of clusters and factor maps
Factorial analysis PCA, MCA, MFA… Hierarchical
Clustering Ward, Euclidean
Cutting the tree partition
Consolidation K-means Description of
clusters and factor maps
5
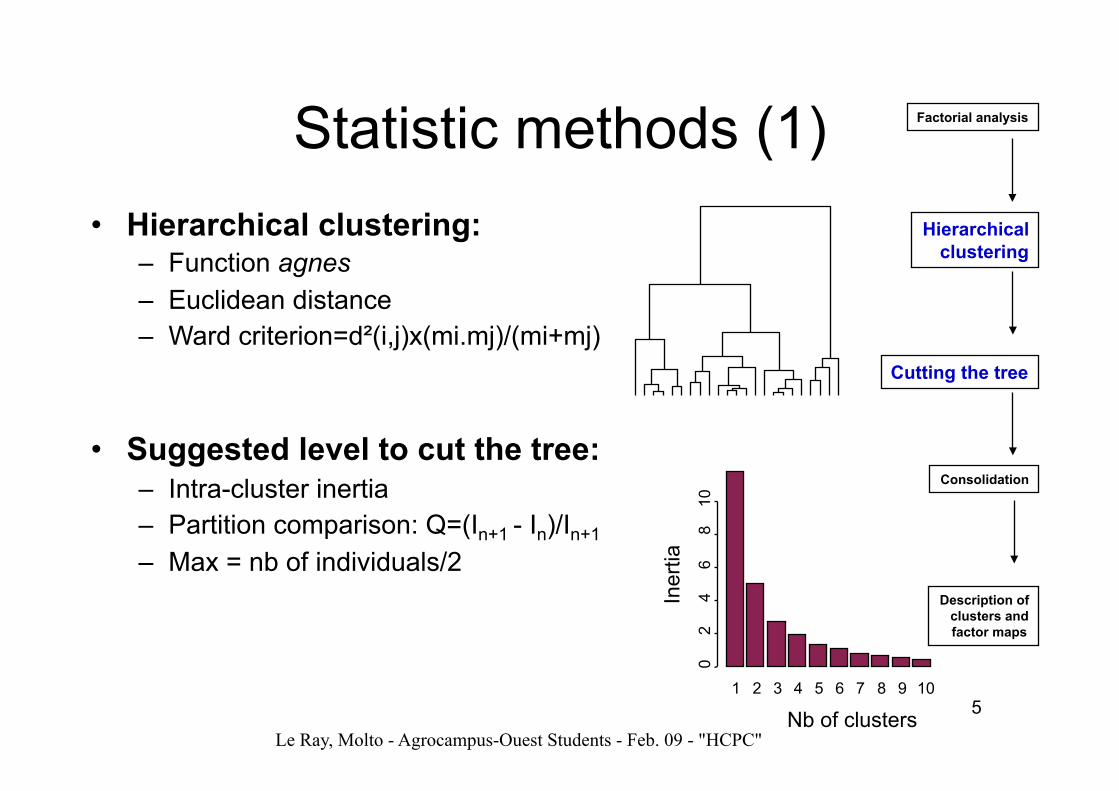
Statistic methods (1) • Hierarchical clustering:
– Function agnes – Euclidean distance – Ward criterion=d²(i,j)x(mi.mj)/(mi+mj)
• Suggested level to cut the tree: – Intra-cluster inertia – Partition comparison: Q=(In+1 - In)/In+1
– Max = nb of individuals/2
Le Ray, Molto - Agrocampus-Ouest Students - Feb. 09 - "HCPC"
1 2 3 4 5 6 7 8 9 10 Nb of clusters
Iner
tia
0 2 4
6 8 10
Factorial analysis
Hierarchical clustering
Cutting the tree
Consolidation
Description of clusters and factor maps
6
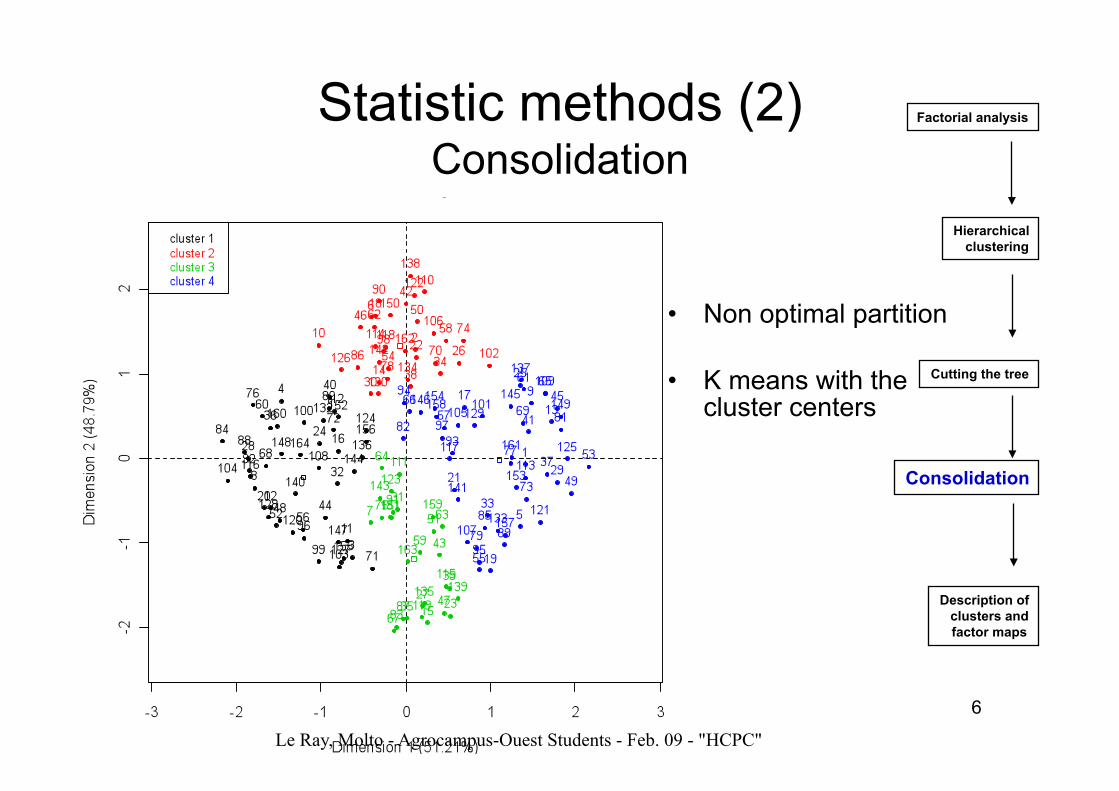
Statistic methods (2) Consolidation
Le Ray, Molto - Agrocampus-Ouest Students - Feb. 09 - "HCPC"
Factorial analysis
Hierarchical clustering
Cutting the tree
Consolidation
Description of clusters and factor maps
• Non optimal partition
• K means with the cluster centers
7
Le Ray, Molto - Agrocampus-Ouest Students - Feb. 09 - "HCPC"
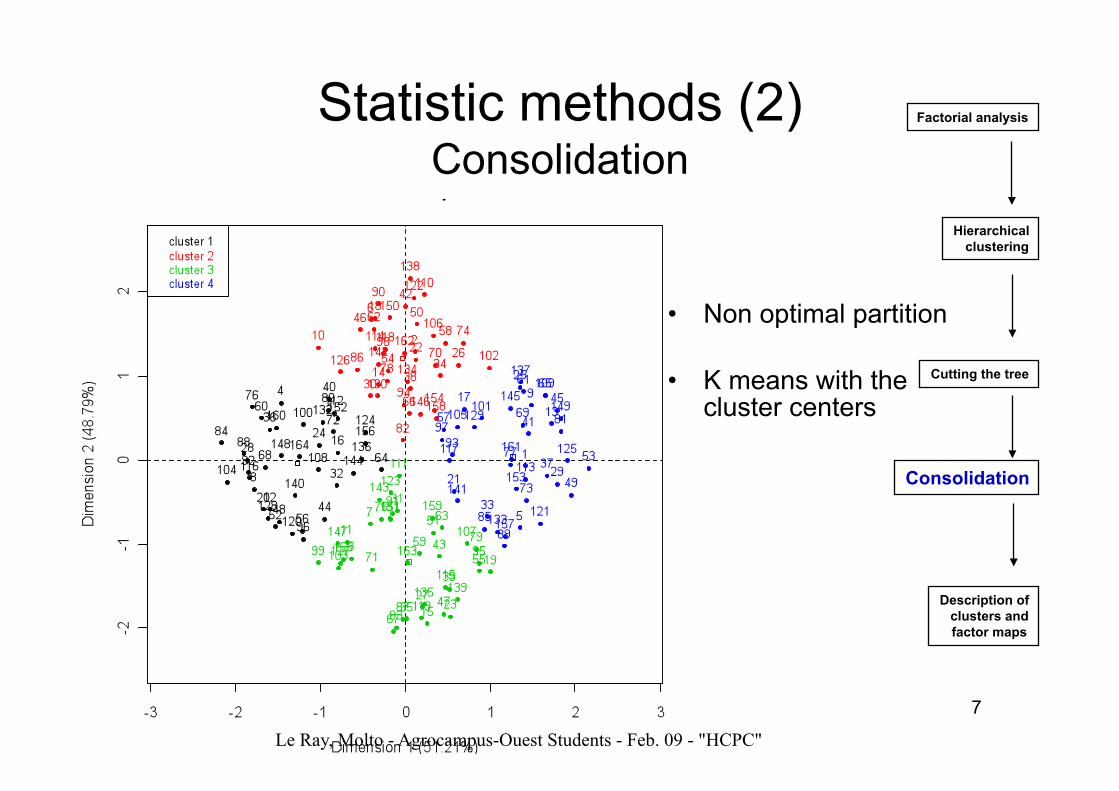
Statistic methods (2) Consolidation
Factorial analysis
Hierarchical clustering
Cutting the tree
Consolidation
Description of clusters and factor maps
• Non optimal partition
• K means with the cluster centers
8
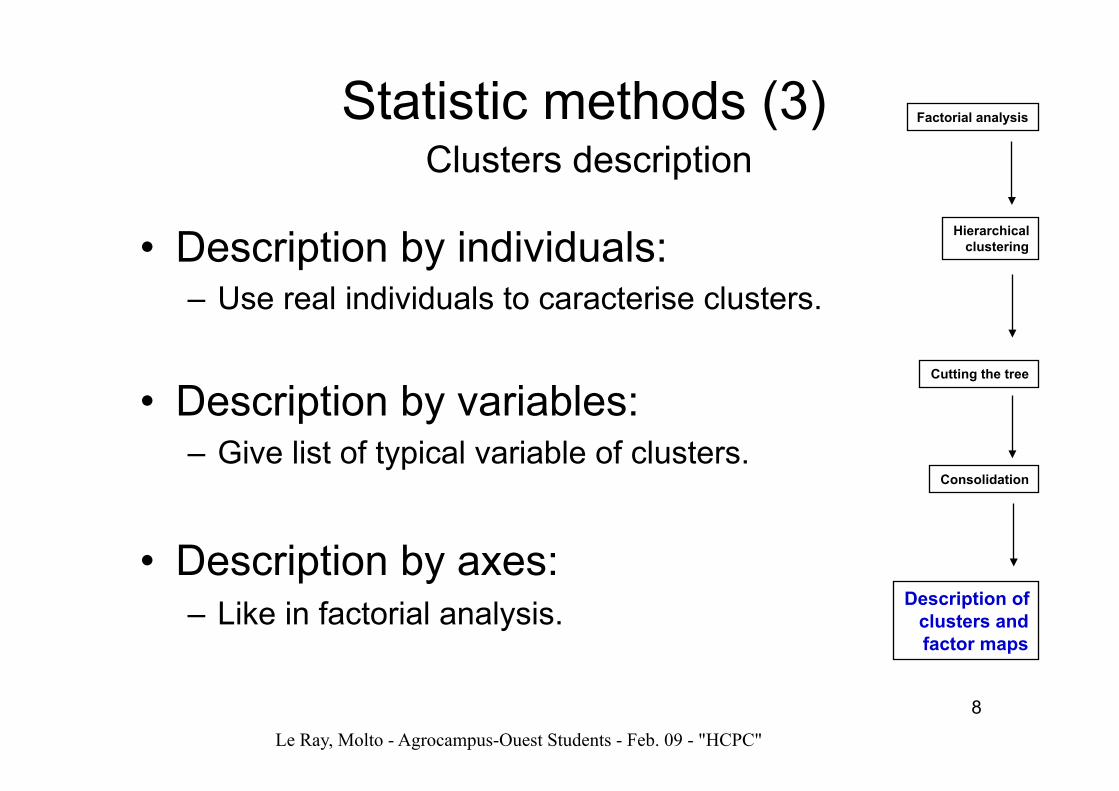
• Description by individuals: – Use real individuals to caracterise clusters.
• Description by variables: – Give list of typical variable of clusters.
• Description by axes: – Like in factorial analysis.
Le Ray, Molto - Agrocampus-Ouest Students - Feb. 09 - "HCPC"
Statistic methods (3) Clusters description
Factorial analysis
Hierarchical clustering
Cutting the tree
Consolidation
Description of clusters and factor maps
9
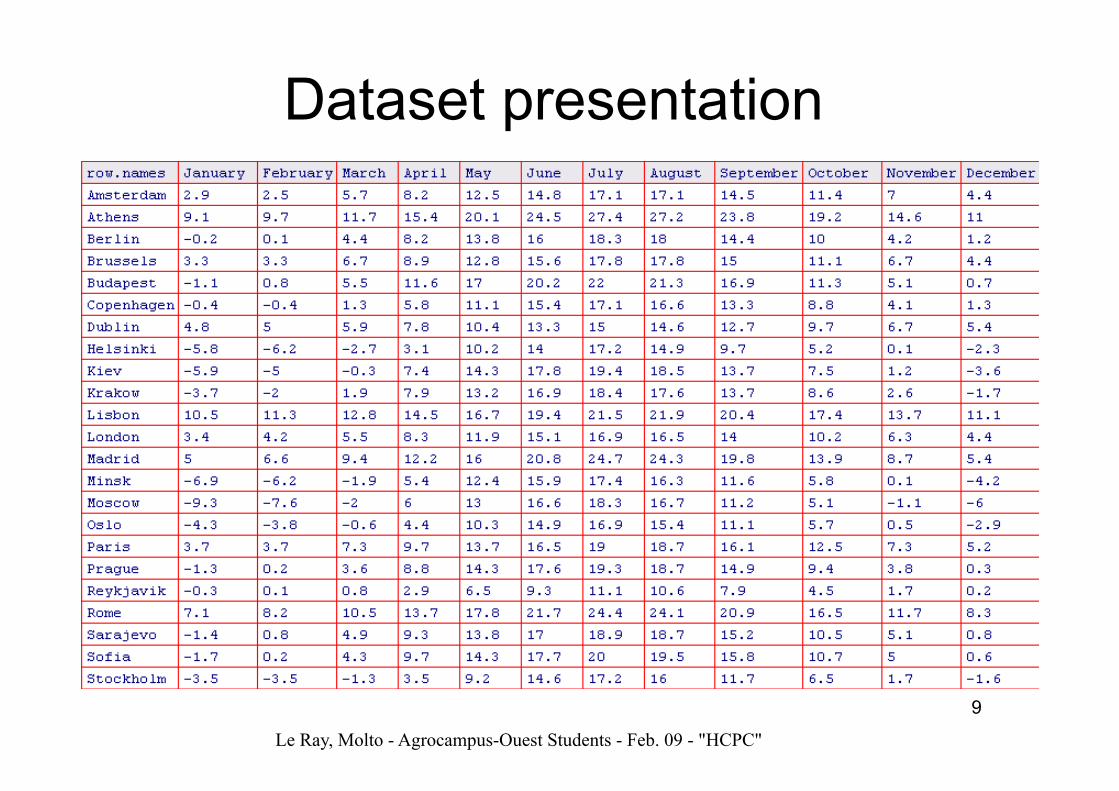
Dataset presentation
Le Ray, Molto - Agrocampus-Ouest Students - Feb. 09 - "HCPC"
10
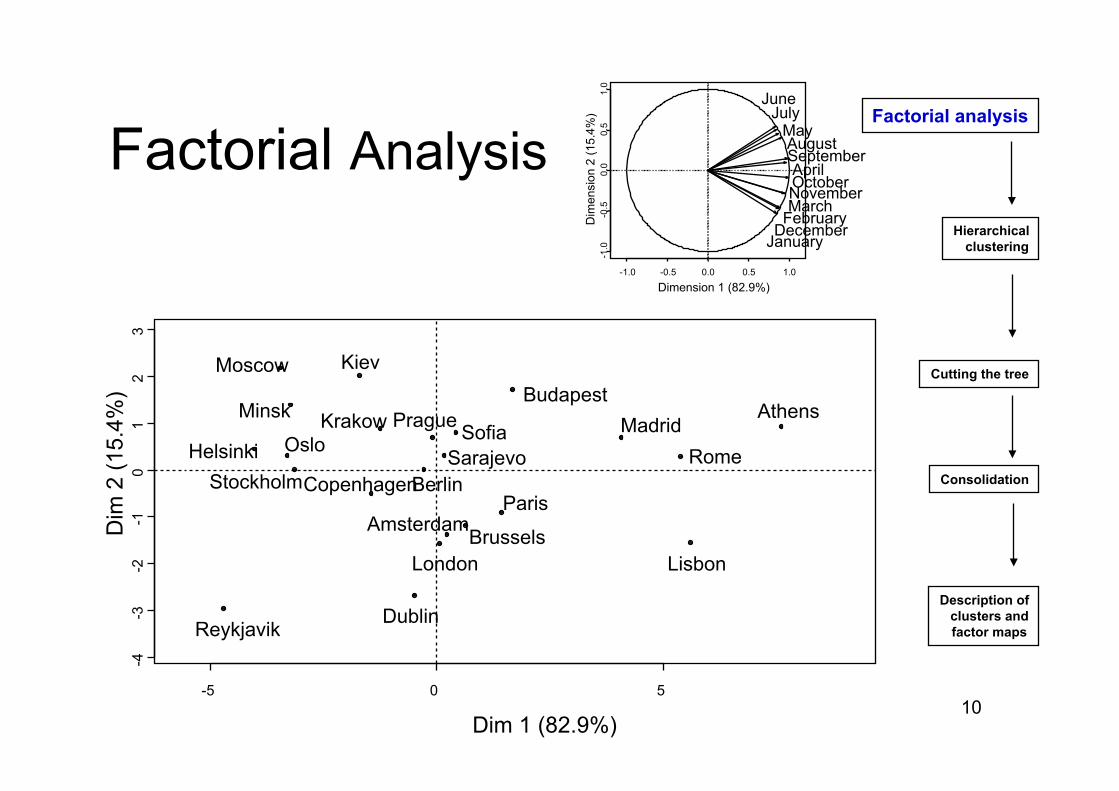
Factorial Analysis
-5 0 5
-4
-3
-2
-1
0 1
2 3
Dim 1 (82.9%)
Dim
2 (1
5.4%
)
Amsterdam
Athens
Berlin
Brussels
Budapest
Copenhagen
Dublin
Helsinki
Kiev
Krakow
Lisbon London
Madrid Minsk
Moscow
Oslo
Paris
Prague
Reykjavik
Rome Sarajevo Sofia
Stockholm
-1.0 -0.5 0.0 0.5 1.0 -1.0 -
0.5
0.0
0.5
1.0
Dimension 1 (82.9%)
Dim
ensi
on 2
(15.
4%)
January February March
April
May
June July
August September October November
December
Factorial analysis
Hierarchical clustering
Cutting the tree
Consolidation
Description of clusters and factor maps
11 0
20 40
60 80
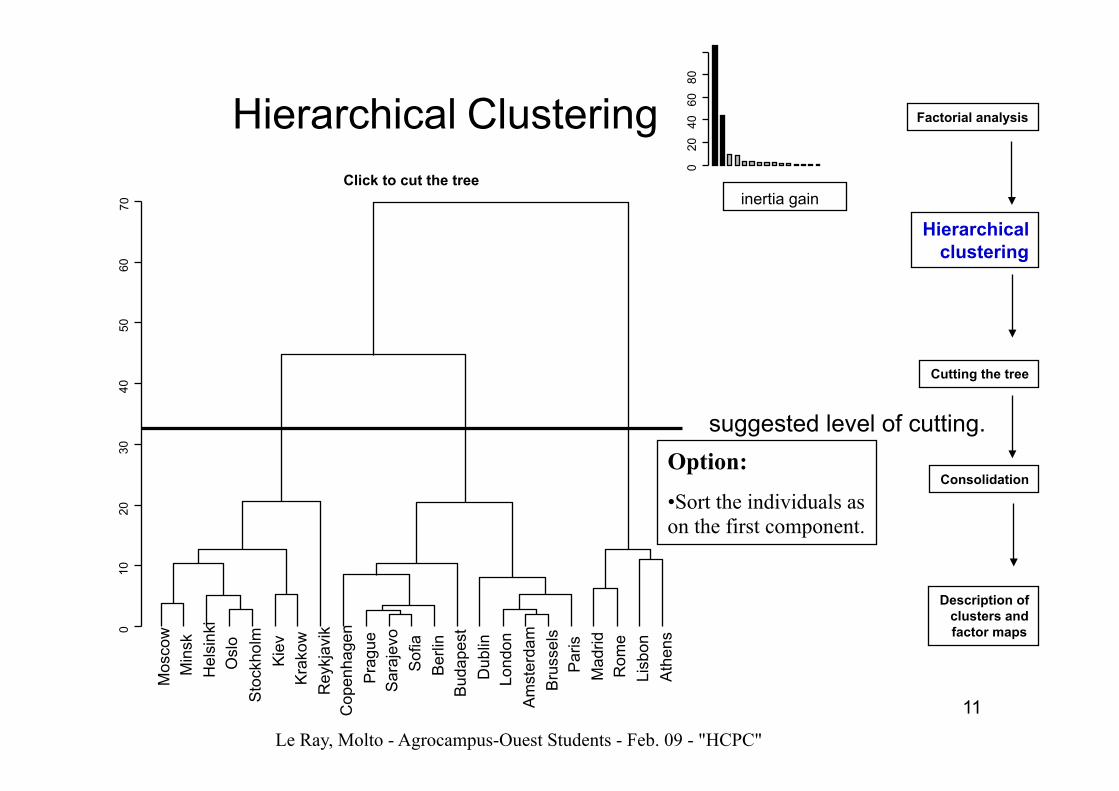
Hierarchical Clustering
inertia gain M
osco
w
Min
sk
Hel
sink
i O
slo
Sto
ckho
lm
Kie
v
Kra
kow
R
eykj
avik
C
open
hage
n
Pra
gue
Sar
ajev
o
Sof
ia
Ber
lin
Bud
apes
t D
ublin
Lo
ndon
A
mst
erda
m
Bru
ssel
s P
aris
M
adrid
R
ome
Lisb
on
Ath
ens 0
10
20
30
40
50
60
70 Click to cut the tree
suggested level of cutting. Option: • Sort the individuals as on the first component.
Le Ray, Molto - Agrocampus-Ouest Students - Feb. 09 - "HCPC"
Factorial analysis
Hierarchical clustering
Cutting the tree
Consolidation
Description of clusters and factor maps
12
Mos
cow
Min
sk
Hel
sink
i O
slo
Sto
ckho
lm
Kie
v
Kra
kow
R
eykj
avik
C
open
hage
n
Pra
gue
Sar
ajev
o
Sof
ia
Ber
lin
Bud
apes
t D
ublin
Lo
ndon
A
mst
erda
m
Bru
ssel
s P
aris
M
adrid
R
ome
Lisb
on
Ath
ens 0
10
20
30
40
50
60
70
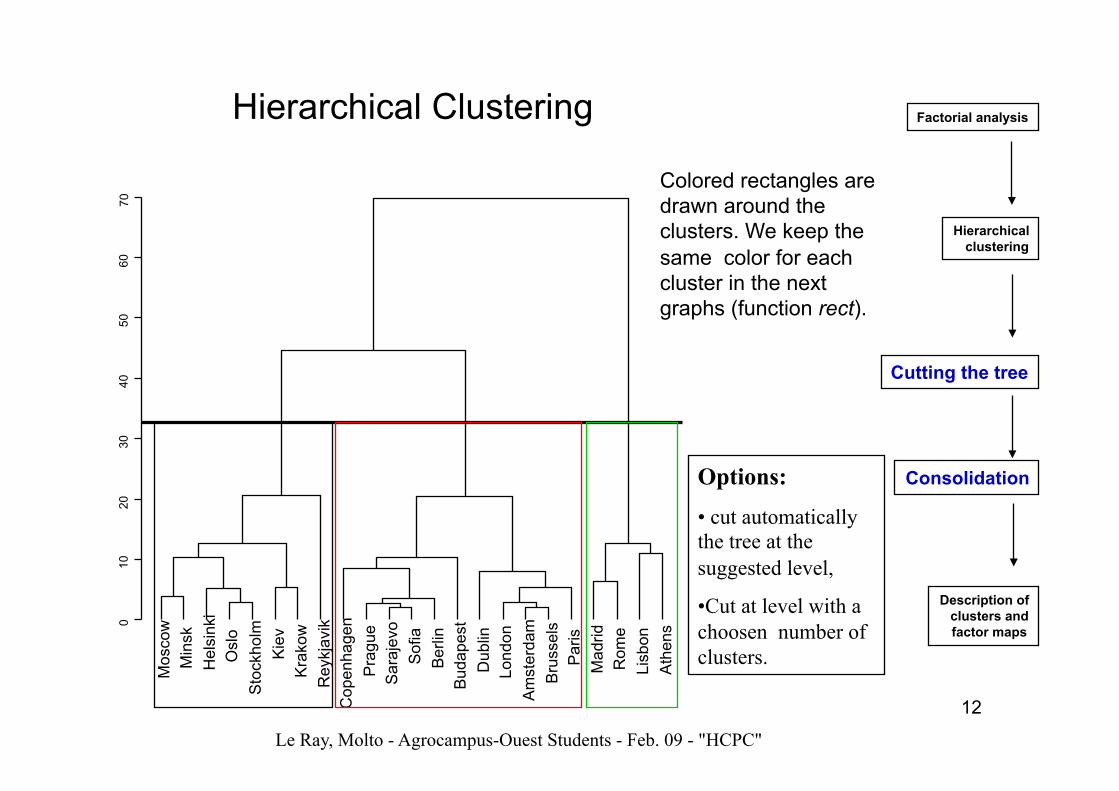
Hierarchical Clustering
Colored rectangles are drawn around the clusters. We keep the same color for each cluster in the next graphs (function rect).
Options: • cut automatically the tree at the suggested level,
• Cut at level with a choosen number of clusters.
Le Ray, Molto - Agrocampus-Ouest Students - Feb. 09 - "HCPC"
Factorial analysis
Hierarchical clustering
Cutting the tree
Consolidation
Description of clusters and factor maps
13
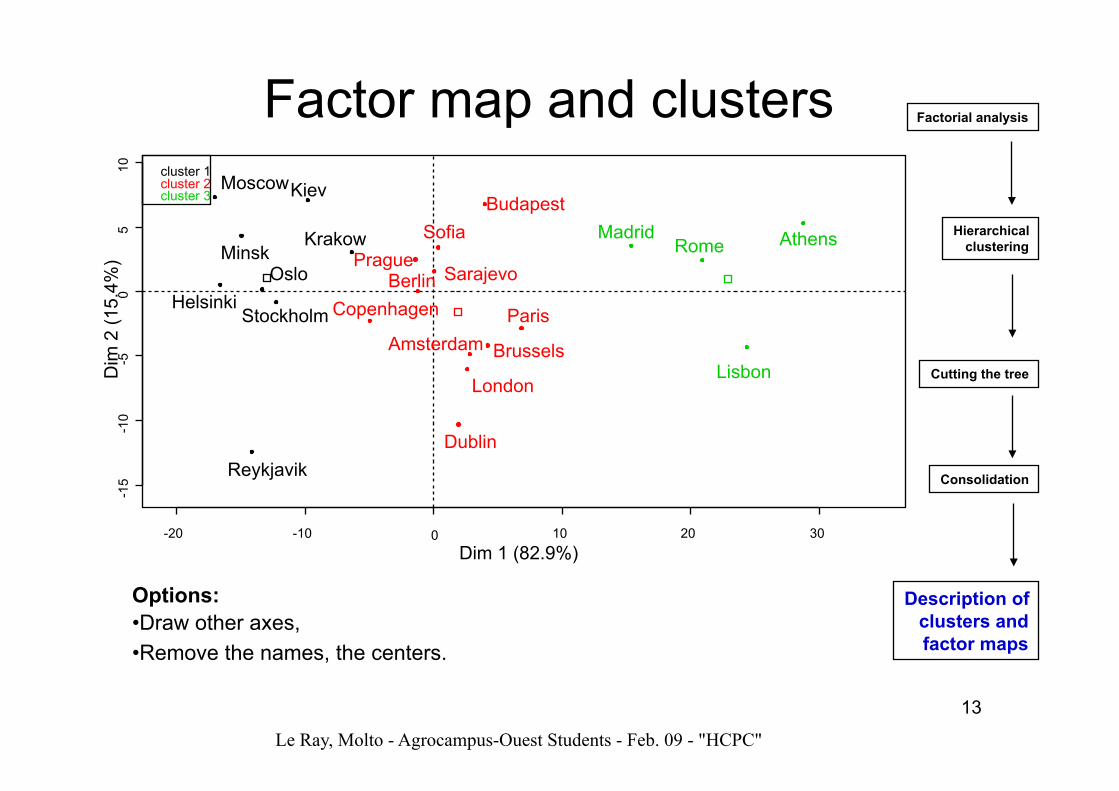
Options: • Draw other axes, • Remove the names, the centers.
Le Ray, Molto - Agrocampus-Ouest Students - Feb. 09 - "HCPC"
Factor map and clusters
-20 -10 0 10 20 30
-15
-10
-5
0 5
10
Dim 1 (82.9%)
Dim
2 (1
5.4%
)
Moscow
Helsinki Minsk
Reykjavik
Oslo Stockholm
Kiev Krakow
Copenhagen Prague
Berlin Sarajevo Sofia
Dublin London
Amsterdam
Budapest
Brussels Paris
Madrid Rome
Lisbon
Athens cluster 1 cluster 2 cluster 3
Factorial analysis
Hierarchical clustering
Cutting the tree
Consolidation
Description of clusters and factor maps
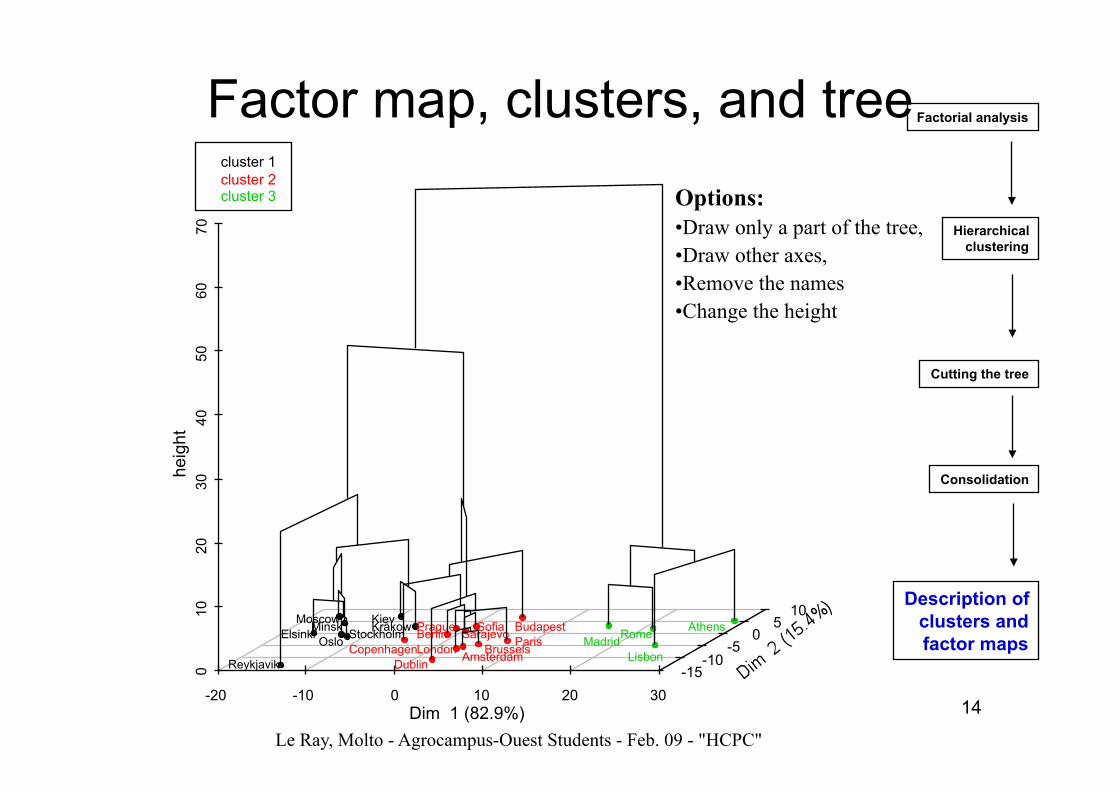
14 -20 -10 0 10 20 30
0
10
20
30
40
50
60
70
-15 -10 -5 0 5
10
Dim 1 (82.9%)
heig
ht
cluster 1 cluster 2 cluster 3
Moscow Elsinki Minsk
Reykjavik Oslo Stockholm Kiev Krakow
Copenhagen Prague Berlin Sarajevo Sofia
Dublin London Amsterdam Budapest
Brussels Paris Madrid Rome Lisbon
Athens
Options: • Draw only a part of the tree, • Draw other axes, • Remove the names • Change the height
Le Ray, Molto - Agrocampus-Ouest Students - Feb. 09 - "HCPC"
Factor map, clusters, and tree Factorial analysis
Hierarchical clustering
Cutting the tree
Consolidation
Description of clusters and factor maps
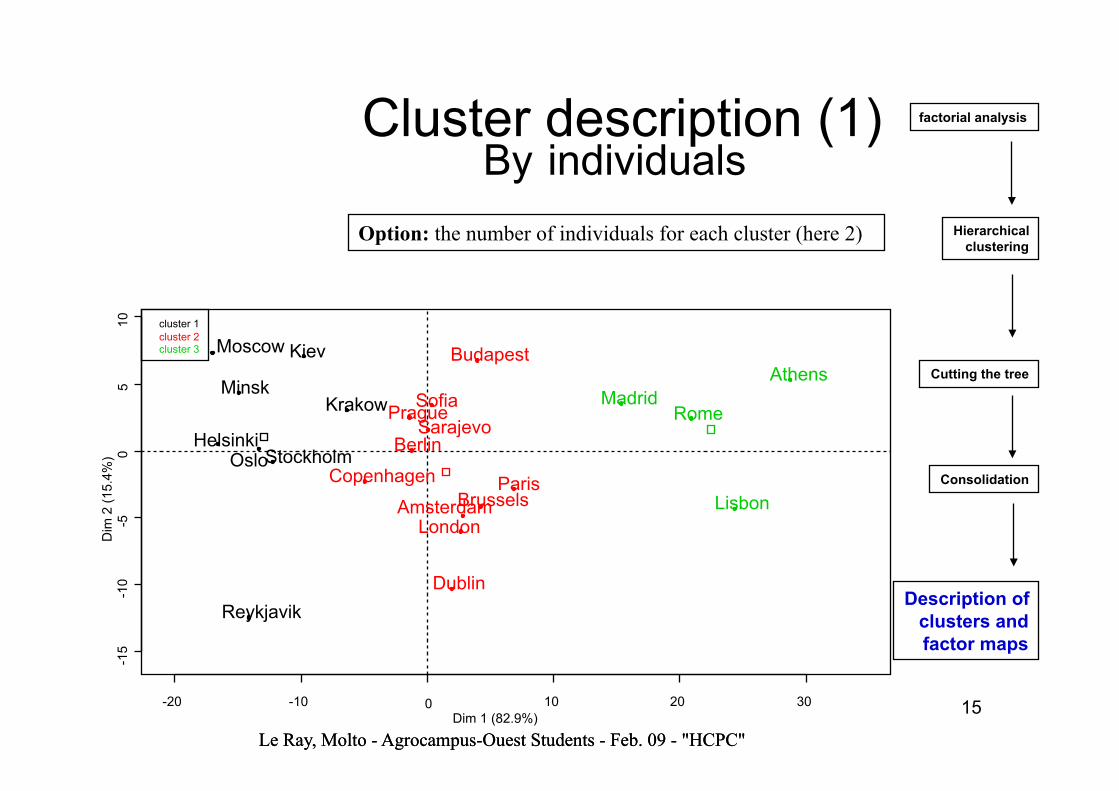
15
Le Ray, Molto - Agrocampus-Ouest Students - Feb. 09 - "HCPC"
-20 -10 0 10 20 30
-15
-10
-5
0 5
10
Dim 1 (82.9%)
Dim
2 (1
5.4%
)
Moscow
Helsinki
Minsk
Reykjavik
Oslo Stockholm
Kiev
Krakow
Copenhagen
Prague
Berlin Sarajevo Sofia
Dublin
London Amsterdam
Budapest
Brussels Paris
Madrid Rome
Lisbon
Athens
cluster 1 cluster 2 cluster 3
Le Ray, Molto - Agrocampus-Ouest Students - Feb. 09 - "HCPC"
factorial analysis
Hierarchical clustering
Cutting the tree
Consolidation
Description of clusters and factor maps
Option: the number of individuals for each cluster (here 2)
Cluster description (1) By individuals
16
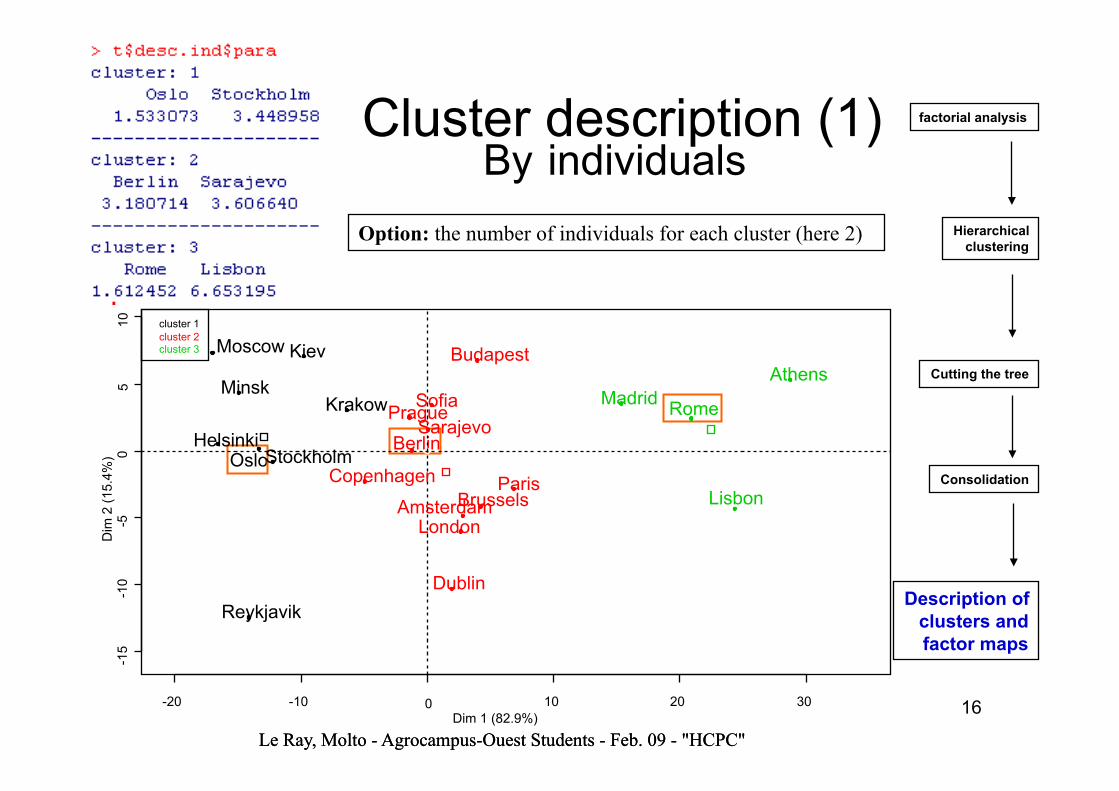
Option: the number of individuals for each cluster (here 2)
Berlin Oslo
Rome
Le Ray, Molto - Agrocampus-Ouest Students - Feb. 09 - "HCPC"
-20 -10 0 10 20 30
-15
-10
-5
0 5
10
Dim 1 (82.9%)
Dim
2 (1
5.4%
)
Moscow
Helsinki
Minsk
Reykjavik
Stockholm
Kiev
Krakow
Copenhagen
Prague Sarajevo Sofia
Dublin
London Amsterdam
Budapest
Brussels Paris
Madrid
Lisbon
Athens
cluster 1 cluster 2 cluster 3
Le Ray, Molto - Agrocampus-Ouest Students - Feb. 09 - "HCPC"
factorial analysis
Hierarchical clustering
Cutting the tree
Consolidation
Description of clusters and factor maps
Cluster description (1) By individuals
17
Le Ray, Molto - Agrocampus-Ouest Students - Feb. 09 - "HCPC"
-20 -10 0 10 20 30
-15
-10
-5
0 5
10
Dim 1 (82.9%)
Dim
2 (1
5.4%
)
Moscow
Helsinki
Minsk
Reykjavik
Oslo Stockholm
Kiev
Krakow
Copenhagen
Prague
Berlin Sarajevo Sofia
Dublin
London Amsterdam
Budapest
Brussels Paris
Madrid Rome
Lisbon
Athens
cluster 1 cluster 2 cluster 3
Le Ray, Molto - Agrocampus-Ouest Students - Feb. 09 - "HCPC"
factorial analysis
Hierarchical clustering
Cutting the tree
Consolidation
Description of clusters and factor maps
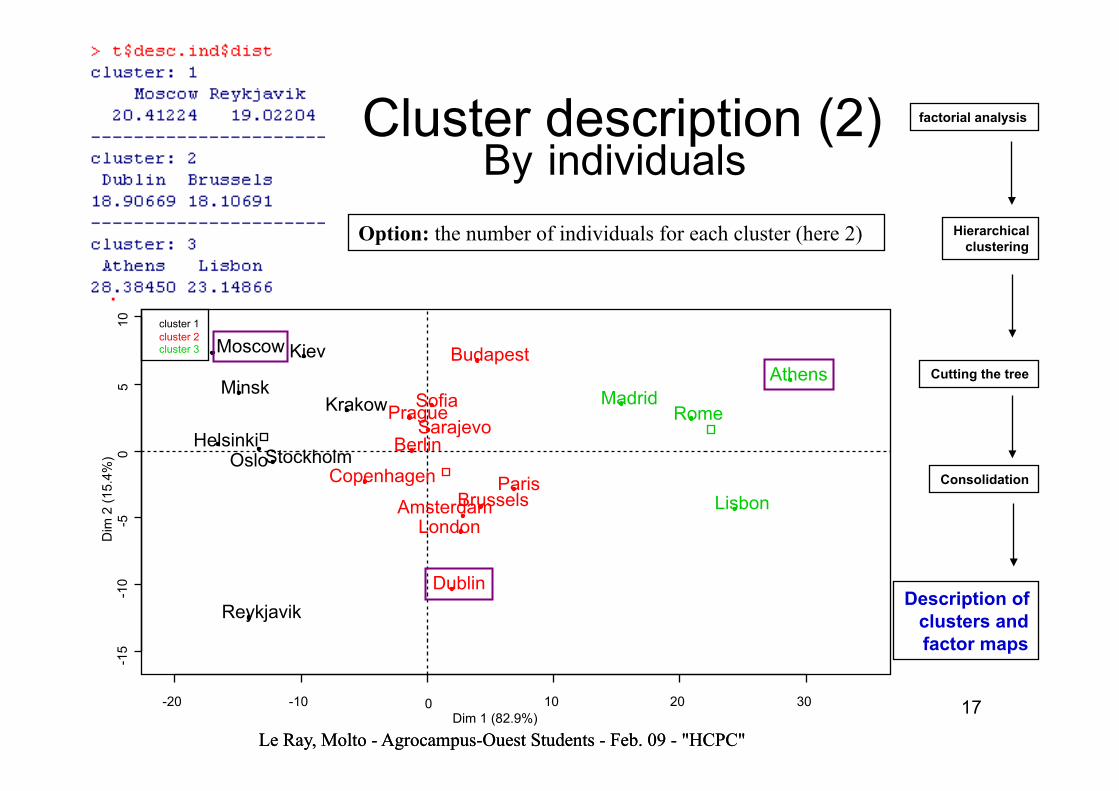
Option: the number of individuals for each cluster (here 2)
Cluster description (2) By individuals
18
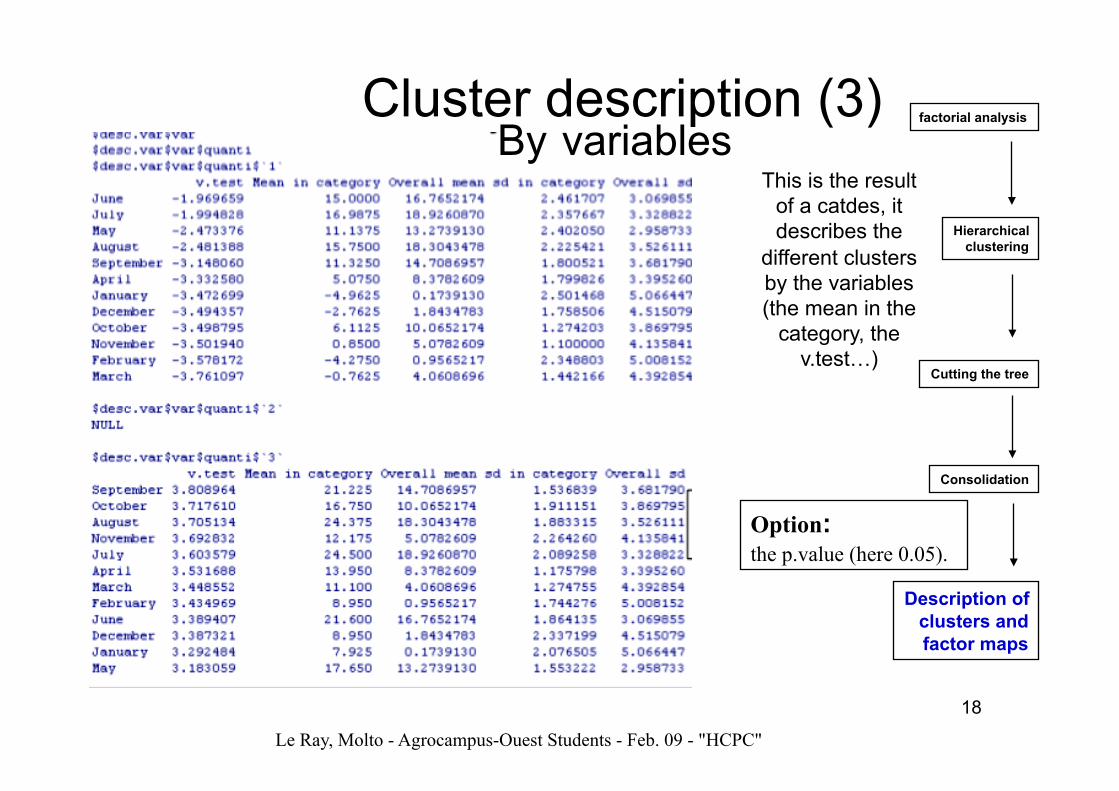
This is the result of a catdes, it describes the
different clusters by the variables (the mean in the
category, the v.test…)
Option: the p.value (here 0.05).
Le Ray, Molto - Agrocampus-Ouest Students - Feb. 09 - "HCPC"
factorial analysis
Hierarchical clustering
Cutting the tree
Consolidation
Description of clusters and factor maps
Cluster description (3) By variables
19
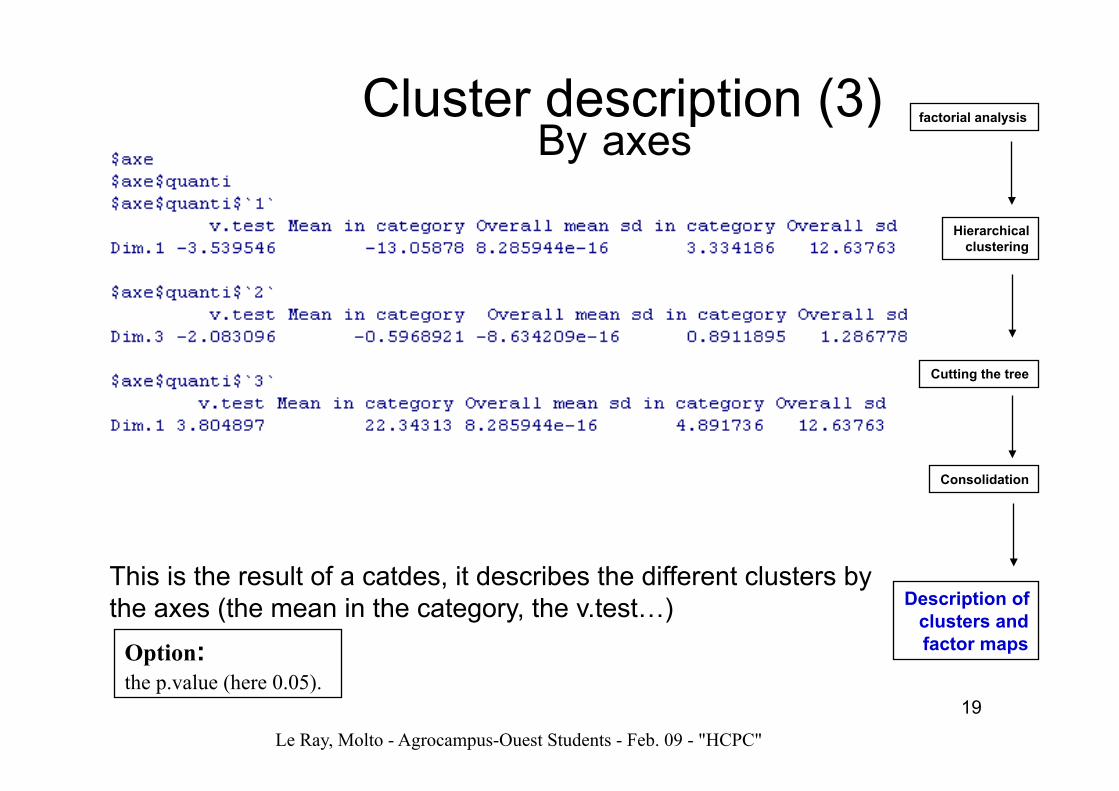
This is the result of a catdes, it describes the different clusters by the axes (the mean in the category, the v.test…)
Le Ray, Molto - Agrocampus-Ouest Students - Feb. 09 - "HCPC"
Option: the p.value (here 0.05).
factorial analysis
Hierarchical clustering
Cutting the tree
Consolidation
Description of clusters and factor maps
Cluster description (3) By axes
20
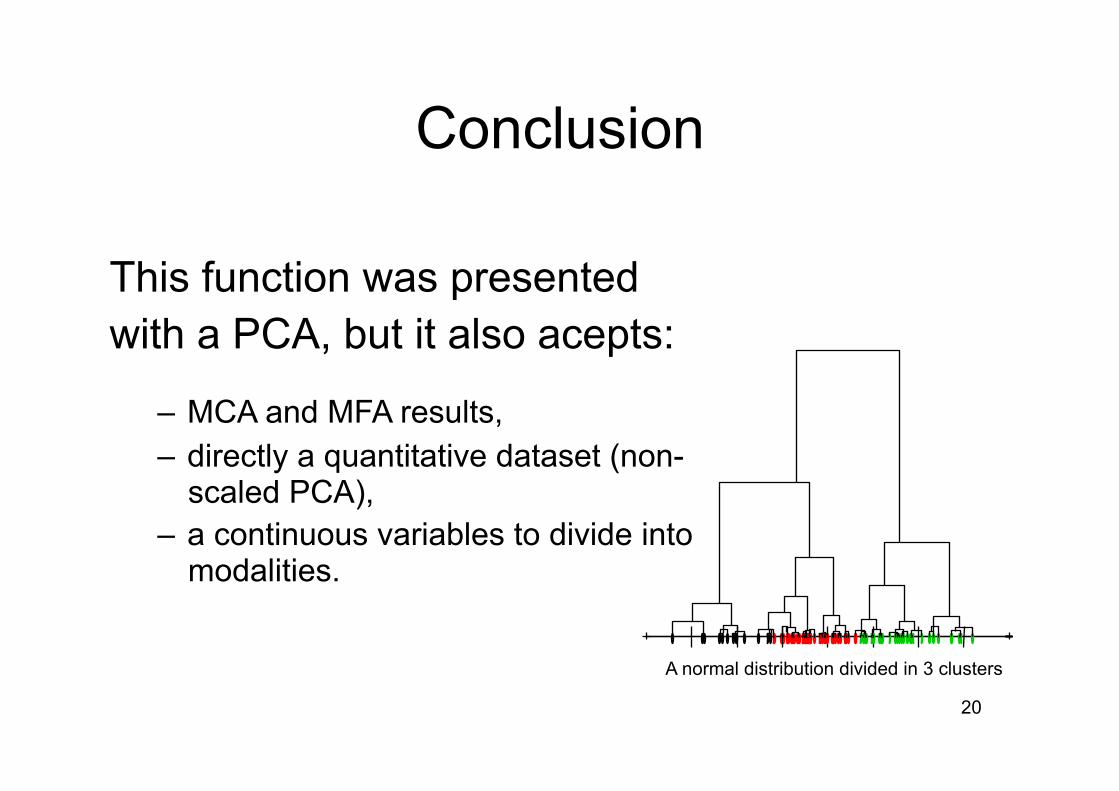
Conclusion
This function was presented with a PCA, but it also acepts:
– MCA and MFA results, – directly a quantitative dataset (non-
scaled PCA), – a continuous variables to divide into
modalities.
A normal distribution divided in 3 clusters
21
Mar
s Fé
vrie
r N
ovem
bre
Oct
obre
Déc
embr
e Ja
nvie
r Av
ril
Sep
tem
bre
Aoû
t M
ai
Juill
et
Juin
cluster 1
v.te
st
-4
-2
0 2
4
Mai
Janv
ier
Déc
embr
e Ju
in
Févr
ier
Mar
s Av
ril
Juill
et
Nov
embr
e A
oût
Oct
obre
Sep
tem
bre
cluster 3
v.te
st
-4
-2
0 2
4
Dim
.1
cluster 1
v.te
st
-4
-2
0 2
4
Dim
.3
cluster 2
v.te
st
-4
-2
0 2
4
Dim
.1
cluster 3
v.te
st
-4
-2
0 2
4
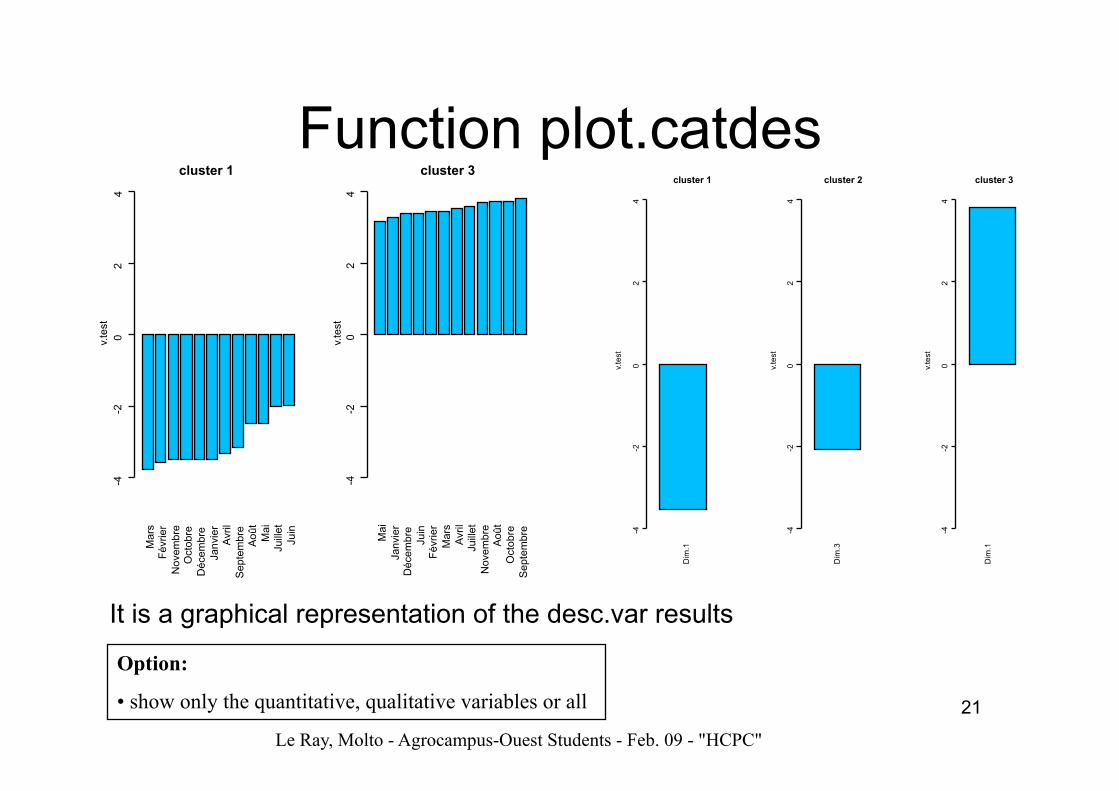
Function plot.catdes
It is a graphical representation of the desc.var results
Option:
• show only the quantitative, qualitative variables or all
Le Ray, Molto - Agrocampus-Ouest Students - Feb. 09 - "HCPC"