Embed Size (px)
DESCRIPTION
Hidraulica magazine no2 2015
Citation preview

No.2/2015
ISSN 1453 – 7303 “HIDRAULICA” (No. 2/2015) Magazine of Hydraulics, Pneumatics, Tribology, Ecology, Sensorics, Mechatronics
3
CONTENTS
• EDITORIAL: Ce, De ce, Pentru cine? / What, Why, Whom for? Ph.D. Petrin DRUMEA
5 - 6
• Wireless Remote Control of Electro-Pneumatic Positioning System Prof. Ryszard DINDORF, PhD., Piotr WOS, PhD.
7 - 13
• Aspects Regarding Fluid Viscous Anchoring Systems Used for Vibration Mitigation at Bridge Structures
Assistant Professor Fănel Dorel ȘCHEAUA, PhD.
14 - 17
• Designing of Liquid Piston Fluidyne Engines Assistant Professor Sunny NARAYAN
18 - 26
• Kinematic and Dynamic Irregularities of Roller Pumps Part ІІ. Numerical Research, Results and Analysis
Prof. MSc. Gencho POPOV PhD., MSc. Yuliyan ANGELOV PhD.
27- 34
• Static Characteristics of the Orifices in a Pilot Operated Pressure Relief Valve
PhD. eng. Sasko DIMITROV, PhD. eng. Simeon SIMEONOV, PhD. eng. Slavco CVETKOV
35 - 39
• Experimental Determinations on Improving Dynamic and Energy Performance of Pneumatic Systems
PhD. eng. Gabriela MATACHE, PhD. eng. Radu RADOI, PhD. eng. Gheorghe SOVAIALA, Tech. Ioan PAVEL
40 - 47
• Laboratory Experiments Made on Corrugated Metallic Capsules, for Selecting Optimal Sensitive Elements in Pressure Transducers Used in Modern Mechatronics Systems
PhD Eng. Iulian Sorin MUNTEANU, St. PhD Eng. Anghel CONSTANTIN, PhD Eng. Petre MUNTEANU
48 - 52
• Innovative Systems for Incremental Positioning in Pneumatics Prof. Mihai AVRAM PhD, Prof. Constantin BUCŞAN PhD, Prof. Valeriu BANU PhD
53 - 56
• Hydrostatic Transmissions Used to Drive a Collapsible Solar Thermal Collector
PhD. eng. Corneliu CRISTESCU, PhD. eng. Radu RADOI, PhD. eng. Catalin DUMITRESCU
57 - 63

ISSN 1453 – 7303 “HIDRAULICA” (No. 2/2015) Magazine of Hydraulics, Pneumatics, Tribology, Ecology, Sensorics, Mechatronics
4
BOARD DIRECTOR OF PUBLICATION
- PhD. Eng. Petrin DRUMEA - Hydraulics and Pneumatics Research Institute in Bucharest, Romania
EDITOR-IN-CHIEF - PhD.Eng. Gabriela MATACHE - Hydraulics and Pneumatics Research Institute in Bucharest, Romania
EXECUTIVE EDITOR
- Ana-Maria POPESCU - Hydraulics and Pneumatics Research Institute in Bucharest, Romania
EDITORIAL BOARD PhD.Eng. Gabriela MATACHE - Hydraulics and Pneumatics Research Institute in Bucharest, Romania Assoc. Prof. Adolfo SENATORE, PhD. – University of Salerno, Italy
PhD.Eng. Catalin DUMITRESCU - Hydraulics and Pneumatics Research Institute in Bucharest, Romania Assoc. Prof. Constantin CHIRITA, PhD. – “Gheorghe Asachi” Technical University of Iasi, Romania PhD.Eng. Radu Iulian RADOI - Hydraulics and Pneumatics Research Institute in Bucharest, Romania
Assoc. Prof. Constantin RANEA, PhD. – University Politehnica of Bucharest; National Authority for Scientific Research
and Innovation (ANCSI), Romania
Prof. Aurelian FATU, PhD. – Institute Pprime – University of Poitiers, France
PhD.Eng. Małgorzata MALEC – KOMAG Institute of Mining Technology in Gliwice, Poland
Lect. Ioan-Lucian MARCU, PhD. – Technical University of Cluj-Napoca, Romania COMMITTEE OF REVIEWERS PhD.Eng. Corneliu CRISTESCU – Hydraulics and Pneumatics Research Institute in Bucharest, Romania
Assoc. Prof. Pavel MACH, PhD. – Czech Technical University in Prague, Czech Republic
Prof. Ilare BORDEASU, PhD. – Politehnica University of Timisoara, Romania
Prof. Valeriu DULGHERU, PhD. – Technical University of Moldova, Chisinau, Republic of Moldova
Assist. Prof. Krzysztof KĘDZIA, PhD. – Wroclaw University of Technology, Poland
Assoc. Prof. Andrei DRUMEA, PhD. – University Politehnica of Bucharest, Romania
PhD.Eng. Marian BLEJAN - Hydraulics and Pneumatics Research Institute in Bucharest, Romania
Prof. Mihai AVRAM, PhD. – University Politehnica of Bucharest, Romania
Prof. Dan OPRUTA, PhD. – Technical University of Cluj-Napoca, Romania
Prof. Ion PIRNA, PhD. – The National Institute of Research and Development for Machines and Installations Designed to
Agriculture and Food Industry - INMA Bucharest, Romania
Published by: Hydraulics and Pneumatics Research Institute, Bucharest-Romania Address: 14 Cuţitul de Argint, district 4, Bucharest, 040558, Romania Phone: +40 21 336 39 91; Fax:+40 21 337 30 40; e-Mail: [email protected]; Web: www.ihp.ro with support from: National Professional Association of Hydraulics and Pneumatics in Romania - FLUIDAS e-Mail: [email protected]; Web: www.fluidas.ro HIDRAULICA Magazine is indexed by international databases:
ISSN 1453 – 7303; ISSN – L 1453 – 7303
ISSN 1453 – 7303 “HIDRAULICA” (No. 2/2015) Magazine of Hydraulics, Pneumatics, Tribology, Ecology, Sensorics, Mechatronics
5
EDITORIAL Ce, De ce, Pentru cine?
In ultimul timp am fost surprins sa aud cateva intrebari care exprima o mare deruta la nivelul cercetarii si invatamantului superior, totul pornind se pare de la situatia precara a numarului si calitatii specialistilor, precum si a perspectivei nu prea incurajatoare privind viitorul hidraulicii in Romania.
In continuare voi incerca si eu un raspuns cat de cat logic si sper ca destul de la obiect.
Prima intrebare este “Ce sa cercetam in Romania“. Intrebarea porneste de la numarul mic de firme productive ramase in domeniu,
Dr.ing. Petrin DRUMEA DIRECTOR DE PUBLICATIE
de la numarul mic de cercetatori activi si de la faptul ca se importa atat produse cat si sisteme intr-o proportie foarte mare. Primul impuls este sa raspundem in logica intrebarii, adica NIMIC. Analizand situatia reala si perspectivele care se intrevad, raspunsul se nuanteaza si se poate afirma ca sunt cateva domenii de mare interes, dintre care sunt relevante urmatoarele:
- Cercetari privind cresterea eficientei energetice a echipamentelor si sistemelor hidraulice; - Cercetari privind productia si utilizarea industriala a unor noutati cum ar fi hidraulica
digitala, fluidele ecologice si tribologia sistemelor hidraulice; - Cercetari privind mentinerea si chiar ridicarea performantelor functionale ale
echipamentelor si sistemelor hidraulice printr-o mentenanta adecvata; - Cercetari privind realizarea unor produse hidraulice de nisa.
A doua intrebare este “De ce sa mai facem cercetare” si are raspunsul rapid si inadecvat NU MAI ESTE CAZUL, insa si un raspuns serios care spune ca e nevoie de cercetare in domeniu pentru ca:
- Exista inca un mare numar de specialisti, o reala crestere a cercetarii universitare, precum si o buna traditie in domeniu;
- Exista multe cereri venite din industrie; - Exista multa hidraulica in tara; - Mentenanta si cercetarea de nisa trebuie asigurate la un nivel tehnico-stiintific ridicat.
A treia intrebare este “Pentru cine trebuie facuta cercetarea in tara“ si are doar un raspuns serios si logic si anume “Pentru economia nationala“, pentru ca:
- A crescut complexitatea utilajelor si echipamentelor industrial; - A crescut numarul si tehnicitatea utilajelor mobile existente in exploatare in tara; - A crescut cererea internationala de munca de cercetare in domeniu.
Numarul intrebarilor de acest fel este mai mare, raspunsurile pot fi mai multe si mai nuantate, insa ideea generala este ca cercetarea in hidraulica va mai exista si se va mai dezvolta, probabil pe anumite domenii si in anumite structuri, care astazi nu sunt relevante. Exista sperante.
ISSN 1453 – 7303 “HIDRAULICA” (No. 2/2015) Magazine of Hydraulics, Pneumatics, Tribology, Ecology, Sensorics, Mechatronics
6
EDITORIAL What, Why, Whom for?
Lately I've been surprised to hear some questions expressing a great confusion in the research and higher education areas, all starting apparently from the precarious situation related to the number and quality of specialists, and also to the not so very encouraging perspective on the future of Hydraulics in Romania.
In the following lines I will try to give a somewhat logical, and hopefully focused enough, answer.
The first question is “What to research in Romania?“ This question starts from the small number of productive companies still existing in
Ph.D.Eng. Petrin DRUMEA DIRECTOR OF PUBLICATION
the field, the small number of active researchers and the fact that both products and systems are imported in a large proportion. The first impulse is to answer in the logic of the question, namely NOTHING. Analyzing the real situation and foreseeable prospects, the answer gets more shades, and it can be said that there are some areas of great interest, of which the following are relevant:
- Research on increasing energy efficiency of hydraulic equipment and systems; - Research on industrial production and use of novelties such as digital hydraulics, green
fluids and tribology of hydraulic systems; - Research on maintaining and even raising the functional performance of hydraulic
equipment and systems through proper maintenance activities; - Research on development of niche hydraulic products.
The second question is “Why bother do research work?”, and it has the quick and inadequate answer IT IS NO LONGER NECESSARY, but also a serious answer saying that there is necessary to be conducted research in the field because:
- There are still a large number of specialists, a real increase in university research, and also good tradition in the field;
- There are many requests from industry; - There is a great deal of Hydraulics in our country; - Maintenance and niche research must be provided at high technical and scientific
standards.
The third question is “Whom for should there be done research in our country?“, and it has only one serious and logical answer, namely “For the national economy“, because:
- Complexity of industrial machines and equipment has increased; - The number and technicality of mobile machinery existing in operation in our country have
also increased; - International demand for research work in the field has increased as well.
The number of questions of this kind is larger, the answers might be more and more sophisticated, but the general idea is that research in Hydraulics will exist and will continue to develop, perhaps in certain areas and in certain structures, which are not relevant today. There are hopes.
ISSN 1453 – 7303 “HIDRAULICA” (No. 2/2015) Magazine of Hydraulics, Pneumatics, Tribology, Ecology, Sensorics, Mechatronics
7
Wireless Remote Control of Electro-Pneumatic Positioning System
Prof. Ryszard DINDORF, PhD.1, Piotr WOŚ, PhD.1 1 Kielce University of Technology, Poland, [email protected]
Abstract: Constant development of wireless networks increases possibilities of their application in the industry. Popular wireless computer networks WLAN (Wireless Local Area Network) can be used not only for data transfer between computers, but also for remote control of electro-pneumatic positioning systems based on the application running on the mobile computer. In order to examine the practical effect of the application the laboratory stand was built for wireless control of the electro-pneumatic servo drive. For that purpose the microcomputer board was used, whose task was to connect the wireless card, input/output port and the application for the operator. The input/output port for the controller was a selected module for data acquisition equipped with analog inputs and outputs. A wireless card was used for wireless communication with the computer operator. Servo drive was built based on the proportional pressure valve, pneumatic positioner, pneumatic actuator of double-sided action, convertor of linear transfers and measure of linear transfers.
Keywords: wireless control, pneumatic systems, servo-drives
1. Introduction
Pneumatic positioning systems have been developing rapidly in recent years. Some of the many applications of pneumatic positioning are: handling of workpieces (such as clamping, positioning, separating, stacking, rotating), packing, filling, metal-forming, stamping [1]. With advancements in micro-computer and servo-valve technology, pneumatic systems are now being considered for industrial applications that involve a control system for positioning of a workpiece. Development of automation and robotization in manufacturing process stimulates interest in pneumatic systems whose advantages include low manufacturing costs, high dynamics and reliability. Unsatisfactory positioning accuracy of multiaxis pneumatic systems considerably reduces their application in manipulating machines, manipulators and robots. Rapid advance in parallel pneumatic manipulators imposes a lot of demands on controllers of pneumatic servo-drive concerning positioning accuracy, resistance to alternating parameters of state and disturbing signals. The problem of positioning accuracy of electro-pneumatic systems is difficult to solve when no sufficient information on the process of conversion of the compressed gas energy into mechanical energy of pneumatic cylinder is available. Therefore, new control methods based on wireless remote control were introduced.
2. Wireless network
Wireless networks have become more and more popular in the recent years. Owing to constant development they become faster, safer and more reliable. Since it is easy to install wireless communication it is very common among private users and in industry. Computer networks can be used not only to access the Internet, but also in the communication with devices used in the industry. The aim of this paper is to present the possible use of WiFi wireless network in the servomechanism of electro-pneumatic control system. For that purpose we constructed a laboratory test stand of wireless controlled pneumatic positioning and wrote the application for the communication between operator and pneumatic positioning system. The communication between devices via network must be conducted according to strictly defined principles so-called protocols, which are specific for every applied communication. The task is to define such features as the format and structure of sent message, ways of message exchange between network devices, methods of the system information exchange and errors between network devices as well as to establish and finish connections. Protocols don’t usually describe how to carry out a determined function so the implementation of a given protocol is independent of specific technology. Successful communication in the network requires sharing of many different protocols. Such
ISSN 1453 – 7303 “HIDRAULICA” (No. 2/2015) Magazine of Hydraulics, Pneumatics, Tribology, Ecology, Sensorics, Mechatronics
8
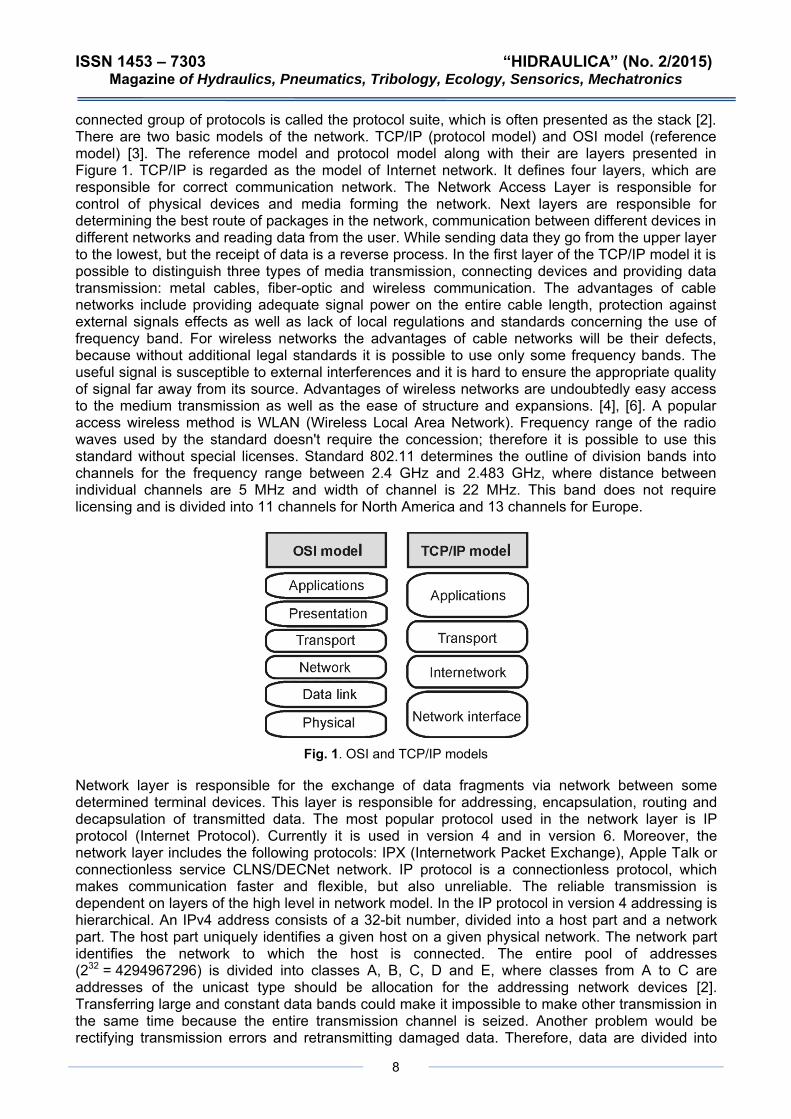
connected group of protocols is called the protocol suite, which is often presented as the stack [2]. There are two basic models of the network. TCP/IP (protocol model) and OSI model (reference model) [3]. The reference model and protocol model along with their are layers presented in Figure 1. TCP/IP is regarded as the model of Internet network. It defines four layers, which are responsible for correct communication network. The Network Access Layer is responsible for control of physical devices and media forming the network. Next layers are responsible for determining the best route of packages in the network, communication between different devices in different networks and reading data from the user. While sending data they go from the upper layer to the lowest, but the receipt of data is a reverse process. In the first layer of the TCP/IP model it is possible to distinguish three types of media transmission, connecting devices and providing data transmission: metal cables, fiber-optic and wireless communication. The advantages of cable networks include providing adequate signal power on the entire cable length, protection against external signals effects as well as lack of local regulations and standards concerning the use of frequency band. For wireless networks the advantages of cable networks will be their defects, because without additional legal standards it is possible to use only some frequency bands. The useful signal is susceptible to external interferences and it is hard to ensure the appropriate quality of signal far away from its source. Advantages of wireless networks are undoubtedly easy access to the medium transmission as well as the ease of structure and expansions. [4], [6]. A popular access wireless method is WLAN (Wireless Local Area Network). Frequency range of the radio waves used by the standard doesn't require the concession; therefore it is possible to use this standard without special licenses. Standard 802.11 determines the outline of division bands into channels for the frequency range between 2.4 GHz and 2.483 GHz, where distance between individual channels are 5 MHz and width of channel is 22 MHz. This band does not require licensing and is divided into 11 channels for North America and 13 channels for Europe.
Fig. 1. OSI and TCP/IP models
Network layer is responsible for the exchange of data fragments via network between some determined terminal devices. This layer is responsible for addressing, encapsulation, routing and decapsulation of transmitted data. The most popular protocol used in the network layer is IP protocol (Internet Protocol). Currently it is used in version 4 and in version 6. Moreover, the network layer includes the following protocols: IPX (Internetwork Packet Exchange), Apple Talk or connectionless service CLNS/DECNet network. IP protocol is a connectionless protocol, which makes communication faster and flexible, but also unreliable. The reliable transmission is dependent on layers of the high level in network model. In the IP protocol in version 4 addressing is hierarchical. An IPv4 address consists of a 32-bit number, divided into a host part and a network part. The host part uniquely identifies a given host on a given physical network. The network part identifies the network to which the host is connected. The entire pool of addresses (232 = 4294967296) is divided into classes A, B, C, D and E, where classes from A to C are addresses of the unicast type should be allocation for the addressing network devices [2]. Transferring large and constant data bands could make it impossible to make other transmission in the same time because the entire transmission channel is seized. Another problem would be rectifying transmission errors and retransmitting damaged data. Therefore, data are divided into
ISSN 1453 – 7303 “HIDRAULICA” (No. 2/2015) Magazine of Hydraulics, Pneumatics, Tribology, Ecology, Sensorics, Mechatronics
9
smaller fragments (segmentation), which are transmitted between devices in the network. Such process also allows for many different applications for simultaneous work in the network by placing a part of messages coming from different applications (multiplecsation) in one transmission channel. The tasks of segmentation, merging data and multiplexing communication fall to the transport layer [5]. Depending on requirements concerning data transmission, two basic transmission protocols are distinguished: TCP and UDP. The TCP Protocol is a protocol which guarantees reliable provision of data to the recipient by tracking transmitted data, confirmation of data receipt and repetition of lost data. It is the interconnection protocol, which means that before data is transmitted by the network, the connection is established between the communicating devices. Second protocol which is simpler is UDP. It is faster than TCP, doesn't require confirmations and doesn't provide lost data for the retransmission, and thus doesn’t ensure reliability. Where reliability of the data transmission is required the TCP is applied (database applications, electronic mail, websites). In case of less sensitive data, where applications are tolerant to loss of small amounts of data the UDP protocol is applied (video or voice transmission) [2]. The task of protocols layer is to provide an interface between the user of the network device and network data. In this layer it is possible to distinguish two types of the software: applications and services. Services of the application layer are usually transparent for the user and are responsible for connecting the application with network as well as sending data. The application provides interface for the user as well as initiates the process of data transmission by the network. The application layer like the remaining layers of the network contains protocols of different type defined by standards and data formats. FTP can be an example of the application, service and protocol, which constitutes the interface for user (application), supporting program connections for transmission files (service) and interchange standard of network communications (protocol). Protocols of the application layer define the way of data exchange between applications and services, which are started on devices participating in the communication. They carry it out by determining the type and format of an exchanged message as well as by determining the way in which the message is sent and received.
3. Wireless controller of servo-drives
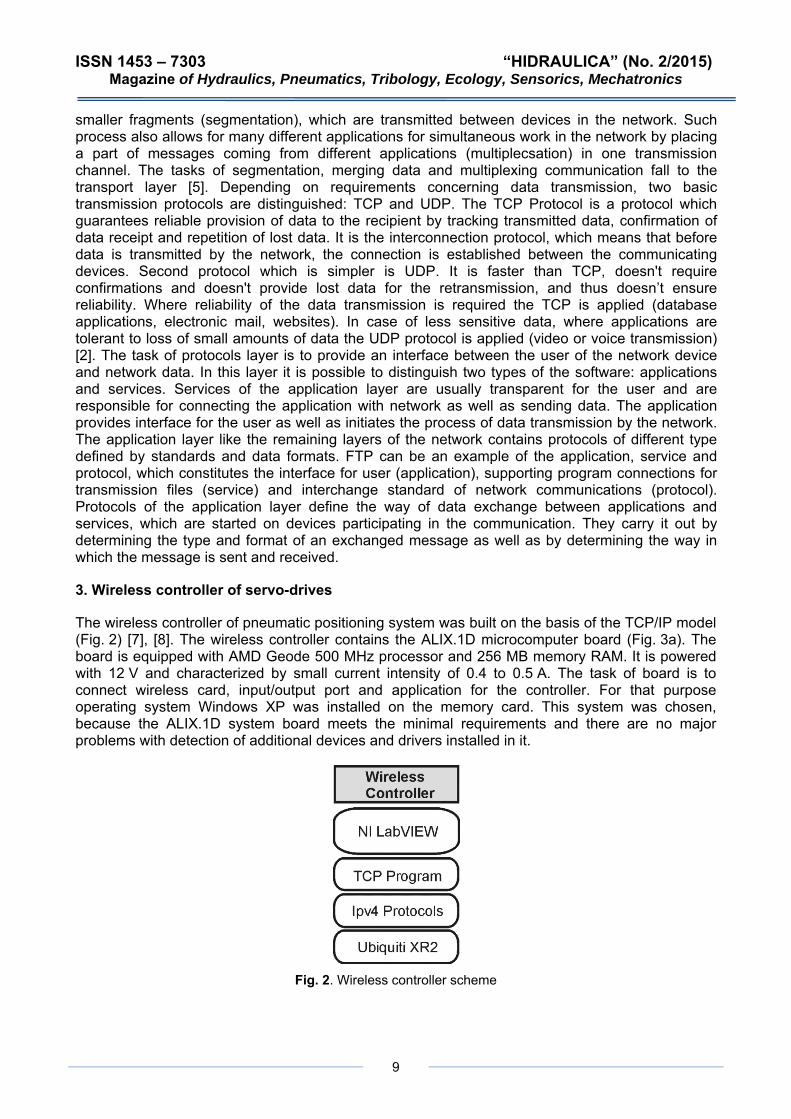
The wireless controller of pneumatic positioning system was built on the basis of the TCP/IP model (Fig. 2) [7], [8]. The wireless controller contains the ALIX.1D microcomputer board (Fig. 3a). The board is equipped with AMD Geode 500 MHz processor and 256 MB memory RAM. It is powered with 12 V and characterized by small current intensity of 0.4 to 0.5 A. The task of board is to connect wireless card, input/output port and application for the controller. For that purpose operating system Windows XP was installed on the memory card. This system was chosen, because the ALIX.1D system board meets the minimal requirements and there are no major problems with detection of additional devices and drivers installed in it.
Fig. 2. Wireless controller scheme

ISSN 1453 – 7303 “HIDRAULICA” (No. 2/2015)
10
Magazine of Hydraulics, Pneumatics, Tribology, Ecology, Sensorics, Mechatronics
Fig. 3. Elements used for construction of the wireless controller: a) ALIX 1D microcomputer board, b) module of the acquisition data MicroDAQ USB-1208FS, c) wireless card Ubiquiti XR2
As input/output port for the driver was a chosen module for the data acquisition MicroDAQ USB-1208FS (Fig. 3b). This system has 4 analog inputs in the symmetrical system (differential) and 8 - inputs in the asymmetrical system. Inputs have resolution of 12 bits in the symmetrical system or 11 bits in the asymmetrical system. In the asymmetrical system there is a possibility of voltage measurement which is ± 10 V, while in the differential system it is ± 20 V. The module is characterized by sample frequency of up to 50 kS/s while using hardware scanning. For generation of output signals 2 analog outputs are available with resolutions of 12 bits. Output voltage range amounts to 0–4.096 V at maximum load capacity of 15 mA. Analog data are sent with the frequency to 10 kS/s for one channel or 5 kS/s for two channels using the hardware method. This module is connected to the driver board by USB interface. For the communication with operator the Ubiquiti XR2 card is used (Fig. 3c). The card is equipped with MMCX connector which provides a better connection card (pigtail), than the one popular miniPCI cards UFL connectors. The advantages of this card are 802.11b and 802.11g standards, large output power (26 dB) and sensitivity of the receiver to -95 dB. The card is recommended for applications, where the highest reliability and quality of transmission is required. Depending on aerial inside the premises it is possible to obtain the space up to 200 m, however in the open space it is about 50 km. The proper operation of TCP/IP requires that he devices in network be assigned a unique network addresses. For that purpose the pool of addresses IPv4 from class B was divided into subnet consisting of two hosts. The division into smaller subnet was achieved by such a change of the mask that only 2 least significant bits were used for appointing addresses of devices. The output address was network address 172.16.0.0/16. The remaining address in the subnet (172.16.2.3) is a reserved broadcast address. Such addressing increases safety before a “strange device” is connected to the network, since the next address 172.16.2.4/30 is already an address of other subnet,. Consequently the devices will not be able to communicate directly with each other In order to provide the reliability of transmission and due to small amounts of data which are sent by the network TCP was chosen as the transport protocol. For the communication between the driver and the operator two applications were written, one for the controller and the other for the operator. The application of controller performs the role of the service. Its task is to listen attentively and wait for the operator to indicate the connection on a chosen port. When connection is detected the service starts to collect and send data. When operator finishes the connection, the application again turns into the state of listening and waiting. Both programs were written using LabVIEW software (Fig. 4) which allows one to write program with the use protocols like TCP, UDP, Bluetooth or IrDA. The applications capable of sending data via TCP protocol must use blocks to open and close connection for a determined IP address and port, a blocks to listen for incoming connections as well the blocks that record and read data from the TCP connection. In the figure below an example of the client application and server created with the use of LabVIEW is presented. Apart from the basic TCP blocks a loop was applied. Its task was a constant sending of data from the client application and a constant reception of data from the server.
ISSN 1453 – 7303 “HIDRAULICA” (No. 2/2015)
11
Magazine of Hydraulics, Pneumatics, Tribology, Ecology, Sensorics, Mechatronics
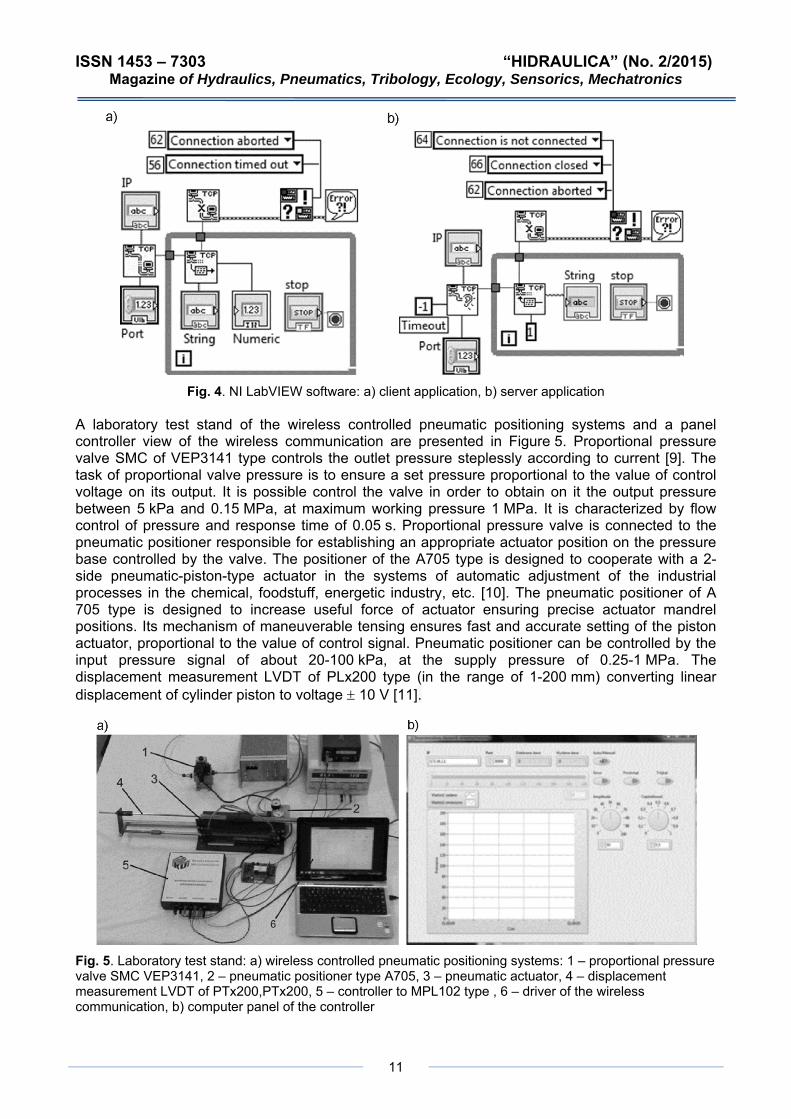
Fig. 4. NI LabVIEW software: a) client application, b) server application
A laboratory test stand of the wireless controlled pneumatic positioning systems and a panel controller view of the wireless communication are presented in Figure 5. Proportional pressure valve SMC of VEP3141 type controls the outlet pressure steplessly according to current [9]. The task of proportional valve pressure is to ensure a set pressure proportional to the value of control voltage on its output. It is possible control the valve in order to obtain on it the output pressure between 5 kPa and 0.15 MPa, at maximum working pressure 1 MPa. It is characterized by flow control of pressure and response time of 0.05 s. Proportional pressure valve is connected to the pneumatic positioner responsible for establishing an appropriate actuator position on the pressure base controlled by the valve. The positioner of the A705 type is designed to cooperate with a 2-side pneumatic-piston-type actuator in the systems of automatic adjustment of the industrial processes in the chemical, foodstuff, energetic industry, etc. [10]. The pneumatic positioner of A 705 type is designed to increase useful force of actuator ensuring precise actuator mandrel positions. Its mechanism of maneuverable tensing ensures fast and accurate setting of the piston actuator, proportional to the value of control signal. Pneumatic positioner can be controlled by the input pressure signal of about 20-100 kPa, at the supply pressure of 0.25-1 MPa. The displacement measurement LVDT of PLx200 type (in the range of 1-200 mm) converting linear displacement of cylinder piston to voltage ± 10 V [11].
Fig. 5. Laboratory test stand: a) wireless controlled pneumatic positioning systems: 1 – proportional pressure valve SMC VEP3141, 2 – pneumatic positioner type A705, 3 – pneumatic actuator, 4 – displacement measurement LVDT of PTx200,PTx200, 5 – controller to MPL102 type , 6 – driver of the wireless communication, b) computer panel of the controller
ISSN 1453 – 7303 “HIDRAULICA” (No. 2/2015) Magazine of Hydraulics, Pneumatics, Tribology, Ecology, Sensorics, Mechatronics
12
4. Results of experimental tests
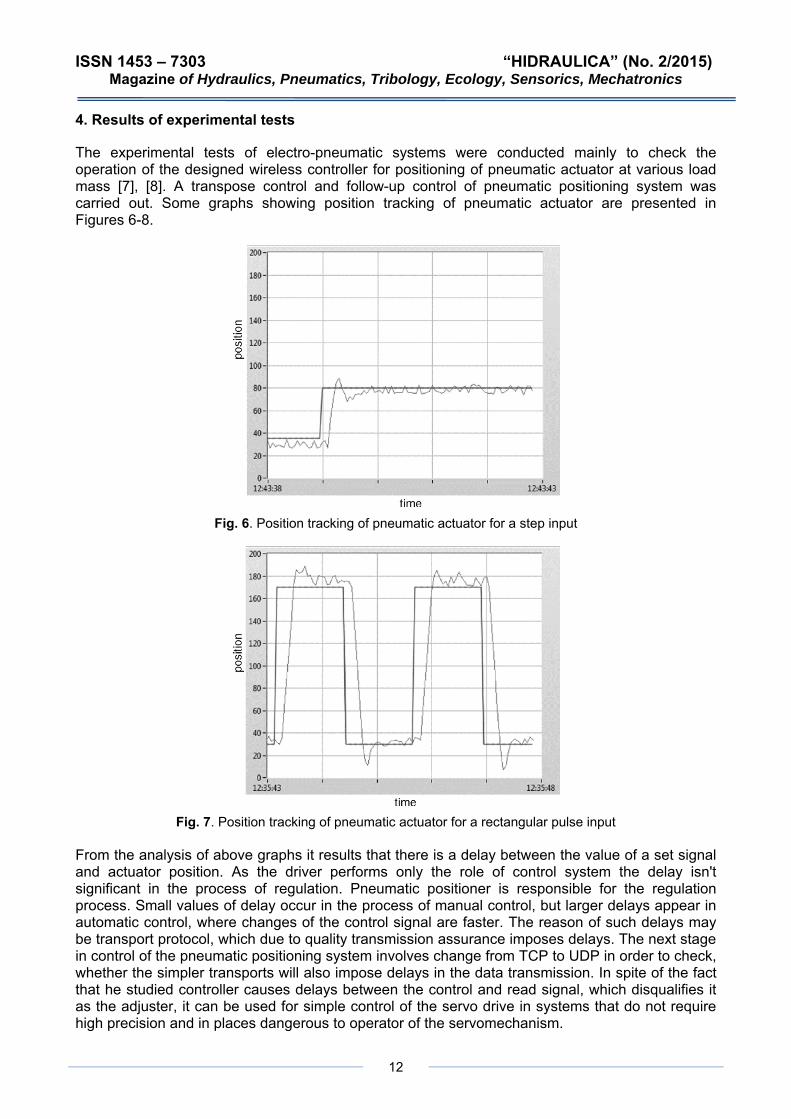
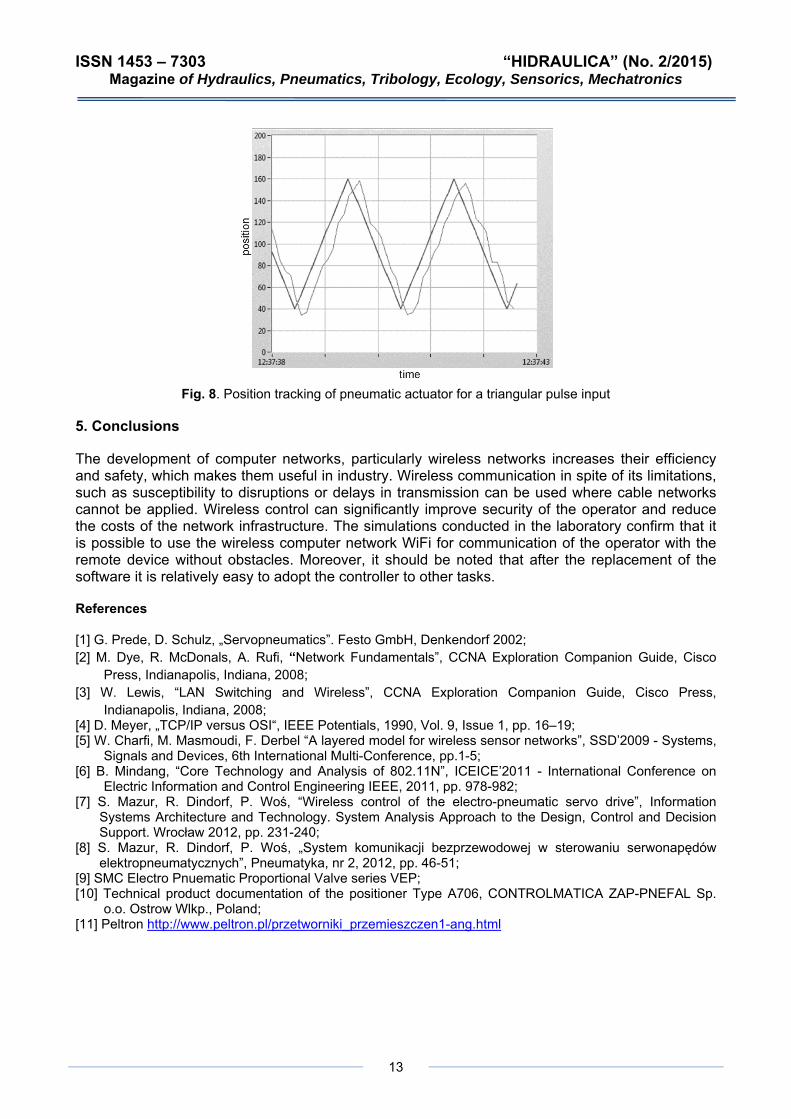
The experimental tests of electro-pneumatic systems were conducted mainly to check the operation of the designed wireless controller for positioning of pneumatic actuator at various load mass [7], [8]. A transpose control and follow-up control of pneumatic positioning system was carried out. Some graphs showing position tracking of pneumatic actuator are presented in Figures 6-8.
Fig. 6. Position tracking of pneumatic actuator for a step input
Fig. 7. Position tracking of pneumatic actuator for a rectangular pulse input
From the analysis of above graphs it results that there is a delay between the value of a set signal and actuator position. As the driver performs only the role of control system the delay isn't significant in the process of regulation. Pneumatic positioner is responsible for the regulation process. Small values of delay occur in the process of manual control, but larger delays appear in automatic control, where changes of the control signal are faster. The reason of such delays may be transport protocol, which due to quality transmission assurance imposes delays. The next stage in control of the pneumatic positioning system involves change from TCP to UDP in order to check, whether the simpler transports will also impose delays in the data transmission. In spite of the fact that he studied controller causes delays between the control and read signal, which disqualifies it as the adjuster, it can be used for simple control of the servo drive in systems that do not require high precision and in places dangerous to operator of the servomechanism.
ISSN 1453 – 7303 “HIDRAULICA” (No. 2/2015) Magazine of Hydraulics, Pneumatics, Tribology, Ecology, Sensorics, Mechatronics
13
Fig. 8. Position tracking of pneumatic actuator for a triangular pulse input
5. Conclusions
The development of computer networks, particularly wireless networks increases their efficiency and safety, which makes them useful in industry. Wireless communication in spite of its limitations, such as susceptibility to disruptions or delays in transmission can be used where cable networks cannot be applied. Wireless control can significantly improve security of the operator and reduce the costs of the network infrastructure. The simulations conducted in the laboratory confirm that it is possible to use the wireless computer network WiFi for communication of the operator with the remote device without obstacles. Moreover, it should be noted that after the replacement of the software it is relatively easy to adopt the controller to other tasks.
References
[1] G. Prede, D. Schulz, „Servopneumatics”. Festo GmbH, Denkendorf 2002; [2] M. Dye, R. McDonals, A. Rufi, “Network Fundamentals”, CCNA Exploration Companion Guide, Cisco
Press, Indianapolis, Indiana, 2008; [3] W. Lewis, “LAN Switching and Wireless”, CCNA Exploration Companion Guide, Cisco Press,
Indianapolis, Indiana, 2008; [4] D. Meyer, „TCP/IP versus OSI“, IEEE Potentials, 1990, Vol. 9, Issue 1, pp. 16–19; [5] W. Charfi, M. Masmoudi, F. Derbel “A layered model for wireless sensor networks”, SSD’2009 - Systems,
Signals and Devices, 6th International Multi-Conference, pp.1-5; [6] B. Mindang, “Core Technology and Analysis of 802.11N”, ICEICE’2011 - International Conference on
Electric Information and Control Engineering IEEE, 2011, pp. 978-982; [7] S. Mazur, R. Dindorf, P. Woś, “Wireless control of the electro-pneumatic servo drive”, Information
Systems Architecture and Technology. System Analysis Approach to the Design, Control and Decision Support. Wrocław 2012, pp. 231-240;
[8] S. Mazur, R. Dindorf, P. Woś, „System komunikacji bezprzewodowej w sterowaniu serwonapędów elektropneumatycznych”, Pneumatyka, nr 2, 2012, pp. 46-51;
[9] SMC Electro Pnuematic Proportional Valve series VEP; [10] Technical product documentation of the positioner Type A706, CONTROLMATICA ZAP-PNEFAL Sp.
o.o. Ostrow Wlkp., Poland; [11] Peltron http://www.peltron.pl/przetworniki_przemieszczen1-ang.html
ISSN 1453 – 7303 “HIDRAULICA” (No. 2/2015) Magazine of Hydraulics, Pneumatics, Tribology, Ecology, Sensorics, Mechatronics
14
Aspects Regarding Fluid Viscous Anchoring Systems Used for Vibration Mitigation at Bridge Structures
Assistant Professor Fănel Dorel ȘCHEAUA, PhD.1 1"Dunărea de Jos" University of Galați, Romania, [email protected]
Abstract: During the last period are increasingly used hydraulic devices attached to building structures in order to achieve energy dissipation during earthquakes but also as anchoring systems being interposed between structural frameworks. An anchoring system is a hydraulic device consisting of a cylinder with piston having inside a working fluid with special viscosity properties. The anchor device can be connected to both ends making a connection between the bridge pier and superstructure. This special positioning between structural frames is made in order to ensure vibrations mitigation and increased stability at high stress requests. The device piston can perform translation displacements inside the cylinder by means of a hydraulic circuit which allow working fluid flow between the two chambers of the cylinder. Due to high viscosity values of the working fluid and small diameter of crossing orifices, the relative slow movements between structural frameworks are allowed, but when a dynamic request of major intensity occurs the system becomes rigid assuring the safety connections between structural frameworks. This article shows a method of modelling a three-dimensional model for a hydraulic anchoring system and numerical analysis to highlight the working principle for such a device.
Keywords: fluid device, anchoring, structural system, bridge, vibration mitigation, energy dissipation
1. Introduction
Special mechanical systems are used at the construction of new bridge or viaduct structural types or rehabilitation of existing ones, that work as anchoring safety connections between structural elements (pier and superstructure) when significant dynamic requests are occurring. Such safety systems are based on a hydraulic fluid having special properties in terms of viscosity. In the absence of active control equipment are considered passive systems, being velocity dependent, because they respond to relative movements between the structural frames where they are located. In the event of an earthquake there is a tendency of relative motion between frameworks, but by changing the anchoring systems rigidity it is ensured a rigid connection between the superstructure and bridge pier. The working fluid used is a high viscosity silicone oil which can be used in a wide temperature range and showing no change in properties over time. ( C5040 0+ ) 2. Modeling aspects for viscous fluid anchoring system
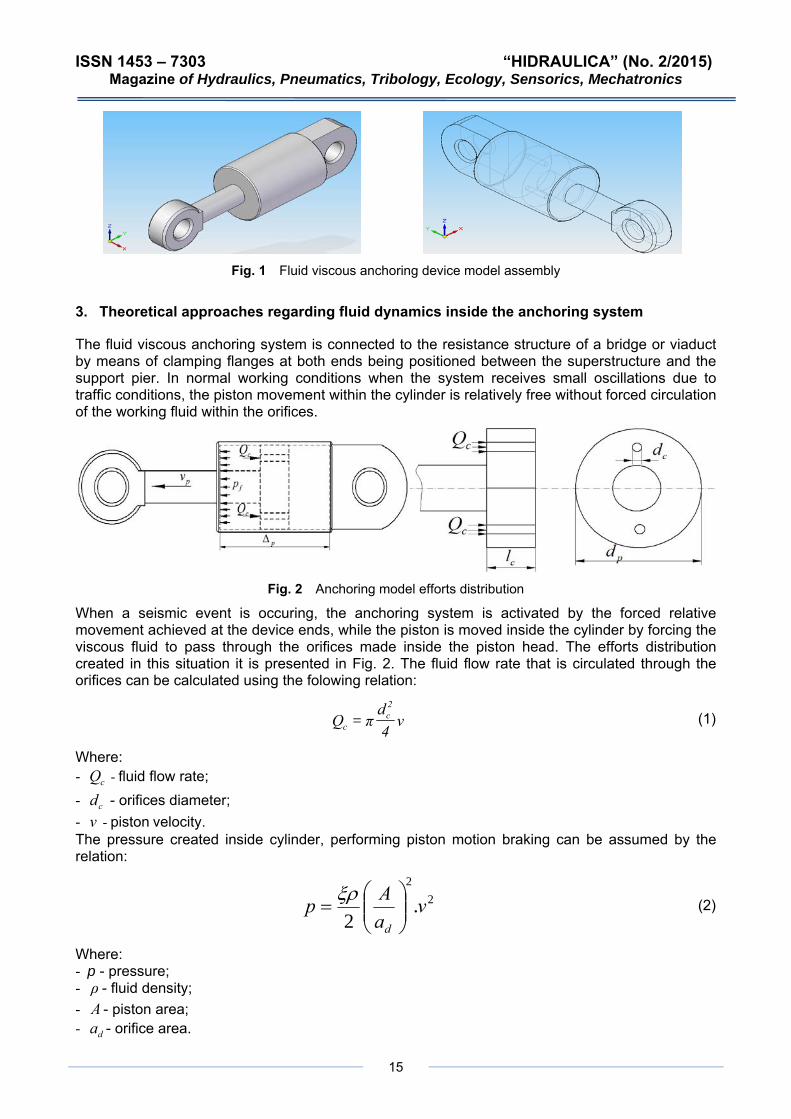
A viscous fluid anchoring system is composed of a cylinder with a piston that divides the interior of the cylinder body in two chambers. The interior volume of the cylinder body is filled with fluid and the movement of the piston is made possible by a special circuit that allows the fluid flow. Due to the diameter value of the passage orifices, low-velocity movements are allowed for the piston but when a dynamic request occur the hydraulic system is activated acting as a safety device. Increasing rigidity is ensured based on the working fluid due to their high viscosity value but also to valve system that can be adjusted to face high levels of forces arising from the dynamic requests. A three-dimensional model for viscous fluid anchoring device was developed and presented in Figure 1.
ISSN 1453 – 7303 “HIDRAULICA” (No. 2/2015) of Hydraulics, Pneumatics, Tribology, Ecology, Sensorics,
15
Magazine Mechatronics
Fig. 1 Fluid viscous anchoring device model assembly
3. Theoretical approaches regarding fluid dynamics inside the anchoring system
The fluid viscous anchoring system is connected to the resistance structure of a bridge or viaduct by means of clamping flanges at both ends being positioned between the superstructure and the support pier. In normal working conditions when the system receives small oscillations due to traffic conditions, the piston movement within the cylinder is relatively free without forced circulation of the working fluid within the orifices.
Fig. 2 Anchoring model efforts distribution
When a seismic event is occuring, the anchoring system is activated by the forced relative movement achieved at the device ends, while the piston is moved inside the cylinder by forcing the viscous fluid to pass through the orifices made inside the piston head. The efforts distribution created in this situation it is presented in Fig. 2. The fluid flow rate that is circulated through the orifices can be calculated using the folowing relation:
vd
πQ2c=4c (1)
Where: - cQ - fluid flow rate; - cd - orifices diameter; - v - piston velocity. The pressure created inside cylinder, performing piston motion braking can be assumed by the relation:
22
.2
vaAp ⎟⎟⎞
⎜⎜⎛
=ξρ
d ⎠⎝ (2)
Where: - p - pressure; - ρ - fluid density; - A - piston area; - da - orifice area.

ISSN 1453 – 7303 “HIDRAULICA” (No. 2/2015) Magazine of Hydraulics, Pneumatics, Tribology, Ecology, Sensorics, Mechatronics
16
From pressure relation shall be deducted that the braking pressure is even higher as the momentary piston velocity is higher and the orifices opening area is smaller. 4. Computation fluid dynamics analysis for anchoring model
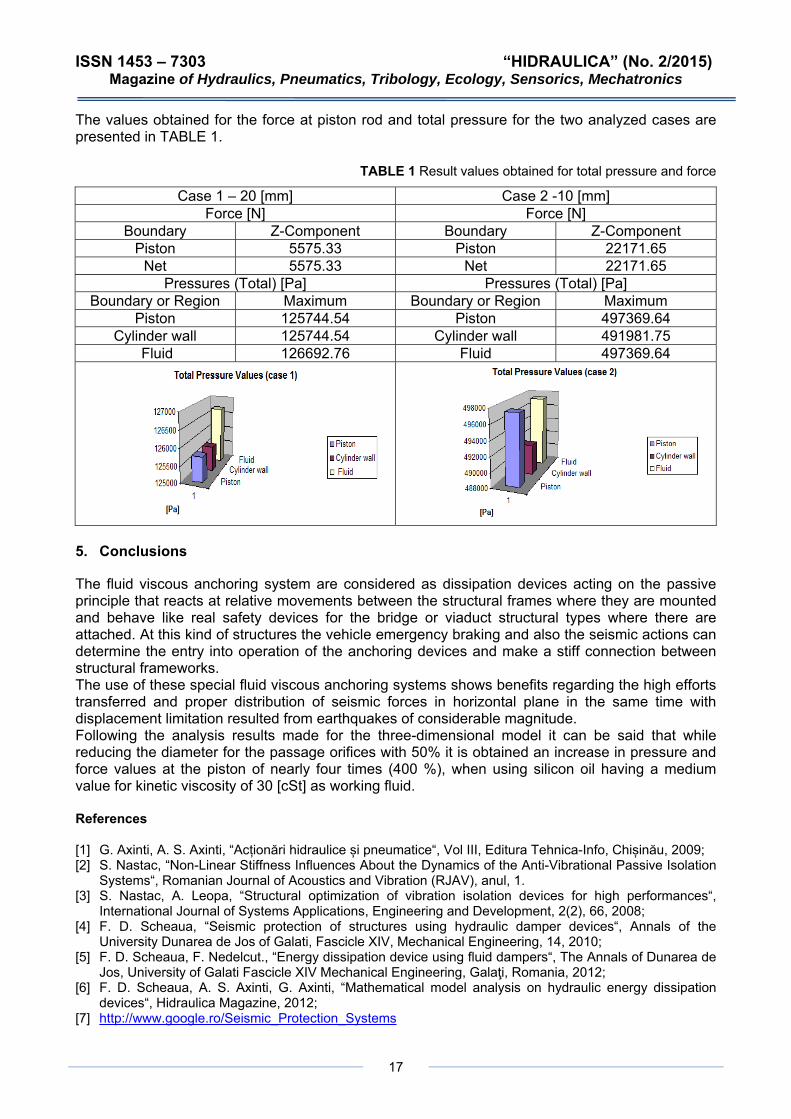
Two different cases were analyzed for the fluid viscous anchoring system three-dimensional model. In the first case it has been considered two circulation orifices for the fluid having a diameter of 20 mm and for the second case the orifices diameter has been reduced to 10 mm. The working fluid is silicone oil having characteristics which remain constant when are changes in temperature or over time. The results are shown in the following, (Fig. 3, Fig. 4).
(a) Total pressure values (b) Static pressure values
(c) Fluid velocity values (d) Fluid velocity values on regions
Fig. 3 The obtained results for anchoring model having diameter orifices of 20 mm (case 1)
(a) Total pressure values (b) Static pressure values
(c) Fluid velocity values (d) Fluid velocity values on regions
Fig. 4 The obtained results for anchoring model having orifices diameter of 10 mm (case 2)
ISSN 1453 – 7303 “HIDRAULICA” (No. 2/2015) Magazine of Hydraulics, Pneumatics, Tribology, Ecology, Sensorics, Mechatronics
17
The values obtained for the force at piston rod and total pressure for the two analyzed cases are presented in TABLE 1.
TABLE 1 Result values obtained for total pressure and force
Case 1 – 20 [mm] Case 2 -10 [mm] Force [N] Force [N]
Boundary Z-Component Boundary Z-Component Piston 5575.33 Piston 22171.65
Net 5575.33 Net 22171.65 Pressures (Total) [Pa] Pressures (Total) [Pa]
Boundary or Region Maximum Boundary or Region Maximum Piston 125744.54 Piston 497369.64
Cylinder wall 125744.54 Cylinder wall 491981.75 Fluid 126692.76 Fluid 497369.64
5. Conclusions
The fluid viscous anchoring system are considered as dissipation devices acting on the passive principle that reacts at relative movements between the structural frames where they are mounted and behave like real safety devices for the bridge or viaduct structural types where there are attached. At this kind of structures the vehicle emergency braking and also the seismic actions can determine the entry into operation of the anchoring devices and make a stiff connection between structural frameworks. The use of these special fluid viscous anchoring systems shows benefits regarding the high efforts transferred and proper distribution of seismic forces in horizontal plane in the same time with displacement limitation resulted from earthquakes of considerable magnitude. Following the analysis results made for the three-dimensional model it can be said that while reducing the diameter for the passage orifices with 50% it is obtained an increase in pressure and force values at the piston of nearly four times (400 %), when using silicon oil having a medium value for kinetic viscosity of 30 [cSt] as working fluid. References
[1] G. Axinti, A. S. Axinti, “Acționări hidraulice și pneumatice“, Vol III, Editura Tehnica-Info, Chișinău, 2009; [2] S. Nastac, “Non-Linear Stiffness Influences About the Dynamics of the Anti-Vibrational Passive Isolation
Systems“, Romanian Journal of Acoustics and Vibration (RJAV), anul, 1. [3] S. Nastac, A. Leopa, “Structural optimization of vibration isolation devices for high performances“,
International Journal of Systems Applications, Engineering and Development, 2(2), 66, 2008; [4] F. D. Scheaua, “Seismic protection of structures using hydraulic damper devices“, Annals of the
University Dunarea de Jos of Galati, Fascicle XIV, Mechanical Engineering, 14, 2010; [5] F. D. Scheaua, F. Nedelcut., “Energy dissipation device using fluid dampers“, The Annals of Dunarea de
Jos, University of Galati Fascicle XIV Mechanical Engineering, Galaţi, Romania, 2012; [6] F. D. Scheaua, A. S. Axinti, G. Axinti, “Mathematical model analysis on hydraulic energy dissipation
devices“, Hidraulica Magazine, 2012; [7] http://www.google.ro/Seismic_Protection_Systems
ISSN 1453 – 7303 “HIDRAULICA” (No. 2/2015) Magazine of Hydraulics, Pneumatics, Tribology, Ecology, Sensorics, Mechatronics
18
Designing of Liquid Piston Fluidyne Engines
Assistant Professor Sunny NARAYAN1
1 Indus International University, Himachal Pradesh, India, [email protected]
Abstract: Engines and pumps are common engineering devices which have become essential to the smooth running of modern society. Many of these are very sophisticated and require infrastructure and high levels of technological competence to ensure their correct operation, for example, some are computer controlled, others require stable three phase electrical supplies, or clean hydrocarbon fuels. This work focuses on the identification, design, construction and testing of a simple, yet elegant, device which has the ability to pump water but which can be manufactured easily without any special tooling or exotic materials and which can be powered from either combustion of organic matter or directly from solar heating. The device, which has many of the elements of a Stirling engine is a liquid piston engine in which the fluctuating pressure is harnessed to pump a liquid (water). A simple embodiment of this engine/pump has been designed and constructed. It has been tested and recommendations on how it might be improved are made. The underlying theory of the device is also presented and discussed.
Keywords: Liquid Piston Engines; Novel Pumps
1. Introduction
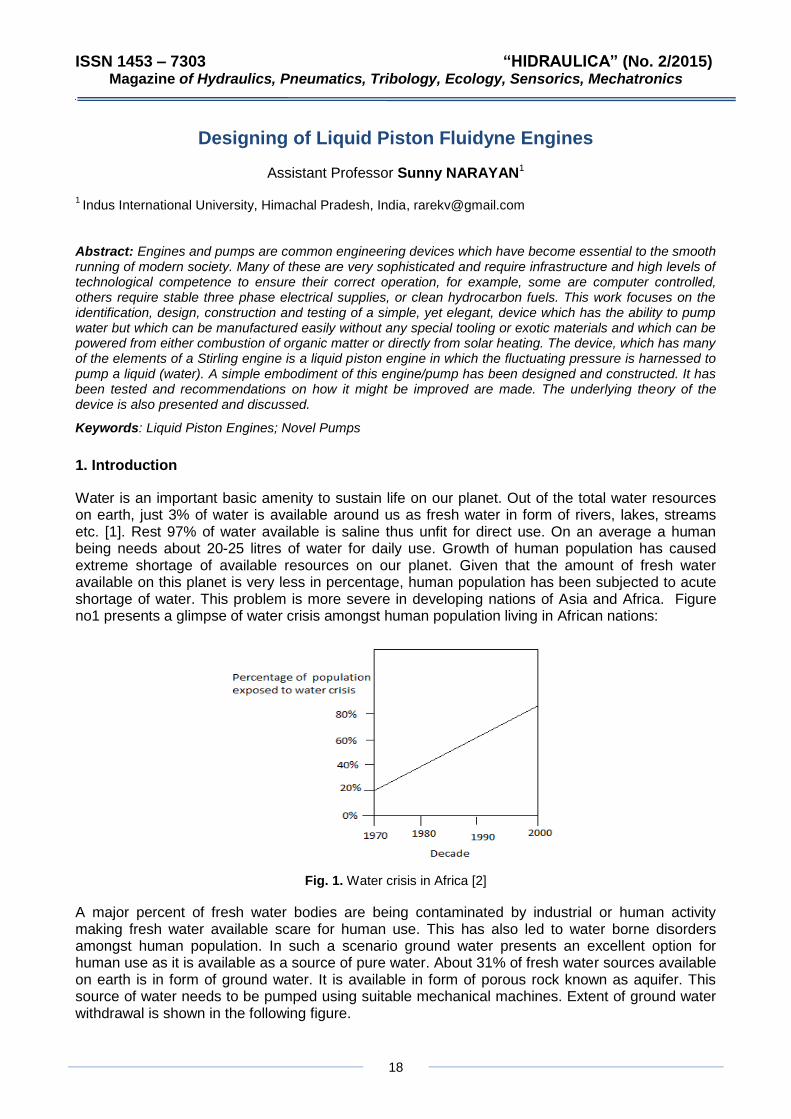
Water is an important basic amenity to sustain life on our planet. Out of the total water resources on earth, just 3% of water is available around us as fresh water in form of rivers, lakes, streams etc. [1]. Rest 97% of water available is saline thus unfit for direct use. On an average a human being needs about 20-25 litres of water for daily use. Growth of human population has caused extreme shortage of available resources on our planet. Given that the amount of fresh water available on this planet is very less in percentage, human population has been subjected to acute shortage of water. This problem is more severe in developing nations of Asia and Africa. Figure no1 presents a glimpse of water crisis amongst human population living in African nations:
Fig. 1. Water crisis in Africa [2]
A major percent of fresh water bodies are being contaminated by industrial or human activity making fresh water available scare for human use. This has also led to water borne disorders amongst human population. In such a scenario ground water presents an excellent option for human use as it is available as a source of pure water. About 31% of fresh water sources available on earth is in form of ground water. It is available in form of porous rock known as aquifer. This source of water needs to be pumped using suitable mechanical machines. Extent of ground water withdrawal is shown in the following figure.
ISSN 1453 – 7303 “HIDRAULICA” (No. 2/2015) Magazine of Hydraulics, Pneumatics, Tribology, Ecology, Sensorics, Mechatronics
19
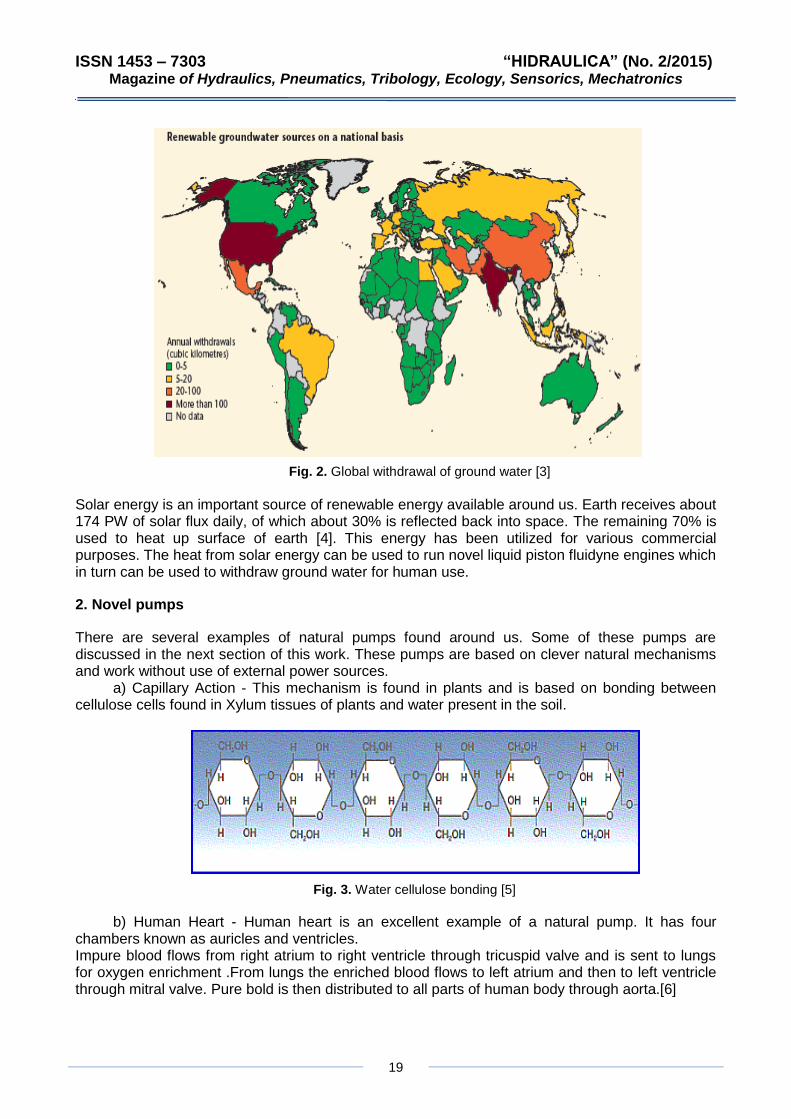
Fig. 2. Global withdrawal of ground water [3]
Solar energy is an important source of renewable energy available around us. Earth receives about 174 PW of solar flux daily, of which about 30% is reflected back into space. The remaining 70% is used to heat up surface of earth [4]. This energy has been utilized for various commercial purposes. The heat from solar energy can be used to run novel liquid piston fluidyne engines which in turn can be used to withdraw ground water for human use.
2. Novel pumps
There are several examples of natural pumps found around us. Some of these pumps are discussed in the next section of this work. These pumps are based on clever natural mechanisms and work without use of external power sources.
a) Capillary Action - This mechanism is found in plants and is based on bonding between cellulose cells found in Xylum tissues of plants and water present in the soil.
Fig. 3. Water cellulose bonding [5]
b) Human Heart - Human heart is an excellent example of a natural pump. It has four chambers known as auricles and ventricles. Impure blood flows from right atrium to right ventricle through tricuspid valve and is sent to lungs for oxygen enrichment .From lungs the enriched blood flows to left atrium and then to left ventricle through mitral valve. Pure bold is then distributed to all parts of human body through aorta.[6]
ISSN 1453 – 7303 “HIDRAULICA” (No. 2/2015) Magazine of Hydraulics, Pneumatics, Tribology, Ecology, Sensorics, Mechatronics
20
Fig. 4. Human heart [6]
c) Human Neurons - Human nerve cells are based on a sodium potassium pump known as Na-K-ATPase system. This system pumps 3 sodium ions into cell & 2 potassium ions out of a cell which causes excitation leading to human stimuli [7].
Fig. 5. Human neuron pumps
3. Liquid piston fluidyne pump [8]
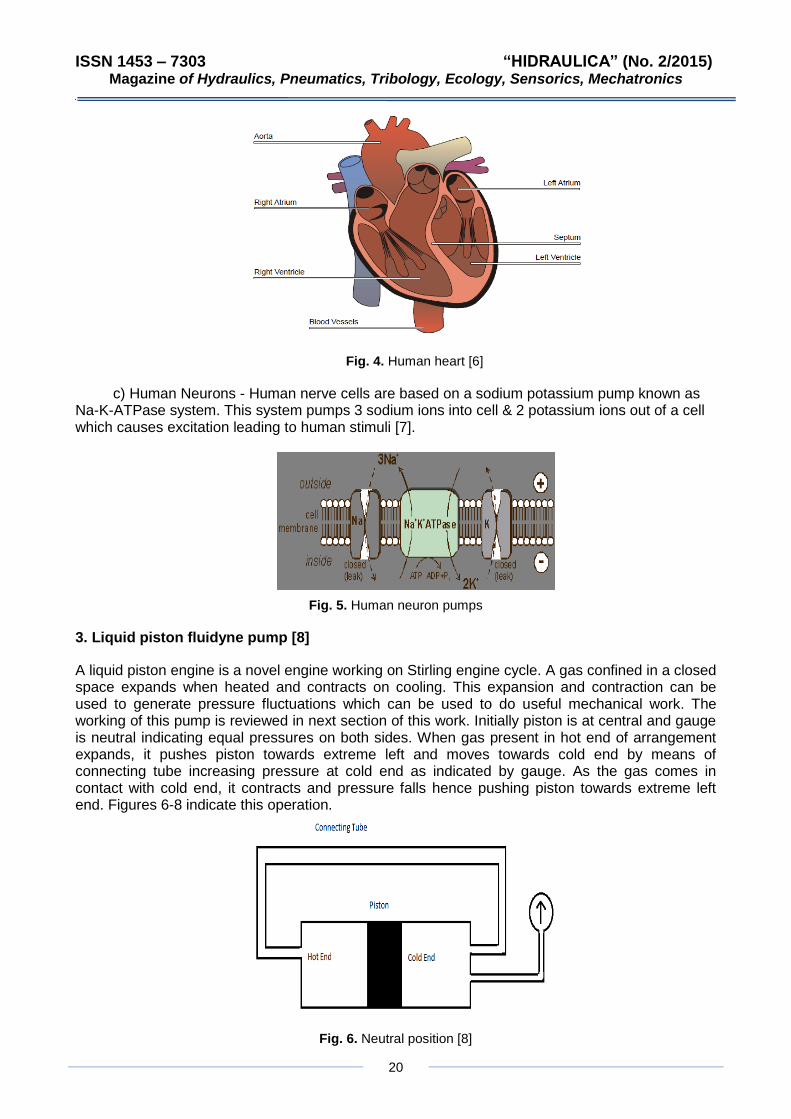
A liquid piston engine is a novel engine working on Stirling engine cycle. A gas confined in a closed space expands when heated and contracts on cooling. This expansion and contraction can be used to generate pressure fluctuations which can be used to do useful mechanical work. The working of this pump is reviewed in next section of this work. Initially piston is at central and gauge is neutral indicating equal pressures on both sides. When gas present in hot end of arrangement expands, it pushes piston towards extreme left and moves towards cold end by means of connecting tube increasing pressure at cold end as indicated by gauge. As the gas comes in contact with cold end, it contracts and pressure falls hence pushing piston towards extreme left end. Figures 6-8 indicate this operation.
Fig. 6. Neutral position [8]

ISSN 1453 – 7303 “HIDRAULICA” (No. 2/2015) Magazine of Hydraulics, Pneumatics, Tribology, Ecology, Sensorics, Mechatronics
21
Fig. 7. Expansion phase [8]
Fig. 8. Contraction phase [8]
The motion of gas causes pressure fluctuations which can be used to drive another engine for extracting useful work, as shown in figure 9. When pressure is high during expansion stroke, piston moves out and vice versa during the contraction stoke. Reciprocating motion of piston can be used to drive a crank shaft for engine motion. A regenerator can be used to increase efficiency of this system, as shown in figure 10.This consists of suitable arrangements of heat exchangers which store heat during expansion phase and release heat during contraction phase of gas.
Fig. 9. Extraction of useful work [8]
ISSN 1453 – 7303 “HIDRAULICA” (No. 2/2015) Magazine of Hydraulics, Pneumatics, Tribology, Ecology, Sensorics, Mechatronics
22
Fig. 10. Regenerator mechanism [8]
4. Motion analysis
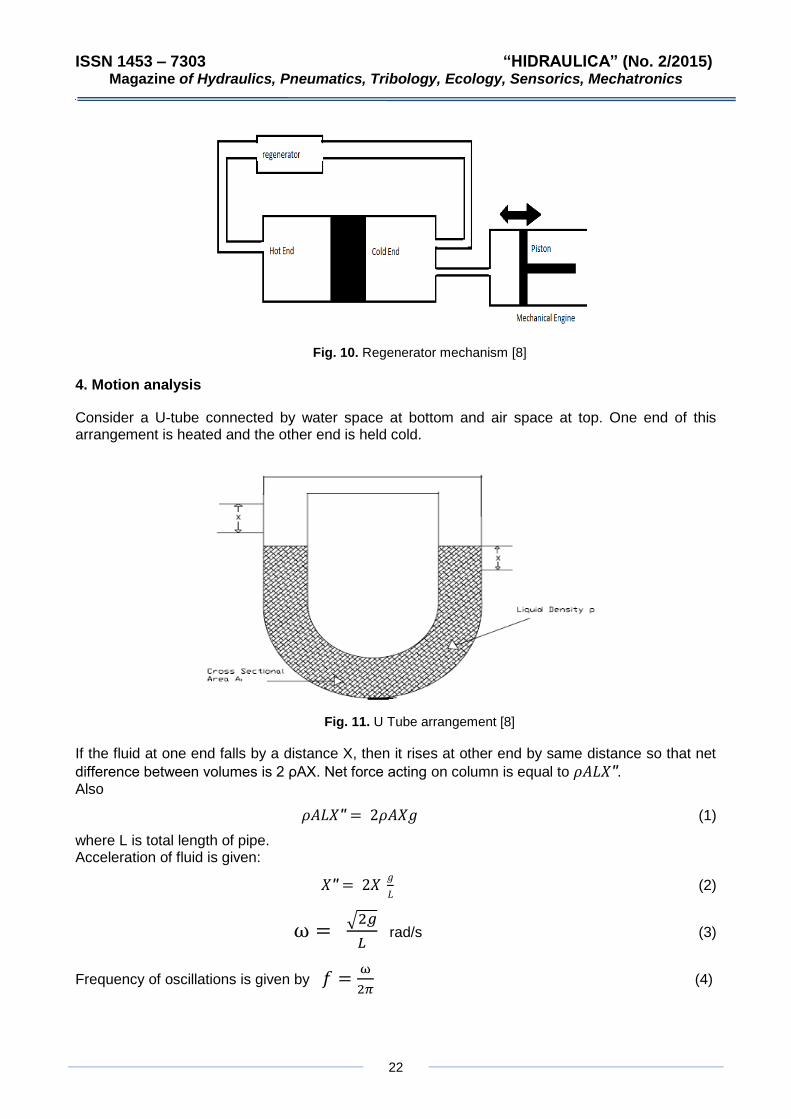
Consider a U-tube connected by water space at bottom and air space at top. One end of this arrangement is heated and the other end is held cold.
Fig. 11. U Tube arrangement [8]
If the fluid at one end falls by a distance X, then it rises at other end by same distance so that net
difference between volumes is 2 ρAX. Net force acting on column is equal to . Also
(1)
where L is total length of pipe. Acceleration of fluid is given:
(2)
rad/s (3)
Frequency of oscillations is given by
(4)
ISSN 1453 – 7303 “HIDRAULICA” (No. 2/2015) Magazine of Hydraulics, Pneumatics, Tribology, Ecology, Sensorics, Mechatronics
23
5. Experimental set up
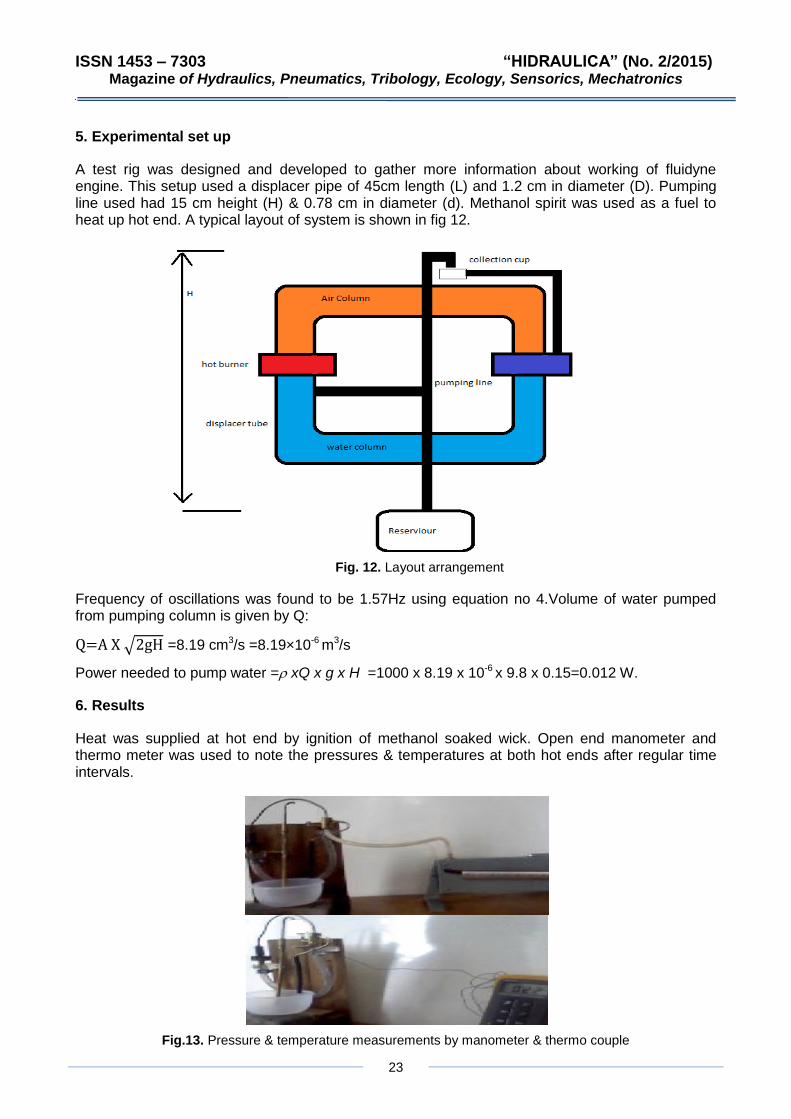
A test rig was designed and developed to gather more information about working of fluidyne engine. This setup used a displacer pipe of 45cm length (L) and 1.2 cm in diameter (D). Pumping line used had 15 cm height (H) & 0.78 cm in diameter (d). Methanol spirit was used as a fuel to heat up hot end. A typical layout of system is shown in fig 12.
Fig. 12. Layout arrangement
Frequency of oscillations was found to be 1.57Hz using equation no 4.Volume of water pumped from pumping column is given by Q:
=8.19 cm3/s =8.19×10⁻⁶ m3/s
Power needed to pump water = xQ x g x H =1000 x 8.19 x 10-6 x 9.8 x 0.15=0.012 W.
6. Results
Heat was supplied at hot end by ignition of methanol soaked wick. Open end manometer and thermo meter was used to note the pressures & temperatures at both hot ends after regular time intervals.
Fig.13. Pressure & temperature measurements by manometer & thermo couple
ISSN 1453 – 7303 “HIDRAULICA” (No. 2/2015) Magazine of Hydraulics, Pneumatics, Tribology, Ecology, Sensorics, Mechatronics
24
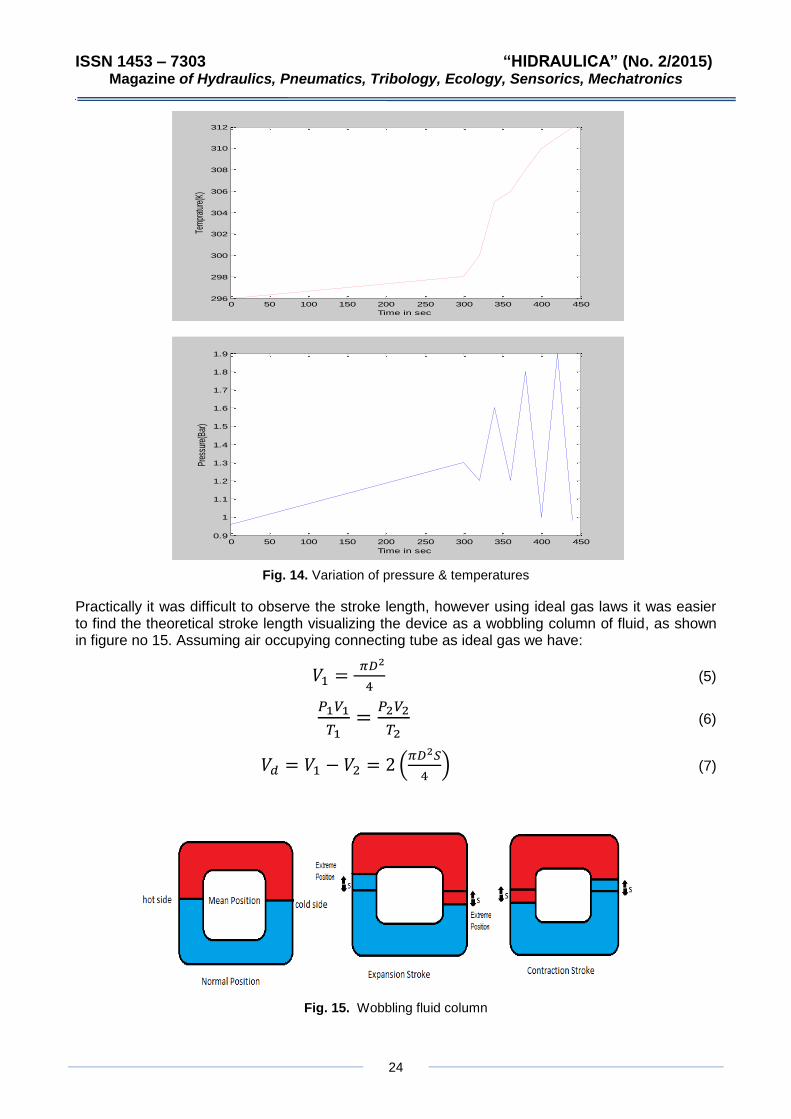
Fig. 14. Variation of pressure & temperatures
Practically it was difficult to observe the stroke length, however using ideal gas laws it was easier to find the theoretical stroke length visualizing the device as a wobbling column of fluid, as shown in figure no 15. Assuming air occupying connecting tube as ideal gas we have:
(5)
(6)
(7)
Fig. 15. Wobbling fluid column
0 50 100 150 200 250 300 350 400 450296
298
300
302
304
306
308
310
312
Time in sec
Tem
prat
ure(
K)
0 50 100 150 200 250 300 350 400 4500.9
1
1.1
1.2
1.3
1.4
1.5
1.6
1.7
1.8
1.9
Time in sec
Pres
sure
(Bar
)
ISSN 1453 – 7303 “HIDRAULICA” (No. 2/2015) Magazine of Hydraulics, Pneumatics, Tribology, Ecology, Sensorics, Mechatronics
25
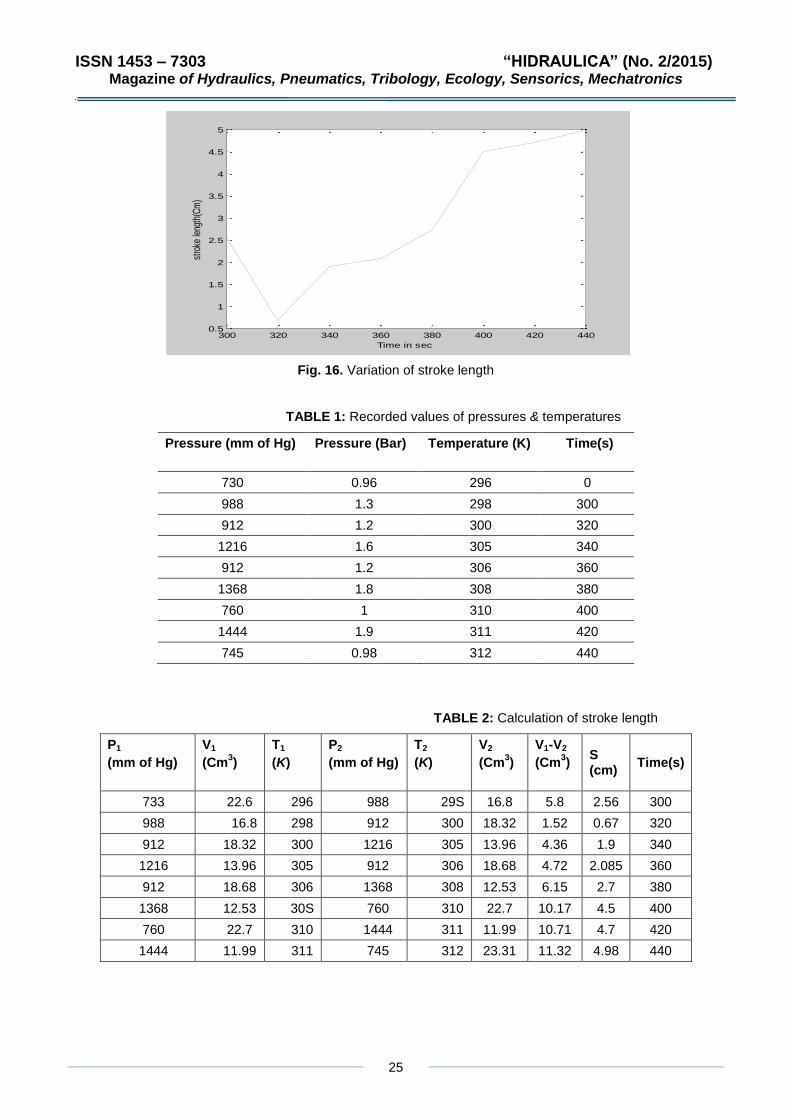
Fig. 16. Variation of stroke length
TABLE 1: Recorded values of pressures & temperatures
Pressure (mm of Hg)
Pressure (Bar)
Temperature (K)
Time(s)
730 0.96 296 0
988 1.3 298 300
912 1.2 300 320
1216 1.6 305 340
912 1.2 306 360
1368 1.8 308 380
760 1 310 400
1444 1.9 311 420
745 0.98 312 440
TABLE 2: Calculation of stroke length
P1
(mm of Hg)
V1
(Cm3)
T1
(K)
P2
(mm of Hg)
T2
(K)
V2
(Cm3)
V1-V2
(Cm3)
S (cm)
Time(s)
733 22.6 296 988 29S 16.8 5.8 2.56 300
988 16.8 298 912 300 18.32 1.52 0.67 320
912 18.32 300 1216 305 13.96 4.36 1.9 340
1216 13.96 305 912 306 18.68 4.72 2.085 360
912 18.68 306 1368 308 12.53 6.15 2.7 380
1368 12.53 30S 760 310 22.7 10.17 4.5 400
760 22.7 310 1444 311 11.99 10.71 4.7 420
1444 11.99 311 745 312 23.31 11.32 4.98 440
300 320 340 360 380 400 420 4400.5
1
1.5
2
2.5
3
3.5
4
4.5
5
Time in sec
stro
ke le
ngth
(Cm
)
ISSN 1453 – 7303 “HIDRAULICA” (No. 2/2015) Magazine of Hydraulics, Pneumatics, Tribology, Ecology, Sensorics, Mechatronics
26
7. Conclusion
Both temperature & pressure of air in the fluidyne rose with time as it gains more and more heat from the burning fuel. Pressure fluctuated & peak pressure was found to be around 1400 mm of
Hg, whereas the peak temperature was found to be around 39C indicating poor heat transfer to the working gas (air). In order to reduce heat losses, the connecting column can be covered with an insulation covering of polytetraflouroethylene tape. Further in order to improve the heat transfer rate, bigger connections can be used so that more mass of air is able to gain heat from the burning fuel. Commercial form of such fluidyne engines can be developed by using solar energy as source of heat to create pressure oscillations, thus pumping ground water from a certain depth.
References
[1] Ground Water (June 2010), retrieved from http://en.wikipedia.org/wiki/Ground_water; [2] Water Resources (June2013), retrieved from
http://en.wikipedia.org/wiki/Water_resources#Sources_of_fresh_water; [3] The United Nations world water development report 3 (June2013), retrieved from
http://webworld.unesco.org/water/wwap/wwdr/wwdr3/case_studies/pdf/WWDR3_Case_Study_Volume.pdf; [4] Earths energy budget (June 2013), from http://en.wikipedia.org/wiki/Earth's_energy_budget; [5] Trees & Capillary action (June 2010), from
http://www.davidlnelson.md/Cazadero/Trees&CapillaryAction.html; [6] Human Heart (June 2010), retrieved from
http://www.webmd.com/heart/picture-of-the-heart; [7] Nerve impulses (June 2010), from http://www.biologymad.com/nervoussystem/nerveimpulses.html; [8] C. D. West, “Liquid Piston Stirling Engine”, Van Nostrand Reinhold, New York, 1983.
ISSN 1453 – 7303 “HIDRAULICA” (No. 2/2015) Magazine of Hydraulics, Pneumatics, Tribology, Ecology, Sensorics, Mechatronics
27
Kinematic and Dynamic Irregularities of Roller Pumps
Part ІІ. Numerical Research, Results and Analysis
Prof. MSc. Gencho POPOV PhD.1, MSc. Yuliyan ANGELOV PhD.1 1University of Ruse “Angel Kanchev”, Bulgaria, [email protected], [email protected]
Abstract: In this work some theoretically found results, concerning typical irregularities of roller pumps, are given. The impact of some main geometric sizes on the character of changing of a given working camera’s flow rate, as well as the possibility for using approximate equations for the determination of the coefficient of kinematic flow rate’s irregularity, are indicated. The phase characteristics of a roll’s rotation, indicating the existing of a transitional and unsteady periodical process, depended by the kinematic characteristics of rotation, have been presented. Graphs, representing the change of the existing forces, acting on the pump’s rolls, and adjusted pump’s shaft torque, both them limited in the range of one full rotation, have also been given.
Keywords: Roller pump, kinematic and dynamic irregularities.
1. Introduction
In the first part of this work the equations, describing some of the main irregularities of roller pumps: kinematic – determining the flow rate’s irregularity; dynamic – determining the loading on the main working elements of these pumps, have been established. These equations ensure the providing of theoretical research, concerning the evaluation and analysis of the work processes of this type of pumps. The main purpose of this work is to use the already established (in the first part) theoretical models and equations, so that numerical research, concerning the determination of the character and parameters of the appeared and periodically existing processes, as well as the change of the occurred irregularities of a roller pump’s working characteristics, to be accomplished.
2 Numerical research and results, concerning the kinematic irregularities
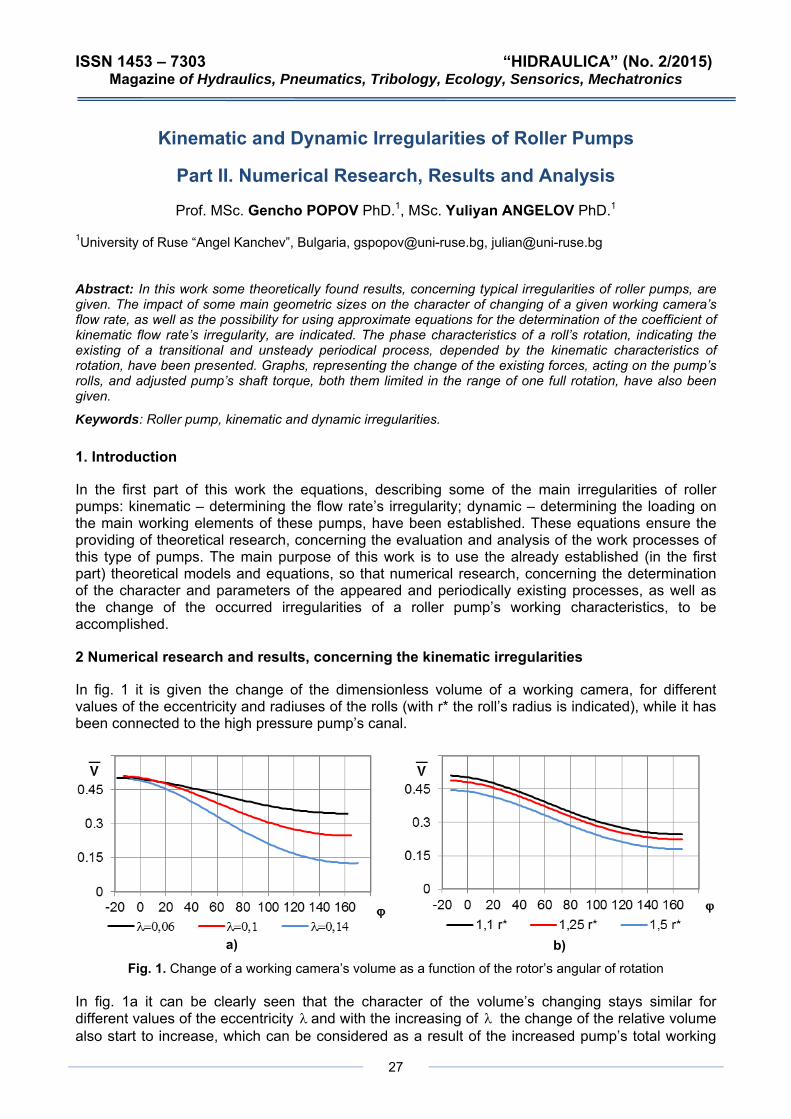
In fig. 1 it is given the change of the dimensionless volume of a working camera, for different values of the eccentricity and radiuses of the rolls (with r* the roll’s radius is indicated), while it has been connected to the high pressure pump’s canal.
а) b) Fig. 1. Change of a working camera’s volume as a function of the rotor’s angular of rotation
In fig. 1a it can be clearly seen that the character of the volume’s changing stays similar for different values of the eccentricity and with the increasing of λ λ the change of the relative volume also start to increase, which can be considered as a result of the increased pump’s total working
ISSN 1453 – 7303 “HIDRAULICA” (No. 2/2015) Magazine of Hydraulics, Pneumatics, Tribology, Ecology, Sensorics, Mechatronics
28
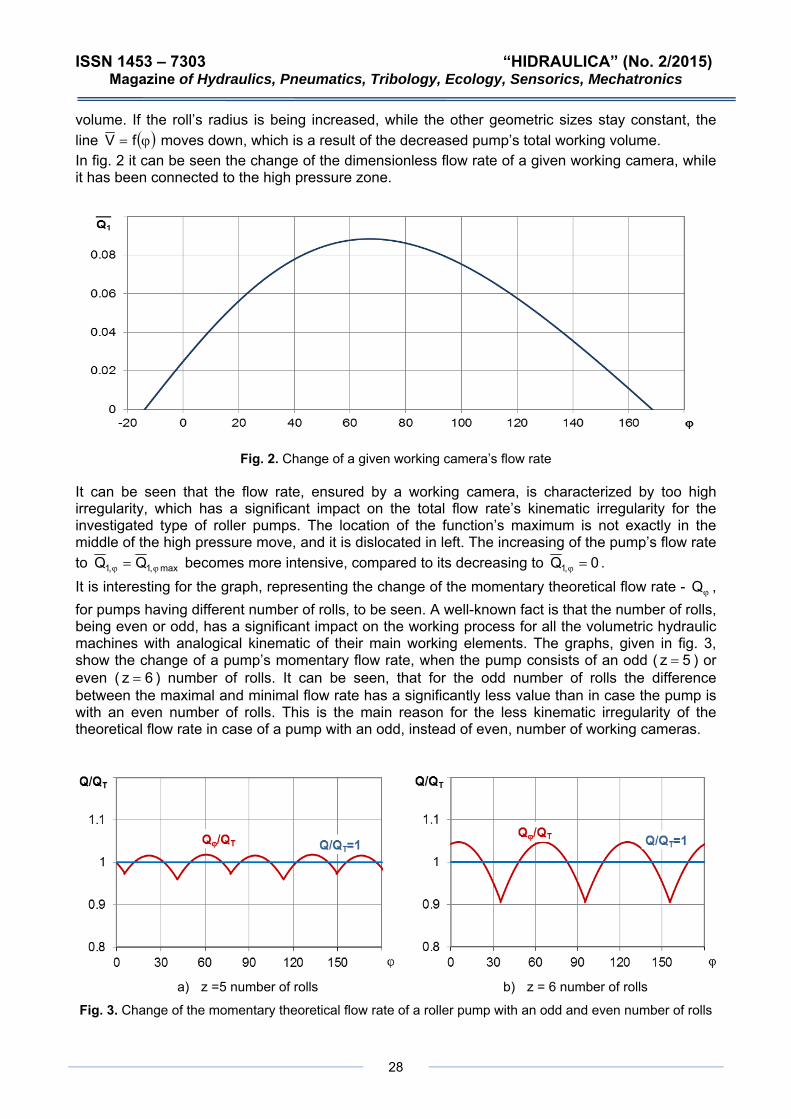
volume. If the roll’s radius is being increased, while the other geometric sizes stay constant, the line ( )ϕ= fV moves down, which is a result of the decreased pump’s total working volume. In fig. 2 it can be seen the change of the dimensionless flow rate of a given working camera, while it has been connected to the high pressure zone.
Fig. 2. Change of a given working camera’s flow rate
It can be seen that the flow rate, ensured by a working camera, is characterized by too high irregularity, which has a significant impact on the total flow rate’s kinematic irregularity for the investigated type of roller pumps. The location of the function’s maximum is not exactly in the middle of the high pressure move, and it is dislocated in left. The increasing of the pump’s flow rate to max,1,1 QQ ϕϕ = becomes more intensive, compared to its decreasing to 0Q ,1 =ϕ . It is interesting for the graph, representing the change of the momentary theoretical flow rate - for pumps having different number of rolls, to be seen. A well-known fact is that the number of rolls, being even or odd, has a significant impact on the working process for all the volumetric hydraulic machines with analogical kinematic of their main working elements. The graphs, given in fig. 3, show the change of a pump’s momentary flow rate, when the pump consists of an odd (
ϕQ ,
5z = ) or even ( ) number of rolls. It can be seen, that for the odd number of rolls the difference between the maximal and minimal flow rate has a significantly less value than in case the pump is with an even number of rolls. This is the main reason for the less kinematic irregularity of the theoretical flow rate in case of a pump with an odd, instead of even, number of working cameras.
6z =
a) z =5 number of rolls b) z = 6 number of rolls
Fig. 3. Change of the momentary theoretical flow rate of a roller pump with an odd and even number of rolls
ISSN 1453 – 7303 “HIDRAULICA” (No. 2/2015) Magazine of Hydraulics, Pneumatics, Tribology, Ecology, Sensorics, Mechatronics
29
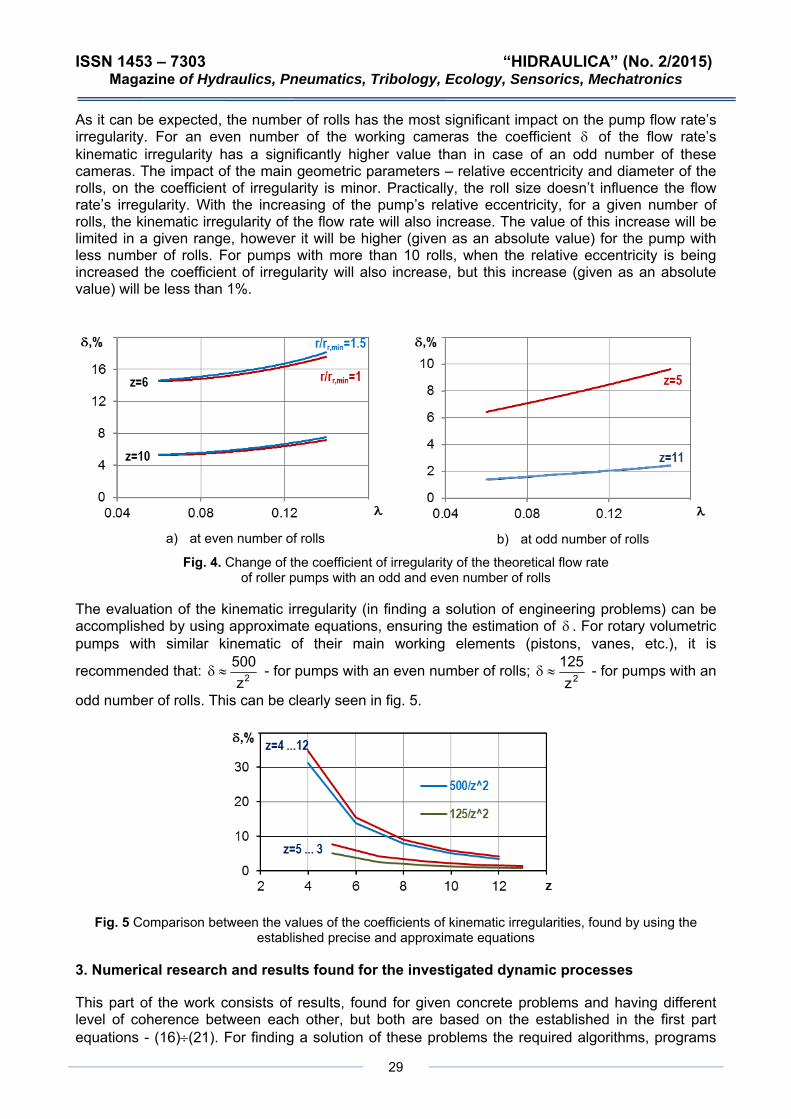
As it can be expected, the number of rolls has the most significant impact on the pump flow rate’s irregularity. For an even number of the working cameras the coefficient of the flow rate’s kinematic irregularity has a significantly higher value than in case of an odd number of these cameras. The impact of the main geometric parameters – relative eccentricity and diameter of the rolls, on the coefficient of irregularity is minor. Practically, the roll size doesn’t influence the flow rate’s irregularity. With the increasing of the pump’s relative eccentricity, for a given number of rolls, the kinematic irregularity of the flow rate will also increase. The value of this increase will be limited in a given range, however it will be higher (given as an absolute value) for the pump with less number of rolls. For pumps with more than 10 rolls, when the relative eccentricity is being increased the coefficient of irregularity will also increase, but this increase (given as an absolute value) will be less than 1%.
δ
a) at even number of rolls
b) at odd number of rolls
Fig. 4. Change of the coefficient of irregularity of the theoretical flow rate of roller pumps with an odd and even number of rolls
The evaluation of the kinematic irregularity (in finding a solution of engineering problems) can be accomplished by using approximate equations, ensuring the estimation of . For rotary volumetric pumps with similar kinematic of their main working elements (pistons, vanes, etc.), it is
recommended that:
δ
2z≈δ
500 - for pumps with an even number of rolls; 2z≈δ
125 - for pumps with an
odd number of rolls. This can be clearly seen in fig. 5.
Fig. 5 Comparison between the values of the coefficients of kinematic irregularities, found by using the established precise and approximate equations
3. Numerical research and results found for the investigated dynamic processes
This part of the work consists of results, found for given concrete problems and having different level of coherence between each other, but both are based on the established in the first part equations - (16)÷(21). For finding a solution of these problems the required algorithms, programs
ISSN 1453 – 7303 “HIDRAULICA” (No. 2/2015) Magazine of Hydraulics, Pneumatics, Tribology, Ecology, Sensorics, Mechatronics
30
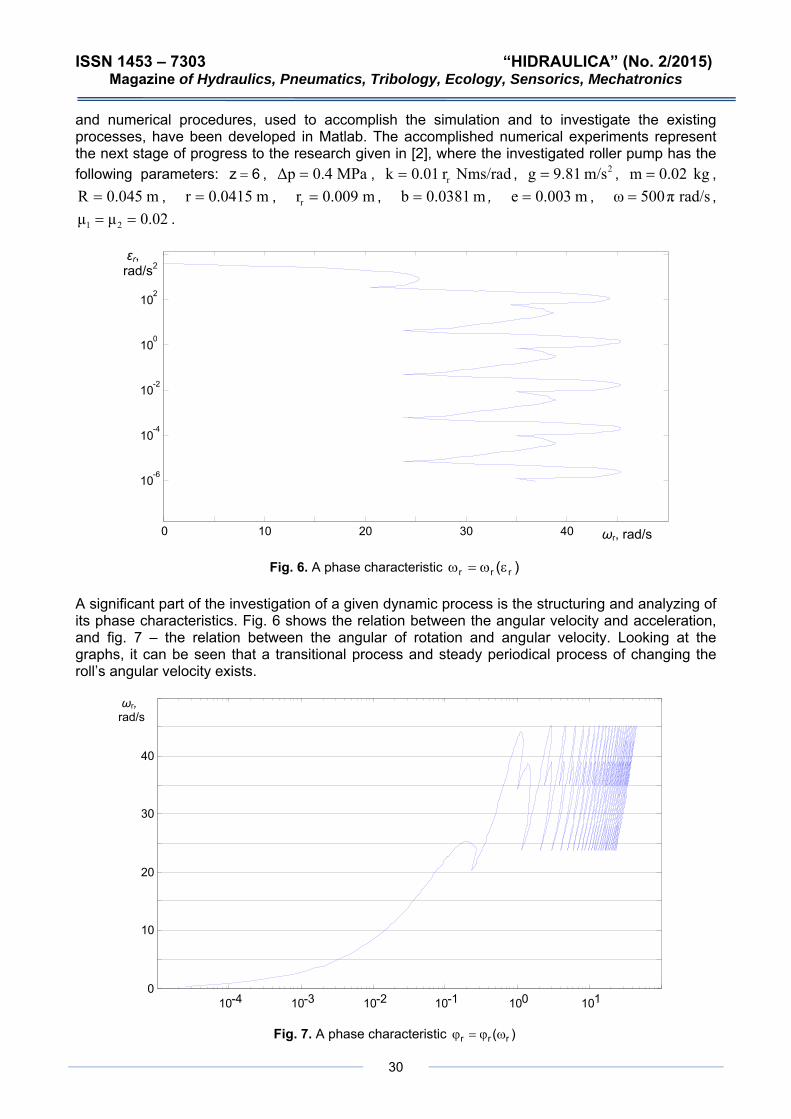
and numerical procedures, used to accomplish the simulation and to investigate the existing processes, have been developed in Matlab. The accomplished numerical experiments represent the next stage of progress to the research given in [2], where the investigated roller pump has the following parameters: 6z = , , MPa0.4Δp = Nms/radr0.01k r= , , ,
, , ,
2m/s9.81g = kg0.02m =m0.045R = m0.0415r = m0.009r =r m0.0381b = , m0.003e = , ,
. rad/sπ500=ω
0.02μμ 21 ==
)( rrr
Fig. 6. A phase characteristic εω=ω
A significant part of the investigation of a given dynamic process is the structuring and analyzing of its phase characteristics. Fig. 6 shows the relation between the angular velocity and acceleration, and fig. 7 – the relation between the angular of rotation and angular velocity. Looking at the graphs, it can be seen that a transitional process and steady periodical process of changing the roll’s angular velocity exists.
Fig. 7. A phase characteristic )( rrr ωϕ=ϕ
10-4 10 -3 10-2 10-1 100 10 1 0
10
20
30
40
ωr, rad/s
0 10 20 30 40
10-6
10-4
10-2
100
102
ωr, rad/s
εr, rad/s2
ISSN 1453 – 7303 “HIDRAULICA” (No. 2/2015) Magazine of Hydraulics, Pneumatics, Tribology, Ecology, Sensorics, Mechatronics
31
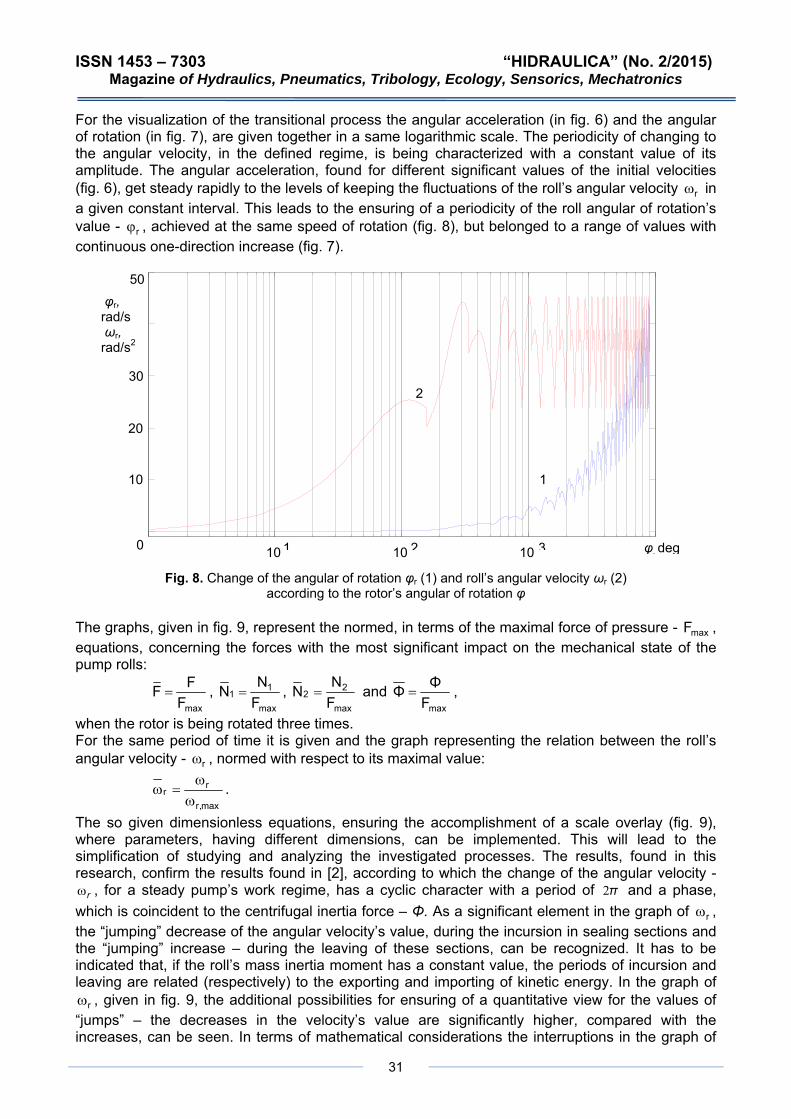
For the visualization of the transitional process the angular acceleration (in fig. 6) and the angular of rotation (in fig. 7), are given together in a same logarithmic scale. The periodicity of changing to the angular velocity, in the defined regime, is being characterized with a constant value of its amplitude. The angular acceleration, found for different significant values of the initial velocities (fig. 6), get steady rapidly to the levels of keeping the fluctuations of the roll’s angular velocity rω in a given constant interval. This leads to the ensuring of a periodicity of the roll angular of rotation’s value - , achieved at the same speed of rotation (fig. 8), but belonged to a range of values with continuous one-direction increase (fig. 7).
rϕ
max
Fig. 8. Change of the angular of rotation φr (1) and roll’s angular velocity ωr (2)
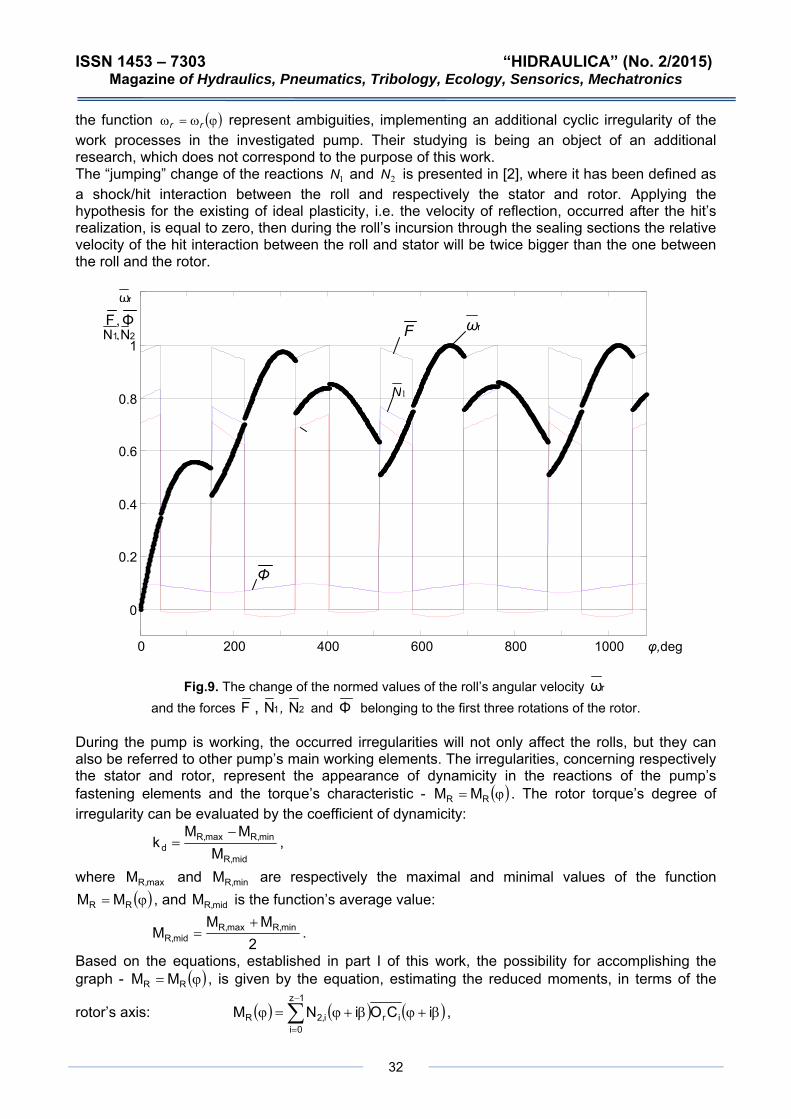
according to the rotor’s angular of rotation φ The graphs, given in fig. 9, represent the normed, in terms of the maximal force of pressure - F , equations, concerning the forces with the most significant impact on the mechanical state of the pump rolls:
maxFFF = ,
max1
F= 1NN ,
max2
F= 2NN and
maxF=
ΦΦ ,
when the rotor is being rotated three times. For the same period of time it is given and the graph representing the relation between the roll’s angular velocity - , normed with respect to its maximal value: rω
max,rr
ωrω=ω .
The so given dimensionless equations, ensuring the accomplishment of a scale overlay (fig. 9), where parameters, having different dimensions, can be implemented. This will lead to the simplification of studying and analyzing the investigated processes. The results, found in this research, confirm the results found in [2], according to which the change of the angular velocity -
, for a steady pump’s work regime, has a cyclic character with a period of and a phase, which is coincident to the centrifugal inertia force – Φ. As a significant element in the graph of
rω π2
rω , the “jumping” decrease of the angular velocity’s value, during the incursion in sealing sections and the “jumping” increase – during the leaving of these sections, can be recognized. It has to be indicated that, if the roll’s mass inertia moment has a constant value, the periods of incursion and leaving are related (respectively) to the exporting and importing of kinetic energy. In the graph of
, given in fig. 9, the additional possibilities for ensuring of a quantitative view for the values of “jumps” – the decreases in the velocity’s value are significantly higher, compared with the increases, can be seen. In terms of mathematical considerations the interruptions in the graph of
rω
10 1 10 2 10 3 φ, deg0
10
20
30
50 φr, rad/s ωr, rad/s2
2
1
ISSN 1453 – 7303 “HIDRAULICA” (No. 2/2015) Magazine of Hydraulics, Pneumatics, Tribology, Ecology, Sensorics, Mechatronics
32
the function represent ambiguities, implementing an additional cyclic irregularity of the work processes in the investigated pump. Their studying is being an object of an additional research, which does not correspond to the purpose of this work.
( )ϕω=ω rr
The “jumping” change of the reactions and is presented in [2], where it has been defined as a shock/hit interaction between the roll and respectively the stator and rotor. Applying the hypothesis for the existing of ideal plasticity, i.e. the velocity of reflection, occurred after the hit’s realization, is equal to zero, then during the roll’s incursion through the sealing sections the relative velocity of the hit interaction between the roll and stator will be twice bigger than the one between the roll and the rotor.
1N 2N
Fig.9. The change of the normed values of the roll’s angular velocity rω and the forces F , 1N , 2N and Φ belonging to the first three rotations of the rotor.
During the pump is working, the occurred irregularities will not only affect the rolls, but they can also be referred to other pump’s main working elements. The irregularities, concerning respectively the stator and rotor, represent the appearance of dynamicity in the reactions of the pump’s fastening elements and the torque’s characteristic - ( )ϕ= RR MM . The rotor torque’s degree of irregularity can be evaluated by the coefficient of dynamicity:
mid,RM
min,R
min,Rmax,R MMk
−=d
max,RM
,
where and M are respectively the maximal and minimal values of the function , and is the function’s average value: (ϕ= RR MM ) mid,RM
2M mid,R =
( )ϕ= RR M
MM min,Rmax,R +.
Based on the equations, established in part I of this work, the possibility for accomplishing the graph - M , is given by the equation, estimating the reduced moments, in terms of the
rotor’s axis: ( ) ( ) ( )β+ϕβ+ϕ=ϕ ∑−
iCOiN=
1z
0iiri,2RM ,
0 200 400 600 800 1000
0
0.2
0.4
0.6
0.8
1
Φ,FF
1N
Φ
rω
φ,deg
rω
21 N,N
ISSN 1453 – 7303 “HIDRAULICA” (No. 2/2015) Mechatronics
33
Magazine of Hydraulics, Pneumatics, Tribology, Ecology, Sensorics,
where ( ) ( ) ( ) ( )ϕ−−+ϕ=ϕ 222 sinerRcoseCO ir
( )ϕ2
is the distance between the rotor’s axis of rotation and the ith number of a roll, and N is the projection of the main vector of forces on the tangent.
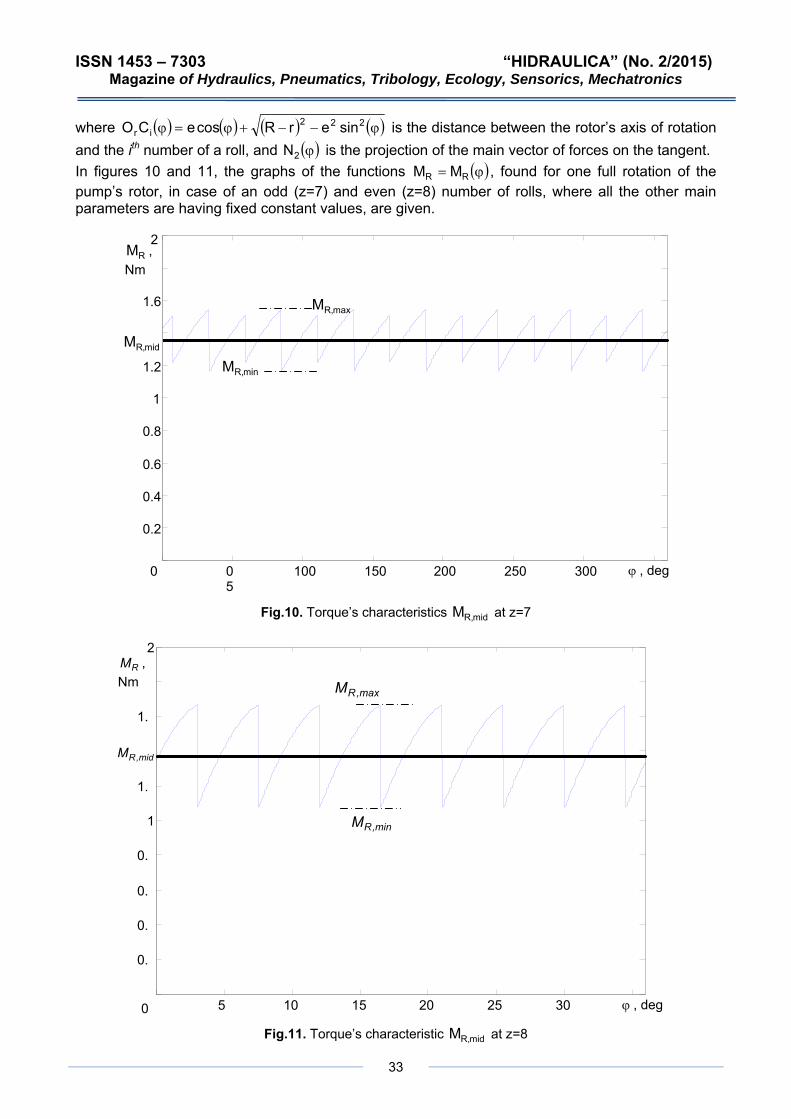
( )In figures 10 and 11, the graphs of the functions = ϕRR M
mid,RM
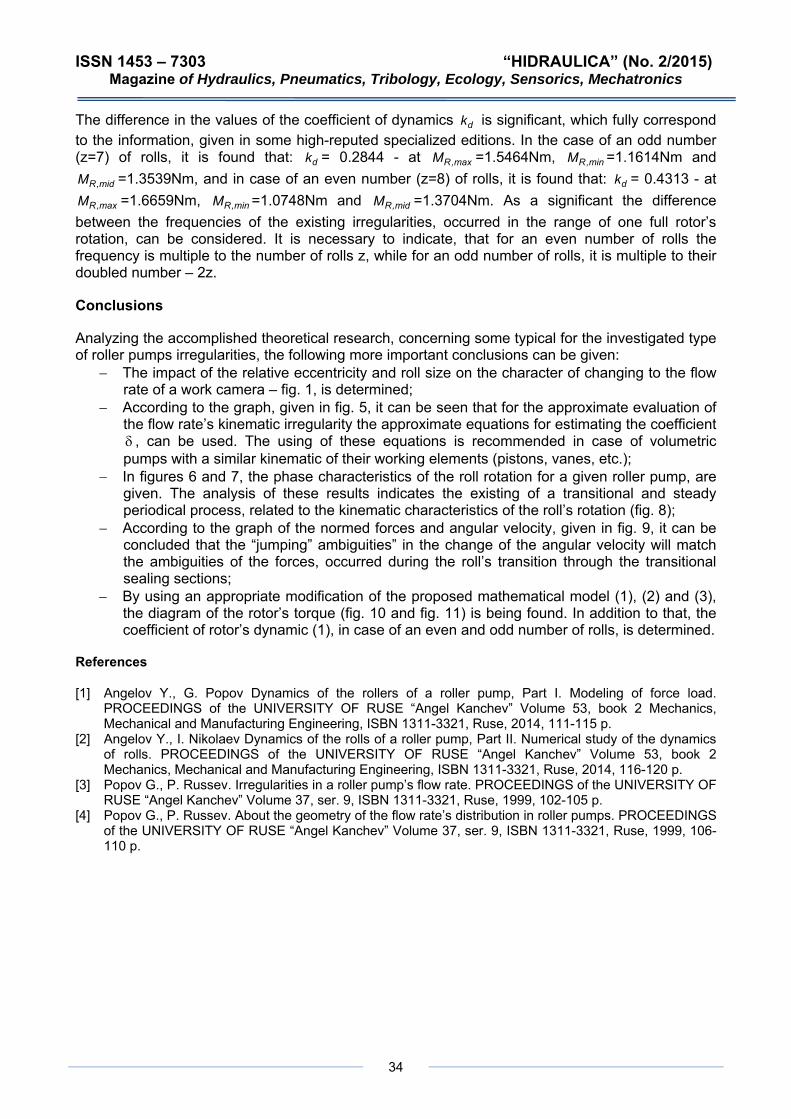
Fig.11. Torque’s characteristic mid,RM at z=8
M , found for one full rotation of the pump’s rotor, in case of an odd (z=7) and even (z=8) number of rolls, where all the other main parameters are having fixed constant values, are given.
2
Fig.10. Torque’s characteristics at z=7
0 5 10 15 20 25 30 ϕ , deg
0.
0.
0.
0.
1
1.
mid,RM
1.
RM , Nm
2
,maxRM
min,RM
0 0 5
100 150 200 250 300
mid,RM
0.2
0.4
0.6
0.8
1
1.2
1.6
RM , Nm
max,RM
min,RM
ϕ , deg
ISSN 1453 – 7303 “HIDRAULICA” (No. 2/2015) Magazine of Hydraulics, Pneumatics, Tribology, Ecology, Sensorics, Mechatronics
34
The difference in the values cant, fully correspond
,maxRMbetween the frequencies of the existing irregularit
ccomplished theoretical research, concerning some typical for the investigated type
−
−
−
Y., G. Popov Dynamics of the rollers of a roller pump, Part I. Modeling of force load.
of the coefficient of dynamics s signifi dked
i which
d that:
to the information, given in some high-reputed specialized itions. In the case of an odd number (z=7) of rolls, it is found that: dk = 0.2844 - at ,maxRM =1.5464Nm, ,minRM =1.1614Nm and
mid,RM =1.3539Nm, and in case of an even number (z=8) of rolls, it is foun dk = 0.4313 - at =1.6659Nm, ,minRM =1.0748Nm and mid,RM =1.3704Nm. As a significant the difference
ies, occurred in the range of one full rotor’s rotation, can be considered. It is necessary to indicate, that for an even number of rolls the frequency is multiple to the number of rolls z, while for an odd number of rolls, it is multiple to their doubled number – 2z.
Conclusions
Analyzing the aof roller pumps irregularities, the following more important conclusions can be given:
− The impact of the relative eccentricity and roll size on the character of changing to the flow rate of a work camera – fig. 1, is determined;
− According to the graph, given in fig. 5, it can be seen that for the approximate evaluation of the flow rate’s kinematic irregularity the approximate equations for estimating the coefficient δ , can be used. The using of these equations is recommended in case of volumetric pumps with a similar kinematic of their working elements (pistons, vanes, etc.); In figures 6 and 7, the phase characteristics of the roll rotation for a given roller pump, are given. The analysis of these results indicates the existing of a transitional and steady periodical process, related to the kinematic characteristics of the roll’s rotation (fig. 8); According to the graph of the normed forces and angular velocity, given in fig. 9, it can be concluded that the “jumping” ambiguities” in the change of the angular velocity will match the ambiguities of the forces, occurred during the roll’s transition through the transitional sealing sections; By using an appropriate modification of the proposed mathematical model (1), (2) and (3), the diagram of the rotor’s torque (fig. 10 and fig. 11) is being found. In addition to that, the coefficient of rotor’s dynamic (1), in case of an even and odd number of rolls, is determined.
References
[1] Angelov PROCEEDINGS of the UNIVERSITY OF RUSE “Angel Kanchev” Volume 53, book 2 Mechanics, Mechanical and Manufacturing Engineering, ISBN 1311-3321, Ruse, 2014, 111-115 p.
[2] Angelov Y., I. Nikolaev Dynamics of the rolls of a roller pump, Part II. Numerical study of the dynamics of rolls. PROCEEDINGS of the UNIVERSITY OF RUSE “Angel Kanchev” Volume 53, book 2 Mechanics, Mechanical and Manufacturing Engineering, ISBN 1311-3321, Ruse, 2014, 116-120 p.
[3] Popov G., P. Russev. Irregularities in a roller pump’s flow rate. PROCEEDINGS of the UNIVERSITY OF RUSE “Angel Kanchev” Volume 37, ser. 9, ISBN 1311-3321, Ruse, 1999, 102-105 p.
[4] Popov G., P. Russev. About the geometry of the flow rate’s distribution in roller pumps. PROCEEDINGS of the UNIVERSITY OF RUSE “Angel Kanchev” Volume 37, ser. 9, ISBN 1311-3321, Ruse, 1999, 106-110 p.
ISSN 1453 – 7303 “HIDRAULICA” (No. 2/2015) Magazine of Hydraulics, Pneumatics, Tribology, Ecology, Sensorics, Mechatronics
35
Static Characteristics of the Orifices in a Pilot Operated Pressure Relief Valve
PhD. eng. Sasko DIMITROV1, PhD. eng. Simeon SIMEONOV2, PhD. eng. Slavco CVETKOV3
1 “Goce Delcev” University - Stip, Macedonia, [email protected]
Abstract: In this paper the static characteristics of the sharp edged orifices have been investigated. Mathematical relationship between pressure loss and flow through the orifice has been developed and solved for orifices mainly used in pilot operated pressure relief valves. A CFD simulation of the flowing process has been done. A full CAD model of the volume for orifices with different geometric parameters was created and meshed at finite number of elements. As a result of the CFD computations, few diagrams have been presented and compared to the theoretical ones. The discharge coefficient and the pressure loss coefficient have been obtained.
Keywords: orifice, pressure drop, flow, CFD, simulation, discharge coefficient.
1. Introduction
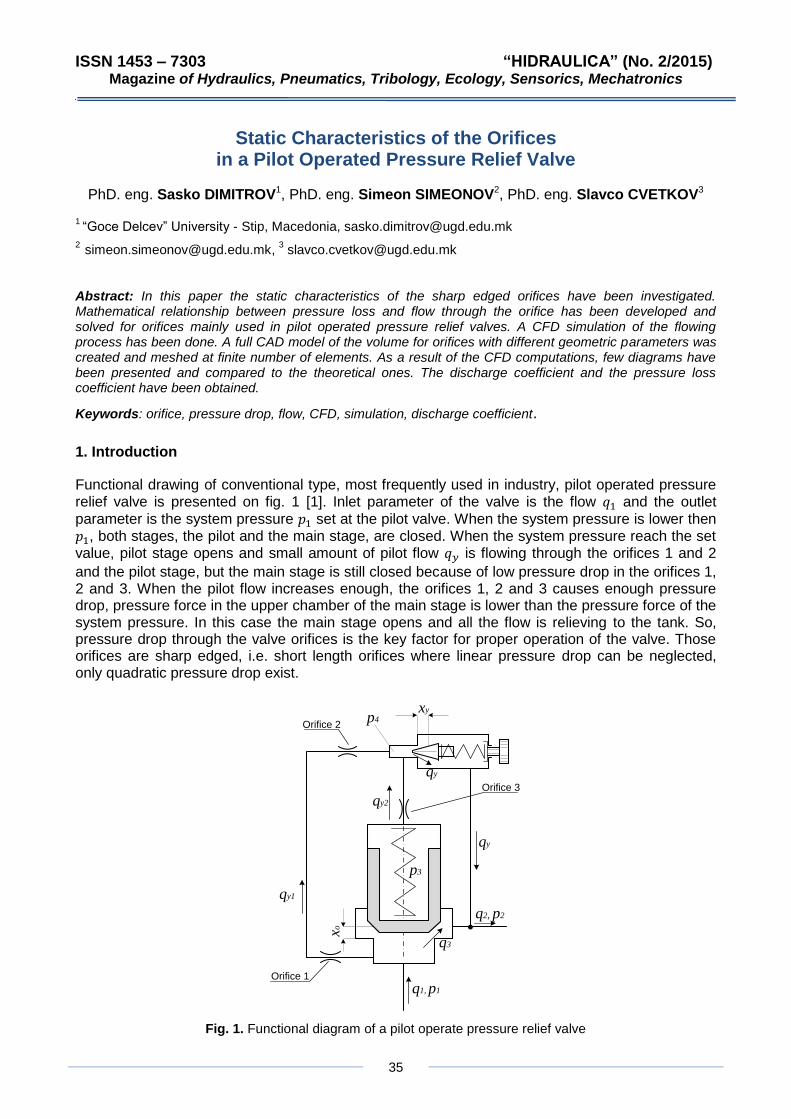
Functional drawing of conventional type, most frequently used in industry, pilot operated pressure relief valve is presented on fig. 1 [1]. Inlet parameter of the valve is the flow and the outlet
parameter is the system pressure set at the pilot valve. When the system pressure is lower then , both stages, the pilot and the main stage, are closed. When the system pressure reach the set value, pilot stage opens and small amount of pilot flow is flowing through the orifices 1 and 2
and the pilot stage, but the main stage is still closed because of low pressure drop in the orifices 1, 2 and 3. When the pilot flow increases enough, the orifices 1, 2 and 3 causes enough pressure drop, pressure force in the upper chamber of the main stage is lower than the pressure force of the system pressure. In this case the main stage opens and all the flow is relieving to the tank. So, pressure drop through the valve orifices is the key factor for proper operation of the valve. Those orifices are sharp edged, i.e. short length orifices where linear pressure drop can be neglected, only quadratic pressure drop exist.
xy
qy
q3
qy
q2, p2
xo
qy1
q1, p1
p4
qy2
p3
Orifice 1
Orifice 2
Orifice 3
Fig. 1. Functional diagram of a pilot operate pressure relief valve
ISSN 1453 – 7303 “HIDRAULICA” (No. 2/2015) Magazine of Hydraulics, Pneumatics, Tribology, Ecology, Sensorics, Mechatronics
36
The flowing and pressure drop through the sharp edged short orifices have been investigated long time ago. In [2] a model for discharge coefficient in the orifice is introduced as a function of the Reynolds number. According to this model, discharge coefficient calculation requires iterative procedure because Reynolds number also depends on the flow rate. To avoid this iterative procedure, in [3] an empirical discharge coefficient model for orifice flow is recommended. Another model for the discharge coefficient is described in [4] by Borutzky. Those models provide a linear relation through the orifice for small velocities while for turbulent flows, they match the conventional square root characteristics. Also, the transition from the laminar to the turbulent regime is smooth [5]. In this paper a CFD method for simulation of the flowing process through the orifice is used, the pressure drop coefficient and the discharges coefficient have been determined and compared with numerical ones.
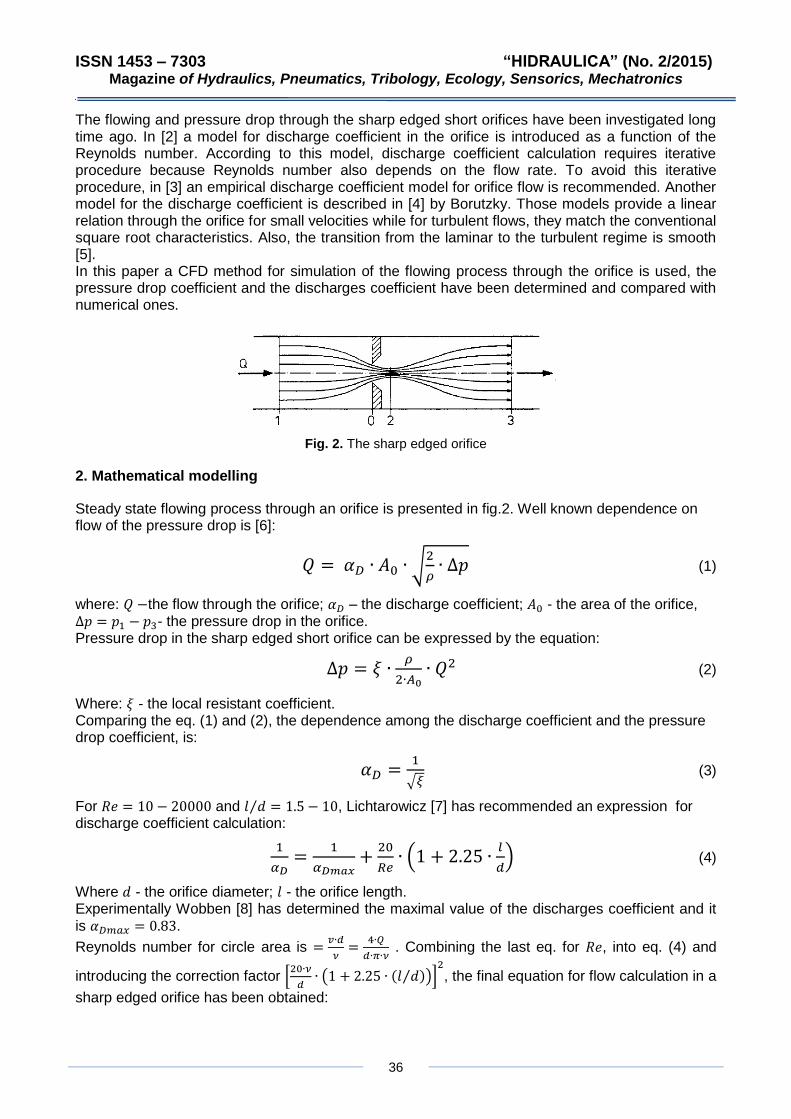
Fig. 2. The sharp edged orifice
2. Mathematical modelling
Steady state flowing process through an orifice is presented in fig.2. Well known dependence on flow of the pressure drop is [6]:
(1)
where: the flow through the orifice; – the discharge coefficient; - the area of the orifice, - the pressure drop in the orifice. Pressure drop in the sharp edged short orifice can be expressed by the equation:
(2)
Where: - the local resistant coefficient. Comparing the eq. (1) and (2), the dependence among the discharge coefficient and the pressure drop coefficient, is:
(3)
For and , Lichtarowicz [7] has recommended an expression for discharge coefficient calculation:
(4)
Where - the orifice diameter; - the orifice length. Experimentally Wobben [8] has determined the maximal value of the discharges coefficient and it is .
Reynolds number for circle area is
. Combining the last eq. for , into eq. (4) and
introducing the correction factor
, the final equation for flow calculation in a
sharp edged orifice has been obtained:
ISSN 1453 – 7303 “HIDRAULICA” (No. 2/2015) Magazine of Hydraulics, Pneumatics, Tribology, Ecology, Sensorics, Mechatronics
37
(5)
Knowing the geometric parameters of the orifice, applying eq. (5), it is possible to obtain the static characteristic of the orifice, i.e. the flow through the orifice depending on the pressure drop in the orifice.
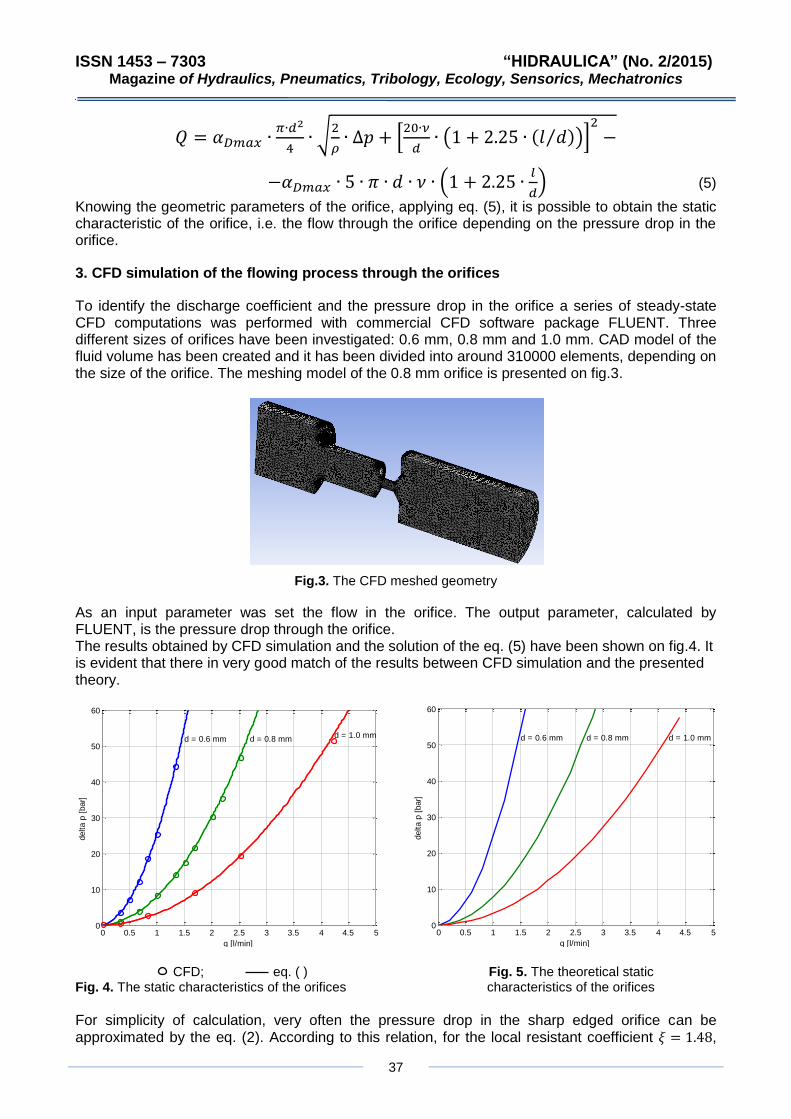
3. CFD simulation of the flowing process through the orifices
To identify the discharge coefficient and the pressure drop in the orifice a series of steady-state CFD computations was performed with commercial CFD software package FLUENT. Three different sizes of orifices have been investigated: 0.6 mm, 0.8 mm and 1.0 mm. CAD model of the fluid volume has been created and it has been divided into around 310000 elements, depending on the size of the orifice. The meshing model of the 0.8 mm orifice is presented on fig.3.
Fig.3. The CFD meshed geometry
As an input parameter was set the flow in the orifice. The output parameter, calculated by FLUENT, is the pressure drop through the orifice. The results obtained by CFD simulation and the solution of the eq. (5) have been shown on fig.4. It is evident that there in very good match of the results between CFD simulation and the presented theory.
CFD; eq. ( ) Fig. 5. The theoretical static Fig. 4. The static characteristics of the orifices characteristics of the orifices
For simplicity of calculation, very often the pressure drop in the sharp edged orifice can be approximated by the eq. (2). According to this relation, for the local resistant coefficient ,
0 0.5 1 1.5 2 2.5 3 3.5 4 4.5 50
10
20
30
40
50
60
d = 0.6 mm d = 0.8 mm d = 1.0 mm
q [l/min]
delta p
[bar]
0 0.5 1 1.5 2 2.5 3 3.5 4 4.5 50
10
20
30
40
50
60
d = 0.6 mm d = 0.8 mm d = 1.0 mm
q [l/min]
delta p
[bar]
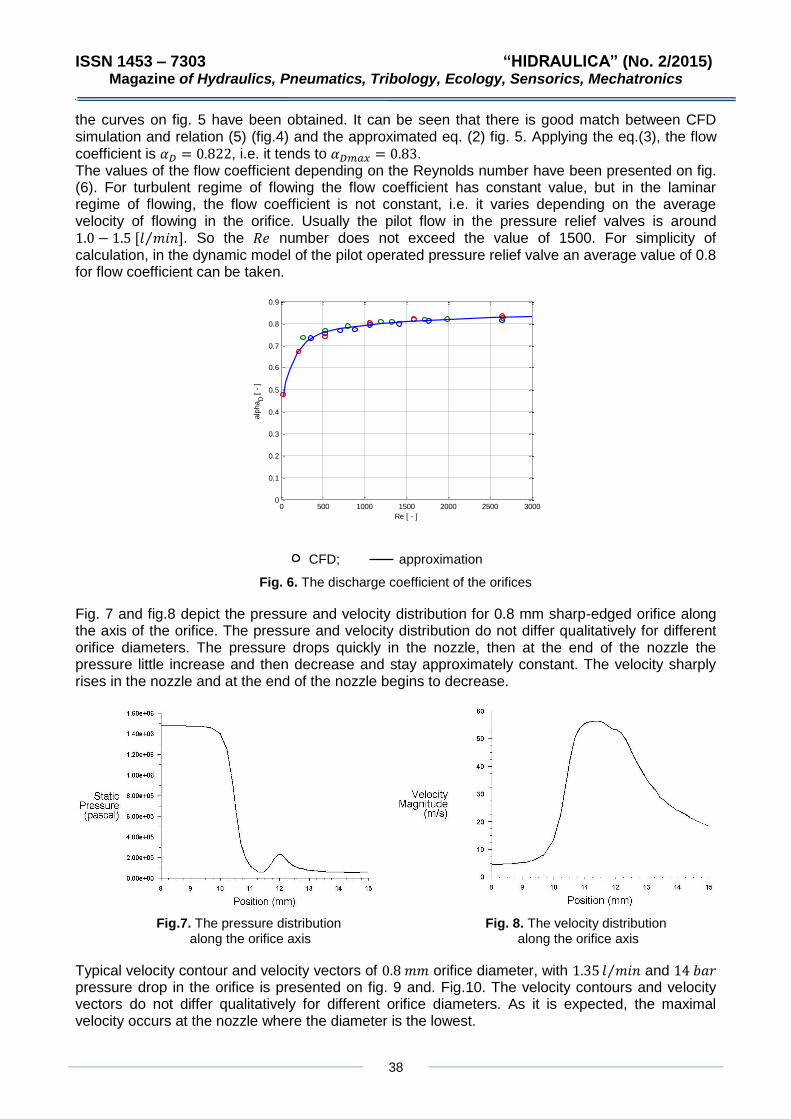
ISSN 1453 – 7303 “HIDRAULICA” (No. 2/2015) Magazine of Hydraulics, Pneumatics, Tribology, Ecology, Sensorics, Mechatronics
38
the curves on fig. 5 have been obtained. It can be seen that there is good match between CFD simulation and relation (5) (fig.4) and the approximated eq. (2) fig. 5. Applying the eq.(3), the flow coefficient is , i.e. it tends to . The values of the flow coefficient depending on the Reynolds number have been presented on fig. (6). For turbulent regime of flowing the flow coefficient has constant value, but in the laminar regime of flowing, the flow coefficient is not constant, i.e. it varies depending on the average velocity of flowing in the orifice. Usually the pilot flow in the pressure relief valves is around . So the number does not exceed the value of 1500. For simplicity of calculation, in the dynamic model of the pilot operated pressure relief valve an average value of 0.8 for flow coefficient can be taken.
CFD; approximation
Fig. 6. The discharge coefficient of the orifices
Fig. 7 and fig.8 depict the pressure and velocity distribution for 0.8 mm sharp-edged orifice along the axis of the orifice. The pressure and velocity distribution do not differ qualitatively for different orifice diameters. The pressure drops quickly in the nozzle, then at the end of the nozzle the pressure little increase and then decrease and stay approximately constant. The velocity sharply rises in the nozzle and at the end of the nozzle begins to decrease.
Fig.7. The pressure distribution Fig. 8. The velocity distribution along the orifice axis along the orifice axis
Typical velocity contour and velocity vectors of orifice diameter, with and pressure drop in the orifice is presented on fig. 9 and. Fig.10. The velocity contours and velocity vectors do not differ qualitatively for different orifice diameters. As it is expected, the maximal velocity occurs at the nozzle where the diameter is the lowest.
0 500 1000 1500 2000 2500 30000
0.1
0.2
0.3
0.4
0.5
0.6
0.7
0.8
0.9
Re [ - ]
alp
ha
D [
- ]
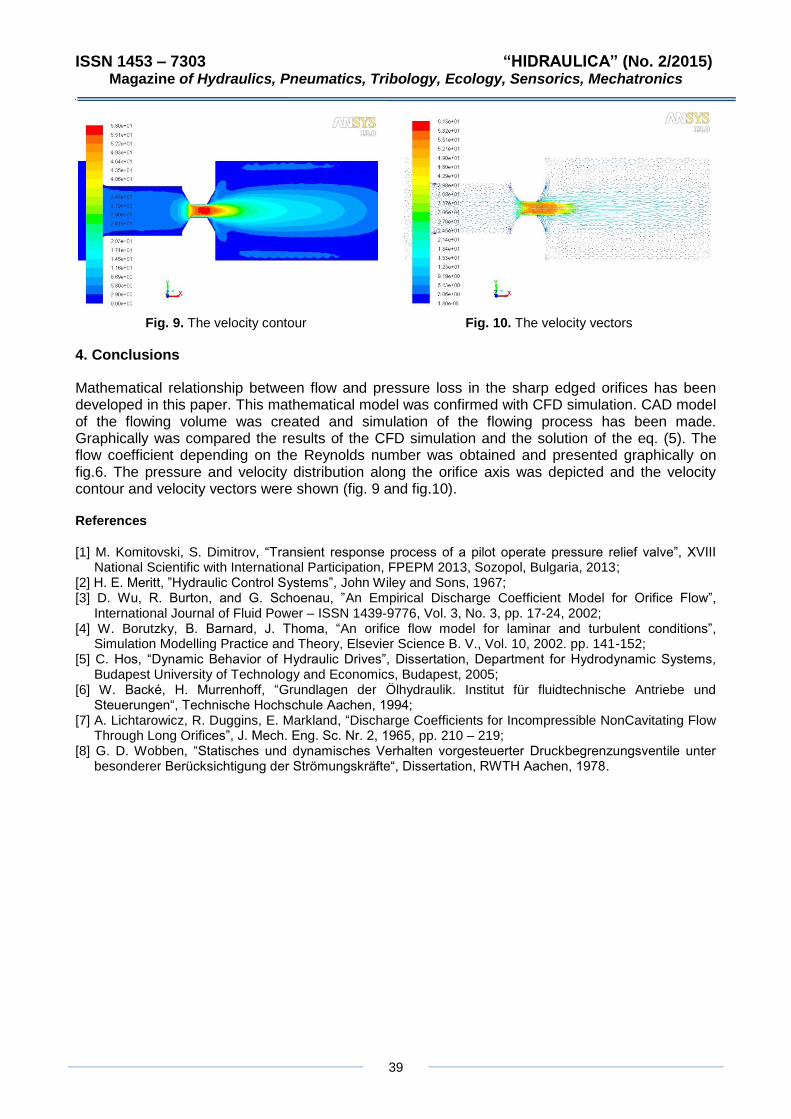
ISSN 1453 – 7303 “HIDRAULICA” (No. 2/2015) Magazine of Hydraulics, Pneumatics, Tribology, Ecology, Sensorics, Mechatronics
39
Fig. 9. The velocity contour Fig. 10. The velocity vectors
4. Conclusions
Mathematical relationship between flow and pressure loss in the sharp edged orifices has been developed in this paper. This mathematical model was confirmed with CFD simulation. CAD model of the flowing volume was created and simulation of the flowing process has been made. Graphically was compared the results of the CFD simulation and the solution of the eq. (5). The flow coefficient depending on the Reynolds number was obtained and presented graphically on fig.6. The pressure and velocity distribution along the orifice axis was depicted and the velocity contour and velocity vectors were shown (fig. 9 and fig.10).
References
[1] M. Komitovski, S. Dimitrov, “Transient response process of a pilot operate pressure relief valve”, XVIII National Scientific with International Participation, FPEPM 2013, Sozopol, Bulgaria, 2013;
[2] H. E. Meritt, ”Hydraulic Control Systems”, John Wiley and Sons, 1967; [3] D. Wu, R. Burton, and G. Schoenau, ”An Empirical Discharge Coefficient Model for Orifice Flow”,
International Journal of Fluid Power – ISSN 1439-9776, Vol. 3, No. 3, pp. 17-24, 2002; [4] W. Borutzky, B. Barnard, J. Thoma, “An orifice flow model for laminar and turbulent conditions”,
Simulation Modelling Practice and Theory, Elsevier Science B. V., Vol. 10, 2002. pp. 141-152; [5] C. Hos, “Dynamic Behavior of Hydraulic Drives”, Dissertation, Department for Hydrodynamic Systems,
Budapest University of Technology and Economics, Budapest, 2005; [6] W. Backé, H. Murrenhoff, “Grundlagen der Ölhydraulik. Institut für fluidtechnische Antriebe und
Steuerungen“, Technische Hochschule Aachen, 1994; [7] A. Lichtarowicz, R. Duggins, E. Markland, “Discharge Coefficients for Incompressible NonCavitating Flow
Through Long Orifices”, J. Mech. Eng. Sc. Nr. 2, 1965, pp. 210 – 219; [8] G. D. Wobben, “Statisches und dynamisches Verhalten vorgesteuerter Druckbegrenzungsventile unter
besonderer Berücksichtigung der Strömungskräfte“, Dissertation, RWTH Aachen, 1978.
ISSN 1453 – 7303 “HIDRAULICA” (No. 2/2015) Magazine of Hydraulics, Pneumatics, Tribology, Ecology, Sensorics, Mechatronics
40
Experimental Determinations on Improving Dynamic and Energy Performance of Pneumatic Systems
PhD. eng. Gabriela MATACHE, PhD. eng. Radu RADOI, PhD. eng. Gheorghe SOVAIALA, Tech. Ioan PAVEL
1INOE 2000-IHP, Bucharest, [email protected]
Abstract: This paper presents the results of tests conducted on a pneumatic system using medium and high pressure actuators. These tests aimed to:
- detect the behaviour in dynamic regime of the drive system with medium pressure pneumatic actuators, pneumatic spring type load, achieved by installing throttles on the piston and rod chambers of the pneumatic drive actuator, respectively controlled using the pressure regulator valve, for step, ramp and sine wave signal (plotting the BODE diagrams: attenuation vs. frequency and phase vs. frequency);
- identify the methods and ways for optimization of dynamic and energy performance of drive systems with medium pressure pneumatic linear actuators.
Keywords: pneumatic positioning system, BODE plots
1. Introduction
The pneumatic system with medium and high pressure actuators undergoes two types of tests: Static tests, targeting: - determining the minimum starting pressure for the piston of the pneumatic actuator driving the system, for both directions of travel (rod chamber and piston chamber); - determining the pushing / traction forces of the pneumatic drive actuator; - speed test at predetermined pressure, with pneumatic spring type load; - speed test at predetermined pressure, with load created by proportional pressure regulator valve; Dynamic tests, targeting: - the response of pneumatic drive system with double acting actuator to step signal, for different values of the PID controller and pneumatic spring type load; - the response of pneumatic drive system with double acting actuator to step signal, for different values of the PID controller and load controlled by proportional pressure regulator valve; - the response of pneumatic drive system with double acting actuator to sine wave signal, for preset values of the PID controller parameters and load controlled by proportional pressure regulator valve; plotting the BODE diagrams (attenuation vs. frequency and phase vs. frequency) [1],[3] The testing software is developed in LabVIEW. On the input of the USB-6218 data acquisition board there are inserted voltage-type signals from the pressure transducers (corresponding to the two chambers of the drive actuator), force transducer, displacement transducer, proportional pressure regulator valve. One of the two analog signal outputs of the data acquisition board is used for control of the proportional pressure regulator, and the other one for control of the proportional directional control valve in the testing diagram. The testing device allows for tests on the drive systems with simple pneumatic actuators, namely medium and high pressure servo actuators, both in static and dynamic regime. Supplying the electromagnets of the proportional equipment and also the sensors, the data acquisition board is made from a two-channel voltage source.
2 . Description of the system under tests
The system is made up of a mechanical assembly of two linear actuators, a drive actuator and a load one, and it is equipped with pressure transducers on the chambers of the drive actuator, force transducer between the rods of the two transducers and reflex position sensor to track position of the drive actuator rod.
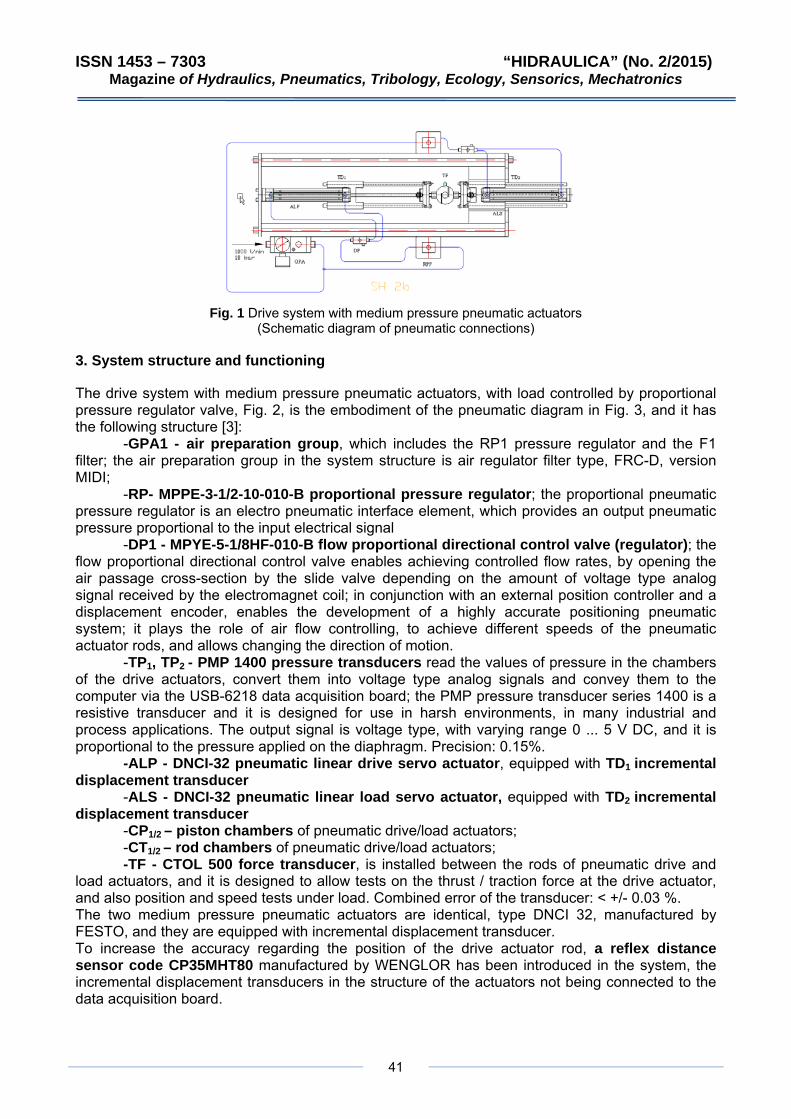
ISSN 1453 – 7303 “HIDRAULICA” (No. 2/2015) Magazine of Hydraulics, Pneumatics, Tribology, Ecology, Sensorics, Mechatronics
41
Fig. 1 Drive system with medium pressure pneumatic actuators
(Schematic diagram of pneumatic connections)
3. System structure and functioning
The drive system with medium pressure pneumatic actuators, with load controlled by proportional pressure regulator valve, Fig. 2, is the embodiment of the pneumatic diagram in Fig. 3, and it has the following structure [3]:
-GPA1 - air preparation group, which includes the RP1 pressure regulator and the F1 filter; the air preparation group in the system structure is air regulator filter type, FRC-D, version MIDI;
-RP- MPPE-3-1/2-10-010-B proportional pressure regulator; the proportional pneumatic pressure regulator is an electro pneumatic interface element, which provides an output pneumatic pressure proportional to the input electrical signal
-DP1 - MPYE-5-1/8HF-010-B flow proportional directional control valve (regulator); the flow proportional directional control valve enables achieving controlled flow rates, by opening the air passage cross-section by the slide valve depending on the amount of voltage type analog signal received by the electromagnet coil; in conjunction with an external position controller and a displacement encoder, enables the development of a highly accurate positioning pneumatic system; it plays the role of air flow controlling, to achieve different speeds of the pneumatic actuator rods, and allows changing the direction of motion.
-TP1, TP2 - PMP 1400 pressure transducers read the values of pressure in the chambers of the drive actuators, convert them into voltage type analog signals and convey them to the computer via the USB-6218 data acquisition board; the PMP pressure transducer series 1400 is a resistive transducer and it is designed for use in harsh environments, in many industrial and process applications. The output signal is voltage type, with varying range 0 ... 5 V DC, and it is proportional to the pressure applied on the diaphragm. Precision: 0.15%.
-ALP - DNCI-32 pneumatic linear drive servo actuator, equipped with TD1 incremental displacement transducer
-ALS - DNCI-32 pneumatic linear load servo actuator, equipped with TD2 incremental displacement transducer
-CP1/2 – piston chambers of pneumatic drive/load actuators; -CT1/2 – rod chambers of pneumatic drive/load actuators; -TF - CTOL 500 force transducer, is installed between the rods of pneumatic drive and
load actuators, and it is designed to allow tests on the thrust / traction force at the drive actuator, and also position and speed tests under load. Combined error of the transducer: < +/- 0.03 %. The two medium pressure pneumatic actuators are identical, type DNCI 32, manufactured by FESTO, and they are equipped with incremental displacement transducer. To increase the accuracy regarding the position of the drive actuator rod, a reflex distance sensor code CP35MHT80 manufactured by WENGLOR has been introduced in the system, the incremental displacement transducers in the structure of the actuators not being connected to the data acquisition board.
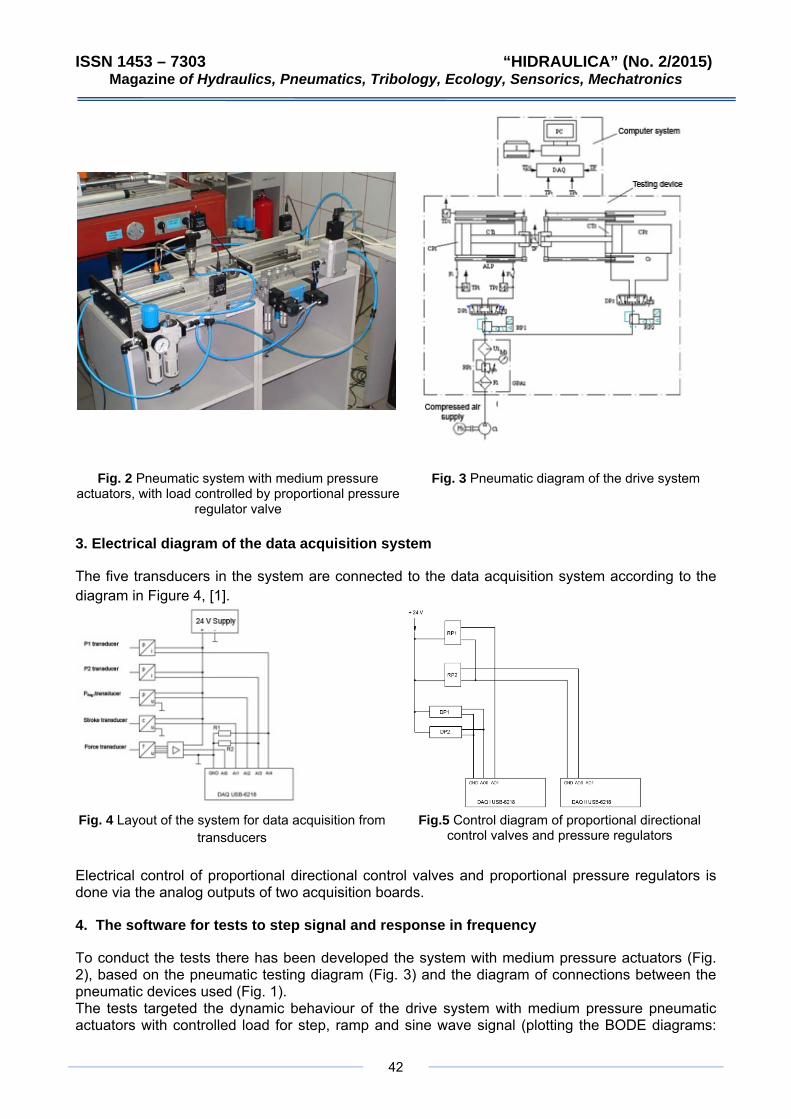
ISSN 1453 – 7303 “HIDRAULICA” (No. 2/2015) Magazine of Hydraulics, Pneumatics, Tribology, Ecology, Sensorics, Mechatronics
42
Fig. 2 Pneumatic system with medium pressure actuators, with load controlled by proportional pressure
regulator valve
Fig. 3 Pneumatic diagram of the drive system
3. Electrical diagram of the data acquisition system
The five transducers in the system are connected to the data acquisition system according to the diagram in Figure 4, [1].
Fig. 4 Layout of the system for data acquisition from
transducers Fig.5 Control diagram of proportional directional
control valves and pressure regulators Electrical control of proportional directional control valves and proportional pressure regulators is done via the analog outputs of two acquisition boards.
4. The software for tests to step signal and response in frequency
To conduct the tests there has been developed the system with medium pressure actuators (Fig. 2), based on the pneumatic testing diagram (Fig. 3) and the diagram of connections between the pneumatic devices used (Fig. 1). The tests targeted the dynamic behaviour of the drive system with medium pressure pneumatic actuators with controlled load for step, ramp and sine wave signal (plotting the BODE diagrams:
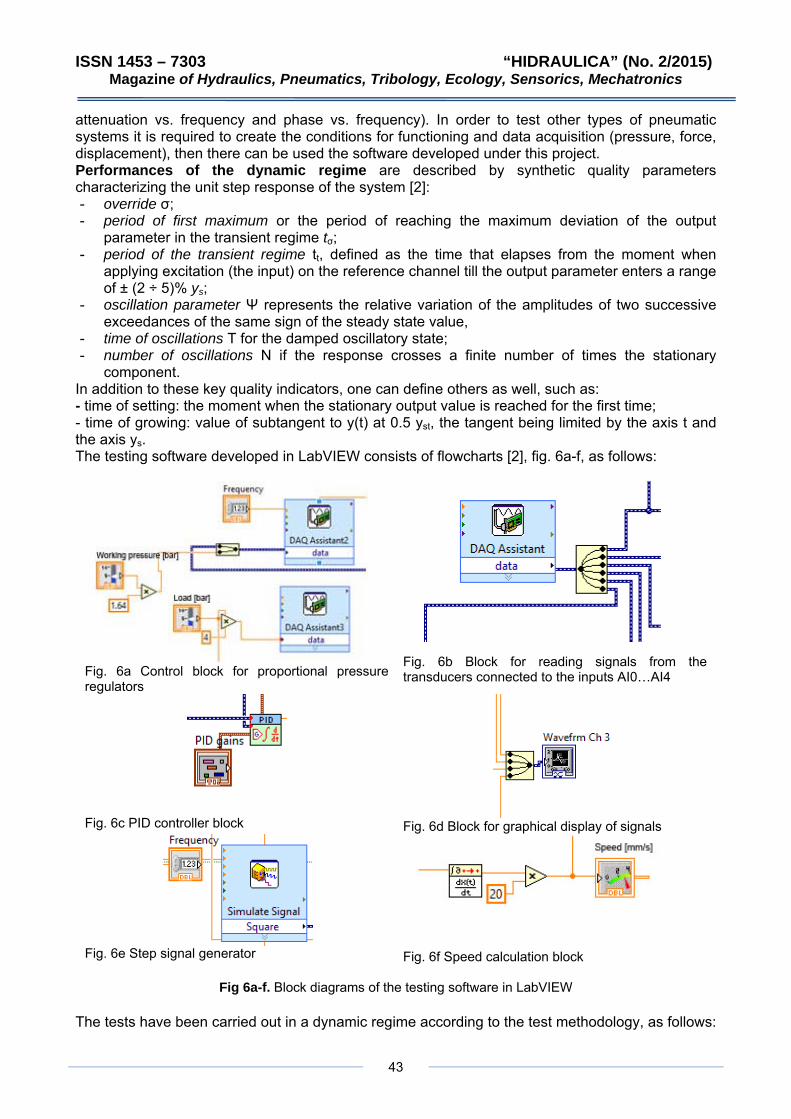
ISSN 1453 – 7303 “HIDRAULICA” (No. 2/2015) Magazine of Hydraulics, Pneumatics, Tribology, Ecology, Sensorics, Mechatronics
43
attenuation vs. frequency and phase vs. frequency). In order to test other types of pneumatic systems it is required to create the conditions for functioning and data acquisition (pressure, force, displacement), then there can be used the software developed under this project. Performances of the dynamic regime are described by synthetic quality parameters characterizing the unit step response of the system [2]: - override σ; - period of first maximum or the period of reaching the maximum deviation of the output
parameter in the transient regime tσ; - period of the transient regime tt, defined as the time that elapses from the moment when
applying excitation (the input) on the reference channel till the output parameter enters a range of ± (2 ÷ 5)% ys;
- oscillation parameter Ψ represents the relative variation of the amplitudes of two successive exceedances of the same sign of the steady state value,
- time of oscillations T for the damped oscillatory state; - number of oscillations N if the response crosses a finite number of times the stationary
component. In addition to these key quality indicators, one can define others as well, such as: - time of setting: the moment when the stationary output value is reached for the first time; - time of growing: value of subtangent to y(t) at 0.5 yst, the tangent being limited by the axis t and the axis ys. The testing software developed in LabVIEW consists of flowcharts [2], fig. 6a-f, as follows:
Fig. 6a Control block for proportional pressure regulators
Fig. 6b Block for reading signals from the transducers connected to the inputs AI0…AI4
Fig. 6c PID controller block
Fig. 6d Block for graphical display of signals
Fig. 6e Step signal generator
Fig. 6f Speed calculation block
Fig 6a-f. Block diagrams of the testing software in LabVIEW
The tests have been carried out in a dynamic regime according to the test methodology, as follows:

ISSN 1453 – 7303 “HIDRAULICA” (No. 2/2015) Magazine of Hydraulics, Pneumatics, Tribology, Ecology, Sensorics, Mechatronics
44
The response of the system to step signal in dynamic regime, with preset load *the variable parameter ps- the pressure generating the load of the drive actuator The input parameters of the system for which testing has been carried out were: the load generating pressure ps=0.5 bar; the parameters of the automatic control system: kc=0.500; Ti[min]=0.500; Td[min]=0.000.
Window displaying prescribed position [mm], achieved position [mm], force [daN], speed [mm/s]
Window displaying amplitude [mm]=f(t) [s]
Window displaying the pneumatic parameters of the drive actuator:
pressure in piston chamber p1 [bar], pressure in rod chamber p2 [bar],
working pressure pl [bar], load generating pressure ps [bar]
Screen capture highlighting the step signal parameters: prescribed position [mm], achieved position [mm],
amplitude [mm], pneumatic parameters of the drive actuator: working pressure pl [bar], load generating pressure ps [bar], parameters of the PID automatic controller: kc, Ti, Td
The response of the system to ramp signal in dynamic regime, with preset load *the variable parameter f-signal frequency, Hz The tests have been carried out for load generating pressure ps=0.5 bar; working pressure of the drive actuator pl=6 bar; parameters of the automatic control system: kc=0.400; Ti[min]=0.400; Td[min]=0.000; f-variable signal frequency, f=0.05-0.5 Hz, with increments of 0.25 Hz.
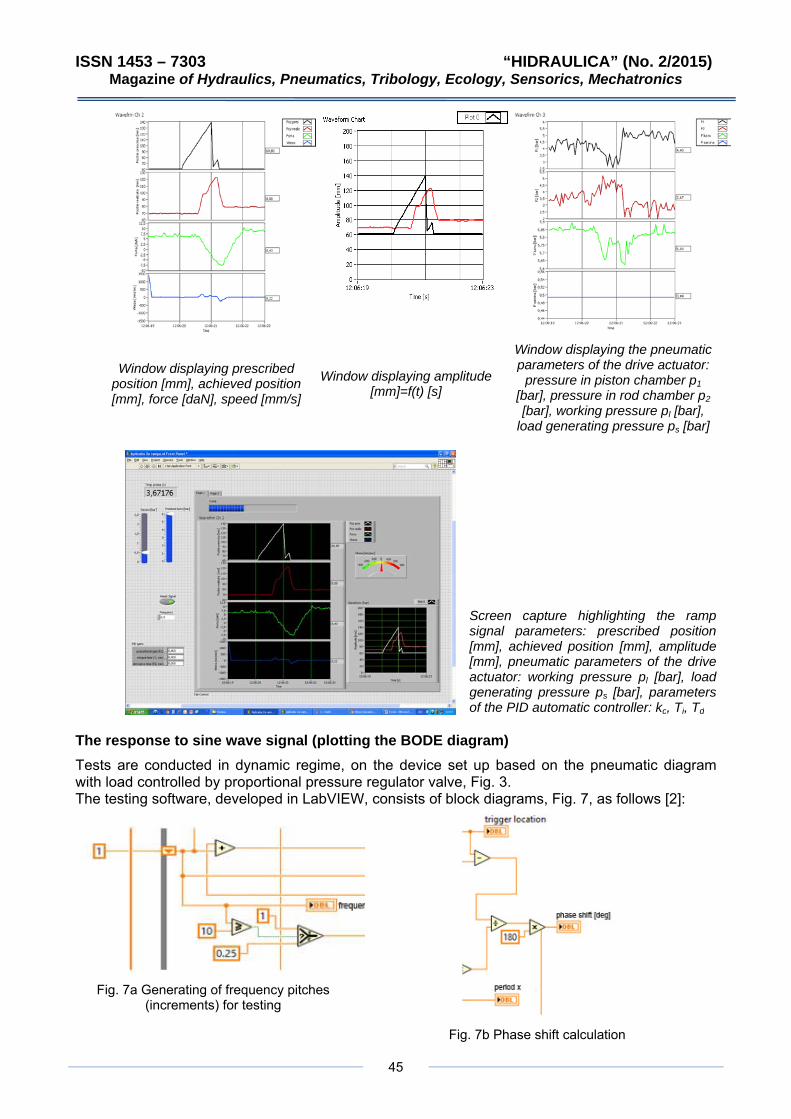
ISSN 1453 – 7303 “HIDRAULICA” (No. 2/2015)
45
Magazine of Hydraulics, Pneumatics, Tribology, Ecology, Sensorics, Mechatronics
Window displaying prescribed position [mm], achieved position [mm], force [daN], speed [mm/s]
Window displaying amplitude [mm]=f(t) [s]
Window displaying the pneumatic parameters of the drive actuator:
pressure in piston chamber p1 [bar], pressure in rod chamber p2 [bar], working pressure pl [bar],
load generating pressure ps [bar]
Screen capture highlighting the ramp signal parameters: prescribed position [mm], achieved position [mm], amplitude [mm], pneumatic parameters of the drive actuator: working pressure pl [bar], load generating pressure ps [bar], parameters of the PID automatic controller: kc, Ti, Td
The response to sine wave signal (plotting the BODE diagram) Tests are conducted in dynamic regime, on the device set up based on the pneumatic diagram with load controlled by proportional pressure regulator valve, Fig. 3. The testing software, developed in LabVIEW, consists of block diagrams, Fig. 7, as follows [2]:
Fig. 7a Generating of frequency pitches (increments) for testing
Fig. 7b Phase shift calculation
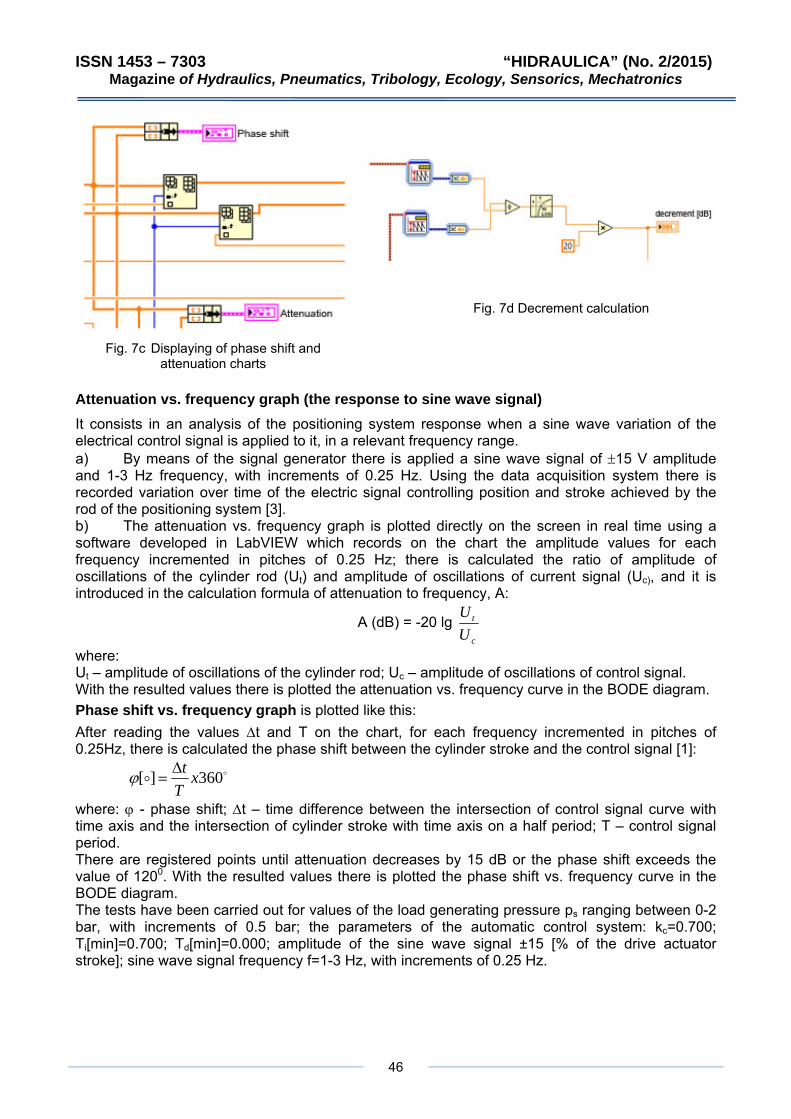
ISSN 1453 – 7303 “HIDRAULICA” (No. 2/2015) of Hydraulics, Pneumatics, Tribology, Ecology, Sensorics, Mechatronics
46
Magazine
Fig. 7c Displaying of phase shift and
attenuation charts
Fig. 7d Decrement calculation
Attenuation vs. frequency graph (the response to sine wave signal) It consists in an analysis of the positioning system response when a sine wave variation of the electrical control signal is applied to it, in a relevant frequency range. a) By means of the signal generator there is applied a sine wave signal of ±15 V amplitude and 1-3 Hz frequency, with increments of 0.25 Hz. Using the data acquisition system there is recorded variation over time of the electric signal controlling position and stroke achieved by the rod of the positioning system [3]. b) The attenuation vs. frequency graph is plotted directly on the screen in real time using a software developed in LabVIEW which records on the chart the amplitude values for each frequency incremented in pitches of 0.25 Hz; there is calculated the ratio of amplitude of oscillations of the cylinder rod (Ut) and amplitude of oscillations of current signal (Uc), and it is introduced in the calculation formula of attenuation to frequency, A:
A (dB) = -20 lg c
t
UU
where: Ut – amplitude of oscillations of the cylinder rod; Uc – amplitude of oscillations of control signal. With the resulted values there is plotted the attenuation vs. frequency curve in the BODE diagram. Phase shift vs. frequency graph is plotted like this: After reading the values Δt and T on the chart, for each frequency incremented in pitches of 0.25Hz, there is calculated the phase shift between the cylinder stroke and the control signal [1]:
oo 360][ xTtΔ
=ϕ
where: ϕ - phase shift; Δt – time difference between the intersection of control signal curve with time axis and the intersection of cylinder stroke with time axis on a half period; T – control signal period. There are registered points until attenuation decreases by 15 dB or the phase shift exceeds the value of 1200. With the resulted values there is plotted the phase shift vs. frequency curve in the BODE diagram. The tests have been carried out for values of the load generating pressure ps ranging between 0-2 bar, with increments of 0.5 bar; the parameters of the automatic control system: kc=0.700; Ti[min]=0.700; Td[min]=0.000; amplitude of the sine wave signal ±15 [% of the drive actuator stroke]; sine wave signal frequency f=1-3 Hz, with increments of 0.25 Hz.
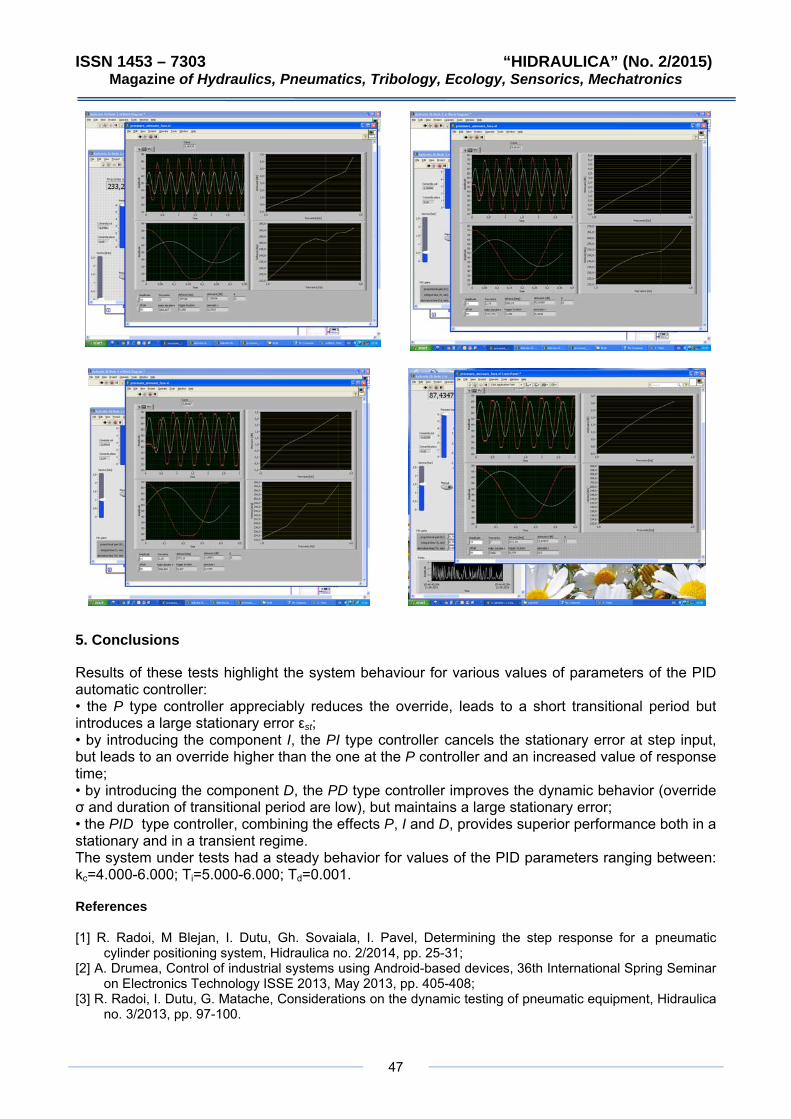
ISSN 1453 – 7303 “HIDRAULICA” (No. 2/2015) Magazine of Hydraulics, Pneumatics, Tribology, Ecology, Sensorics, Mechatronics
47
5. Conclusions
Results of these tests highlight the system behaviour for various values of parameters of the PID automatic controller: • the P type controller appreciably reduces the override, leads to a short transitional period but introduces a large stationary error εst; • by introducing the component I, the PI type controller cancels the stationary error at step input, but leads to an override higher than the one at the P controller and an increased value of response time; • by introducing the component D, the PD type controller improves the dynamic behavior (override σ and duration of transitional period are low), but maintains a large stationary error; • the PID type controller, combining the effects P, I and D, provides superior performance both in a stationary and in a transient regime. The system under tests had a steady behavior for values of the PID parameters ranging between: kc=4.000-6.000; Ti=5.000-6.000; Td=0.001.
References
[1] R. Radoi, M Blejan, I. Dutu, Gh. Sovaiala, I. Pavel, Determining the step response for a pneumatic cylinder positioning system, Hidraulica no. 2/2014, pp. 25-31;
[2] A. Drumea, Control of industrial systems using Android-based devices, 36th International Spring Seminar on Electronics Technology ISSE 2013, May 2013, pp. 405-408;
[3] R. Radoi, I. Dutu, G. Matache, Considerations on the dynamic testing of pneumatic equipment, Hidraulica no. 3/2013, pp. 97-100.
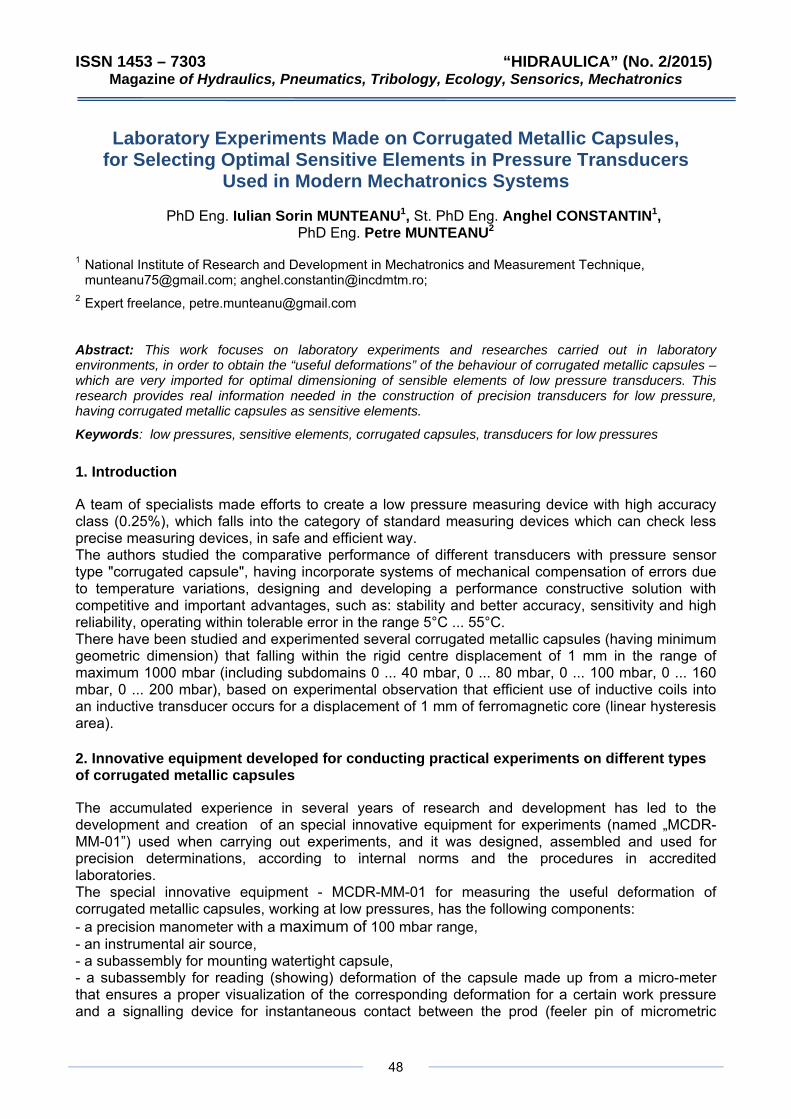
ISSN 1453 – 7303 “HIDRAULICA” (No. 2/2015) Magazine of Hydraulics, Pneumatics, Tribology, Ecology, Sensorics, Mechatronics
48
Laboratory Experiments Made on Corrugated Metallic Capsules, for Selecting Optimal Sensitive Elements in Pressure Transducers
Used in Modern Mechatronics Systems
PhD Eng. Iulian Sorin MUNTEANU1, St. PhD Eng. Anghel CONSTANTIN1, PhD Eng. Petre MUNTEANU2
1 National Institute of Research and Development in Mechatronics and Measurement Technique, [email protected]; [email protected];
2 Expert freelance, [email protected]
Abstract: This work focuses on laboratory experiments and researches carried out in laboratory environments, in order to obtain the “useful deformations” of the behaviour of corrugated metallic capsules – which are very imported for optimal dimensioning of sensible elements of low pressure transducers. This research provides real information needed in the construction of precision transducers for low pressure, having corrugated metallic capsules as sensitive elements.
Keywords: low pressures, sensitive elements, corrugated capsules, transducers for low pressures
1. Introduction
A team of specialists made efforts to create a low pressure measuring device with high accuracy class (0.25%), which falls into the category of standard measuring devices which can check less precise measuring devices, in safe and efficient way. The authors studied the comparative performance of different transducers with pressure sensor type "corrugated capsule", having incorporate systems of mechanical compensation of errors due to temperature variations, designing and developing a performance constructive solution with competitive and important advantages, such as: stability and better accuracy, sensitivity and high reliability, operating within tolerable error in the range 5°C ... 55°C. There have been studied and experimented several corrugated metallic capsules (having minimum geometric dimension) that falling within the rigid centre displacement of 1 mm in the range of maximum 1000 mbar (including subdomains 0 ... 40 mbar, 0 ... 80 mbar, 0 ... 100 mbar, 0 ... 160 mbar, 0 ... 200 mbar), based on experimental observation that efficient use of inductive coils into an inductive transducer occurs for a displacement of 1 mm of ferromagnetic core (linear hysteresis area).
2. Innovative equipment developed for conducting practical experiments on different types of corrugated metallic capsules
The accumulated experience in several years of research and development has led to the development and creation of an special innovative equipment for experiments (named „MCDR-MM-01”) used when carrying out experiments, and it was designed, assembled and used for precision determinations, according to internal norms and the procedures in accredited laboratories. The special innovative equipment - MCDR-MM-01 for measuring the useful deformation of corrugated metallic capsules, working at low pressures, has the following components: - a precision manometer with a maximum of 100 mbar range, - an instrumental air source, - a subassembly for mounting watertight capsule, - a subassembly for reading (showing) deformation of the capsule made up from a micro-meter that ensures a proper visualization of the corresponding deformation for a certain work pressure and a signalling device for instantaneous contact between the prod (feeler pin of micrometric
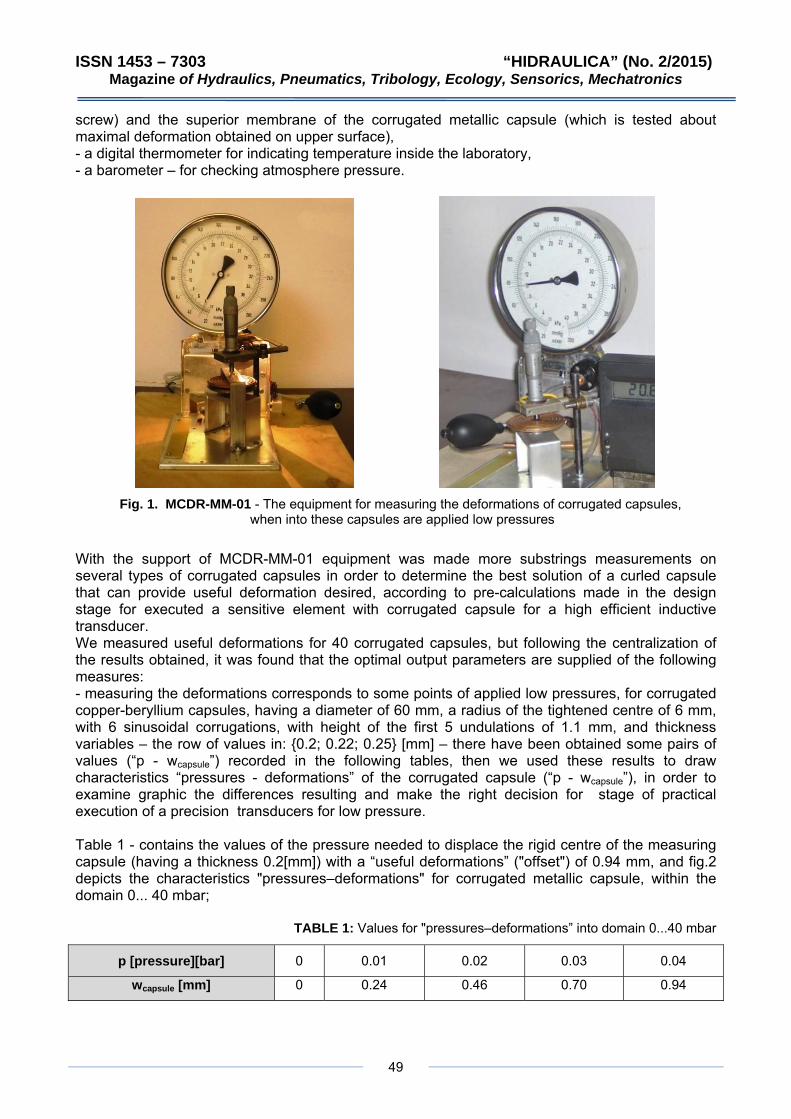
ISSN 1453 – 7303 “HIDRAULICA” (No. 2/2015) Magazine of Hydraulics, Pneumatics, Tribology, Ecology, Sensorics, Mechatronics
49
screw) and the superior membrane of the corrugated metallic capsule (which is tested about maximal deformation obtained on upper surface), - a digital thermometer for indicating temperature inside the laboratory, - a barometer – for checking atmosphere pressure.
Fig. 1. MCDR-MM-01 - The equipment for measuring the deformations of corrugated capsules,
when into these capsules are applied low pressures With the support of MCDR-MM-01 equipment was made more substrings measurements on several types of corrugated capsules in order to determine the best solution of a curled capsule that can provide useful deformation desired, according to pre-calculations made in the design stage for executed a sensitive element with corrugated capsule for a high efficient inductive transducer. We measured useful deformations for 40 corrugated capsules, but following the centralization of the results obtained, it was found that the optimal output parameters are supplied of the following measures: - measuring the deformations corresponds to some points of applied low pressures, for corrugated copper-beryllium capsules, having a diameter of 60 mm, a radius of the tightened centre of 6 mm, with 6 sinusoidal corrugations, with height of the first 5 undulations of 1.1 mm, and thickness variables – the row of values in: {0.2; 0.22; 0.25} [mm] – there have been obtained some pairs of values (“p - wcapsule”) recorded in the following tables, then we used these results to draw characteristics “pressures - deformations” of the corrugated capsule (“p - wcapsule”), in order to examine graphic the differences resulting and make the right decision for stage of practical execution of a precision transducers for low pressure. Table 1 - contains the values of the pressure needed to displace the rigid centre of the measuring capsule (having a thickness 0.2[mm]) with a “useful deformations” ("offset") of 0.94 mm, and fig.2 depicts the characteristics "pressures–deformations" for corrugated metallic capsule, within the domain 0... 40 mbar;
TABLE 1: Values for "pressures–deformations” into domain 0...40 mbar
p [pressure][bar] 0 0.01 0.02 0.03 0.04
wcapsule [mm] 0 0.24 0.46 0.70 0.94
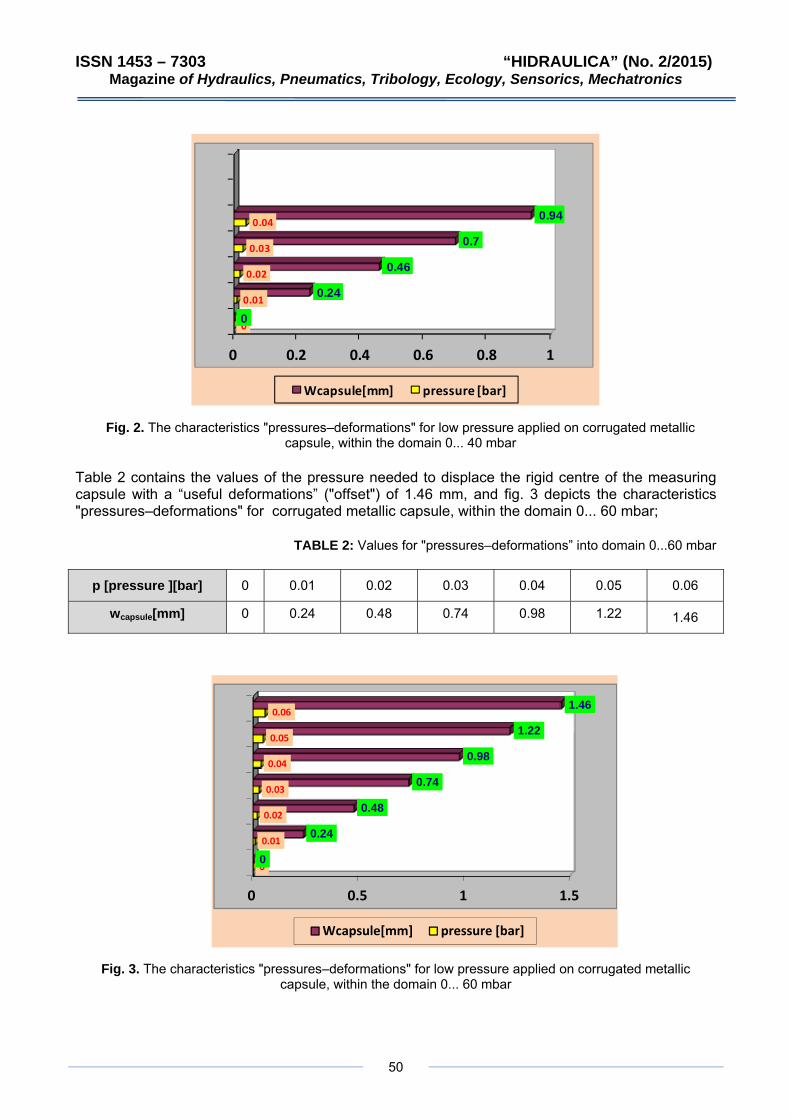
ISSN 1453 – 7303 “HIDRAULICA” (No. 2/2015) Magazine of Hydraulics, Pneumatics, Tribology, Ecology, Sensorics, Mechatronics
50
0 0.2 0.4 0.6 0.8 1
0
0.01
0.02
0.03
0.04
0
0.24
0.46
0.7
0.94
Wcapsule[mm] pressure [bar]
Fig. 2. The characteristics "pressures–deformations" for low pressure applied on corrugated metallic capsule, within the domain 0... 40 mbar
Table 2 contains the values of the pressure needed to displace the rigid centre of the measuring capsule with a “useful deformations” ("offset") of 1.46 mm, and fig. 3 depicts the characteristics "pressures–deformations" for corrugated metallic capsule, within the domain 0... 60 mbar;
TABLE 2: Values for "pressures–deformations” into domain 0...60 mbar
0 0.5 1 1.5
0
0.01
0.02
0.03
0.04
0.05
0.06
0
0.24
0.48
0.74
0.98
1.22
1.46
Wcapsule[mm] pressure [bar]
Fig. 3. The characteristics "pressures–deformations" for low pressure applied on corrugated metallic capsule, within the domain 0... 60 mbar
p [pressure ][bar] 0 0.01 0.02 0.03 0.04 0.05 0.06
wcapsule[mm] 0 0.24 0.48 0.74 0.98 1.22 1.46
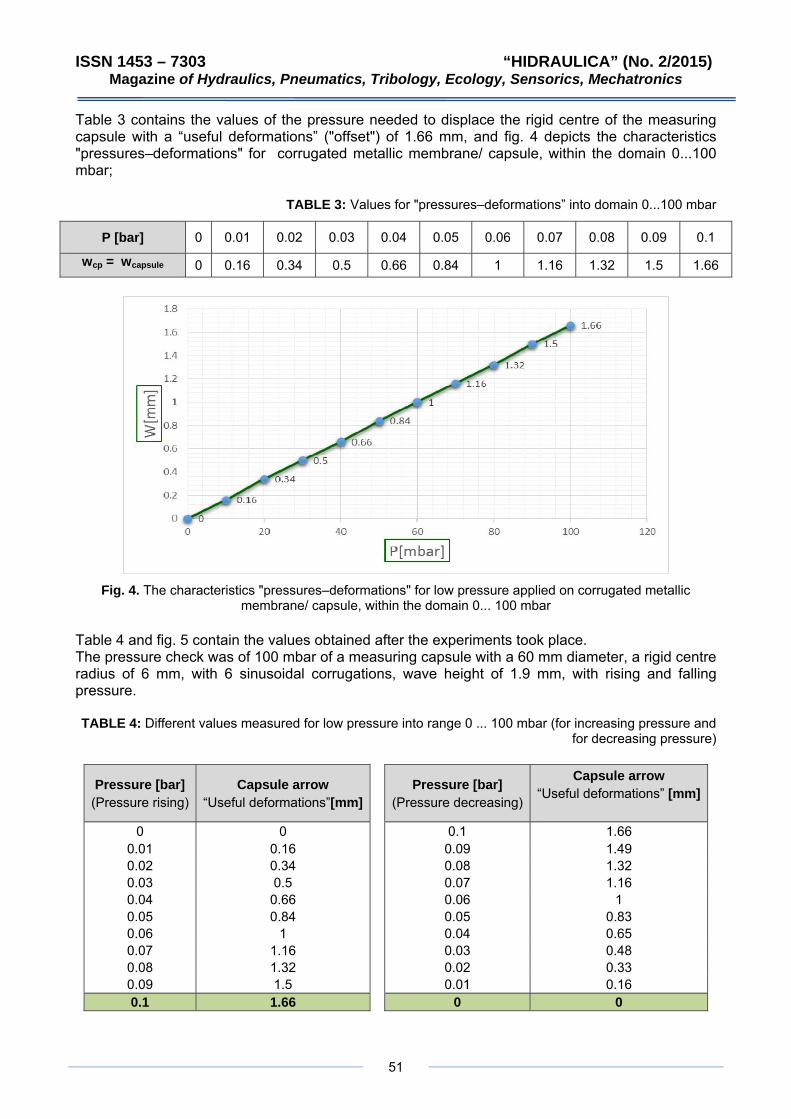
ISSN 1453 – 7303 “HIDRAULICA” (No. 2/2015) Magazine of Hydraulics, Pneumatics, Tribology, Ecology, Sensorics, Mechatronics
51
Table 3 contains the values of the pressure needed to displace the rigid centre of the measuring capsule with a “useful deformations” ("offset") of 1.66 mm, and fig. 4 depicts the characteristics "pressures–deformations" for corrugated metallic membrane/ capsule, within the domain 0...100 mbar;
TABLE 3: Values for "pressures–deformations” into domain 0...100 mbar
Fig. 4. The characteristics "pressures–deformations" for low pressure applied on corrugated metallic
membrane/ capsule, within the domain 0... 100 mbar Table 4 and fig. 5 contain the values obtained after the experiments took place. The pressure check was of 100 mbar of a measuring capsule with a 60 mm diameter, a rigid centre radius of 6 mm, with 6 sinusoidal corrugations, wave height of 1.9 mm, with rising and falling pressure. TABLE 4: Different values measured for low pressure into range 0 ... 100 mbar (for increasing pressure and
for decreasing pressure)
Pressure [bar] (Pressure rising)
Capsule arrow “Useful deformations”[mm]
Pressure [bar] (Pressure decreasing)
Capsule arrow “Useful deformations” [mm]
0 0 0.1 1.66
0.01 0.16 0.09 1.49 0.02 0.34 0.08 1.32 0.03 0.5 0.07 1.16 0.04 0.66 0.06 1 0.05 0.84 0.05 0.83 0.06 1 0.04 0.65 0.07 1.16 0.03 0.48 0.08 1.32 0.02 0.33 0.09 1.5 0.01 0.16 0.1 1.66 0 0
P [bar] 0 0.01 0.02 0.03 0.04 0.05 0.06 0.07 0.08 0.09 0.1
wcp = wcapsule 0 0.16 0.34 0.5 0.66 0.84 1 1.16 1.32 1.5 1.66
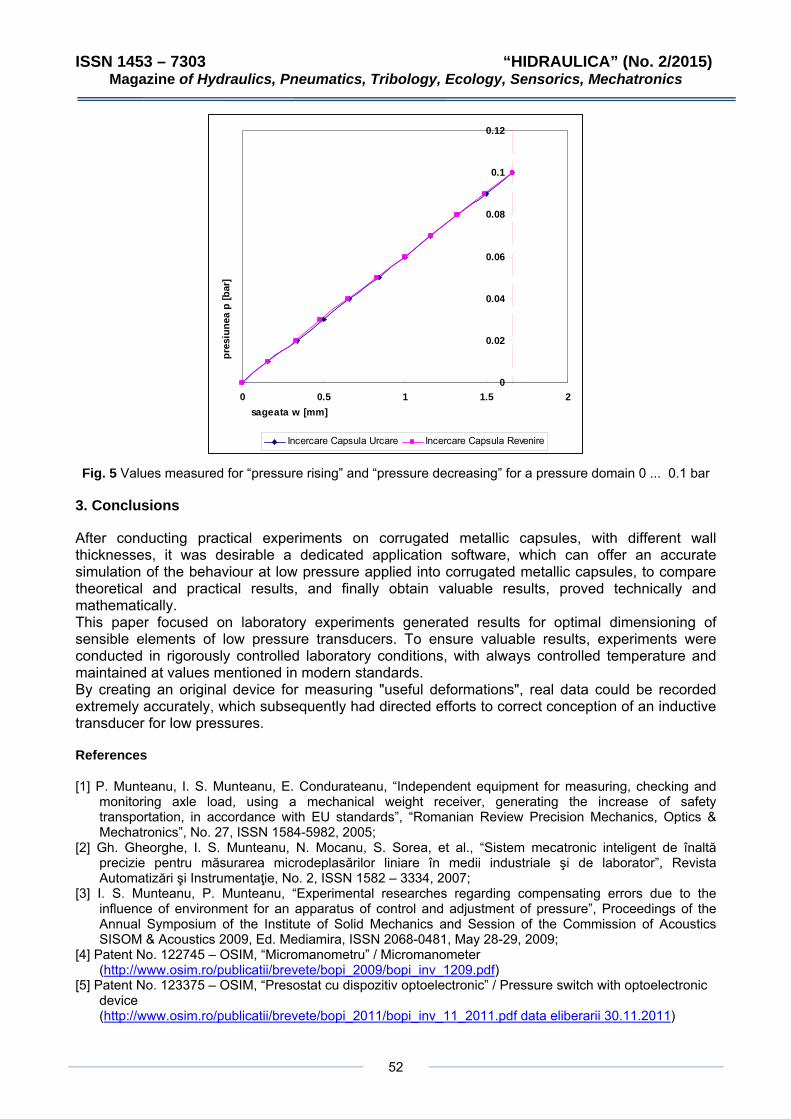
ISSN 1453 – 7303 “HIDRAULICA” (No. 2/2015) Magazine Mechatronics
52
of Hydraulics, Pneumatics, Tribology, Ecology, Sensorics,
0
0.02
0.04
0.06
0.08
0.1
0.12
0 0.5 1 1.5 2sageata w [mm]
pres
iune
a p
[bar
]
Incercare Capsula Urcare Incercare Capsula Revenire
Fig. 5 Values measured for “pressure rising” and “pressure decreasing” for a pressure domain 0 ... 0.1 bar
3. Conclusions
After conducting practical experiments on corrugated metallic capsules, with different wall thicknesses, it was desirable a dedicated application software, which can offer an accurate simulation of the behaviour at low pressure applied into corrugated metallic capsules, to compare theoretical and practical results, and finally obtain valuable results, proved technically and mathematically. This paper focused on laboratory experiments generated results for optimal dimensioning of sensible elements of low pressure transducers. To ensure valuable results, experiments were conducted in rigorously controlled laboratory conditions, with always controlled temperature and maintained at values mentioned in modern standards. By creating an original device for measuring "useful deformations", real data could be recorded extremely accurately, which subsequently had directed efforts to correct conception of an inductive transducer for low pressures.
References
[1] P. Munteanu, I. S. Munteanu, E. Condurateanu, “Independent equipment for measuring, checking and monitoring axle load, using a mechanical weight receiver, generating the increase of safety transportation, in accordance with EU standards”, “Romanian Review Precision Mechanics, Optics & Mechatronics”, No. 27, ISSN 1584-5982, 2005;
[2] Gh. Gheorghe, I. S. Munteanu, N. Mocanu, S. Sorea, et al., “Sistem mecatronic inteligent de înaltă precizie pentru măsurarea microdeplasărilor liniare în medii industriale şi de laborator”, Revista Automatizări şi Instrumentaţie, No. 2, ISSN 1582 – 3334, 2007;
[3] I. S. Munteanu, P. Munteanu, “Experimental researches regarding compensating errors due to the influence of environment for an apparatus of control and adjustment of pressure”, Proceedings of the Annual Symposium of the Institute of Solid Mechanics and Session of the Commission of Acoustics SISOM & Acoustics 2009, Ed. Mediamira, ISSN 2068-0481, May 28-29, 2009;
[4] Patent No. 122745 – OSIM, “Micromanometru” / Micromanometer (http://www.osim.ro/publicatii/brevete/bopi_2009/bopi_inv_1209.pdf)
[5] Patent No. 123375 – OSIM, “Presostat cu dispozitiv optoelectronic” / Pressure switch with optoelectronic device (http://www.osim.ro/publicatii/brevete/bopi_2011/bopi_inv_11_2011.pdf data eliberarii 30.11.2011)
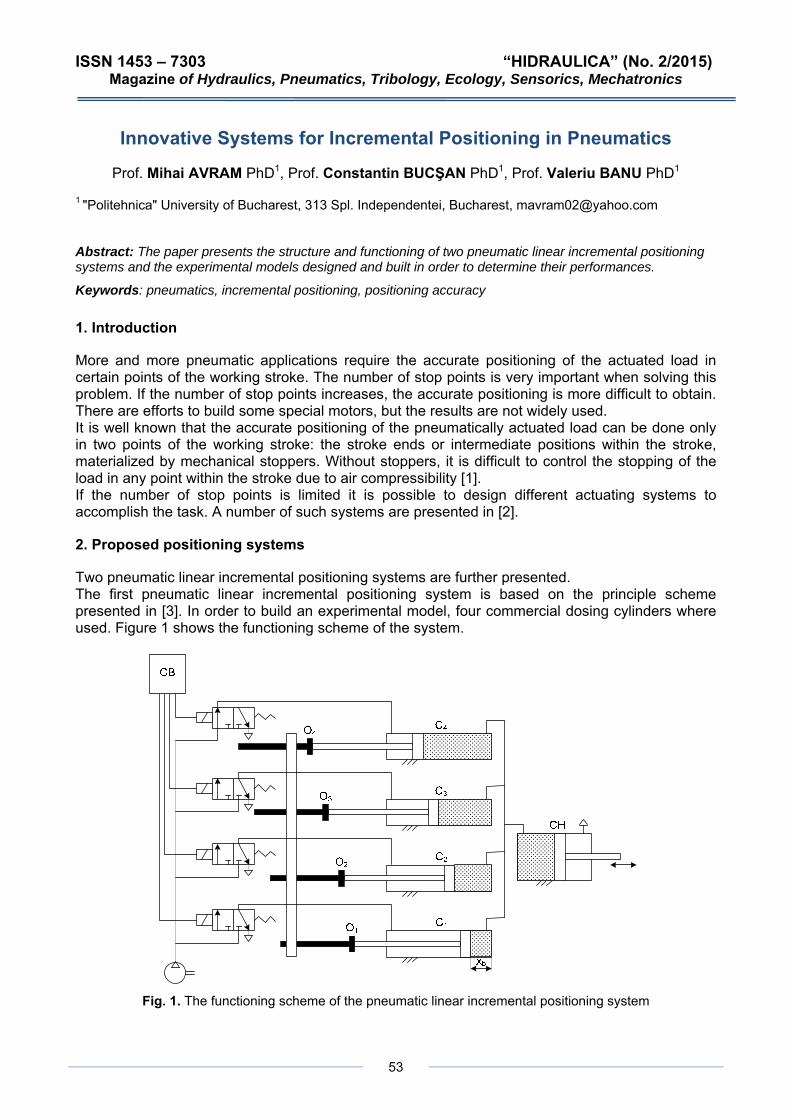
ISSN 1453 – 7303 “HIDRAULICA” (No. 2/2015) Magazine of Hydraulics, Pneumatics, Tribology, Ecology, Sensorics, Mechatronics
Innovative Systems for Incremental Positioning in Pneumatics
Prof. Mihai AVRAM PhD1, Prof. Constantin BUCŞAN PhD1, Prof. Valeriu BANU PhD1 1 "Politehnica" University of Bucharest, 313 Spl. Independentei, Bucharest, [email protected]
Abstract: The paper presents the structure and functioning of two pneumatic linear incremental positioning systems and the experimental models designed and built in order to determine their performances.
Keywords: pneumatics, incremental positioning, positioning accuracy
1. Introduction
More and more pneumatic applications require the accurate positioning of the actuated load in certain points of the working stroke. The number of stop points is very important when solving this problem. If the number of stop points increases, the accurate positioning is more difficult to obtain. There are efforts to build some special motors, but the results are not widely used. It is well known that the accurate positioning of the pneumatically actuated load can be done only in two points of the working stroke: the stroke ends or intermediate positions within the stroke, materialized by mechanical stoppers. Without stoppers, it is difficult to control the stopping of the load in any point within the stroke due to air compressibility [1]. If the number of stop points is limited it is possible to design different actuating systems to accomplish the task. A number of such systems are presented in [2].
2. Proposed positioning systems
Two pneumatic linear incremental positioning systems are further presented. The first pneumatic linear incremental positioning system is based on the principle scheme presented in [3]. In order to build an experimental model, four commercial dosing cylinders where used. Figure 1 shows the functioning scheme of the system.
Fig. 1. The functioning scheme of the pneumatic linear incremental positioning system
53
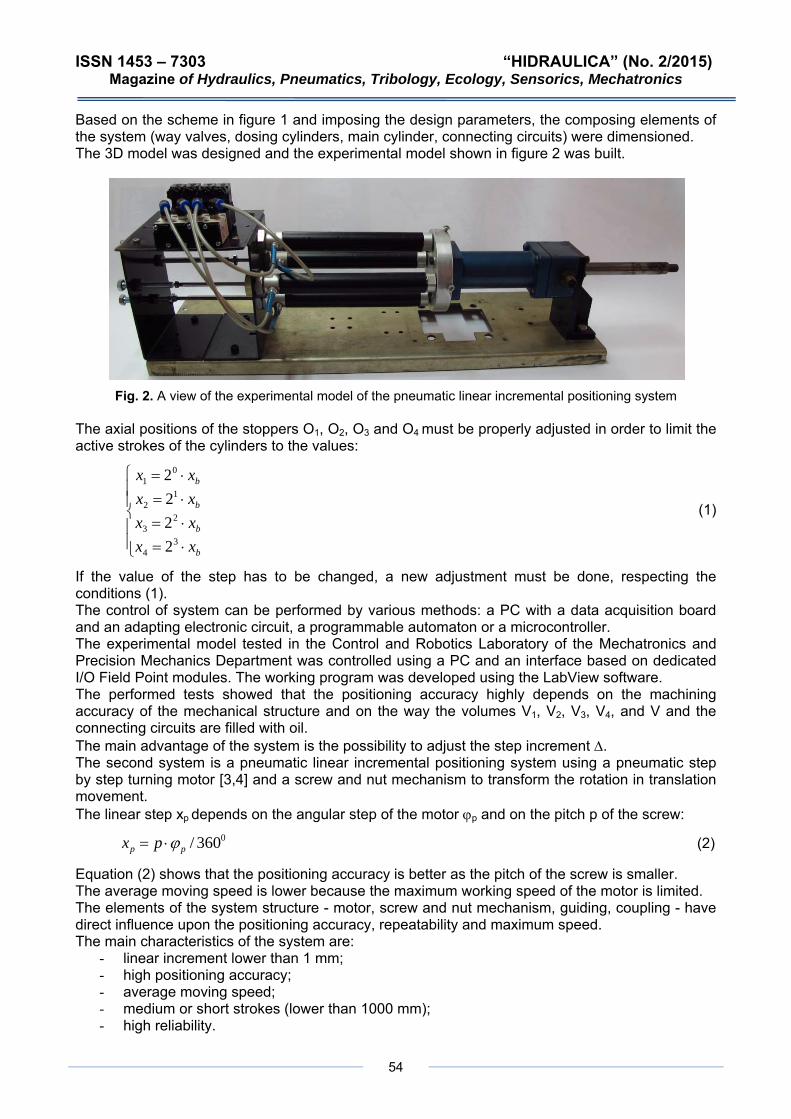
ISSN 1453 – 7303 “HIDRAULICA” (No. 2/2015) Magazine of Hydraulics, Pneumatics, Tribology, Ecology, Sensorics, Mechatronics
54
Based on the scheme in figure 1 and imposing the design parameters, the composing elements of the system (way valves, dosing cylinders, main cylinder, connecting circuits) were dimensioned. The 3D model was designed and the experimental model shown in figure 2 was built.
Fig. 2. A view of the experimental model of the pneumatic linear incremental positioning system
The axial positions of the stoppers O1, O2, O3 and O4 must be properly adjusted in order to limit the active strokes of the cylinders to the values:
(1)
⎪⎩ ⋅= bxx 34 2
⎪
⎪⎪⎨
⎧
⋅=⋅=⋅=
b
b
b
xxxxxx
23
12
01
222
If the value of the step has to be changed, a new adjustment must be done, respecting the conditions (1). The control of system can be performed by various methods: a PC with a data acquisition board and an adapting electronic circuit, a programmable automaton or a microcontroller. The experimental model tested in the Control and Robotics Laboratory of the Mechatronics and Precision Mechanics Department was controlled using a PC and an interface based on dedicated I/O Field Point modules. The working program was developed using the LabView software. The performed tests showed that the positioning accuracy highly depends on the machining accuracy of the mechanical structure and on the way the volumes V1, V2, V3, V4, and V and the connecting circuits are filled with oil. The main advantage of the system is the possibility to adjust the step increment Δ. The second system is a pneumatic linear incremental positioning system using a pneumatic step by step turning motor [3,4] and a screw and nut mechanism to transform the rotation in translation movement. The linear step xp depends on the angular step of the motor ϕp and on the pitch p of the screw:
(2) 0360/pp px ϕ⋅=
Equation (2) shows that the positioning accuracy is better as the pitch of the screw is smaller. The average moving speed is lower because the maximum working speed of the motor is limited. The elements of the system structure - motor, screw and nut mechanism, guiding, coupling - have direct influence upon the positioning accuracy, repeatability and maximum speed. The main characteristics of the system are:
- linear increment lower than 1 mm; - high positioning accuracy; - average moving speed; - medium or short strokes (lower than 1000 mm); - high reliability.
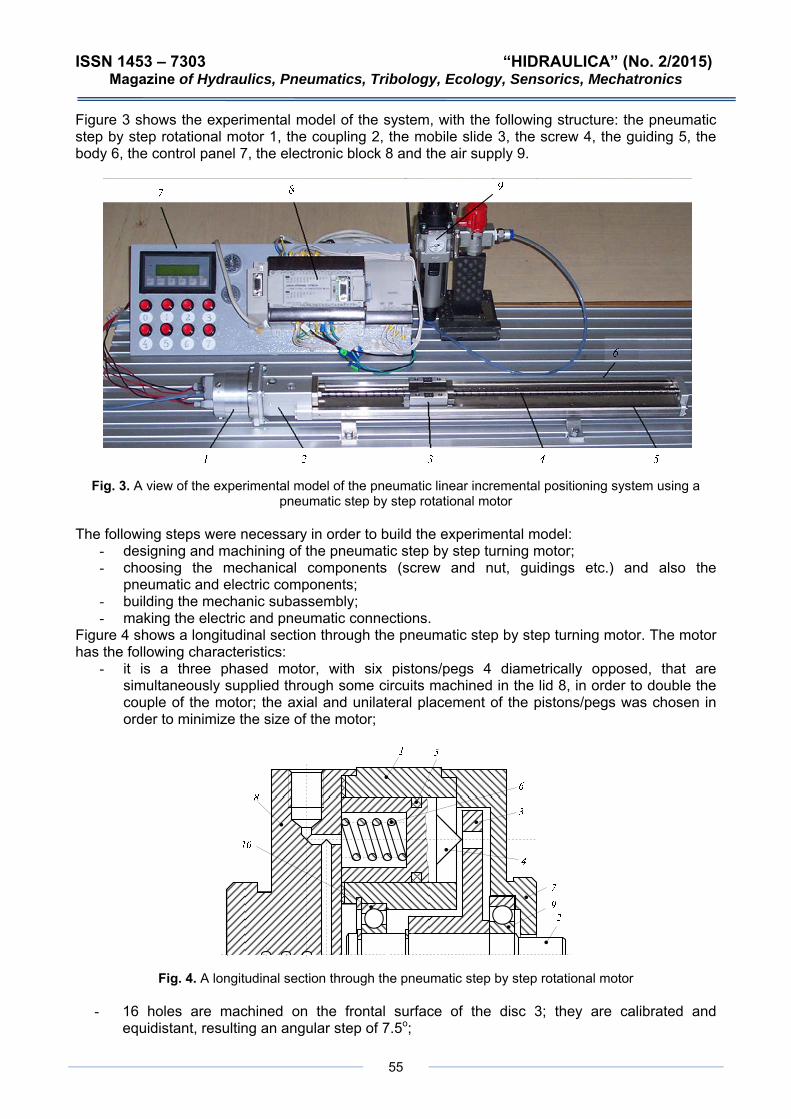
ISSN 1453 – 7303 “HIDRAULICA” (No. 2/2015) Magazine of Hydraulics, Pneumatics, Tribology, Ecology, Sensorics, Mechatronics
55
Figure 3 shows the experimental model of the system, with the following structure: the pneumatic step by step rotational motor 1, the coupling 2, the mobile slide 3, the screw 4, the guiding 5, the body 6, the control panel 7, the electronic block 8 and the air supply 9.
Fig. 3. A view of the experimental model of the pneumatic linear incremental positioning system using a
pneumatic step by step rotational motor
The following steps were necessary in order to build the experimental model: - designing and machining of the pneumatic step by step turning motor; - choosing the mechanical components (screw and nut, guidings etc.) and also the
pneumatic and electric components; - building the mechanic subassembly; - making the electric and pneumatic connections.
Figure 4 shows a longitudinal section through the pneumatic step by step turning motor. The motor has the following characteristics:
- it is a three phased motor, with six pistons/pegs 4 diametrically opposed, that are simultaneously supplied through some circuits machined in the lid 8, in order to double the couple of the motor; the axial and unilateral placement of the pistons/pegs was chosen in order to minimize the size of the motor;
Fig. 4. A longitudinal section through the pneumatic step by step rotational motor
- 16 holes are machined on the frontal surface of the disc 3; they are calibrated and
equidistant, resulting an angular step of 7.5o;

ISSN 1453 – 7303 “HIDRAULICA” (No. 2/2015) Magazine of Hydraulics, Pneumatics, Tribology, Ecology, Sensorics, Mechatronics
56
- the rotor, consisting of the disc 3 and the shaft 2, can rotate against the stator due to the ball bearings 9 and 10;
- the stator consists of the lids 7 and 8 and the intermediate body 1. The motor has a compact structure, with the three way valves mounted directly on the distribution plate; this way the working frequency was increased by reducing the length of the signal lines and the dead volumes. The screw and nut mechanism is of the type LTF6 produced by SMC. A programmable controller type CPM2A-30 produced by OMRON was used to control the system.
References
[1] Anghel, S., Matache, G., Popescu, A-M., Girleanu, I-C., Applications of proportional pneumatic equipment in industry, Hidraulica, no. 2/2013, pp. 90-95; [2] Avram, M., Acţionări hidraulice şi pneumatice, Echipamente şi sisteme clasice şi mecatronice, University Publishing House, Bucharest, 2005; [3] Avram, M., Bucşan, C., Sisteme de acţionare pneumatice inteligente, Politehnica PRESS Publishing House, Bucharest, 2014; [4] Demian, T., Banu, G. V., Micromotoare Pneumatice liniare şi Rotative, Technical Publishing House, Bucharest, 1984.
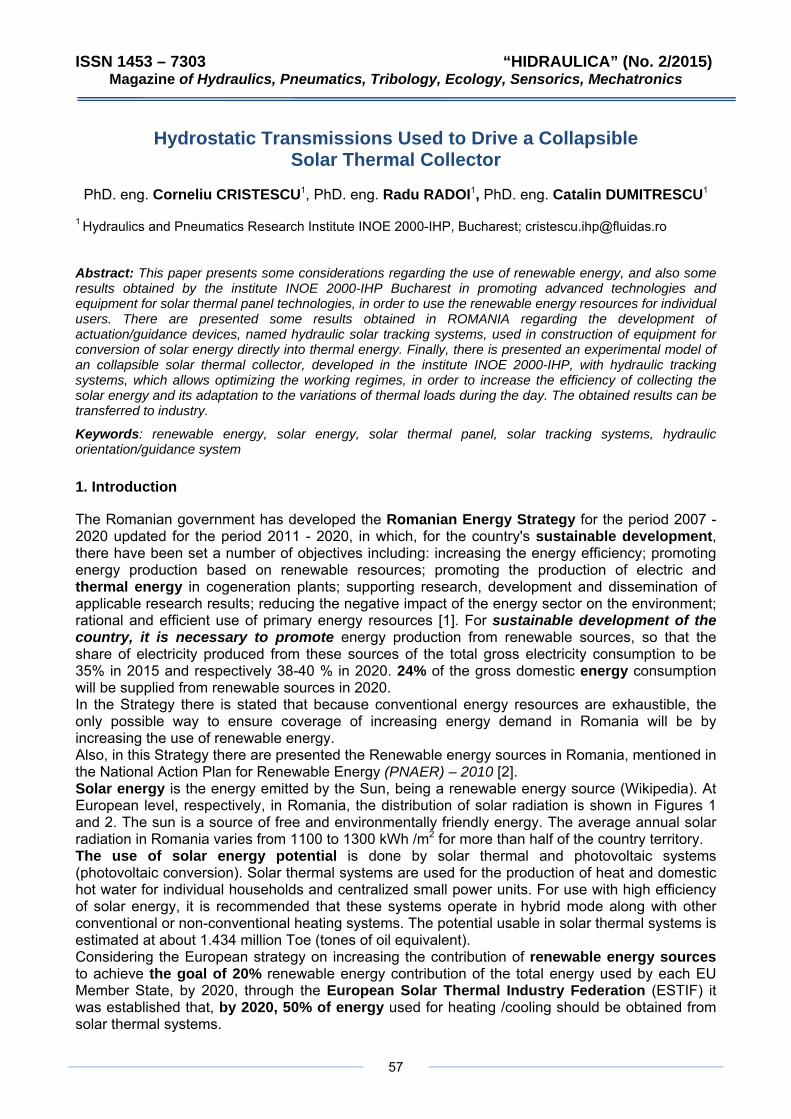
ISSN 1453 – 7303 “HIDRAULICA” (No. 2/2015) Magazine of Hydraulics, Pneumatics, Tribology, Ecology, Sensorics, Mechatronics
57
Hydrostatic Transmissions Used to Drive a Collapsible Solar Thermal Collector
PhD. eng. Corneliu CRISTESCU1, PhD. eng. Radu RADOI1, PhD. eng. Catalin DUMITRESCU1 1 Hydraulics and Pneumatics Research Institute INOE 2000-IHP, Bucharest; [email protected]
Abstract: This paper presents some considerations regarding the use of renewable energy, and also some results obtained by the institute INOE 2000-IHP Bucharest in promoting advanced technologies and equipment for solar thermal panel technologies, in order to use the renewable energy resources for individual users. There are presented some results obtained in ROMANIA regarding the development of actuation/guidance devices, named hydraulic solar tracking systems, used in construction of equipment for conversion of solar energy directly into thermal energy. Finally, there is presented an experimental model of an collapsible solar thermal collector, developed in the institute INOE 2000-IHP, with hydraulic tracking systems, which allows optimizing the working regimes, in order to increase the efficiency of collecting the solar energy and its adaptation to the variations of thermal loads during the day. The obtained results can be transferred to industry.
Keywords: renewable energy, solar energy, solar thermal panel, solar tracking systems, hydraulic orientation/guidance system
1. Introduction
The Romanian government has developed the Romanian Energy Strategy for the period 2007 - 2020 updated for the period 2011 - 2020, in which, for the country's sustainable development, there have been set a number of objectives including: increasing the energy efficiency; promoting energy production based on renewable resources; promoting the production of electric and thermal energy in cogeneration plants; supporting research, development and dissemination of applicable research results; reducing the negative impact of the energy sector on the environment; rational and efficient use of primary energy resources [1]. For sustainable development of the country, it is necessary to promote energy production from renewable sources, so that the share of electricity produced from these sources of the total gross electricity consumption to be 35% in 2015 and respectively 38-40 % in 2020. 24% of the gross domestic energy consumption will be supplied from renewable sources in 2020. In the Strategy there is stated that because conventional energy resources are exhaustible, the only possible way to ensure coverage of increasing energy demand in Romania will be by increasing the use of renewable energy. Also, in this Strategy there are presented the Renewable energy sources in Romania, mentioned in the National Action Plan for Renewable Energy (PNAER) – 2010 [2]. Solar energy is the energy emitted by the Sun, being a renewable energy source (Wikipedia). At European level, respectively, in Romania, the distribution of solar radiation is shown in Figures 1 and 2. The sun is a source of free and environmentally friendly energy. The average annual solar radiation in Romania varies from 1100 to 1300 kWh /m2 for more than half of the country territory. The use of solar energy potential is done by solar thermal and photovoltaic systems (photovoltaic conversion). Solar thermal systems are used for the production of heat and domestic hot water for individual households and centralized small power units. For use with high efficiency of solar energy, it is recommended that these systems operate in hybrid mode along with other conventional or non-conventional heating systems. The potential usable in solar thermal systems is estimated at about 1.434 million Toe (tones of oil equivalent). Considering the European strategy on increasing the contribution of renewable energy sources to achieve the goal of 20% renewable energy contribution of the total energy used by each EU Member State, by 2020, through the European Solar Thermal Industry Federation (ESTIF) it was established that, by 2020, 50% of energy used for heating /cooling should be obtained from solar thermal systems.

ISSN 1453 – 7303 “HIDRAULICA” (No. 2/2015) Magazine of Hydraulics, Pneumatics, Tribology, Ecology, Sensorics, Mechatronics
58
Fig. 1. Solar map of Europe
Fig. 2. Solar map of Romania The use of renewable energy sources required continuous development of manufacturing and implementation technologies of renewable energy conversion systems in order to identify solutions characterized by high efficiency, low cost, reliability and adaptability to implementation conditions. The solar thermal energy is the cleanest source of energy and is practically inexhaustible. It can be captured using solar thermal panels that directly absorb the heat of the sun and deliver it to some hot water tanks, to provide domestic hot water or for contribution to heating a house or a pool. Therefore, in our institute there have been also conducted a number of projects at national level for the development of solar thermal energy collecting technologies, which bring great economic benefits to the users.
2. Conversion of solar energy into thermal energy
The sun is the source of life on Earth. Earth captures about 2.8·1021 kJ of total solar radiation emitted [3]. Direct radiation, received on the earth's surface, is influenced by the coverage of the sky with clouds. Another important factor influencing the intensity of solar radiation is the relative position. Majority of the energy from the sun, about 95%, has wavelengths between 0.3 and 2.6 mm, and only 1% has wavelengths greater than 4.0 mm. In solar thermal applications the spectrum of interest is the infrared one for direct heating and the visible spectrum for solar-thermal conversion. Among the types of solar energy conversion, photothermal conversion presents a particular interest in all branches of activity, as the heat generated can be used directly (stored in various fluid, gas or solid environments) or indirectly (electricity, thermo-chemical transformations etc.). Solar energy is converted by means of solar-thermal collectors (CST) into clean thermal energy used for heating space and domestic water. Harnessing solar energy is achieved by passive or active systems [4]. Any black surface exposed to beams, called absorbing surface, converts solar energy into heat. This absorbent surface presents the simplest example of direct converter of solar radiation into thermal energy, called flat plate solar collector. Thermal conversion of solar energy includes several technologies: water heating with flat plate or evacuated tube collectors. Usually, a solar heat collector looks as in Figure 3. The main components of a flat plate solar collector, presented in Figure 4, are: black case-5, with thermo-insulation of three walls-4, covered on the front with transparent surface-3. The heat exchanger is of type metal plate-pipe, namely absorbent surface-1 and pipes 2. The functioning of the solar collector is based on the two physical phenomena: the absorption by a black body of solar radiation incident on the absorbent surface and the greenhouse effect achieved on the transparent surface. In the case of a solar collector there is achieved an artificial greenhouse effect. A surface is transparent to sunlight and opaque for the infrared radiation. Temperature of the absorbent surface increases and heat is conveyed to the water flowing through the pipes 2.
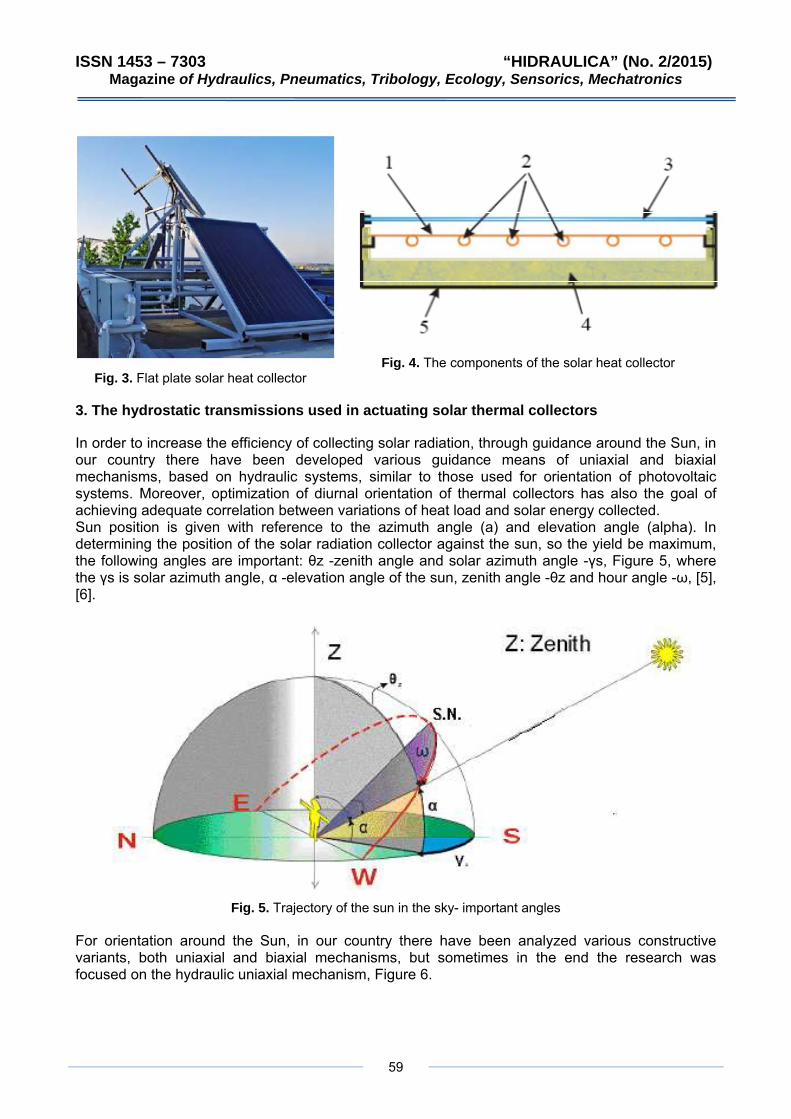
ISSN 1453 – 7303 “HIDRAULICA” (No. 2/2015) Magazine of Hydraulics, Pneumatics, Tribology, Ecology, Sensorics, Mechatronics
59
Fig. 3. Flat plate solar heat collector
Fig. 4. The components of the solar heat collector
3. The hydrostatic transmissions used in actuating solar thermal collectors
In order to increase the efficiency of collecting solar radiation, through guidance around the Sun, in our country there have been developed various guidance means of uniaxial and biaxial mechanisms, based on hydraulic systems, similar to those used for orientation of photovoltaic systems. Moreover, optimization of diurnal orientation of thermal collectors has also the goal of achieving adequate correlation between variations of heat load and solar energy collected. Sun position is given with reference to the azimuth angle (a) and elevation angle (alpha). In determining the position of the solar radiation collector against the sun, so the yield be maximum, the following angles are important: θz -zenith angle and solar azimuth angle -γs, Figure 5, where the γs is solar azimuth angle, α -elevation angle of the sun, zenith angle -θz and hour angle -ω, [5], [6].
Fig. 5. Trajectory of the sun in the sky- important angles
For orientation around the Sun, in our country there have been analyzed various constructive variants, both uniaxial and biaxial mechanisms, but sometimes in the end the research was focused on the hydraulic uniaxial mechanism, Figure 6.
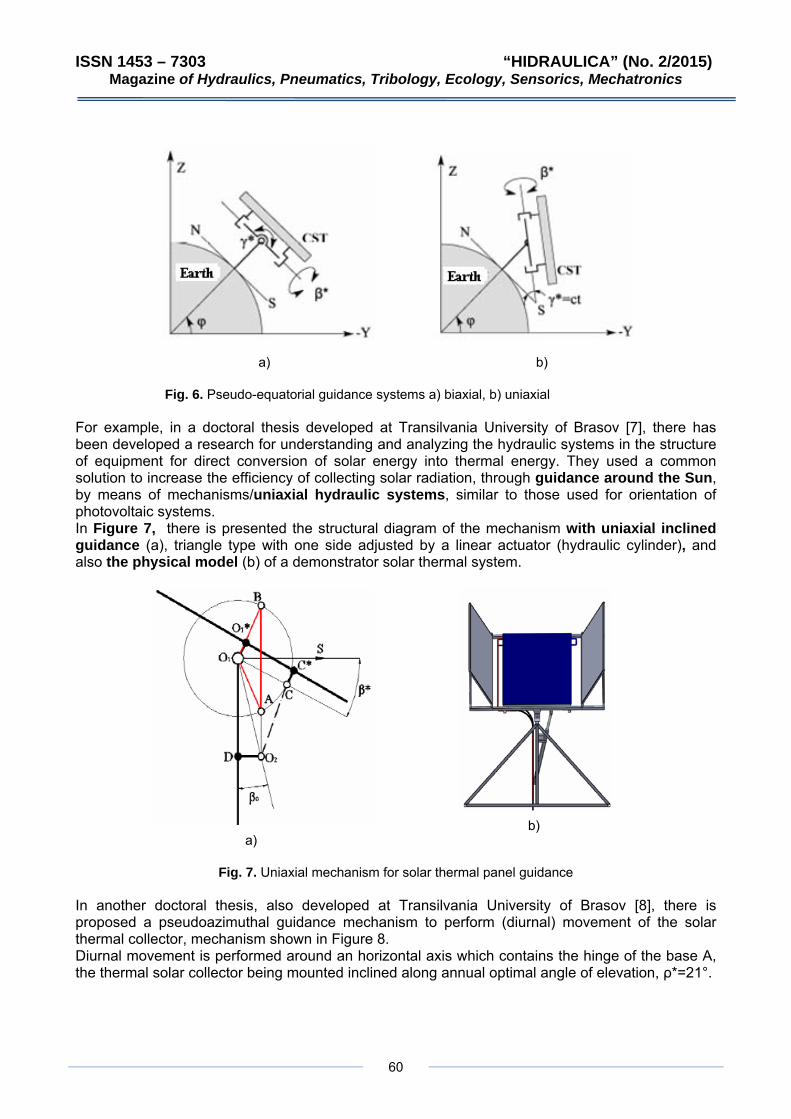
ISSN 1453 – 7303 “HIDRAULICA” (No. 2/2015) Magazine of Hydraulics, Pneumatics, Tribology, Ecology, Sensorics, Mechatronics
60
a)
b)
Fig. 6. Pseudo-equatorial guidance systems a) biaxial, b) uniaxial For example, in a doctoral thesis developed at Transilvania University of Brasov [7], there has been developed a research for understanding and analyzing the hydraulic systems in the structure of equipment for direct conversion of solar energy into thermal energy. They used a common solution to increase the efficiency of collecting solar radiation, through guidance around the Sun, by means of mechanisms/uniaxial hydraulic systems, similar to those used for orientation of photovoltaic systems. In Figure 7, there is presented the structural diagram of the mechanism with uniaxial inclined guidance (a), triangle type with one side adjusted by a linear actuator (hydraulic cylinder), and also the physical model (b) of a demonstrator solar thermal system.
a)
b)
Fig. 7. Uniaxial mechanism for solar thermal panel guidance
In another doctoral thesis, also developed at Transilvania University of Brasov [8], there is proposed a pseudoazimuthal guidance mechanism to perform (diurnal) movement of the solar thermal collector, mechanism shown in Figure 8. Diurnal movement is performed around an horizontal axis which contains the hinge of the base A, the thermal solar collector being mounted inclined along annual optimal angle of elevation, ρ*=21°.
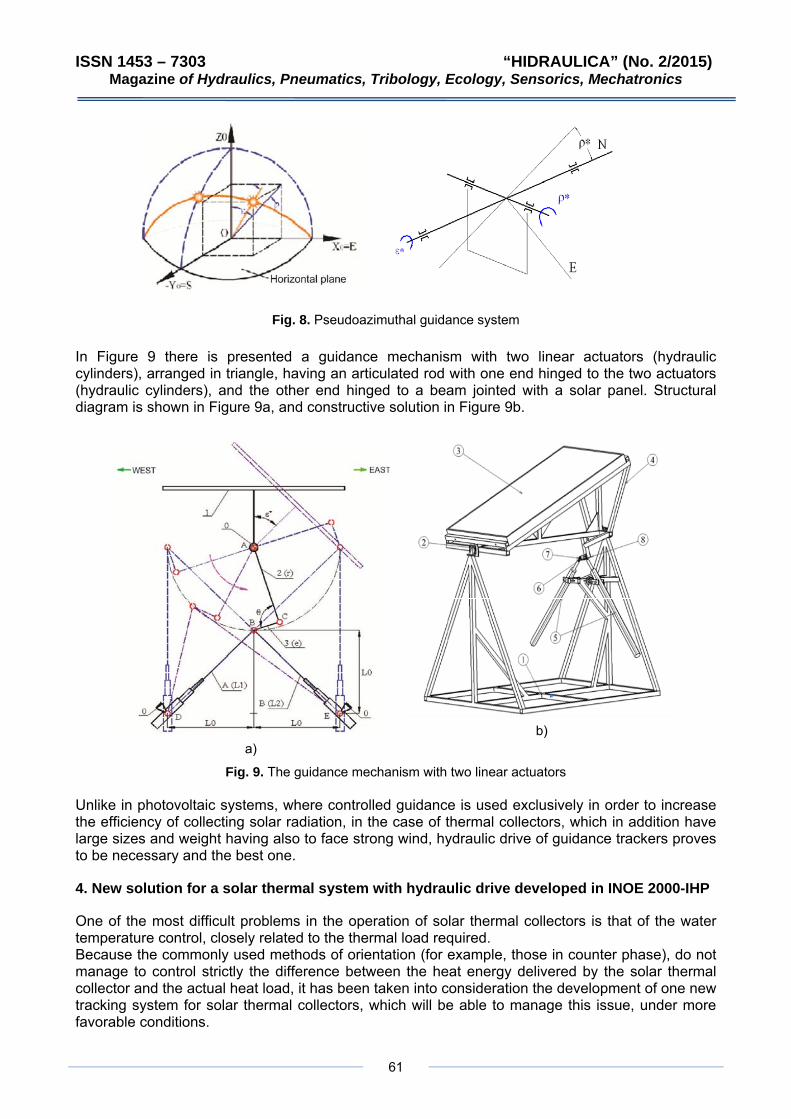
ISSN 1453 – 7303 “HIDRAULICA” (No. 2/2015) of Hydraulics, Pneumatics, Tribology, Ecology, Sensorics, echatronics
61
Magazine M
Fig. 8. Pseudoazimuthal guidance system In Figure 9 there is presented a guidance mechanism with two linear actuators (hydraulic cylinders), arranged in triangle, having an articulated rod with one end hinged to the two actuators (hydraulic cylinders), and the other end hinged to a beam jointed with a solar panel. Structural diagram is shown in Figure 9a, and constructive solution in Figure 9b.
a)
b)
Fig. 9. The guidance mechanism with two linear actuators Unlike in photovoltaic systems, where controlled guidance is used exclusively in order to increase the efficiency of collecting solar radiation, in the case of thermal collectors, which in addition have large sizes and weight having also to face strong wind, hydraulic drive of guidance trackers proves to be necessary and the best one.
4. New solution for a solar thermal system with hydraulic drive developed in INOE 2000-IHP
One of the most difficult problems in the operation of solar thermal collectors is that of the water temperature control, closely related to the thermal load required. Because the commonly used methods of orientation (for example, those in counter phase), do not manage to control strictly the difference between the heat energy delivered by the solar thermal collector and the actual heat load, it has been taken into consideration the development of one new tracking system for solar thermal collectors, which will be able to manage this issue, under more favorable conditions.
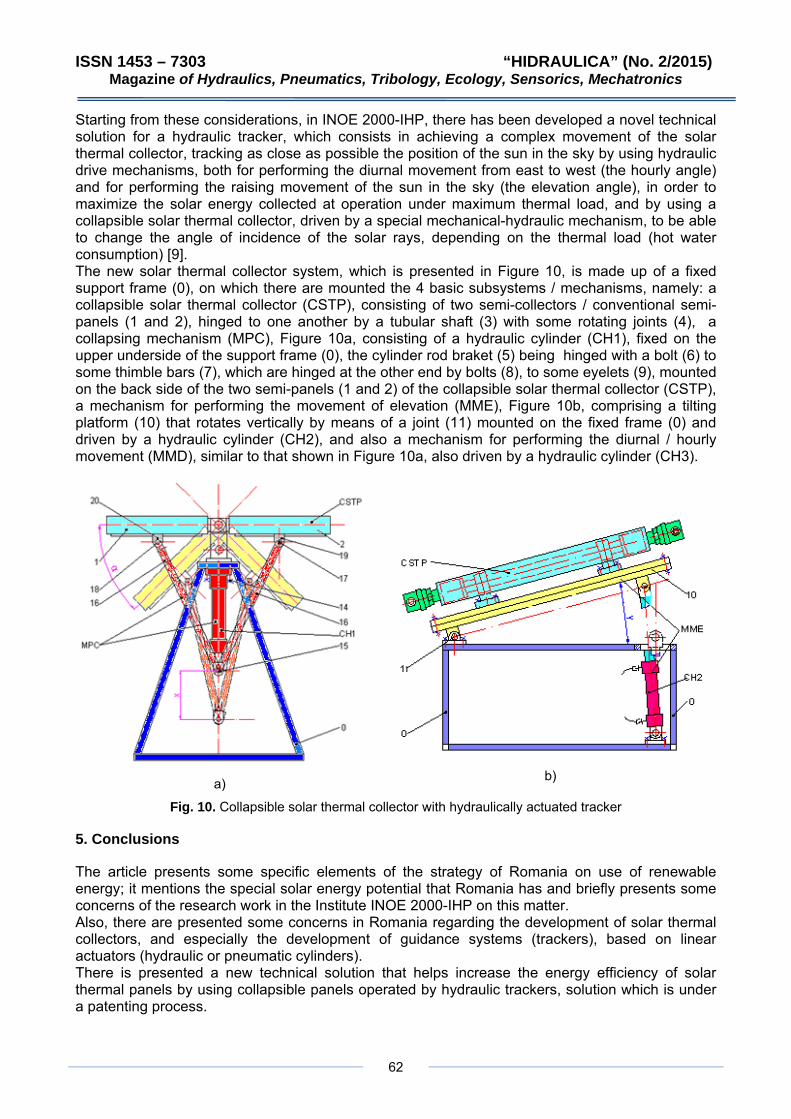
ISSN 1453 – 7303 “HIDRAULICA” (No. 2/2015) Magazine of Hydraulics, Pneumatics, Tribology, Ecology, Sensorics, Mechatronics
62
Starting from these considerations, in INOE 2000-IHP, there has been developed a novel technical solution for a hydraulic tracker, which consists in achieving a complex movement of the solar thermal collector, tracking as close as possible the position of the sun in the sky by using hydraulic drive mechanisms, both for performing the diurnal movement from east to west (the hourly angle) and for performing the raising movement of the sun in the sky (the elevation angle), in order to maximize the solar energy collected at operation under maximum thermal load, and by using a collapsible solar thermal collector, driven by a special mechanical-hydraulic mechanism, to be able to change the angle of incidence of the solar rays, depending on the thermal load (hot water consumption) [9]. The new solar thermal collector system, which is presented in Figure 10, is made up of a fixed support frame (0), on which there are mounted the 4 basic subsystems / mechanisms, namely: a collapsible solar thermal collector (CSTP), consisting of two semi-collectors / conventional semi-panels (1 and 2), hinged to one another by a tubular shaft (3) with some rotating joints (4), a collapsing mechanism (MPC), Figure 10a, consisting of a hydraulic cylinder (CH1), fixed on the upper underside of the support frame (0), the cylinder rod braket (5) being hinged with a bolt (6) to some thimble bars (7), which are hinged at the other end by bolts (8), to some eyelets (9), mounted on the back side of the two semi-panels (1 and 2) of the collapsible solar thermal collector (CSTP), a mechanism for performing the movement of elevation (MME), Figure 10b, comprising a tilting platform (10) that rotates vertically by means of a joint (11) mounted on the fixed frame (0) and driven by a hydraulic cylinder (CH2), and also a mechanism for performing the diurnal / hourly movement (MMD), similar to that shown in Figure 10a, also driven by a hydraulic cylinder (CH3).
a)
b)
Fig. 10. Collapsible solar thermal collector with hydraulically actuated tracker
5. Conclusions
The article presents some specific elements of the strategy of Romania on use of renewable energy; it mentions the special solar energy potential that Romania has and briefly presents some concerns of the research work in the Institute INOE 2000-IHP on this matter. Also, there are presented some concerns in Romania regarding the development of solar thermal collectors, and especially the development of guidance systems (trackers), based on linear actuators (hydraulic or pneumatic cylinders). There is presented a new technical solution that helps increase the energy efficiency of solar thermal panels by using collapsible panels operated by hydraulic trackers, solution which is under a patenting process.
ISSN 1453 – 7303 “HIDRAULICA” (No. 2/2015) Magazine of Hydraulics, Pneumatics, Tribology, Ecology, Sensorics, Mechatronics
63
This new technical solution offers better control on the difference between thermal energy supplied by solar thermal collectors and the actual thermal load.
References
[1] Strategia RO Strategia energetică a României pentru perioada 2007 – 2020, actualizată pentru perioada 2011 – 2020. / Romanian Energy Strategy for the period 2007 – 2020, updated for the period 2011-2020. In:http://www.mmediu.ro/protectia_mediului/evaluare_impact_planuri/2011-11-07/2011-11-07_evaluare_impact_planuri_strategiaenergeticaactualizata2011.pdf;
[2] Planul Naţional de Acţiune în Domeniul Energiei din Surse Regenerabile/ National Action Plan for Renewable Energy (PNAER). In: http://www.minind.ro/energie/PNAER_final.pdf;
[3] Studiu privind evaluarea potenţialului energetic actual al surselor regenerabile de energie în Romania / Study on assessing current energy potential of renewable energy in Romania. In: http://www.minind.ro/domenii_sectoare/energie/studii/potential_energetic.pdf;
[4] Croitoru, A-M., Analiza posibilităților de utilizare a energiei termice dezvoltate de sistemele fotovoltaice/ Analysis of the possiblity of use of thermal energy developed by the photovoltaic systems. Doctoral thesis, Politehnica University of Bucharest, 2014.
[5] Rusănescu C.O., Paraschiv G., Murad E., Dutu M.F., Monitoring solar radiation intensity with sun-earth angle in the year 2011 in the north-west of Bucharest. In: INMATEH –Agricultural Engineering, Vol. 40, No. 2 / 2013, pp. 97-102.
[6] Cotfas D. T., Cotfas P. A., Cojocariu C., Costinescu L., Samoila C. (2008), Solar Tracker cu algoritm matematic - National Conference of Virtual Instrumentation, 5th Edition, Bucharest;
[7] Dombi V.E., Optimizarea orientării colectoarelor solar termice plane funcţie de necesarul energetic al unei clădiri/ Optimization of flat solar thermal collectors orientation depending on the energy load of a building. Doctoral thesis, Transilvania University of Brasov, 2011;
[8] Şerban C., Adaptarea sistemului de orientare a colectoarelor solar-termice la necesarul termic al unei clădiri / Adjusting the tracking system of solar-thermal collectors to the heating load of a building. Doctoral thesis, Brasov, Romania, 2012;
[9] Cristescu C., Dumitrescu, C., Ilie, I., Dumitrescu, L., Increasing energy efficiency of the solar thermal panels through the use of hydraulic tracking systems. In: Proceedings of International Multidisciplinary Scientific Geo-Conference SGEM-2014, June 17 – 26, 2014, Albena Co., Bulgaria, Vol.: „Energy and clean technologies”, pp. 291–298, ISBN 978-619-7105-15-5, ISSN 1314-2704, URL: www.sgem.org.

http://hidraulica.fluidas.ro