Embed Size (px)
Citation preview
Institut C.D. HOWE Institute
commentaryNO. 368
Hiding in Plain Sight: the Harmful Impact of
Provincial Business Property Taxes
When measuring their relative attractiveness to new business investment, provinces should take into account the Business Education Tax. Otherwise, they are
underestimating the negative impacts on investment stemming from their tax systems.
Adam Found and Peter Tomlinson
$12.00isbn 978-0-88806-888-0issn 0824-8001 (print);issn 1703-0765 (online)
Essential Policy Intelligence | Conseils indispensablessur les
polit
ique
s
INST
ITU
TC.D. HOWE
INST
ITU
TE
Finn PoschmannVice-President, Research
Commentary No. 368December 2012Fiscal and Tax Competitiveness
C.D. Howe Institute publications undergo rigorous external review by academics and independent experts drawn from the public and private sectors.
The Institute’s peer review process ensures the quality, integrity and objectivity of its policy research. The Institute will not publish any study that, in its view, fails to meet the standards of the review process. The Institute requires that its authors publicly disclose any actual or potential conflicts of interest of which they are aware.
In its mission to educate and foster debate on essential public policy issues, the C.D. Howe Institute provides nonpartisan policy advice to interested parties on a non-exclusive basis. The Institute will not endorse any political party, elected official, candidate for elected office, or interest group.
As a registered Canadian charity, the C.D. Howe Institute as a matter of course accepts donations from individuals, private and public organizations, charitable foundations and others, by way of general and project support. The Institute will not accept any donation that stipulates a predetermined result or policy stance or otherwise inhibits its independence, or that of its staff and authors, in pursuing scholarly activities or disseminating research results.
The Institute’s Commitment to Quality
About The Authors
Adam Found M.A.is a Ph.D. Candidate, Department of Economics, University of Toronto.
Peter Tomlinson Ph.D.is a Sessional Lecturer, Department of Economics, University of Toronto.
The Study In Brief
When governments analyze tax policies aimed at attracting investment, they typically rely on a variable called the marginal effective tax rate (METR) on capital. The METR is a measure of the effective tax burden on new business investment.
Recent Ontario budgets have presented estimates of the METR, while emphasizing the economic benefit of reducing taxes included in these estimates. This Commentary makes the case that METR estimates have so far underestimated the actual tax burdens that investors face, because they exclude a major tax on businesses: provincial business property taxes. Excluding these taxes means that provinces do not adequately recognize the economic benefit of reducing them.
Provincial governments in Ontario, Alberta and British Columbia, the three provinces we consider, now hold the taxing power once held by school boards. This power shift has transformed the business education tax (BET). When school boards controlled the BET, it combined – at least potentially – two separate taxes: a benefit tax financing local schools and a tax on capital investment. Provincial takeovers have since eliminated any benefit tax component. From the standpoint of investors, business education taxes – despite their obsolete name – are now simply provincial business property taxes.
We find that including the BET adds substantially to METR estimates in Ontario. The impact of the BET on British Columbia’s METR appears to be somewhat less than the impact in Ontario, while the impact on Alberta’s METR appears substantially less.
The BET’s substantial impact on Ontario’s METR lends strong support to the case for parity between business and residential education tax rates. We estimate that if the BET rate were reduced to parity with the residential education tax (RET) rate, its METR impact would be much smaller. Even an announcement that BET/RET rate parity is to be attained in 15 years would immediately reduce the METR impact of BET due to the effect on investor expectations.
As a start, governments should include the BET in published METR estimates, such as the estimates published routinely in Ontario budgets. Leaving out the BET means missing a large part of the tax burden investors pay. It thus leads governments to underestimate the negative impacts on investment stemming from their tax systems, and it causes governments to defer – perhaps indefinitely – tax reforms needed to mitigate those negative impacts.
C.D. Howe Institute Commentary© is a periodic analysis of, and commentary on, current public policy issues. James Fleming edited the manuscript; Yang Zhao prepared it for publication. As with all Institute publications, the views expressed here are those of the authors and do not necessarily reflect the opinions of the Institute’s members or Board of Directors. Quotation with appropriate credit is permissible.
To order this publication please contact: the C.D. Howe Institute, 67 Yonge St., Suite 300, Toronto, Ontario M5E 1J8. The full text of this publication, including an on-line Appendix, is available on the Institute’s website at www.cdhowe.org.
2
This Commentary makes the case that provincial governments underestimate the size of the wedge. It argues provincial business property taxes are a significant part of the tax wedge, yet governments leave them out when estimating its size. As a result, governments maintain policies that discourage and distort investment.
Experience in Ontario provides an example. Ontario budgets have presented METR estimates since 2009, with four taxes included:2 the former Ontario Capital Tax (now eliminated); the former Ontario Provincial Sales Tax (replaced in 2010 by the Harmonized Sales Tax (HST), which does not affect the METR); the Ontario Corporate Income Tax (Ontario CIT); and the federal Corporate Income Tax (Federal CIT).
However, the provincial government’s property tax on businesses – known as the business education tax (BET) – has been excluded from the estimates. In this Commentary, we present METR estimates for Ontario with the BET included. We find that including the BET adds substantially to the
METR in Ontario. Thus the government’s METR estimates – given their exclusion of BET – are well below the METR as determined by investors.
Like Ontario, Alberta and British Columbia have provincially controlled business education taxes. We present order-of-magnitude METR estimates for these provinces with the BET included. The impact of the BET on British Columbia’s METR appears to be somewhat smaller than the impact in Ontario, while the impact on Alberta’s METR appears substantially smaller. It is likely that Alberta’s competitive advantage is understated by METR estimates that leave out the BET.
The Case for Including the Business Education Ta x in Ontario’s METR Estim ates
The Ontario government has made a priority of reducing METRs when implementing tax cuts. The resulting cuts to the capital tax and Ontario CIT have been substantial: $3.93 billion per year
The writers are grateful to Ben Dachis for many valuable suggestions. Helpful comments on an earlier draft were received from Ken Hughes, Jim Milway, Enid Slack, Marion Steele, and from anonymous reviewers. Responsibility for any remaining errors rests with the authors.
1 The marginal effective tax rate on capital investment is defined as the effective tax rate on revenue generated by the last unit of capital invested. Economists estimate other METRs as well – for example the marginal effective tax rate on labour – but only the capital METR will be discussed here.
2 The federal finance ministry developed the model used for the estimates presented in Ontario budgets.
When governments analyze tax policies aimed at attracting investment, they typically rely on a variable called the marginal effective tax rate (METR) on capital.1 The METR measures the wedge between before- and after-tax rates of return. Taxes in the wedge can make or break business decisions to invest in a country or province.
3 Commentary 368
since the cuts began in 2005 (almost 35 percent of 2004/05 revenue from these taxes).3
In contrast, the government’s cuts to BET – a tax excluded from METR estimates as noted – have been smaller: $0.24 billion per year since the cuts began in 2008 (about 6 percent of 2007 revenue from this tax).4
As announced in the 2012 budget, the government has put all tax cuts on hold pending elimination of the deficit. The government expects this to occur in 2018, and plans at that point to resume cutting both the Ontario CIT and BET. If the BET is still excluded from the government’s METR estimates at that point, it is unlikely the government would optimize the division of total tax cuts between the CIT and BET.
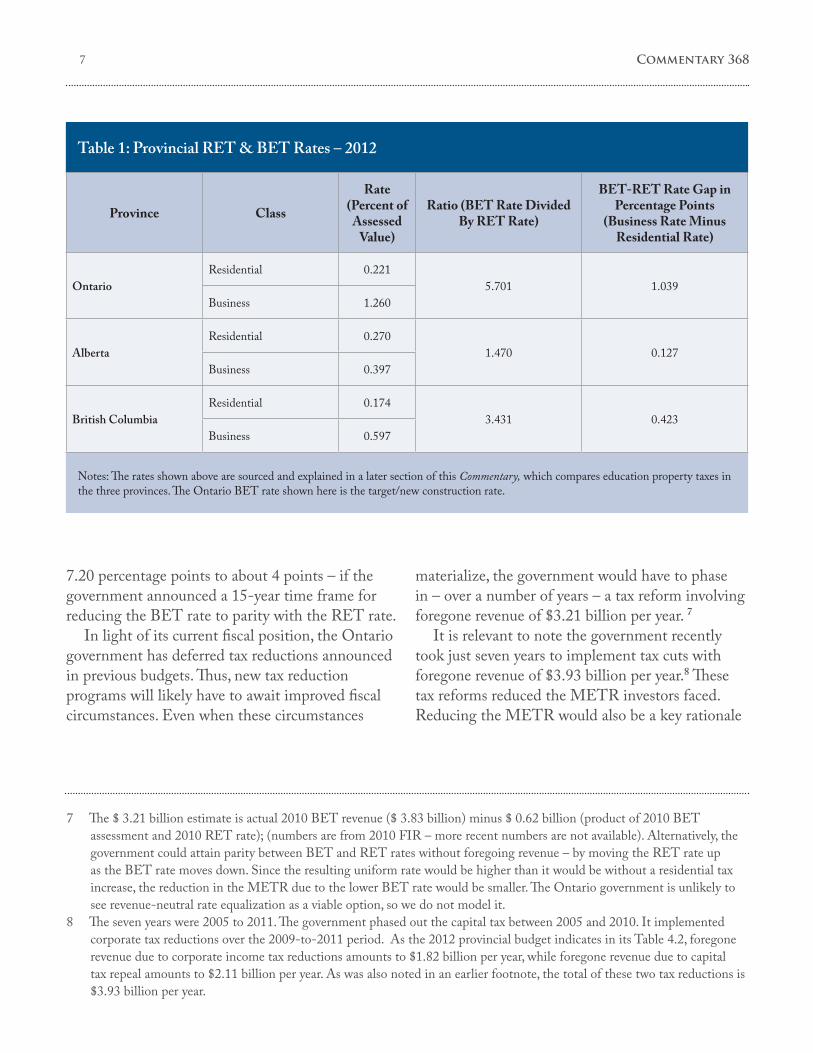
As well in this scenario, the imbalance between (higher) education tax rates on business and (lower) rates on residential properties will likely continue. As we will indicate later in the paper, the gap between business and residential education tax rates is much larger in Ontario than in Alberta or British Columbia. It is likely that tax distortions are contributing to inter-provincial differences in the capital formation mix. For example, investment in business structures accounts for a relatively small proportion of Ontario’s capital formation – with residential structures proportionately higher – compared with Alberta and British Columbia.
Before its elimination, Ontario’s capital tax imposed a $2.12 billion-per-year tax burden on
businesses, compared with the 2010 BET burden of $3.83 billion per year.5 Despite the burden differential, however, the BET is still excluded from government METR estimates, while the capital tax was not. Inclusion of the BET in government METR estimates is evidently desirable, given that investors include it in their own METR estimates.
Why is the BET still excluded from government METR estimates? We consider two potential rationales:
• VariationsinBETrevenuemaybeclosely linked to variations in school spending, so investors may perceive the BET as a partial benefit tax. Just as municipal property taxes on businesses are a partial benefit tax, and for that reason excluded from METR estimates, so should the BET be excluded.
• TheBETmaybeaneconomicallyefficienttaxliketheHST.Economicallyefficienttaxesdonothave significant negative impacts on investment in jurisdictions levying these taxes, and thus (as with the HST) are appropriately excluded from METR estimates.
Neither of these rationales is persuasive on close examination, as we will emphasize later.
Ontario METR Estim ates and Policy Recommendations
To estimate the impact of the BET on Ontario’s METR, we updated a model developed by McKenzie et al. (1998). With the BET excluded,
3 $3.93 billion per year is the 2012 budget estimate of foregone annual revenue (in 2012 dollars) due to eliminating capital tax and Ontario CIT reductions implemented to date. The 2006 budget reported 2004/5 revenue from Ontario CIT and capital tax at $9.88 billion. $9.88 billion in 2004/5 dollars adjusted to 2012 dollars by Ontario Consumer Price Index (CPI) inflation (14.3 percent) is $11.29 billion. $3.93 billion is 34.8 percent of $11.29 billion. The capital tax base was formally paid-up capital but equivalent, in economic terms, to a tax base consisting of the value of land, structures, machinery and inventories (McKenzie et al. 1998).
4 $0.24 billion per year is the $0.54 billion per year BET cut announced in the 2007 budget minus the amount not implemented that was originally scheduled for 2013 and 2014 ($0.30 billion per year as announced in the 2012 budget). $0.24 billion as a percentage of $3.91 billion per year BET revenue is approximately 6 percent. $3.91 billion is $3.57 billion actual 2007 revenue (as reported in the 2007 Financial Information Return (FIR) published by the Ontario Ministry of Municipal Affairs and Housing) adjusted to 2012 dollars by Ontario CPI inflation (9.6 percent).
5 Capital tax revenue as reported in the 2012 Ontario budget; BET revenue as reported in the 2010 FIR.
4
our model and the model used by the Ontario government produce METR estimates that do not appreciably differ. When we add the BET to our model, the METR estimate goes up by 7.20 percentage points to 24.56 – an increase of 40 percent over our estimate with the BET excluded (17.36 percentage points).
The Potential Impact of Ontario’s Tax Rates on the Composition of Investment
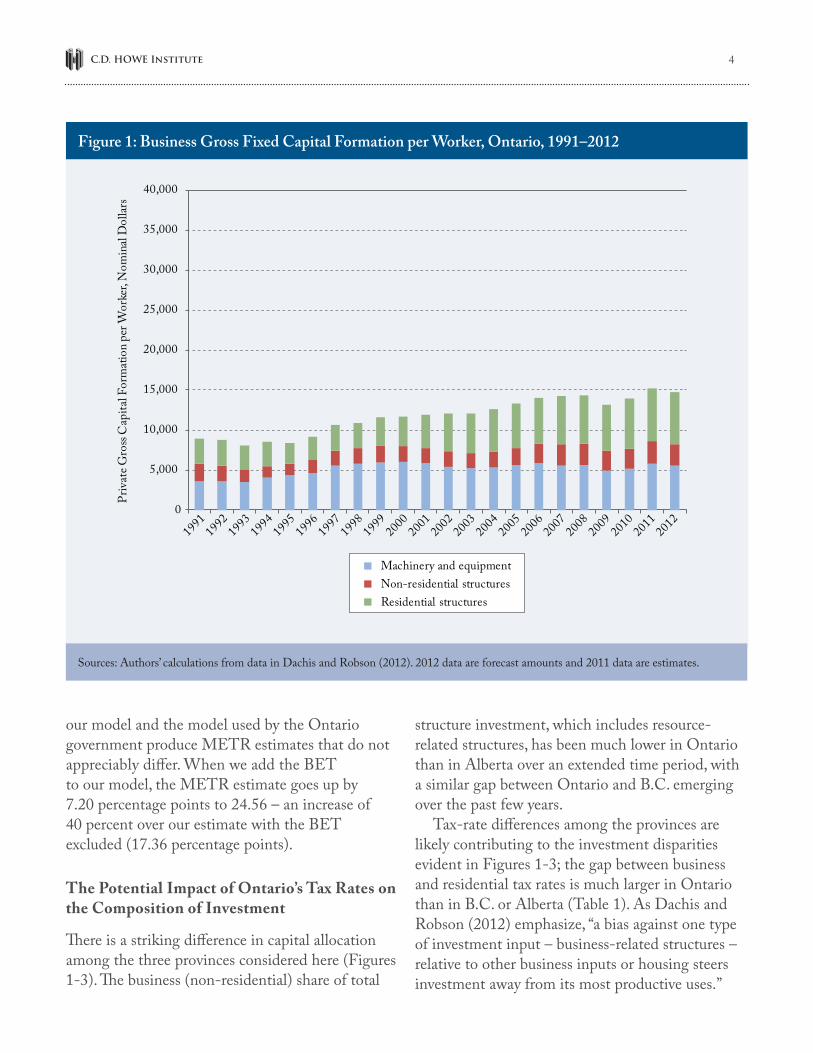
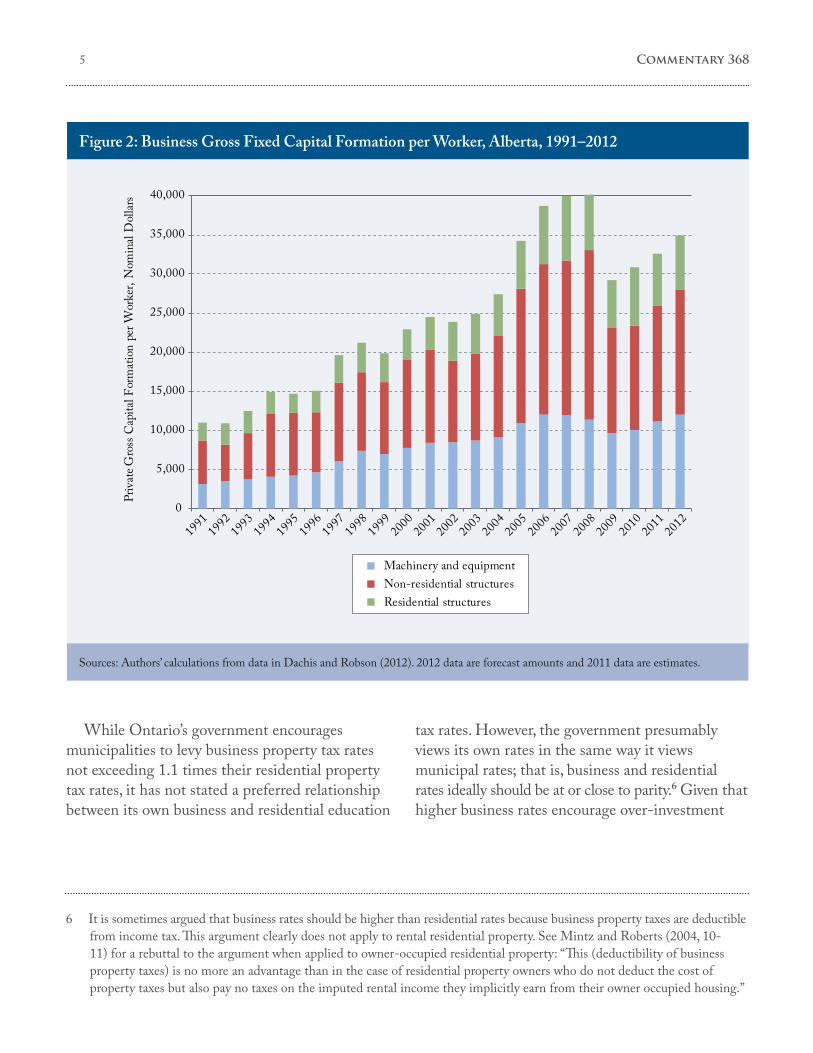
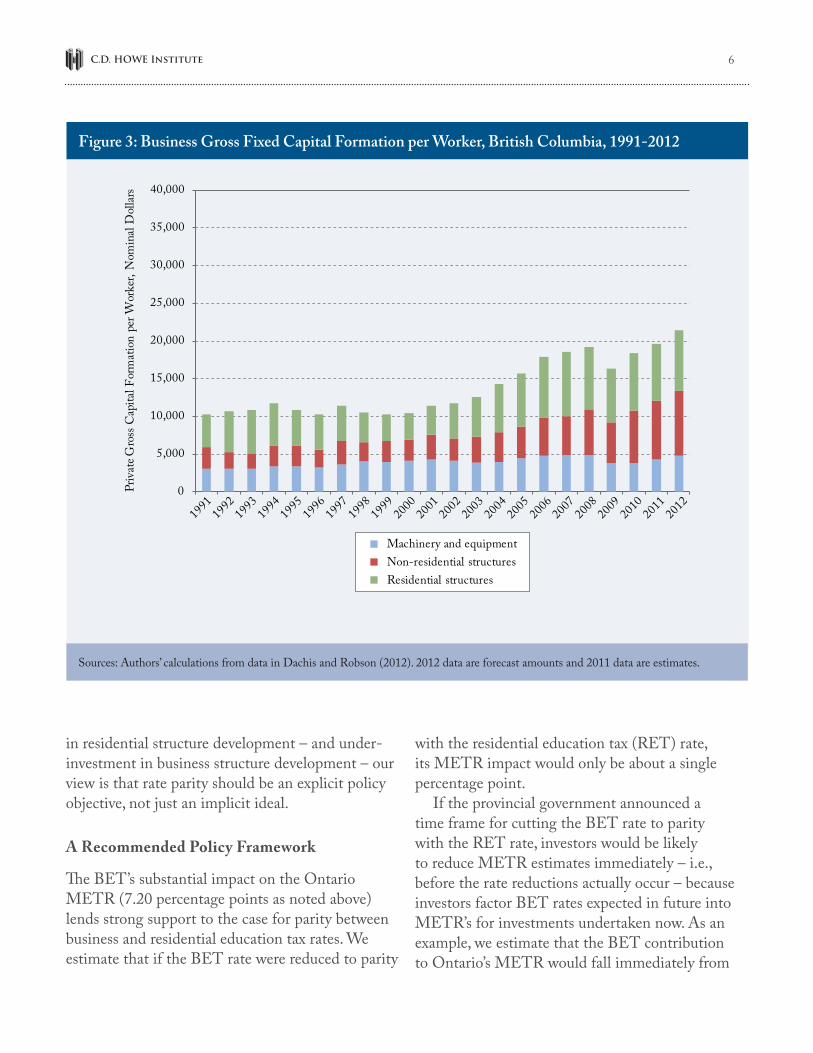
There is a striking difference in capital allocation among the three provinces considered here (Figures 1-3). The business (non-residential) share of total
structure investment, which includes resource-related structures, has been much lower in Ontario than in Alberta over an extended time period, with a similar gap between Ontario and B.C. emerging over the past few years.
Tax-rate differences among the provinces are likely contributing to the investment disparities evident in Figures 1-3; the gap between business and residential tax rates is much larger in Ontario than in B.C. or Alberta (Table 1). As Dachis and Robson (2012) emphasize, “a bias against one type of investment input – business-related structures – relative to other business inputs or housing steers investment away from its most productive uses.”
Figure 1: Business Gross Fixed Capital Formation per Worker, Ontario, 1991–2012
Sources: Authors’ calculations from data in Dachis and Robson (2012). 2012 data are forecast amounts and 2011 data are estimates.
0
5,000
10,000
15,000
20,000
25,000
30,000
35,000
40,000
1991
1992
1993
1994
1995
1996
1997
1998
1999
2000
2001
2002
2003
2004
2005
2006
2007
2008
2009
2010
2011
2012
Priv
ate G
ross
Cap
ital F
orm
atio
n pe
r Wor
ker,
Nom
inal
Dol
lars
Machinery and equipment
Residential structuresNon-residential structures
5 Commentary 368
Figure 2: Business Gross Fixed Capital Formation per Worker, Alberta, 1991–2012
Sources: Authors’ calculations from data in Dachis and Robson (2012). 2012 data are forecast amounts and 2011 data are estimates.
0
5,000
10,000
15,000
20,000
25,000
30,000
35,000
40,000
Priv
ate G
ross
Cap
ital F
orm
atio
n pe
r Wor
ker,
Nom
inal
Dol
lars
1991
1992
1993
1994
1995
1996
1997
1998
1999
2000
2001
2002
2003
2004
2005
2006
2007
2008
2009
2010
2011
2012
Machinery and equipment
Residential structuresNon-residential structures
While Ontario’s government encourages municipalities to levy business property tax rates not exceeding 1.1 times their residential property tax rates, it has not stated a preferred relationship between its own business and residential education
tax rates. However, the government presumably views its own rates in the same way it views municipal rates; that is, business and residential rates ideally should be at or close to parity.6 Given that higher business rates encourage over-investment
6 It is sometimes argued that business rates should be higher than residential rates because business property taxes are deductible from income tax. This argument clearly does not apply to rental residential property. See Mintz and Roberts (2004, 10-11) for a rebuttal to the argument when applied to owner-occupied residential property: “This (deductibility of business property taxes) is no more an advantage than in the case of residential property owners who do not deduct the cost of property taxes but also pay no taxes on the imputed rental income they implicitly earn from their owner occupied housing.”
6
in residential structure development – and under-investment in business structure development – our view is that rate parity should be an explicit policy objective, not just an implicit ideal.
A Recommended Policy Framework
The BET’s substantial impact on the Ontario METR (7.20 percentage points as noted above) lends strong support to the case for parity between business and residential education tax rates. We estimate that if the BET rate were reduced to parity
with the residential education tax (RET) rate, its METR impact would only be about a single percentage point.
If the provincial government announced a time frame for cutting the BET rate to parity with the RET rate, investors would be likely to reduce METR estimates immediately – i.e., before the rate reductions actually occur – because investors factor BET rates expected in future into METR’s for investments undertaken now. As an example, we estimate that the BET contribution to Ontario’s METR would fall immediately from
Figure 3: Business Gross Fixed Capital Formation per Worker, British Columbia, 1991-2012
Sources: Authors’ calculations from data in Dachis and Robson (2012). 2012 data are forecast amounts and 2011 data are estimates.
0
5,000
10,000
15,000
20,000
25,000
30,000
35,000
40,000
Priv
ate G
ross
Cap
ital F
orm
atio
n pe
r Wor
ker,
Nom
inal
Dol
lars
1991
1992
1993
1994
1995
1996
1997
1998
1999
2000
2001
2002
2003
2004
2005
2006
2007
2008
2009
2010
2011
2012
Machinery and equipment
Residential structuresNon-residential structures
7 Commentary 368
Notes: The rates shown above are sourced and explained in a later section of this Commentary, which compares education property taxes in the three provinces. The Ontario BET rate shown here is the target/new construction rate.
Table 1: Provincial RET & BET Rates – 2012
Province Class
Rate (Percent of
Assessed Value)
Ratio (BET Rate Divided By RET Rate)
BET-RET Rate Gap in Percentage Points
(Business Rate Minus Residential Rate)
OntarioResidential 0.221
5.701 1.039Business 1.260
AlbertaResidential 0.270
1.470 0.127Business 0.397
British ColumbiaResidential 0.174
3.431 0.423Business 0.597
7.20 percentage points to about 4 points – if the government announced a 15-year time frame for reducing the BET rate to parity with the RET rate.
In light of its current fiscal position, the Ontario government has deferred tax reductions announced in previous budgets. Thus, new tax reduction programs will likely have to await improved fiscal circumstances. Even when these circumstances
materialize, the government would have to phase in – over a number of years – a tax reform involving foregone revenue of $3.21 billion per year. 7
It is relevant to note the government recently took just seven years to implement tax cuts with foregone revenue of $3.93 billion per year.8 These tax reforms reduced the METR investors faced. Reducing the METR would also be a key rationale
7 The $ 3.21 billion estimate is actual 2010 BET revenue ($ 3.83 billion) minus $ 0.62 billion (product of 2010 BET assessment and 2010 RET rate); (numbers are from 2010 FIR – more recent numbers are not available). Alternatively, the government could attain parity between BET and RET rates without foregoing revenue – by moving the RET rate up as the BET rate moves down. Since the resulting uniform rate would be higher than it would be without a residential tax increase, the reduction in the METR due to the lower BET rate would be smaller. The Ontario government is unlikely to see revenue-neutral rate equalization as a viable option, so we do not model it.
8 The seven years were 2005 to 2011. The government phased out the capital tax between 2005 and 2010. It implemented corporate tax reductions over the 2009-to-2011 period. As the 2012 provincial budget indicates in its Table 4.2, foregone revenue due to corporate income tax reductions amounts to $1.82 billion per year, while foregone revenue due to capital tax repeal amounts to $2.11 billion per year. As was also noted in an earlier footnote, the total of these two tax reductions is $3.93 billion per year.
8
– along with investment neutrality between business and residential development – for moving to BET / RET rate parity.
Seven years could be an appropriate time frame within which to attain future BET / RET rate parity. However, the actual timing would take into account fiscal conditions at the time tax reductions begin.
We make the following recommendations:• InlinewithapolicymaintainedbyOntario
governments since 1998, the government should continue adjusting BET rates to maintain BET revenue in current dollars (i.e., revenue in constant dollars is reduced over time by inflation). We estimate that the alternative of maintaining BET revenue in constant dollars (as British Columbia does) would add about a 2 percentage point premium to the Ontario METR.
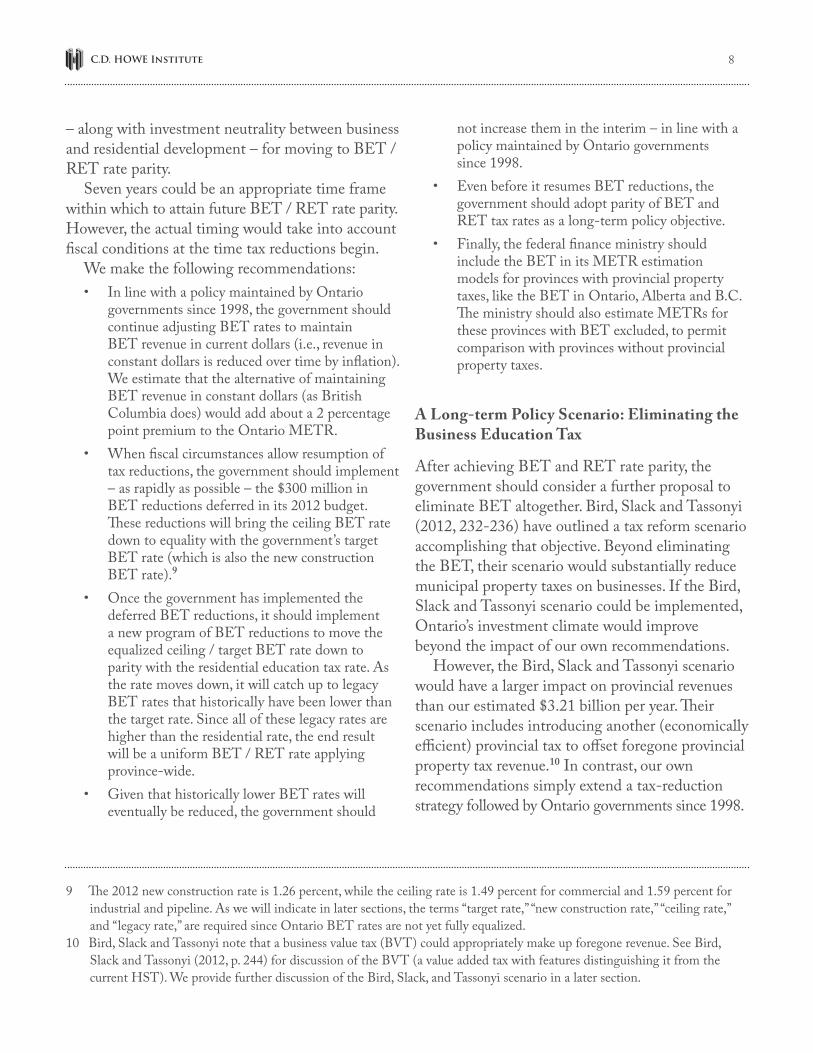
• Whenfiscalcircumstancesallowresumptionoftax reductions, the government should implement – as rapidly as possible – the $300 million in BET reductions deferred in its 2012 budget. These reductions will bring the ceiling BET rate down to equality with the government’s target BET rate (which is also the new construction BET rate).9
• Oncethegovernmenthasimplementedthedeferred BET reductions, it should implement a new program of BET reductions to move the equalized ceiling / target BET rate down to parity with the residential education tax rate. As the rate moves down, it will catch up to legacy BET rates that historically have been lower than the target rate. Since all of these legacy rates are higher than the residential rate, the end result will be a uniform BET / RET rate applying province-wide.
• GiventhathistoricallylowerBETrateswilleventually be reduced, the government should
not increase them in the interim – in line with a policy maintained by Ontario governments since 1998.
• EvenbeforeitresumesBETreductions,thegovernment should adopt parity of BET and RET tax rates as a long-term policy objective.
• Finally,thefederalfinanceministryshouldinclude the BET in its METR estimation models for provinces with provincial property taxes, like the BET in Ontario, Alberta and B.C. The ministry should also estimate METRs for these provinces with BET excluded, to permit comparison with provinces without provincial property taxes.
A Long-term Policy Scenario: Eliminating the Business Education Tax
After achieving BET and RET rate parity, the government should consider a further proposal to eliminate BET altogether. Bird, Slack and Tassonyi (2012, 232-236) have outlined a tax reform scenario accomplishing that objective. Beyond eliminating the BET, their scenario would substantially reduce municipal property taxes on businesses. If the Bird, Slack and Tassonyi scenario could be implemented, Ontario’s investment climate would improve beyond the impact of our own recommendations.
However, the Bird, Slack and Tassonyi scenario would have a larger impact on provincial revenues than our estimated $3.21 billion per year. Their scenario includes introducing another (economically efficient)provincialtaxtooffsetforegoneprovincialproperty tax revenue.10 In contrast, our own recommendations simply extend a tax-reduction strategy followed by Ontario governments since 1998.
9 The 2012 new construction rate is 1.26 percent, while the ceiling rate is 1.49 percent for commercial and 1.59 percent for industrial and pipeline. As we will indicate in later sections, the terms “target rate,” “new construction rate,” “ceiling rate,” and “legacy rate,” are required since Ontario BET rates are not yet fully equalized.
10 Bird,SlackandTassonyinotethatabusinessvaluetax(BVT)couldappropriatelymakeupforegonerevenue.SeeBird,SlackandTassonyi(2012,p.244)fordiscussionoftheBVT(avalueaddedtaxwithfeaturesdistinguishingitfromthecurrent HST). We provide further discussion of the Bird, Slack, and Tassonyi scenario in a later section.
9 Commentary 368
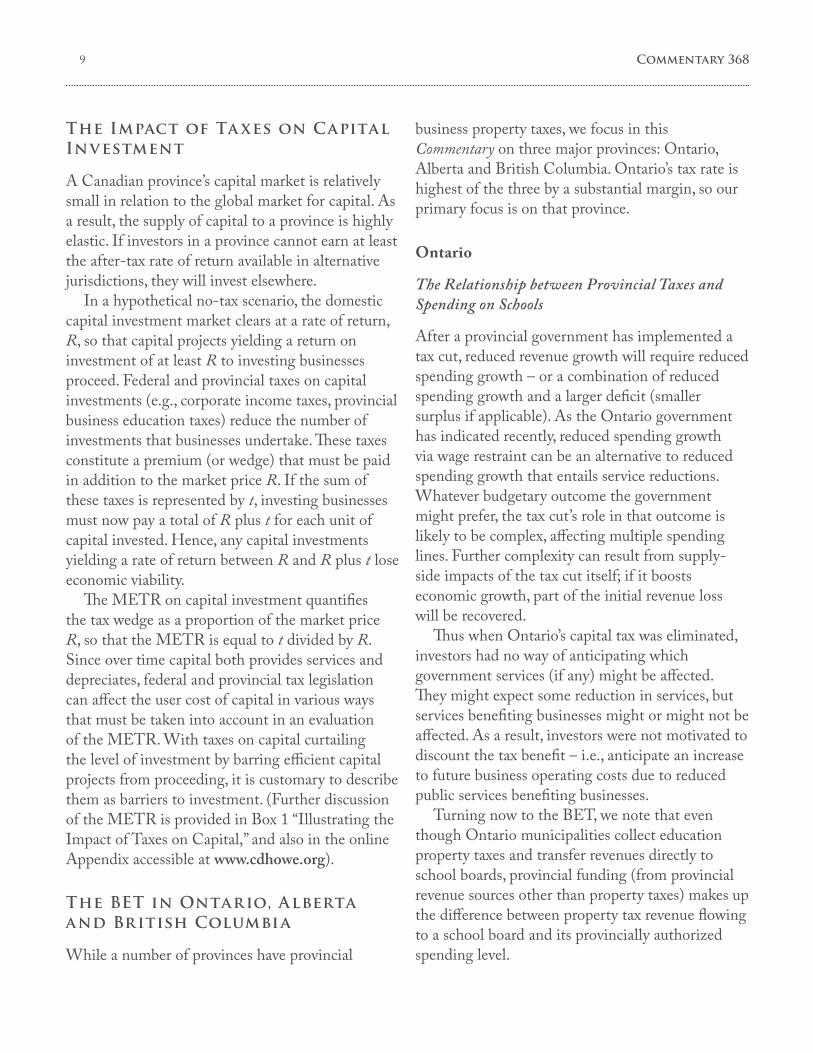
The Impact of Ta xes on Capital Investment
A Canadian province’s capital market is relatively small in relation to the global market for capital. As a result, the supply of capital to a province is highly elastic. If investors in a province cannot earn at least the after-tax rate of return available in alternative jurisdictions, they will invest elsewhere.
In a hypothetical no-tax scenario, the domestic capital investment market clears at a rate of return, R, so that capital projects yielding a return on investment of at least R to investing businesses proceed. Federal and provincial taxes on capital investments (e.g., corporate income taxes, provincial business education taxes) reduce the number of investments that businesses undertake. These taxes constitute a premium (or wedge) that must be paid in addition to the market price R. If the sum of these taxes is represented by t, investing businesses must now pay a total of R plus t for each unit of capital invested. Hence, any capital investments yielding a rate of return between R and R plus t lose economic viability.
The METR on capital investment quantifies the tax wedge as a proportion of the market price R, so that the METR is equal to t divided by R. Since over time capital both provides services and depreciates, federal and provincial tax legislation can affect the user cost of capital in various ways that must be taken into account in an evaluation of the METR. With taxes on capital curtailing thelevelofinvestmentbybarringefficientcapitalprojects from proceeding, it is customary to describe them as barriers to investment. (Further discussion of the METR is provided in Box 1 “Illustrating the Impact of Taxes on Capital,” and also in the online Appendix accessible at www.cdhowe.org).
The BET in Ontario, Alberta and British Columbia
While a number of provinces have provincial
business property taxes, we focus in this Commentary on three major provinces: Ontario, Alberta and British Columbia. Ontario’s tax rate is highest of the three by a substantial margin, so our primary focus is on that province.
Ontario
The Relationship between Provincial Taxes and Spending on Schools
After a provincial government has implemented a tax cut, reduced revenue growth will require reduced spending growth – or a combination of reduced spending growth and a larger deficit (smaller surplus if applicable). As the Ontario government has indicated recently, reduced spending growth via wage restraint can be an alternative to reduced spending growth that entails service reductions. Whatever budgetary outcome the government might prefer, the tax cut’s role in that outcome is likely to be complex, affecting multiple spending lines. Further complexity can result from supply-side impacts of the tax cut itself; if it boosts economic growth, part of the initial revenue loss will be recovered.
Thus when Ontario’s capital tax was eliminated, investors had no way of anticipating which government services (if any) might be affected. They might expect some reduction in services, but services benefiting businesses might or might not be affected. As a result, investors were not motivated to discount the tax benefit – i.e., anticipate an increase to future business operating costs due to reduced public services benefiting businesses.
Turning now to the BET, we note that even though Ontario municipalities collect education property taxes and transfer revenues directly to school boards, provincial funding (from provincial revenue sources other than property taxes) makes up the difference between property tax revenue flowing to a school board and its provincially authorized spending level.
1 0
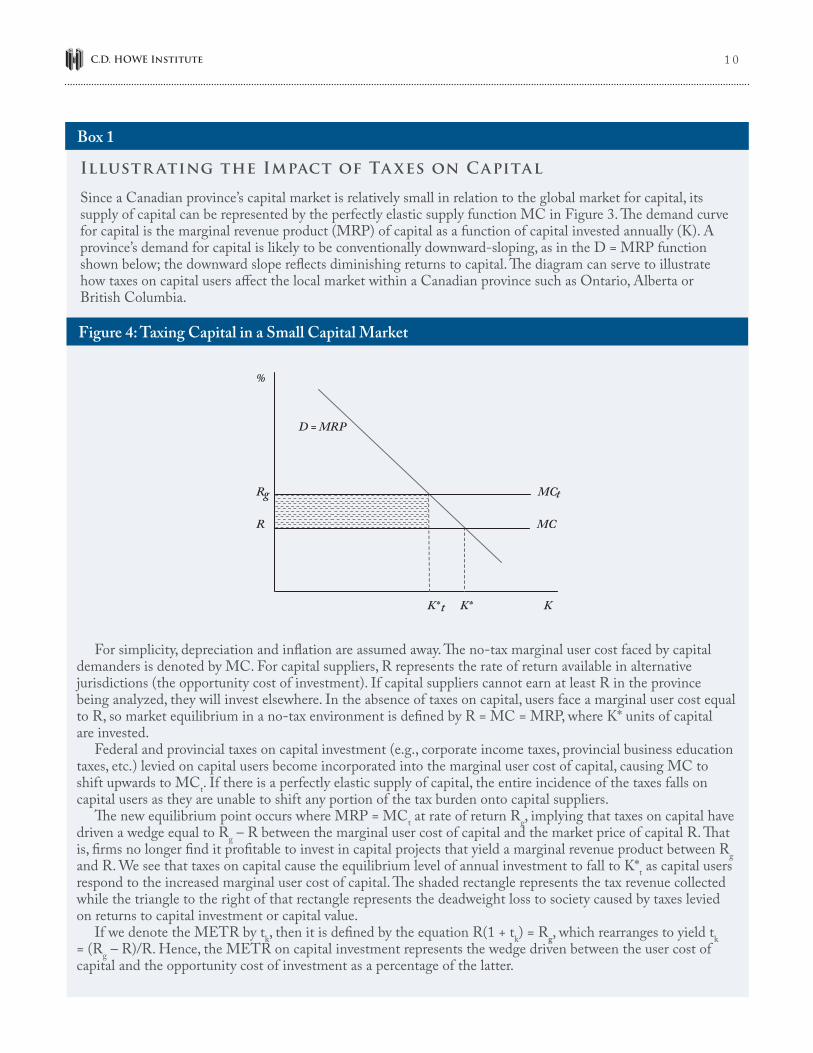
For simplicity, depreciation and inflation are assumed away. The no-tax marginal user cost faced by capital demanders is denoted by MC. For capital suppliers, R represents the rate of return available in alternative jurisdictions (the opportunity cost of investment). If capital suppliers cannot earn at least R in the province being analyzed, they will invest elsewhere. In the absence of taxes on capital, users face a marginal user cost equal to R, so market equilibrium in a no-tax environment is defined by R = MC = MRP, where K* units of capital are invested.
Federal and provincial taxes on capital investment (e.g., corporate income taxes, provincial business education taxes, etc.) levied on capital users become incorporated into the marginal user cost of capital, causing MC to shift upwards to MCt. If there is a perfectly elastic supply of capital, the entire incidence of the taxes falls on capital users as they are unable to shift any portion of the tax burden onto capital suppliers.
The new equilibrium point occurs where MRP = MCt at rate of return Rg, implying that taxes on capital have driven a wedge equal to Rg – R between the marginal user cost of capital and the market price of capital R. That is, firms no longer find it profitable to invest in capital projects that yield a marginal revenue product between Rg and R. We see that taxes on capital cause the equilibrium level of annual investment to fall to K*t as capital users respond to the increased marginal user cost of capital. The shaded rectangle represents the tax revenue collected while the triangle to the right of that rectangle represents the deadweight loss to society caused by taxes levied on returns to capital investment or capital value.
If we denote the METR by tk, then it is defined by the equation R(1 + tk) = Rg, which rearranges to yield tk = (Rg – R)/R. Hence, the METR on capital investment represents the wedge driven between the user cost of capital and the opportunity cost of investment as a percentage of the latter.
Figure 4: Taxing Capital in a Small Capital Market
%
D = MRP
Rg MCt
R MC
K* t K* K
Illustr ating the Impact of Ta xes on Capital
Since a Canadian province’s capital market is relatively small in relation to the global market for capital, its supply of capital can be represented by the perfectly elastic supply function MC in Figure 3. The demand curve for capital is the marginal revenue product (MRP) of capital as a function of capital invested annually (K). A province’s demand for capital is likely to be conventionally downward-sloping, as in the D = MRP function shown below; the downward slope reflects diminishing returns to capital. The diagram can serve to illustrate how taxes on capital users affect the local market within a Canadian province such as Ontario, Alberta or British Columbia.
Box 1
1 1 Commentary 368
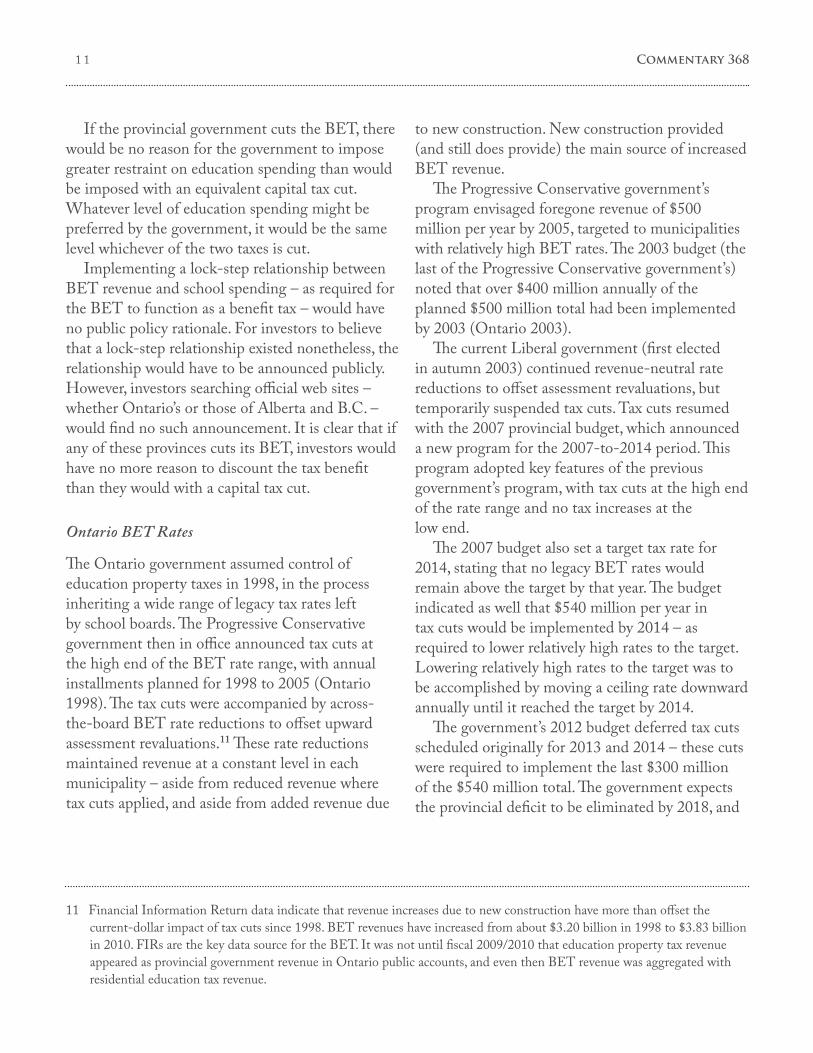
If the provincial government cuts the BET, there would be no reason for the government to impose greater restraint on education spending than would be imposed with an equivalent capital tax cut. Whatever level of education spending might be preferred by the government, it would be the same level whichever of the two taxes is cut.
Implementing a lock-step relationship between BET revenue and school spending – as required for the BET to function as a benefit tax – would have no public policy rationale. For investors to believe that a lock-step relationship existed nonetheless, the relationship would have to be announced publicly. However,investorssearchingofficialwebsites–whether Ontario’s or those of Alberta and B.C. – would find no such announcement. It is clear that if any of these provinces cuts its BET, investors would have no more reason to discount the tax benefit than they would with a capital tax cut.
Ontario BET Rates
The Ontario government assumed control of education property taxes in 1998, in the process inheriting a wide range of legacy tax rates left by school boards. The Progressive Conservative governmenttheninofficeannouncedtaxcutsatthe high end of the BET rate range, with annual installments planned for 1998 to 2005 (Ontario 1998). The tax cuts were accompanied by across-the-board BET rate reductions to offset upward assessment revaluations.11 These rate reductions maintained revenue at a constant level in each municipality – aside from reduced revenue where tax cuts applied, and aside from added revenue due
to new construction. New construction provided (and still does provide) the main source of increased BET revenue.
The Progressive Conservative government’s program envisaged foregone revenue of $500 million per year by 2005, targeted to municipalities with relatively high BET rates. The 2003 budget (the last of the Progressive Conservative government’s) noted that over $400 million annually of the planned $500 million total had been implemented by 2003 (Ontario 2003).
The current Liberal government (first elected in autumn 2003) continued revenue-neutral rate reductions to offset assessment revaluations, but temporarily suspended tax cuts. Tax cuts resumed with the 2007 provincial budget, which announced a new program for the 2007-to-2014 period. This program adopted key features of the previous government’s program, with tax cuts at the high end of the rate range and no tax increases at the low end.
The 2007 budget also set a target tax rate for 2014, stating that no legacy BET rates would remain above the target by that year. The budget indicated as well that $540 million per year in tax cuts would be implemented by 2014 – as required to lower relatively high rates to the target. Lowering relatively high rates to the target was to be accomplished by moving a ceiling rate downward annually until it reached the target by 2014.
The government’s 2012 budget deferred tax cuts scheduled originally for 2013 and 2014 – these cuts were required to implement the last $300 million of the $540 million total. The government expects the provincial deficit to be eliminated by 2018, and
11 Financial Information Return data indicate that revenue increases due to new construction have more than offset the current-dollar impact of tax cuts since 1998. BET revenues have increased from about $3.20 billion in 1998 to $3.83 billion in 2010. FIRs are the key data source for the BET. It was not until fiscal 2009/2010 that education property tax revenue appeared as provincial government revenue in Ontario public accounts, and even then BET revenue was aggregated with residential education tax revenue.
1 2
intends to resume BET tax cuts at that time. The gap between the ceiling rate (1.49 percent for commercial and 1.59 percent for industrial and pipeline in 2012) and the target rate (1.26 percent in 2012) will thus remain five years longer than planned. (The 1.26 percent target rate is the Ontario BET rate shown earlier in Table 1.)
One key feature announced in 2007 has been maintained in the 2012 budget. Major new construction in municipalities with legacy rates above the target rate is taxed at the target rate.12 Implicitly, as in previous budgets, the 2012 budget rejected inflation indexing of BET revenue; thus the government will continue adjusting tax rates to offset reassessment revaluations, maintaining revenue in current dollars.
Ontario’s residential education tax is levied at a province-wide uniform rate of 0.221 percent, as shown in Table 1; that rate applies to all properties in the residential and multi-residential classes. A portion of RET revenue is returned to taxpayers via tax credit and grant programs. These programs, like the RET rate itself, are relevant to investors insofar as they affect selling prices of new residential units.
Assessment revaluations are done every four years in Ontario, with increases in value phased in over the years between revaluations. Given the time lags entailed by this policy, and given generally increasing property values, effective tax rates are typically lower than published rates. An agency with a board of directors appointed by the provincial government (the Municipal Property Assessment Corporation) is responsible for property assessment.
Alberta
Property assessment is a local responsibility in Alberta, and some municipalities have average business assessment levels above or below market value. Consequently, the provincial government calculates equalization factors annually to scale each municipality’s total assessment to a market value equivalent (Alberta 2010).
The government also calculates a province-wide uniform BET rate, which is the total amount to be levied divided by total province-wide equalized assessment. The resulting rate (0.397 percent for 2012, see Table 1 above) is then applied to equalized assessment in each municipality to determine requisitioned amounts – i.e., dollar amounts to be levied on each municipality’s business assessment. The actual BET rate in a municipality is the requisitioned amount divided by the municipality’s actual business assessment.13
As long as a business investing in a new building is assessed – in any municipality – at the municipality’s average assessment level, it can expect to face the same effective rate wherever in the province the building is located: the province-wide uniform BET rate. Thus a representative investor considering placement of capital in Alberta is likely to use the province-wide uniform BET rate in a METR calculation. That rate can be considered an effective rate due to annual revaluation of equalized assessments.
An Alberta investor’s expectation of future tax rates would take into account a policy announced in the 2012 provincial budget. In that budget, the
12 Major new construction means redevelopment that adds at least 50 percent to assessed value. Most municipalities with legacy rates below the target rate are rural. Of the urban municipalities with legacy rates below the target, most have rates below the target rate by relatively small margins. In municipalities with legacy rates above the target rate, legacy rates still apply to investments falling short of the 50 percent threshold.
13 There are limits on annual increases in education tax requisitions, noted on: http://municipalaffairs.alberta.ca/1662.cfm.
1 3 Commentary 368
government announced that the 2012 province-wide BET rate would be frozen at its 2011 level.14
Alberta’s province-wide residential education rate (also based on equalized assessment and also frozen in 2012) is 0.270 percent. As in the other provinces considered here, there are tax reductions for designated taxpayers such as seniors.
British Columbia
The B.C. government subdivides business properties into sub-classes. In addition to the general sub-class that includes most businesses, there are industrial and utility sub-classes. The tax rate applied to each sub-class is uniform province-wide. The rate on utilities is higher than the rate on the general sub-class, while the industrial rate is lower (due to credits applied to industrial properties). The 0.597 percent BET rate shown earlier in Table 1 is an assessment-weighted average of sub-class rates.
The B.C. government adjusts education tax rates to maintain revenue in constant dollars.15 Investor expectations of future rates are therefore higher than they would be if rate adjustments maintained current dollar revenue. As a result, our METR estimate for B.C. is higher than it would be if inflation indexing were not applied.
The Residential Education Tax in B.C.
The B.C. government’s residential education rates cannot readily be compared with rates in Alberta or Ontario. The government uses a formula to
set residential education rates separately in each municipality. The formula reduces tax rates in municipalities with above-average house values, while increasing tax rates in municipalities with below-average house values. The residential education rate shown earlier in Table 1 (0.174 percent) is an assessment-weighted average across municipalities.16 As in Ontario and Alberta, British Columbia has tax reduction programs for various residential taxpayers.
As in Ontario, a special-purpose agency (B.C. Assessment) has responsibility for assessment revaluations. The agency does revaluations annually so published tax rates are also effective rates.
The BET Contribution to Provincial METRs: Quantitative Estim ates
In this section, we describe a METR model for Ontario that can produce METR estimates with or without BET, and which closely approximates METR estimates appearing in recent Ontario budgets when the BET is excluded. We also describe versions of the model tailored to Alberta and British Columbia.
Estimating Ontario’s METR
Tax reforms announced in the 2009 Ontario budget [repeal of the Ontario Capital Tax (OCT), replacement of Ontario Sales Tax (OST) with the Harmonized Sales Tax (HST), and reductions to
14 Alberta (2012, p. 100). Alberta’s uniform BET rate has been either frozen or cut in each of the past 18 years. See: http://www.education.alberta.ca/admin/funding/tax.aspx. Still, it is unclear whether an investor could project a specific downward time-path of future rates based on this record. For METR modeling purposes here we have assumed that investors (conservatively) project future rates at the 2012 level.
15 British Columbia (2012, p. 62).16 The assessment-weighted average RET rate was calculated using data available at
http://www.cscd.gov.bc.ca/lgd/infra/tax_rates/tax_rates2012.htm. The assessment-weighted average BET rate (0.597 percent) was also calculated using data on that site.
1 4
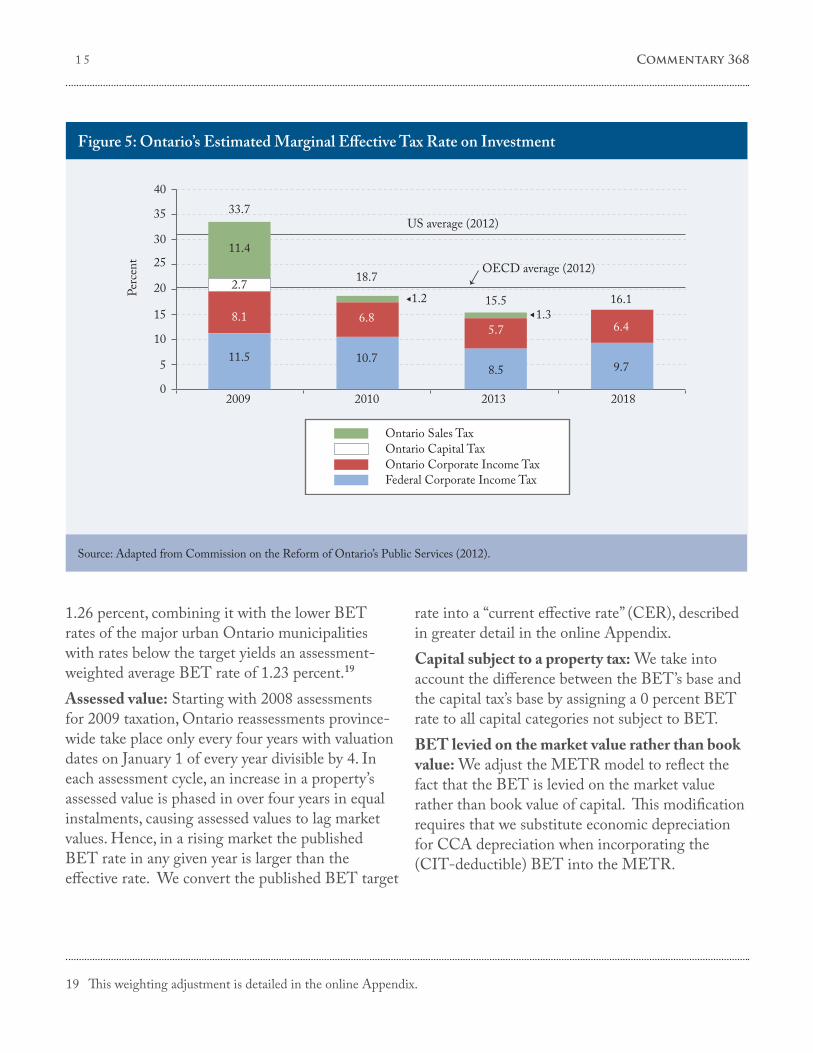
Ontario and federal Corporate Income Tax (CIT)] lowered the government’s estimated METR from 33.7 percent in 2009 to 18.7 percent in 2010. This METR impact is shown graphically in Figure 5, from the report of the Commission on the Reform of Ontario’s Public Services (2012).17 Originally scheduled (but now deferred) Ontario CIT reductions for 2012 and 2013, as well as a 2011-2013 temporary accelerated CCA program, are reflected in the 2013 METR of 15.5 percent. Once the accelerated CCA program expires. and the residual sales tax on producer inputs is fully phased out, the METR estimate increases slightly to 16.1 percent for 2018 as shown in Figure 5.
Reflecting deferral of Ontario CIT reductions, the 2012 Ontario budget increased the 2013 METR to 16.3 percent – still less than half the 33.7 percent METR for 2009. Commenting on the tax reforms as originally announced in the 2009 budget, Mintz (2009) estimated that the reforms would attract almost $50 billion in added capital stock and increase annual incomes by up to 8.8 percent by 2020.
Incorporating the BET into the METR Model
Our Ontario METR model largely builds on McKenzie et al. (1998) and to some extent on Boadway et al. (1984) and King and Fullerton (1984). Features of the model, such as the underlying theoretical framework and assumed parameter values, are detailed in the online Appendix. To incorporate the BET into a METR
estimate, we position it as comparable to the former OCT; from the perspective of owners of buildings and land, the taxes are comparable. As with the former OCT, the BET is levied on an ad valorem basis, is deductible for CIT purposes, and must be paid irrespective of a business’s profitability.
There are five distinct features of Ontario’s BET that require special consideration when adding the BET to an Ontario METR model: (i) BET rates are still not entirely uniform across municipalities; (ii) the assessed value of the BET tax base lags its current market value; (iii) the BET only applies to capital subject to a property tax, and not all capital; (iv) the BET is levied on the market value rather than book value of capital; and (v) the BET rate routinely changes in accordance with exogenous revenue targets, rather than being left constant, impacting investor expectations and distinguishing the BET from the OCT, which had an exogenous tax rate and endogenous revenue.BET rates: Ontario’s target BET rate is the rate facing a typical investor. The few urban municipalities with legacy BET rates below the target rate have rates only slightly lower than the target.18 Otherwise the target rate applies uniformly across urban Ontario, where most capital investments take place. Thus, the target rate could be used in a METR model as an approximation to a uniform rate; however, we instead adjust the target rate downward to a weighted average using municipal shares of provincial business assessment as weights. With the 2012 target rate being
17 The Commission’s chart is the most up to date Ontario METR chart available showing the contribution of individual taxes to the METR. The METR chart (Chart 4.5) in the 2012 Ontario budget, which appeared after the Commission’s report was published, does not show the contribution of individual taxes.
18 Reassessment can cause a legacy rate in a municipality to reach the target rate. After this happens, the target rate continues to apply in the municipality – in other words once at the target, always at the target.
1 5 Commentary 368
1.26 percent, combining it with the lower BET rates of the major urban Ontario municipalities with rates below the target yields an assessment-weighted average BET rate of 1.23 percent.19
Assessed value: Starting with 2008 assessments for 2009 taxation, Ontario reassessments province-wide take place only every four years with valuation dates on January 1 of every year divisible by 4. In each assessment cycle, an increase in a property’s assessed value is phased in over four years in equal instalments, causing assessed values to lag market values. Hence, in a rising market the published BET rate in any given year is larger than the effective rate. We convert the published BET target
rate into a “current effective rate” (CER), described in greater detail in the online Appendix.Capital subject to a property tax: We take into account the difference between the BET’s base and the capital tax’s base by assigning a 0 percent BET rate to all capital categories not subject to BET.BET levied on the market value rather than book value: We adjust the METR model to reflect the fact that the BET is levied on the market value rather than book value of capital. This modification requires that we substitute economic depreciation for CCA depreciation when incorporating the (CIT-deductible) BET into the METR.
Figure 5: Ontario’s Estimated Marginal Effective Tax Rate on Investment
Source: Adapted from Commission on the Reform of Ontario’s Public Services (2012).
33.740
35
30
25
20
15
10
5
02009 2010 2013 2018
US average (2012)
18.7OECD average (2012)
15.5 16.11.21.3
Ontario Sales TaxOntario Capital TaxOntario Corporate Income TaxFederal Corporate Income Tax
Perc
ent
11.4
2.7
8.1
11.5
6.8
10.7
5.7
8.5
6.4
9.7
19 This weighting adjustment is detailed in the online Appendix.
1 6
Investor expectations of future BET rates: Changes in the target rate over time affect investor expectations of future rates. The target rate was 1.60 percent when the BET reduction program was announced in 2007. With no reassessment implemented for the 2008 taxation year, the target rate remained at 1.60 percent that year. Since then, the province has moved the target rate down: 1.52 percent in 2009, 1.43 percent in 2010, 1.33 percent in 2011, and 1.26 percent in 2012. These decreases were implemented by the province to offset assessment revaluations of business properties province-wide. In the online Appendix, we develop annual projections of BET rates, converted into an equivalent notional BET rate held constant in perpetuity: the equivalent level effective rate (ELER). It is this parameter which ultimately enters the METR model, thereby incorporating the BET into the METR.
We consider expected future BET rates in the context of three policy scenarios:
1. BET-RET Parity: The Ontario government announces a 15-year schedule of BET ceiling rates beginning in 2013, reaching an estimated effective RET rate of 0.13 percent in 2027 (see online Appendix for RET rate projection). After 2027, the government adjusts the resulting uniform BET rate annually to maintain revenue in nominal dollars.
2. Status Quo: The Ontario government continues its revenue-neutral rate adjustment policy as reconfirmed in the 2012 Ontario budget. This policy maintains revenue in nominal dollars by adjusting rates to offset reassessment impacts.
3. Inflation Indexed: The Ontario government adopts British Columbia’s rate adjustment policy. With this policy, the government adjusts rates to offset reassessment impacts subject to maintaining revenue in real dollars.
In all three scenarios, revenue accruing from new development is added to total revenue from previously developed properties. In the online Appendix, we have calculated ELERs for the three policy scenarios (Table 2). There are two asset categories to which the BET applies: land and buildings.20 The ELERs tend to vary across these categories due to varying parameter values and policy assumptions used for modelling. If the government were to announce a policy goal of BET-RET parity, it would lower the ELER (and therefore the METR) from the Status Quo scenario level because it changes the time path of expected future BET rates from that scenario to a lower time path trending downward to the RET rate.21
We assume that investors expect the future rate of property appreciation across a province to equal the anticipated inflation rate (assumed here to be 2 percent per annum). The province-wide appreciation rate will influence the government’s tax rate determination, and thus investors’ future tax rateexpectations.Giventhedifficultyofprojectingproperty appreciation over a long period of time across a diversified assessment base, appreciation at the inflation rate appears to be a reasonable assumption. As a result of that assumption, we keep expected future tax rates constant in the Inflation Indexed scenario.
20 New structures are mostly covered under Capital Cost Allowance (CCA) Class 1, and older structures, those built before 1988 (including improvements thereto), are covered under CCA Class 3. We have merged these two classes together to form a single capital category called “Buildings”. See the online Appendix for details.
21 A key feature of the BET / RET Parity scenario is its schedule of maximum tax rates for future years, announced in advance. This feature, which makes revenue endogenous, minimizes investors’ uncertainty with respect to future rates.
1 7 Commentary 368
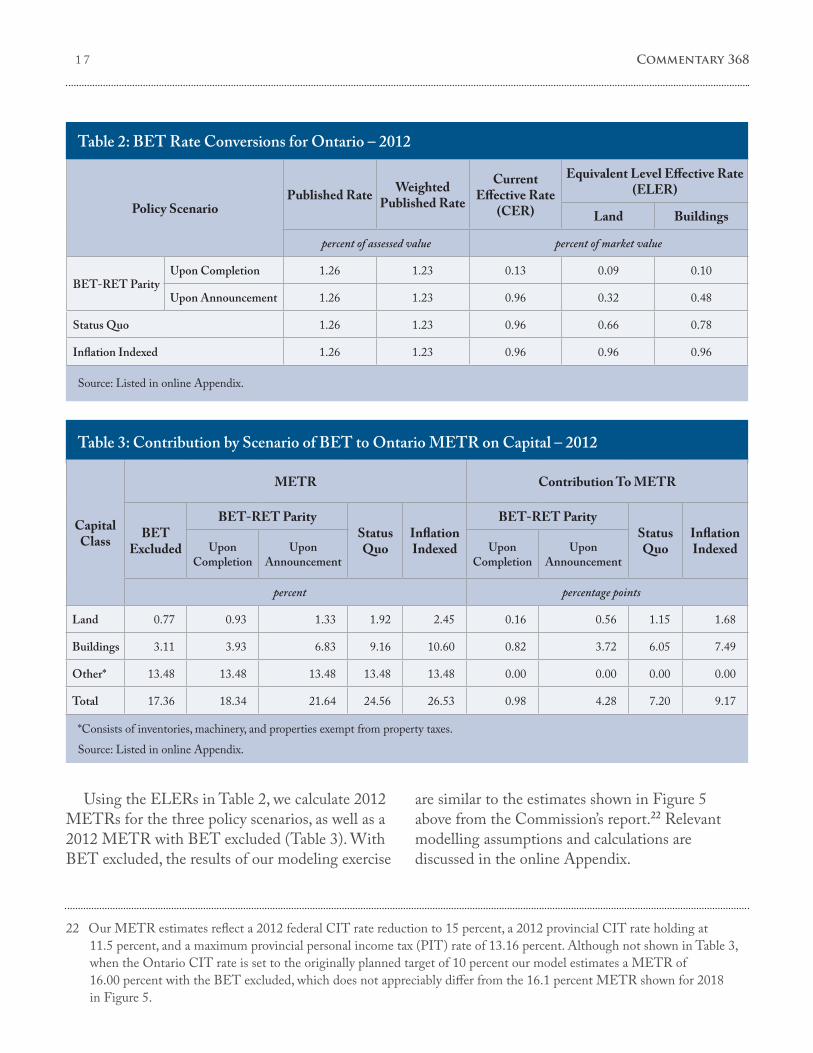
Using the ELERs in Table 2, we calculate 2012 METRs for the three policy scenarios, as well as a 2012 METR with BET excluded (Table 3). With BET excluded, the results of our modeling exercise
are similar to the estimates shown in Figure 5 above from the Commission’s report.22 Relevant modelling assumptions and calculations are discussed in the online Appendix.
Source: Listed in online Appendix.
Table 2: BET Rate Conversions for Ontario – 2012
Policy ScenarioPublished Rate Weighted
Published Rate
Current Effective Rate
(CER)
Equivalent Level Effective Rate (ELER)
Land Buildings
percent of assessed value percent of market value
BET-RET ParityUpon Completion 1.26 1.23 0.13 0.09 0.10
Upon Announcement 1.26 1.23 0.96 0.32 0.48
Status Quo 1.26 1.23 0.96 0.66 0.78
Inflation Indexed 1.26 1.23 0.96 0.96 0.96
*Consists of inventories, machinery, and properties exempt from property taxes.Source: Listed in online Appendix.
Table 3: Contribution by Scenario of BET to Ontario METR on Capital – 2012
Capital Class
METR Contribution To METR
BET Excluded
BET-RET ParityStatus Quo
Inflation Indexed
BET-RET ParityStatus Quo
Inflation IndexedUpon
CompletionUpon
AnnouncementUpon
CompletionUpon
Announcement
percent percentage points
Land 0.77 0.93 1.33 1.92 2.45 0.16 0.56 1.15 1.68
Buildings 3.11 3.93 6.83 9.16 10.60 0.82 3.72 6.05 7.49
Other* 13.48 13.48 13.48 13.48 13.48 0.00 0.00 0.00 0.00
Total 17.36 18.34 21.64 24.56 26.53 0.98 4.28 7.20 9.17
22 Our METR estimates reflect a 2012 federal CIT rate reduction to 15 percent, a 2012 provincial CIT rate holding at 11.5 percent, and a maximum provincial personal income tax (PIT) rate of 13.16 percent. Although not shown in Table 3, when the Ontario CIT rate is set to the originally planned target of 10 percent our model estimates a METR of 16.00 percent with the BET excluded, which does not appreciably differ from the 16.1 percent METR shown for 2018 in Figure 5.
1 8
As the “Contribution To METR” columns in Table 3 indicate, the BET contributes 4.28 percentage points under the BET-RET Parity scenario when announced (0.98 percentage points upon completion), 7.20 percentage points under the Status Quo scenario, and 9.17 percentage points under the Inflation Indexed scenario. An announcement of the BET-RET Parity scenario would cut the BET’s contribution to the current METR by almost 3 percentage points relative to the Status Quo scenario.
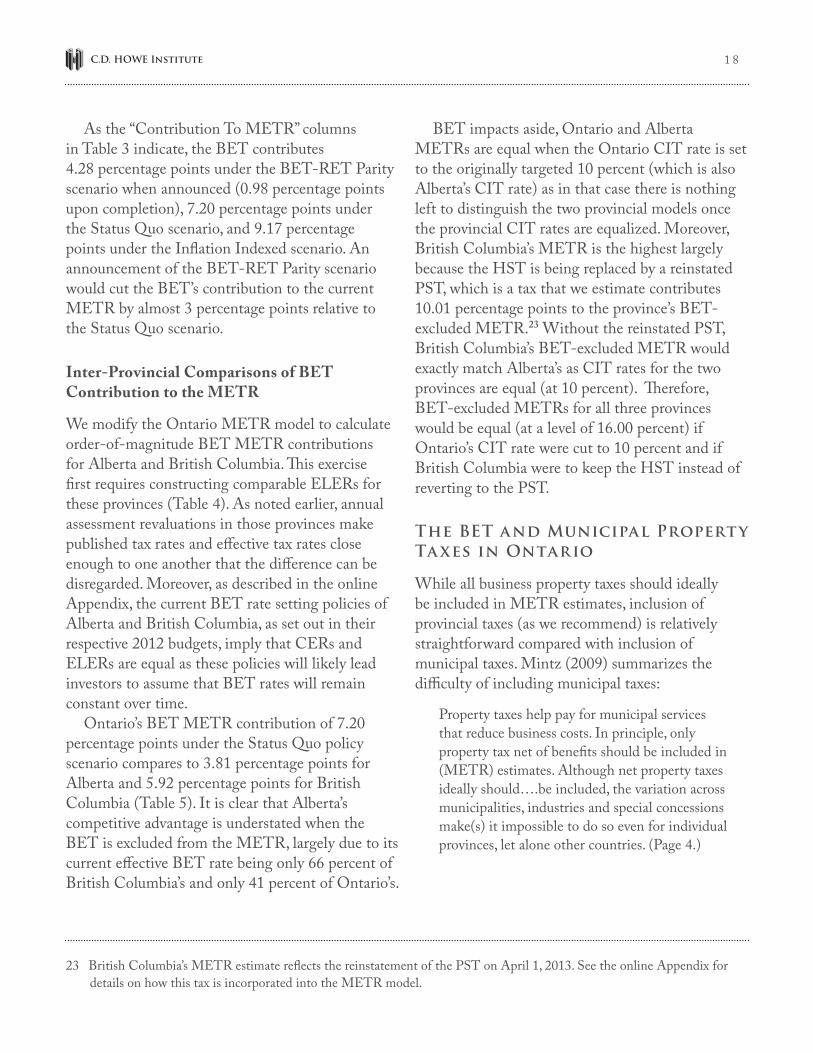
Inter-Provincial Comparisons of BET Contribution to the METR
We modify the Ontario METR model to calculate order-of-magnitude BET METR contributions for Alberta and British Columbia. This exercise first requires constructing comparable ELERs for these provinces (Table 4). As noted earlier, annual assessment revaluations in those provinces make published tax rates and effective tax rates close enough to one another that the difference can be disregarded. Moreover, as described in the online Appendix, the current BET rate setting policies of Alberta and British Columbia, as set out in their respective 2012 budgets, imply that CERs and ELERs are equal as these policies will likely lead investors to assume that BET rates will remain constant over time.
Ontario’s BET METR contribution of 7.20 percentage points under the Status Quo policy scenario compares to 3.81 percentage points for Alberta and 5.92 percentage points for British Columbia (Table 5). It is clear that Alberta’s competitive advantage is understated when the BET is excluded from the METR, largely due to its current effective BET rate being only 66 percent of British Columbia’s and only 41 percent of Ontario’s.
BET impacts aside, Ontario and Alberta METRs are equal when the Ontario CIT rate is set to the originally targeted 10 percent (which is also Alberta’s CIT rate) as in that case there is nothing left to distinguish the two provincial models once the provincial CIT rates are equalized. Moreover, British Columbia’s METR is the highest largely because the HST is being replaced by a reinstated PST, which is a tax that we estimate contributes 10.01 percentage points to the province’s BET-excluded METR.23 Without the reinstated PST, British Columbia’s BET-excluded METR would exactly match Alberta’s as CIT rates for the two provinces are equal (at 10 percent). Therefore, BET-excluded METRs for all three provinces would be equal (at a level of 16.00 percent) if Ontario’s CIT rate were cut to 10 percent and if British Columbia were to keep the HST instead of reverting to the PST.
The BET and Municipal Property Ta xes in Ontario
While all business property taxes should ideally be included in METR estimates, inclusion of provincial taxes (as we recommend) is relatively straightforward compared with inclusion of municipal taxes. Mintz (2009) summarizes the difficultyofincludingmunicipaltaxes:
Property taxes help pay for municipal services that reduce business costs. In principle, only property tax net of benefits should be included in (METR) estimates. Although net property taxes ideally should….be included, the variation across municipalities, industries and special concessions make(s) it impossible to do so even for individual provinces, let alone other countries. (Page 4.)
23 British Columbia’s METR estimate reflects the reinstatement of the PST on April 1, 2013. See the online Appendix for details on how this tax is incorporated into the METR model.
1 9 Commentary 368
Sources: Listed in online Appendix.
Table 4: BET Rate Conversions for Alberta and British Columbia – 2012
Province BET Rate Setting Policy
Published Rate Current Effective Rate (CER)
Equivalent Level Effective Rate (ELER)
Land Buildings
percent of assessed value percent of market value
Alberta Fixed Rate 0.397 0.397 0.397 0.397
British Columbia Inflation Indexed 0.597 0.597 0.597 0.597
*Consists of inventories, machinery, and properties exempt from property taxes.**Evaluated for the Status Quo policy scenario.Sources: Listed in online Appendix.
Table 5: Contribution of BET to Modelled Provincial METRs on Capital – 2012
Capital Class
Ontario** Alberta British Columbia
METRMETR
Excluding BET
BET Contribution METR
METR Excluding
BET
BET Contribution METR
METR Excluding
BET
BET Contribution
percent percentage points percent percentage
points percent percentage points
Land 1.92 0.77 1.15 1.41 0.71 0.70 2.15 1.06 1.09
Buildings 9.16 3.11 6.05 5.95 2.84 3.11 10.09 5.26 4.83
Other* 13.48 13.48 0.00 12.45 12.45 0.00 19.69 19.69 0.00
Total 24.56 17.36 7.20 19.81 16.00 3.81 31.93 26.01 5.92
The presence of a benefit component means that if a municipality reduces its business property tax, investors may expect reduced benefits from municipal services. The benefit reduction will partially offset the tax reduction. A similar relationship would apply in the case of a municipal tax increase. Thus adding municipal property taxes to METR estimates is not among the recommendations in this Commentary.
Although the BET and municipal property taxes appear on a single bill, investors are motivated to distinguish between the two taxes. Local governments control the municipal tax while the provincial government controls the education tax. Thus investors are motivated to project future tax burdens differently for the two taxes – since separate taxing authorities will have different taxing policies.
2 0
Preventing Municipalities from Occupying Vacated Tax Room
Our recommendations would eventually lift about $3.21 billion from a $3.83 billion annual BET burden.24 A tax reduction of this magnitude prompts a question: could municipalities occupy the tax room created by BET reductions? If BET reductions were to make municipal tax increases larger than they’d be otherwise, the METR benefit of BET relief would be diluted. While larger-than-usual tax increases could lead to improved services to businesses, research findings suggest investors will expect any benefits to fall well short of tax increases.25
It is relevant here that provincial rules prevent Ontario municipalities from imposing larger percentage tax increases on businesses than on residents. In other words, when a local council increases taxes on businesses, it has to increase taxes on residents by at least the same percentage. This requirement would likely discourage councils from imposing higher-than-usual tax increases on businesses – as would be required to occupy tax room created by BET reductions. The political impact of higher-than-usual tax increases on residents would be a deterrent.26
In any case, the provincial government has the authority to introduce new restrictions on municipal tax policy. If municipal occupancy of tax room were to become an actual concern in future, the provincial government could further restrict municipal tax increases on businesses.
The Impact of Reassessments on Business Property Tax Burdens
Tax increases provide municipalities with added revenue. Aside from tax increases, Ontario municipalities can also implement tax shifts. With a tax shift, one class of property pays more tax so that another class can pay less, with no change in revenue for the municipality.
When a municipality shifts taxes from businesses onto residents, there is a favourable impact on the investment climate. Seeing that municipal revenue is unchanged, investors have no reason to expect reduced services. At the same time business taxes have gone down. Thus, investors see all of the tax reduction as implemented on a services-held-constant basis.27 The provincial government imposes no restrictions on tax shifts in this direction – i.e., from businesses onto residents.
24 The actual revenue loss to the government will be less than the estimated $3.21 billion per year tax reduction. As has been emphasized in recent Ontario budgets, METR reductions are expected to accelerate the province’s economic growth. Accelerated economic growth in turn can be expected to boost provincial revenue growth. Conservative budgeting practice rules out reliance on supply-side impacts when developing revenue projections. However, these impacts could substantially mitigate the foregone revenue impact of BET reductions.
25 Examples of relevant research findings include MMK Consulting (2007); Hemson Consulting (2003); Mintz and Roberts (2006); Kitchen and Slack (1993).
26 A provincial rule further restricts tax increases in municipalities with business tax rates exceeding residential rates by specified margins. In those municipalities, percentage tax increases on businesses cannot be more than half of percentage tax increases on residents. We comment further on this rule – originally called the “hard cap” – in a later section.
27 Residential voters may seek to offset higher tax burdens by voting for candidates advocating reduced service levels. This impact on voting could occur even if municipal tax increases on residents are offset by education tax decreases. However, actual impacts on service levels will emerge from an uncertain political process. We assume the political impacts of tax shifts aresufficientlyuncertainthatinvestorsdisregardthem.
2 1 Commentary 368
Conversely, when a municipality shifts taxes from residents onto businesses, there is an unfavourable impact on the investment climate. Seeing that municipal revenue is unchanged, investors in this case have no reason to expect improved services. At the same time, business taxes have gone up. Thus, investors see all of the tax increase as implemented on a services-held-constant basis.
The provincial government allows tax shifts in this direction – i.e., from residents onto businesses – only when reassessment raises the business share of total assessment. However, such reassessment impacts occur routinely, and municipal tax shifts onto businesses do occur.28
Regardless of whether BET reductions are being implemented or not, municipal tax shifts onto businesses affect the Ontario investment climate unfavourably. With new assessed values scheduled to take effect in 2013, now is an appropriate time for the government to consider whether tax shifts onto businesses should still be allowed.
Implementing Comprehensive Provincial and Municipal Property Tax Reform
We now briefly consider a relevant tax reform scenario outlined by Bird, Slack and Tassonyi (2012).29 Key features of the scenario include:
• Municipalitieswouldnolongerbepermittedto levy higher tax rates on businesses than on residents. Property classes for taxation purposes would no longer exist, so municipalities would necessarily have to levy a uniform rate on all property.30
• Municipaltaxesonbusinesseswoulddecreaseasa result of the uniform rate, but municipalities on average would not lose revenue. The residential education tax would be eliminated, enabling municipalities to increase their residential taxes by enough to offset the tax reduction for businesses. On average, there would be no overall increase in residential taxes; residents would no longer pay education taxes so the municipal tax increase would be offset.
• Thebusinesseducationtaxwouldbeeliminatedin its entirety. The provincial revenue foregone by eliminating both business and residential education taxes would be made up by introducing aneweconomicallyefficientprovincialtax.31
The Bird, Slack and Tassonyi scenario is clearly worthy of further consideration and analysis. In addition to paying no BET, businesses would see their municipal taxes go down without an accompanying reduction in municipal revenue. Thus, they would not expect a benefit reduction to partially offset the tax reduction. Investors would reduce their calculated METRs to reflect the full amount of the tax reduction.
The Bird, Slack and Tassonyi scenario’s complete elimination of BET would also reduce the METR – indeed by more than the reduction associated with our recommendations. Our recommended reductions would leave a small BET in place.
It might be possible to gradually implement the Bird, Slack and Tassonyi scenario without an offsetting new tax. The provincial government does not seem to be willing to introduce new taxes even to offset reduction to another provincial tax. The alternative would be to implement the scenario
28 For an example of a municipal tax policy that shifts taxes from residents to businesses, see Regional Municipality of Halton (2010). We discuss examples of tax shifting in Toronto in a later section.
29 Chapter 9, especially pages 232-236. The authors outline a number of property tax reform scenarios. Of these scenarios, the scenario we discuss here offers the largest METR reduction.
30 The scenario could be modified to allow continuation of discounted tax rates on farm and managed forest properties.31 An earlier footnote in this Commentary provides a reference to Bird, Slack and Tassonyi’s discussion of the suggested new
tax (business value tax).
2 2
gradually without a revenue offset. The route taken in this case would be the same route taken with capital tax repeal, corporate income tax reductions, and BET reductions implemented to date.
Impacts of BET Reductions and Capital Ta x Reductions on Investment
The Ontario government – rightly in our view – sees elimination of its capital tax as an action that improved the province’s investment climate. Over time, this action will substantially increase Ontario’s capital stock and output. We expect a similar outcome if the BET rate is reduced to parity with the residential education rate.
The Impact of Municipal Land Use Zoning on Investment
First, however, we consider an economic model that would predict a different outcome due to municipal zoning policy. In this model, a jurisdiction that reduces its business property tax rate will attract little or no added investment as a result.32 The view of business property taxes in this model has been called the “benefit tax view” (Smart 2012).
In the model underlying the benefit tax view (Fischel 1975, 1976), municipalities in an urban region use zoning to optimize their levels of economic activity. Increases in a municipality’s land
supply zoned for business initially add more to tax revenue than to costs.33 Thus residents, who control the municipality, benefit from the increased business land supply. However, as the business land supply continues to increase, additions to tax revenue and to costs converge. From the point of view of residents, that is the point of optimal business development. Further increases in the business land supply would add more to costs than to property tax revenue, so the municipality would optimally design zoning rules to prevent net entry of businesses beyond that point.
Starting with optimal levels of business activity throughout the region, what would happen if there were a policy intervention that reduces the business tax rate in a municipality (holding service levels constant)? Businesses would be attracted to that municipality from elsewhere, but to gain entry they have to bid land away from existing businesses. Since the zoning regulation prevents net entry of businesses, the tax reduction’s only impact is an increase in land prices. The tax reduction would thus be fully capitalized into land prices, with no net impact on business location.
If instead of reducing a municipality’s tax rate the policy intervention increased that rate, businesses moving to that jurisdiction would no longer pay pre-tax-increase land prices. Once again, the tax change would be fully capitalized into (lower) land prices, with no net impact on business location.34
32 Economists’ analysis of business property taxes has focused on municipal taxes. We stay with that focus initially, for ease of reference to the literature. We consider provincial property taxes after the initial discussion focusing on municipal taxes.
33 Theadditiontocostsconsistsofaddedmunicipalservicingcostplusaddedenvironmentalcost(e.g.,trafficcongestion,pollution). Economists typically assume that “externalities” (in this case environmental costs associated with business activity) can be expressed in dollar terms.
34 A zoning regulation imposing a mandatory capital / land ratio (i.e., the maximum is also the minimum) will ensure full capitalization (meaning no net entry or exit of firms) whether a tax change is up or down. However, under some conditions only a maximum ratio will be required, and under other conditions only a minimum ratio will be required. In general, zoning has to prevent firms from changing their capital / land ratios in response to a change in land prices that results from a tax change.
2 3 Commentary 368
Responsiveness of the Land Supply to Increased Land Prices
So far as predicting the impact of tax changes on investment is concerned, the benefit tax view has a key limitation: most municipalities do not have zoning regulations aimed at preventing net entry of businesses.35 Instead, the land supplies they zone for business include many vacant or underutilized sites. Rather than businesses facing a zoning barrier when they consider entry, they face a supply function for land that may be relatively elastic – that is, the amount of land that is made available for development increases substantially in response to an increase in land prices.
Contributing to supply elasticity are vacant greenfield sites in municipalities not yet built out. Substantial entry of businesses onto this land supply can occur without utilizing all of it. And virtually all municipalities have underutilized sites – such as parking lots and sites occupied by older low-density buildings – available for redevelopment.
In some cases, business investment can take place on land that otherwise would be developed residentially. For example, Toronto zones much of the land supply in its central area as mixed use (commercial / residential). High-density residential development sets the land price, and relatively few businesses are able to match that price. A reduction to the business tax rate – if not accompanied by a reduction to the residential tax rate – would allow more businesses to match the residential land price.
In areas of Toronto zoned exclusively for business, some land owners hold land vacant in expectation of rezoning – that is, rezoning to more valuable high-density residential use. Again, a reduction
to the business tax rate – if not accompanied by a reduction to the residential tax rate – would allow more businesses to match the residential land price (in this case a speculative reservation price).
An upward sloping supply function for land, whatever its elasticity, implies higher land prices as demand for land increases. However, higher land prices are associated with higher density (i.e. a higher capital / land ratio), so sites that investors would have developed in any case will instead have more capital when the land price goes up.
An upward sloping supply function for land accords well with an alternative to the benefit tax view: i.e., the “capital tax view” (Smart 2012). In this capital tax view, a jurisdiction reducing its tax rate can expect more business activity on its land supply, via utilization of vacant sites and via greater density on redeveloped sites. The magnitude of this effect depends on various elasticities (the land supply elasticity, the related structure supply elasticity, and structure demand elasticity).
The Impact of Expectations on Investment
Because structures are fixed in place and have an extended asset life, investor expectations of future tax rates are relevant. A reduction in the tax rate may not lower investors’ expectations of future rates, since they may see the reduction as not extending beyond the current year or the current assessment cycle. Thus, a municipality using a tax reduction to attract businesses will increase the strategy’s impact if it can lower businesses’ long-term expectations of future rates.
Investors attracted by a tax reduction may acquire land and then hold it for future development.
35 Municipalities may be determining optimal levels of business activity as in Fischel’s model, but business demand for land is evidently not strong enough to get them to these levels. Downward rigidity of land prices, due to owners’ future price expectations,helpstomaintaininsufficiencyofdemand.Withsub-optimallevelsofbusinessactivitythereisnorationalefor zoning policies aimed at preventing net entry of firms.
2 4
Investors view the optimal development time in conjunction with optimal density.36 If a business expects market conditions several years ahead to make a high-density building optimal, while market conditions today would make a low-density building optimal, immediate development (whether at low or high density) can be less desirable than waiting.
Time lags complicate empirical studies of the tax-rate / investment relationship. One study found substantially higher growth of economic activity in Massachusetts towns that continued taxing business and residential properties at a uniform rate – compared with other Massachusetts towns that increased business tax rates relative to residential rates; however, the authors noted that the difference became evident gradually (Lee and Wheaton 2010).
Another study considered economic activity in Ontario municipalities that reduced business tax rates more than others over the 2001-2006 period;
the author concluded that municipalities with larger tax-rate reductions experienced “economically small” positive impacts on economic activity as a result – adding, however, that “moving is costly, and the full effects of the tax reform may not be realized until much later, after the natural process of exit and entry causes business activity to shift fully in response to the tax reform” (Smart 2012).37
The Relationship between the BET and Traditional Capital Taxes
Ontario’s former capital tax was levied on the value of land and capital – meaning it can be viewed as a type of property tax – with the capital component of its assessment base extending beyond structures to include the value of machines and inventories (McKenzie et al. 1998).38 The capital tax’s economic role was similar to the business
36 The optimal development time / density combination is the combination that maximizes the net present value of the income stream expected from development of a property (Nowlan 2001).
37 The reform considered by Smart, implemented by the Ontario government in 2001 and known as the “hard cap,” restricted budget flexibility in municipalities with relatively high tax ratios (business tax rates divided by residential tax rates). These municipalities (Toronto among them) were required to finance annual tax levy increases on their residential tax base alone, rather than on their combined residential / business tax base. A less stringent version of the cap has applied since 2004. Smart compared increases in business activity in capped municipalities with comparable increases in municipalities exempt from the cap. The data indicated a difference in the expected direction but it was economically small as noted above. Investors’ perceptions of the cap policy’s long-term effectiveness may have been compromised by another provincial policy. That policy, which was discussed earlier in this Commentary, allows municipalities to override the cap by implementing tax shifts onto businesses. These shifts are allowed when the business share of total assessment goes up due to revaluation. Just as the cap was being implemented in 2001, the City of Toronto shifted $61.4 million per year from residents to businesses – overriding the cap. Then a new assessment revaluation in 2004 reversed the 2001 assessment shift – i.e., the residential share of total assessment went up. City staff reported that a tax shift of $66.3 million per year off commercial / industrial properties would result from the new assessment shift. However, a 2004 change in provincial policy allowed municipalities to avoid tax shifting onto residential properties; Toronto exercised this option. The tax shift impacts in Toronto were well known to consulting and legal firms specializing in property tax issues and operating across the province. Businesses generally could certainly have seen the tax shift policy as one-sided, a perception that may affect long-term tax expectations negatively. (See City of Toronto 2004, page 10, for data respecting the 2001 tax shift and the avoided 2004 shift.) More recent City of Toronto policies rule out tax shifts that favour the residential property class.
38 Alberta’s BET is evidently designed so that the value of machinery could be included in the tax base. However, a government web site notes that the “tax rate remains at zero mills for properties assessed as machinery and equipment,” so the tax base currently is limited to value of buildings and land. See: http://www.education.alberta.ca/admin/funding/tax.aspx. In addition to tax bases that overlap, capital taxes and business property taxes share another attribute: both taxes must be paid whether or not a business is profitable.
2 5 Commentary 368
property tax role as seen through the capital tax view lens. The provincial government expected capital tax elimination to make the province more attractive to businesses – businesses that would succeed in acquiring Ontario land, and would then build structures to accommodate machines and inventories.
In considering the investment in structures induced by eliminating the capital tax, it is clear that most Ontario municipalities would welcome the new investment – rather than adopting zoning regulations aimed at blocking it. The same observation applies to investment in structures induced by reducing the BET rate to parity with the residential education rate, should the government implement the reduction in future. Given actual zoning policies adopted by municipalities, the capital tax view provides the appropriate perspective on both capital tax and BET.
Because capital tax elimination reduced the tax rate on machinery and inventories, some induced investment was feasible immediately – for example by installing machines or inventories in existing structures. However, new structures – and the machines and inventories those structures accommodate – would likely have constituted a substantial part of investment induced by eliminating the capital tax. The timing of this part of induced investment would have been subject to the lag effects discussed earlier in connection with property taxes.
A BET reduction would reduce the tax rate on structure capital alone, so induced investment in machinery and inventories would be indirect; that is, structure investment would be induced directly by the tax cut, with indirectly induced machinery
and inventories placed in new structures when occupied. Apart from timing differences,39 we expect the overall induced investment impacts to be similar whether the government reduces the capital tax or the BET.
Our conclusion here is that policymakers should see the BET as being similar to a capital tax – notasanefficienttaxincompanywiththeHST;efficienttaxesarerevenuesourcesthathaveminimalnegative impact on investment.40 As the Ontario government observed in its 2007 budget:
This initiative (the BET reduction program) is a key element in the government’s overall strategy to enhance Ontario’s investment climate and builds on the proposal in this Budget to accelerate the elimination of the capital tax to July 1, 2010. The BET reductions will improve the competitive position of Ontario businesses, create new jobs and strengthen the provincial economy. (Page 19.)
Conclusions
Provincial governments, in the three provinces we consider, now hold the taxing power once held by school boards. This power shift has transformed the business education tax. When school boards controlled the BET, it combined – at least potentially – two separate taxes: a benefit tax financing local schools and a tax on capital investment. Provincial takeovers have since eliminated any benefit tax component. From the standpoint of investors, the BET is now a tax on capital investment like the former capital tax.
This transformation allows governments to assess their investment climates more accurately. When the BET was a local tax, economists had
39 Structure investment in the form of renovations to existing structures could avoid the time lags associated with investment in new structures.
40 TheBETandcapitaltaxcouldbeefficientrevenuesourcesifmostorallcompetingjurisdictionsoutsideOntariohadzoning regulations aimed at preventing net entry of firms. However, this is clearly not the case.
2 6
no apparent means of isolating its investment tax component – a requirement for estimating METRs. With the BET now a general revenue tax, that problem no longer exists. Business education taxes – despite their obsolete name – are simply provincial business property taxes.
Compared with Ontario tax rates, Alberta has a much lower BET rate, and its BET rate is closer to its residential education tax (RET) rate. With BET excluded, Alberta and Ontario have similar METRs (respectively 16.00 percent and 17.36 percent in our estimates). With BET included, Alberta’s competitive position relative to Ontario looks much better; estimates in that case are 19.81 percent for Alberta and 24.56 percent for Ontario. When fiscal circumstances allow tax cuts, Alberta could further improve its investment climate with BET reforms. To shape investor expectations, the province’s government should announce future BET rate reductions in advance, progressively reducing the BET rate to parity with the RET rate.
As for British Columbia, our METR estimates reveal a competitive disadvantage for that province relative to Ontario. This disadvantage is not due
to a difference in BET policy between the two provinces (this difference is in B.C.’s favour), but rather is due to B.C.’s reversion to the economically inefficient(pre-HST)salestax.Figure5(appearingabove in an earlier section) shows that if Ontario reverted to its pre-HST sales tax, 11.4 percentage points would be added to the METR. Our estimate for B.C.’s reversion, at 10.01 percentage points, is similar. When fiscal circumstances allow tax cuts, B.C. should mitigate the negative impact of sales tax reversion by implementing BET cuts – first by eliminating inflation-indexing of BET revenue, and then progressively reducing BET rates to parity with the average residential education rate.
Based on our METR estimates, we conclude that governments should include the BET in published METR estimates, such as the estimates published routinely in Ontario budgets. Leaving out the BET means missing a large part of the tax burden investors pay. It thus leads governments to underestimate the negative impacts on investment stemming from their tax systems, and it causes governments to defer – perhaps indefinitely – tax reforms needed to mitigate those negative impacts.
2 7 Commentary 368
References
Alberta. 2010. “Guide to Equalized Assessment in Alberta.” Ministry of Municipal Affairs.
–––––. 2012. 2012 Alberta Budget.Bird, Richard M., Enid Slack, and Almos Tassonyi.
2012. “A Tale of Two Taxes: Property Tax Reform in Ontario.” The Lincoln Institute of Land Policy, Cambridge, Massachusetts.
Boadway, Robin, Neil Bruce and Jack Mintz. 1984. “Taxation, Inflation and the Marginal Effective Tax Rate on Capital in Canada.” Canadian Journal of Economics 17: 62-79.
British Columbia. 2012. 2012 British Columbia Budget.Canada. 2012. “Federal and Provincial Personal Income
Tax Rates and Corporate Income Tax Rates.” Canada Revenue Agency http://www.cra-arc.gc.ca/tx/llrts/menu-eng.html
CityofToronto.2004.“2004CurrentValueAssessment(CVA)ChangesandTaxPolicyOptions.”ReporttoPolicy and Finance Committee, January 7.
Commission on the Reform of Ontario’s Public Services. 2012. Final Report.
Dachis, Benjamin, and William B.P. Robson. 2012. “From Living Well to Working Well: Raising Canada’s Performance in Non-residential Investment.” E-Brief. Toronto: C.D. Howe Institute. August.
Fischel, William A. 1975. “Fiscal and Environmental Considerations in the Location of Firms in Suburban Communities” in Fiscal Zoning and Land Use Controls. Eds: Edwin S. Mills and Wallace E. Oates. Lexington MA: Heath-Lexington Books, pp.119-173.
––––––––––. 1976. “An Evaluation of Proposals for Metropolitan Sharing of Commercial and Industrial Property Tax Base.” Journal of Urban Economics 3: 253-63.
Halton Regional Municipality. 2010. “2010 Tax Policies.” Report to Administration and Finance Committee No. CS-25-10, April 21.
HemsonConsultingLtd.2003.“TorontoOfficeBuildings: Analysis of Municipal Revenue and Cost.” Toronto: Canadian Institute of Public and Private Real Estate Companies (now the Real Property Association of Canada).
King, Mervyn, and Don Fullerton. 1984. “The Taxation of Income from Capital.” Chicago: University of Chicago Press.
Kitchen, Harry, and Enid Slack. 1993. “Business Property Taxation.” Government and Competitiveness Project Discussion Paper No. 93-24. Kingston: Queen’s University School of Policy Studies.
Lee, Nai Jia, and William C. Wheaton. 2010. “Property Taxes Under ‘Classification’: Why do Firms Pay More?” Working Paper 10-10, Massachusetts Institute of Technology Department of Economics.
McKenzie, Kenneth, Mario Mansour, and Ariane Brûlé. 1998. “The Calculation of Marginal Effective Tax Rates.” Working Paper 97-15. Ottawa: Technical Committee on Business Taxation, Department of Finance.
Mintz, Jack. 1990. “Corporate Tax Holidays and Investment.” The World Bank Economic Review, 4(1): 81-102.
–––––. 2009. “Ontario’s Bold Move to Create Jobs and Growth: Impact of the 2009 Ontario Budget and Other Recent Tax Measures on Investment, Jobs and Incomes.” Calgary: University of Calgary SchoolofPublicPolicyCommuniqué,Vol.1,Issue4(November).
Mintz, Jack, and Tom Roberts. 2006. “Running on Empty: A Proposal to Improve City Finances.” Commentary 226. Toronto: C.D. Howe Institute. February.
MMKConsulting.2007.“CityofVancouverConsumption of Tax-Supported Municipal Services”,Volume1–MainReport.”Vancouver:FinancialPlanningandTreasury,CityofVancouver.
Nowlan, David. 2001. “A Model of Development Timing”. University of Toronto: http://homes.chass.utoronto.ca/~nowlan/papers/papers.htm.
2 8
Ontario. 1998. 1998 Ontario Budget.–––––. 2003. 2003 Ontario Budget.–––––. 2004. 2004 Ontario Budget.–––––. 2006. 2006 Ontario Budget.–––––. 2007. 2007 Ontario Budget.–––––. 2011. 2011 Ontario Budget.–––––. 2012. 2012 Ontario Budget.–––––. 2012. “Municipal Financial Information
Return.” Ministry of Municipal Affairs and Housing. Available online at: http://csconramp.mah.gov.on.ca/fir/welcome.htm. At time of writing Provincial Summary figures are available for years up to and including 2010.
Royal Commission on National Passenger Transportation. 1992. Final Report.
Smart, Michael. 2012. “The Reform of Business Property Tax in Ontario: An Evaluation.” IMFG Papers on Municipal Finance and Governance No. 10. Toronto: Institute on Municipal Finance and Governance, Munk School of Global Affairs, University of Toronto.
Witmer, Jonathan. 2010. “Trends in Issuance: Underlying Factors and Implications.” Bank of Canada.
November 2012 Schwanen, Daniel. “Speed Dating or Serious Courtship? Canada and Foreign State-Owned Enterprises.” C.D. Howe Institute E-Brief.November 2012 Johnson, David R. “Are Middle Schools Good for Student Academic Achievement? Evidence from Ontario.” C.D. Howe Institute E-Brief.November 2012 Blomqvist, Åke, and Colin Busby. Long-Term Care for the Elderly: Challenges and Policy Options. C.D. Howe Institute Commentary 367.November 2012 Robson, William B.P., and Alexandre Laurin. “Federal Employee Pension Reforms: First Steps – on a Much Longer Journey.” C.D. Howe Institute E-Brief.October 2012 Cross, Philip, and Philippe Bergevin. Turning Points: Business Cycles in Canada since 1926. C.D. Howe Institute Commentary 366.October 2012 Blomqvist, Åke, and Colin Busby. How to Pay Family Doctors: Why “Pay per Patient” is Better Than Fee for Service. C.D. Howe Institute Commentary 365.October 2012 Dachis, Benjamin. Stuck in Place: The Effect of Land Transfer Taxes on Housing Transactions. C.D. Howe Institute Commentary 364.October 2012 Laurin, Alexandre. “Tuer la poule aux oeufs d’or : Les impacts des hausses d’impôt proposées au Québec.” C.D. Howe Institute E-Brief.September 2012 Bergevin, Philippe, and William B.P. Robson. More RRBs, Please! Why Ottawa Should Issue More Inflation-Indexed Bonds. C.D. Howe Institute Commentary 363. September 2012 Fancy, Tariq. “Can Venture Capital Foster Innovation in Canada? Yes, but Certain Types of Venture Capital Are Better Than Others.” C.D. Howe Institute E-Brief.September 2012 Bergevin, Philippe. Housing Bubbles and the Consumer Price Index: A Proposal for a Better Inflation Indicator. C.D. Howe Institute Commentary 362. September 2012 Longworth, David. Combatting the Dangers Lurking in the Shadows: The Macroprudential Regulation of Shadow Banking. C.D. Howe Institute Commentary 361. August 2012 Herman, Lawrence L. The New Multilateralism: The Shift to Private Global Regulation. C.D. Howe Institute Commentary 360.
Support the InstituteFor more information on supporting the C.D. Howe Institute’s vital policy work, through charitable giving or membership, please go to www.cdhowe.org or call 416-865-1904. Learn more about the Institute’s activities and how to make a donation at the same time. You will receive a tax receipt for your gift.
A Reputation for Independent, Nonpartisan ResearchThe C.D. Howe Institute’s reputation for independent, reasoned and relevant public policy research of the highest quality is its chief asset, and underpins the credibility and effectiveness of its work. Independence and nonpartisanship are core Institute values that inform its approach to research, guide the actions of its professional staff and limit the types of financial contributions that the Institute will accept.
For our full Independence and Nonpartisanship Policy go to www.cdhowe.org.
Recent C.D. Howe Institute Publications

C.D
. HO
WE
Ins
tit
ut
e
67 Yonge Street, Suite 300,Toronto, O
ntarioM
5E 1J8