Embed Size (px)
Citation preview
Hidden Unemployment and Older Male Workers
Martin O’Brien
WP 04-02
February 2004
University of Wollongong Economics Working Paper Series 2004 http://www.uow.edu.au/commerce/econ/wpapers.html
Hidden Unemployment and Older Male Workers
Dr Martin J. O’Brien
ABSTRACT
A number of policy reforms have recently been announced by the Commonwealth government to encourage greater labour force participation by older people in the context of an ageing society. These policy reforms are generally supply side in orientation such as the removal of the Mature Age Allowance, or restrictions to the Disability Support Pension. In this paper it is argued that these pensions have historically been used to accommodate otherwise unemployed older male workers. A number of methods are used to quantify the level of hidden unemployment within the older male population over recent decades. Estimates of adjusted unemployment rates, which include hidden as well as official unemployment, reveal a very dramatic picture of unutilised older male labour beneath relatively modest official unemployment rates. It is argued that without complementary employment policy addressing the labour demand side these policy reforms will achieve little except to reveal the previously high levels of hidden unemployment in official unemployment statistics.
1
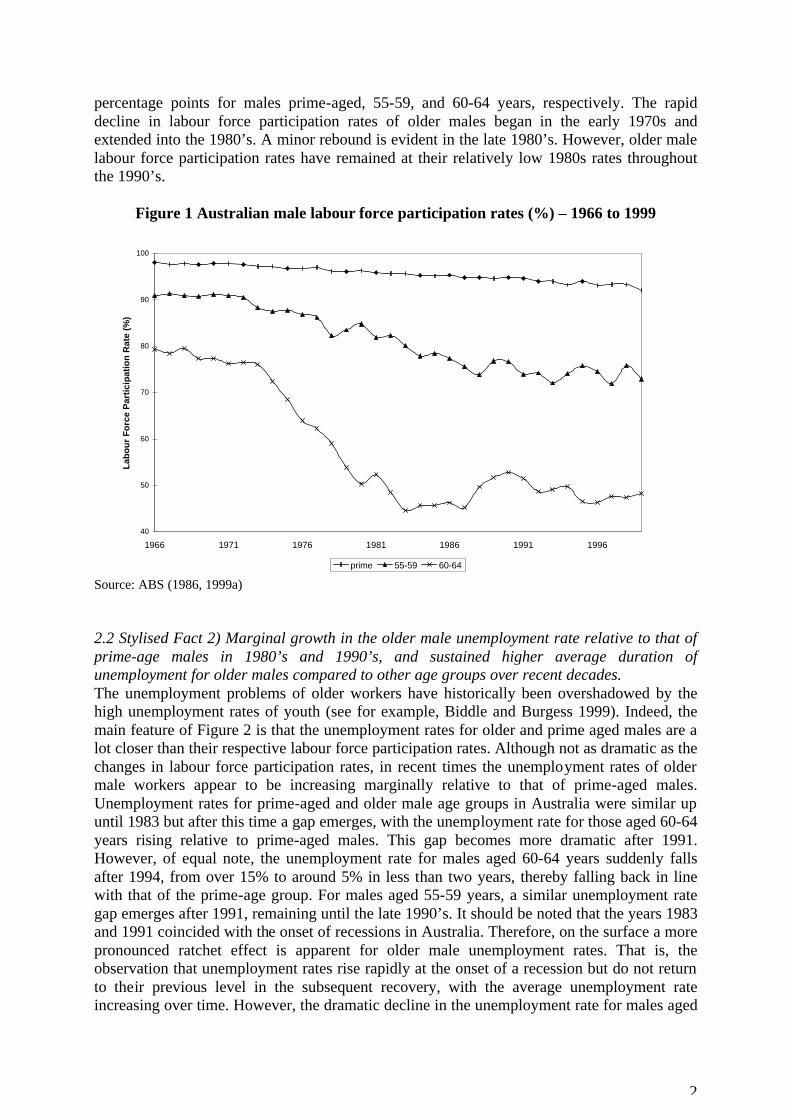
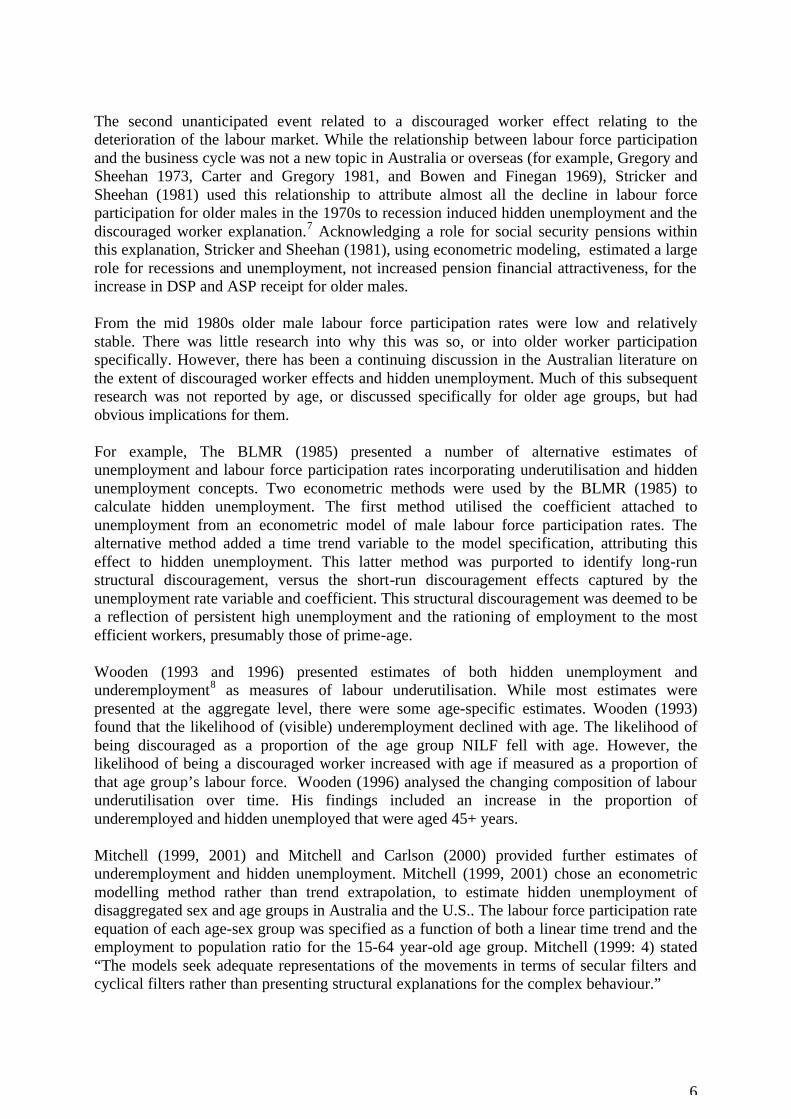
1. Introduction A number of recent Commonwealth government policy reforms have sought to increase the labour force participation of older people aged 55 to 64 years in the face of an ageing society (for example DFaCS 2000a, 2001, 2002a, 2002b, Treasury 2004, and House of Representatives 2000). As such, recent attempts have been made to restrict access to various social security pensions such as the Disability Support Pension (DSP) and Mature Age Allowance (MAA) that have traditionally accommodated older males not in the labour force. Other policies put forth are designed to encourage training and non-standard employment of older people. These policies can be largely characterised as supply side, affecting the individual’s budget constraint and (labour) marketable skills. No employment subsidies, job creation or other demand side policies for older people have been foreshadowed. O’Brien’s (2003) empirical analysis of micro data, based on the orthodox theory of labour supply, failed to adequately explain recent trends in the labour force participation rate of older males. Furthermore, other analyses conducted by O’Brien (2001a and 2001b) suggest that findings from models based upon aggregate labour market explanations, especially those incorporating labour force discouragement variables, can account for the majority of the stylised facts concerning the labour force participation rate and social security pension receipt of older males in recent decades. Findings from this research imply that large pools of hidden unemployment may be concealed beneath relatively low official unemployment rates. With this in mind, a number of methods are used within this paper to estimate total (official + hidden) unemployment for older males for the period 1979 to 1999. The results have implications for the likely success of policy reforms aimed at addressing an ageing society. A brief review of relevant statistics, literature and policy reforms are contained in Sections 2 to 4. Results obtained from econometric models of the labour force participation rate and social security use rate by older males are presented in Sections 5 and 6. Various methods used to calculate hidden and total unemployment for older males are explained in Section 7, followed by the presentation of estimates in Section 8. Finally, the implications of the findings for ageing society policy reforms are explored in Section 9. 2. Stylised facts of older male workers The set of stylised facts presented below were originally published in O’Brien (1999) and are broadly consistent with the research findings of VandenHeuval (1999).1 It is evident that a number of changes to labour force participation patterns of older males have occurred over recent decades. 2.1 The decline in labour force participation rates of older males during the 1970’s and 1980’s, and their stability at a low level in the 1990’s. A marked trend in Australian and international labour markets over recent decades has been the decline in labour force participation rates of older males (for example Merrilees 1982, Hughes 1984 and Stille 1999). In Australia at least, this trend is in contrast to generally increasing labour force participation rates for older females (O’Brien 2000a). It is shown in Figure 1 that while there has been a decline in labour force participation rates over time for all male age groups presented, this decline appears to increase with age group. The decrease in labour force participation rates from 1966 to 1999 is equal to six, eighteen and thirty one
2
percentage points for males prime-aged, 55-59, and 60-64 years, respectively. The rapid decline in labour force participation rates of older males began in the early 1970s and extended into the 1980’s. A minor rebound is evident in the late 1980’s. However, older male labour force participation rates have remained at their relatively low 1980s rates throughout the 1990’s.
Figure 1 Australian male labour force participation rates (%) – 1966 to 1999
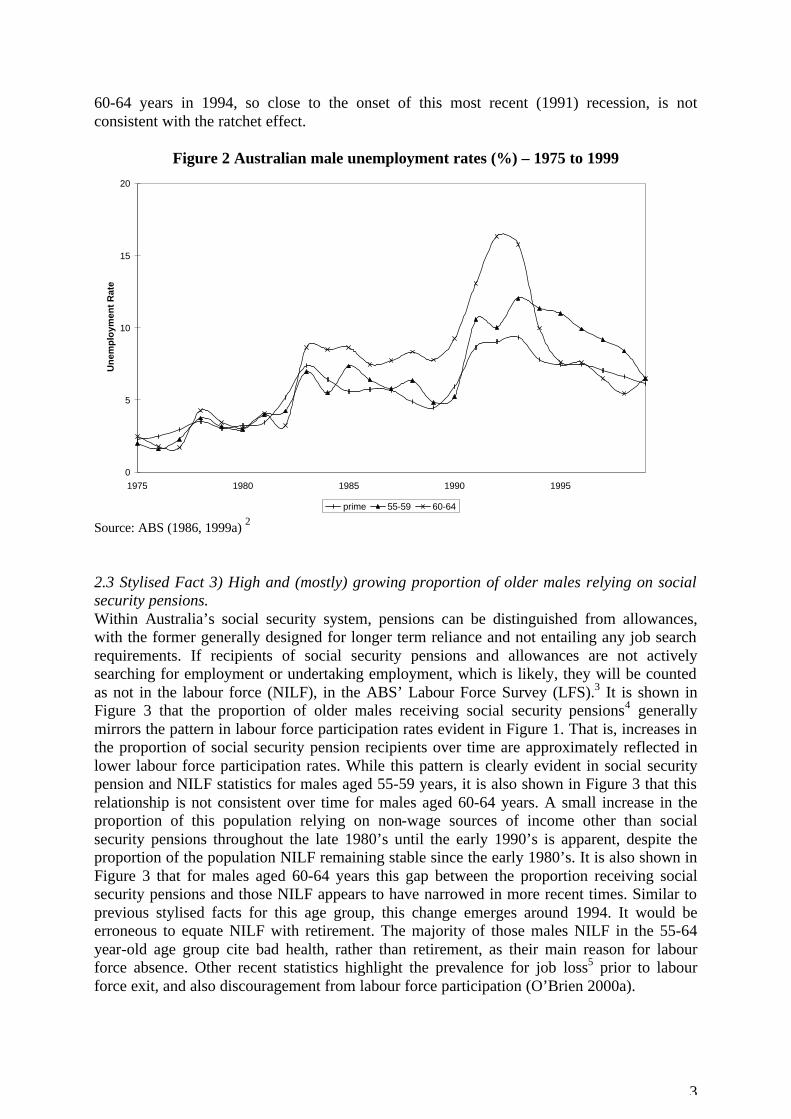
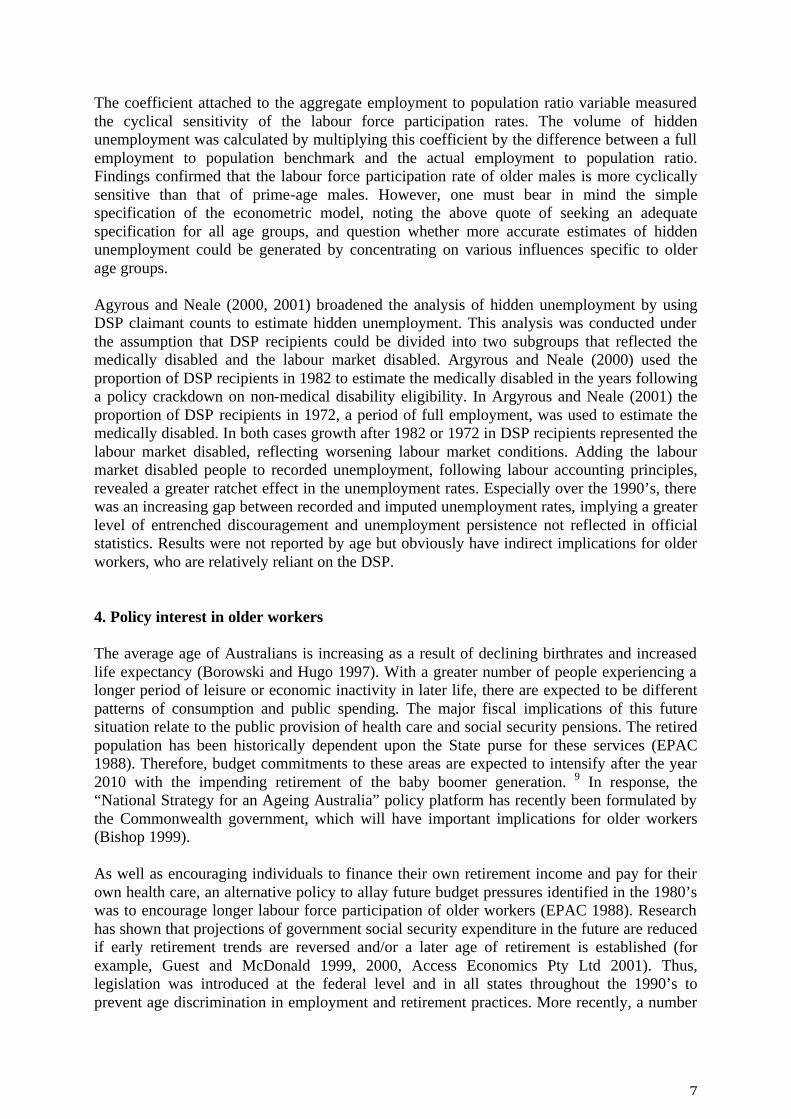
Source: ABS (1986, 1999a) 2.2 Stylised Fact 2) Marginal growth in the older male unemployment rate relative to that of prime-age males in 1980’s and 1990’s, and sustained higher average duration of unemployment for older males compared to other age groups over recent decades. The unemployment problems of older workers have historically been overshadowed by the high unemployment rates of youth (see for example, Biddle and Burgess 1999). Indeed, the main feature of Figure 2 is that the unemployment rates for older and prime aged males are a lot closer than their respective labour force participation rates. Although not as dramatic as the changes in labour force participation rates, in recent times the unemployment rates of older male workers appear to be increasing marginally relative to that of prime-aged males. Unemployment rates for prime-aged and older male age groups in Australia were similar up until 1983 but after this time a gap emerges, with the unemployment rate for those aged 60-64 years rising relative to prime-aged males. This gap becomes more dramatic after 1991. However, of equal note, the unemployment rate for males aged 60-64 years suddenly falls after 1994, from over 15% to around 5% in less than two years, thereby falling back in line with that of the prime-age group. For males aged 55-59 years, a similar unemployment rate gap emerges after 1991, remaining until the late 1990’s. It should be noted that the years 1983 and 1991 coincided with the onset of recessions in Australia. Therefore, on the surface a more pronounced ratchet effect is apparent for older male unemployment rates. That is, the observation that unemployment rates rise rapidly at the onset of a recession but do not return to their previous level in the subsequent recovery, with the average unemployment rate increasing over time. However, the dramatic decline in the unemployment rate for males aged
40
50
60
70
80
90
100
1966 1971 1976 1981 1986 1991 1996
La
bo
ur
Fo
rce
Pa
rtic
ipa
tio
n R
ate
(%
)
prime 55-59 60-64
3
60-64 years in 1994, so close to the onset of this most recent (1991) recession, is not consistent with the ratchet effect.
Figure 2 Australian male unemployment rates (%) – 1975 to 1999
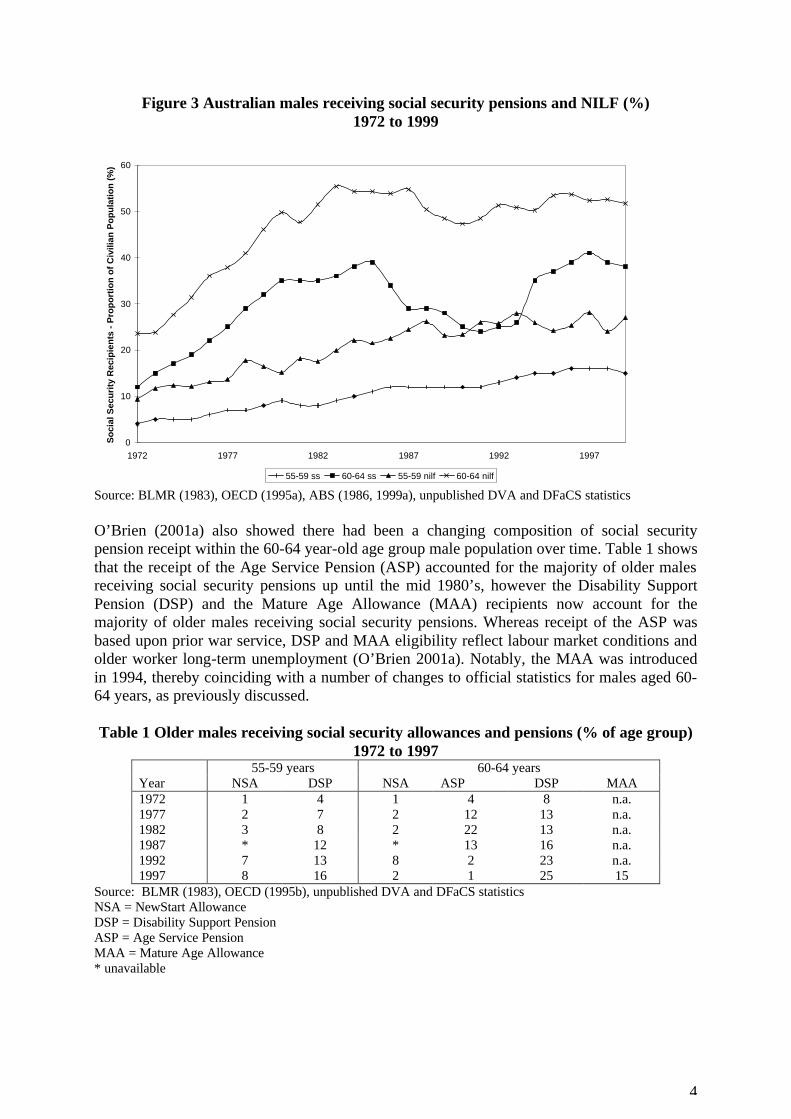
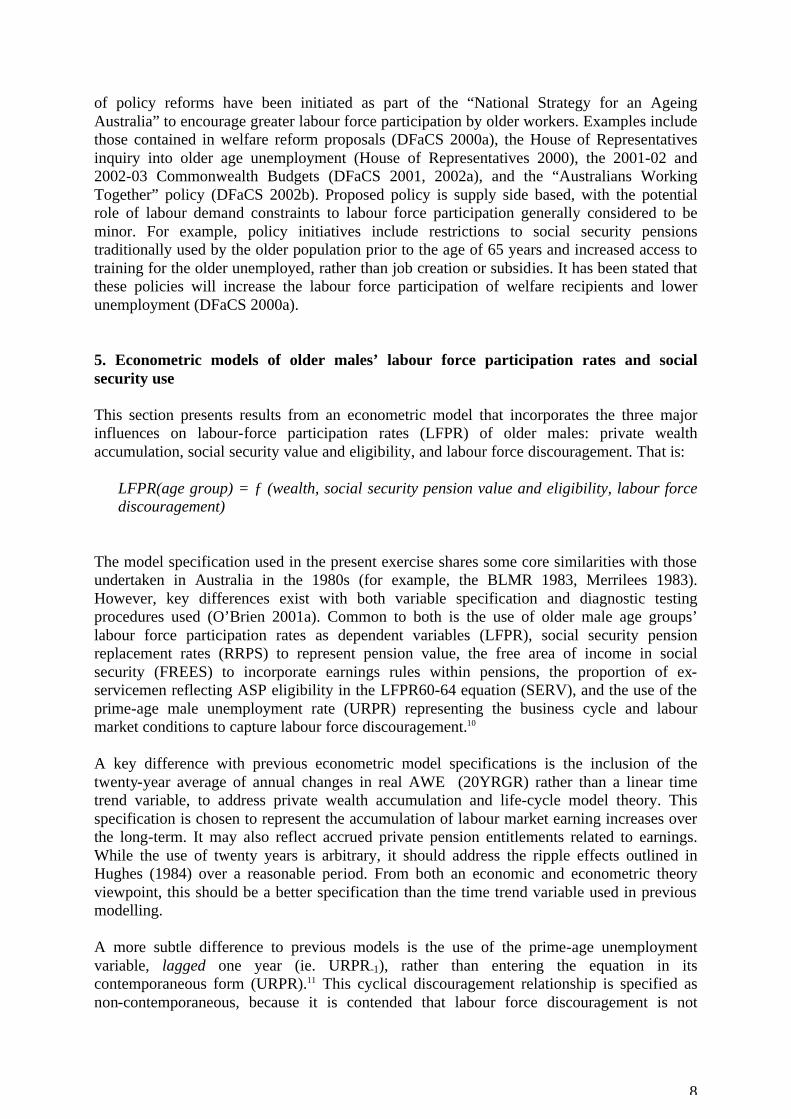
Source: ABS (1986, 1999a) 2 2.3 Stylised Fact 3) High and (mostly) growing proportion of older males relying on social security pensions. Within Australia’s social security system, pensions can be distinguished from allowances, with the former generally designed for longer term reliance and not entailing any job search requirements. If recipients of social security pensions and allowances are not actively searching for employment or undertaking employment, which is likely, they will be counted as not in the labour force (NILF), in the ABS’ Labour Force Survey (LFS).3 It is shown in Figure 3 that the proportion of older males receiving social security pensions4 generally mirrors the pattern in labour force participation rates evident in Figure 1. That is, increases in the proportion of social security pension recipients over time are approximately reflected in lower labour force participation rates. While this pattern is clearly evident in social security pension and NILF statistics for males aged 55-59 years, it is also shown in Figure 3 that this relationship is not consistent over time for males aged 60-64 years. A small increase in the proportion of this population relying on non-wage sources of income other than social security pensions throughout the late 1980’s until the early 1990’s is apparent, despite the proportion of the population NILF remaining stable since the early 1980’s. It is also shown in Figure 3 that for males aged 60-64 years this gap between the proportion receiving social security pensions and those NILF appears to have narrowed in more recent times. Similar to previous stylised facts for this age group, this change emerges around 1994. It would be erroneous to equate NILF with retirement. The majority of those males NILF in the 55-64 year-old age group cite bad health, rather than retirement, as their main reason for labour force absence. Other recent statistics highlight the prevalence for job loss5 prior to labour force exit, and also discouragement from labour force participation (O’Brien 2000a).
0
5
10
15
20
1975 1980 1985 1990 1995
Un
em
plo
ym
en
t R
ate
prime 55-59 60-64
4
Figure 3 Australian males receiving social security pensions and NILF (%) 1972 to 1999
Source: BLMR (1983), OECD (1995a), ABS (1986, 1999a), unpublished DVA and DFaCS statistics O’Brien (2001a) also showed there had been a changing composition of social security pension receipt within the 60-64 year-old age group male population over time. Table 1 shows that the receipt of the Age Service Pension (ASP) accounted for the majority of older males receiving social security pensions up until the mid 1980’s, however the Disability Support Pension (DSP) and the Mature Age Allowance (MAA) recipients now account for the majority of older males receiving social security pensions. Whereas receipt of the ASP was based upon prior war service, DSP and MAA eligibility reflect labour market conditions and older worker long-term unemployment (O’Brien 2001a). Notably, the MAA was introduced in 1994, thereby coinciding with a number of changes to official statistics for males aged 60-64 years, as previously discussed. Table 1 Older males receiving social security allowances and pensions (% of age group)
1972 to 1997 55-59 years 60-64 years Year NSA DSP NSA ASP DSP MAA 1972 1 4 1 4 8 n.a. 1977 2 7 2 12 13 n.a. 1982 3 8 2 22 13 n.a. 1987 * 12 * 13 16 n.a. 1992 7 13 8 2 23 n.a. 1997 8 16 2 1 25 15
Source: BLMR (1983), OECD (1995b), unpublished DVA and DFaCS statistics NSA = NewStart Allowance DSP = Disability Support Pension ASP = Age Service Pension MAA = Mature Age Allowance * unavailable
0
10
20
30
40
50
60
1972 1977 1982 1987 1992 1997
So
cia
l S
ec
uri
ty R
ec
ipie
nts
- P
rop
ort
ion
of
Civ
ilia
n P
op
ula
tio
n (
%)
55-59 ss 60-64 ss 55-59 nilf 60-64 nilf
5
3. Relevant literature It was previously noted in Stylised Fact 1 that from the mid 1970’s to the mid 1980’s the labour force participation rates of older males declined substantially, a phenomenon that was not experienced previously in Australia. This decline was the focus of initial research in the early to mid 1980’s into older worker labour force issues. The BLMR (1983), Hughes (1984), and Merrilees (1986) provide summaries of the main debates addressed in this literature. Stricker and Sheehan (1981), Merrilees (1983), Miller (1983) and the BLMR (1983) provided quantitative estimates of various influences upon labour force participation rates of older males. Merrilees (1986) summarised the literature of competing theories of the economic determinants of older male labour force participation from this era. He claimed (1986: 220):
In summary, a consensus is at last emerging which emphasises the life cycle private wealth effects as the key to the long term trend to early retirement, though not necessarily the short run (1973-76) acceleration in such.
The explanatory framework was clearly established and debate focused on the relative contribution of three factors in explaining declining labour force participation rates of older males. The factors were a) increased private wealth and the choice of earlier (anticipated) substitution of work for
leisure; b) increased availability and financial attractiveness of social security pensions; and c) the discouraged worker hypothesis and hidden unemployment. The first theme reflected the application of a lifecycle model of labour force participation under conditions of certainty, whereby more recent cohorts of older people with greater private wealth, were able to afford to retire earlier. Hughes (1984: 7) commented that retirement trends were the result of past accumulation of successive waves of real wage increases sending “stored-up ripples in older worker participation rates many years later.” Rather than an immediate income effect from an increase in wages, an intertemporal relationship was asserted whereby wage increases over time were effectively saved and used to purchase leisure at an earlier retirement age. Miller (1983) emphasised the forward looking aspect of the lifecycle model under conditions of certainty, via retirement planning and expectations, in explaining trends in the labour force participation rate of males aged 60-64 years from 1973 to 1983. He claimed that the decline in older male labour force participation rates throughout the 1970’s to the early 1980’s reflected lifecycle planning decisions taken prior to 1973. Other researchers emphasised two unanticipated events of the 1970’s as alternative explanations of changing trends in the labour force participation rate of older males. The first of these was the increase in availability and financial attractiveness of social security pensions. Merrilees (1982) calculated that nearly all of the decline in the labour force participation rate of males aged 55-59 years in the period 1973 to 1980 was the result of greater receipt of the Invalid (DSP) pension.6 Furthermore, of the twenty six percentage point decline in labour force participation rates of males aged 60-64 years between 1973 and 1980, Merrilees (1982) calculated that increased receipt of the Age Service Pension (ASP) accounted for fifteen percentage points and was the dominant explanatory force, with the growth of DSP accounting for a further six percentage points.
6
The second unanticipated event related to a discouraged worker effect relating to the deterioration of the labour market. While the relationship between labour force participation and the business cycle was not a new topic in Australia or overseas (for example, Gregory and Sheehan 1973, Carter and Gregory 1981, and Bowen and Finegan 1969), Stricker and Sheehan (1981) used this relationship to attribute almost all the decline in labour force participation for older males in the 1970s to recession induced hidden unemployment and the discouraged worker explanation.7 Acknowledging a role for social security pensions within this explanation, Stricker and Sheehan (1981), using econometric modeling, estimated a large role for recessions and unemployment, not increased pension financial attractiveness, for the increase in DSP and ASP receipt for older males. From the mid 1980s older male labour force participation rates were low and relatively stable. There was little research into why this was so, or into older worker participation specifically. However, there has been a continuing discussion in the Australian literature on the extent of discouraged worker effects and hidden unemployment. Much of this subsequent research was not reported by age, or discussed specifically for older age groups, but had obvious implications for them. For example, The BLMR (1985) presented a number of alternative estimates of unemployment and labour force participation rates incorporating underutilisation and hidden unemployment concepts. Two econometric methods were used by the BLMR (1985) to calculate hidden unemployment. The first method utilised the coefficient attached to unemployment from an econometric model of male labour force participation rates. The alternative method added a time trend variable to the model specification, attributing this effect to hidden unemployment. This latter method was purported to identify long-run structural discouragement, versus the short-run discouragement effects captured by the unemployment rate variable and coefficient. This structural discouragement was deemed to be a reflection of persistent high unemployment and the rationing of employment to the most efficient workers, presumably those of prime-age. Wooden (1993 and 1996) presented estimates of both hidden unemployment and underemployment8 as measures of labour underutilisation. While most estimates were presented at the aggregate level, there were some age-specific estimates. Wooden (1993) found that the likelihood of (visible) underemployment declined with age. The likelihood of being discouraged as a proportion of the age group NILF fell with age. However, the likelihood of being a discouraged worker increased with age if measured as a proportion of that age group’s labour force. Wooden (1996) analysed the changing composition of labour underutilisation over time. His findings included an increase in the proportion of underemployed and hidden unemployed that were aged 45+ years. Mitchell (1999, 2001) and Mitchell and Carlson (2000) provided further estimates of underemployment and hidden unemployment. Mitchell (1999, 2001) chose an econometric modelling method rather than trend extrapolation, to estimate hidden unemployment of disaggregated sex and age groups in Australia and the U.S.. The labour force participation rate equation of each age-sex group was specified as a function of both a linear time trend and the employment to population ratio for the 15-64 year-old age group. Mitchell (1999: 4) stated “The models seek adequate representations of the movements in terms of secular filters and cyclical filters rather than presenting structural explanations for the complex behaviour.”
7
The coefficient attached to the aggregate employment to population ratio variable measured the cyclical sensitivity of the labour force participation rates. The volume of hidden unemployment was calculated by multiplying this coefficient by the difference between a full employment to population benchmark and the actual employment to population ratio. Findings confirmed that the labour force participation rate of older males is more cyclically sensitive than that of prime-age males. However, one must bear in mind the simple specification of the econometric model, noting the above quote of seeking an adequate specification for all age groups, and question whether more accurate estimates of hidden unemployment could be generated by concentrating on various influences specific to older age groups. Agyrous and Neale (2000, 2001) broadened the analysis of hidden unemployment by using DSP claimant counts to estimate hidden unemployment. This analysis was conducted under the assumption that DSP recipients could be divided into two subgroups that reflected the medically disabled and the labour market disabled. Argyrous and Neale (2000) used the proportion of DSP recipients in 1982 to estimate the medically disabled in the years following a policy crackdown on non-medical disability eligibility. In Argyrous and Neale (2001) the proportion of DSP recipients in 1972, a period of full employment, was used to estimate the medically disabled. In both cases growth after 1982 or 1972 in DSP recipients represented the labour market disabled, reflecting worsening labour market conditions. Adding the labour market disabled people to recorded unemployment, following labour accounting principles, revealed a greater ratchet effect in the unemployment rates. Especially over the 1990’s, there was an increasing gap between recorded and imputed unemployment rates, implying a greater level of entrenched discouragement and unemployment persistence not reflected in official statistics. Results were not reported by age but obviously have indirect implications for older workers, who are relatively reliant on the DSP. 4. Policy interest in older workers The average age of Australians is increasing as a result of declining birthrates and increased life expectancy (Borowski and Hugo 1997). With a greater number of people experiencing a longer period of leisure or economic inactivity in later life, there are expected to be different patterns of consumption and public spending. The major fiscal implications of this future situation relate to the public provision of health care and social security pensions. The retired population has been historically dependent upon the State purse for these services (EPAC 1988). Therefore, budget commitments to these areas are expected to intensify after the year 2010 with the impending retirement of the baby boomer generation. 9 In response, the “National Strategy for an Ageing Australia” policy platform has recently been formulated by the Commonwealth government, which will have important implications for older workers (Bishop 1999). As well as encouraging individuals to finance their own retirement income and pay for their own health care, an alternative policy to allay future budget pressures identified in the 1980’s was to encourage longer labour force participation of older workers (EPAC 1988). Research has shown that projections of government social security expenditure in the future are reduced if early retirement trends are reversed and/or a later age of retirement is established (for example, Guest and McDonald 1999, 2000, Access Economics Pty Ltd 2001). Thus, legislation was introduced at the federal level and in all states throughout the 1990’s to prevent age discrimination in employment and retirement practices. More recently, a number
8
of policy reforms have been initiated as part of the “National Strategy for an Ageing Australia” to encourage greater labour force participation by older workers. Examples include those contained in welfare reform proposals (DFaCS 2000a), the House of Representatives inquiry into older age unemployment (House of Representatives 2000), the 2001-02 and 2002-03 Commonwealth Budgets (DFaCS 2001, 2002a), and the “Australians Working Together” policy (DFaCS 2002b). Proposed policy is supply side based, with the potential role of labour demand constraints to labour force participation generally considered to be minor. For example, policy initiatives include restrictions to social security pensions traditionally used by the older population prior to the age of 65 years and increased access to training for the older unemployed, rather than job creation or subsidies. It has been stated that these policies will increase the labour force participation of welfare recipients and lower unemployment (DFaCS 2000a). 5. Econometric models of older males’ labour force participation rates and social security use This section presents results from an econometric model that incorporates the three major influences on labour-force participation rates (LFPR) of older males: private wealth accumulation, social security value and eligibility, and labour force discouragement. That is:
LFPR(age group) = ƒ (wealth, social security pension value and eligibility, labour force discouragement)
The model specification used in the present exercise shares some core similarities with those undertaken in Australia in the 1980s (for example, the BLMR 1983, Merrilees 1983). However, key differences exist with both variable specification and diagnostic testing procedures used (O’Brien 2001a). Common to both is the use of older male age groups’ labour force participation rates as dependent variables (LFPR), social security pension replacement rates (RRPS) to represent pension value, the free area of income in social security (FREES) to incorporate earnings rules within pensions, the proportion of ex-servicemen reflecting ASP eligibility in the LFPR60-64 equation (SERV), and the use of the prime-age male unemployment rate (URPR) representing the business cycle and labour market conditions to capture labour force discouragement.10 A key difference with previous econometric model specifications is the inclusion of the twenty-year average of annual changes in real AWE (20YRGR) rather than a linear time trend variable, to address private wealth accumulation and life-cycle model theory. This specification is chosen to represent the accumulation of labour market earning increases over the long-term. It may also reflect accrued private pension entitlements related to earnings. While the use of twenty years is arbitrary, it should address the ripple effects outlined in Hughes (1984) over a reasonable period. From both an economic and econometric theory viewpoint, this should be a better specification than the time trend variable used in previous modelling. A more subtle difference to previous models is the use of the prime-age unemployment variable, lagged one year (ie. URPR-1), rather than entering the equation in its contemporaneous form (URPR).11 This cyclical discouragement relationship is specified as non-contemporaneous, because it is contended that labour force discouragement is not
9
instantaneous, and older males who drop out of the labour force are likely to do so after initially passing through the unemployment queues first. For those in receipt of MAA, the non-contemporaneous relationship is explicitly incorporated into eligibility rules that specify that the individual must be unemployed for at least nine months. It is also alleged that older DSP recipients in Australia are likely to pass through the unemployment link first (for example, Cai 2001, Chalmers 2002). As such, NILF status, and the resulting effect on labour force participation rates, should occur after a period of unemployment. Even without access to social security pensions, cyclical discouragement is likely to be a delayed response to the labour market conditions captured by the prime-age unemployment rate. Another new feature adopted in the model is the incorporation of the influence of an alternative labour force discouragement variable, as suggested in Blöndal and Scarpetta (1998). This is included in the model as the proportion of prime-aged males within the working age male population (PRIMEPR). This influence is similar to the long-run labour force discouragement concept proposed by Standing (1978) and the BLMR (1983). The hypothesis that any increase in this proportion will crowd out older workers from participating in the labour market over time rests on two key assumptions. First, that prime-age workers are more attractive to employers than older workers. Second, employers are rationing available jobs to those most attractive under the labour market conditions of persistent excess labour supply. This represents a kind of labour demand constraint upon labour supply, or a form of discouraged worker effect and hidden unemployment, not directly related to the business cycle. In summary, the aforementioned URPR variable captures cyclical or short-run labour force discouragement, while the PRIMEPR variable captures the more entrenched long-run labour force discouragement. The estimated effects from these variables upon labour force participation rates are later used to calculate older male hidden unemployment. A number of social security pension eligibility dummy variables were also included to test various phases of DSP reforms. If successful, these reforms should reduce DSP claimants and increase the labour force participation rate. Furthermore, a dummy variable for the effect of the introduction of MAA in 1994 is included in the LFPR60-64 equation.12 If MAA introduction had a significant effect upon older male labour force participation rates it should have removed older males from the labour force previously receiving unemployment allowances and displaying unemployed labour force status. Another difference with previous models estimated in Australia is the longer time period under analysis. The longer time period should allow for more exact disentanglement of competing explanations and also allow for the identification of any structural breaks in the relationships, if any.
10
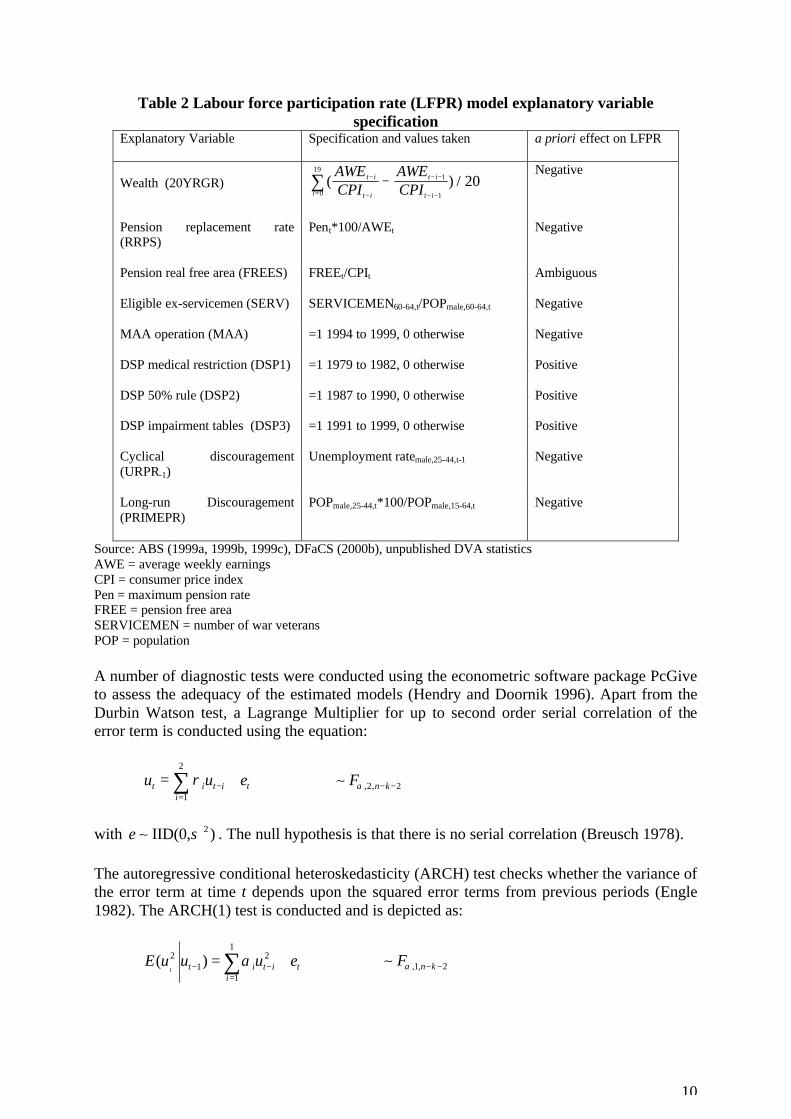
Table 2 Labour force participation rate (LFPR) model explanatory variable specification
Explanatory Variable Specification and values taken a priori effect on LFPR
Wealth (20YRGR)
( ) /AWECPI
AWECPI
t i
t ii
t i
t i
−
−=
− −
− −∑ −
0
191
1
20 Negative
Pension replacement rate (RRPS)
Pent*100/AWEt Negative
Pension real free area (FREES)
FREEt/CPIt Ambiguous
Eligible ex-servicemen (SERV)
SERVICEMEN60-64,t/POPmale,60-64,t Negative
MAA operation (MAA)
=1 1994 to 1999, 0 otherwise Negative
DSP medical restriction (DSP1)
=1 1979 to 1982, 0 otherwise Positive
DSP 50% rule (DSP2)
=1 1987 to 1990, 0 otherwise Positive
DSP impairment tables (DSP3)
=1 1991 to 1999, 0 otherwise Positive
Cyclical discouragement (URPR-1)
Unemployment ratemale,25-44,t-1 Negative
Long-run Discouragement (PRIMEPR)
POPmale,25-44,t*100/POPmale,15-64,t Negative
Source: ABS (1999a, 1999b, 1999c), DFaCS (2000b), unpublished DVA statistics AWE = average weekly earnings CPI = consumer price index Pen = maximum pension rate FREE = pension free area SERVICEMEN = number of war veterans POP = population A number of diagnostic tests were conducted using the econometric software package PcGive to assess the adequacy of the estimated models (Hendry and Doornik 1996). Apart from the Durbin Watson test, a Lagrange Multiplier for up to second order serial correlation of the error term is conducted using the equation:
2
1t i t i t
i
u u eρ −=
= +∑ ,2, 2n kFα − −∼
with 2IID(0, )e σ∼ . The null hypothesis is that there is no serial correlation (Breusch 1978). The autoregressive conditional heteroskedasticity (ARCH) test checks whether the variance of the error term at time t depends upon the squared error terms from previous periods (Engle 1982). The ARCH(1) test is conducted and is depicted as:
1
2 21
1
( )t t i t i t
i
E u u u eα− −=
= +∑ ,1, 2n kFα − −∼
11
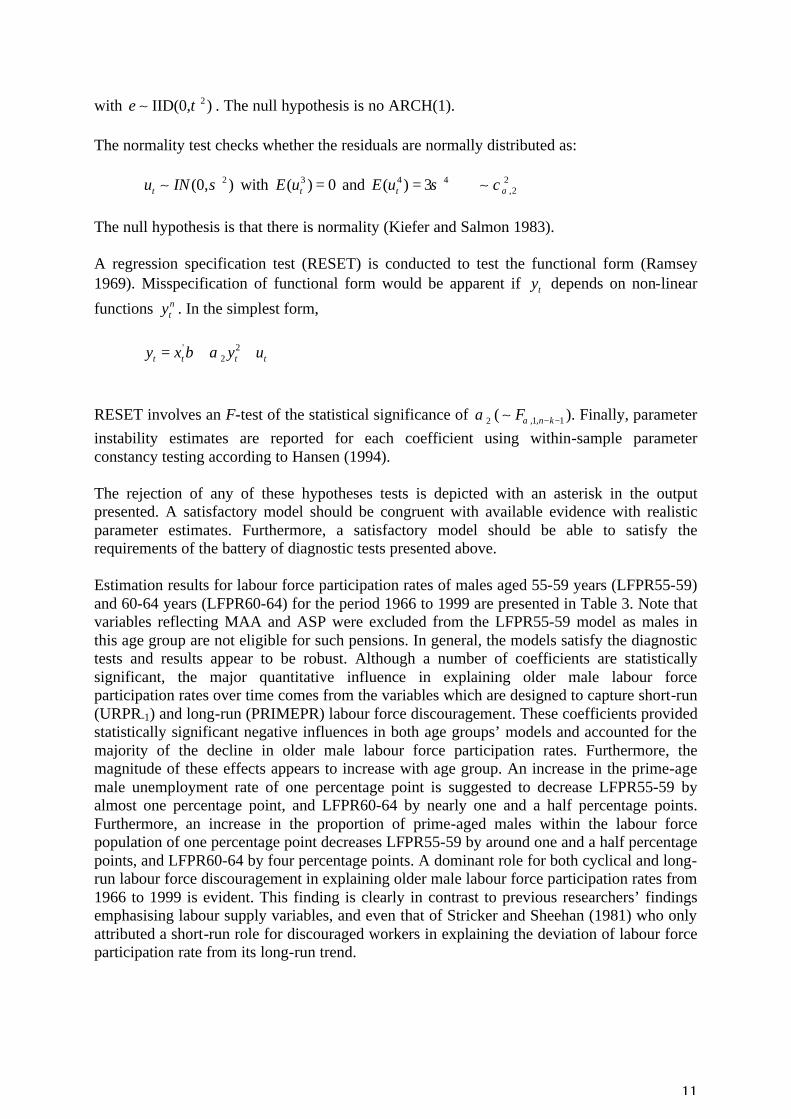
with 2IID(0, )e τ∼ . The null hypothesis is no ARCH(1). The normality test checks whether the residuals are normally distributed as: 2(0, )tu IN σ∼ with 3( ) 0tE u = and 4 4( ) 3tE u σ= 2
,2αχ∼
The null hypothesis is that there is normality (Kiefer and Salmon 1983). A regression specification test (RESET) is conducted to test the functional form (Ramsey 1969). Misspecification of functional form would be apparent if ty depends on non-linear
functions nty . In the simplest form,
' 2
2t t t ty x y uβ α= + +
RESET involves an F-test of the statistical significance of 2α ( ,1, 1n kFα − −∼ ). Finally, parameter
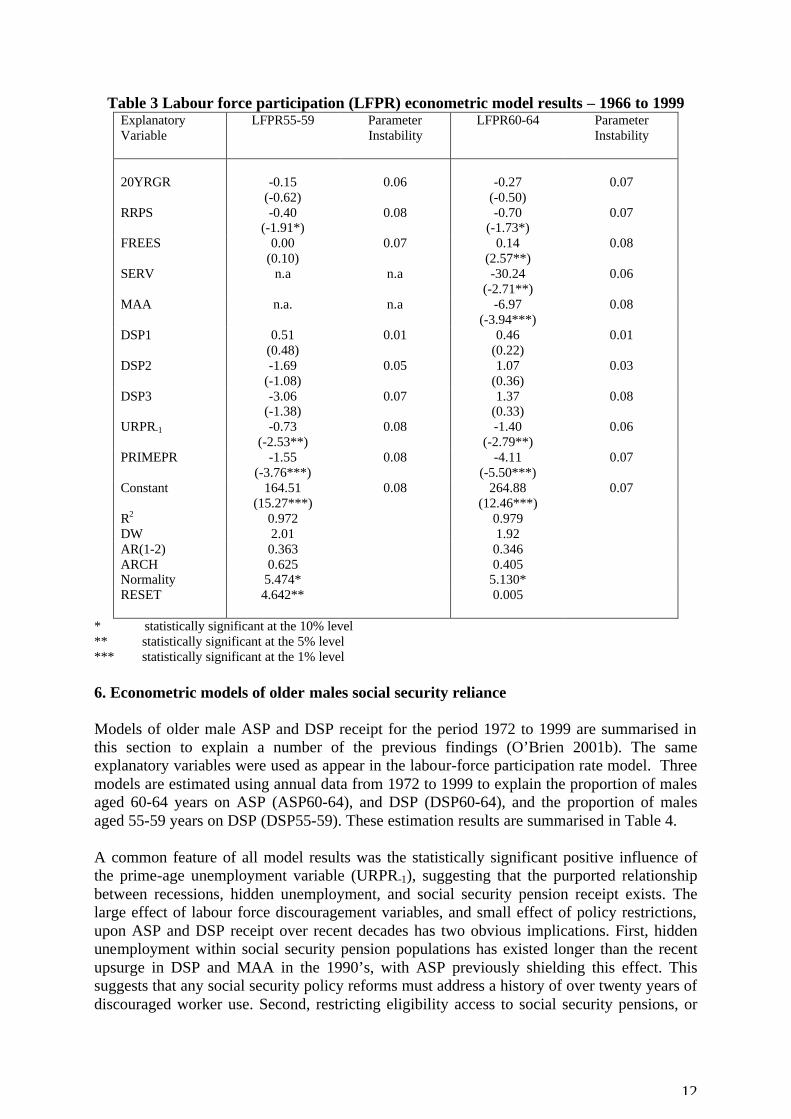
instability estimates are reported for each coefficient using within-sample parameter constancy testing according to Hansen (1994). The rejection of any of these hypotheses tests is depicted with an asterisk in the output presented. A satisfactory model should be congruent with available evidence with realistic parameter estimates. Furthermore, a satisfactory model should be able to satisfy the requirements of the battery of diagnostic tests presented above. Estimation results for labour force participation rates of males aged 55-59 years (LFPR55-59) and 60-64 years (LFPR60-64) for the period 1966 to 1999 are presented in Table 3. Note that variables reflecting MAA and ASP were excluded from the LFPR55-59 model as males in this age group are not eligible for such pensions. In general, the models satisfy the diagnostic tests and results appear to be robust. Although a number of coefficients are statistically significant, the major quantitative influence in explaining older male labour force participation rates over time comes from the variables which are designed to capture short-run (URPR-1) and long-run (PRIMEPR) labour force discouragement. These coefficients provided statistically significant negative influences in both age groups’ models and accounted for the majority of the decline in older male labour force participation rates. Furthermore, the magnitude of these effects appears to increase with age group. An increase in the prime-age male unemployment rate of one percentage point is suggested to decrease LFPR55-59 by almost one percentage point, and LFPR60-64 by nearly one and a half percentage points. Furthermore, an increase in the proportion of prime-aged males within the labour force population of one percentage point decreases LFPR55-59 by around one and a half percentage points, and LFPR60-64 by four percentage points. A dominant role for both cyclical and long-run labour force discouragement in explaining older male labour force participation rates from 1966 to 1999 is evident. This finding is clearly in contrast to previous researchers’ findings emphasising labour supply variables, and even that of Stricker and Sheehan (1981) who only attributed a short-run role for discouraged workers in explaining the deviation of labour force participation rate from its long-run trend.
12
Table 3 Labour force participation (LFPR) econometric model results – 1966 to 1999 Explanatory Variable
LFPR55-59 Parameter Instability
LFPR60-64 Parameter Instability
20YRGR
-0.15
(-0.62)
0.06
-0.27
(-0.50)
0.07
RRPS -0.40 (-1.91*)
0.08 -0.70 (-1.73*)
0.07
FREES 0.00 (0.10)
0.07 0.14 (2.57**)
0.08
SERV n.a n.a -30.24 (-2.71**)
0.06
MAA n.a. n.a -6.97 (-3.94***)
0.08
DSP1 0.51 (0.48)
0.01 0.46 (0.22)
0.01
DSP2 -1.69 (-1.08)
0.05 1.07 (0.36)
0.03
DSP3 -3.06 (-1.38)
0.07 1.37 (0.33)
0.08
URPR-1 -0.73 (-2.53**)
0.08 -1.40 (-2.79**)
0.06
PRIMEPR -1.55 (-3.76***)
0.08 -4.11 (-5.50***)
0.07
Constant 164.51 (15.27***)
0.08 264.88 (12.46***)
0.07
R2 0.972 0.979 DW 2.01 1.92 AR(1-2) 0.363 0.346 ARCH 0.625 0.405 Normality 5.474* 5.130* RESET 4.642** 0.005
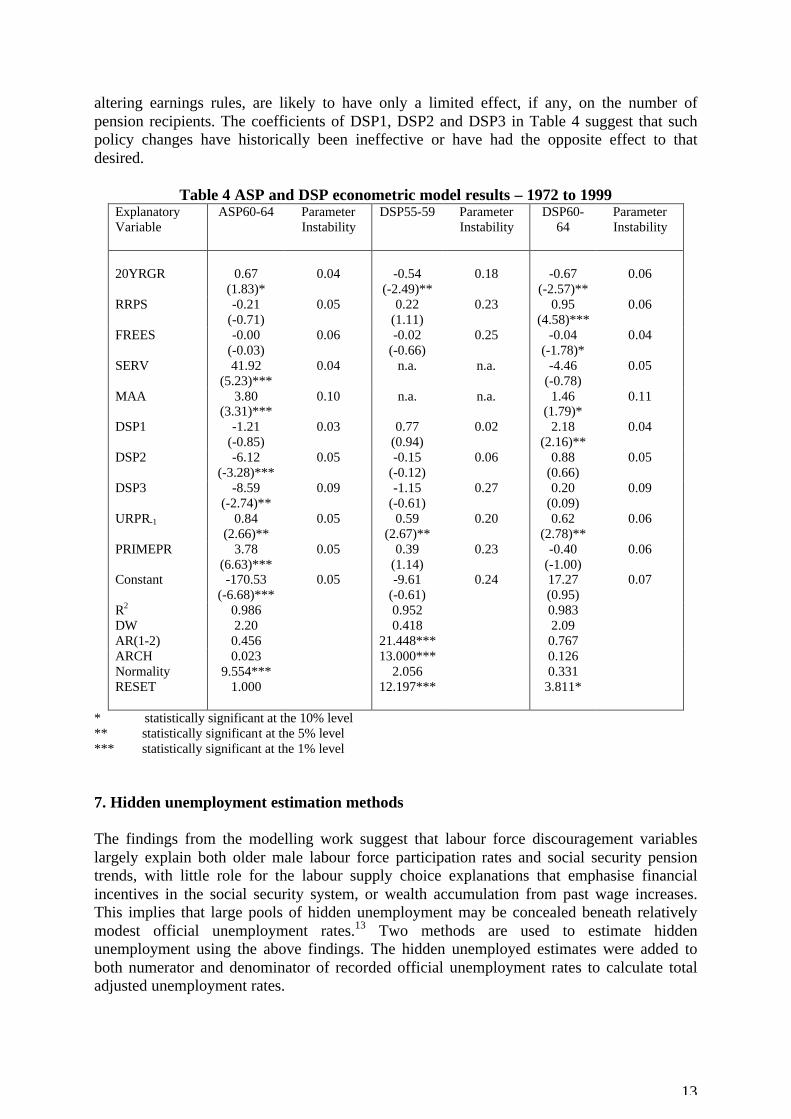
* statistically significant at the 10% level ** statistically significant at the 5% level *** statistically significant at the 1% level 6. Econometric models of older males social security reliance Models of older male ASP and DSP receipt for the period 1972 to 1999 are summarised in this section to explain a number of the previous findings (O’Brien 2001b). The same explanatory variables were used as appear in the labour-force participation rate model. Three models are estimated using annual data from 1972 to 1999 to explain the proportion of males aged 60-64 years on ASP (ASP60-64), and DSP (DSP60-64), and the proportion of males aged 55-59 years on DSP (DSP55-59). These estimation results are summarised in Table 4. A common feature of all model results was the statistically significant positive influence of the prime-age unemployment variable (URPR-1), suggesting that the purported relationship between recessions, hidden unemployment, and social security pension receipt exists. The large effect of labour force discouragement variables, and small effect of policy restrictions, upon ASP and DSP receipt over recent decades has two obvious implications. First, hidden unemployment within social security pension populations has existed longer than the recent upsurge in DSP and MAA in the 1990’s, with ASP previously shielding this effect. This suggests that any social security policy reforms must address a history of over twenty years of discouraged worker use. Second, restricting eligibility access to social security pensions, or
13
altering earnings rules, are likely to have only a limited effect, if any, on the number of pension recipients. The coefficients of DSP1, DSP2 and DSP3 in Table 4 suggest that such policy changes have historically been ineffective or have had the opposite effect to that desired.
Table 4 ASP and DSP econometric model results – 1972 to 1999 Explanatory Variable
ASP60-64 Parameter Instability
DSP55-59 Parameter Instability
DSP60-64
Parameter Instability
20YRGR
0.67
(1.83)*
0.04
-0.54
(-2.49)**
0.18
-0.67
(-2.57)**
0.06
RRPS -0.21 (-0.71)
0.05 0.22 (1.11)
0.23 0.95 (4.58)***
0.06
FREES -0.00 (-0.03)
0.06 -0.02 (-0.66)
0.25 -0.04 (-1.78)*
0.04
SERV 41.92 (5.23)***
0.04 n.a. n.a. -4.46 (-0.78)
0.05
MAA 3.80 (3.31)***
0.10 n.a. n.a. 1.46 (1.79)*
0.11
DSP1 -1.21 (-0.85)
0.03 0.77 (0.94)
0.02 2.18 (2.16)**
0.04
DSP2 -6.12 (-3.28)***
0.05 -0.15 (-0.12)
0.06 0.88 (0.66)
0.05
DSP3 -8.59 (-2.74)**
0.09 -1.15 (-0.61)
0.27 0.20 (0.09)
0.09
URPR-1 0.84 (2.66)**
0.05 0.59 (2.67)**
0.20 0.62 (2.78)**
0.06
PRIMEPR 3.78 (6.63)***
0.05 0.39 (1.14)
0.23 -0.40 (-1.00)
0.06
Constant -170.53 (-6.68)***
0.05 -9.61 (-0.61)
0.24 17.27 (0.95)
0.07
R2 0.986 0.952 0.983 DW 2.20 0.418 2.09 AR(1-2) 0.456 21.448*** 0.767 ARCH 0.023 13.000*** 0.126 Normality 9.554*** 2.056 0.331 RESET 1.000 12.197*** 3.811*
* statistically significant at the 10% level ** statistically significant at the 5% level *** statistically significant at the 1% level 7. Hidden unemployment estimation methods The findings from the modelling work suggest that labour force discouragement variables largely explain both older male labour force participation rates and social security pension trends, with little role for the labour supply choice explanations that emphasise financial incentives in the social security system, or wealth accumulation from past wage increases. This implies that large pools of hidden unemployment may be concealed beneath relatively modest official unemployment rates.13 Two methods are used to estimate hidden unemployment using the above findings. The hidden unemployed estimates were added to both numerator and denominator of recorded official unemployment rates to calculate total adjusted unemployment rates.
14
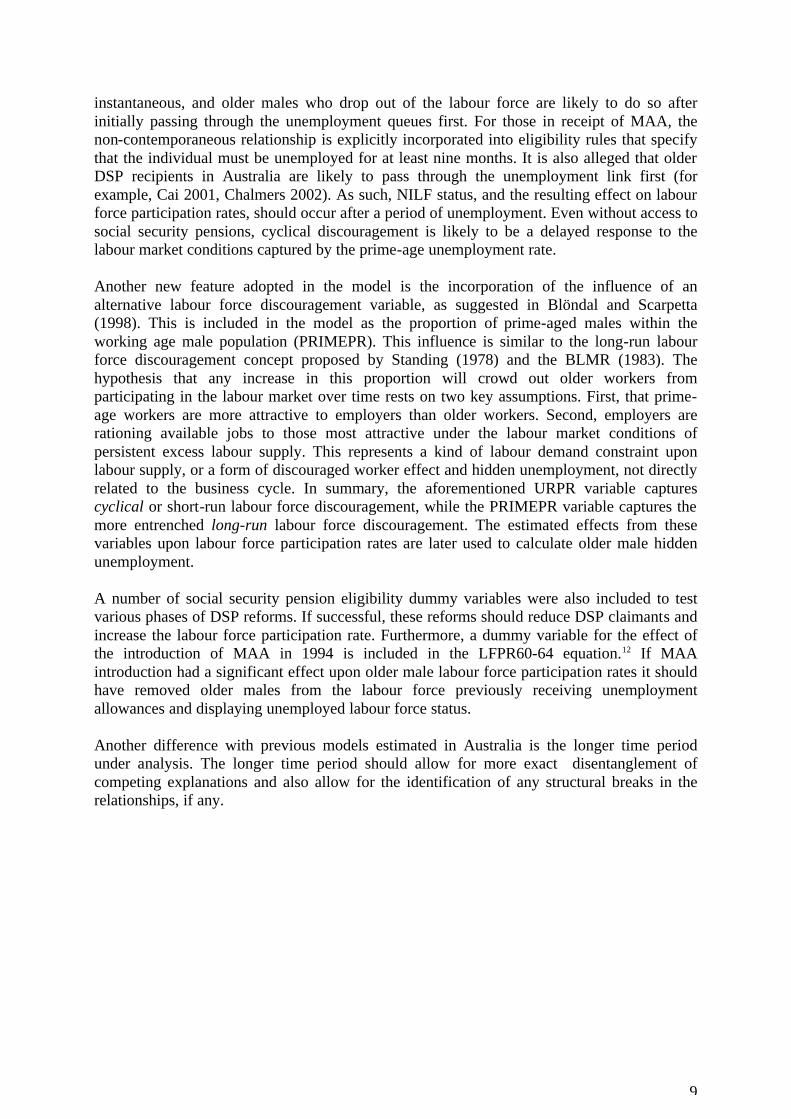
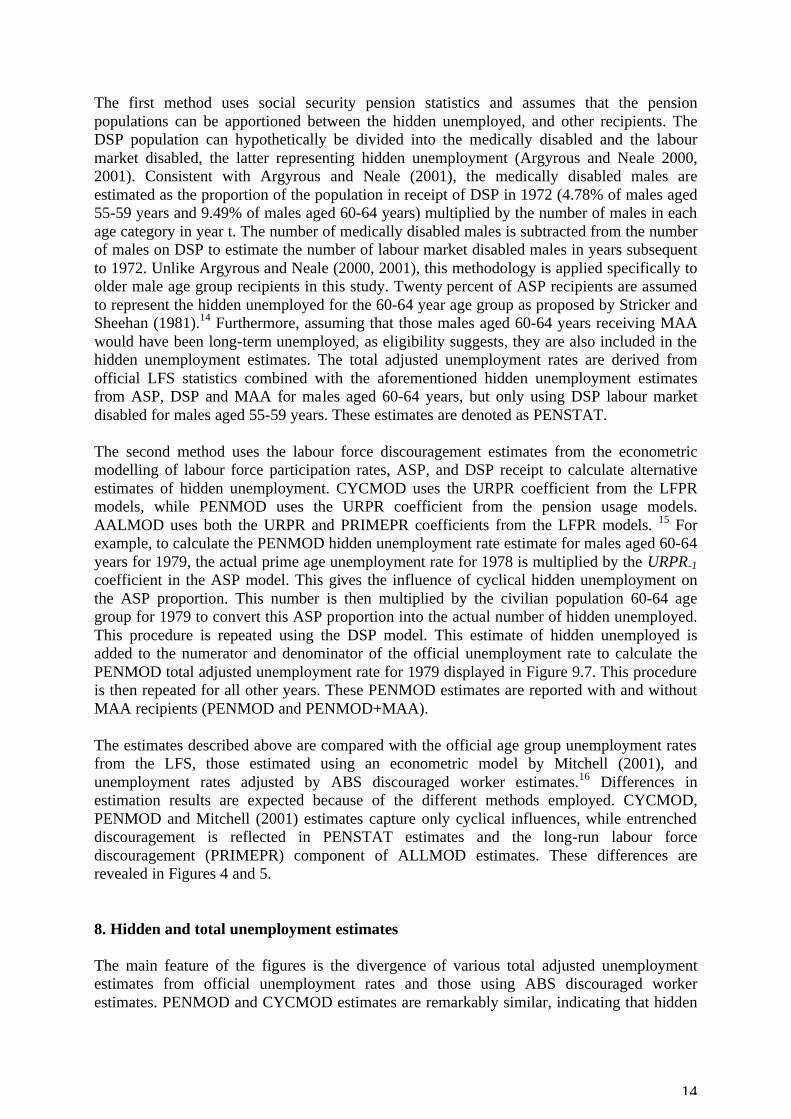
The first method uses social security pension statistics and assumes that the pension populations can be apportioned between the hidden unemployed, and other recipients. The DSP population can hypothetically be divided into the medically disabled and the labour market disabled, the latter representing hidden unemployment (Argyrous and Neale 2000, 2001). Consistent with Argyrous and Neale (2001), the medically disabled males are estimated as the proportion of the population in receipt of DSP in 1972 (4.78% of males aged 55-59 years and 9.49% of males aged 60-64 years) multiplied by the number of males in each age category in year t. The number of medically disabled males is subtracted from the number of males on DSP to estimate the number of labour market disabled males in years subsequent to 1972. Unlike Argyrous and Neale (2000, 2001), this methodology is applied specifically to older male age group recipients in this study. Twenty percent of ASP recipients are assumed to represent the hidden unemployed for the 60-64 year age group as proposed by Stricker and Sheehan (1981).14 Furthermore, assuming that those males aged 60-64 years receiving MAA would have been long-term unemployed, as eligibility suggests, they are also included in the hidden unemployment estimates. The total adjusted unemployment rates are derived from official LFS statistics combined with the aforementioned hidden unemployment estimates from ASP, DSP and MAA for males aged 60-64 years, but only using DSP labour market disabled for males aged 55-59 years. These estimates are denoted as PENSTAT. The second method uses the labour force discouragement estimates from the econometric modelling of labour force participation rates, ASP, and DSP receipt to calculate alternative estimates of hidden unemployment. CYCMOD uses the URPR coefficient from the LFPR models, while PENMOD uses the URPR coefficient from the pension usage models. AALMOD uses both the URPR and PRIMEPR coefficients from the LFPR models. 15 For example, to calculate the PENMOD hidden unemployment rate estimate for males aged 60-64 years for 1979, the actual prime age unemployment rate for 1978 is multiplied by the URPR-1 coefficient in the ASP model. This gives the influence of cyclical hidden unemployment on the ASP proportion. This number is then multiplied by the civilian population 60-64 age group for 1979 to convert this ASP proportion into the actual number of hidden unemployed. This procedure is repeated using the DSP model. This estimate of hidden unemployed is added to the numerator and denominator of the official unemployment rate to calculate the PENMOD total adjusted unemployment rate for 1979 displayed in Figure 9.7. This procedure is then repeated for all other years. These PENMOD estimates are reported with and without MAA recipients (PENMOD and PENMOD+MAA). The estimates described above are compared with the official age group unemployment rates from the LFS, those estimated using an econometric model by Mitchell (2001), and unemployment rates adjusted by ABS discouraged worker estimates.16 Differences in estimation results are expected because of the different methods employed. CYCMOD, PENMOD and Mitchell (2001) estimates capture only cyclical influences, while entrenched discouragement is reflected in PENSTAT estimates and the long-run labour force discouragement (PRIMEPR) component of ALLMOD estimates. These differences are revealed in Figures 4 and 5. 8. Hidden and total unemployment estimates The main feature of the figures is the divergence of various total adjusted unemployment estimates from official unemployment rates and those using ABS discouraged worker estimates. PENMOD and CYCMOD estimates are remarkably similar, indicating that hidden
15
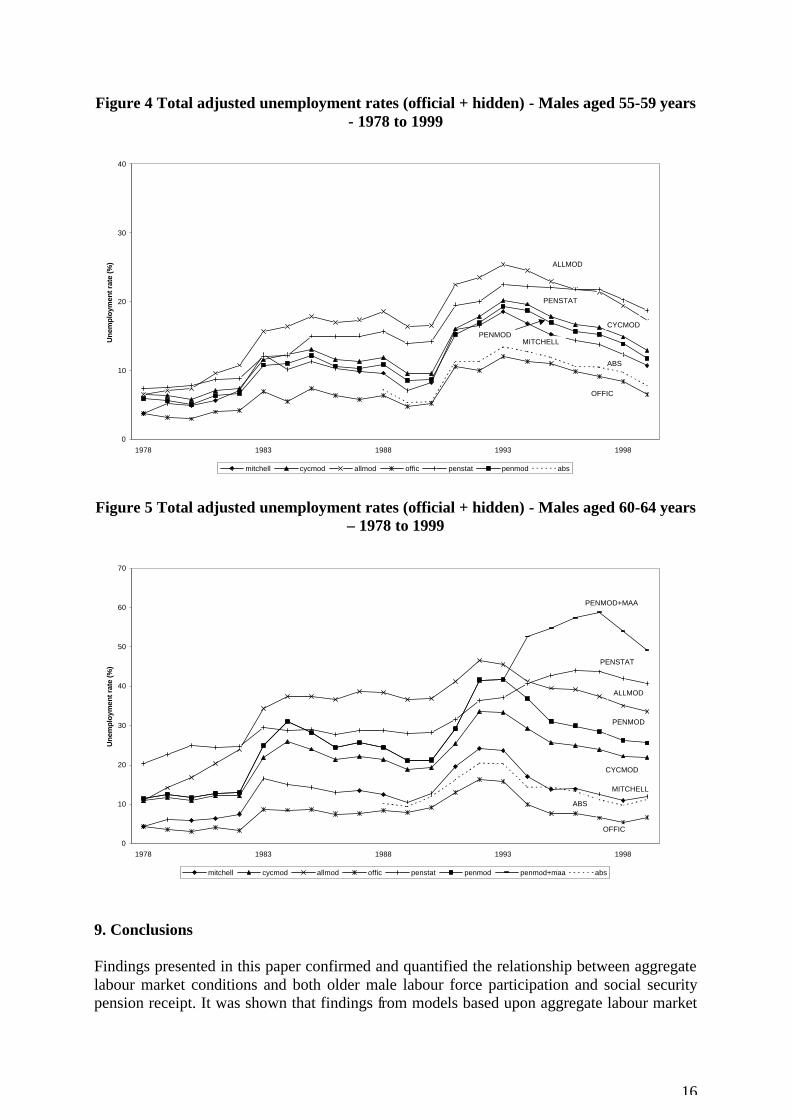
unemployed social security pensioners largely constitute the hidden unemployed population. The CYCMOD estimates are slightly greater than Mitchell (2001) estimates for males aged 55-59 years, with greater differences for males aged 60-64 years. A divergence should be expected, with Mitchell (2001) basing his estimates on a full employment unemployment rate of 4%, whereas PENMOD and CYCMOD are freely estimated.17 As expected, ALLMOD estimates, which include the effects from both the short-run and long-run labour force discouragement variables in the labour force participation rate econometric model, provide the greatest adjusted unemployment rates, exceeding 25% for males aged 55-59 years and 45% for those aged 60-64 years in recent times. Therefore, these estimates can generally be regarded as the higher bounds to the adjusted unemployment rates. An interesting contrast emerges with the estimates using MAA statistics (PENSTAT and PENMOD+MAA) for males aged 60-64 years. These total adjusted unemployment rates do not fall after 1994 in line with official unemployment rates. With MAA introduced in 1994, it adds further weight to the assertion that official unemployment rates for males aged 60-64 years fell artificially, with total adjusted unemployment rate estimates including MAA long-term unemployed continuing to rise almost five percentage points until 1997. This confirms that the government had the power through social security policy to manipulate the labour force outcome of a significant group of older workers in a period of labour supply surplus. PENSTAT and PENMOD+MAA estimates imply an entrenchment of unemployment related problems not reflected in official, CYCMOD, PENMOD or Mitchell (2001) estimates. The estimates of unemployment including various estimates of hidden unemployed certainly suggest that potentially large unemployment rates would be revealed if not for the existence of social security pensions. More fundamentally, official unemployment rates are a misleading indicator of older male labour market conditions or unutilised capacity.
16
Figure 4 Total adjusted unemployment rates (official + hidden) - Males aged 55-59 years - 1978 to 1999
Figure 5 Total adjusted unemployment rates (official + hidden) - Males aged 60-64 years
– 1978 to 1999
9. Conclusions Findings presented in this paper confirmed and quantified the relationship between aggregate labour market conditions and both older male labour force participation and social security pension receipt. It was shown that findings from models based upon aggregate labour market
0
10
20
30
40
50
60
70
1978 1983 1988 1993 1998
Un
emp
loym
ent
rate
(%
)
mitchell cycmod allmod offic penstat penmod penmod+maa abs
PENMOD+MAA
PENSTAT
ALLMOD
PENMOD
CYCMOD
MITCHELL
OFFIC
ABS
0
10
20
30
40
1978 1983 1988 1993 1998
Un
emp
loym
ent
rate
(%
)
mitchell cycmod allmod offic penstat penmod abs
ALLMOD
PENSTAT
CYCMOD
MITCHELL
OFFIC
PENMOD
ABS
17
explanations, and especially labour force discouragement variables, accounted for the majority of older males’ labour force participation rate and social security pension receipt stylised facts. The Australian literature presented in Section 3 suggested that a consensus existed amongst Australian researchers that early exit from the labour force represented a planned response to increased wealth accumulation, however, there was room for short-run effects from the unanticipated influences of recessions, and changes to social security value and availability. As such, findings from Australian research would have largely fitted in neatly with orthodox literature emphasising responses to financial variables, and a voluntary nature to early retirement. However, findings presented challenge this consensus and suggest that various forms of labour force discouragement explain the bulk of trends. Findings suggested that ASP had previously played a large hidden unemployment role now occupied by DSP and MAA. This means that the current DSP/MAA trends represent the continuation and growth of discouraged worker effects from the 1970’s rather than representing the emergence of a relatively new phenomenon. Estimates from a number of sources suggested that a large proportion of social security pensioners and NILF represent hidden unemployed. This implies that older male official unemployment rates have been manipulated to be artificially low in a period of labour supply surplus and are misleading as an indicator of the older male labour market. In conclusion, the bulk of evidence suggests that Australia’s government has historically treated older workers as a reserve army of labour. Older unemployed males have been systematically removed from the labour force in periods of sustained high unemployment. Evidence of the large extent or magnitude of the reserve army is contained in the previous estimates of hidden unemployment. However, one caveat to this story is the ASP. This pension effectively operated as a hidden unemployment policy tool, but cannot be said to have been conceived specifically as a reserve army of labour tool to remove older workers from the labour force as was MAA, or to have operated as de facto unemployment relief, as with the labour market related eligibility contained within DSP. The finding that variables representing labour force discouragement explain the bulk of older male worker labour force participation rate trends, and the accommodating role of social security over a long time period, takes on greater significance in the light of recent policy changes aimed at addressing ageing population issues. Attempts to reverse early retirement trends via pension reform would tend to be successful if pension availability and value was the primary incentive to leave the labour force. However, if government policy was more accurately described as accommodating otherwise unemployed older workers, it is unclear that supply side policy will increase the employment component of the labour force participation rate, and alternatively may have distributional consequences according to those who work and those unemployed. Therefore, an important consideration of the proposed policy should have been the strength of the social security pension influence in removing older workers from the labour market, and the possible symmetry of the reserve army of labour relationship. That is, if social security receipt was associated with lower labour force participation rates, will removing the so-called disincentives to participation, such as restricting access and value of pensions, lead to an increase older worker labour force participation, and especially employment? A primary consideration of course, is the likely behaviour of the other parties involved. It has been argued that government policy for older workers has been influenced by labour market conditions, and has thus accommodated
18
otherwise unemployed older workers in a world of aggregate labour supply surplus. Thus labour supply policy without complementary labour demand from employers is likely to do little more than reveal large pools of hidden unemployment in official statistics. Older workers were targeted as the reserve army of labour during periods of labour supply surplus and have subsequently become reliant upon government social security in the absence of full employment. Therefore, the move toward greater self-reliance for retirement income appears particularly ironic for a group who, by design of policy, have become increasingly reliant upon government assistance. With self-provision of retirement income reliant upon labour market earnings, the proposed reforms will widen the gap between those with uninterrupted high paying full-time employment versus those that may experience employment difficulties. Therefore it is likely that this policy will extend an unequal distribution of income into later life. The main caveat to the findings is whether the baby boomer generation will face the same poor employment predicament as past older generations. If declining older male labour force participation rates had been concentrated amongst the poorly educated and those with few credentials it has been argued by government and academic researchers that the baby boomer generation, with higher levels of education should display higher older male labour force participation rates (for example, McDonald and Kippen 1999). However, this ignores the fallacy of composition issue established in O’Brien (2003), that education affected an older individual worker’s labour force status, but that changes to human capital composition of the older population did not affect their labour force participation rate over time. The only benefit for the baby boomer generation may be realised if the relationship between the proportion of prime-aged males in the working age population and older male labour force participation rates established in econometric modelling holds over time. The continuing decline in the proportion of prime-age males in the working age population may mean increased opportunities for older workers in the future. Therefore, to an extent, the characteristics of an ageing society may carry with it the seeds for decreasing hidden unemployment and increasing older male labour force participation rates in the future. The baby boomer generation may have crowded out past generations of older workers but may not face the same crowding out from the relatively small prime-age cohorts following.
19
Endnotes 1 Notably, O’Brien (1999) and (2000) contained a more disaggregated and comprehensive analysis of labour force statistics covering a longer time period than that of VandenHeuval (1999). 2 Unlike labour force participation rates which are available from 1966 onward, unemployment rates for males 55+ are measured only from 1975 onward (ABS 1986). 3 For example, Flatau et al. (1999) show that only around five percent of males on MAA also receive labour market earnings. 4 This includes the Age Service Pension, Disability Support Pension, and Mature Age Allowance. 5 A job loser is defined by the ABS to have left their last full-time job involuntarily because they were retrenched or laid off, because of ill health or injury, the job was temporary and they did not return to studies, or their last job was running their own business which has closed down because of financial difficulties (ABS 1997) 6 The Invalid Pension was later renamed as the disability support pension (DSP) 7 Stricker and Sheehan (1981: 54) say “Hidden unemployment is defined as the number of persons, although not now in the labour force, would be in the labour force if conditions characteristic of full employment were obtained.” 8 Underemployment can be both visible, with the volume of employment less than desired, as well as invisible underemployment, with inefficient use of a worker’s skills (Wooden 1996). 9 The baby boomer generation is defined as those born after 1946 and before 1960. 10 A variable representing real average weekly earnings (RAWE) was also included in the specification to account for contemporaneous substitution or income effects as in the BLMR (1983). However, this variable was adequately captured within the replacement rate specification and was found to be statistically insignificant in the various age cohort equations. It is not reported below in model results. 11 Stricker and Sheehan (1981) also included an unemployment duration variable lagged one period in their pension receipt models. 12 These policy changes over time and their likely influence on older male LFPR are detailed in O’Brien (2000b). 13 Hidden unemployment is defined as the number of persons, not currently in the labour force, who would be in the labour force if there was full employment (Stricker and Sheehan 1981: p54). 14 Results from the ASP econometric model provide an independent estimate of the hidden unemployed in PENMOD. 15 The choice of base year for demographic structure was arbitrary and reflected the use of LFS unemployment rates from 1978 to 1999. 16 The adjusted total unemployment rates using ABS discouraged worker estimates are only available from 1988 onward. Estimates before this time were either not reported by sex or older age groups, or not reported at all if the standard error of the estimate was too high. 17 No such adjustment has been made for PENMOD and CYCMOD, implicitly assuming a zero percent prime unemployment rate for the full employment comparison. Therefore, Mitchell estimates should not diverge by more than four percentage points.
20
References ABS (1986) The Labour Force, Australia: historical summary, 1966 to 1984, ABS Catalogue
No. 6204.0. ABS (1997) Retirement and Retirement Intentions, Australia, ABS Catalogue No. 6238.0. ABS (1999a) LFS DATASETS, ABS Catalogue no. 6291.0.40.001. ABS (1999b) Average Weekly Earnings, Australia, ABS Catalogue No. 6301.0. ABS (1999c) Consumer Price Index, Australia, ABS Catalogue No. 6401.0. Access Economics Pty Ltd (2001) Population Ageing and The Economy, Commonwealth
Department of Health and Aged Care, Canberra. Biddle, D. and Burgess, J. (1999) "Youth Unemployment in Australia and the Search for
Supply Side Solutions", Journal of Economic and Social Policy, 4 (1), Summer, 83-104. Argyrous, G. and Neale, M. (2000) “Labour Market Disability: Implications for the
Unemployment Rate”, paper presented to the 7th National Conference on Unemployment, UNWS: Campbelltown, December 1.
Argyrous, G. and Neal, M. (2001) “Labor market disability: Implications for the unemployment rate”, Economic and Labour Relations Review, 12 (2), December, 263-84.
Biddle, D. and Burgess, J. (1999) "Youth Unemployment in Australia and the Search for Supply Side Solutions", Journal of Economic and Social Policy, 4 (1), Summer, 83-104.
Bishop, B. (1999) The National Strategy for an Ageing Australia: Background Paper, available at www.health.gov.au
Blöndal, S. and Scarpetta, S. (1998) “The Retirement Decision in OECD Countries”, Ageing Working Paper 1.4, OECD, Paris.
BLMR (1983) “Retired, Unemployed or at Risk: Changes in the Australian Labour Market for Older Workers, Bureau of Labour Market Research Report No. 4, Australian Government Publishing Service, Canberra.
BLMR (1985) “Who’s in the Labour Force? A Study of Labour Force Participation”, Bureau of Labour Market Research Report No. 7, Australian Government Publishing Service, Canberra.
Bororwski, A. and Hugo, G. (1997) “Demographic Trends and Policy Implications”, in Borowski, A., Encel, S. and Ozanne, E. (eds) Ageing and Social Policy in Australia, Cambridge University Press Cambridge UK, 19-53.Bowen, W.G. and Finegan, T.A. (1969) The Economics of Labor Force Participation, Princeton University Press, Princeton.
Bowen, W.G. and Finegan, T.A. (1969) The Economics of Labor Force Participation, Princeton University Press, Princeton.
Breusch, T. (1978) “Testing for Autocorrelation in Dynamic Linear Models”, Australian Economic Papers, 17, 334-55.
Cai, L. (2001) “Observations on the Growth of the Disability Support Pension (DSP) Program”, Presented at the PhD Conference in Economics and Business.
Carter, M. and Gregory, R. (1981) “Employment, Unemployment and Government Income Support”, in Stricker, P. and Sheehan, P. (eds) Hidden Unemployment: The Australian Experience, Institute of Applied Economic and Social Research, University of Melbourne, Melbourne.
Chalmers, J. (2002) “Transitions onto the Age Pension: an Analysis of FACS Longitudinal Administrative Data, report prepared for the Department of Family and Community Services, submitted November 2001, revised July 2002”, SPRC Report 3/02, available at http://www.sprc.unsw.edu.au/reports/index.htm
21
DFaCS (2000a) “Participation Support for a More Equitable Society: Final Report of the
Reference Group on Welfare Reform”, available at http://www.facs.gov.au DFaCS (2000b) “The Social Security Guide”, Department of Family and Community
Services, Canberra, available at http://www.facs.gov.au/guide/ssguide DFaCS (2001) “2001-02 Budget – What’s New, What’s Different”, Department of Family
and Community Services, Canberra, available at http://www.facs.gov.au DFaCS (2002a) “Budget and Additional Estimates 2002-03”, Department of Family and
Community Services, Canberra, available at http://www.facs.gov.au DFaCS (2002b) “What Australians Working Together Means for Mature People”, Department
of Family and Community Services, Canberra, available at http://www.together.gov.au/Publications/default.asp
EPAC (1988) “Economic Effects of an Aging Population”, Council Paper No. 29, Australian Government Publishing Service, Canberra.
Flatau, P., Dockery, M. and Stromback, T. (1999) “Labour Earnings and Income Support Arrangements”, paper presented to the DFaCS Labour Market Research Workshop, DFaCS Tuggeranong, March 29.
Gregory, R.G. and Sheehan, P.J. (1973) “The Cyclical Sensitivity of Labour Force Participation Rates”, The Australian Economic Review, 2nd qtr, 9-20.
Guest, R., and McDonald, I. (1999) “The Effect of Later Retirement on Optimal National Saving in Australia”, in Productivity Commission and Melbourne Institute of Applied Economic and Social Research (eds) Policy Implications of the Ageing of Australia’s Population: Conference Proceedings, Ausinfo, Canberra, 107-26.
Guest, R.S., and McDonald, I.M. (2000) “Population Ageing and Projections of Government Social Outlays in Australia”, The Australian Economic Review 33(1), 49-64.Hughes, B. (1984) “Labour Force Participation: What are the Issues?”, in Kaspura, A. (ed.) Labour Force Participation in Australia: The Proceedings of a Conference, BLMR Monograph Series No. 1, Australian Government Publishing Service, Canberra, 1-11.
Hansen, B.E. (1994) “Testing for Parameter Instability in Linear Models”, in Ericsson, N.R., and Irons, J.S. (eds) Testing Exogeneity: Advanced Texts in Econometrics, Oxford University Press, Oxford and New York, 389-406.
Hendry, D.F. and Doornik, J.A. (1996) Empirical Econometric Modelling Using PcGive for Windows, Timberlake Consulting, London.
House of Representatives (2000) Age Counts: An Inquiry Into Issues Specific to Mature Age Workers, The Parliament of the Commonwealth of Australia, Canberra.
Hughes, B. (1984) “Labour Force Participation: What are the Issues?”, in Kaspura, A. (ed.) Labour Force Participation in Australia: The Proceedings of a Conference, BLMR Monograph Series No. 1, Australian Government Publishing Service, Canberra, 1-11.
Kiefer, N. and Salmon, M. (1983) “Testing Normality in Econometric Models”, Economics Letters, 11, 123-28.
Merrilees, W. (1982) “The Mass Exodus of Older Males From The Labour Force: An Exploratory Analysis”, Australian Bulletin of Labour 8 (2), 81-94.
Merrilees, W. (1986) “Economic Determinants of Retirement” in Mendelsohn, R. (ed.) Finance of Old Age, Centre for Research on Federal Financial Relations, Australian National University, Canberra.
Miller, P. (1983) “On Explanations of Declining Labour Force Participation Among Older Males”, Centre for Economic Research Discussion Paper 74, Australian National University, Canberra.
Mitchell, W.F. (1999) “Estimating Hidden Unemployment in Australia and the United States”, CofFEE Working Paper No. 99-01, available at http://e1.newcastle.edu.au/coffee
22
Mitchell, W.F. (2001) “Hidden Unemployment in Australia”, in Mitchell, W.F. and Carlson,
E. (eds) The Tip of the Iceburg, CAER, Sydney, 33-46. Mitchell, W.F. and Carlson, E. (2000) “Beyond the Unemployment Rate – Labour
Underutilisation and Underemployment in Australia and the USA”, CofFEE Working Paper No 00-06, available at http://e1.newcastle.edu.au/coffee
O'Brien, M.J. (1999) “Old Enough for the Scrapheap? Employment Issues for the Baby Boomers”, in Lee, J., Probert, B. and Watts, R. (eds) Work in the New Economy: Policies, Programs, Populations, Centre for Applied Social Research, RMIT University, 207-23.
O’Brien, M.J. (2000a) “Labour Force Participation of Older Males and Females in Australia”, paper presented to the 7th Interdisciplinary Gender Studies Conference, University of Newcastle, June 30.
O’Brien, M.J. (2000b) “Older Workers and Government Policy in Australia”, paper presented to the PhD Conference in Economics and Business, Australian National University, Canberra, November 17.
O’Brien, M.J. (2001a) “Older Male Labour Force Participation: the Role of Social Security and Hidden Unemployment”, Australian Journal of Labour Economics 4 (3), 206-23.
O’Brien, M.J. (2001b) “Older Males and Social Security Reliance”, in Mitchell, W.F. and Carlson, E. (eds) The Tip of the Iceburg, CAER, Sydney, 135-56.
O’Brien, M.J. (2003) ‘A Unit Record Analysis of Older Male Labour Force Participation’, paper presented to the 32nd Conference of Economists and Business Symposium, Australian National University, September 30.
OECD (1995a) The Transition From Work to Retirement, OECD Social Policy Studies No. 16, OECD, Paris.
OECD (1995b) “Australia” in OECD (ed) The Labour Market and Older Workers, OECD Social Policy Studies No. 17, OECD, Paris, 9-24.
Ramsey, J. (1969) “Tests for Specification Errors in Classical Linear Least Squares Regression Analysis”, Journal of the Royal Statistical Society, Series B, 31, 350-71.
Standing, G. (1978) Labour Force Participation and Development, International Labour Office, Geneva.
Stille, F. (1999) “Older Workers on the Labour Market: an Introduction”, Employment Observatory Trends: The Journal of the European System of Documentation, Evaluation and Monitoring on Employment Policies (SYSDEM) 33, Winter, 4-8.
Stricker, P. and Sheehan, P. (1981) Hidden Unemployment: The Australian Experience, Institute of Applied Economic and Social Research, University of Melbourne, Melbourne.
Treasury (2004) “Australia’s Demographic Challenges”, Commonwealth Treasury, Canberra, available at http://demographics.treasury.gov.au/content/default.asp
VandenHeuvel, A. (1999) “Mature Age Workers: Are They a Disadvantaged Group?”, Australian Bulletin of Labour 25 (1), 11-22. Wooden, M. (1993) Underemployment, Hidden Unemployment and Immigrants, Australian
Government Publishing Service, Canberra. Wooden, M. (1996) “Hidden Unemployment and Underemployment: Their Nature and
Possible Impact on Future Labour Force Participation and Unemployment”, National Institute of Labour Studies Working Paper Series No 140, Flinders University, South Australia and University of Melbourne, Victoria.