Embed Size (px)
Citation preview
arX
iv:a
stro
-ph/
0611
771v
1 2
4 N
ov 2
006
Hidden Trigger for the Giant Starburst Arc in M83?
Ruben J. Dıaz1,2, Horacio Dottori3, Maria P. Aguero2,
Evencio Mediavilla4, Irapuan Rodrigues3, Damian Mast2
ABSTRACT
The huge star formation events that occur at some galactic centers do not
provide enough clues as to their origin, since the morphological signatures of the
triggering mechanism are smeared out in the timescale of a few orbital revolutions
of the galaxy core. Our high spatial resolution three-dimensional near-infrared
spectroscopy for the first time reveals that a previously known hidden mass con-
centration is located exactly at the youngest end of a giant star-forming arc.
This location, the inferred average cluster ages, and the dynamical times clearly
indicate that the interloper has left behind a spur of violent star formation in
M83, in a transient event lasting less than one orbital revolution. The study of
the origin (bar funneling or cannibalized satellite) and fate (black hole merging
or giant stellar cluster) of this system could provide clues to the question of core
growing and morphological evolution in grand-design spiral galaxies. In particu-
lar, our TreeSPH numerical modeling suggests that the two nuclei could coalesce,
forming a single massive core in about 60 million years or less.
This work is based on observations made at the Gemini South Telescope.
Subject headings: Galaxies: active, starburst, nuclei, individual (M83), ISM,
kinematics, dynamics.
1. INTRODUCTION
The enormous energy output detected in many cores of galaxies is one of the key is-
sues in the study of galaxies and their evolution; notwithstanding, several questions remain
1Gemini Observatory, Southern Operations Center, Chile; e-mail:[email protected]
2Observatorio Astronomico de Cordoba, Universidad Nacional de Cordoba and CONICET, Argentina
3Instituto de Fısica, Universidade Federal do Rio Grande do Sul, Brazil
4Instituto de Astrofisica de Canarias, Spain

– 2 –
unsolved. Are accretion onto super-massive black holes and violent star formation just co-
evolving phenomena or necessary partners of the activity? How is the detailed physics of the
mechanisms triggering the nuclear extended violent star formation? What is the relationship
of the triggering mechanisms to galaxy evolution? The main challenge facing these issues is
that developed stages of large star formation events at galactic centers do not provide suffi-
cient clues to their origin, since the morphological signatures of the triggering mechanism are
smeared out on the timescale of a few orbital revolutions of the galaxy core. Here we present
the discovery of hidden evolutionary links in one of the extraordinary transient events in
the life of a galaxy like our own, which occur when the remnant of an accreted (galactic or
extragalactic) body arrives at the galactic nuclear region. For M83, this arrival is accompa-
nied by the fireworks of the violent star formation arising in the gas-rich environment of this
galaxy, giving us the unique opportunity in the nearby universe for studying the detailed
physics of the so-called nuclear starbursts and the initial stages of the super-massive black
hole growth in the center of galaxies.
M83 is a galaxy with grand-design spiral structure and could be taken at first glance to
be one of the nearest (distance 3.7Mpc; RC3) normal spiral galaxies. Its central region has
progressively gained attention since it was known to harbor the nearest “hot spot” or Sersic-
Pastoriza nucleus (Sersic & Pastoriza 1965), later identified as one of the brightest nearby
giant HII complexes (Arsenault & Roy 1986), and now studied as the nearest nuclear massive
starburst (Fig. 1). It has been subject of several detailed observational studies, including a
wealth of observations with the Very Large Telescope (VLT) and the Hubble Space Telescope
(HST), but the dynamical origin of the starburst has remained elusive. Several hypotheses
have been discussed, from the influence of a not very close companion (Rogstad, Lockart
& Wright 1974) or the resonance patterns of the global weak bar (Elmegreen, Chromey &
Warren 1998; Petitpas & Wilson 1998), down in scale to the presence of a nuclear bar in
the morphology at near- and mid-infrared spectral ranges (Gallais et al. 1991). Clues to the
dynamical signature of a trigger have been provided initially by long-slit observations of the
nuclear region in a study by Thatte, Tecza & Genzel (2000), who report two peaks in the slit
profile of the stellar radial velocity dispersion. The lack of spatially extended spectroscopic
information did not allow them to fix the position and to confirm the presence of a second
nucleus. This result was interpreted as revealing the presence of two dynamical centers,
possibly the consequence of the off-center nuclear bar postulated in previous low-resolution
studies (Gallais et al. 1991; Telesco 1988). However the existence of an off-centered nuclear
bar is not expected from observations and modeling (Maciejewski & Sparke 2000; Heller &
Shlosman 1994). The existence of two off-centered nuclei, one of them coincident with the
optical nucleus and the other located a few arcseconds to the west of the optical nucleus, was
proposed (Mast et al. 2002; Mast, Dıaz & Aguero 2006) by a team using the Multi-functional

– 3 –
Spectrograph at the Bosque Alegre Astrophysical Station (Dıaz et al. 1999) to determine
the ionized gas radial velocity and radial velocity dispersion fields from the optical emission.
A deep study (Harris et al. 2001) of the violent star formation taking place in M83
was made by a thorough photometric analysis of the 45 most massive clusters in the giant
star-forming arc of M83 with the Wide Field Planetary Camera 2 of the HST. This giant
arc is located between 3′′ and 7′′ from the galaxy center, spans about 15′′ (255 pc), and
includes about 20 massive young clusters similar to 30Dor, one of the largest young clusters
in the Local Group of galaxies. By comparing the broad- and narrow-band photometry with
theoretical population synthesis models, the age and mass of each cluster were estimated
(Harris et al. 2001). The main conclusion was that the starburst began about or less
than 10Myr ago and that the clusters may dissolve on a 10Myr timescale. More recently,
Sakamoto et al. (2004) studied the CO emission in M83 with the Submillimeter Array and
found that the distribution and kinematics of the molecular gas is typical for barred galaxies
down to 1 kpc radii, although they confirm unusual kinematics around the double nucleus
in the central ∼ 300 pc. The relatively low spatial resolution of the velocity field (∼ 3′′)
leads these authors to conclude that the second nucleus would coincide with the center of
the bulge. They discuss the dynamics of the M83 central region in the context of the bar
instability and inner Lindblad resonance of the disk and conclude that the nuclear starburst
of M83 owes much to the bar-driven gas dynamics for accumulating molecular gas toward
the central 300 pc.
In order to understand the nature of the double nucleus configuration and its possible
relation to the giant arc of star formation, minimizing the effects of dust and improving
the relative low spatial resolution (∼ 2′′) of our previous optical observations, we applied
the new observational techniques of three-dimensional (3D) spectroscopy at near-infrared
(NIR) wavelengths performed at sub-arcsecond spatial resolution. We complement these
new observations with numerical simulations, which reveal what can be considered a growing
galactic core in a grand-design spiral galaxy.
2. OBSERVATIONS
Observations. We used the Cambridge Infrared Panoramic Survey Spectrograph (Parry
et al. 2000), built at the Cambridge Institute of Astronomy, during its visit to the Gemini
South 8.1 m telescope in March 2003. The observations were taken with an Integral Field
Unit (IFU) sampling of 0.′′36 (6.4 pc) in an elliptical arrangement with a size of 13′′×5′′. The
array has 490 hexagonal doublet lenses attached to fibres and provides an area filling-factor
near 100%. The IFU was oriented at PA 120◦ (Fig. 1) and was centered in a point mid-

– 4 –
way between the optical nucleus position and the possible position of the hidden nucleus
previously determined from our optical 2D kinematics (Mast et al. 2002). The set of 490
spectra covers the spectral range 1.2-1.4µm, including the emission lines Paβ 1.3µm and
[FeII] 1.26µm, and the spectral resolution is ∼3200. During the observations the peripheral
wave front sensor of Gemini active optics was used, and the achieved image quality was
excellent (FWHM≈ 0.′′5); therefore, the focal plane was somewhat sub-sampled by the used
configuration. The data were reduced using IRAF (distributed by the National Optical As-
tronomy Observatory), ADHOC (2D kinematics analysis software developed by Marseille’s
Observatory), SAO (spectra processing software developed by the Special Astrophysical Ob-
servatory, Russia), and standard worksheets and image processing software. Due to the
complex data output the spectra have been carefully reduced one by one, using the promi-
nent sky emission lines as wavelength and profile references. The general techniques used
have been previously described in other works (Dıaz et al. 1999, Mast et al. 2006). In most
of the field the S/N ratio was higher than 10, and the average radial velocity uncertainty
resulted about 6 km s−1. We present here a mean velocity field that includes both nuclei. We
also constructed the Paβ continuum map, which is shown in Figure 2 and can be compared
for reference with the HST pseudo color optical image, combined from F439W, F555W, and
F702W filters, presented in Figure 1.
Astrometry. The position reference system was taken from the two most recent papers
that show optical and NIR images with accurate astrometry (Thatte et al. 2000; Harris
et al. 2001), which have coordinate system differences of about 0.′′1 (determined from their
figures). Using some J-band compact features appearing in Figure 2 as position references
and identifying them in the previous high-resolution images (mainly the one at F814W band),
we were able to provide coordinates for the galaxy visible nucleus (defined as the continuum
emission peak), the bulge geometrical center and the dark rotation center reported here. The
resulting coordinates of the visible nucleus are α = 13h37m0.95s, δ = −29◦51′55.5′′ (J2000.0)
with a 2 σ uncertainty of 0.′′15. The bulge geometrical center, defined as the symmetry
center of the outer K-band isophotes of the galactic central region (Thatte et al. 2000;
central arc-minute, r < 500 pc) is at α = 13h37m0.57s, δ = −29◦51′56.9′′ (J2000.0), with
a 2 σ uncertainty of 0.′′8 arising mainly in the photometric determination of this symmetry
center. Finally, the position of the dark rotation pattern center was determined by fitting
a pure rotational model (Satoh disk; Binney & Tremaine 1991, pp. 44-45) with varying
inclination. The resulting coordinates are α = 13h37m0.46s, δ = −29◦51′53.6′′ (J2000.0),
with a 2 σ uncertainty of 0.′′7.

– 5 –
3. RESULTS & DISCUSSION
We present in Figure 2 the radial velocity field of the ionized gas observed at near
infrared wavelengths. An inspection of the continuum map (with a resolution of ∼ 0.′′6)
and the radial velocity field clearly shows that the main rotation center is far (7.′′8 ± 0.′′7 or
140±13 pc to the WNW, PA= 284◦ ± 5◦) from the optical nucleus position, defined as the
maximum peak in the J-band continuum emission. The optical nucleus is also located out of
the global symmetry center: the galactic bulge or central spheroid geometry center is located
at 3.′′5 ± 0.′′8 or 63±14 pc to the WNW, PA= 249◦ ± 5◦, from the visible nucleus position.
The relative positions of the visible nucleus, the bulge geometrical center, and dark rotation
center can be seen in Figures 2 and 3. The radial velocity gradient across the optical nucleus
implies a total mass not larger than 107M⊙ inside a radius of 2′′. In particular, the fit of a
Satoh disk model yields a total mass of (2 ± 1) × 106M⊙ with an inclination of 50◦ ± 10◦.
This dynamical mass value is consistent with the mass calculated (Thatte et al. 2000) for
the stellar component, using population synthesis models. The main rotation center has no
obvious emitting structure associated in the continuum map of Figure 2 and in the near-IR
HST imagery, but is coincident with the largest lobe in the 10µm map (Gallais et al. 1991)
shown in Figure 3, and the second largest lobe in the 6 cm radio map (Telesco 1988). The
rotation pattern has been fitted with a Satoh disk (Binney & Tremaine 1991) with inclination
50◦ ± 15◦ and a total mass of (16 ± 4) × 106M⊙. Considering the lack of emission in our
1.3µm continuum map of this highly obscured region, we estimate that it should have a mass
to light ratio 10 to 100 times larger than the optical nucleus in the J band. The relatively
large mass of the intruder would explain the optical nucleus off-centering and perturbed
appearance in the high resolution images. The maximum possible central mass of this dark
rotation center can be estimated by fitting a point-like gravitational source to the observed
radial velocity gradient, inside a 1′′ radius from the rotation center and considering a beam
smearing of two sampling elements (0.′′72). Therefore, the largest supermassive black hole
that can be fitted to the unresolved inner region of the rotation center should have a mass
not larger than (3± 1)× 106 (sin i)−1M⊙.
The hidden mass concentration is located precisely at the younger end of the star forming
arc, in a region where star clusters with extinction possibly larger than 10 mag have been
reported (Gallais et al. 1991; Mast et al. 2006). Therefore, the core of the hidden mass
concentration could eventually be explained by the presence of one or a few super-massive
star clusters such as the one forming the optical nucleus (stellar luminosity corresponding to
2.5× 10⁶M⊙; Thatte et al. 2000 ), but highly obscured in this case.
This obscured rotation center (hereafter intruder nucleus) could correspond to an inter-
loper gaseous body funneled to the circumnuclear environment by the global bar dynamics in

– 6 –
a scenario such as that proposed by Elmegreen et al. (1998) for M83. This kind of scenario
has been thoroughly modeled by several teams (e.g. Heller & Shlosman 1994; Pinner, Stone
& Teuben 1995), but until now there was no direct observational evidence of the behavior
of the central region during a bar-fueling event, so the results presented here could be im-
portant for testing the detailed physics of the models. Currently the best and unbiased (in
terms of extinction) picture of the bar dynamics in M83, is the interferometric imaging of
CO emission (Sakamoto et al. 2004). Based on a relatively low spatial resolution velocity
field, these authors conclude that the second nucleus would coincide with the center of the
bulge and that the optical nucleus could be an interloper. The dynamics of the M83 bar
instability and resonances have been extensively discussed by Sakamoto et al. (2004) and
by other authors previously (e.g. Handa et al. 1990; Kenney & Lord 1991; Elmegreen et
al. 1998), and the main conclusion that can be drawn is that, whatever the trigger, the
nuclear starburst of M83 owes much to the bar for the accumulation of molecular gas in
the central region. Although the Sakamoto et al. (2004) velocity map has much lower (5-8
times) resolution than the Gemini+CIRPASS data discussed here, a slight distortion and
isovelocities crowding along the minor axis and northwest from the optical nucleus position
could be identified as the hidden mass concentration. This concentration is located just at
the edge of a fairly massive molecular gas concentration in what could be interpreted as
bar streaming flow of M83, but it appears strongly asymmetric in intensity and shape with
respect to the global pattern.
It could be possible that the hidden nucleus is part of the material fed by the bar,
but this would imply that the bar is capable of funneling extended bodies of ten million
solar masses and tens of parsec sizes to the circumnuclear region. Moreover, the bar feeding
scenario is difficult to support due to a couple of details:
1st.- The strong asymmetrical appearance of the mid-infrared (Fig. 3) and radio maps
(6 cm; Telesco 1988), which, in addition to their tidal shape, would not show a continuity of
their features with the bar dust lanes (marking the main bar streaming regions; Athanassoula
1992).
2nd.- There is at least one other case of a single nucleus off center with respect to both
the geometric and the kinematical center, in the strongly barred Seyfert galaxy NGC1672
(Dıaz et al. 1999). In both NGC1672 and M83 the strong offset between the optical nucleus,
the bulge center, and the main kinematic center would indeed remain as a puzzle in a bar
funneling scenario. Nevertheless, this scenario cannot be ruled out without high-resolution
numerical models.
An alternative would be the arrival of an accreted satellite core into the highly gaseous
circumnuclear environment of M83. As this is a theoretical scenario less explored at the

– 7 –
scale of our observations, we will thoroughly analyze the possibilities in the present case of
M83.
Malin & Hadley (1997) have found a low-brightness arc outside the disk of M83 and
explained it as the remnant of an accreted satellite. The global appearance of the HI disk
could show some evidences of a past interaction, such as a large HI tidal feature that sur-
rounds the optical disk of the galaxy (Park et al. 2001). At circumnuclear scales, it was
found that the integrated Hα kinematical profile of the whole complex has a small secondary
Gaussian component, redshifted with respect to the main one; and infall of material was
claimed as a plausible explanation (Arsenault & Roy 1986). Moreover, it has been argued
(Sofue & Wakamatsu 1994) that part of the central region of M83 is obscured by a polar
dust lane, which in turn was related to a global warp in the H I disk. Coincidentally or not,
the dust lane would end at the galactic equatorial plane in the region of the hidden mass
concentration discussed here.
There are also a number of galaxies in which the optical nucleus is off centered with
respect to the galaxy center, e.g., NGC3227 (Mediavilla & Arribas 1993), M31 (Kormendy
& Richstone 1995), NGC1068 (Arribas, Mediavilla & Garcia-Lorenzo 1996), and NGC5033
(Mediavilla et al. 2005). In many cases the off centering has been related to a galaxy
merger, and minor mergers have been theoretically considered in the past as a source of
gaseous nuclear fueling (Taniguchi & Wada 1996). It is expected in the above scenario that
the nucleus of the cannibalized satellite is accreted to the central region of the galaxy, where
theoretically it should generate a star formation trail (Saslaw & De Young 1972; Saslaw
1975) as it perturbs a gas rich environment and eventually produces a supermassive black
hole binary. A statistical analysis of the previous photometric results (Harris et al. 2001)
allows a quantitative approach to this proposition. We calculated the average age of the
young massive clusters in 25◦ angular sectors of the 100◦ ringlet (within a radial range from
50 to 150 pc), and found a clear age gradient across the arc. This age gradient is more
obvious when the age of the oldest clusters is considered; in the east extreme of the arc the
oldest cluster is 25Myr old, while in the northwest extreme, in the region of the intruder
nucleus, the oldest cluster is only 5Myr old. This age difference is beyond any statistical
uncertainty; moreover, the appearance of the H II regions in Figure 1 shows clearly that the
star-forming regions near the intruder nucleus are more compact and luminous, and therefore
less evolved. Another striking characteristic of the giant arc of star formation is that the
location of the youngest clusters and the Hα morphology indicate that the star formation
has been radially propagated from the interior of the arc outward to its radial perimeter.
As has been stated previously (Harris et al. 2001), it appears that the 5-7Myr population
has evacuated interstellar material from most of the active arc and that star formation is
continuing along the radial edges of the region, where the gas density is probably still high.
– 8 –
This phenomenon had no previous explanation, but would naturally fit in a scenario where
star formation has propagated radially from the path of the intruder nucleus around the
galactic center (see Figs. 1 and 3). This picture is fully consistent with the dynamical crossing
times of the galactic central regions, which have been estimated using the observed positions
of the mass concentrations, the inferred path of the captured body in the circumnuclear
region and the rotation curve of M83 (Aguero & Dıaz 2004) from optical, near-infrared, and
radio observations. We consider that the orbit of the intruder mass is partially described by
an ellipse with a semi-major axis not smaller than 120 pc (as seen in Fig. 1, and with the
bulge center in one of the foci), a range of possible inclinations from the global one (20◦-30◦)
to that inferred at the kinematical center (40◦-60◦), and the range of possible total masses
enclosed in the radial range from 100 to 200 pc. This Keplerian approach gives a minimum
dynamical crossing time of 3Myr, and maximum of 12Myr, with the most probable value
around 5Myr (semi-major axis 130 pc, inclination 45◦, enclosed mass 2 × 10⁸M⊙), which is
fairly consistent with the age gradient depicted in Figure 1.
The observational evidences that would therefore support the proposed capture and star
formation triggering picture are:
i) the hidden mass concentration is located at the younger end of the star-forming arc
(Fig. 1);
ii) the optical nucleus is out of the galactic geometry center and seems to have an associated
stellar trail (see Figs. 1 and 3), possibly pointing toward the galactic center;
iii) the continuum maps at radio wavelengths (Rogstad et al. 1974, Telesco 1988) and at
10µm (Gallais et al. 1991; see our Fig. 3 for a superposition of the optical and mid-IR fea-
tures) have a strong tidal appearance, with the largest emission at mid infrared wavelengths
located precisely at the position of the kinematically detected dark mass;
iv) the mentioned possible off-plane dust lane related with global H I map (Sofue & Waka-
matsu 1994) would end in the region of the hidden mass concentration;
v) the age of the oldest clusters in the starburst arc is about 25Myr (Harris et al. 2001),
similar to the dynamical crossing time of the central kiloparsec (∼ 26Myr);
vi) the age difference between the youngest and the oldest ends of the arc (a few Myr) is
similar to the dynamical crossing time at a hundred parsec scale in M83.
Modeling. In order to make a theoretical approach to the dynamical evolution of this
kind of scenario we simulate the encounter between the system components following the
evolution of their stellar and gaseous contents. A set of numerical simulations were done
using a TreeSPH code (Hernquist & Katz 1989). The circumnuclear galactic potential was
represented by a fixed spherical Hernquist (1990) potential fitted to the most detailed rotation

– 9 –
curve available for M83 (Aguero & Dıaz 2004), with a total mass of 1.5 × 10¹¹M⊙, scale
length of 2.5 kpc, and cutoff radius of 40 kpc. It was centered at the bulge geometrical center,
defined as the symmetry center of the outer K-band isophotes (see explanation in Section 2).
Nuclei models (optical nucleus and intruder nucleus) were constructed following the general
prescription for N -body galaxy realizations (Hernquist 1993), including gaseous and stellar
disks plus a spherical component. Initial conditions for these models were based on the
observed sizes, masses and 2D radial velocity distributions. A total of 3000 particles were
used for the mass distribution representing the optical nucleus, arranged in a disk component
(Mdisk = 0.9×10⁶M⊙; scale length l = 4.2 pc; vertical scale height h = 0.4 pc; QToomre = 1.5;
Vcirc(peak) = 25 kms−1) and a spherical component (Msphere = 1.1 × 10⁶M⊙; core radius
r = 2.1 pc; cutoff radius rcutoff = 44pc). For the intruder nucleus we used 17,000 particles
arranged in a disk component (Mdisk = 8.8× 10⁶M⊙; l = 6.8 pc; h = 0.68 pc; QToomre = 1.5;
Vcirc(peak) = 50 kms−1) plus a spherical component (Msphere = 7.2×10⁶M⊙; r = 3.4 pc; cutoff
radius rcutoff = 68pc). Considering the observed molecular gas distribution (Lundgren et
al. 2004), a fraction of 10% of the optical nucleus mass and 50% of the intruder dark mass
were assigned to gaseous massive (SPH) particles.
As Figure 2 shows, Paβ spider-like diagrams, characteristic of a rotating disk, are ob-
served around the kinematical center and hidden nucleus. Although they only indicate the
gas behavior, the presence of a stellar disk cannot be ruled out, mainly around the kine-
matical center. This leads us to consider models composed of spheroids and disk in our
simulations. Genzel et al. (2001) found that both nuclei of the major merger Arp 220 retain
rotating gas disks; therefore, the presence of the disk in the intruder nucleus is physically pos-
sible. The real nature of the mass distribution would be determined when the near-infrared
stellar velocity dispersion maps (currently under elaboration) become available. As a first
approach to the problem, we model the intruder’s orbit and the main galaxy disk coplanar,
for the sake of simplicity and considering the strong star-forming effect on the main galaxy
disk. Indeed, it has been shown in numerical simulations (Walker, Mihos & Hernquist 1996)
and in the properties of double nuclei in spiral galaxies (Gimeno, Dıaz & Carranza 2004)
that most of the accreted satellites would be moving in the disk of the main galaxy when
they reach the circumnuclear region.
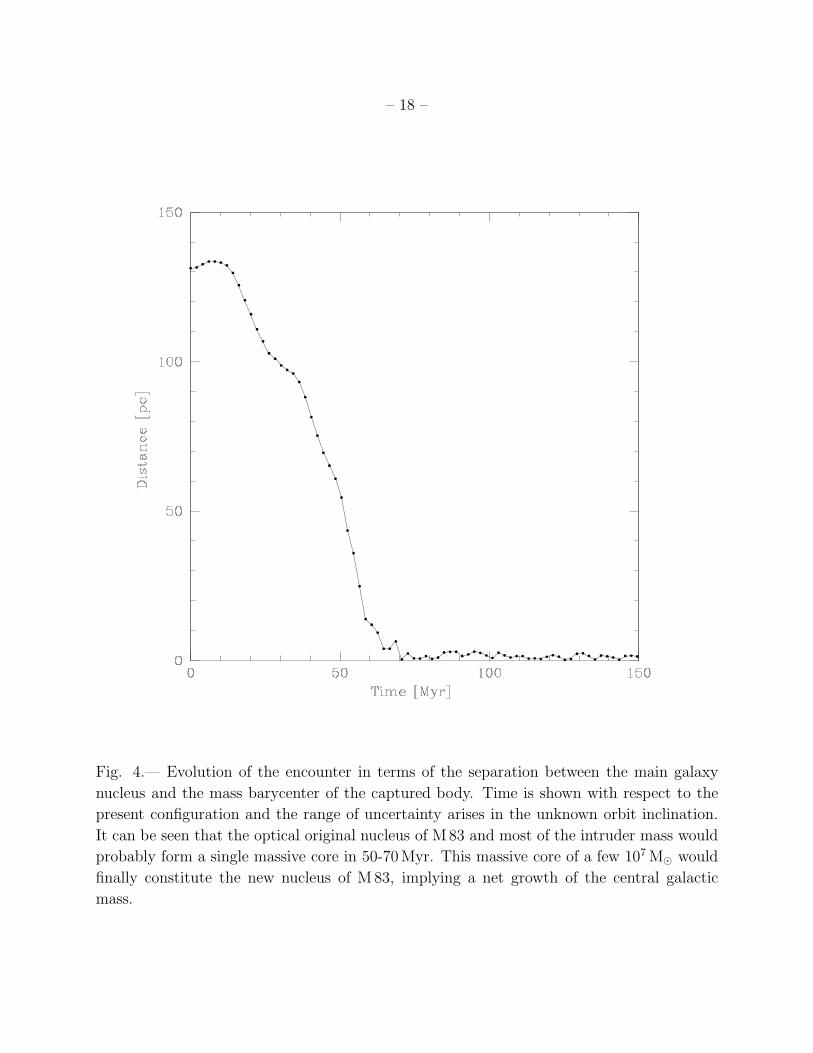
Figure 4 shows the evolution of the encounter in terms of the separation between the
optical (original?) galaxy nucleus and the mass barycenter of the captured galaxy; the initial
path was approached with a long parabolic orbit with a perigalactic distance q = 1kpc.
The models show that the main galaxy nucleus and the bulk of the intruder mass would
form a single massive core in 50-70Myr, considering the range of uncertainty in the orbit
inclination. Note that this is, in fact, an upper limit, since in the present simulation the
central potential of M83 is modeled by a rigid potential, and the dynamical friction between

– 10 –
it and the optical and intruder nuclei is not considered. In fully self-consistent simulations
under elaboration, the merging time may be considerably shorter. The massive core of a
few 107M⊙ would finally settle as the new nucleus of M83 in less than 100Myr, implying a
net growth of the central galactic mass. Furthermore, the whole star formation and nuclei
merging event would last less than a global galactic revolution (about 150Myr at the average
radius of 5 kpc). Mergers between spiral galaxies and their satellites are of broad interest
because they can have a profound influence on the structure of disks in spiral galaxies
through secular processes (Hernquist 1991; Combes 2001) that do not destroy the galaxy,
unlike to those events involving more massive companions (whose remnants are more akin
to elliptical galaxies rather than any kind of spiral galaxy). Owing to the complexity of the
merger process, quantitative predictions of the effects of merging are very difficult without
appealing to numerical simulations applied to the study of individual events, which in turn
can be used to constrain the models of spiral galaxy secular evolution. The massive core
of a few 107M⊙ that would finally settle as the new nucleus of M83 would represent about
10−3Macc, the mass that would be accreted during a Hubble time by a spiral galaxy such
as our own (Hernquist 1991) or like M83, which would also be dynamically dominated by a
massive halo (Aguero & Dıaz 2004).
Whatever the origin of the interloper mass, its presence and star-forming trail are con-
sistent with the suggestion that minor mergers and bar fueling are the main sources of bulge
growth in spiral galaxies (Combes 2001), which in turn could explain the correlation be-
tween supermassive black hole mass and galactic bulge mass (e.g. Ferrarese & Merrit 2000;
Tremaine et al. 2002; MSMBH ∼ 10−3Mbulge). This correlation can be extrapolated to the
Sbc morphological type of M83 and is consistent with the observations presented here: the
presence of a quasar remnant (MSMBH ∼ 108M⊙) can be discarded in this spiral galaxy from
our kinematic data. Notwithstanding, we might be in the presence of a circumnuclear disk
caught in the last stages of the evolution towards a collapsed object with nonstellar activity.
In this scenario the fate of M83 could be to evolve to an earlier type galaxy, eventually har-
boring an active nucleus, as might be expected from the statistical excess of active nuclei in
Sa galaxies (Ho, Filippenko & Sargent 1997), which also ties bulge formation and evolution
to massive black hole formation and evolution.
4. FINAL REMARKS
Summarizing, several pieces of observational evidence support the proposed capture and
star formation triggering picture: (1) the hidden mass concentration, detected by 3D near-
infrared spectroscopy, is precisely located at the younger end of the star forming arc; (2) the

– 11 –
optical nucleus is out of the galactic geometry center and seems to have a stellar trail possibly
pointing toward the geometric center; (3) the continuum maps at radio wavelengths and at
10µm have a strong tidal appearance, with the largest emission at mid-infrared wavelengths
located precisely at the position of the kinematically detected dark mass; (4) a possible
off-plane dust lane related to global H I map would end in the region of the hidden mass
concentration; (5) the age of the oldest clusters in the starburst arc would be about 25Myr,
similar to the dynamical crossing time of the central kiloparsec (∼ 26Myr); (6) the age
difference between the youngest and the oldest ends of the arc (a few Myr) would be similar
to the dynamical crossing time at a hundred parsec scale in M83. Therefore, the hidden
mass location and the inferred average cluster ages and the dynamical times clearly indicate
that the interloper has left behind a spur of violent star formation in M83, in a transient
event lasting less than one orbital revolution.
The origin of the interloper could be bar-funneled material or a cannibalized satellite,
and the fate of most of the involved masses could be a black hole merging or giant stellar
cluster. Whatever the nature and fate of this complex system, we surely (and luckily) are
witnessing a short event that yields a net growth of the galactic core in this grand-design
spiral galaxy, and the phenomena reported here should help to make a leap forward in our
understanding of the evolutionary picture of the final stages in a galactic minor merger or
a bar-funneled massive cloud. We remark that the reported ages and timescales imply that
the observed phenomenon is extremely short in galactic timescales (probability of occurrence
less than 1% in a given galaxy), and that its detection may be unique among the nearby
galaxies. The next step in our study is the execution of higher resolution numerical studies,
together with spectroscopic and imaging observations in the mid-infrared range, focused on
the (dark) largest dynamical center, which so far appears to be bright at these wavelengths.
Acknowledgements. R.D. thanks the support of the Instituto de Astrofisica de Canarias
(Spain) and the hospitality of its researchers. H.D. acknowledges support from CNPq (Brazil)
and Megalit/Millenium grants. E.M. thanks the support of the Euro3D RTN. We wish to
thank the Instrumentation Group at the Institute of Astronomy, Cambridge, for providing
CIRPASS and supporting the observations at the telescope. The Raymond and Beverly
Sackler Foundation and PPARC were responsible for the funding of CIRPASS. The Gem-
ini Observatory is operated by the Association of Universities for Research in Astronomy,
Inc., under a cooperative agreement with the NSF on behalf of the Gemini partnership:
NSF (USA), PPARC (United Kingdom), NRC (Canada), ARC (Australia), CONICET (Ar-
gentina), CNPq (Brazil) and CONICYT (Chile). The NASA/ESA Hubble Space Telescope
is operated by AURA under NASA contract NAS 5-26555. This work also was partially
supported by the CONICET grant PIP 5697.

– 12 –
REFERENCES
Arsenault, R., Roy, J.-R. 1986, AJ, 92, 567
Athanassoula, E. 1992, MNRAS, 259, 345
Aguero, M., & Dıaz, R.J. 2004, BAAA, 47, 360
Arribas, S., Mediavilla, E., & Garcia-Lorenzo, B. 1996, ApJ, 463, 509
Binney, J., & Tremaine, S. 1991, Galactic Dynamics, 44-45 (Princeton: Princeton Univ.
Press)
Combes, F. 2001, in The Starburst-AGN Connection, eds. I. Aretxaga, D. Kunth and R.
Mujica (Singapore: World Scientific), 223
De Vaucouleurs, G., de Vaucouleurs, A., Corwin, H., Buta, R., Paturel, G., & Fouque, P.
1991, Third Reference Catalog of Bright Galaxies, Springer, New York (RC3)
Dıaz, R., Carranza, G., Dottori, H., & Goldes, G. 1999, AJ 512, 623
Elmegreen, D., Chromey, F., & Warren, A. 1998, AJ, 116, 2834
Ferrarese, L., & Merritt, D. A. 2000, ApJ, 539, L9
Gallais, P., Rouan, D., Lacombe, F., Tiphene, D., & Vauglin, I. 1991, A&A, 243, 309
Genzel, R., Tacconi, L., Rigopoulou, D., Lutz, D., & Tecza, M. 2001, ApJ, 563, 527
Gimeno, G., Dıaz, R. J., & Carranza, G. 2004, AJ, 128, 62
Handa, T., Nakai, N., Sofue, Y., Hayashi, M., & Fujimoto, M. 1990, PASJ, 42, 1
Harris, J., Calzetti, D., Gallagher, J., Conselice, C., & Smith, D. 2001, AJ, 122, 3046
Heller, C., & Shlosman, I. 1994, ApJ, 424, 84
Hernquist, L., & Katz, N. 1989, ApJS, 70, 419
Hernquist, L. 1990, ApJ, 356, 359
Hernquist, L. 1991, in Warped Disks and Inclined Rings Around Galaxies (Knudsen), 96
Hernquist, L. 1993, ApJS, 86, 389
Ho, L., Filippenko, A., & Sargent, W. 1997, ApJ 487, 568
– 13 –
Kenney, J., & Lord, S. 1991, ApJ, 381, 118
Kormendy, J., & Richstone, D. 1995, ARA&A, 33, 581
Lundgren , A., Wiklind, T., Olofsson, H., & Rydbeck, G. 2004, A&A, 413, 505
Maciejewski, W., & Sparke, L. 2000, MNRAS, 313, 745
Malin, D., & Hadley, B. 1997, PASA, 14, 52
Mast, D., Dıaz, R. & Aguero 2002, BAAA, 45, 74
Mast, D., Dıaz, R., & Aguero, M. 2006, AJ, 131, 1394
Mediavilla, E., & Arribas, S. 1993, Nature, 365, 420
Mediavilla, E., Guijarro, A., Castillo-Morales, A., Jimnez-Vicente, J., Florido, E., Arribas,
S., Garca-Lorenzo, B., & Battaner, E. 2005, A&A, 433, 79
Park, O., Kalnajs, A., Freeman, K., Koribalski, B., Staveley-Smith, L., & Malin, D. 2001,
in ASP Conf. Ser. 230, Galaxy Disks and Disk Galaxies, ed. J.G. Funes and E.M.
Corsini (San Francisco: ASP), 109
Parry, I., Mackay, C., Johnson, R., McMahon, R., Dean, A, Ramaprakash, A., King, D.,
Pritchard, J., Medlen, S., Sabbey, C., Ellis, R., & Aragon-Salamanca, A. 2000, Proc.
SPIE, 4008, 1193
Petitpas, G., & Wilson, C. 1998, ApJ, 503, 219
Pinner, B. G., Stone, J. M., & Teuben P. J. 1995, ApJ, 449, 508
Rogstad, D., Lockart, I., & Wright, M. 1974, ApJ, 193, 309
Saslaw, W., & De Young, D. 1072, Astrophys. Letters 11, 87
Saslaw, W.C. 1975, in I.A.U. Symposium 69, Dynamics of Stellar Systems, ed. A. Hayli
(Dordretch: Reidel), 379
Sersic, J.L., & Pastoriza, M. 1965, PASP, 77, 287
Sakamoto, K., Matsushita, S., Peck, A., Wiedner, M., & Iono, D. 2004, ApJL 616, L59
Sofue, Y., & Wakamatsu, K. 1994, AJ, 107, 1018
Taniguchi, Y., & Wada, K. 1996, ApJ, 469, 581
– 14 –
Telesco, C.M. 1988, ARA&A, 26, 343
Thatte, N., Tecza, M., & Genzel, R. 2000, A&A, 364, L47
Tremaine, S., Gebhardt, K., Bender, R., Bower, G., Dressler, A., Faber, S., Filippenko, A.,
Green, R., Grillmair, C., Ho, L., Kormendy, J., Lauer, T., Magorrian, J., Pinkney, J.,
& Richstone, D. 2002, ApJ, 574, 740
Walker, I., Mihos, J., & Hernquist, L. 1996, ApJ, 460, 121
This preprint was prepared with the AAS LATEX macros v5.2.

– 15 –
Fig. 1.— HST false color optical image, combined from F439W, F555W, and F702W filters.
Point-spread functions were matched to a common resolution of 0.′′09. We determined the
average ages of the young massive star clusters in the arc (in 25◦ angular sectors) by using
the available data (Harris et al. 2001), which are depicted together with the age of the oldest
clusters in each sector. The integral field observed with the CIRPASS instrument attached
to the Gemini South telescope has been depicted together with the position of the main
rotation center found (the yellow circle corresponds to the 2 σ uncertainty radius). The
red features in the image inside the integral field area can be compared with the J-band
continuum image generated from the spectral data in Fig. 2. Note that the rotation center
(intruder nucleus) is at the youngest end of the partial ellipse that describes the positions of
the main star forming regions in the giant arc. Coincidentally, the dynamical crossing time
at this scale is about 5Myr. This evidence is consistent with a trail of violent star formation
triggered by the passage of the intruder nucleus.

– 16 –
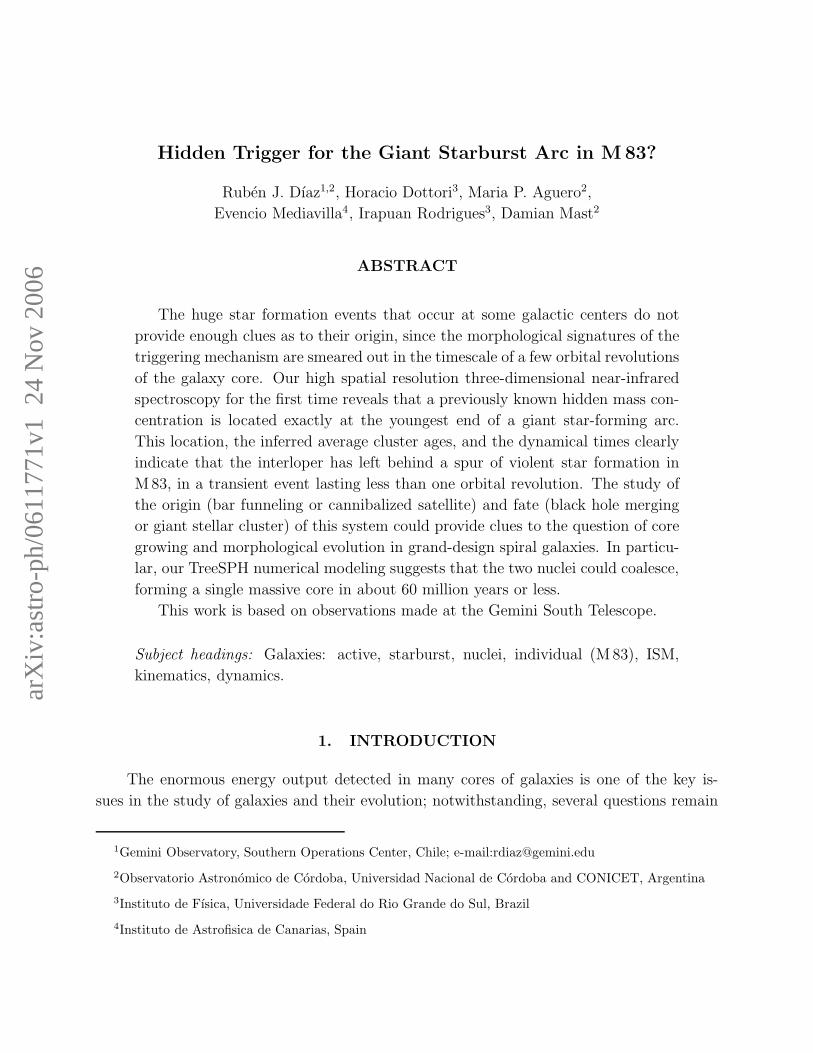
Fig. 2.— Left: Radial velocity map of the ionized gas, corresponding to the main integral
field observed with both nuclei. It corresponds to the field marked in Fig. 1. The step
in isovelocity lines is set equal to the average uncertainty, but the shape of the field does
not qualitatively change even at a 3 σ display. Right: Image generated from the continuum
emission in the spectral region 1.28µm (in the photometric J-band domain); the achieved
resolution is 0.′′6. The main features can be compared for reference with the reddest features
in Fig. 1. The yellow circle corresponds to the 2 σ uncertainty radius, and it is evident
that the main rotation center is dark at J-band wavelengths and is located far from the
visible nucleus position and from the geometrical center of the galactic bulge at near-infrared
wavelengths, which is marked with a cross.

– 17 –
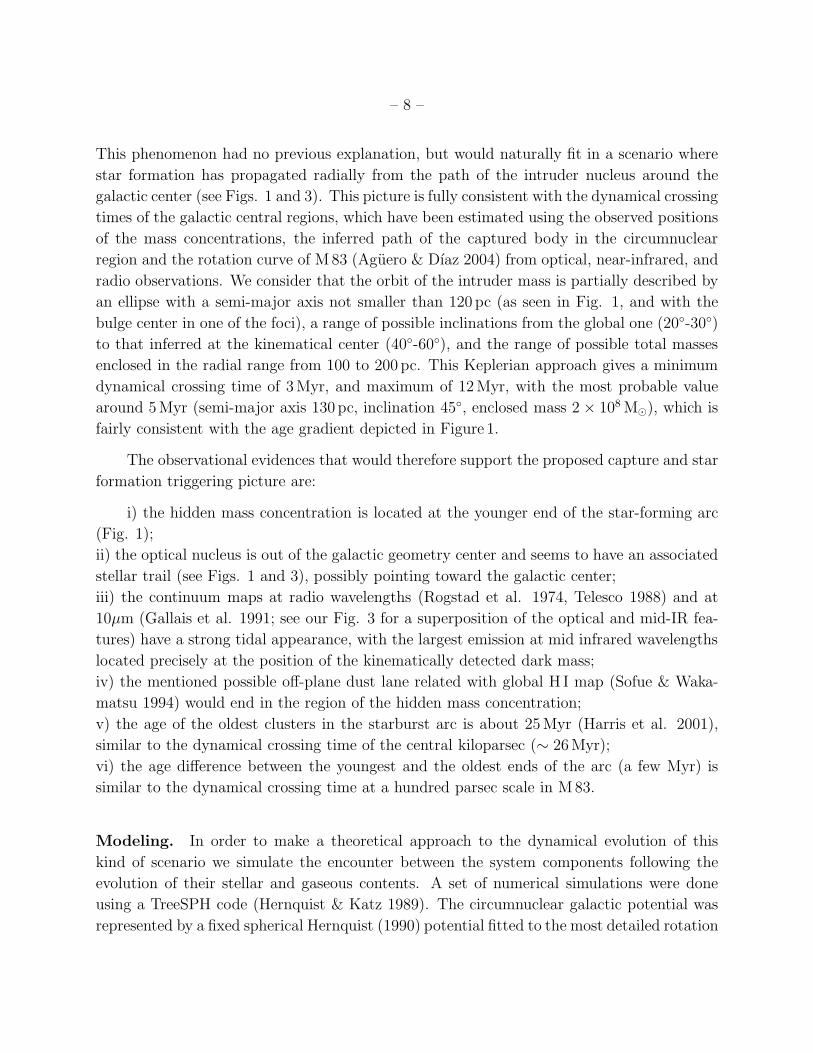
Fig. 3.— Image constructed from the filters F300W, F547M, and F814W. In this display
the youngest clusters of the field are enhanced. A strong tidal shape can be seen in the
mid-infrared continuum map at 10µm wavelengths (Telesco 1988), which is depicted in grey
isophotes using the corresponding position references (Gallais et al. 1991). The position
uncertainty of the rotation center corresponding to the intruder nucleus is marked with a
circle. Strikingly, this position is also coincident with the largest lobe in the mid-infrared
emission. Note the partial ellipses that describe the main regions in the giant arc and a
possible stellar trail of the optical nucleus.
– 18 –
Fig. 4.— Evolution of the encounter in terms of the separation between the main galaxy
nucleus and the mass barycenter of the captured body. Time is shown with respect to the
present configuration and the range of uncertainty arises in the unknown orbit inclination.
It can be seen that the optical original nucleus of M83 and most of the intruder mass would
probably form a single massive core in 50-70Myr. This massive core of a few 107M⊙ would
finally constitute the new nucleus of M83, implying a net growth of the central galactic
mass.