Embed Size (px)
Citation preview

'=hi, VI e This paper not to be cited without prior reference to the author s
Internationq.l Council for the C. M. 1976/E:32 -Exploration of the Sea Fisherie s Improvement Committee
1.
2.
On controlled discharges of oil hydrocarbons from
the Ekofisk field terminal p.1atforrn .----------.----------
by
Otto Grahi- Nielsen, Tore Neppelberg, Kar sten H. Palmork,
Kjell Westrheim and Svein Wilhelmsen
Institute of Marine Research, Directorate of Fisheries
P.O.Box 1870-72, 5011 Bergen-Nordnes
Norway
INTRODUCTION
The purpose of this investigation was to get a qualitative and
quantitative picture of the so called controlled discharge s of
oil hydrocarbons from the Ekofisk field terminal platform.
The discharges were mainly sea water which had been in contact
with the produced oil and therefore contained disolved or
emulgated oil hydrocarbons. The water is discharged from two
points, the Skimmer tank and the Sea sump.
The project was planned so that samples from these two discharge
points should be collected over a period of 24 hours, for analys~s
of oil hydrocarbons. The results of these analysis will be of use
in the setting up of instructions concerning discharges from field
terminal platforms.
COLLECTION OF SAMPLES
2. 1 The Skimmer tank. Production water, water accompanying the produced
oil, water from the oil and gas separators and other sources are
drained to the Skimmer tank (Fig. 1). The oil collecting on the

-2-
surface of the skimmer tank is separated from the water and
recycled to the oil production. The water is drained from the
bottom of the tank and discharged into the sea.
~
~A
[=:J B
Im c
~ ~
o E
Fig. 1. Diagram of the skimmer tank at the EKOFISK field
terminal platform. A = oil, B = water, C gas to flare,
D '" oil to the second stage separator and.E water discharged
to the sea.
Samples were collected six time s in two 2 litre separating funnels
and two 2.8 litre bottle s from a tap situated in a side branch
of the main drain (Fig. l, E). Before the sample collection, the
water was allowed to drain from the tap for some minutes to wash out
the tube and tap. The water at this point had a temperature of 38 QC, a
faint yellow colour and was cloudy due to suspended air bubles.
2.2 The sea sump is a 75 cm inner diameter tube extending from the
lower deck on the field terminal platform down to 26 meter
below normal sea surface level (Fig. 2).
The lower end of this tube is open but protected by a screen.
A pump is situated within this tube at the normal sea surface
level. Drains from the different decks and from the die sel
storage tank leads to the sea via the sea sump. Oil accumulating
on the top of the water in the sea sump is pumped back to the
production system. The pump is started and stopped
manually. There is no indication of the actual oil level in the
sea sump.

-3-
o
A 1 ZOm
D
.'J ~
Fig. 2. Diagram of the sea sump at the EKOFISK field terminal
platform. A =: buble tube, B = minimum oil level, C = maximum
oil level, D =: sea surface and E = pump.
Attempts were made to take samples from the lower end of the
sea sump (the water layer), using an aluminium bottle, open in
the upper end and equipped with a valve allowing water to flow
in at the lower end. The sampling bottle will then, when lowered,
be washed through and when it is hauled the valve will close and
the water sample from the wanted depth is taken. The purpose
was to take samples from 3 meter above the lower open end of
the sea sump and from a level 6 meter s above. When the sample s
wa s hauled through the oil-layer in the sea sump, part of that oil
remained on top of the water in the sampling bottle. This oil
was carefully decanted off and the water salnple drawn from the
lower end through the valve and collected in 2.8 litre sample
bottles. Each haul resulted in a 0.8 litre sample.

-4-
The sampling- bottle was trapped in the installations in the
the third haul, so that further sampling from the sea sump
2.3. Condensate-Skimmer tank A drain tube from the bottom of this
tank is connected to the drain from the main Skimmer tank so
that water from this tank is also drained to the sea. It was
difficult to obtain a satisfactory sample from the tap installed
in the drain, possibly because oitoo little flow through the system.
At the first attempt only a few hundred ml were obtained,
of which <;>nly 100/0 was water. Later a greater volume was
obtained of which approx 10% was an organic phase. This
organic phase was separated in a separating funnel and stored
for analysis. The water sample was drawn into a 2.8 liter
sample bottle.
2.4. Production water. To get a representative sample of the water,
which is produced with the oil, a sample was collected from
the bottom of the fir st stage separator. This sample also
contained oil. The oil and water sample was stored separately.
2.5 Sediment samples. Four attempts were made to sample sediments
with a 13 kilogram gravity corer, but with no succe s s,
2.6
pro bably due to the nature of the bottom (gravel and
pebbles) or from washing out of the sediment core during the
hauling caused by the heavy wave action at the surface.
Crude oil. Two samples, each 100 ml of crude oil
were taken from a tap in the production system after the third
stage separator, for use as reference s in the analysis of the
collected samples.
3. SAMPLE TREATMENT
3.1 Water samples in separating funnels. These samples were
extracted, imediately after collection in a laboratory situated
on the same deck as the skimmer tank. The extractions were

-5-
performed using 3 x 40 ml of dichloromethane. The separating funnel
was shaken vigorously for 2 minutes. From the first 40 ml
added only lO ml were left partly) because of evaporation
(high temperature) and solution of dichloromethane in the water
phase. Of the next 40 ml portions added practically all remained
as the dichloromethane phase, giving a total of 80 - 90 ml.
The combined extracts were kept in 100 ml sample bottles with
a teflon lined screw cap.
The efficiency of the extraction procedure was tested by extracting
the sample again with 3 x 30 ml dichlorolnethane and keepin
this extract separately for further analysis. Two blank samples
were also performed shaking an empty separating funnel with
3 x 30 ml of dichloromethane. Before the analysis were started
all the extracts were adjusted to the same volume (90 ml ) and
the sample s dried using approx. 5 grams of dry sodium sulphate.
3.2 Water samples collected on 2.8 litre bottles. Immediately after
collection of the samples approx. lO ml of dichloromethane
wa s added to prevent any biological activity. The bottle s
were provided with an aluminiumfoil 1 ined screw cap before
transportation to the institute. The samples from the skimmer
tank was then extracted as described above. The samples of the
production water and the water from the sea suY4P were extracted
three time s with 3 x 30 ml dichloromethane. This was done
because the fir st set of extractions were strongly brown coloured
and the second set of extraction had also a faint colour.
To enable a sear ch for acidic cOlnponents in the skimmer tank
water the sample s were acidified to pH = l, using concentr ated
sulphuric acid (approx. 1 ml acid per litre of water) and then
extracted according to the method already described above.
The extracts were evaporated to approx 5 ml and then extracted
with 3 ml of I N sodium hydroxide. During this procedure the
acidic components will be extracted from the bulk of components
in the dichloromethane extract. The alkaline solution wa s
4.
4.1
- 6-
acidified and extracted with benzen, evaporated and a solution
of diazomethane in ethylether was added and allowed to react
for 5 minutes at room temperature. The result of this
treatment is methylesters of the acidic components, which
enables a better gas chromatographic separation and analysis.
ANALYSIS
Identification. Dichloromethane was removed from five ml
portions of the extracts using a stream of dry nitrogen,
the residues were then dissolved in a controlled volume of
carbondisulphide. Samples of the resulting solutions were
analysed using a computerized gac chromatograph-mass spectro
meter; Finnigan 3200 E-6100 equipped with a 20 meter OV-l
glas capillary columl).. The mass spectra of the separated
peaks in the gas chromatograms were used for identifications.
The results are given in Table 1.
Table 1. Identified hydrocarbons in water samples from
the Skimmer tank at 20.30 hours, November 18th , 1975.
Components
Benzene
Toluene
Xylene
Trimethylbenzene s
Tetramethylbenzene s
Naphthalene
Methylnaphthalene s
Dimethylnaphthalene s
Trimethylnaphthalene s
Phenanthrene
Phenol
Methylphenoles
Dimethylphenoles
Trimethylphenoles
Alkanes C 13 - C29
Fatty acids
Benzoic acids
Amount in mg,'l
3
0,6
0.7
0.004
2
0.9

-7-
4. 2 Quantification. The quantification was performed in the
three following ways:
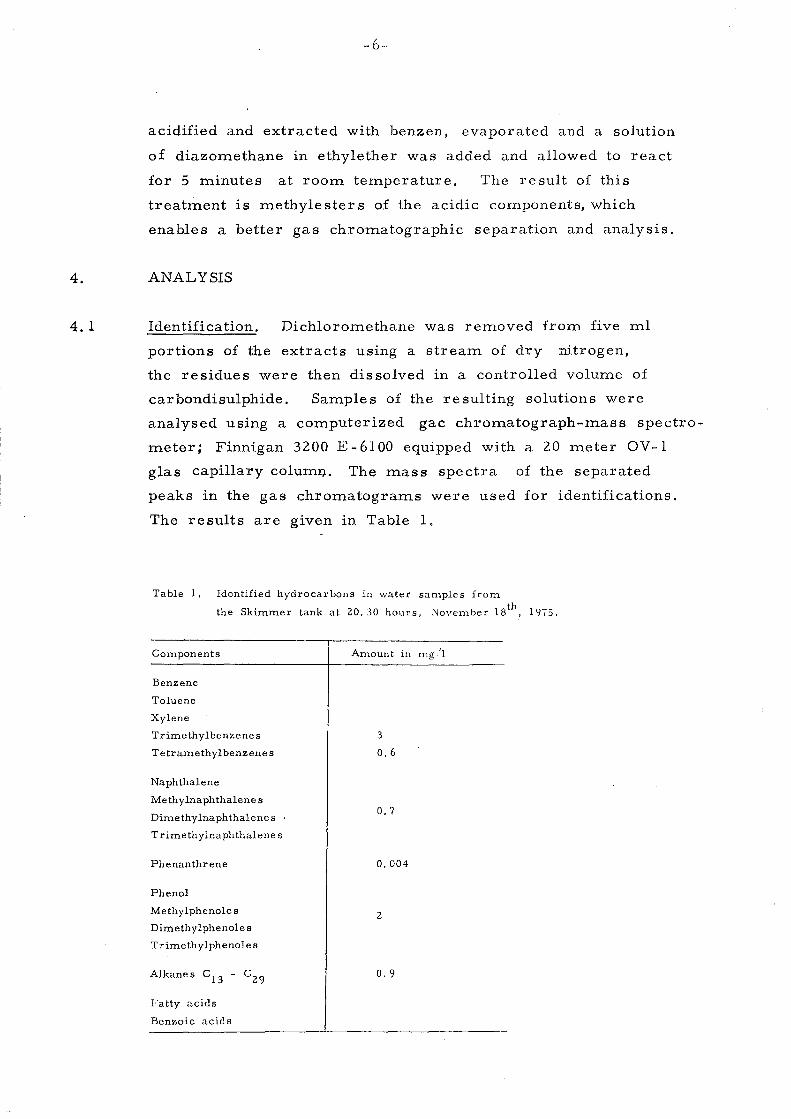
4.2.1 The volatile components benzene, toluene and the xylene s were
dominating. The quantification of the se components were
performed by gas chromatography of 2.0 pI of the total extracts
using a OV -1 packed column. An exalnple of such a chromatogram
is shown in Fig. 3. The three isomeric xylenes, ortho, meta
and para were not properly separated on this column, the meta
and para xylenes are overlapping each other. The amount of
each of the components in the sample s was calculated from the
area of the peaks ip. the respective chromatograms. From a
calibration curve, based on accurately weighed benzene and
toluene a response factor was found for both components to be
27.5 area units per pg injected component. The same respons-
factor was used for the xylene s,
Table 2.
The re sults are given in
Table 2. Hydrocarbonconcentrations (mg/1) in water samples
from the Skimmer tank, Sea sump alld after the fir st th th
stage separator. Sample s taken the 18 - 19 November
1975 on the Ekofisk field terminal platform.
Benzene Toluene Xylene Others
Skimmer tank
1500 hours
1730 " 2030 " 0030 " 0600 " 1145 "
Seasump
1500 hours
1. stage sep.
2200 hours
28 21 8 8
45 40 14 20
81 (83) 64 (63) 21 (21)
35 33 10
62 54 17
31 (38) 29 (32) 10 (12)
1100
500
The values in brackets represent samples collected
in 2.8 litre sample bottles, which were extracted
at the Institute of Marine Research.
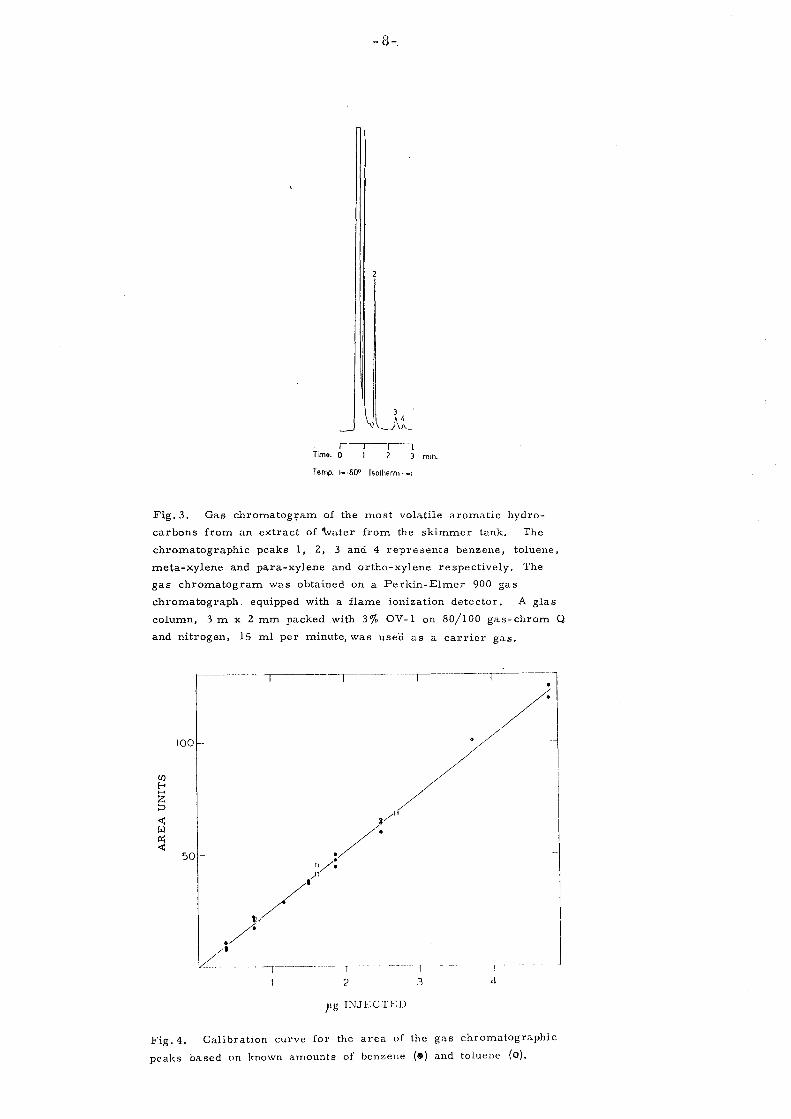
Fig. 3.
r Time. 0
- 8-_
3 4
Temp. f- 5()o Isotherm--.
min.
Gas chromatogram of the most volatile aromatic hydro-
carbons from an extract of '\.vater from the skimmer tank. The
chromatographic peaks 1, 2, 3 and 4 represents benzene, toluene,
meta-xylene and para-xylene and ortho-xylene respectively. The
gas chromatogram was obtained on a Perkin-Elmer 900 gas
chromatograph_ equipped with a flame ionization detector. A glas
column, 3 m x 2 mm packed with 3 % OV -Ion 80/100 gas- chrom Q
and nitrogen, 15 ml per minute, was used as a carrier gas.
Cl)
E-<
Z :::> ~ w ~ ~
100>--
50'-
/' I!-!/
./ /t
--I" -------I------.--r-/--:l
./!/" 0/:
)1
-----1-·----------- r - --- --------- r
2 3 4
pg INJECTED
Fig. 4. Calibration curve for the area of the gas chromatographic
peaks based on known amounts of benzene (a) and toluene (0).

4.2.2
4.2.3
'::r
- 9-
The main portion of the other aromatic components were
quantified using GC/MS. An internal standard, namely
fluorene, was added to each of the total extracts. Then
the dichloromethane was, removed by a stream of dry· nitrogen
and the residues taken up in a measured volume of carbon
disulphide and aliquotes injected on the GC/MS. Mass frag
mentograms based on the molecular ion of the different components
were then recorded using the GC/MS;
The amount of the different components was calculated by
comparing the area of the fragmentograms of a known
amount of fluorene. The results are given in Table 1.
Apart from the components present in concentration high enough
to show up as peaks in the chromatograms, the unresolved
components show up as an envelope (Fig. 5). This is due
to the fact that the· separation power of an ordinary gas
(;hromatografic column do not separate all the branched
alifatics, cyclic alifatics, aromatics and the other components
present in oil.
To measure the total content of oil hydrocarbons in the
sample s, however, this envelope must also be quantified.
The dichloromethane was therefore removed from 5 ml portions
of the extracts as described above (4.1) and the residues
dissolved in 200 pI dichloromethane and 2.0 pI aliquotes of
this solution was then chromatographed. A 1 ml solution of
15.2 mg of the crude oil-reference (2. 6) was made and 2.0 pI of this solution (30.4 pg crude oil) was chromatographed under
the same condition giving the result; 1 pg crude oil :;: 18.5 area
units. The calculation of. total oil hydrocarbons in the samples
can thus be done (MEDEIROS and FARRINGTON, 1974).
The areas were determined by cutting and weighing. The
results are shown in Table 2.
The content of hydrocarbons in the extracts from the sea sump
and production water were high enough to be chromatographed

, , , , ,
\1'
\ \
-10
----------- ---- --_ .. "
~ ;
" ,,------_.- - - ------------_.
m: I ~i i,
l ('
u J~~wJJJY' Time 0--[-- ----- -- -- - -- -- 31.5-~------ L.b mln
Temp. 80 80 . --·-·-~300---~ 'c .... Iso ........ ---~- - S"/min. ---------- ... -. Iso ...............
Fig. 5. Gas chromatograms of, from the top; EKOFISK crude,
extract of production water from the fir st stage separator, extract
of water from the skimmer tank and extract of water from the s' a
sump. The broken line represents the baseline of the chromat·
grams found by chromatography of pure solvent under identical
condHions.

-11-
without any preconcentration before the quantitation of the
envelope.
4.3 Sources of error. The quantitation of benzene, toluene
and xylene was based on chromatography of two paralells
5
of each extract.
was approx 2 0/0. The mean deviation between two paralells
Each sample was taken in duplo (2.1),
thus resulting in two extracts, The rnean deviation calculated
on the basis of the se four deterrninations wa s approx. 5 0/0. In
addition to this the respons factor 27.5, which was used to.
calculate the concentrations (4.2. 1), have some degree of uncer
tainty because the' chromatographic condition used, did not give
a baseline- separation.
The values for benzene, toluene and xylene given in
Table 2 is therefore belived to have a maximum error
of 100/0.
The re st of the values, based on rnas s fragmentography
(4.2.2) and area determination of the envelope (4.2. 3) is
believed to have a mean deviation slightly rnore than 10 0/0, allthough no systematic inve stigation on the accuracy has
been performed.
DISCUSSION
The samples from the skimmer tank were extracted with
3 x 40 ml dichloromethane, as described under 3.1, which
quantitativly removed benzene, toluene and xylene from the
water phase. Repeated extractions with 3 x 30 ml dichloromethane
only gave insignificant amounts of these Components, The
production- and sea sump water saITlple s, however, had to be
extracted twice. The second extraction, using 3 x 30 ml,
gave about 10% of the amount from the fir st extraction.

-12-
The analytical methode used gave a quantitativ recovery
of benzene. Tests were performed to show this by dissolving
174 mg benzene, using a calibrated 200 ul Carlsberg pipet
in 2.2 litre of sea water, i.e. concentration of 79 mg/I.
This sample was prepared and analysed according to the
described method and gave a recovery of 83 mg/l benzene,
e. g. 105 %, which is within the accuracy of the method used.
The 2.8 litre water samples (3.2) which were brought back to
the Institute and extracted in the laboratory gave the same
results as those extracted in the field laboratory (Table 2).
Extractions in future control activity could therefore be
performed on the sampling site.
Benzene, toluene and xylene are the dominating hydrocarbons
in the water discharged from the skimmer tank. The other
hydrocarbons accoul'lted for only approx. 10%, both for the
sample with the lowest content, (at 15 00 hours) and the sample
with the heighest content, (at 20 30 hours) see Table 2.
A routine check on the hydrocarbon content of discharge
water could therefore be limited to the analysis of benzene,
toluene and xylene.
The relatively high content of hydrocarbons in the discharged
water could perhaps indicate that gravimetric analysis should
be the most proper analytical method to use. Since, however,
benzene, toluene and xylene are very volatile, they would
partly or totally disappear, during the evaporation of the
extraction solventl even if the very volatile dichloromethane is
used. A gravimetric analytical method is therefore not
recommendable in this connection.
For these volatile components gas chromatography has proved
to be a suitable analytical tool. Benzene, toluene and xylene
have very little retention time on the column-material used,

-13-
QV-I, which Inakes it difficult to get a complete separation
of benzene frOIn the solvent used. In future investigations
another coluInn Inaterial, giving higher retention tiInes for
the low boiling aroInatic hydroca:r.bons~ will be chosen.
Benzene, toluene and xylene are strongly concentrated in the
skiInIner tank water cOInpared to the com.position found in
the crude oil. A gas chroInatogl'aphic - m.ass spectroInetric
analysis of the crude oil sampled at the third stage separator
(2. 6) showed a content of approx, O. 1570 benzene and 0.5 % toluene. The relative content of benzene and toluene in the
hydro'carbons extracted frOIn the production water, saInpled from
the first stage separator (2.4), showed to be corresponding.
The gas chroInatograIn of the production water extract could
be Inistaken for the gas chromatogram of the crude oil
(Fig.5), which indicates that the hydrocarbon content in the
production water is an emulsion of crude oil in the water.
The chroInatograIn of the skirnrner tank water extract
(Fig. 5) is essentially different from the chromatograIn of the
crude oil, in that it contains higher concentration of the Inore
volatile cOInponents, early in the chroInatograln, such as
benzene, toluene and xylene. This indicates that these components
in the skiInIner tank water do not originate froIn the production
water, but rather froIn the water froIn the gas scrubber systeIn,
which ends up in the ·skiInmer tank. Due to the relative high
teInperature of the produced oil, the D ... ost volatile hydro-
carbons will be present as gas. The gas is separated £rOIn the
oil in the separator and led through a separate cleaning and
drying systeIn. Since these cOInponents belong to the Inost
water soluble hydrocarbons, they will be dissolved in the \vater
during this process and this water drains to the skiInIner tank.

-14-
It is essential for the calculation of the total discharge of oil
hydrocarbons from a skimmer tank that a flow meter is
installed in the drain tube from the tank.
The salinity of the production water was very high, 49 0/00,
compared with the sea water, 35 0/00. Water samples from
the Skimmer tank varied between 37 and 42 0/00, there was,
however, no correlation between salinity and hydrocarbon content.
Water samples from the sea sump had a hydrocarbon content
exceeding 1000 mg/l, mostly less volatile components, whi,ch are
eluted from the gas chromatographic column as the characteristic
envelope at about 300 QC (4.2.3). These components have most
probably been in suspension in the water rather than in solution.
It should be noted that the high value is based on one sample
only and that the conditions during the sampling was not satis
factory, since the sample was hauled through the oil layer in
the sea sump.. Precautions was taken though, to prevent any
of this oil to contaminate the water sample during the transfere
to the sample bottle (2.2).
The sea sump seems not to be suitable for its purpose, even if it
goes down to 26 meters below normal s'ea surface level.
The wave action sets up a rather big vertical movement of the
water/oil column within the sea sump, which was evident during
the sampling from the strong current of air going in and out
through the sampling hole. This will reduce the
separation of the oil from the water phase and increase the
dis solution and emulsification of oil in water, An installation of
a proper sampling system is nessessary before a clear picture of
the oil hydrocarbon' content of the discharged water through the
sea sump can be established.
Benzene and benzene derivatives are of the most volatile and
mo st soluble fractions in crude oil. The relative high solubility
in water render them more available for the marine organisms,
they belong to the more toxic components and therefore more harmfull to the marine ecosystem.

,'. -15-
Laboratory experiments has shown that 35 mg/1 of benzene or
toluene was lethal to freshwater fish (PICKERING and
HENDERSON' 1966). For salmon fry 10 mg/l of benzene had
a narcotic effect (BROCKSEN and BAILEY 1973). A starting
concentration of 40 mg/l of benzene reduced to 10 mg/l
within the next 24 hours had a 50% lethal effect on herring eggs,
but half the concentration had the same effect on herring fry.
(STRUHSAKER, ELDRIDGE and ECHEVERRIA 1974). It has
also been shown that less than 50 mg/l benzene, toluene or
xylene has a 100% lethal effect on a few weeks old salmon
fry in 48 hours (MORROW, GRITZ and KIRTON 1975).
These components will also have a harmful effect on marine
organisms in lower concentration. It is much more complicated
to find out at which level sublethal effects start. Observations
indicate that values down to 50 pg/l of oil hydrocarbons affects
the photosynthesis in phytoplankton. (GORDON and PROUSE 1973).
As a guideline can be suggested that the concentration of oil
hydrocarbons under no curcumstance s should exceed one thousandth
of the level found to have a lethal effect.
Because of the high volatility of benzene and its derivatives,
it is to be expected that they will evaporate relatively rapid
from the water in which they are dis solved. It has been found
that up to 75 % of dis solved benzene was evaporated from
stagnant water at 12 QC during 24 hours (STRUHSAKER,
ELDRIDGES and ECHEVERRIA 1974).
The present investigation should be extended to an analysis
of the distribution of petroleum hydrocarbons in the water around
the Ekofisk field and to an analysis of eventual hydrocarbons
in the tissue of marine organisms in the area.
-16-
REFERENCES
BROCKSEN, R. W. and BAILEY, H. T. 1973. Respiratory
re sponse of juvenile Chinock Salmon and Striped
Bass exposed to benzen, a water- soluble component
of crude oil. Proc. of Joint Con£. on Prevention
and Control of Oil Spills. Am. Petr. Inst. Washington
D. C. : 783-791.
GORDON, D. C., Jr. and PROUSE, N. J. 1973. The effects
of three oils on marine phytoplankton photosynthesis.
Mar. BioI., 22 : 329- 333.
MEDEIROS, G. C. and FARRINGRON, J. W. 1974. Idoe-5
intercalibration sample: Results of analysis after
sixteen months storage. Marine Pollution Monitoring.
Nat. Bur. Stand. (U. S.), Spec. Publ. 409 : 167-169.
MORROW, J.E., GRITZ, R.L. and KIRT'ON, M.P. 1975.
Effects of some components of crude oil on young
Coho Salmon. Copeia 2 : 326-331.
PICKERING, G. H. and HENDERSON, C. 1966. Acute toxicity
of some important petrochemicals to fish. J. Water
Pollution Control Fed., 38 (9) : 1419-1429.
STRUHSAKER, J. W., ELDRIDGE, M. B. and ECHEVERRIA, T. 1974.
Effects of benzene (a water- soluble component of crude
oil) on egg s and larvae of pacific herring and northern
anchovy. Pollution and Pllysiology of Marine Organisms.
Ed. Vernberg, F. J. and Vernberg, W. B. Academic
Press N. Y. : 253-284.