Embed Size (px)
Citation preview

The State of the Hi-Tech Supply Chain Industry Report
By Haley Garner, Head of Content and Research, eft. March 2016

http://events.eft.com/hitech/ www.eft.com 2
Introduction
The hi-tech industry has gone through some significant changes over the last
5 years driven primarily by shifts in consumer demand. This era is hitting a state
of maturity as global demand wavers and hi-tech supply chains are left keeping
on top of fluctuating demand. Areas of clear revenue for hi-tech companies are
still abound. Aftermarket sales is starting to show real ROI while risk mitigation is
becoming more and more advanced. That being said, the year ahead is going to be
a challenge. How are hi-tech companies going to adapt to mixed global demand?
Enablers: Solution providers, logistics service providers and other providers of
services to hi-tech and electronics manufacturers and retailers.
Shippers: Manufacturers and retailers in the hi-tech industry that ship products
Respondents: 180. What is your company’s annual revenue?
$0 – 50 m
37.7%
$50 – 250 m
11.5%
$250 – 1 b
6.2%
$1 b +
44.6%
What region are you based in?
North America18.5%
South America6.2%
Europe44.6%
Middle East & Africa 6.9%
Asia Pacific23.8%
What best describes your business type?
30.7%Hi-Tech or Electronics
Manufacturer, Retailer or Distributor or Contract Manufacturer
30.8%3PL, 4PL or Transport or Logistics Solution
Provider
38.5%Supply Chain IT or
Technology Solution Provider
http://events.eft.com/hitech/ www.eft.com 3
There are some distinct differences in the ways and their shipper counterparts
are predicting growth in hi-tech this year. Overall, enablers are more positive on
their industry outlook with 58% seeing moderate to major growth (between
5%-10%).
Shippers aren’t nearly as positive about 2016 though. 50% of respondents
predict slow or stagnant growth (0-5%) while a further 8% predict a decline in
growth. Shipper growth trepidation isn’t surprising given the current economic
environment. The industry is currently seeing slowing growth even amongst
some of its biggest players as recent smart phone/tablet market has matured.
Slow growth in major consumer markets are also contributing to this stagnant
growth. Global economic recovery is likely to have the strongest impact on
changing shipper pessimism.
Expected industry growth
ENABLERS: What rate of growth are you expecting in the hi-tech
industry this year?
SHIPPERS: What rate of growth are you expecting in the hi-tech
industry this year?
n Major growth (10%+) n Moderate growth (5%-10%) n Slow growth (1-5%) n Stagnant growth (0%-1%) n Decline in growth (negative
growth)
15.6%
42.2%
32.2%
7.8%
2.2%
n Major growth (10%+) n Moderate growth (5%-10%) n Slow growth (1-5%) n Stagnant growth (0%-1%) n Decline in growth (negative
growth)
2.5%
40%
32.5%
17.5%
7.5%
http://events.eft.com/hitech/ www.eft.com 4
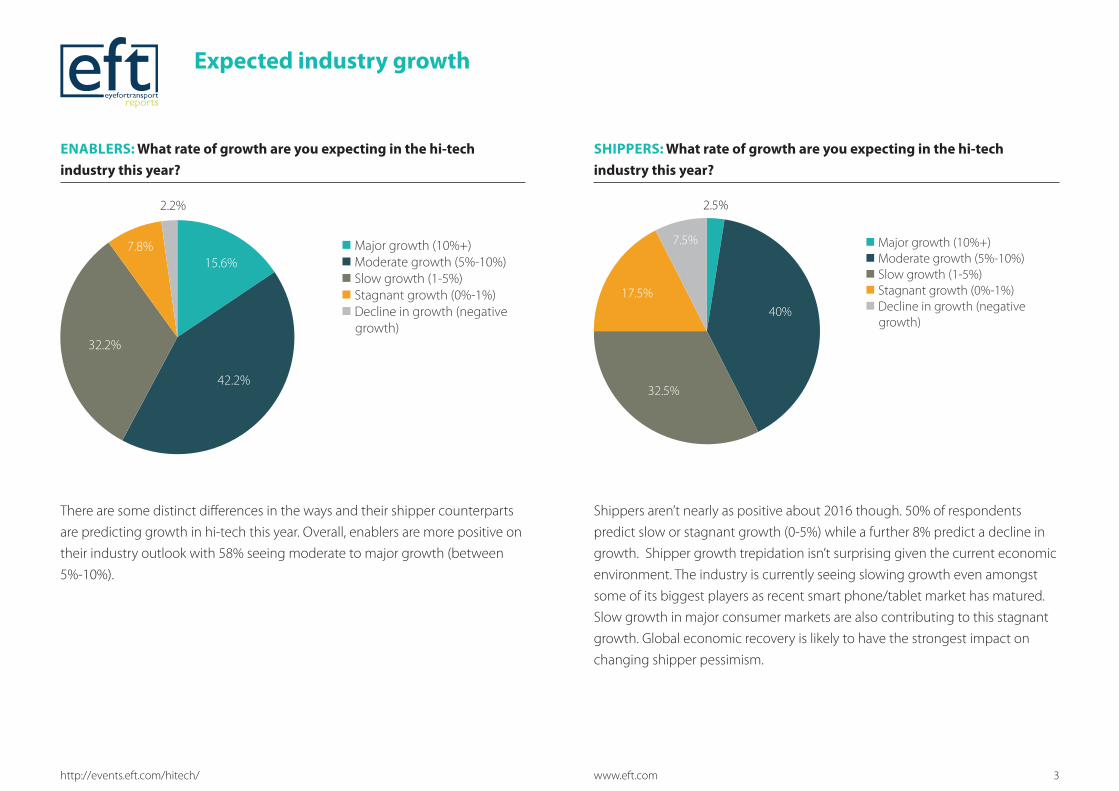
India has received a lot of press
coverage over its recent growth.
A number of companies – namely
logistics providers – are looking
to break into this market to take
advantage of the growth and the
infrastructure short-falls. However,
India has some significant barriers to
entry for foreign companies mean-
ing it is less likely to rank highly on
the shipper front.
In fact, shippers are seeing most
opportunities in China still, despite
the country’s recent economic hard-
ships. Asia as a whole still represents
a significant opportunity for shippers
in hi-tech.
ENABLERS: Where are you seeing the greatest market opportunities?
SHIPPERS: Where are you seeing the greatest market opportunities?
Expected regions of growth
India China North America
Other Asia
Western Europe
Eastern Europe
Africa Brazil Russia Mexico Other South
America
42.2% 38.9% 33.3% 30%
25.6% 23.3% 20% 13.3% 8.9% 7.8% 6.7%
0%
5%
10%
15%
20%
25%
30%
35%
40%
45%
China India Other Asia North America
Western Europe
Eastern Europe
Mexico Africa Brazil Russia Other South
America
60% 52.5%
42.5% 37.5% 27.5% 22.5% 20% 20% 15% 10% 10%
0%
10%
20%
30%
40%
50%
60%
70%

http://events.eft.com/hitech/ www.eft.com 5
Global sourcing
China is the consensus sourcing
region of choice for shippers and
their enabler counterparts. South-
east Asia also ranks highly by both
shippers and enablers. Things then
differ though between shippers
and enablers. Shippers see Western
Europe and Japan as top sourcing
locations with enablers preferring
Eastern Europe. One of the reasons
that might explain this discrep-
ancy in responses is that enablers
are working more with emerging
markets currently. Additionally, the
shipper respondents to the report
are predominantly from large,
established hi-tech firms who have
a much longer sourcing history in
areas like Japan and Western Europe.
ENABLERS: Where are your customers currently sourcing the bulk of their components/materials?
SHIPPERS: Where are you currently sourcing the bulk of your components/materials?
China South Korea
South-East Asia
Eastern Europe
Other Asia Western Europe
Japan India North America
Latin America
Africa
83.3%
26.7% 26.7% 17.8% 16.7% 15.6% 14.4% 14.4% 14.4% 11.1% 5.6%
0%
10%
20%
30%
40%
50%
60%
70%
80%
90%
China South-East Asia
Western Europe
Japan Eastern Europe
North America
Other Asia South Korea India Latin America
Africa
75%
50% 40%
27.5% 25% 25% 15% 12.5% 10% 7.5% 5%
0%
10%
20%
30%
40%
50%
60%
70%
80%

http://events.eft.com/hitech/ www.eft.com 6
SHIPPERS: Over the last year, how has your product lead-time changed?ENABLERS: Over the last year, how has your customers’ product lead-
time changed?
Lead-times
n Increased n Decreased
28.9%
71.1%
n Increased n Decreased
42.5%
57.5%
There’s a sense that product lead-times have been decreasing over the years
due to a combination of improved technologies, efficiencies and prevalence of
data. However, is that necessarily the case?
Enablers certainly think lead-times are decreasing with 71% indicating that
this is what they’re seeing with their customers. Shippers on the other hand
aren’t seeing quite this decrease. While 57% have seen a decrease, 42% have
actually seen increases in lead-times. The hi-tech industry continues to become
more complex. As such, lead-times aren’t about to disappear – they are likely
to continue to fluctuate as markets shift, sourcing shifts and new products
continue to underpin hi-tech growth.
Another angle we’ve heard some executives mention in interviews is the idea
that short lead-times are not necessarily beneficial in stagnant growth. The
competitive nature of hi-tech means the onus is on getting the product right
rather than releasing multiple iterations in quick timeframes. As such, increasing
lead-time isn’t necessarily indicative of an inefficiency, but of a tactic.

http://events.eft.com/hitech/ www.eft.com 7
ENABLERS: What has been the most effective mechanism for a shipper in
hi-tech to increase the agility of their supply chain?
SHIPPERS: What has been the most effective mechanism for increasing
the agility of your supply chain?
Agility
Supply chains are increasing in complexity. This is being driven by increased
competition, the availability of technology, prevalence of data and speed of
the supply chain. The key here is that companies operating in supply chain are
going to have to ensure agility in order to respond to any shifts or changes in
their industry.
For enablers, leveraging logistics provider partnerships was seen as the best
way for hi-tech shippers to increase their agility. 18% of respondents felt that
implementing more efficient communication technologies was key for increas-
ing agility.
For shippers, more efficient communication was the most important mech-
anism for maintaining agility. Though 22.5% of shippers also felt logistics
partnerships were a key aspect of achieving agility as well.
Partnerships as well as communication are clearly important factors for supply
chain agility. In fact they go hand in hand – a constructive logistics partner-
ship requires efficient communication – especially as far as data sharing is
concerned. Despite shippers ranking communication ahead of partnerships,
it seems like shippers and enablers are on the same page when it comes to
achieving agility.
10%
14.4%
40%
5.6%
17.8%
5.6%6.7% n IoT
n Predictive analytics n Logistics provider n Rethinking risk strategy n Implementation of more efficient
communication technologies n Implementation of other
technologies n Outsourcing non-logistics
services
n IoT n Predictive analytics n Logistics provider partnerships n Rethinking risk strategy n Implementation of more efficient
communication technologies n Implementation of other
technologies n Outsourcing non-logistics
services
5%
17.5%
22.5%
2.5%
30%
15%
7.5%

http://events.eft.com/hitech/ www.eft.com 8
Full service logistics providers are benefitting from supply chains looking to
increase their agility. Enablers in fact have highlighted this as the top invest-
ment they see shippers benefitting when it comes to creating a more agile
supply chain. Visibility, which has clear ties to both communication and partner-
ships as highlighted above, also ranks highly for enablers.
Shippers see things differently though. Back-end systems dominate shipper
investments, a reflection of their need for more efficient communication. With
data being one of the key things underpinning communication, it’s no surprise
seeing data-specific solutions come second in investments. Shippers also rank
full-service logistics providers at a similar level, further emphasizing the shift
from specialist LSPs to full service ones.
Agility investments
ENABLERS: Where are your customers investing most to increase their
supply chain agility?
SHIPPERS: Where are you investing in most to increase your supply
chain agility?
n Back-end management systems – ERP, TMS, etc.
n Front-end tech systems – CRM, Social media data metrics, apps, etc.
n Full-service logistics providers n Last mile logistics providers n Data-specific solutions n Warehousing space n Visibility technology - IoT, RFID,
etc.
17.8%
12.2%
27.8%7.8%
13.3%
3.3%
17.8%n Back-end management systems –
ERP, TMS, etc. n Front-end tech systems – CRM,
Social media data metrics, apps, etc.
n Full-service logistics providers n Data-specific solutions n Warehousing space n Visibility technology - IoT, RFID,
etc.
42.5%
12.5%
15%
15%
2.5% 12.5%
http://events.eft.com/hitech/ www.eft.com 9
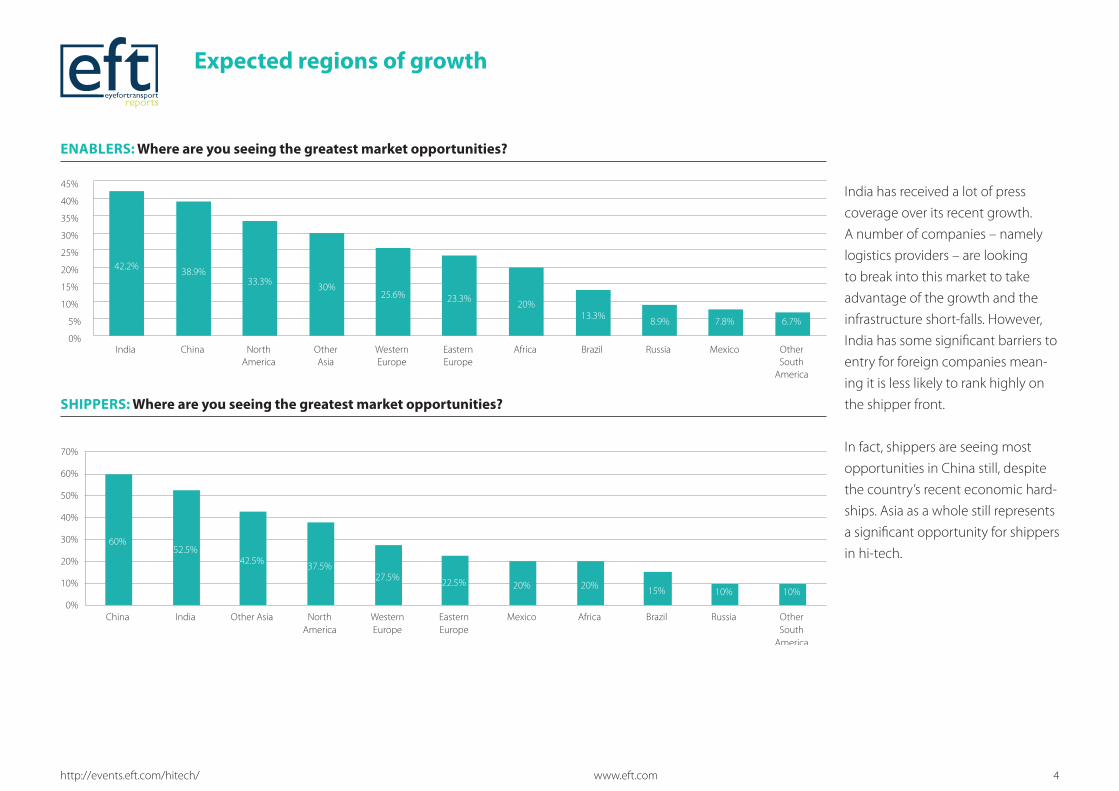
Demand planning improvements have been due to three primary drivers: Sales
and Operations Planning improvements, visibility into supply chain partner
data and predictive analytics. We’re likely to see predictive analytics play a much
more significant role in demand planning as the ability to make predictions off
of historical sales and marketing data increases. In addition, S&OP is going to
have to reshape to deal with these new predictive realities.
While S&OP and predictive analytics are pushing demand planning further, supply
chain partner data has been an area of contention in recent executive interviews eft
has conducted. The digital supply chain has led to the increase in value of supply
chain data. Before, communication between supply chain partners was one of the
greatest difficulties for sharing data. Now, data is seen by many organizations as
proprietary and a differentiator. As such, while the amount of data is increasing in the
supply chain, the amount shared might not necessarily increase at the same rate.
Demand planning
SHIPPERS: What tool has helped you the most in improving your
demand planning?
n Predictive analytics n A complete view of supply chain
partner data n Social media analytics n External data inputs into your
analytics systems (Such as weather and trends but not including IoT)
n IoT technologies n S+OP improvements
20%
30%
2.5%2.5%
45%

http://events.eft.com/hitech/ www.eft.com 10
59% of enabler respondents say their customers are increasing the number
of services they’re offering with their products. It is interesting that solution
providers have under-estimated this movement with their hi-tech customers
given the shift from cost-center to profit center that is occurring in the after-
market sales services realm.
63% of shippers are increasing the number of services they offer with their
products – especially from an aftersales perspective. This perhaps under-
pins how hi-tech companies are turning aftermarket sales into profit – by a
concerted effort to provide services related to a product.
SHIPPERS: Are you increasing or decreasing the number of services you
offer with your products? (maintenance, repairs, upgrades, financing, etc.)
ENABLERS: Are you increasing or decreasing the number of services you
offer with your products? (maintenance, repairs, upgrades, financing, etc.)
Services offered alongside products
n Increasing n Decreasing n Stay the same
58.9%
11.1%
30%
n Increasing n Decreasing n Stay the same
62.5%
7.5%
30%
http://events.eft.com/hitech/ www.eft.com 11
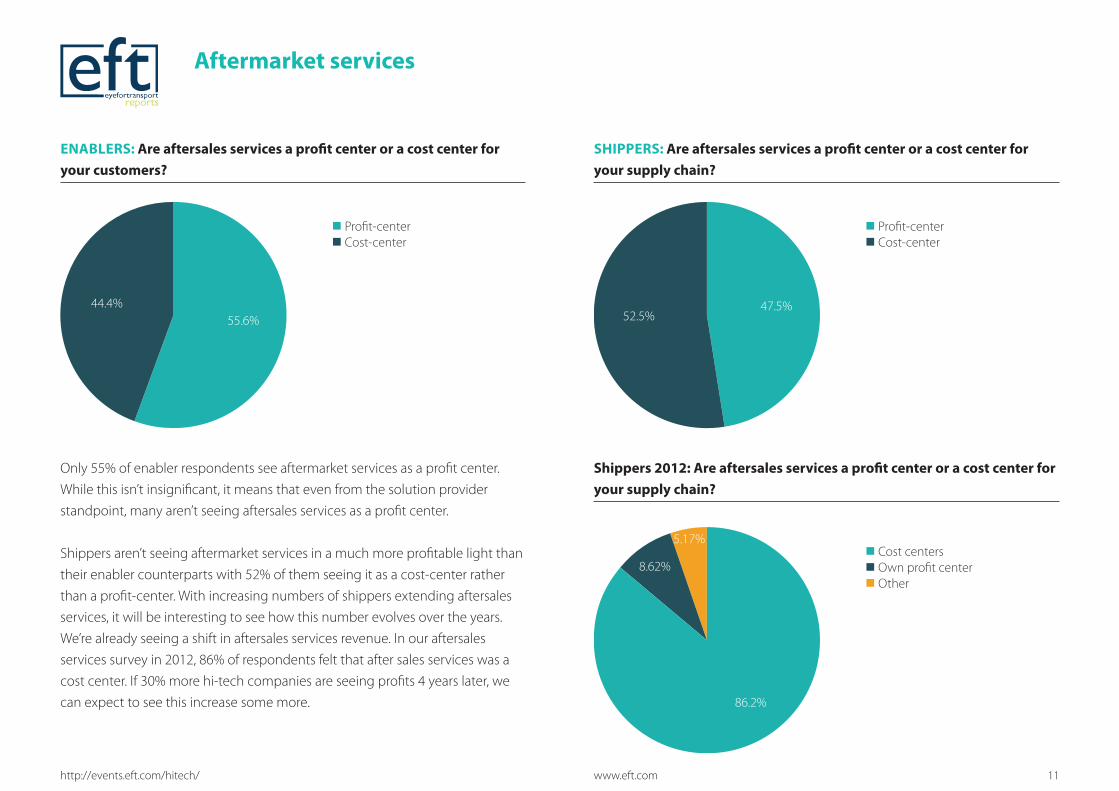
Only 55% of enabler respondents see aftermarket services as a profit center.
While this isn’t insignificant, it means that even from the solution provider
standpoint, many aren’t seeing aftersales services as a profit center.
Shippers aren’t seeing aftermarket services in a much more profitable light than
their enabler counterparts with 52% of them seeing it as a cost-center rather
than a profit-center. With increasing numbers of shippers extending aftersales
services, it will be interesting to see how this number evolves over the years.
We’re already seeing a shift in aftersales services revenue. In our aftersales
services survey in 2012, 86% of respondents felt that after sales services was a
cost center. If 30% more hi-tech companies are seeing profits 4 years later, we
can expect to see this increase some more.
SHIPPERS: Are aftersales services a profit center or a cost center for
your supply chain?
ENABLERS: Are aftersales services a profit center or a cost center for
your customers?
Aftermarket services
n Profit-center n Cost-center
55.6%44.4%
n Profit-center n Cost-center
47.5%52.5%
Shippers 2012: Are aftersales services a profit center or a cost center for
your supply chain?
n Cost centers n Own profit center n Other
86.2%
8.62%
5.17%

http://events.eft.com/hitech/ www.eft.com 12
Risk
Despite the number of risks in
today’s supply chain – natural disas-
ters, fluctuating demand, theft, etc.
enablers generally classed them-
selves as having advanced abilities.
Shippers were even more confi-
dent on their abilities, classifying
themselves as advanced/leaders in
response execution and response-
time to a crisis, scaling/advanced
in risk mitigation planning and risk
assessment. The Japanese tsunami
and flooding in Thailand amongst
other risks have cause the hi-tech
industry to focus on this area signifi-
cantly over the last several years. This
has clearly had an effect on shippers
and enablers in advancing their risk
mitigation abilities. The digitization
of supply chain and the implemen-
tation of predictive analytics is only
going to give supply chains more
tools to manage their risk.
ENABLERS: How would you classify your abilities in risk management specific to the hi-tech vertical?
SHIPPERS: How would you classify your abilities in risk management?
0
10
20
30
40
50
60
70
80
90
100
Leader
Advanced
Scaling
Entry-level
Risk Assessment Response Execution to a
crisis
Risk mitigation and
planning
Response-time to a crisis
0
5
10
15
20
25
30
35
40
45
Risk Assessment Response Execution to a crisis
Risk mitigation and planning
Response-time to a crisis
Leader
Advanced
Scaling
Entry-level
http://events.eft.com/hitech/ www.eft.com 13
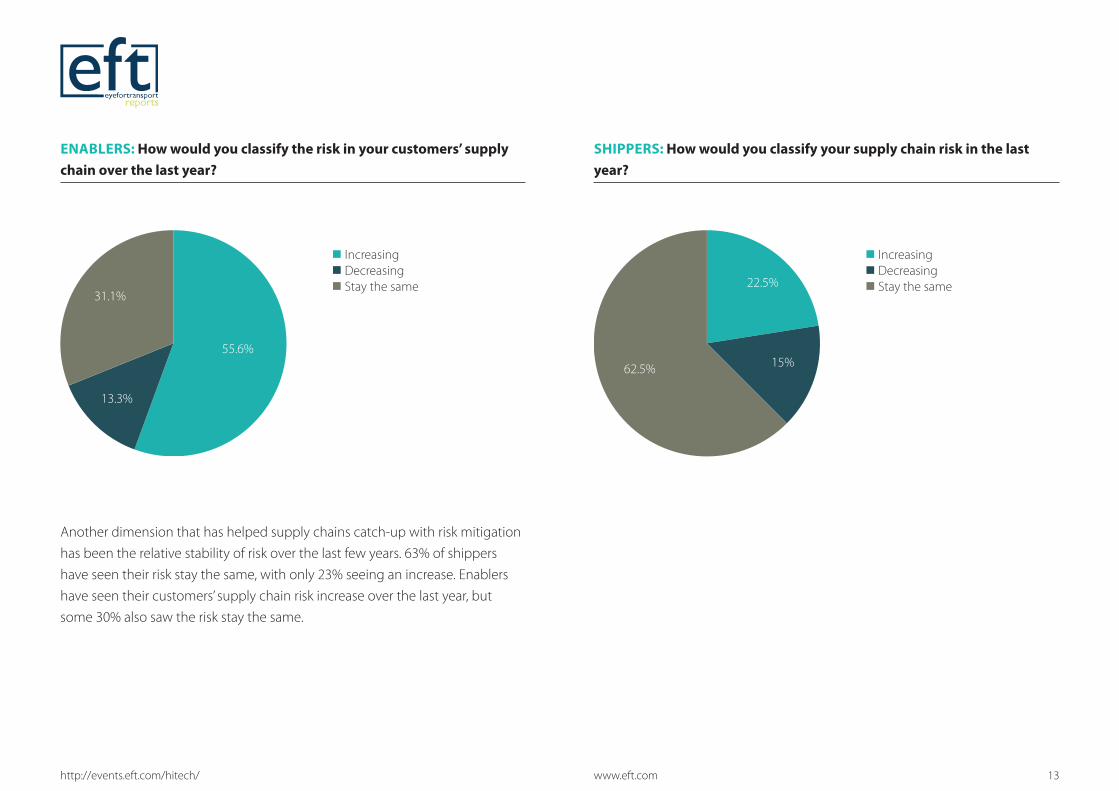
Another dimension that has helped supply chains catch-up with risk mitigation
has been the relative stability of risk over the last few years. 63% of shippers
have seen their risk stay the same, with only 23% seeing an increase. Enablers
have seen their customers’ supply chain risk increase over the last year, but
some 30% also saw the risk stay the same.
ENABLERS: How would you classify the risk in your customers’ supply
chain over the last year?
SHIPPERS: How would you classify your supply chain risk in the last
year?
n Increasing n Decreasing n Stay the same
55.6%
13.3%
31.1%
n Increasing n Decreasing n Stay the same 22.5%
15%62.5%
http://events.eft.com/hitech/ www.eft.com 14
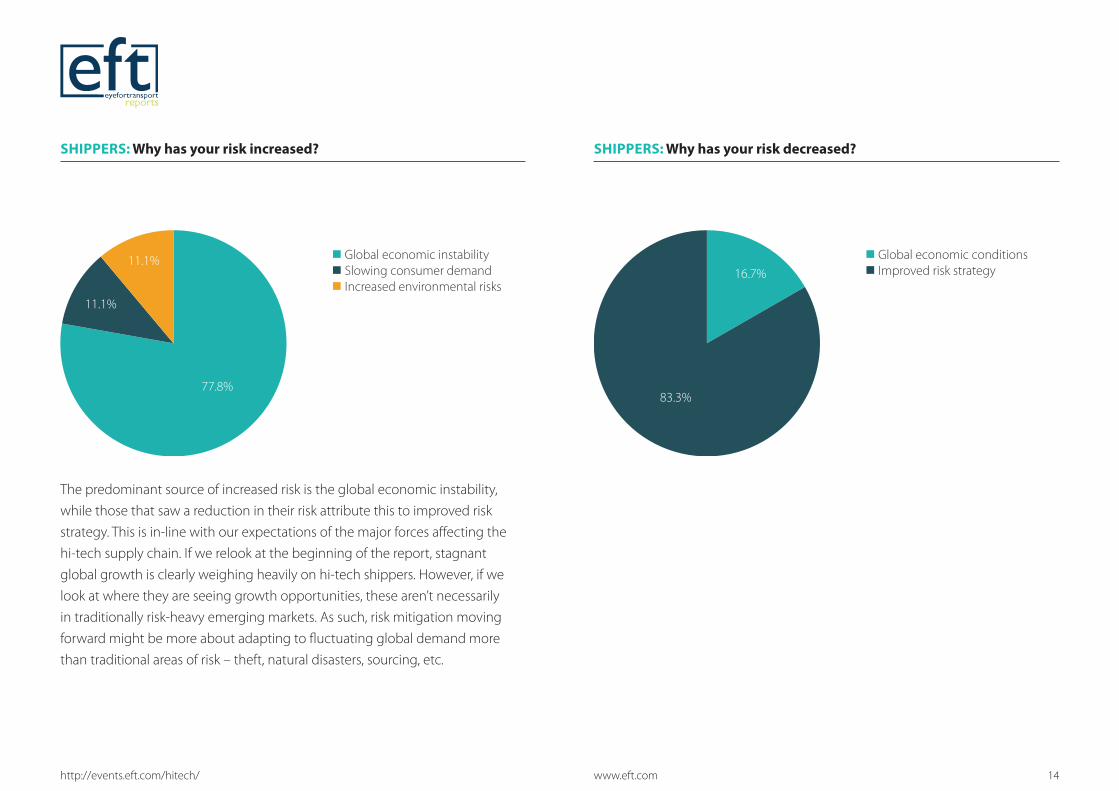
SHIPPERS: Why has your risk increased? SHIPPERS: Why has your risk decreased?
n Global economic instability n Slowing consumer demand n Increased environmental risks
77.8%
11.1%
11.1%16.7%
83.3%
n Global economic conditions n Improved risk strategy
The predominant source of increased risk is the global economic instability,
while those that saw a reduction in their risk attribute this to improved risk
strategy. This is in-line with our expectations of the major forces affecting the
hi-tech supply chain. If we relook at the beginning of the report, stagnant
global growth is clearly weighing heavily on hi-tech shippers. However, if we
look at where they are seeing growth opportunities, these aren’t necessarily
in traditionally risk-heavy emerging markets. As such, risk mitigation moving
forward might be more about adapting to fluctuating global demand more
than traditional areas of risk – theft, natural disasters, sourcing, etc.
http://events.eft.com/hitech/ www.eft.com 15
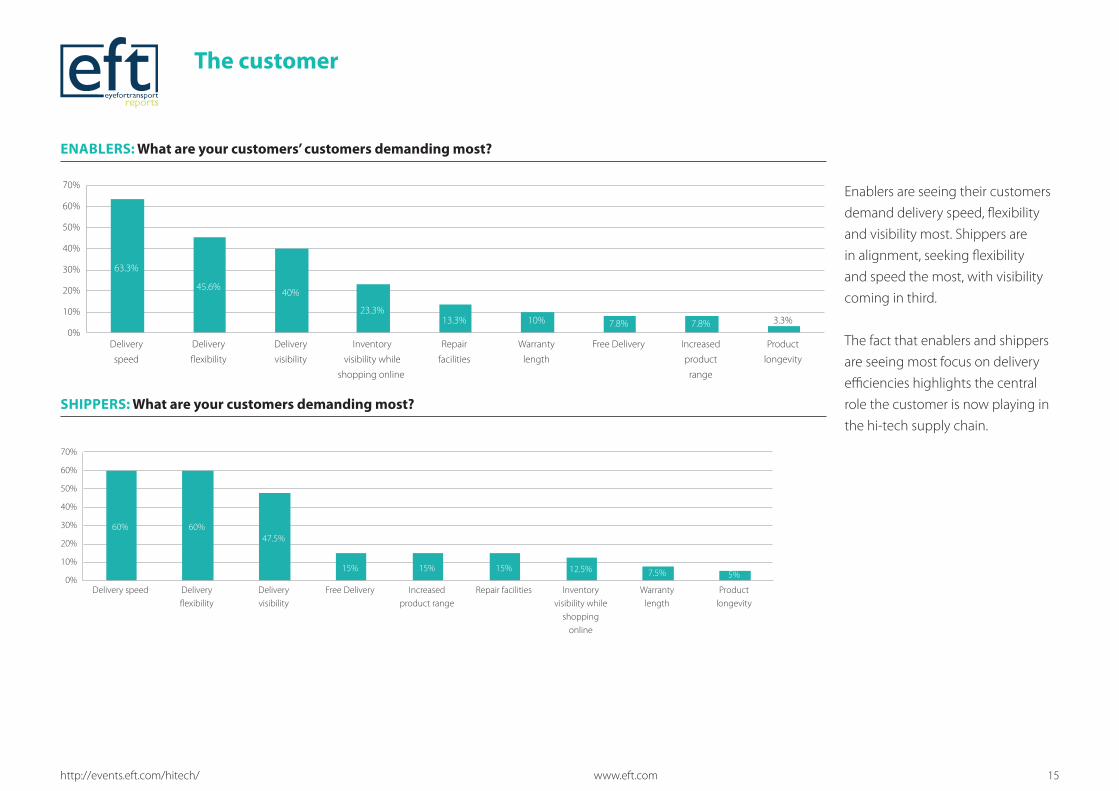
The customer
Enablers are seeing their customers
demand delivery speed, flexibility
and visibility most. Shippers are
in alignment, seeking flexibility
and speed the most, with visibility
coming in third.
The fact that enablers and shippers
are seeing most focus on delivery
efficiencies highlights the central
role the customer is now playing in
the hi-tech supply chain.
ENABLERS: What are your customers’ customers demanding most?
SHIPPERS: What are your customers demanding most?
Delivery
speed
Delivery
flexibility
Delivery
visibility
Inventory
visibility while
shopping online
Repair
facilities
Warranty
length
Free Delivery Increased
product
range
Product
longevity
63.3%
45.6% 40%
23.3% 13.3% 10% 7.8% 7.8% 3.3%
0%
10%
20%
30%
40%
50%
60%
70%
Delivery speed Delivery flexibility
Delivery visibility
Free Delivery Increased product range
Repair facilities Inventory visibility while
shopping online
Warranty length
Product longevity
60% 60% 47.5%
15% 15% 15% 12.5% 7.5% 5% 0%
10%
20%
30%
40%
50%
60%
70%

http://events.eft.com/hitech/ www.eft.com 16
While most shippers were using analytics to better understand their customers’
supply chain experience, a significant number of respondents have been using
social media, apps and mobile tech to keep pace.
SHIPPERS: Which of the following technologies are you using for plugging into your customers’ supply chain experience?
Analytics Apps Mobile tech Social media Cloud Gamification
67.5%
35% 25% 22.5% 22.5% 2.5%
0%
10%
20%
30%
40%
50%
60%
70%
80%
http://events.eft.com/hitech/ www.eft.com 17
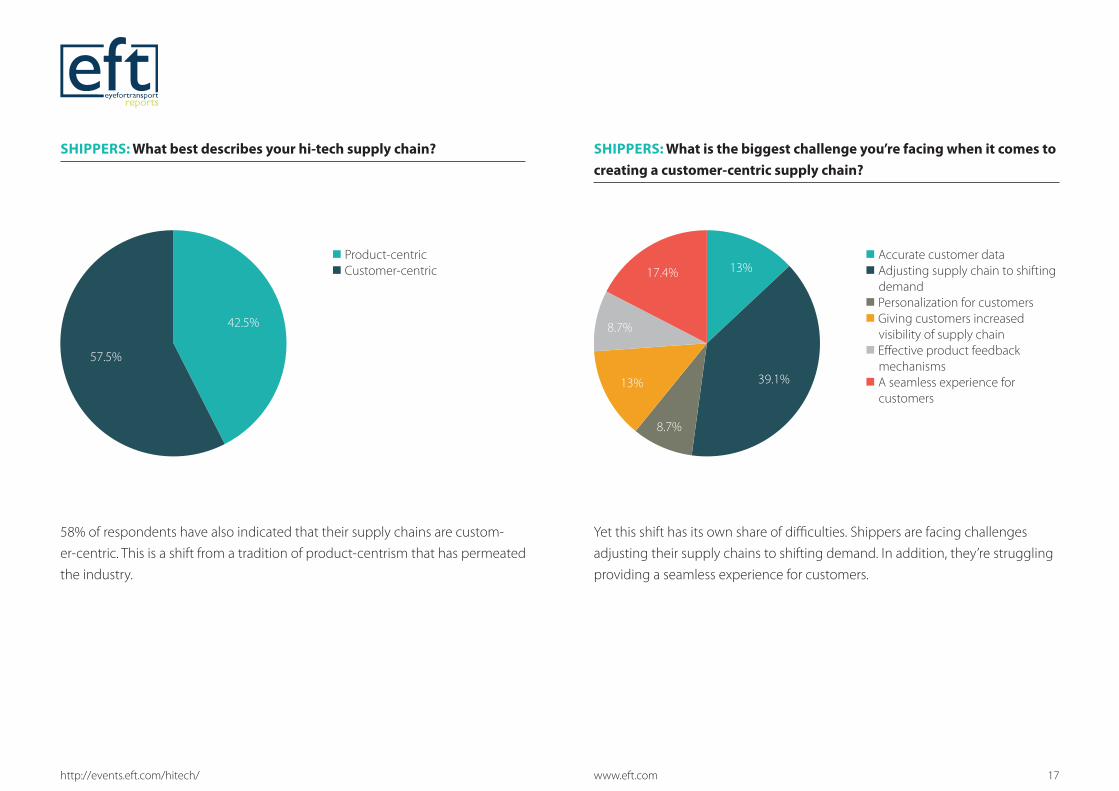
58% of respondents have also indicated that their supply chains are custom-
er-centric. This is a shift from a tradition of product-centrism that has permeated
the industry.
Yet this shift has its own share of difficulties. Shippers are facing challenges
adjusting their supply chains to shifting demand. In addition, they’re struggling
providing a seamless experience for customers.
SHIPPERS: What best describes your hi-tech supply chain? SHIPPERS: What is the biggest challenge you’re facing when it comes to
creating a customer-centric supply chain?
n Product-centric n Customer-centric
42.5%
57.5%
n Accurate customer data n Adjusting supply chain to shifting
demand n Personalization for customers n Giving customers increased
visibility of supply chain n Effective product feedback
mechanisms n A seamless experience for
customers
13%
39.1%
8.7%
13%
8.7%
17.4%
http://events.eft.com/hitech/ www.eft.com 18
The consumer is shaping the hi-tech supply chain. More than ever, the supply
chain is being brought to the forefront of the consumer’s interaction with an
organization. Delivery speed, social media and general customer-centrism are
now key aspects of a hi-tech supply chain. Just as hi-tech has started to get it
right, the industry is facing a difficult economic climate. Stagnant global growth
in hi-tech is set to weigh heavily on hi-tech companies. However the best tactic
is likely going to be a continued focus on the customer to drive profits in 2016
with additional services along-side products featuring heavily as a possible
additional revenue stream.
Conclusion Want to learn more?
The 10th Hi-Tech & Electronics Supply Chain Summit brings together
thought leaders and industry shapers within the world’s leading tech compa-
nies for an event acclaimed for its interactive sessions and highlevel speakers.
With 200+ attendees from a cross section of the industry, the summit will
provide a comprehensive road map to help you can create a 3-D value chain in
your hi-tech organisation.
Learn how to make your hi-tech supply chain:
Demand Orientated: Learn how to calibrate your business to the exter-
nal pace of the market and customer rather than the internal cadence of
product development.
Data Driven: Manage data captured for analysis as it’s produced; making
management more accurate, agile and productive.
Digital Execution: Discover how a more instrumented and connected
enterprise yields a higher ROI and meets customers satisfaction.
Do you have what it takes to create a culture of innovation by fostering out-of-
the-box thinking and embracing emerging technologies?
Find out by joining us on May 25- 26, 2016, reserve your place today at
www.events.eft.com/hitech
Join us this year at the 10th Annual Hi-Tech & Electronics Supply Chain Summit May 25-26, 2016Novotel, Amsterdam, Schiphol Airport