Embed Size (px)
Citation preview
Depressive symptoms and carotid artery intima-media thickness in police officers
John M. Violanti,Department of Social and Preventive Medicine, School of Public Health and Health Professions, University at Buffalo, State University of New York, 270 Farber Hall, Buffalo, NY 14214, USA
Luenda E. Charles,Biostatistics and Epidemiology Branch, Health Effects Laboratory Division, National Institute for Occupational Safety and Health, Centers for Disease Control and Prevention, Morgantown, WV, USA
Ja K. Gu,Biostatistics and Epidemiology Branch, Health Effects Laboratory Division, National Institute for Occupational Safety and Health, Centers for Disease Control and Prevention, Morgantown, WV, USA
Cecil M. Burchfiel,Biostatistics and Epidemiology Branch, Health Effects Laboratory Division, National Institute for Occupational Safety and Health, Centers for Disease Control and Prevention, Morgantown, WV, USA
Michael E. Andrew,Biostatistics and Epidemiology Branch, Health Effects Laboratory Division, National Institute for Occupational Safety and Health, Centers for Disease Control and Prevention, Morgantown, WV, USA
P. Nedra Joseph, andThe University of Chicago Comprehensive Cancer Center, Epidemiology and Research Recruitment Core, Chicago, IL, USA
Joan M. DornDepartment of Exercise and Nutrition Sciences, School of Public Health and Health Professions, State University of New York at Buffalo, Buffalo, NY, USA
John M. Violanti: [email protected]
Abstract
Purpose—Police work is a stressful occupation. Depressive symptoms, which may occur as a
result of exposure to stressors in police work, have been known to be associated with an increased
risk of cardiovascular disease. This cross-sectional study investigated the association between
depressive symptoms and carotid artery intima-media thickness (CIMT) among police officers.
Correspondence to: John M. Violanti, [email protected].
Conflict of interest The authors declare that they have no conflict of interest.
HHS Public AccessAuthor manuscriptInt Arch Occup Environ Health. Author manuscript; available in PMC 2015 June 30.
Published in final edited form as:Int Arch Occup Environ Health. 2013 November ; 86(8): 931–942. doi:10.1007/s00420-012-0829-6.
Author M
anuscriptA
uthor Manuscript
Author M
anuscriptA
uthor Manuscript

Methods—CIMT was measured with B-mode carotid ultrasonography. Depressive symptoms
were measured using the Center for Epidemiological Studies Depression (CES-D) scale. Analyses
of variance and covariance were utilized to examine the mean values of common CIMT (CCA
IMT) and maximum CIMT (MMXIMT) across quintiles of depressive symptoms.
Results—Participants included 412 officers (mean age = 41 years). Hypertension status
significantly modified the association between CES-D score and CIMT. The association between
CES-D score and CCA IMT was statistically significant (adjusted P = 0.030) but only among
officers without hypertension. The associations between CES-D score and MMXIMT were not
significant among officers with or without hypertension. Our results also showed that among
officers who reported poor sleep quality, mean levels of CCA IMT, and MMXIMT tended to
increase as depressive symptoms increased.
Conclusions—Depressive symptoms may be therefore be independently associated with CIMT,
yet masked by hypertension. Even though sleep quality did not significantly modify the main
association, our results also suggest that poor sleep quality may act synergistically with depressive
symptoms to increase CIMT. Future prospective work would help to clarify these associations.
Keywords
Cardiovascular disease; Depression; Risk factors; Police
Introduction
Police work is considered a stressful occupation which not only involves danger and
traumatic event exposure, but also organizational stressors such as lack of support,
punishment-centered executive philosophies, and excessive paperwork (Violanti et al. 2006;
Berg et al. 2005; Kop and Euwema 2001; Patterson 2003; Spielberger et al. 1982; Violanti
and Aron 1994).
Depression may be one outcome of exposure to police work stressors and it has been
associated with increased risk of cardiovascular disease (CVD) (Wang et al. 2010; Chen et
al. 2006; Whipple et al. 2011). Barefoot and Schroll (1996) found that a high level of
depressive symptoms predicted the subsequent occurrence of myocardial infarction and
mortality in a 21-year follow-up study. Appels and Mulder (1988) found relationships
between various negative psychological states and the occurrence of coronary heart disease
(CHD). Depression has also been associated with biological outcomes which exacerbate the
risk of CVD, including hyperactivity within the hypothalamic–pituitary–adrenal (HPA) axis,
diminished heart rate variability, and ventricular instability (Musselman et al. 1998a, b).
Due to their occupational exposure and increased risk for depression, police officers may
also be at higher risk for CVD (Violanti et al. 1998; Franke and Anderson 1994; Franke et
al. 1998). Based on the previous research, we tested the hypothesis that depressive
symptoms in police officers are associated with carotid artery intima-media thickness
(CIMT) after adjustment for traditional CVD risk factors. Stewart et al. (2007) found that
higher depressive symptoms at baseline were associated with greater 3-year change in
carotid intima-media thickness even after taking into account demographic factors,
Violanti et al. Page 2
Int Arch Occup Environ Health. Author manuscript; available in PMC 2015 June 30.
Author M
anuscriptA
uthor Manuscript
Author M
anuscriptA
uthor Manuscript

cardiovascular risk factors, medication use, medical conditions, and other correlated
negative emotions. Pizzi et al. (2010) found that IMT is higher in depressed subjects,
indicating that atherosclerosis is accelerated in depressed patients. These authors contribute
this to mechanisms which connect depression and coronary artery disease, such as
inflammation and imbalance of the autonomic nervous system. Haas et al. (2005), adjusting
for baseline cardiovascular risk factors, found participants with elevated depression scores at
baseline were > 2 times as likely as those with no depressive symptoms to have carotid
plaque. This study suggested that hypothalamic–pituitary–adrenal (HPA) dysregulation,
diminished heart rate variability, altered blood platelet function, and noncompliance with
medical treatments underlie the association between depression and cardiovascular disease.
Conversely, Rice et al. (2009) in the Baltimore Longitudinal Study of Aging found no
significant relationship between the trajectory of depressive symptoms and future carotid
IMT.
CIMT progression rates have been associated with risk factors such as diabetes, smoking,
hypercholesterolemia, and hypertension (Chambless et al. 2002; Ferrieres et al. 1999).
CIMT has been used successfully to study arterial atherosclerotic disease in predicting
cardiovascular disease outcomes (myocardial infarction, stroke), clinical coronary outcomes,
determining the effectiveness of risk factor intervention, and in monitoring the progression
of arterial wall thickness over time (Bots et al. 2003; Chambless et al. 1997; Grobbee and
Bots 1994) In a meta-analysis of population-based CIMT studies, Lorenz et al. (2007)
estimated the relative risk of myocardial infarction and stroke as 1.15 and 1.18, respectively
(adjusted for age and gender), for each 0.10-mm thickness increase in common carotid IMT.
Methods
Study design and participants
Between June 2004 and October 2009, 464 police officers (active-duty and retired) among
all officers in the Buffalo New York Police Department (estimated to be approximately 710
in 2004) were examined in the Buffalo Cardio-metabolic Occupational Police Stress
(BCOPS) study. Women officers who were pregnant at the time of examination were
excluded. Police officers perform a variety of duties. A typical routine day in this sample of
officers may involve riding on patrol, walking a beat, answering complaint calls for police
service, handling traffic accidents, investigating crimes, and writing reports. During routine
patrol, officers may also be exposed to incidents considered to be traumatic, such as
shootings, assaults, robberies, and homicides. Officers are required to work 10 h fixed shifts,
including midnight shifts.
The data were collected at the Center for Health Research, School of Public Health and
Health Professions, University at Buffalo, State University of New York. To be eligible for
this current study, officers must have had no prior history of heart attack, stroke, bypass
surgery, carotid artery endarterectomy, transient ischemic attack, or any physician-
diagnosed coronary heart disease. The final sample included 412 officers with complete data
(305 men and 107 women) who were currently employed, had complete information for
CIMT, and had completed the Center for Epidemiologic Studies Depression (CES-D) Scale
(Radloff 1977). Prior to any clinic examinations, the officers reviewed and signed informed
Violanti et al. Page 3
Int Arch Occup Environ Health. Author manuscript; available in PMC 2015 June 30.
Author M
anuscriptA
uthor Manuscript
Author M
anuscriptA
uthor Manuscript

consent forms. The Institutional Review Board at the University at Buffalo and the National
Institute for Occupational Safety and Health (NIOSH) approved the study.
Measures
Assessment of carotid intima-media thickness—Certified sonographers used a
standardized ultrasound protocol that was adopted from the Center for Medical Ultrasound
at Wake Forest University. High-resolution B-mode carotid ultrasonography was performed
using a 7.5- to 10-MHz transducer and a Biosound Esaote (AU5) ultrasound machine
(Howard et al. 1993) Prior to the measurement of CIMT, the participants lay supine in a
darkened, quiet room. A cool gel was applied to the area to be scanned and a preliminary
exploratory transverse scan was performed to assess the participant’s anatomy and to
determine the optimum angle for the CIMT scan. Standing at the head of the examination
table, the sonographers scanned both the right and left extra-cranial carotid arteries. Starting
at the optimal angle, standardized longitudinal images were acquired of the near and far
walls of the distal 1.0 cm portion of the common carotid artery (CCA), the carotid
bifurcation and proximal 1.0 cm at the optimum angle, and two additional scanning angles
(30–45° anterior and 30–45° posterior). Mean common carotid artery (CCA) IMT (mm) is
defined as the average of the CCA IMT measured at 12 sites in the right and left CCA. Mean
maximum (MMXIMT) IMT (mm) is the average of the maximum IMT measured in the
CCA, bifurcation, and internal carotid artery on both the right and left sides of the neck from
three interrogation angles on the right and left side of the near and far walls (3 sites × 3
angles × 2 sides × 2 walls = 36) and was computed as the average IMT for all 36 image
segments (Riley 2002). The scans were recorded on a ¾-inch (1.9 cm) high-resolution
(Super VHS) video cassette and later digitized using ImagePro Plus software for
measurement.
Established guidelines were used for ongoing quality control. The acceptable differences
between any two ultrasound readers should not exceed <0.03 mm for the MMCCA and
<0.05 mm for the MMXIMT. A phantom scan, using a tissue equivalent phantom, was
performed every 2 weeks to ensure accurate calibration of the ultrasound machine and
transducers.
Assessment of depressive symptoms—Depressive symptoms were measured using
the Center for Epidemiological Studies Depression (CES-D) scale. The CES-D is a short
scale that was designed to measure the symptoms of depression in the general population
(Radloff 1977). Several dimensions of depression are measured including affective
components of depression, psychomotor retardation, loss of appetite, and sleep disorder. The
CES-D consists of 20 items with responses on a 4-point scale which represents the degree to
which each symptom occurred during the past 7 days: 0 (rarely or none of the time, less than
1 day); 1 (some or little of the time, 1–2 days); 2 (occasionally or a moderate amount of
time, 3–4 days); and 3 (most or all of the time, 5–7 days). These items are used to obtain an
overall score (range = 0–60) of depressive symptoms. For analysis, the CES-D scores were
categorized into quintiles: 1st quintile (0–<3), 2nd quintile (3–<5), 3rd quintile (5–<8), 4th
quintile (8–<12), and 5th quintile (12–42) and also into two categories <16 (not depressed)
and ≥16 (depressed).
Violanti et al. Page 4
Int Arch Occup Environ Health. Author manuscript; available in PMC 2015 June 30.
Author M
anuscriptA
uthor Manuscript
Author M
anuscriptA
uthor Manuscript

Depressive symptoms are determined here by means of a valid and reliable questionnaire,
but should not be construed at clinical depression. Clinical depression must either have a
depressed mood or a loss of interest or pleasure in daily activities consistently for at least a
2-week period (American Psychiatric Association 2000 DSM-IV 1994). Our study was
cross-sectional, and therefore, it was not possible to diagnose clinical depression in our
sample.
Assessment of covariates—CVD risk components were based on cut-points established
by the National Cholesterol Education Program Adult Treatment Panel III (NCEP ATP III),
the American Heart Association and the National Heart, Lung, and Blood Institute, National
Institutes of Health which included abdominal obesity (gender-specific waist
circumference), impaired fasting blood glucose, elevated triglycerides, elevated blood
pressure, and reduced gender-specific HDL cholesterol. Hypertension was defined as taking
any medication for high blood pressure or having a systolic blood pressure of ≥140 mm Hg
or a diastolic blood pressure of ≥90 mm Hg. The average of the second and third of three
resting systolic and diastolic blood pressure readings was used. Diabetes was defined as
taking any medication for diabetes or having a fasting serum glucose level of ≥126 mg/dL
(Grundy et al. 2005). Participants were weighed, and height was measured without shoes.
Body mass index (BMI) was calculated as weight (in kilograms) divided by height (in
meters) squared. Waist circumference was measured at the midpoint between the lowest part
of the costal margin in the mid-axillary line and highest point of the iliac crest. The average
value of two measurements rounded to the nearest 0.5 cm was used in the analyses. If the
two measurements had a difference of more than 0.5 cm, a third measurement was
performed. Blood was collected from officers who had fasted for at least 12 h the previous
night. Blood parameters were measured at Kaleida Laboratory, Buffalo, NY, by standard
laboratory techniques on the Beckman Coulter LX20 clinical chemistry analyzer and
included a blood lipid panel for HDL and triglycerides, and chemistry panels for glucose.
Officers were given self and interviewer-administered questionnaires to provide information
on demographic characteristics, lifestyle behaviors, and medical history. For educational
status, they checked one of eight choices from “less than 12 years of school” to “graduate
degree;” these eight categories were later collapsed into three levels (<high school/GED,
college <4 years, and college 4+ years). Officers were asked how often they consumed
alcoholic beverages with one drink defined as a 12-oz. can or bottle of beer, one medium
glass of wine (6 oz. or 170 gm), or one shot (1 oz. or 28.4 gm) of liquor. The total number of
drinks per month (of each type) was summed and then divided by 4 to give the approximate
total number of drinks consumed per week. Officers reported their smoking status as current,
former, or never. Hours of sleep was assessed from questionnaire data. The average hours of
sleep reported for the five previous weekdays were multiplied by five and the hours reported
for the weekend days were multiplied by two. The hours were then summed and divided by
seven to give the total hours of sleep per 24-h period during the previous 7 days.
Sleep quality was obtained from 19 self-rated individual questions that assessed various
sleep quality-related factors over the previous 1-month period. These 19 items were grouped
into seven components. Each component was scored by summing the scores of each item.
Each item was weighted equally on a 0–3 scale. A global PSQI score was derived by
Violanti et al. Page 5
Int Arch Occup Environ Health. Author manuscript; available in PMC 2015 June 30.
Author M
anuscriptA
uthor Manuscript
Author M
anuscriptA
uthor Manuscript

summing up the seven component scores with a possible range of 0–21; a global score of >5
defined poor sleep quality (Buysse et al. 1989). The PSQI global score allows direct
comparisons among groups, identifies groups that differ in the quality of sleep, and provides
a single overall assessment of sleep quality. Studies have shown that the PSQI has high
internal homogeneity, reliability, and validity (Buysse et al. 1989; Knutson et al. 2006).
Physical activity during the previous 7 days was obtained with the Seven-Day Physical
Activity Recall questionnaire (Sallis et al. 1986). For three types of physical activity
(occupational, household, and sports), participants reported the duration (hours per weekday,
hours per weekend) and intensity (moderate, hard, very hard). A total physical activity score
was then computed by summing the intensities of the three types of physical activity
performed during the weekday and weekend, and multiplying that number by the reported
duration.
Statistical analysis
Simple descriptive measures were calculated for all variables. Associations for all covariates
with CES-D scores and CIMT were examined using the chi-square test of independence and
analysis of variance (ANOVA). ANOVA and analysis of covariance (ANCOVA) were
utilized to examine the mean values of CCA IMT and MMXIMT across quintiles of
depressive symptoms. Depressive symptoms were categorized into quintiles in order to
present mean values of the dependent variables which facilitate the interpretation of the
results. The p values for linear trends were obtained from linear regression models utilizing
the continuous forms of both dependent and independent variables. Effect modification was
assessed for antidepressant medication use, BMI, smoking status, alcohol consumption
status, physical activity status, history of hypertension and diabetes, race/ethnicity, gender,
sleep duration, and sleep quality. Confounders were selected based on their associations
with the main exposures and outcomes or on the scientific literature. The potential
confounders were age, gender, race/ethnicity, educational level, cigarette smoking status,
alcohol intake, waist circumference, HDL cholesterol, LDL cholesterol, triglycerides,
glucose, diabetes, systolic blood pressure, hypertension, antidepressant medication use, and
physical activity. All analyses were conducted in SAS version 9.2 2008 (SAS; Cary, NC).
Results
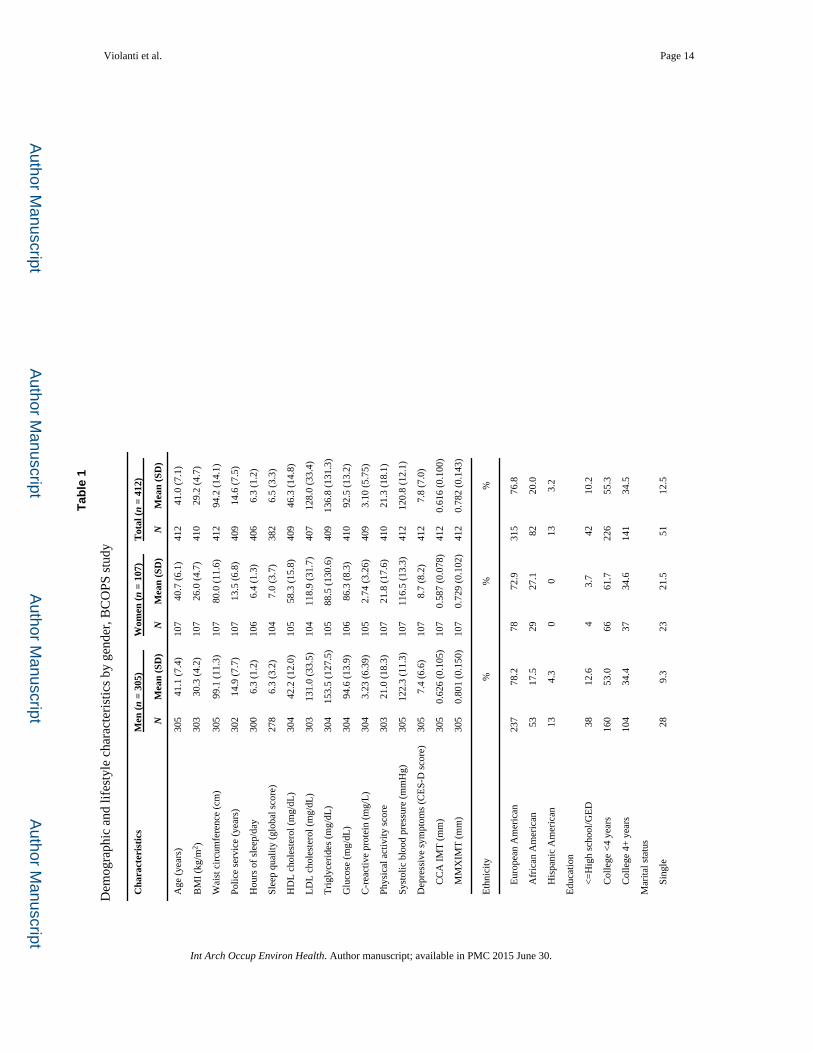
The mean age (±SD) of all officers (n = 412) was 41.0 ± 7.1 years (Table 1). The age ranges
for men and women were 21–66 and 26–53 years, respectively. The majority of officers
were Caucasian (76.8 %), 16.7 % were current smokers, and 19.9 % reported 8 drinks or
more per week. Approximately 24 % of all officers had a history of hypertension and 2.7 %
a history of diabetes. Women had slightly higher CES-D scores than men (8.7 ± 8.2 vs. 7.4 ±
6.6). In contrast, men had slightly higher mean CCA IMT (0.626 mm vs. 0.587 mm) and
MMXIMT (0.801 mm vs. 0.729 mm) values than women.
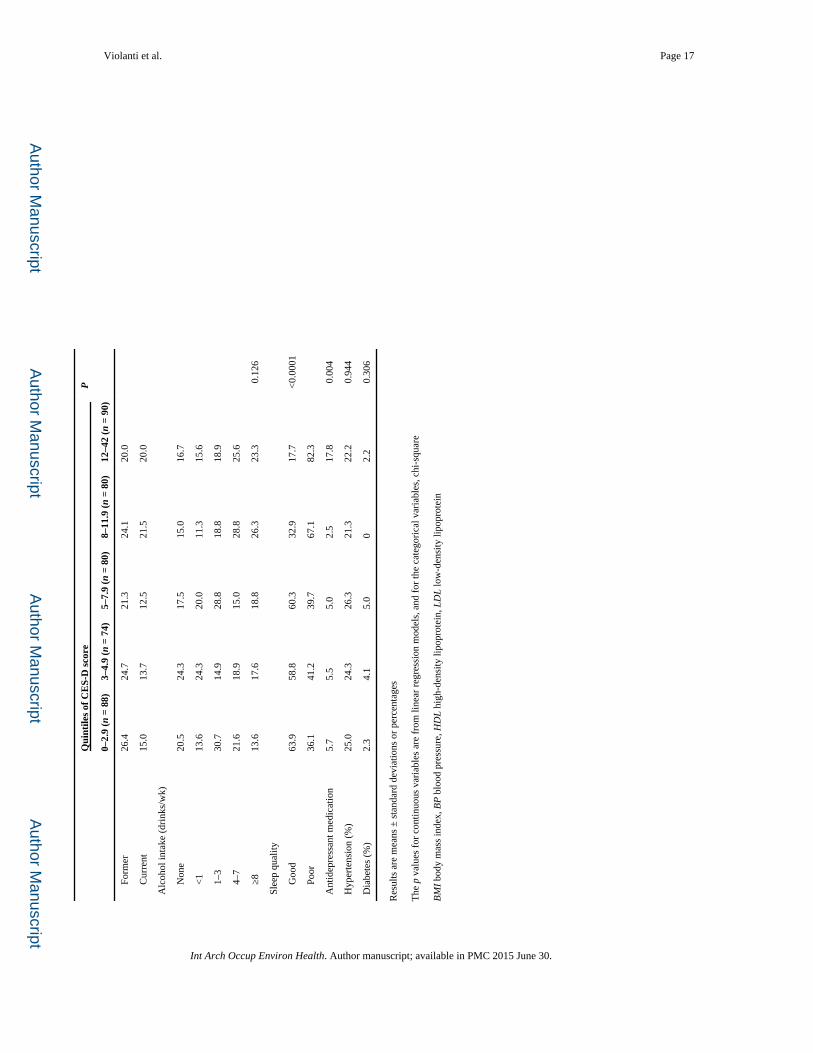
Results for the association between demographic, lifestyle characteristics, and CES-D scores
are presented in Table 2. Low-density lipoprotein (LDL) cholesterol and triglycerides
generally increased with increasing quintiles of CES-D scores but the associations were not
statistically significant. Race/ethnicity was associated with CES-D scores, P = 0.029. Use of
Violanti et al. Page 6
Int Arch Occup Environ Health. Author manuscript; available in PMC 2015 June 30.
Author M
anuscriptA
uthor Manuscript
Author M
anuscriptA
uthor Manuscript
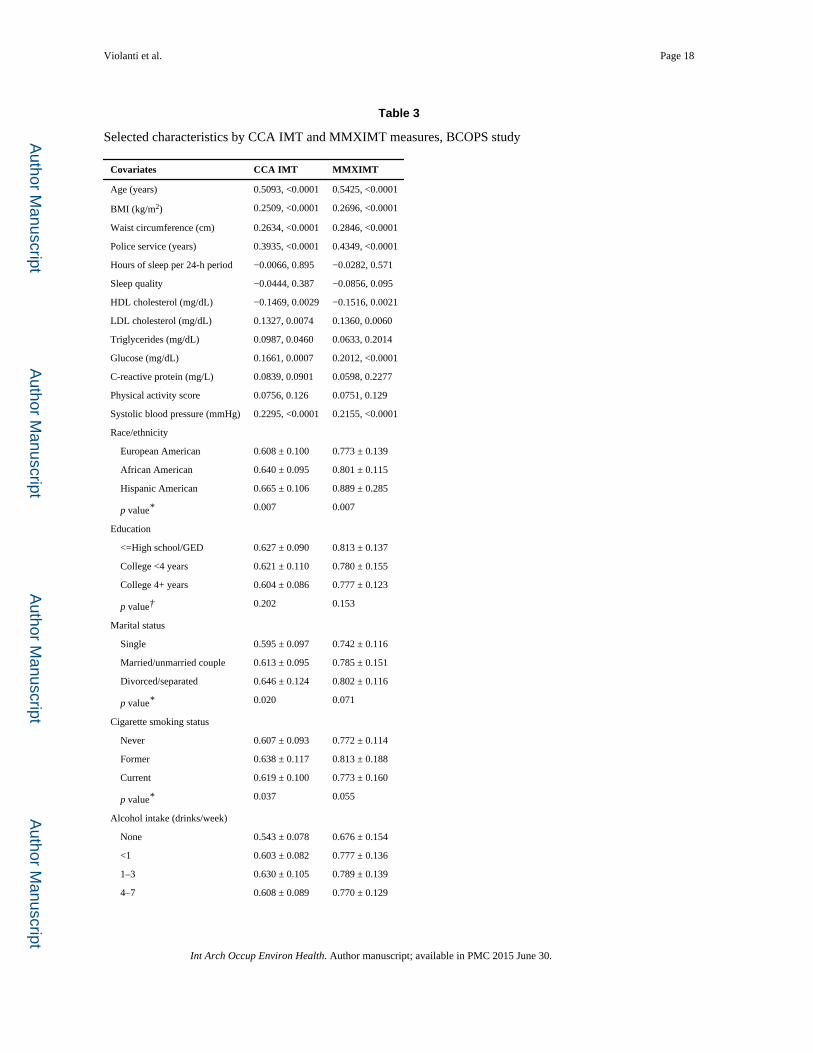
antidepressant medications was also associated with CES-D scores, P = 0.004. Table 3
provides associations between selected demographics, traditional CVD risk factors, CCA
IMT, and MMXIMT. Most results were in the expected direction. LDL cholesterol, glucose
levels, diabetes, and hypertension were positively and significantly correlated with both
CIMT measures, whereas high-density lipoprotein (HDL) was inversely and significantly
associated with both. Mean levels of CCA IMT and MMXIMT differed significantly by
race/ethnicity, with Caucasians having the lowest mean levels and Hispanic-American
officers having the highest mean levels of both CCA IMT (P = 0.007) and MMXIMT (P =
0.007).
After adjustment for age, gender, race, education level, cigarette smoking status, alcohol
intake, body mass index (BMI), HDL cholesterol, LDL cholesterol, triglycerides, glucose,
and hypertension, officers with CES-D scores >16 had a higher mean CCA IMT value
(0.628 ± 0.013) than officers with lower CES-D scores, but the difference was not
statistically significant (P = 0.130) (data not shown). Similar results were observed with
MMXIMT. The results in Table 4 show no significant association for CES-D scores with
CCA IMT or MMXIMT, before or after adjustment for covariates.
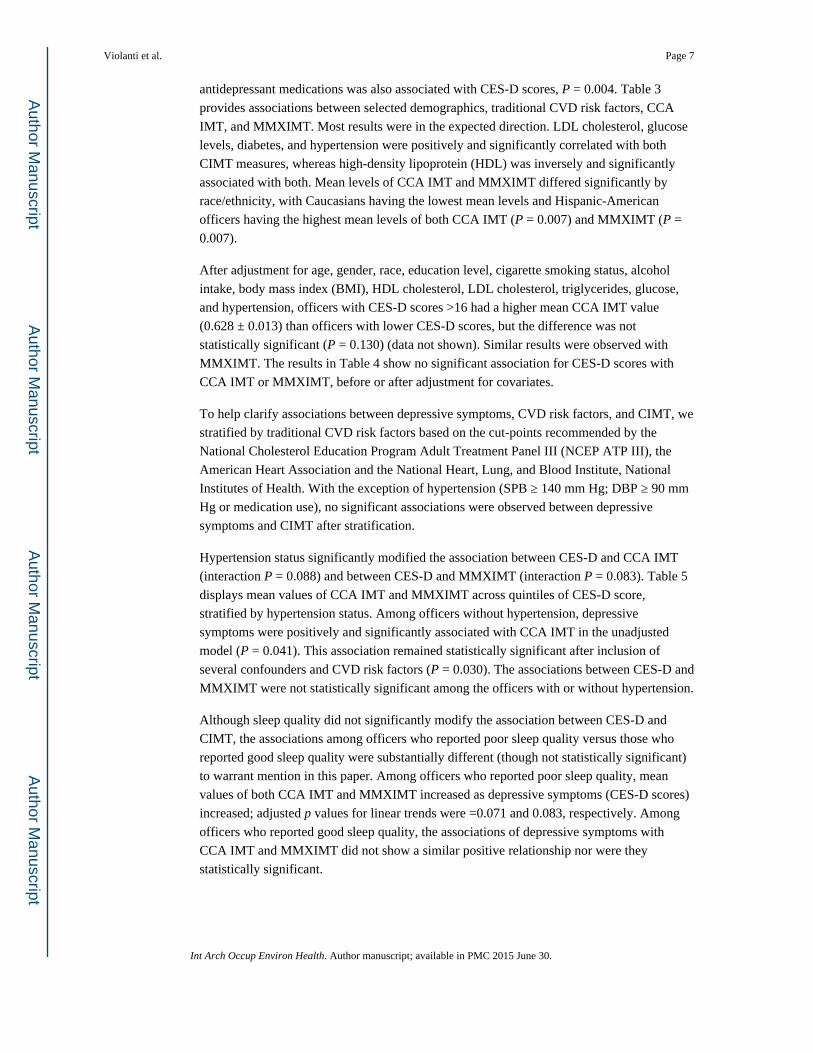
To help clarify associations between depressive symptoms, CVD risk factors, and CIMT, we
stratified by traditional CVD risk factors based on the cut-points recommended by the
National Cholesterol Education Program Adult Treatment Panel III (NCEP ATP III), the
American Heart Association and the National Heart, Lung, and Blood Institute, National
Institutes of Health. With the exception of hypertension (SPB ≥ 140 mm Hg; DBP ≥ 90 mm
Hg or medication use), no significant associations were observed between depressive
symptoms and CIMT after stratification.
Hypertension status significantly modified the association between CES-D and CCA IMT
(interaction P = 0.088) and between CES-D and MMXIMT (interaction P = 0.083). Table 5
displays mean values of CCA IMT and MMXIMT across quintiles of CES-D score,
stratified by hypertension status. Among officers without hypertension, depressive
symptoms were positively and significantly associated with CCA IMT in the unadjusted
model (P = 0.041). This association remained statistically significant after inclusion of
several confounders and CVD risk factors (P = 0.030). The associations between CES-D and
MMXIMT were not statistically significant among the officers with or without hypertension.
Although sleep quality did not significantly modify the association between CES-D and
CIMT, the associations among officers who reported poor sleep quality versus those who
reported good sleep quality were substantially different (though not statistically significant)
to warrant mention in this paper. Among officers who reported poor sleep quality, mean
values of both CCA IMT and MMXIMT increased as depressive symptoms (CES-D scores)
increased; adjusted p values for linear trends were =0.071 and 0.083, respectively. Among
officers who reported good sleep quality, the associations of depressive symptoms with
CCA IMT and MMXIMT did not show a similar positive relationship nor were they
statistically significant.
Violanti et al. Page 7
Int Arch Occup Environ Health. Author manuscript; available in PMC 2015 June 30.
Author M
anuscriptA
uthor Manuscript
Author M
anuscriptA
uthor Manuscript
Discussion
The goal of this study was to investigate the cross-sectional association of depressive
symptoms with subclinical cardiovascular markers CIMT and MMXIMT among police
officers. As expected, traditional risk factors remained strong predictors of CIMT. Age,
BMI, LDL cholesterol, and glucose levels were positively and significantly correlated with
CIMT measures, whereas high-density lipoprotein (HDL) was inversely and significantly
associated with both. We stratified by traditional CVD risk factors to reveal whether any of
these risk factors might modify the association between depressive symptoms and CIMT.
No significant differences were noted in the associations between depressive symptoms and
CIMT after stratification with one exception: hypertension. A significant positive
association between depressive symptoms and CIMT was observed in officers who were
free of hypertension. Additionally, hypertension significantly modified the association
between CES-D and CCAIMT. This result indicated that depressive symptoms may be
independently associated with CIMT, yet only among participants free of hypertension.
Recent work on depression and hypertension has provided evidence of increased
sympathetic activity and increased blood pressure reactivity (Jonas and Lando 2000; Jonas
et al. 1997; Bowman and Nicklin 1997; Veith et al. 1994; Waked and Jutai 1990). These
studies suggest that depression may have an effect on the cardiovascular system that could
lead to the development of hypertension and possible future CVD. Our results also showed
that among officers who reported poor sleep quality (Table 6), mean levels of CIMT tended
to increase as depressive symptoms increased. Even though sleep quality did not
significantly modify the main association, our results suggest that poor sleep quality may act
synergistically with depressive symptoms to increase CIMT. Violanti et al. (2009) found
that police officers working midnight shifts combined with either shorter sleep duration or
increased overtime may be at an increased risk for metabolic syndrome. The prevalence of
metabolic syndrome among officers working the midnight shift was higher than that found
in the National Health and Nutrition Examination Survey (NHANES III) 1988–1994 (Ford
et al. 2002). Karlsson et al. (2001) found that obesity, high triglycerides, and low
concentrations of HDL cholesterol seem to cluster together more often in shift workers than
in day workers. Lasfargues et al. (1996) found night-shift workers have significantly higher
levels of triglycerides, smoking, and obesity than controls. In a review of the literature,
Wolk and Somers (2007) found that the weight of evidence suggested that sleep deprivation
and shift work independently lead to the development of both insulin resistance and
individual components of the metabolic syndrome. Other studies found the metabolic effects
of shift work to include abdominal obesity, lower HDL cholesterol and higher triglycerides,
and changes in glucose intolerance (Nagaya et al. 2002). Mean levels of CCA IMT and
MMXIMT differed significantly by race/ethnicity, with Caucasians having the lowest mean
levels and Hispanic-American officers having the highest mean levels of both CCA IMT (P
= 0.007) and MMXIMT (P = 0.007). The small number of Hispanic Americans in our study
prevented any meaningful conclusions concerning CIMT and depressive symptoms. African
Americans had significantly greater mean CIMT than did Caucasians in our cohort;
however, no significant interactions with depressive symptoms were found. This was not
surprising, as African Americans are more likely to have a higher prevalence of CVD than
whites and are also 1.5 times as likely as whites to have hypertension and 10 % less likely
Violanti et al. Page 8
Int Arch Occup Environ Health. Author manuscript; available in PMC 2015 June 30.
Author M
anuscriptA
uthor Manuscript
Author M
anuscriptA
uthor Manuscript

than whites to have their blood pressure under control (http://www.cdc.gov/nchs/data/series/
sr_10/sr10_249.pdf).
In a recent study, higher levels of hopelessness (a diagnostic criterion of depression) were
associated with increased CIMT (Whipple et al. 2011). The authors stated that hopelessness
confers an independent risk of CVD. For minority officers, there may be social conditions or
exposures within police work that increase the risk of both depressive symptoms and
hopelessness.
Behaviors related to stress or depression may also increase the risk for CVD in officers. The
low physical fitness level found among police officers may be an indicator. Williams (1987)
found that a substantial number of officers in their sample were at elevated risk for
atherosclerotic heart disease: 76 % had elevated cholesterol, 26 % had elevated triglycerides,
and 60 % elevated body fat composition. Price et al. (1978) concluded that middle-aged
police officers had CVD risk above that of the general population. Joseph et al. (2009) found
that police officers have increased levels of atherosclerosis compared with a general
population sample, which was not fully explained by elevated CVD risk factors, thereby
potentially implicating other mechanisms whereby law enforcement work may increase
CVD risk. Franke and Anderson (1994) found that public safety officers had a higher
probability of developing CHD than did the Framingham Heart Study population. Steinhardt
et al. (1991) found an inverse association between cardiovascular fitness and medical claims
among police officers. Of interest is the fact that police officers either suffer from disease or
die at a much earlier age than do reference groups such as municipal workers or the general
US population (Violanti et al. 1998; Franke et al. 1998). Officers also died from CVD at
earlier ages than the general population (Violanti et al. 1998). This suggests the possible
influence of lifestyle risk factors for those diseases, including psychological stress and
depression.
This study is cross-sectional and cannot determine the causal direction between depressive
symptoms and CIMT. Future prospective investigations may help to clarify this issue. Other
limitations of this study are the lack of complete recruitment of all members of the police
force, residual confounding, and the possibility of selection bias. To clarify whether officers
who were examined were representative of all officers, we compared those officers who
participated versus those who did not; summary characteristics were as follows: 26 versus
23 % women; 30 versus 28 % above 45 years of age; 66 versus 71 % police officers (vs.
higher rank); and 45 versus 39 % hired after 1990, respectively. The results suggest that
findings are likely to be generalizable to the entire Buffalo Police Department. The potential
for residual confounding in this analysis could remain due to incomplete adjustment, and
there could be other unmeasured variables that could not be adjusted for in the analysis.
Another limitation of the study is the limited period of time for which information on
depressive symptoms is available (i.e., 7 days). Data on the history of depressive symptoms
or depressive disorders were not available for this cohort. If the association was causal, it
might take years of exposure to depressive symptoms before an adverse effect on carotid
IMT would be evident.
Violanti et al. Page 9
Int Arch Occup Environ Health. Author manuscript; available in PMC 2015 June 30.
Author M
anuscriptA
uthor Manuscript
Author M
anuscriptA
uthor Manuscript

This study has the advantage of being conducted in a controlled clinical setting, where the
assessment of many CVD risk factors (such as blood pressure or cholesterol) is conducted
by trained clinic personnel. Data collection for all studies was performed at the same site,
using a standardized protocol during similar time frames by the same research team. As
suggested by Joseph et al. (2009), subclinical CIMT is a predictive measure of future CVD
disease. The use of subclinical markers prior to CVD event manifestation is beneficial, in
that preventive efforts may be initiated well in advance of clinically apparent disease.
In sum, the present study suggests that, other than when stratified by hypertension, no
significant associations were observed for depressive symptoms with CCA IMT and
MMXIMT, after adjustment for demographics and traditional CVD risk factors. However,
among officers without hypertension, mean levels of CCA IMT increased with increasing
quintiles of CES-D scores. This association was statistically significant after adjustment for
several confounders and CVD risk factors (BMI, HDL cholesterol, LDL cholesterol,
triglycerides, and serum glucose levels). This result may reflect difficulty detecting an
association of depressive symptoms with CIMT in individuals with hypertension due to the
strong influence of hypertension on CIMT, whereas such an association may be easier to
detect in those free of hypertension. If confirmed in other studies and in a prospective
design, efforts to reduce depressive symptoms and to prevent its occurrence might prevent
increased CIMT. There are some studies which do provide directional evidence that
depressive symptoms may have an adverse effect on the cardiovascular system that could
lead to the development of hypertension and CVD (Waked and Jutai 1990; Julius 1988).
Future prospective work is planned with the present police cohort to help clarify such
possible directional relationships between depressive symptoms and CVD. It will also be
necessary to examine not only depressive symptoms, but other variables associated with
police work such as hopelessness and behavioral lifestyles that may further exacerbate
earlier signs of cardiovascular disease.
Acknowledgments
This work was supported by the National Institute for Occupational Safety and Health (NIOSH), contract no. 200–2003–01580. The findings and conclusions in this article are those of the authors and do not necessarily represent the views of the National Institute for Occupational Safety and Health.
References
American Psychiatric Association. Diagnostic and statistical manual of mental disorders. 4th edn.. Washington, DC: American Psychiatric Association; 2000.
Appels A, Mulder P. Excess fatigue as a precursor of myocardial infarction. Eur Heart J. 1988; 9:758–764. [PubMed: 3169045]
Barefoot JC, Schroll M. Symptoms of depression, acute myocardial infarction, and total mortality in a community sample. Circulation. 1996; 93:1976–1980. [PubMed: 8640971]
Berg AM, Hem E, Lau B, Haseth K, Ekeberg O. Stress in the Norwegian police service. Occup Med. 2005; 55:113–120.
Bots ML, Evans GW, Riley WA, Grobbee DE. Carotid intima-media thickness measurements in intervention studies: design options, progression rates, and sample size considerations: a point of view. Stroke. 2003; 34:2985–2994. [PubMed: 14615619]
Violanti et al. Page 10
Int Arch Occup Environ Health. Author manuscript; available in PMC 2015 June 30.
Author M
anuscriptA
uthor Manuscript
Author M
anuscriptA
uthor Manuscript
Bowman MA, Nicklin DE. Family medicine new guide to clinical preventive services published by the US Preventive Services Task Force. Depression and other stressors associated with hypertension. JAMA. 1997; 277:1857–1858. [PubMed: 9185800]
Buysse DJ, Reynolds CF III, Monk TH, Berman SR, Kupfer DJ. The Pittsburgh sleep quality index: a new instrument for psychiatric practice and research. Psych Res. 1989; 28:193–213.
Chambless LE, Heiss G, Folsom AR, Rosamond W, Szklo M, Sharrett AR, Clegg LX. Association of coronary heart disease incidence with carotid arterial wall thickness and major risk factors: the atherosclerosis risk in communities (ARIC) study, 1987–1993. Am J Epidemiol. 1997; 146:483–494. [PubMed: 9290509]
Chambless LE, Folsom AR, Davis V, Sharrett R, Heiss G, Sorlie P, Szklo M, Howard G, Evans GW. Risk factors for progression of common carotid atherosclerosis: the atherosclerosis risk in communities study, 1987–1998. Am J Epidemiol. 2002; 155:38–47. [PubMed: 11772783]
Chen HC, Chou FH, Chen MC, Su SF, Wang SY, Feng WW, Chen PC, Lai JY, Chao SS, Yang SL, Tsai TC, Tsai KY, Lin KS, Lee CY, Wu HC. A survey of quality of life and depression for police officers in Kaohsiung, Taiwan. Qual Life Res. 2006; 15:925–932. [PubMed: 16721651]
Ferrieres J, Elias A, Ruidavets JB, Cantet C, Bongard V, Fauvel J, Boccalon H. Carotid intima-media thickness and coronary heart disease risk factors in a low-risk population. J Hyper. 1999; 17:743–748.
Ford ES, Giles WH, Dietz WH. Prevalence of the metabolic syndrome among US adults: findings from the third national health and nutrition examination survey. JAMA. 2002; 287:356–359. [PubMed: 11790215]
Franke WD, Anderson DF. Relationship between physical activity and risk factors for cardiovascular disease among law enforcement officers. J Occup Med. 1994; 36:1127–1132. [PubMed: 7830172]
Franke WD, Collins SA, Hinz PN. Cardiovascular disease morbidity in an Iowa law enforcement cohort, compared with the general Iowa population. J Occup Environ Med. 1998; 40:441–444. [PubMed: 9604181]
Grobbee DE, Bots ML. Carotid artery intima-media thickness as an indicator of generalized atherosclerosis. J Int Med. 1994; 236:567–573.
Grundy SM, Cleeman JI, Daniels SR, Donato KA, Eckel RH, Franklin BA, Gordon DJ, Krauss RM, Savage PJ, Smith SC Jr, Spertus JA, Costa F. American Heart Association; National Heart, Lung, and Blood Institute. Diagnosis and management of the metabolic syndrome: an American Heart Association/National Heart, Lung, and Blood Institute Scientific Statement. Circulation. 2005; 112:2735–2752. [PubMed: 16157765]
Haas DC, Davidson KW, Schwartz DJ, Riekmann N, Roman MJ, Pickering TG, Gerin W, Schartz JE. Depressive symptoms are independently predictive of carotid atherosclerosis. Am J Cardiol. 2005; 95:547–550. [PubMed: 15695154]
Howard GA, Sharrett R, Heiss G, Evans GW, Chambless LE, Riley WA, Burke GL. Carotid artery intimal-medial thickness distribution in general populations as evaluated by B-mode ultrasound: ARIC investigators. Stroke. 1993; 24:1297–1304. [PubMed: 8362421]
Jonas BS, Lando JF. Negative affect as a prospective risk factor for hypertension. Psychosom Med. 2000; 62:188–196. [PubMed: 10772396]
Jonas BS, Franks P, Ingram DD. Are symptoms of anxiety and depression risk factors for hypertension? Arch Family Med. 1997; 6:43–49.
Joseph PN, Violanti JM, Donahue R, Andrew ME, Trevisan M, Burchfiel CM, Dorn J. Police work and subclinical atherosclerosis. J Occup Environ Med. 2009; 51:700–707. [PubMed: 19530342]
Julius S. Transition from high cardiac output to elevated vascular resistance in hypertension. Am Heart J. 1988; 116:600–606. [PubMed: 3293404]
Karlsson B, Knutsson A, Lindahl B. Is there an association between shift work and having a metabolic syndrome? Results from a population based study of 27,485 people. Occup Environ Med. 2001; 58:747–752. [PubMed: 11600731]
Knutson KL, Rathouz PJ, Yan LL, Liu K, Lauderdale DS. Stability of the Pittsburgh sleep quality index and the Epworth sleepiness questionnaires over 1 year in early middle-aged adults: the CARDIA study. Sleep. 2006; 29:1503–1506. [PubMed: 17162998]
Violanti et al. Page 11
Int Arch Occup Environ Health. Author manuscript; available in PMC 2015 June 30.
Author M
anuscriptA
uthor Manuscript
Author M
anuscriptA
uthor Manuscript
Kop N, Euwema MC. Occupational stress and the use of force by Dutch police officers. Crim Just Beh. 2001; 28:631–652.
Lasfargues G, Sylvanie V, Caces B. Relations among night work, dietary habits, biological measures, and health status. Intl J Behav Med. 1996; (3):123–134.
Lorenz MW, Markus HS, Bots ML, Rosvall M, Sitzer M. Prediction of clinical cardiovascular events with carotid intima-media thickness: a systematic review and meta-analysis. Circulation. 2007; 115:459–467. [PubMed: 17242284]
Musselman DL, Evans DL, Nemeroff CB. The relationship of depression to cardiovascular disease. Arch Gen Psychiatry. 1998a; 55:580–592. [PubMed: 9672048]
Musselman, DL.; Knight, BT.; Baron, A.; Nemeroff, CB. Presented at society of biological psychiatry annual meeting. Toronto, Canada: 1998b May. Further studies on altered platelet reactivity in major depression; p. 27-31.
Nagaya T, Yoshida H, Takahashi H, Kawai M. Markers of insulin resistance in day and shift workers aged 30–59 years. Int Arch Occup Environ Health. 2002; 75:562–568. [PubMed: 12373318]
Patterson GT. Examining the effects of coping and social support on work and life stress among police officers. J Crim Just. 2003; 31:215–226.
Pizzi C, Manzoli L, Mancini S, Bedetti G, Fontana F, Costa GM. Autonomic nervous system, inflammation and preclinical carotid atherosclerosis in depressed subjects with coronary risk factors. Atherosclerosis. 2010; 212:292–298. [PubMed: 20510416]
Price, CS.; Pollock, ML.; Gettman, LR.; Kent, DA. Physical fitness programs for law enforcement officers: a manual for police administrators. Washington, DC: US Department of Justice; 1978.
Radloff LS. The CES-D scale: a self-report depression scale for research in the general population. Appl Psychol Meas. 1977; 1:385–401.
Rice SC, Zonderman AB, Metter EJ, Najjoar SS, Waldstein SR. Absence of relation between depressive symptoms and carotid intimal medial thickness in the Blatomire Longitudinal study of aging. Psychosom Med. 2009; 71:70–76. [PubMed: 18842746]
Riley WA. Carotid intima-media thickness: risk assessment and scanning protocol. Eur Heart J. 2002; 23:916–918. [PubMed: 12069441]
Sallis JF, Haskell WL, Fortmann SP, Wood PD, Vranizan KM. Moderate-intensity physical activity and cardiovascular risk factors: the Stanford five-city project. Prev Med. 1986; 15:561–568. [PubMed: 3797388]
SAS Institute Inc. SAS/STAT 9.2 User’s Guide. 2008
Spielberger C, Grier K, Greenfield G. Major dimensions of stress in law enforcement. Florida Fraternal Order Police J Spring. 1982; 6:10–20.
Steinhardt M, Greehow L, Stewart. The relationship of physical activity and cardiovascular fitness to absenteeism and medical care claims among law enforcement officers. Am J Health Prom. 1991; 5:455–460.
Stewart JC, Janicki DL, Muldoon MF, Sutoon-Tyrell K, Kamarck TW. Negative emotions and 3-year progression of subclinical atherosclerosis. Arch Gen Psychiatry. 2007; 64:225–233. [PubMed: 17283290]
Veith RC, Lewis N, Linares OA, Barnes RF, Raskind MA, Villacres EC, Murburg MM, Ashleigh A, Castillo S, Peskind ER, Pascualy M, Halter JB. Sympathetic nervous system activity in major depression: basal and desipramine-induced alterations in plasma norepinephrine kinetics. Arch Gen Psychiatry. 1994; 51:411–422. [PubMed: 8179465]
Violanti JM, Aron F. Ranking police stressors. Psychol Rep. 1994; 75:824–826. [PubMed: 7862790]
Violanti JM, Vena JE, Petralia S. Mortality of a police cohort: 1950–1990. Am J Ind Med. 1998; 33:366–373. [PubMed: 9513643]
Violanti JM, Vena JE, Burchfiel CM, Sharp DS, Miller DB, Andrew ME, Dorn J, Wende-Wactaski J, Beighley CM, Pierino K, Joseph PN, Trevesan M. The Buffalo Cardio-metabolic occupational police stress (BCOPS) pilot study: design, methods, and measurement. Ann Epidemiol. 2006; 16:48–156.
Violanti JM, Burchfiel CM, Hartley TA, Mnatsakanova A, Fekedu-legn D, Andrew ME, Charles LE, Vila BJ. Atypical work hours and metabolic syndrome among police officers. 2009
Violanti et al. Page 12
Int Arch Occup Environ Health. Author manuscript; available in PMC 2015 June 30.
Author M
anuscriptA
uthor Manuscript
Author M
anuscriptA
uthor Manuscript

Waked EG, Jutai JW. Baseline and reactivity measures of blood pressure and negative affect in borderline hypertension. Physiol Beh. 1990; 47:265–271.
Wang Z, Inslicht SS, Metzler TJ, Henn-Haase C, McCaslin SE, Tong H, Neylan TC, Marmer CR. A prospective study of predictor of depression in police. Psychiatry Res. 2010; 175:211–216. [PubMed: 20044144]
Whipple MO, Lewis TT, Sutton-Tyrell K, Matthews KA, Barinas-Mitchell E, Powell LH, Everson-Rose SA. Hopelessness depressive symptoms, and carotid atherosclerosis in women: the study of women’s health across the nation (SWAN) heart study. Stroke. 2011; 40:3166–3172. [PubMed: 19713542]
Williams, C. Peacetime combat treating and preventing delayed stress reactions in police officers, in Post-traumatic stress disorders: a handbook for clinicians. In: Williams, T., editor. Cincinnati: Ohio Disabled American Veterans; 1987.
Wolk R, Somers VK. Sleep and the metabolic syndrome. Exp Physiol. 2007; 92:67–78. [PubMed: 17085678]
Violanti et al. Page 13
Int Arch Occup Environ Health. Author manuscript; available in PMC 2015 June 30.
Author M
anuscriptA
uthor Manuscript
Author M
anuscriptA
uthor Manuscript
Author M
anuscriptA
uthor Manuscript
Author M
anuscriptA
uthor Manuscript
Violanti et al. Page 14
Tab
le 1
Dem
ogra
phic
and
life
styl
e ch
arac
teri
stic
s by
gen
der,
BC
OPS
stu
dy
Cha
ract
eris
tics
Men
(n
= 30
5)W
omen
(n
= 10
7)T
otal
(n
= 41
2)
NM
ean
(SD
)N
Mea
n (S
D)
NM
ean
(SD
)
Age
(ye
ars)
305
41.1
(7.
4)10
740
.7 (
6.1)
412
41.0
(7.
1)
BM
I (k
g/m
2 )30
330
.3 (
4.2)
107
26.0
(4.
7)41
029
.2 (
4.7)
Wai
st c
ircu
mfe
renc
e (c
m)
305
99.1
(11
.3)
107
80.0
(11
.6)
412
94.2
(14
.1)
Polic
e se
rvic
e (y
ears
)30
214
.9 (
7.7)
107
13.5
(6.
8)40
914
.6 (
7.5)
Hou
rs o
f sl
eep/
day
300
6.3
(1.2
)10
66.
4 (1
.3)
406
6.3
(1.2
)
Slee
p qu
ality
(gl
obal
sco
re)
278
6.3
(3.2
)10
47.
0 (3
.7)
382
6.5
(3.3
)
HD
L c
hole
ster
ol (
mg/
dL)
304
42.2
(12
.0)
105
58.3
(15
.8)
409
46.3
(14
.8)
LD
L c
hole
ster
ol (
mg/
dL)
303
131.
0 (3
3.5)
104
118.
9 (3
1.7)
407
128.
0 (3
3.4)
Tri
glyc
erid
es (
mg/
dL)
304
153.
5 (1
27.5
)10
588
.5 (
130.
6)40
913
6.8
(131
.3)
Glu
cose
(m
g/dL
)30
494
.6 (
13.9
)10
686
.3 (
8.3)
410
92.5
(13
.2)
C-r
eact
ive
prot
ein
(mg/
L)
304
3.23
(6.
39)
105
2.74
(3.
26)
409
3.10
(5.
75)
Phys
ical
act
ivity
sco
re30
321
.0 (
18.3
)10
721
.8 (
17.6
)41
021
.3 (
18.1
)
Syst
olic
blo
od p
ress
ure
(mm
Hg)
305
122.
3 (1
1.3)
107
116.
5 (1
3.3)
412
120.
8 (1
2.1)
Dep
ress
ive
sym
ptom
s (C
ES-
D s
core
)30
57.
4 (6
.6)
107
8.7
(8.2
)41
27.
8 (7
.0)
C
CA
IM
T (
mm
)30
50.
626
(0.1
05)
107
0.58
7 (0
.078
)41
20.
616
(0.1
00)
M
MX
IMT
(m
m)
305
0.80
1 (0
.150
)10
70.
729
(0.1
02)
412
0.78
2 (0
.143
)
Eth
nici
ty%
%%
E
urop
ean
Am
eric
an23
778
.278
72.9
315
76.8
A
fric
an A
mer
ican
5317
.529
27.1
8220
.0
H
ispa
nic
Am
eric
an13
4.3
00
133.
2
Edu
catio
n
<
=H
igh
scho
ol/G
ED
3812
.64
3.7
4210
.2
C
olle
ge <
4 ye
ars
160
53.0
6661
.722
655
.3
C
olle
ge 4
+ y
ears
104
34.4
3734
.614
134
.5
Mar
ital s
tatu
s
S
ingl
e28
9.3
2321
.551
12.5
Int Arch Occup Environ Health. Author manuscript; available in PMC 2015 June 30.

Author M
anuscriptA
uthor Manuscript
Author M
anuscriptA
uthor Manuscript
Violanti et al. Page 15
Cha
ract
eris
tics
Men
(n
= 30
5)W
omen
(n
= 10
7)T
otal
(n
= 41
2)
NM
ean
(SD
)N
Mea
n (S
D)
NM
ean
(SD
)
M
arri
ed/u
nmar
ried
cou
ple
236
78.4
6358
.929
973
.3
D
ivor
ced/
sepa
rate
d37
12.3
2119
.658
14.2
Cig
aret
te s
mok
ing
stat
us
N
ever
199
65.7
4643
.824
560
.0
F
orm
er64
21.1
3129
.595
23.3
C
urre
nt40
13.2
2826
.768
16.7
Alc
ohol
inta
ke (
drin
ks/w
eek)
N
one
5116
.726
24.3
7718
.7
<
146
15.1
2321
.569
16.7
1
–371
23.3
2220
.693
22.6
4
–769
22.6
2220
.691
22.1
8
+68
22.3
1413
.182
19.9
Slee
p qu
ality
G
ood
130
42.6
4643
.017
642
.7
P
oor
148
48.5
5854
.220
650
.0
Ant
idep
ress
ant m
edic
atio
n us
e19
6.3
1211
.231
7.6
Hyp
erte
nsio
n80
26.2
1816
.898
23.8
Dia
bete
s10
3.3
10.
911
2.7
Hyp
erte
nsio
n w
as d
efin
ed a
s ta
king
any
med
icat
ion
for
high
blo
od p
ress
ure
or S
BP
≥ 14
0 or
DB
P ≥
90
Dia
bete
s w
as d
efin
ed a
s ta
king
any
med
icat
ion
for
diab
etes
or
fast
ing
seru
m g
luco
se ≥
126
BM
I bo
dy m
ass
inde
x, B
P b
lood
pre
ssur
e, C
IMT
car
otid
intim
a-m
edia
thic
knes
s, C
ES-
D c
ente
r fo
r ep
idem
iolo
gic
stud
ies
depr
essi
on s
cale
Int Arch Occup Environ Health. Author manuscript; available in PMC 2015 June 30.

Author M
anuscriptA
uthor Manuscript
Author M
anuscriptA
uthor Manuscript
Violanti et al. Page 16
Tab
le 2
Sele
cted
cha
ract
eris
tics
by q
uint
iles
of C
ES-
D s
core
, BC
OPS
stu
dy
Qui
ntile
s of
CE
S-D
sco
reP
0–2.
9 (n
= 8
8)3–
4.9
(n =
74)
5–7.
9 (n
= 8
0)8–
11.9
(n
= 80
)12
–42
(n =
90)
Age
(ye
ars)
40.5
± 8
.140
.8 ±
6.3
41.4
± 7
.541
.3 ±
6.6
40.8
± 7
.00.
833
BM
I (k
g/m
2 )28
.8 ±
3.4
29.8
± 4
.928
.7 ±
4.8
29.8
± 5
.628
.8 ±
4.6
0.48
7
Wai
st c
ircu
mfe
renc
e (c
m)
93.3
± 1
2.2
94.6
± 1
4.4
92.8
± 1
4.0
96.6
± 1
5.9
93.7
± 1
4.2
0.82
7
Polic
e se
rvic
e (y
ears
)14
.0 ±
8.0
14.2
± 6
.415
.9 ±
8.1
14.3
± 7
.714
.4 ±
6.9
0.99
9
Hou
rs o
f sl
eep
per
24-h
per
iod
6.4
± 1
.36.
1 ±
1.2
6.4
± 1
.26.
4 ±
1.2
6.3
± 1
.20.
726
Slee
p qu
ality
5.0
± 2
.85.
4 ±
2.6
5.5
± 3
.47.
4 ±
3.0
8.9
± 3
.0<
0.00
01
HD
L c
hole
ster
ol (
mg/
dL)
47.0
± 1
4.8
43.3
± 1
3.8
46.7
± 1
3.9
47.8
± 1
6.2
46.6
± 1
5.1
0.70
2
LD
L c
hole
ster
ol (
mg/
dL)
125.
8 ±
31.
112
6.4
± 3
0.9
124.
0 ±
28.
912
7.1
± 3
5.5
135.
5 ±
38.
70.
160
Tri
glyc
erid
es (
mg/
dL)
126.
2 ±
106
.614
0.5
± 1
51.7
112.
9 ±
80.
313
6.6
± 1
03.5
165.
7 ±
181
.10.
087
Glu
cose
(m
g/dL
)92
.1 ±
10.
992
.5 ±
9.6
92.4
± 1
2.6
91.5
± 1
0.3
93.7
± 1
9.5
0.75
3
C-r
eact
ive
prot
ein
(mg/
L)
2.8
± 3
.32.
2 ±
1.9
3.7
± 8
.84.
2 ±
8.1
2.6
± 3
.00.
959
Phys
ical
act
ivity
sco
re20
.7 ±
17.
221
.6 ±
15.
819
.8 ±
16.
621
.1 ±
17.
022
.9 ±
22.
60.
784
Syst
olic
blo
od p
ress
ure
(mm
Hg)
120.
2 ±
12.
012
1.6
± 1
1.0
121.
0 ±
13.
712
1.0
± 1
1.3
120.
4 ±
12.
50.
721
Rac
e/et
hnic
ity (
%)
C
auca
sian
83.0
63.0
77.5
74.7
83.3
0.02
9
A
fric
an A
mer
ican
17.0
31.5
21.3
20.3
12.2
H
ispa
nic
Am
eric
an0
5.5
1.3
5.0
4.4
Edu
catio
n (%
)
≤
Hig
h sc
hool
/GE
D10
.212
.38.
88.
911
.20.
937
C
olle
ge <
4 ye
ars
60.2
52.1
51.3
55.7
56.2
C
olle
ge ≥
4 ye
ars
29.6
35.6
40.0
35.4
32.6
Mar
ital s
tatu
s (%
)
S
ingl
e10
.215
.38.
813
.914
.60.
909
M
arri
ed/u
nmar
ried
76.1
72.2
77.5
72.2
D
ivor
ced/
sepa
rate
d13
.612
.513
.813
.916
.9
Smok
ing
stat
us (
%)
N
ever
58.6
61.6
65.0
54.4
60.0
0.76
8
Int Arch Occup Environ Health. Author manuscript; available in PMC 2015 June 30.
Author M
anuscriptA
uthor Manuscript
Author M
anuscriptA
uthor Manuscript
Violanti et al. Page 17
Qui
ntile
s of
CE
S-D
sco
reP
0–2.
9 (n
= 8
8)3–
4.9
(n =
74)
5–7.
9 (n
= 8
0)8–
11.9
(n
= 80
)12
–42
(n =
90)
F
orm
er26
.424
.721
.324
.120
.0
C
urre
nt15
.013
.712
.521
.520
.0
Alc
ohol
inta
ke (
drin
ks/w
k)
N
one
20.5
24.3
17.5
15.0
16.7
<
113
.624
.320
.011
.315
.6
1
–330
.714
.928
.818
.818
.9
4
–721
.618
.915
.028
.825
.6
≥
813
.617
.618
.826
.323
.30.
126
Slee
p qu
ality
G
ood
63.9
58.8
60.3
32.9
17.7
<0.
0001
P
oor
36.1
41.2
39.7
67.1
82.3
Ant
idep
ress
ant m
edic
atio
n5.
75.
55.
02.
517
.80.
004
Hyp
erte
nsio
n (%
)25
.024
.326
.321
.322
.20.
944
Dia
bete
s (%
)2.
34.
15.
00
2.2
0.30
6
Res
ults
are
mea
ns ±
sta
ndar
d de
viat
ions
or
perc
enta
ges
The
p v
alue
s fo
r co
ntin
uous
var
iabl
es a
re f
rom
line
ar r
egre
ssio
n m
odel
s, a
nd f
or th
e ca
tego
rica
l var
iabl
es, c
hi-s
quar
e
BM
I bo
dy m
ass
inde
x, B
P b
lood
pre
ssur
e, H
DL
hig
h-de
nsity
lipo
prot
ein,
LD
L lo
w-d
ensi
ty li
popr
otei
n
Int Arch Occup Environ Health. Author manuscript; available in PMC 2015 June 30.
Author M
anuscriptA
uthor Manuscript
Author M
anuscriptA
uthor Manuscript
Violanti et al. Page 18
Table 3
Selected characteristics by CCA IMT and MMXIMT measures, BCOPS study
Covariates CCA IMT MMXIMT
Age (years) 0.5093, <0.0001 0.5425, <0.0001
BMI (kg/m2) 0.2509, <0.0001 0.2696, <0.0001
Waist circumference (cm) 0.2634, <0.0001 0.2846, <0.0001
Police service (years) 0.3935, <0.0001 0.4349, <0.0001
Hours of sleep per 24-h period −0.0066, 0.895 −0.0282, 0.571
Sleep quality −0.0444, 0.387 −0.0856, 0.095
HDL cholesterol (mg/dL) −0.1469, 0.0029 −0.1516, 0.0021
LDL cholesterol (mg/dL) 0.1327, 0.0074 0.1360, 0.0060
Triglycerides (mg/dL) 0.0987, 0.0460 0.0633, 0.2014
Glucose (mg/dL) 0.1661, 0.0007 0.2012, <0.0001
C-reactive protein (mg/L) 0.0839, 0.0901 0.0598, 0.2277
Physical activity score 0.0756, 0.126 0.0751, 0.129
Systolic blood pressure (mmHg) 0.2295, <0.0001 0.2155, <0.0001
Race/ethnicity
European American 0.608 ± 0.100 0.773 ± 0.139
African American 0.640 ± 0.095 0.801 ± 0.115
Hispanic American 0.665 ± 0.106 0.889 ± 0.285
p value* 0.007 0.007
Education
<=High school/GED 0.627 ± 0.090 0.813 ± 0.137
College <4 years 0.621 ± 0.110 0.780 ± 0.155
College 4+ years 0.604 ± 0.086 0.777 ± 0.123
p value† 0.202 0.153
Marital status
Single 0.595 ± 0.097 0.742 ± 0.116
Married/unmarried couple 0.613 ± 0.095 0.785 ± 0.151
Divorced/separated 0.646 ± 0.124 0.802 ± 0.116
p value* 0.020 0.071
Cigarette smoking status
Never 0.607 ± 0.093 0.772 ± 0.114
Former 0.638 ± 0.117 0.813 ± 0.188
Current 0.619 ± 0.100 0.773 ± 0.160
p value* 0.037 0.055
Alcohol intake (drinks/week)
None 0.543 ± 0.078 0.676 ± 0.154
<1 0.603 ± 0.082 0.777 ± 0.136
1–3 0.630 ± 0.105 0.789 ± 0.139
4–7 0.608 ± 0.089 0.770 ± 0.129
Int Arch Occup Environ Health. Author manuscript; available in PMC 2015 June 30.

Author M
anuscriptA
uthor Manuscript
Author M
anuscriptA
uthor Manuscript
Violanti et al. Page 19
Covariates CCA IMT MMXIMT
8+ 0.619 ± 0.120 0.791 ± 0.175
p value†† 0.441 0.283
Sleep quality
Good 0.626 ± 0.008 0.803 ± 0.011
Poor 0.607 ± 0.007 0.763 ± 0.010
p value* 0.069 0.008
Antidepressant medication use
Yes 0.616 ± 0.105 0.890 ± 0.169
No 0.616 ± 0.100 0.890 ± 0.217
p value* 0.977 0.986
Hypertension
Yes 0.663 ± 0.123 0.843 ± 0.192
No 0.602 ± 0.088 0.764 ± 0.119
p value* <0.0001 <0.0001
Diabetes
Yes 0.687 ± 0.100 0.979 ± 0.364
No 0.614 ± 0.100 0.777 ± 0.128
p value* 0.016 <0.0001
Results are Pearson’s correlation coefficients and mean ± SD
*p value for any difference between the means
†p value from polynomial orthogonal contrast linear trend
††p value from linear regression models
Int Arch Occup Environ Health. Author manuscript; available in PMC 2015 June 30.

Author M
anuscriptA
uthor Manuscript
Author M
anuscriptA
uthor Manuscript
Violanti et al. Page 20
Tab
le 4
Una
djus
ted
and
adju
sted
mea
n va
lues
of
the
CC
A I
MT
and
MM
XIM
T a
cros
s qu
intil
es o
f C
ES-
D s
core
, BC
OPS
stu
dy
Qui
ntile
s of
CE
S-D
sco
rep
valu
e*
0–2.
9 (n
= 8
8)3–
4.9
(n =
74)
5–7.
9 (n
= 8
0)8–
11.9
(n
= 80
)12
–42
(n =
90)
CC
A I
MT
(m
m)
M
odel
10.
617
± 0
.114
0.60
7 ±
0.0
890.
612
± 0
.101
0.61
6 ±
0.0
930.
624
± 0
.102
0.47
9
M
odel
20.
621
± 0
.013
0.60
0 ±
0.0
130.
612
± 0
.013
0.61
2 ±
0.0
130.
630
± 0
.013
0.30
0
M
odel
30.
652
± 0
.021
0.62
9 ±
0.0
200.
646
± 0
.021
0.64
0 ±
0.0
210.
660
± 0
.020
0.35
6
MM
XIM
T (
mm
)
M
odel
10.
785
± 0
.147
0.78
4 ±
0.1
720.
784
± 0
.142
0.77
7 ±
0.1
200.
781
± 0
.133
0.73
5
M
odel
20.
805
± 0
.018
0.78
8 ±
0.0
180.
795
± 0
.019
0.77
9 ±
0.0
180.
800
± 0
.017
0.66
3
M
odel
30.
887
± 0
.028
0.86
7 ±
0.0
280.
878
± 0
.028
0.86
1 ±
0.0
290.
884
± 0
.028
0.76
3
Val
ues
are
mea
ns (
stan
dard
dev
iatio
ns)
for
unad
just
ed m
odel
s or
mea
ns (
stan
dard
err
ors)
for
adj
uste
d m
odel
s
Mod
el 1
: Una
djus
ted
Mod
el 2
: Adj
uste
d fo
r ag
e, g
ende
r, r
ace,
edu
catio
nal l
evel
, cig
aret
te s
mok
ing
stat
us, a
nd a
lcoh
ol in
take
Mod
el 3
: Adj
uste
d fo
r ag
e, g
ende
r, r
ace,
edu
catio
nal l
evel
, cig
aret
te s
mok
ing
stat
us, a
lcoh
ol in
take
, wai
st c
ircu
mfe
renc
e, H
DL
cho
lest
erol
, LD
L c
hole
ster
ol, t
rigl
ycer
ides
, glu
cose
, dia
bete
s, s
ysto
lic b
lood
pr
essu
re, h
yper
tens
ion,
ant
idep
ress
ant m
edic
atio
n us
e, a
nd p
hysi
cal a
ctiv
ity
CC
A I
MT
com
mon
car
otid
intim
a-m
edia
thic
knes
s, M
MX
IMT
max
imum
car
otid
intim
a-m
edia
thic
knes
s, C
ES-
D c
ente
r fo
r ep
idem
iolo
gic
stud
ies
depr
essi
on s
cale
* p va
lues
are
fro
m li
near
ort
hogo
nal c
ontr
asts
Int Arch Occup Environ Health. Author manuscript; available in PMC 2015 June 30.

Author M
anuscriptA
uthor Manuscript
Author M
anuscriptA
uthor Manuscript
Violanti et al. Page 21
Tab
le 5
Una
djus
ted
and
adju
sted
mea
n va
lues
of
the
CC
A I
MT
and
MM
XIM
T a
cros
s qu
intil
es o
f C
ES-
D s
core
, str
atif
ied
by h
yper
tens
ion,
BC
OPS
stu
dy
Qui
ntile
s of
CE
S-D
sco
rep
valu
e*
0–2.
9 (n
= 8
8)3–
4.9
(n =
74)
5–7.
9 (n
= 8
0)8–
11.9
(n
= 80
)12
–42
(n =
90)
CC
A I
MT
(m
m)
Hyp
erte
nsio
nn
= 1
9n
= 1
8n
= 2
0n
= 1
7n
= 1
9
M
odel
10.
694
± 0
.178
0.65
8 ±
0.1
150.
667
± 0
.139
0.67
3 ±
0.0
830.
622
± 0
.065
0.15
7
M
odel
20.
715
± 0
.034
0.65
9 ±
0.0
340.
663
± 0
.037
0.67
4 ±
0.0
380.
642
± 0
.037
0.14
4
M
odel
30.
781
± 0
.051
0.71
0 ±
0.0
490.
747
± 0
.052
0.72
0 ±
0.0
550.
701
± 0
.050
0.11
6
No
hype
rten
sion
n =
69
n =
56
n =
60
n =
63
n =
71
M
odel
10.
596
± 0
.078
0.59
1 ±
0.0
740.
593
± 0
.077
0.60
1 ±
0.0
900.
625
± 0
.110
0.04
1
M
odel
20.
590
± 0
.014
0.58
3 ±
0.0
140.
593
± 0
.014
0.59
3 ±
0.0
130.
622
± 0
.013
0.01
3
M
odel
30.
610
± 0
.023
0.60
0 ±
0.0
240.
610
± 0
.024
0.61
1 ±
0.0
240.
637
± 0
.023
0.03
0
MM
XIM
T (
mm
)
Hyp
erte
nsio
n
M
odel
10.
866
± 0
.221
0.87
7 ±
0.2
610.
849
± 0
.207
0.86
4 ±
0.1
070.
764
± 0
.108
0.12
6
M
odel
20.
919
± 0
.054
0.86
1 ±
0.0
530.
848
± 0
.058
0.86
7 ±
0.0
590.
786
± 0
.057
0.06
3
M
odel
31.
192
± 0
.071
1.08
4 ±
0.0
671.
114
± 0
.072
1.14
0 ±
0.0
751.
049
± 0
.068
0.07
8
No
hype
rten
sion
M
odel
10.
763
± 0
.111
0.75
4 ±
0.1
200.
762
± 0
.106
0.75
3 ±
0.1
130.
785
± 0
.139
0.34
6
M
odel
20.
760
± 0
.018
0.75
2 ±
0.0
190.
764
± 0
.018
0.74
5 ±
0.0
170.
784
± 0
.017
0.28
8
M
odel
30.
752
± 0
.030
0.74
0 ±
0.0
300.
750
± 0
.030
0.73
1 ±
0.0
300.
768
± 0
.029
0.53
0
Inte
ract
ion
p va
lue
= 0
.062
Val
ues
are
mea
ns (
stan
dard
dev
iatio
ns)
for
unad
just
ed m
odel
s or
mea
ns (
stan
dard
err
ors)
for
adj
uste
d m
odel
s
Mod
el 1
: Una
djus
ted
Mod
el 2
: Adj
uste
d fo
r ag
e, g
ende
r, r
ace,
edu
catio
nal l
evel
, cig
aret
te s
mok
ing
stat
us, a
nd a
lcoh
ol in
take
Mod
el 3
: Adj
uste
d fo
r ag
e, g
ende
r, r
ace,
edu
catio
nal l
evel
, cig
aret
te s
mok
ing
stat
us, a
lcoh
ol in
take
, wai
st c
ircu
mfe
renc
e, H
DL
cho
lest
erol
, LD
L c
hole
ster
ol, t
rigl
ycer
ides
, glu
cose
, dia
bete
s, s
ysto
lic b
lood
pr
essu
re, h
yper
tens
ion,
ant
idep
ress
ant m
edic
atio
n us
e, a
nd p
hysi
cal a
ctiv
ity
Inte
ract
ion
by h
yper
tens
ion
stat
us f
or C
CA
IM
T: p
= 0
.088
Inte
ract
ion
by h
yper
tens
ion
stat
us f
or M
MX
IMT
: p =
0.0
83
Int Arch Occup Environ Health. Author manuscript; available in PMC 2015 June 30.

Author M
anuscriptA
uthor Manuscript
Author M
anuscriptA
uthor Manuscript
Violanti et al. Page 22C
IMT
car
otid
intim
a-m
edia
thic
knes
s, C
ES-
D c
ente
r fo
r ep
idem
iolo
gic
stud
ies
depr
essi
on s
cale
* p va
lues
are
fro
m li
near
ort
hogo
nal c
ontr
asts
Int Arch Occup Environ Health. Author manuscript; available in PMC 2015 June 30.

Author M
anuscriptA
uthor Manuscript
Author M
anuscriptA
uthor Manuscript
Violanti et al. Page 23
Tab
le 6
Una
djus
ted
and
adju
sted
mea
n va
lues
of
the
CC
A I
MT
and
MM
XIM
T a
cros
s qu
intil
es o
f C
ES-
D s
core
, str
atif
ied
by s
leep
qua
lity,
BC
OPS
stu
dy
Qui
ntile
s of
CE
S-D
sco
rep
valu
e*
0–2.
9 (n
= 8
3)3–
4.9
(n =
68)
5–7.
9 (n
= 7
3)8–
11.9
(n
= 73
)12
–42
(n =
85)
CC
A I
MT
(m
m)
Poor
sle
ep q
ualit
y(n
= 3
0)(n
= 2
8)(n
= 2
9)(n
= 4
9)(n
= 7
0)
M
odel
10.
587
± 0
.083
0.59
7 ±
0.0
720.
595
± 0
.093
0.61
4 ±
0.0
910.
618
± 0
.085
0.06
0
M
odel
20.
600
± 0
.018
0.59
6 ±
0.0
180.
603
± 0
.018
0.60
7 ±
0.0
150.
626
± 0
.014
0.09
3
M
odel
30.
615
± 0
.030
0.60
8 ±
0.0
280.
618
± 0
.028
0.61
9 ±
0.0
280.
644
± 0
.027
0.07
1
Goo
d sl
eep
qual
ity(n
= 5
3)(n
= 4
0)(n
= 4
4)(n
= 2
4)(n
= 1
5)
M
odel
10.
636
± 0
.129
0.61
8 ±
0.1
020.
611
± 0
.097
0.61
7 ±
0.1
070.
664
± 0
.165
0.46
7
M
odel
20.
634
± 0
.021
0.60
2 ±
0.0
200.
609
± 0
.021
0.62
4 ±
0.0
250.
667
± 0
.029
0.15
9
M
odel
30.
697
± 0
.039
0.66
1 ±
0.0
380.
677
± 0
.039
0.67
2 ±
0.0
430.
722
± 0
.044
0.33
1
MM
XIM
T (
mm
)
Poor
sle
ep q
ualit
y
M
odel
10.
736
± 0
.094
0.75
5 ±
0.1
030.
750
± 0
.112
0.77
7 ±
0.1
260.
775
± 0
.125
0.09
1
M
odel
20.
751
± 0
.024
0.74
5 ±
0.0
230.
757
± 0
.023
0.76
2 ±
0.0
190.
782
± 0
.018
0.10
4
M
odel
30.
730
± 0
.039
0.72
1 ±
0.0
360.
734
± 0
.037
0.73
8 ±
0.0
370.
765
± 0
.036
0.08
3
Goo
d sl
eep
qual
ity
M
odel
10.
815
± 0
.168
0.80
8 ±
0.2
120.
794
± 0
.159
0.76
9 ±
0.1
190.
826
± 0
.176
0.89
0
M
odel
20.
839
± 0
.031
0.80
4 ±
0.0
290.
814
± 0
.031
0.79
9 ±
0.0
360.
844
± 0
.042
0.95
6
M
odel
31.
095
± 0
.051
1.05
2 ±
0.0
491.
075
± 0
.051
1.03
8 ±
0.0
561.
074
± 0
.056
0.49
4
Val
ues
are
mea
ns (
stan
dard
dev
iatio
ns)
for
unad
just
ed m
odel
s or
mea
ns (
stan
dard
err
ors)
for
adj
uste
d m
odel
s
Mod
el 1
: Una
djus
ted
Mod
el 2
: Adj
uste
d fo
r ag
e, g
ende
r, r
ace,
edu
catio
nal l
evel
, cig
aret
te s
mok
ing
stat
us, a
nd a
lcoh
ol in
take
Mod
el 3
: Adj
uste
d fo
r ag
e, g
ende
r, r
ace,
edu
catio
nal l
evel
, cig
aret
te s
mok
ing
stat
us, a
lcoh
ol in
take
, wai
st c
ircu
mfe
renc
e, H
DL
cho
lest
erol
, LD
L c
hole
ster
ol, t
rigl
ycer
ides
, glu
cose
, dia
bete
s, s
ysto
lic b
lood
pr
essu
re, h
yper
tens
ion,
ant
idep
ress
ant m
edic
atio
n us
e, a
nd p
hysi
cal a
ctiv
ity
Inte
ract
ion
by s
leep
qua
lity
for
CC
A I
MT
: p =
0.7
03
Inte
ract
ion
by s
leep
qua
lity
for
MM
XIM
T: p
= 0
.249
CC
A I
MT
com
mon
car
otid
intim
a-m
edia
thic
knes
s, M
MX
IMT
max
imum
car
otid
intim
a-m
edia
thic
knes
s, C
ES-
D c
ente
r fo
r ep
idem
iolo
gic
stud
ies
depr
essi
on s
cale
Int Arch Occup Environ Health. Author manuscript; available in PMC 2015 June 30.
Author M
anuscriptA
uthor Manuscript
Author M
anuscriptA
uthor Manuscript
Violanti et al. Page 24* p
valu
es a
re f
rom
line
ar o
rtho
gona
l con
tras
ts
Int Arch Occup Environ Health. Author manuscript; available in PMC 2015 June 30.