Embed Size (px)
Citation preview

Quarterly Report from
the HHS Ombudsman
Managed Care
Assistance Team
2nd Quarter FY 2020
As Required by
Section 531.0213 of the
Government Code
Office of the Ombudsman
September 2020
ii
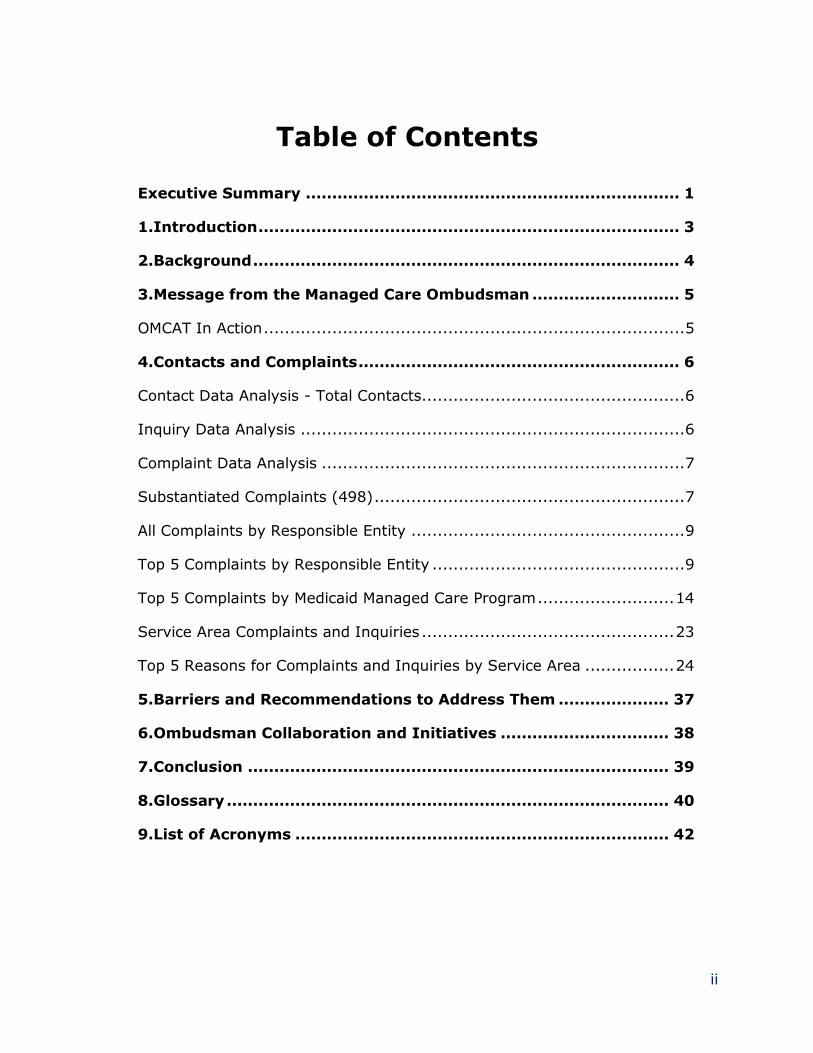
Table of Contents
Executive Summary ....................................................................... 1
1.Introduction ................................................................................ 3
2.Background ................................................................................. 4
3.Message from the Managed Care Ombudsman ............................ 5
OMCAT In Action ................................................................................ 5
4.Contacts and Complaints ............................................................. 6
Contact Data Analysis - Total Contacts.................................................. 6
Inquiry Data Analysis ......................................................................... 6
Complaint Data Analysis ..................................................................... 7
Substantiated Complaints (498) ........................................................... 7
All Complaints by Responsible Entity .................................................... 9
Top 5 Complaints by Responsible Entity ................................................ 9
Top 5 Complaints by Medicaid Managed Care Program .......................... 14
Service Area Complaints and Inquiries ................................................ 23
Top 5 Reasons for Complaints and Inquiries by Service Area ................. 24
5.Barriers and Recommendations to Address Them ..................... 37
6.Ombudsman Collaboration and Initiatives ................................ 38
7.Conclusion ................................................................................ 39
8.Glossary .................................................................................... 40
9.List of Acronyms ....................................................................... 42

1
Executive Summary
In accordance with Government Code Chapter 531, Section 531.0213(d)(5), the Health and Human Services Commission is required to collect and maintain statistical information on a regional basis regarding calls received by the Ombudsman Managed
Care Assistance Team (OMCAT) and publish quarterly reports that: list the number of calls received by the region; identify trends in delivery and access problems; identify
recurring barriers in the Medicaid system; and indicate other problems identified with Medicaid managed care.
The data provided in this report is exclusive to contacts received by OMCAT and does
not include contacts received by any other areas within Health and Human Services (HHS).
OMCAT received 8,059 contacts during the second quarter of fiscal year 2020; of these contacts, 2,792 were complaints and 5,267 were inquiries. Of the complaints that were
received, 498 were substantiated, 312 were unsubstantiated, and 1,978 were unable to be substantiated (e.g. there was not enough evidence to determine whether agency policy or expectations were violated).
Figure 1 Total Contacts by Type

2
The most common reasons for complaints received by consumers during the second quarter of fiscal year 2020 were related to:
● Medicaid Eligibility/Recertification ● Access to Prescriptions – Other Insurance ● Access to Prescriptions – Member Not Showing Active
● Case Information Error ● Home Health
This report contains recommendations to mitigate issues related to consumer access to prescriptions and erroneous insurance information on Medicaid cases. These continue to be the most frequent and ongoing barriers to care that drive Medicaid managed care
consumers to contact OMCAT.
3
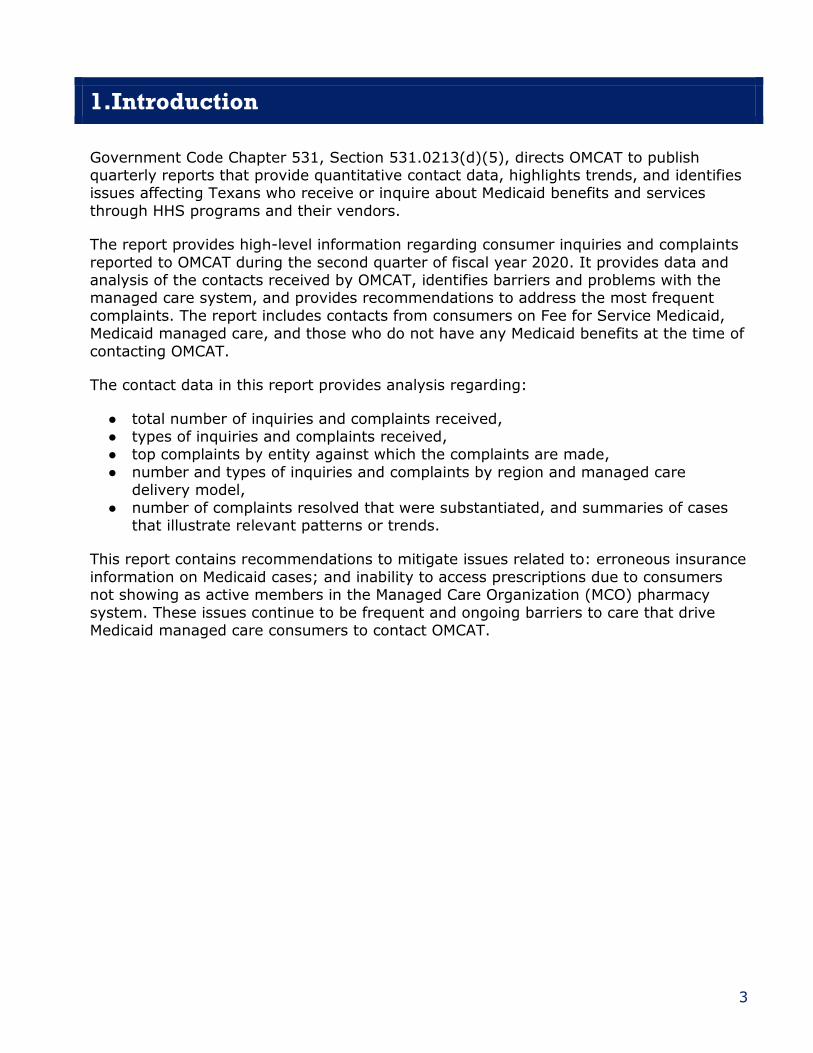
1.Introduction
Government Code Chapter 531, Section 531.0213(d)(5), directs OMCAT to publish quarterly reports that provide quantitative contact data, highlights trends, and identifies issues affecting Texans who receive or inquire about Medicaid benefits and services
through HHS programs and their vendors.
The report provides high-level information regarding consumer inquiries and complaints
reported to OMCAT during the second quarter of fiscal year 2020. It provides data and analysis of the contacts received by OMCAT, identifies barriers and problems with the managed care system, and provides recommendations to address the most frequent
complaints. The report includes contacts from consumers on Fee for Service Medicaid, Medicaid managed care, and those who do not have any Medicaid benefits at the time of
contacting OMCAT.
The contact data in this report provides analysis regarding:
● total number of inquiries and complaints received, ● types of inquiries and complaints received, ● top complaints by entity against which the complaints are made,
● number and types of inquiries and complaints by region and managed care delivery model,
● number of complaints resolved that were substantiated, and summaries of cases that illustrate relevant patterns or trends.
This report contains recommendations to mitigate issues related to: erroneous insurance
information on Medicaid cases; and inability to access prescriptions due to consumers not showing as active members in the Managed Care Organization (MCO) pharmacy
system. These issues continue to be frequent and ongoing barriers to care that drive Medicaid managed care consumers to contact OMCAT.
4
2.Background
Government Code 531.0171 requires the HHS Office of the Ombudsman to provide dispute resolution services for the health and human services system and perform consumer protection and advocacy functions related to health and human services. This
assistance includes assisting a consumer or other interested person with raising a matter within the health and human services system that the person feels is being ignored,
obtaining information regarding a filed complaint, and collecting inquiry and complaint data related to the health and human services system.
The Medicaid Managed Care helpline began operations on January 2, 2001, under a non-
profit organization, Texas HEART, contracted by the Texas Department of Health. On September 1, 2007, HHSC transitioned the helpline into the HHS Office of the
Ombudsman. The helpline was originally created during the 71st Texas Legislative Session through SB 601, which required HHSC to operate a helpline to assist consumers
with urgent medical needs who experience barriers to receiving Medicaid and Medicaid managed care services.
OMCAT receives contacts from the public via a toll free helpline and an online submission
form, which can be accessed at HHS Ombudsman Managed Care Help. Contacts are captured in the HHS Enterprise Administrative Report and Tracking System (HEART), a
web-based system that tracks inquiries and complaints for several HHS programs. HEART tracks consumer specific information, consumer issues, regional and program data, as well as the findings and resolutions of OMCAT investigations.

5
3.Message from the Managed Care Ombudsman
This is the sixth of an ongoing series of publicly available quarterly reports that OMCAT will be publishing on its website at HHS Ombudsman Managed Care Help as well as on the HHS Reports and Presentations website at HHS Reports and Presentations.
This report offers our program an opportunity to identify and highlight trends and emergent issues reported by consumers who contact our office. The report contains
regional data, Medicaid program specific data, as well as recommendations that the Office of the Ombudsman has for resolving problem trends. It should be noted that the data in this report only represents contacts received by OMCAT. Therefore, it will not
include all Medicaid managed care complaints received by the agency, vendors, or MCOs during the quarter.
OMCAT is comprised of highly trained and experienced professionals who, collectively, possess 35 years of Medicaid managed care experience. As ombudsmen, staff educate
consumers on their rights and responsibilities, help consumers navigate the Medicaid managed care system, and resolve complaints. OMCAT investigates consumer complaints, works with Medicaid and CHIP Services to determine compliance with state
and agency rules and policies, determines if agency expectations were met, and provides recommendations for resolution with the goal of preventing future occurrences.
OMCAT welcomes feedback from stakeholders to improve this report in its ability to reflect the experience of Medicaid consumers who have contacted OMCAT.
OMCAT In Action
Upon adoption, a consumer was moved from Foster Care Medicaid to Adoption
Assistance Medicaid. This change resulted in the consumer being enrolled with a health plan that was different from the one the child had in foster care. This change in health
plan caused a disruption in obtaining medical supplies and authorization for several physician appointments that were necessary to continue treating the child’s health
condition. OMCAT worked with the consumer’s new health plan to obtain authorization for the appointments and to ensure delivery of needed medical equipment.

6
4.Contacts and Complaints
Contact Data Analysis - Total Contacts
OMCAT received 8,059 contacts in the second quarter of fiscal year 2020. Compared to the first quarter of fiscal year 2020, the second quarter of fiscal year 2020 saw an
increase of one percent (107) in total contacts. Total contacts include general inquiries and complaints from consumers, legislative staff on behalf of consumers, and other stakeholders related to Medicaid benefits and services.
Inquiry Data Analysis
OMCAT received 5,267 inquiries, which is a decrease of two percent (-80), in the second
quarter of fiscal year 2020 compared to the first quarter of fiscal year 2020. Inquiries
remain an important indicator of member’s educational needs and requests for information.
Top 10 Inquiries
The top ten inquiries listed below represent 62.24% (3,278) of the total number of inquiries received during the first quarter.
Table 1 Top 10 Inquiries
Inquiry Reason Count Percent of Total
Verify Health Coverage 1,025 19%
Apply for Health Coverage 322 6%
Explanation of Benefits/Policy 301 6%
Access to PCP/Change PCP 298 6%
Change Plan-Provider (PCP, Facility, DME) 275 5%
Reporting Change 233 4%
Billing Inquiry 224 4%
Caller Disconnected/Didn’t respond 217 4%
Other/NA 195 4%
7
Inquiry Reason Count Percent of Total
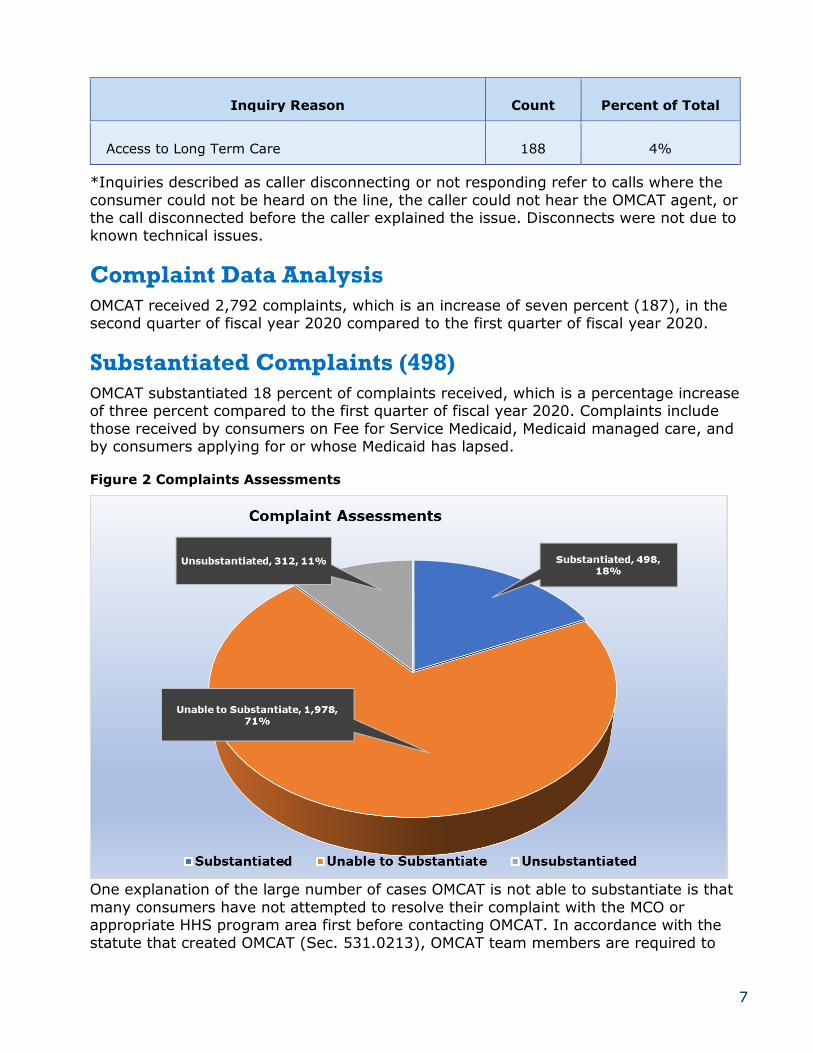
Access to Long Term Care 188 4%
*Inquiries described as caller disconnecting or not responding refer to calls where the
consumer could not be heard on the line, the caller could not hear the OMCAT agent, or the call disconnected before the caller explained the issue. Disconnects were not due to known technical issues.
Complaint Data Analysis
OMCAT received 2,792 complaints, which is an increase of seven percent (187), in the second quarter of fiscal year 2020 compared to the first quarter of fiscal year 2020.
Substantiated Complaints (498)
OMCAT substantiated 18 percent of complaints received, which is a percentage increase of three percent compared to the first quarter of fiscal year 2020. Complaints include
those received by consumers on Fee for Service Medicaid, Medicaid managed care, and by consumers applying for or whose Medicaid has lapsed.
Figure 2 Complaints Assessments
One explanation of the large number of cases OMCAT is not able to substantiate is that
many consumers have not attempted to resolve their complaint with the MCO or appropriate HHS program area first before contacting OMCAT. In accordance with the
statute that created OMCAT (Sec. 531.0213), OMCAT team members are required to

8
educate consumers so they can advocate for themselves. When consumers are educated on how to file their complaint with the appropriate area, this results in an initial referral
to the health plan or appropriate HHS program. In these cases, OMCAT will not have the final resolution to the complaints and therefore cannot determine if the complaints were substantiated or not.
Substantiated: a complaint where research clearly indicates agency policy was violated or agency expectations were not met. (Example: Consumer complains that their home
health attendant did not show up for duty. Research shows that the home health agency confirmed that the attendant was not able to work that day.)
Unable to Substantiate: a complaint where research does not clearly indicate if
agency policy was violated or agency expectations were met. (Example: Consumer has a complaint about accessing medical services and is referred to their MCO to address the
complaint since they have not yet tried to work with their MCO.)
Unsubstantiated: a complaint where research clearly indicates agency policy was not
violated or agency expectations were met. (Example: Consumer complains that that their prescription was rejected at the pharmacy. Research shows that the consumer is not yet due to refill that prescription.)
Top Ten Substantiated Complaints
Inability to access prescriptions due to other insurance showing on consumers’ Medicaid cases in HHSC systems or on the MCO’s pharmacy system (87);
Inability to access prescriptions due to the consumer not showing as active in the pharmacies’ systems or with the MCO’s pharmacy benefits manager (PBM) (75);
Issues with accessing home health services (40);
Errors on Medicaid case (29);
Inability to access prescriptions due to pharmacies billing the wrong health plan (23);
Issues with accessing in-network specialists and facilities (20);
Medicaid Eligibility/Recertification (18);
Access to a PCP (16);
Inability to access durable medical equipment (DME) (15); and
Denial of Services (14).

9
All Complaints by Responsible Entity
Figure 3 Complaints by Responsible Entity
The Responsible Entity refers to the area found or presumed responsible for the program or service about which the consumer in contacting OMCAT. Complaints in this section of
the report include those that were substantiated, unsubstantiated and those that OMCAT was unable to substantiate. Complaints received in the second quarter were found to be associated to three main responsible entities: managed care plans, HHSC, and
providers. HHSC and providers were the Responsible Entity in 57 percent of complaints (1,601), Managed care plans were the Responsible Entity in 35 percent of complaints
(981), the remainder of complaints were against various entities not already mentioned and made up eight percent (210) of all complaints received in the second quarter.
Top 5 Complaints by Responsible Entity
The tables below show the top 5 complaints by Responsible Entity. Complaints include those that are substantiated, unsubstantiated, and unable to substantiate.

10
HHSC
Table 2 HHSC Top 5 Complaints
HHSC Top 5 Complaints Count Substantiated
%
Substantiated*
Medicaid
Eligibility/Recertification
316 13 19%
Case Information Error 142 18 26%
Access to Prescriptions – Other
Insurance
32 13 19%
Home Health 28 2 3%
Access to Prescriptions – Member
Not Showing Active
27 6 9%
Table 3 HHSC Top 5 Substantiated Complaints
HHSC Top 5 Substantiated
Complaints Count Substantiated
%
Substantiated*
Case Information Error 142 18 26%
Access to Prescriptions – Other
Insurance
32 13 19%
Medicaid
Eligibility/Recertification
316 13 19%
Access to Prescriptions – Member
Not Showing Active
27 6 9%
Systems Issues 13 3 4%
*represents percent of total substantiated complaints
There were 782 complaints received where the entity responsible for the complaint was HHSC. Of those complaints, 68 (9%) were substantiated. The second quarter of fiscal year 2020 had an increase of seven percent (48) in complaints
compared to the first quarter of fiscal year 2020 (734). The second quarter of fiscal year

11
2020 had a percentage increase of one percent in substantiated complaints compared to the first quarter of fiscal year 2020.
Substantiated complaints of incorrect information on the Medicaid case includes: incorrect residential information; incorrect start date of Medicaid coverage; incorrect gender; misspelled name; incorrect DOB; incorrect SSN; Medicare information showing
on case when consumer is not active with Medicare; authorized representative not showing on case; and a newborn that was not added to the case.
Substantiated complaints of inability to access prescription due to other insurance are related to private insurance or Medicare showing in HHS systems even though the consumer was not active with other coverage at the time of service.
Substantiated complaints of Medicaid eligibility and recertification include: applications not worked timely; consumer trying to withdraw from Medicaid for months; and a
consumer that came off the STAR+PLUS Waiver interest list but had not been contacted by anyone to set up an assessment for services.
Substantiated complaints of inability to access prescriptions due to consumers not showing as active is due to consumers being recently certified for Medicaid but eligibility has not yet transferred to all HHS systems.
Managed Care Plans
Table 4 Managed Care Plans Top 5 Complaints
MCO Top 5 Complaints Count Substantiated
%
Substantiated*
Access to In-Network Provider
(non-PCP)
103 17 7%
Home Health 98 38 15%
Access to Prescriptions – Other
Insurance
86 42 17%
Access to Out-of-Network
Provider
83 12 5%
Access to DME 77 12 5%

12
Table 5 Managed Care Plans Top 5 Substantiated Complaints
MCO Top 5 Substantiated
Complaints Count Substantiated
%
Substantiated*
Access to Prescriptions - Other
Insurance
86 42 17%
Home Health 98 38 15%
Access to Prescriptions - Member
Not Showing Active
47 23 9%
Access to In-Network Provider
(non-PCP)
103 17 7%
Denial of Services 65 12 5%
*represents percent of total substantiated complaints
There were 1,151 complaints received where the entity responsible for the
complaint was an MCO. Of those complaints, 248 (22%) were substantiated. The second quarter of fiscal year 2020 had an increase of 41% (332) in complaints
compared to the first quarter of fiscal year 2020 (819). The second quarter had a percentage increase of three percent in substantiated complaints compared to the first quarter.
Substantiated complaints of inability to access prescriptions related to other insurance are due to the MCO pharmacy management system showing private insurance that the
consumer was not active with at the time of service.
Substantiated complaints related to accessing home health services include: interruption
in accessing services; delay in receiving an increase in home health hours; reduction in home health service hours; and delay in starting services. Circumstances that caused these issues include: home health providers not being paid; consumers moving out of
the service area and not receiving assistance from the MCO in obtaining services in new area; incorrect information in the MCO or home health agency system; MCO performing
assessment without the authorized representative present; and problems with communicating with the MCO service coordinator.
Substantiated complaints of inability to access prescriptions related to consumer not
showing with active coverage are due to the MCO pharmacy benefit manager (PBM) system not showing the consumer with active coverage at the time of service. The
majority of these complaints are due to the consumers’ enrollment information being sent to the MCO; however, the MCO had not uploaded the enrollment files.
Substantiated complaints related to accessing in-network specialists include access to:
pain management, otolaryngologist, oncologist, obstetrician gynecologist (OBGYN),

13
pulmonologist, behavioral health specialists, endocrinologist, physical therapist, neurologist, and orthopedic specialist. Barriers with accessing specialists were related to
MCO not having specialist in-network in the consumer’s service area, MCO provider directory having outdated information, long wait time for appointments, and MCO not assisting dual-eligible member with finding a specialist that accepts both Medicaid and
Medicare.
Provider
Table 6 Provider Top 5 Complaints
Provider Top 5 Complaints Count Substantiated
%
Substantiated*
Balance Billing 104 3 2%
Access to Prescriptions –
Member Not Showing Active
100 41 27%
Access to Prescriptions - Other
Insurance
100 28 19%
Access to Prescriptions – Billed
Incorrect Health Plan
66 21 14%
Access to Prescriptions - Other 59 8 5%
Table 7 Provider Top 5 Substantiated Complaints
Provider Top 5 Substantiated
Complaints Count Substantiated
%
Substantiated*
Access to Prescriptions -
Member Not Showing Active
100 41 27%
Access to Prescriptions – Other
Insurance
100 28 19%
Access to Prescriptions – Billed
Incorrect Health Plan
66 21 14%
Access to Prescriptions – PDL
Prior Authorization
36 8 5%

14
Provider Top 5 Substantiated
Complaints Count Substantiated
%
Substantiated*
Access to Prescriptions - Other 59 8 5%
*represents percent of total substantiated complaints
There were 977 complaints received where the entity that the complaint was against was a provider. Of those complaints, 151 (15%) were substantiated.
The second quarter of fiscal year 2020 had a decrease of 14% (-161) in complaints compared to the first quarter of fiscal year 2020 (1,138). The second quarter had a
percentage increase of one percent in substantiated complaints compared to the first quarter.
Complaints of being billed by providers include: Medicaid providers billing consumers
that were effective with Medicaid at the time of service – many of these are due to provider billing the MCO when the consumer had traditional Medicaid or billing traditional
Medicaid when the consumer was on an MCO at time of service; Medicare consumers being billed for copays, deductibles or the remaining 20% that should have been billed to Medicaid; and consumers receiving bills for services received when the consumer was
not active with Medicaid.
Substantiated complaints of inability to access prescriptions due to provider not showing
the consumer as having active coverage are related to pharmacies whose systems do not show consumer has having active Medicaid coverage, but the consumer was eligible for Medicaid at the time of service.
Substantiated complaints of inability to access prescriptions related to other insurance are due to erroneous insurance showing in the pharmacies’ systems. Pharmacies are
required to bill private insurance before billing Medicaid; therefore, if there is incorrect/outdated private insurance showing in the system, the pharmacy is not able bill correctly for the medication. Medications are the only Medicaid service that are point
of sale and cannot be billed after the service is provided.
Substantiated complaints of inability to access prescriptions due to claims submitted to
incorrect health plan include: pharmacies submitting claims to a consumer’s previous MCO instead of to traditional Medicaid; and pharmacies that have the incorrect billing information in their systems.
Top 5 Complaints by Medicaid Managed Care Program
In the previous section of this report, complaints were analyzed by the entity responsible. In this section, complaints are analyzed by the Medicaid program that
consumers had at the time of the complaint.
The following tables show the top five reasons for complaints for each managed care
program. Complaints include those that are substantiated, unsubstantiated and unable to substantiate.

15
OMCAT receives many different types of complaints; therefore, the top five complaints may not always comprise a majority of total complaints for each service area.
STAR+PLUS (527,737*)
Complaints -- (960 total/159 substantiated)
Table 8 STAR+PLUS Top 5 Complaints
Top 5 Complaint Reasons Count Substantiated
% of
Substantiated**
Home Health 107 34 21%
Access to DME 59 8 5%
Balance Billing 48 5 3%
Denial of Services 46 5 3%
Access to Prescriptions – Other
Insurance 44 10 6%
*average monthly enrollment **represents percent of total substantiated complaints
OMCAT received 960 complaints from consumers in the STAR+PLUS program in the second quarter of fiscal year 2020, and of those 159 (17%) complaints
were substantiated. Complaints decreased by two percent (-19) and the percentage of substantiated complaints increased by three percent compared to the first quarter of fiscal year 2020. The top five complaints noted in the table above make up 32 percent of
the total complaints received by consumers on STAR+PLUS.
Substantiated complaints related to home health services include: delay in accessing
services due to issues with communicating with the service coordinator; interruption in services due to change in type of Medicaid, change in managed care program, or change in health plan; home health providers not being paid; authorized increase in service
hours not implemented timely; delay in the start of services; home health agency has not received authorization to continue providing services; providers not showing up for
all scheduled hours; home health hours reduced; delay in receiving assessment for services; MCOs not assisting with arranging for home health services when consumer moves out of the service delivery area and is still effective with the same health plan;
assessment performed without the authorized representative being present; MCO showing the consumer in the wrong type of managed care program preventing home
health services from starting; and home health agency not showing consumer as active with Medicaid. One MCO was responsible for 10 of the substantiated complaints related to accessing home health services.
16
Substantiated complaints related to access to DME include access to incontinent supplies, mobility aids (wheelchair, lift chair) and hospital beds. Issues with accessing
DME include: DME provider submitting incorrect codes for authorization and payment; not being assisted by service coordinator in finding a DME provider; delay in receiving supplies; denied DME; and consumer still showing to be in a nursing facility on Medicaid
case.
Substantiated complaints of inability to access prescriptions where other insurance is
listed on the consumer’s file are due to the pharmacy or MCO showing consumer as having private insurance.
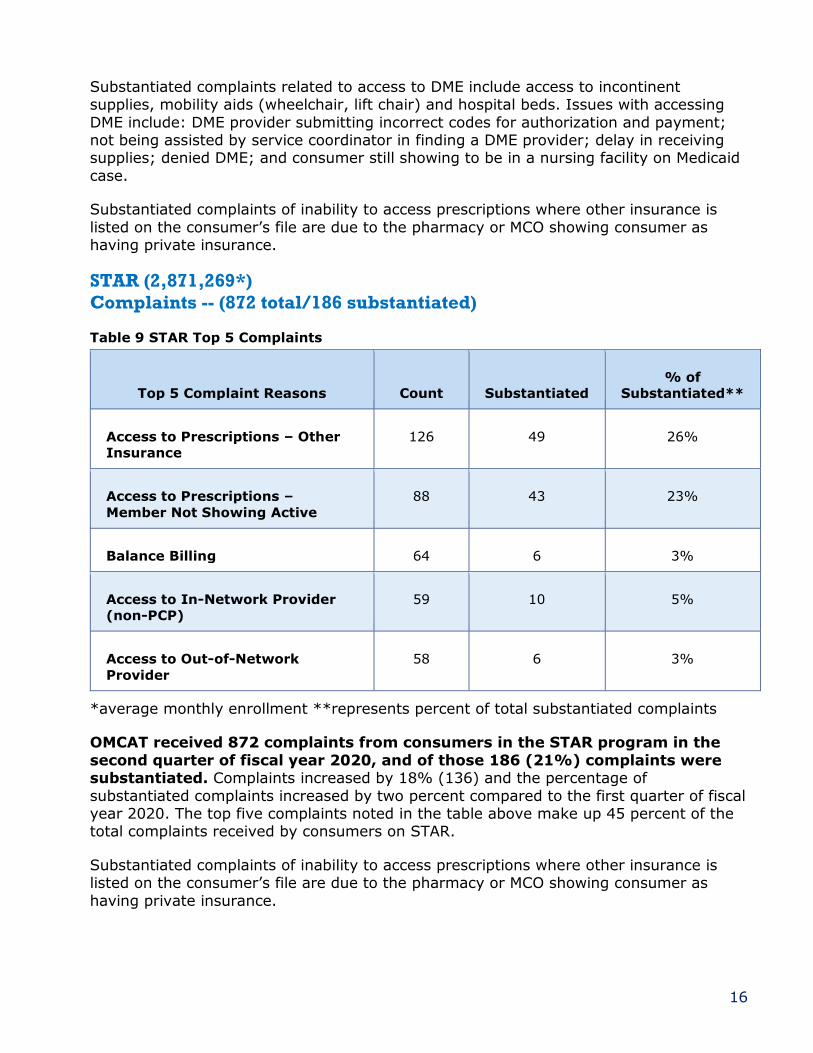
STAR (2,871,269*)
Complaints -- (872 total/186 substantiated)
Table 9 STAR Top 5 Complaints
Top 5 Complaint Reasons Count Substantiated
% of
Substantiated**
Access to Prescriptions – Other
Insurance
126 49 26%
Access to Prescriptions –
Member Not Showing Active
88 43 23%
Balance Billing 64 6 3%
Access to In-Network Provider
(non-PCP)
59 10 5%
Access to Out-of-Network
Provider
58 6 3%
*average monthly enrollment **represents percent of total substantiated complaints
OMCAT received 872 complaints from consumers in the STAR program in the
second quarter of fiscal year 2020, and of those 186 (21%) complaints were substantiated. Complaints increased by 18% (136) and the percentage of
substantiated complaints increased by two percent compared to the first quarter of fiscal year 2020. The top five complaints noted in the table above make up 45 percent of the total complaints received by consumers on STAR.
Substantiated complaints of inability to access prescriptions where other insurance is listed on the consumer’s file are due to the pharmacy or MCO showing consumer as
having private insurance.

17
Substantiated complaints of inability to access prescriptions related to consumer not showing as active are due to: consumer’s eligibility was recently certified and has not
yet crossed over to all HHS or MCO systems; or pharmacy has incorrect eligibility information for the consumer.
Substantiated complaints of accessing in-network specialists include: MCO provider
directly is outdated; pediatric specialists do not accept the consumer’s MCO; consumer not able to obtain an appointment timely with in-network specialists; and a specialist
unwilling to see consumer as the consumer’s eligibility information has not yet crossed over to the eligibility verification system for providers.
STAR Kids (157,647*)
Complaints -- (216 total/34 substantiated)
Table 10 STAR Kids Top 5 Complaints
Top 5 Complaint Reasons Count Substantiated
% of
Substantiated**
Home Health 21 2 6%
Medicaid
Eligibility/Recertification
19 1 3%
Access to In-Network
Provider (non-PCP)
16 1 3%
Access to Out-of-Network
Provider
13 4 12%
Case Information Error 11 2 6%
*average monthly enrollment **represents percent of total substantiated complaints
OMCAT received 216 complaints from consumers in the STAR Kids program in
the second quarter of fiscal year 2020, and of those 34 (16%) were substantiated. Complaints increased by 18 percent (33) and the percentage of substantiated complaints decreased by one percent compared to the first quarter of
fiscal year 2020. The top five complaints noted in the table above make up 37 percent of the total complaints received by consumers on STAR Kids.
Complaints of access to home health services include: denial of personal attendant services; home health provider not being paid; consumer’s service coordinator not assisting with transition from STAR Kids to STAR+PLUS; reduction in home health hours;
and home health agency not able to provide all nursing hours authorized.

18
Complaints of access to in-network specialists and facilities include access to: optometrist, behavioral health provider, OBGYN, MRI facility, orthopedist, and
rheumatologist. Some of the reasons for barriers to accessing specialists and specialty services include: problems with finding an OBGYN that will see consumer with complex medical conditions, not able to find a specialist within a reasonable distance; and
problems communicating with a service coordinator.
Complaints related to Medicaid eligibility and recertification include: MDCP waiver not
recertified; consumer removed from MDCP waiver interest list; family not receiving any information regarding if application for MDCP waiver was received; case denied; problems with getting Medicaid voluntarily terminated; and problems with recertifying
Medicaid.
Complaints related to accessing out of network providers are due to consumers that
have moved out of the service area and needed assistance in finding providers in their new area; and consumers that have not been able to find an in-network provider in their
area and therefore are trying to obtain authorization to see a provider outside of the network.
Complaints of incorrect information on consumers’ Medicaid cases were regarding
incorrect residential information on the case.
STAR+PLUS Dual Demo (39,875*)
Complaints -- (48 total/9 substantiated)
Table 11 STAR Plus Dual Demo Top 5 Complaints
Top 5 Complaint Reasons Count Substantiated
% of
Substantiated**
Access to DME 9 3 33%
Medicaid
Eligibility/Recertification
4 1 11%
Denial of Services 4 0 0%
Access to PCP 4 2 22%
Access to Dental Services
(adult)
3 1 11%
*average monthly enrollment **represents percent of total substantiated complaints
OMCAT received 48 complaints from consumers in the STAR+PLUS Dual Demo
program in the second quarter of fiscal year 2020, and of those 9 (19%) complaints were substantiated. Complaints increased by 30 percent (11) and the

19
percentage of substantiated complaints increased eleven percent as compared to the first quarter of fiscal year 2020. There was no trend identified in the entity related or
types of complaints that were substantiated. The top five complaints noted in the table above make up 50 percent of the total complaints received by consumers on STAR+PLUS Dual Demo.
Complaints of access to DME include: access to general mobility aids (wheelchair, walker, etc.), nutritional supplements, mattresses and hospital beds, and shower aids.
Issues causing barriers to accessing DME include: DME provider not being paid; interruptions in Medicaid coverage; and DME needing repairs.
STAR Health (31,668*)
Complaints -- (18 total/1 substantiated)
Table 12 STAR Health Top 5 Complaints
Top 5 Complaint Reasons Count Substantiated
% of
Substantiated**
Case Information Error 3 0 0%
Access to In-Network Provider
(non-PCP)
3 0 0%
Access to Prescriptions –
Other Insurance
1 0 0%
Access to PCP 1 0 0%
Staff Behavior 1 0 0%
*average monthly enrollment **represents percent of total substantiated complaints
OMCAT received 18 complaints from consumers in the STAR Health program in the second quarter of fiscal year 2020, and of that one complaint was
substantiated. Complaints increased by 125% (10) and the percentage of substantiated complaints decreased 25 percent as compared to the first quarter of fiscal year 2020. The top five complaints noted in the table above make up 50 percent of the
total complaints received by consumers on STAR Health.

20
Dental Managed Care (2,781,703*)
Complaints -- (61 total/10 substantiated)
Table 13 Dental Managed Care Top 5 Complaints
Top 5 Complaint Reasons Count Substantiated
% of
Substantiated**
Denial of Services 9 1 10%
Provider Treatment
Inappropriate/Ineffective
8 0 0%
Fair Hearing/Appeals 6 2 20%
Authorization Issue 6 1 10%
Case Information Error 6 3 30%
*average monthly enrollment **represents percent of total substantiated complaints
OMCAT received 61 complaints from consumers in the Dental Managed Care program in the second quarter of fiscal year 2020, and of those 10 (16%) complaints were substantiated. Complaints increased by 39 percent (17) and the
percentage of substantiated complaints increased by eleven percent compared to the first quarter of fiscal year 2020. The top five complaints noted in the table above make
up 57 percent of the total complaints received by consumers on Dental Managed Care.
Complaints related to denial of services include denials of: removal of braces, tooth extraction, bridge, porcelain caps, treatment for cavities, and dental appointment
(denied by dentist). Consumers denied a dental appointment by the dental office were due to: consumer who was trying to make an appointment was underage and dental
office would only speak with the authorized representative; dental office not able to verify consumer’s eligibility; or due to guardian’s previous behavior in the office.
Complaints of provider treatment being inappropriate or ineffective include: consumer
that sought second opinion after the first dental provider claimed consumer had cavities in all teeth and needed all wisdom teeth extracted; consumer whose cavity was not
treated; consumer who continued to be in pain after having several teeth extracted; dental managed care organization (DMO) that would not assist in making accommodations for consumer with special needs; dental provider not performing a
thorough exam; and consumer whose speech was negatively affected by work performed by the dental provider.
21
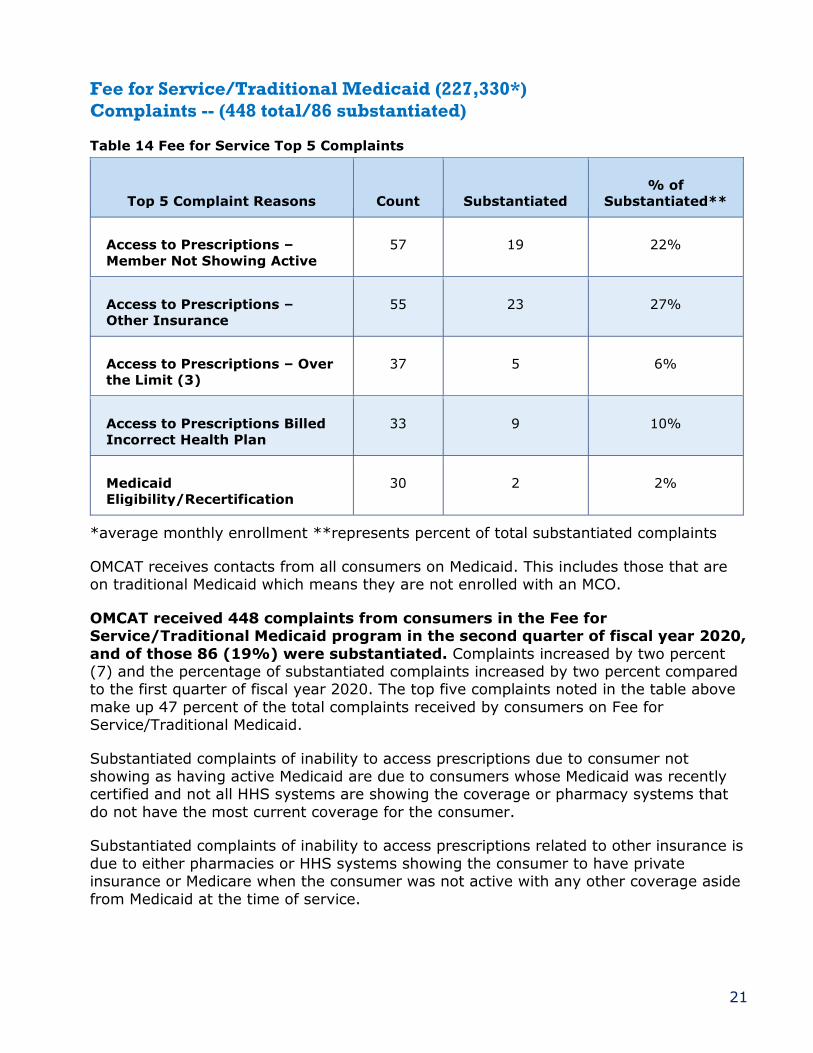
Fee for Service/Traditional Medicaid (227,330*)
Complaints -- (448 total/86 substantiated)
Table 14 Fee for Service Top 5 Complaints
Top 5 Complaint Reasons Count Substantiated
% of
Substantiated**
Access to Prescriptions –
Member Not Showing Active
57 19 22%
Access to Prescriptions –
Other Insurance
55 23 27%
Access to Prescriptions – Over
the Limit (3)
37 5 6%
Access to Prescriptions Billed
Incorrect Health Plan
33 9 10%
Medicaid
Eligibility/Recertification
30 2 2%
*average monthly enrollment **represents percent of total substantiated complaints
OMCAT receives contacts from all consumers on Medicaid. This includes those that are on traditional Medicaid which means they are not enrolled with an MCO.
OMCAT received 448 complaints from consumers in the Fee for Service/Traditional Medicaid program in the second quarter of fiscal year 2020,
and of those 86 (19%) were substantiated. Complaints increased by two percent (7) and the percentage of substantiated complaints increased by two percent compared to the first quarter of fiscal year 2020. The top five complaints noted in the table above
make up 47 percent of the total complaints received by consumers on Fee for Service/Traditional Medicaid.
Substantiated complaints of inability to access prescriptions due to consumer not showing as having active Medicaid are due to consumers whose Medicaid was recently certified and not all HHS systems are showing the coverage or pharmacy systems that
do not have the most current coverage for the consumer.
Substantiated complaints of inability to access prescriptions related to other insurance is
due to either pharmacies or HHS systems showing the consumer to have private insurance or Medicare when the consumer was not active with any other coverage aside
from Medicaid at the time of service.
22
Substantiated complaints of inability to access prescriptions due to claims submitted to incorrect health plans are related to pharmacies submitting claims to a consumer’s
previous MCO instead of to traditional Medicaid.
Substantiated complaints of inability to access prescriptions related to prescribing physician being a non-Medicaid provider are due to facilities that are enrolled as
Medicaid providers but not all prescribing physicians within the facility are enrolled with Medicaid. Pharmacies can only fill medications for Medicaid consumers if the prescribing
provider is enrolled with Medicaid.
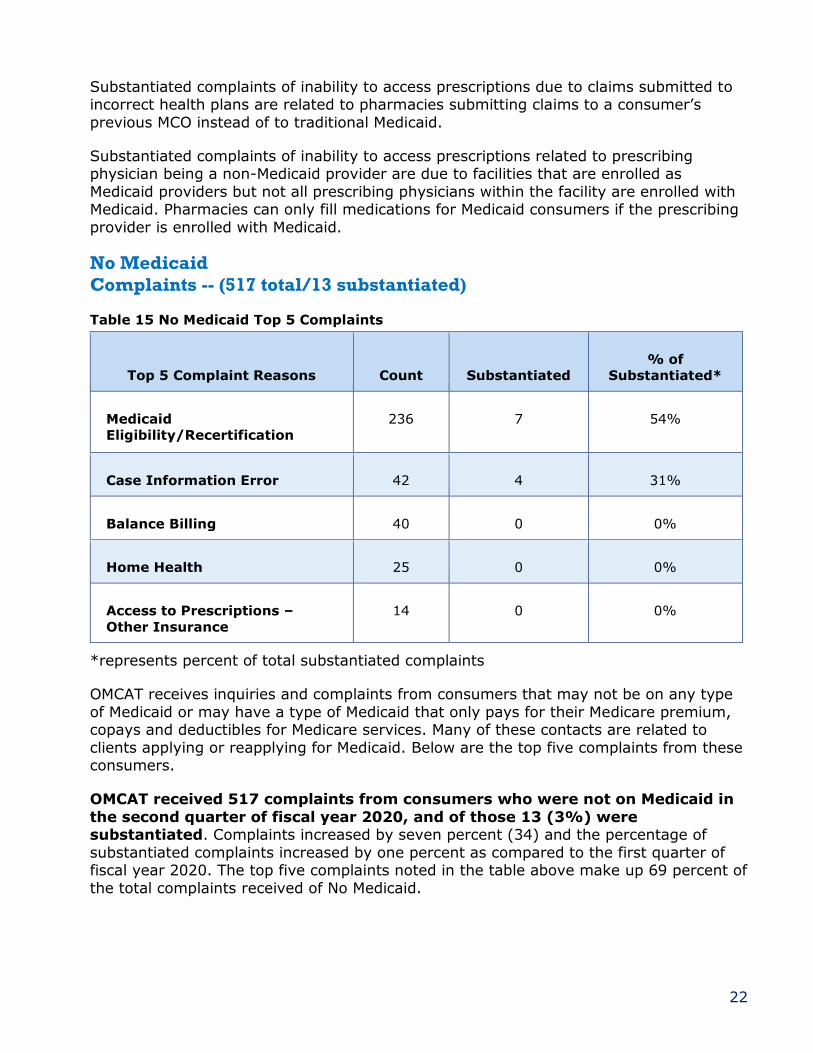
No Medicaid
Complaints -- (517 total/13 substantiated)
Table 15 No Medicaid Top 5 Complaints
Top 5 Complaint Reasons Count Substantiated
% of
Substantiated*
Medicaid
Eligibility/Recertification
236 7 54%
Case Information Error 42 4 31%
Balance Billing 40 0 0%
Home Health 25 0 0%
Access to Prescriptions –
Other Insurance
14 0 0%
*represents percent of total substantiated complaints
OMCAT receives inquiries and complaints from consumers that may not be on any type
of Medicaid or may have a type of Medicaid that only pays for their Medicare premium, copays and deductibles for Medicare services. Many of these contacts are related to
clients applying or reapplying for Medicaid. Below are the top five complaints from these consumers.
OMCAT received 517 complaints from consumers who were not on Medicaid in
the second quarter of fiscal year 2020, and of those 13 (3%) were substantiated. Complaints increased by seven percent (34) and the percentage of
substantiated complaints increased by one percent as compared to the first quarter of fiscal year 2020. The top five complaints noted in the table above make up 69 percent of
the total complaints received of No Medicaid.

23
Substantiated complaints related to Medicaid eligibility and recertification include: application not worked timely; newborn not added to Medicaid case; and erroneous
termination of Medicaid case.
Substantiated complaints of incorrect information on consumer cases include: incorrect address or start date on consumer’s Medicare Savings Program case; one child of a set
of twins was not put on Medicaid while the other was; a person not enrolled with Medicaid was sent a Medicaid ID card for a Medicaid consumer with the same name as a
child in the household.
Service Area Complaints and Inquiries
Map of Managed Care Service Areas and Related Complaints
The map includes all complaints and substantiated complaints by program type for each
service area. Here’s a map of the Texas Managed Care Service Areas.
Figure 4 Managed Care Service Areas and Related Complaints Map
24
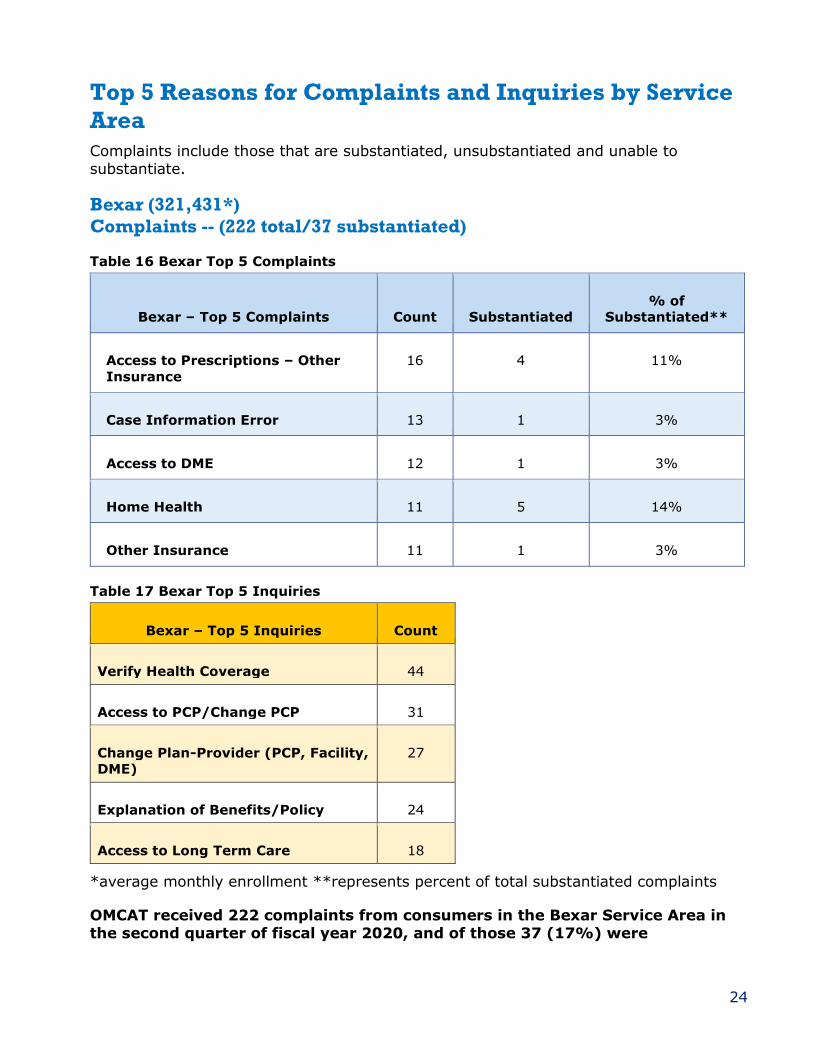
Top 5 Reasons for Complaints and Inquiries by Service
Area
Complaints include those that are substantiated, unsubstantiated and unable to
substantiate.
Bexar (321,431*)
Complaints -- (222 total/37 substantiated)
Table 16 Bexar Top 5 Complaints
Bexar – Top 5 Complaints Count Substantiated
% of
Substantiated**
Access to Prescriptions – Other
Insurance
16 4 11%
Case Information Error 13 1 3%
Access to DME 12 1 3%
Home Health 11 5 14%
Other Insurance 11 1 3%
Table 17 Bexar Top 5 Inquiries
Bexar – Top 5 Inquiries Count
Verify Health Coverage 44
Access to PCP/Change PCP 31
Change Plan-Provider (PCP, Facility,
DME)
27
Explanation of Benefits/Policy 24
Access to Long Term Care 18
*average monthly enrollment **represents percent of total substantiated complaints
OMCAT received 222 complaints from consumers in the Bexar Service Area in
the second quarter of fiscal year 2020, and of those 37 (17%) were

25
substantiated. Complaints decreased by one and the percentage of substantiated complaints increased by four percent compared to the first quarter of fiscal year 2020.
The top five complaints noted in the table above make up 28 percent of the total complaints received of Bexar Service Area.
Dallas (465,222*)
Complaints -- (282 total/42 substantiated)
Table 18 Dallas Top 5 Complaints
Dallas – Top 5 Complaints Count Substantiated
% of
Substantiated**
Balance Billing 22 1 2%
Access to In-Network Provider
(non-PCP)
21 4 10%
Medicaid Eligibility
/Recertification
19 0 0%
Home Health 17 2 5%
Case Information Error 16 0 0%
Table 19 Dallas Top 5 Inquiries
Dallas – Top 5 Inquiries Count
Verify Health Coverage 53
Access to PCP/Change PCP 34
Change Plan-Provider (PCP, Facility,
DME)
33
Reporting Change 21
Explanation of Benefits/Policy 20
*average monthly enrollment **represents percent of total substantiated complaints
OMCAT received 282 complaints from consumers in the Dallas Service Area in
the second quarter of fiscal year 2020, and of those 42 (15%) were substantiated. Complaints increased by two percent (5) and the percentage of

26
substantiated complaints decreased by one percent as compared to the first quarter of fiscal year 2020. The top five complaints noted in the table above make up 34 percent of
the total complaints received of Dallas Service Area.
El Paso (145,221*)
Complaints -- (45 total/6 substantiated)
Table 20 El Paso Top 5 Complaints
El Paso – Top 5 Complaints Count Substantiated
% of
Substantiated**
Access to Prescriptions – Other
Insurance
4 1 17%
Access to Prescriptions –
Formulary
4 1 17%
Case Information Error 4 0 0%
Denial of Services 4 0 0%
Authorization Issue 3 0 0%
Table 21 El Paso Top 5 Inquiries
El Paso – Top 5 Inquiries Count
Verify Health Coverage 9
Change Plan-Provider (PCP, Facility,
DME)
5
Adult Dental 4
Access to Long Term Care 3
Billing Inquiry 3
*average monthly enrollment **represents percent of total substantiated complaints
27
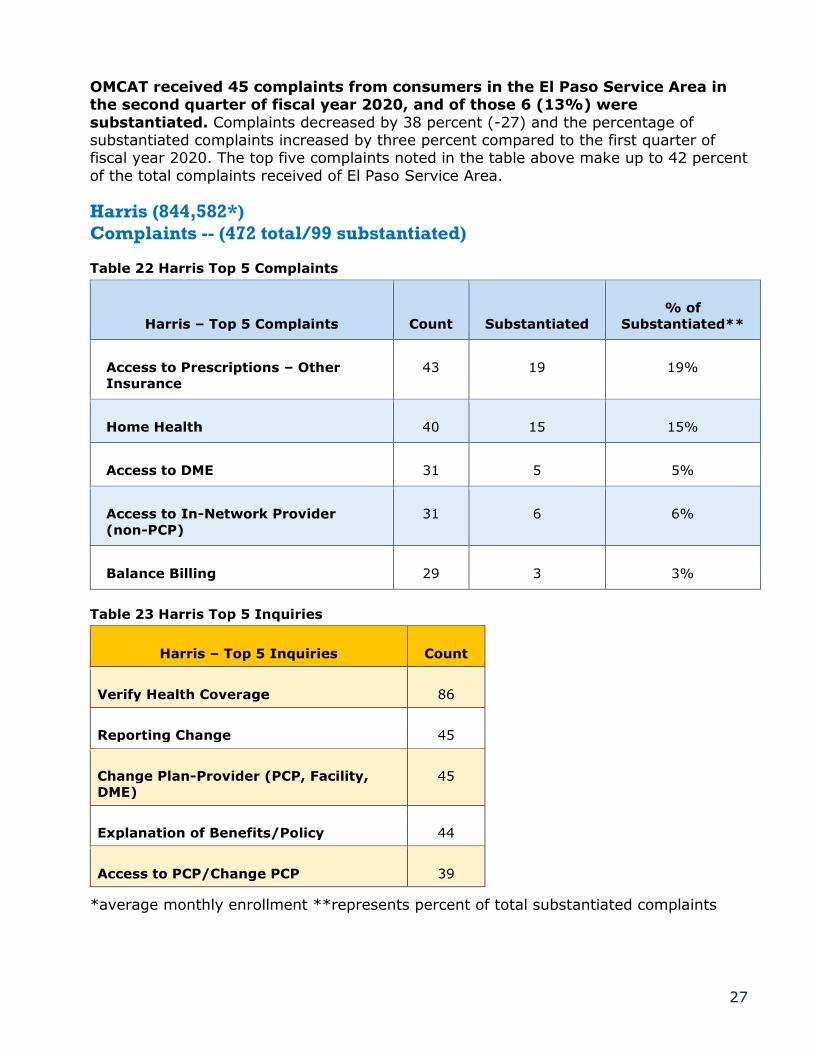
OMCAT received 45 complaints from consumers in the El Paso Service Area in the second quarter of fiscal year 2020, and of those 6 (13%) were
substantiated. Complaints decreased by 38 percent (-27) and the percentage of substantiated complaints increased by three percent compared to the first quarter of fiscal year 2020. The top five complaints noted in the table above make up to 42 percent
of the total complaints received of El Paso Service Area.
Harris (844,582*)
Complaints -- (472 total/99 substantiated)
Table 22 Harris Top 5 Complaints
Harris – Top 5 Complaints Count Substantiated
% of
Substantiated**
Access to Prescriptions – Other
Insurance
43 19 19%
Home Health 40 15 15%
Access to DME 31 5 5%
Access to In-Network Provider
(non-PCP)
31 6 6%
Balance Billing 29 3 3%
Table 23 Harris Top 5 Inquiries
Harris – Top 5 Inquiries Count
Verify Health Coverage 86
Reporting Change 45
Change Plan-Provider (PCP, Facility,
DME)
45
Explanation of Benefits/Policy 44
Access to PCP/Change PCP 39
*average monthly enrollment **represents percent of total substantiated complaints

28
OMCAT received 472 complaints from consumers in the Harris Service Area in the second quarter of fiscal year 2020, and of those 99 (21%) were
substantiated. Complaints increased by 17% (70) and the percentage of substantiated complaints increased by five percent compared to the first quarter of fiscal year 2020. The top five complaints noted in the table above make up 37 percent of the total
complaints received of Harris Service Area.
Hidalgo (426,800*)
Complaints -- (137 total/20 substantiated)
Table 24 Hidalgo Top 5 Complaints
Hidalgo – Top 5 Complaints Count Substantiated
% of
Substantiated**
Access to Prescriptions –
Member Not Showing Active
14 6 30%
Home Health 14 1 5%
Access to Prescriptions –
Other Insurance
10 4 20%
Access to DME 8 1 5%
Access to Out-of-Network
Provider
8 2 10%
Table 25 Hidalgo Top 5 Inquiries
Hidalgo – Top 5 Inquiries Count
Verify Health Coverage 51
Change Plan-Provider (PCP, Facility,
DME)
24
Access to PCP / Change PCP 20
Access to Long Term Care 14
Explanation of Benefits/Policy 11
*average monthly enrollment **represents percent of total substantiated complaints

29
OMCAT received 137 complaints from consumers in the Hidalgo Service Area in the second quarter of fiscal year 2020, and of those 20 (15%) were
substantiated. Complaints increased by 23 percent (26) and the percentage of substantiated complaints increased by three percent compared to the first quarter of fiscal year 2020. The top five complaints noted in the table above make up 39 percent of
the total complaints received of Hidalgo Service Area.
Jefferson (103,617*)
Complaints -- (69 total/14 substantiated)
Table 26 Jefferson Top 5 Complaints
Jefferson – Top 5 Complaints Count Substantiated
% of
Substantiated**
Access to Prescriptions – Other
Insurance
13 5 36%
Access to Prescriptions –
Formulary
5 0 0%
Access to Prescriptions – Clinical
Prior Authorization
5 1 7%
Balance Billing 5 0 0%
Access to Out-of-Network
Provider
4 0 0%
Table 27 Jefferson Top 5 Inquiries
Jefferson - Top 5 Inquiries Count
Verify Health Coverage 14
Change Plan-Provider (PCP, Facility,
DME)
7
Access to PCP/Change PCP 6
Adult Dental 6
Obtain Health Plan ID card 5
*average monthly enrollment **represents percent of total substantiated complaints

30
OMCAT received 69 complaints from consumers in the Jefferson Service Area in the second quarter of fiscal year 2020, and of those 14 (20%) were
substantiated. Complaints increased by 44 percent (21) and the percentage of substantiated complaints increased by three percent compared to the first quarter of fiscal year 2020. The top five complaints noted in the table above make up 46 percent of
the total complaints received of Jefferson Service Area.
Lubbock (90,910*)
Complaints -- (53 total/13 substantiated)
Table 28 Lubbock Top 5 Complaints
Lubbock – Top 5 Complaints Count Substantiated
% of
Substantiated**
Access to Prescriptions – Member
Not Showing Active
7 3 23%
Access to Prescriptions – Other 4 0 0%
Access to Prescriptions – Other
Insurance
4 1 8%
Balance Billing 3 0 0%
Case Information Error 3 3 23%
Table 29 Lubbock Top 5 Inquiries
Lubbock – Top 5 Inquiries Count
Explanation of Benefits/Policy 8
Reporting Change 8
Verify Health Coverage 7
Billing Inquiry 6
Access to Specialist 4
*average monthly enrollment **represents percent of total substantiated complaints
OMCAT received 53 complaints from consumers in the Lubbock Service Area in the second quarter of fiscal year 2020, and of those 13 (25%) were

31
substantiated. Complaints increased by 33% (13) and the percentage of substantiated complaints increased by two percent compared to the first quarter of fiscal year 2020.
The top five complaints noted in the table above make up 40 percent of the total complaints received of Lubbock Service Area.
MRSA Central (177,333*)
Complaints -- (111 total/20 substantiated)
Table 30 MRSA Central Top 5 Complaints
MRSA Central – Top 5 Complaints Count Substantiated
% of
Substantiated**
Access to Prescriptions – Other
Insurance
14 3 15%
Access to In-Network Provider (non-
PCP)
8 1 5%
Balance Billing 7 1 5%
Staff Behavior 7 0 0%
Access to Prescriptions – Member
Not Showing Active
7 4 20%
Table 31 MRSA Central Top 5 Inquiries
MRSA Central – Top 5 Inquiries Count
Change Plan-Provider (PCP, Facility,
DME)
22
Verify Health Coverage 17
Access to PCP/Change PCP 12
Adult Dental 9
Billing Inquiry 7
*average monthly enrollment **represents percent of total substantiated complaints
OMCAT received 111 complaints from consumers in the MRSA Central Service
Area in the second quarter of fiscal year 2020, and of those 20 (18%) were
32
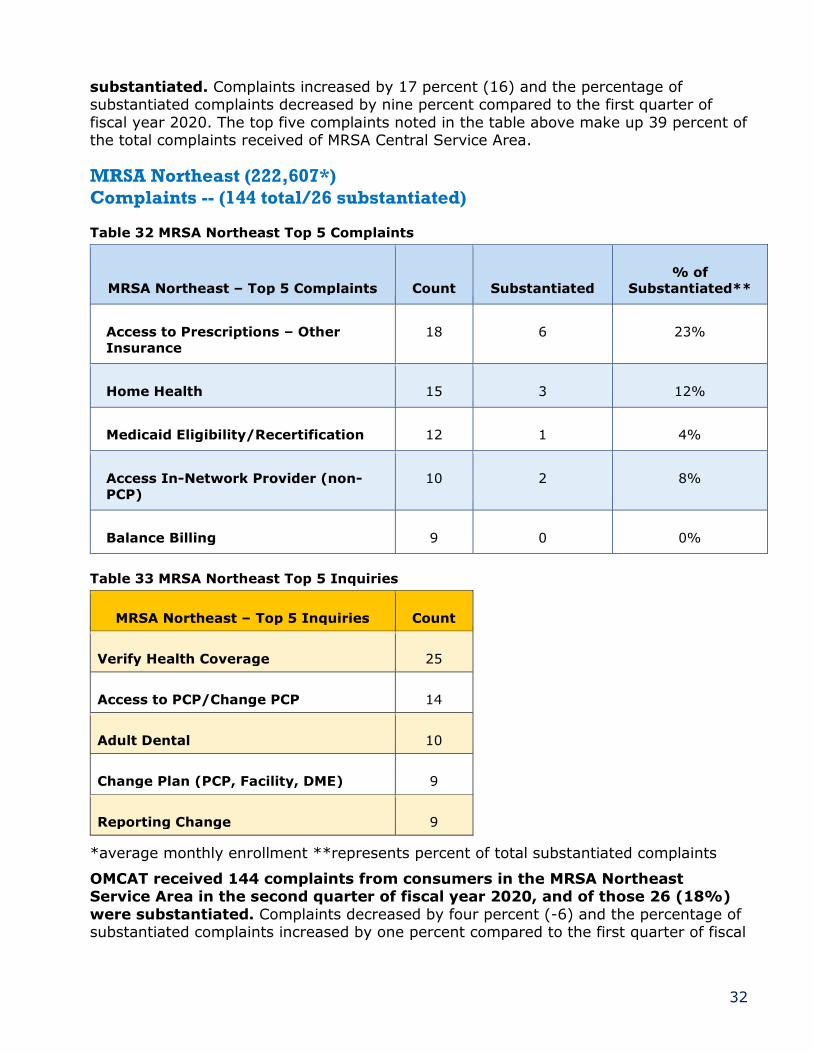
substantiated. Complaints increased by 17 percent (16) and the percentage of substantiated complaints decreased by nine percent compared to the first quarter of
fiscal year 2020. The top five complaints noted in the table above make up 39 percent of the total complaints received of MRSA Central Service Area.
MRSA Northeast (222,607*)
Complaints -- (144 total/26 substantiated)
Table 32 MRSA Northeast Top 5 Complaints
MRSA Northeast – Top 5 Complaints Count Substantiated
% of
Substantiated**
Access to Prescriptions – Other
Insurance
18 6 23%
Home Health 15 3 12%
Medicaid Eligibility/Recertification 12 1 4%
Access In-Network Provider (non-
PCP)
10 2 8%
Balance Billing 9 0 0%
Table 33 MRSA Northeast Top 5 Inquiries
MRSA Northeast – Top 5 Inquiries Count
Verify Health Coverage 25
Access to PCP/Change PCP 14
Adult Dental 10
Change Plan (PCP, Facility, DME) 9
Reporting Change 9
*average monthly enrollment **represents percent of total substantiated complaints
OMCAT received 144 complaints from consumers in the MRSA Northeast Service Area in the second quarter of fiscal year 2020, and of those 26 (18%)
were substantiated. Complaints decreased by four percent (-6) and the percentage of substantiated complaints increased by one percent compared to the first quarter of fiscal

33
year 2020. The top five complaints noted in the table above make up 44 percent of the total complaints received of MRSA Northeast Service Area.
MRSA West (191,356*)
Complaints -- (145 total/36 substantiated)
Table 34 MRSA West Top 5 Complaints
MRSA West – Top 5 Complaints Count Substantiated
% of
Substantiated**
Access to Prescriptions – Other
Insurance
22 11 31%
Home Health 12 4 11%
Access to Prescriptions – Member
Not Showing Active
8 3 8%
Access to DME 8 1 3%
Balance Billing 8 0 0%
Table 35 MRSA West Top 5 Inquiries
MRSA West – Top 5 Inquiries Count
Verify Health Coverage 25
Explanation of Benefits/Policy 9
Reporting Change 9
Change Plan-Provider (PCP, Facility,
DME)
8
Access to PCP/Change PCP 7
*average monthly enrollment **represents percent of total substantiated complaints
OMCAT received 145 complaints from consumers in the MRSA West Service
Area in the second quarter of fiscal year 2020, and of those 36 (25%) were substantiated. Complaints increased by 21% (25) and the percentage of substantiated
complaints increased by ten percent compared to the first quarter of fiscal year 2020.

34
The top five complaints noted in the table above make up 40 percent of the total complaints received of MRSA West Service Area.
Nueces (113,019*)
Complaints -- (64 total/10 substantiated)
Table 36 Nueces Top 5 Complaints
Nueces – Top 5 Complaints Count Substantiated
% of
Substantiated**
Case Information Error 6 0 0%
Medicaid Eligibility/Recertification 5 1 10%
Access to PCP 5 0 0%
Access to Prescriptions - Other
Insurance
5 2 20%
Access to Out-of-Network Provider 4 0 0%
Table 37 Nueces Top 5 Inquiries
Nueces – Top 5 Inquiries Count
Verify Health Coverage 16
Access to PCP/Change PCP 14
Change Plan-Provider (PCP, Facility,
DME)
7
Access to Specialist 5
Reporting Change 5
*average monthly enrollment **represents percent of total substantiated complaints
OMCAT received 64 complaints from consumers in the Nueces Service Area in
the second quarter of fiscal year 2020, and of those 10 (16%) were substantiated. Complaints decreased by six percent (-4) and the percentage of substantiated complaints increased by three percent compared to the first quarter of
fiscal year 2020. The top five complaints noted in the table above make up 39 percent of the total complaints received of Nueces.

35
Tarrant (318,562*)
Complaints -- (240 total/51 substantiated)
Table 38 Tarrant Top 5 Complaints
Tarrant – Top 5 Complaints Count Substantiated
% of
Substantiated**
Access to Prescriptions – Member
Not Showing Active
22 12 24%
Access to Prescriptions – Other
Insurance
18 6 12%
Access to In-Network Provider
(non-PCP)
16 3 6%
Medicaid Eligibility/Recertification 16 2 4%
Access to Out-of-Network Provider 16 2 4%
Table 39 Tarrant Top 5 Inquiries
Tarrant – Top 5 Inquiries Count
Verify Health Coverage 50
Access to PCP/Change PCP 29
Reporting Change 24
Change Plan-Provider (PCP, Facility,
DME)
22
Explanation of Benefits/Policy 18
*average monthly enrollment **represents percent of total substantiated complaints
OMCAT received 240 complaints from consumers in the Tarrant Service Area in the second quarter of fiscal year 2020, and of those 51 (21%) were
substantiated. Complaints increased by six percent (13) and the percentage of substantiated complaints increased by two percent compared to the first quarter of fiscal year 2020. The top five complaints noted in the table above make up 37 percent of the
total complaints received of Tarrant Area.
36
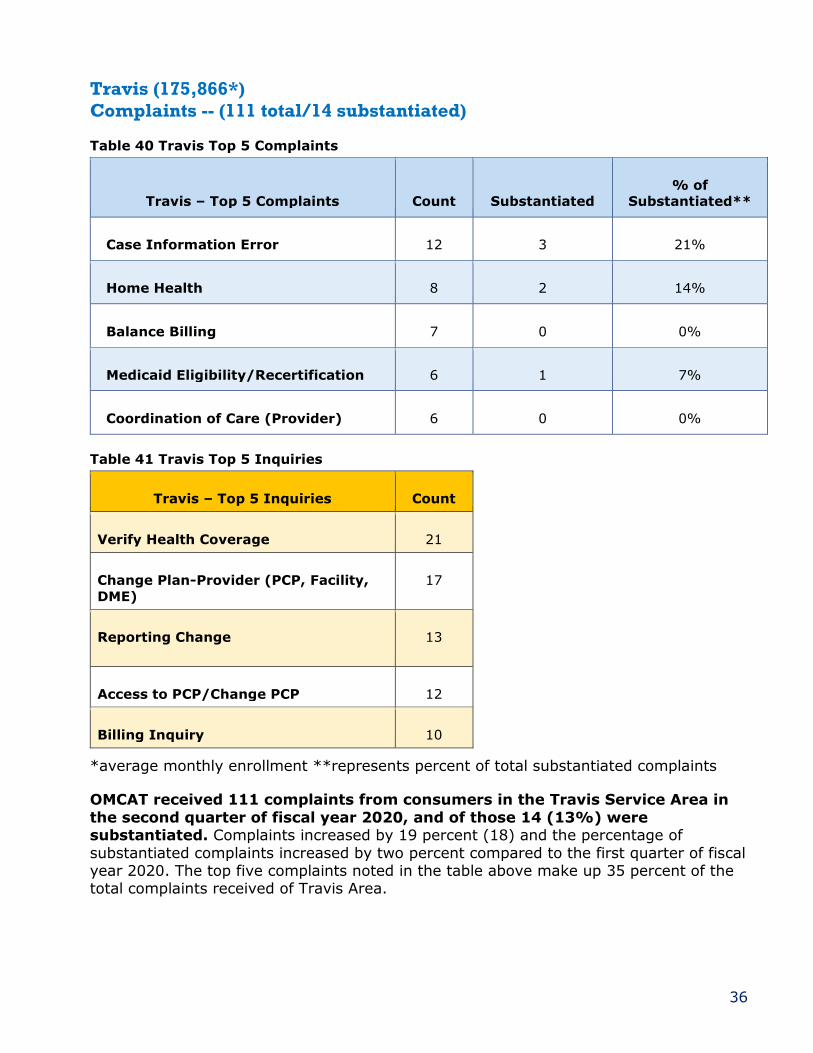
Travis (175,866*)
Complaints -- (111 total/14 substantiated)
Table 40 Travis Top 5 Complaints
Travis – Top 5 Complaints Count Substantiated
% of
Substantiated**
Case Information Error 12 3 21%
Home Health 8 2 14%
Balance Billing 7 0 0%
Medicaid Eligibility/Recertification 6 1 7%
Coordination of Care (Provider) 6 0 0%
Table 41 Travis Top 5 Inquiries
Travis – Top 5 Inquiries Count
Verify Health Coverage 21
Change Plan-Provider (PCP, Facility,
DME)
17
Reporting Change 13
Access to PCP/Change PCP 12
Billing Inquiry 10
*average monthly enrollment **represents percent of total substantiated complaints
OMCAT received 111 complaints from consumers in the Travis Service Area in
the second quarter of fiscal year 2020, and of those 14 (13%) were substantiated. Complaints increased by 19 percent (18) and the percentage of
substantiated complaints increased by two percent compared to the first quarter of fiscal year 2020. The top five complaints noted in the table above make up 35 percent of the total complaints received of Travis Area.

37
5.Barriers and Recommendations to Address Them
Erroneous Insurance on Medicaid Cases
Inability to access Medicaid services due to erroneous insurance information on Medicaid was the number one complaint for the quarter and continues to be in the top five
complaints. Often consumers do not realize that there is other insurance listed on their Medicaid cases until they try to access services. OMCAT has the following recommendations to mitigate incorrect insurance information from preventing
consumers from accessing needed medical care.
Whenever private insurance is identified as being active for a consumer, the consumer
should be notified and allowed the opportunity to confirm or have this information corrected. Notifications should be provided on the Self-Service Portal as well as by mail. These notifications should also be provided again upon recertification.
Consumers Not Showing Active in MCO Systems
Consumers whose Medicaid is recertified in the middle of the month are backdated to the beginning of the month. Their enrollment into an MCO is also backdated to the
beginning of the month and is sent on a daily file to the MCO. However, MCOs are not required to upload those files upon receipt. This causes a barrier to consumers newly
recertified in accessing medical services through the MCO that same month.
STAR, STAR+PLUS, and STAR Kids MCOs should be contractually required to upload member enrollment daily files to their systems within 24 hours of receipt.
38
6.Ombudsman Collaboration and Initiatives
OMCAT collaborates with HHS programs and MCOs in identifying and resolving barriers to accessing Medicaid services.
OMCAT coordinates a network of HHS program areas that have a direct or indirect
impact on the delivery of Medicaid services to HHS consumers. The network meets quarterly to share information regarding barriers to care that Medicaid consumers
experience, discusses how to mitigate or resolve barriers to care, and provides training to ensure all HHS areas participating in the network are aware of the work and functions of their counterparts.
OMCAT is involved in a project to route Medicaid consumer complaints received through MCCO and other HHS offices to OMCAT for handling. The project includes updating
Medicaid MCO consumer handbooks to direct consumers to OMCAT to register complaints with the agency. The goal of this project is an effort to streamline the
Medicaid complaints process for consumers and to enhance and standardize the reporting process.
During the second quarter of FY 2020, the agency directed the enrollment broker,
MAXIMUS, to start routing escalated consumer complaints to OMCAT for resolution.
OMCAT is working with MCCO to align complaint reason codes to be used by OMCAT,
MCCO and the MCOs. This alignment will allow HHS to better track and trend issues that Medicaid consumers experience.
39
7.Conclusion
OMCAT is the HHS’s public facing contact for consumers who need to make complaints and inquiries regarding Medicaid services. As such, the HHS Office of the Ombudsman’s goal in this report is to spotlight issues that Medicaid consumers face and provide
recommendations to remove barriers where possible, thereby improving the experience of Texas Medicaid consumers.

40
8.Glossary
Contact – An attempt by HHS consumers to inquire or complain about HHS programs or services.
Complaint – A contact regarding any expression of dissatisfaction.
Enrollment Broker – an independent contracted organization that helps Medicaid consumers with choosing their managed care health plan.
Fiscal Year 2018 - The 12-month period from September 1, 2017 through August 31, 2018, covered by this report.
Fiscal Year 2020 - The 12-month period from September 1, 2018 through August 31,
2019, covered by this report.
HHS Enterprise Administrative Report and Tracking System (HEART) – A web-
based system that tracks all inquiries and complaints OMCAT receives.
Inquiry – A contact regarding a request for information about HHS programs or
services.
Lock-In Program – The program restricts consumers whose use of medical services is documented as being excessive. Consumers are "Locked-In" to a specific pharmacy to
prevent consumers from obtaining excessive quantities of prescribed drugs through multiple visits to physicians and pharmacies.
Managed Care Organization - A health plan that is a network of contracted health care providers, specialists, and hospitals.
Managed Care Compliance Operations - the area within HHSC that provides
oversight of the managed care contracts.
Medicare Savings Program – the use of Medicaid funds to help eligible consumers pay
for all or some of their out-of-pocket Medicare expenses, such as premiums, deductibles or co-insurance.
Provider - An individual such as a physician or nurse, or group of physicians and nurses
such as a clinic or hospital, that delivers health care directly to patients.
Resolution – The point at which a determination is made as to whether a complaint is
substantiated, and no further action is necessary by the OMCAT.
Substantiated – A complaint determination where research clearly indicates agency policy was violated or agency expectations were not met.
Unable to Substantiate – A complaint determination where research does not clearly indicate if agency policy was violated or agency expectations were met.

41
Unsubstantiated – A complaint determination where research clearly indicates agency policy was not violated or agency expectations were met.
42
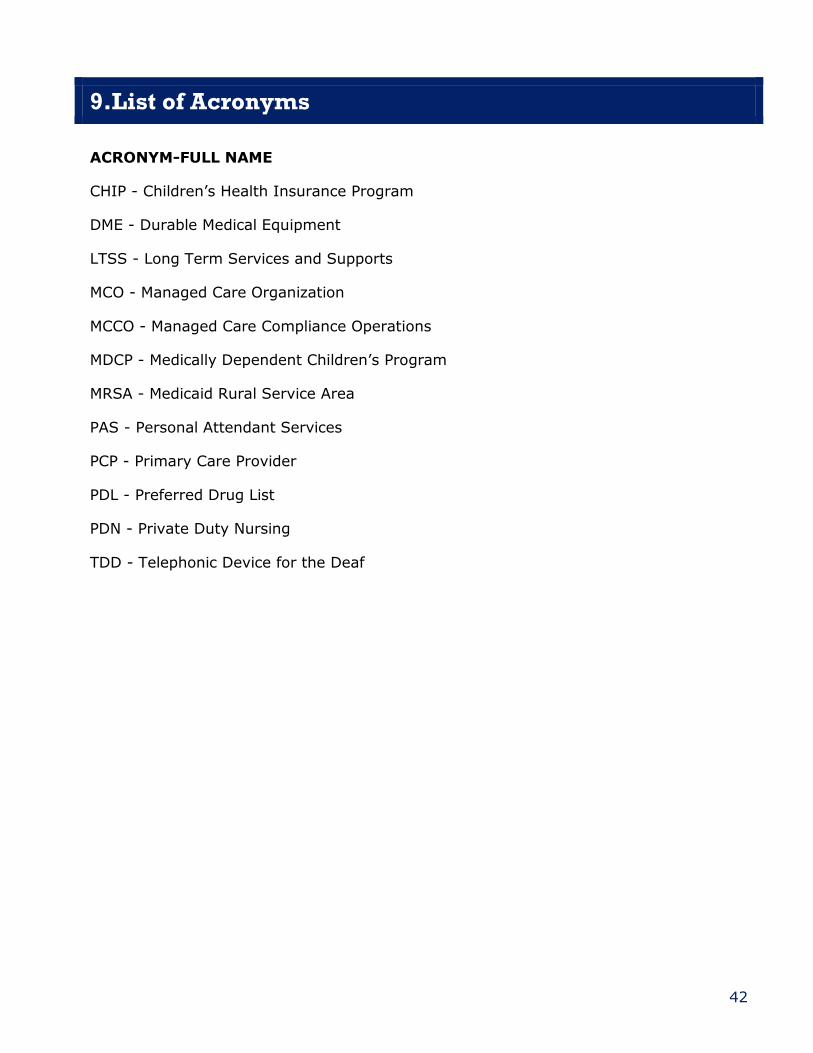
9.List of Acronyms
ACRONYM-FULL NAME
CHIP - Children’s Health Insurance Program
DME - Durable Medical Equipment
LTSS - Long Term Services and Supports
MCO - Managed Care Organization
MCCO - Managed Care Compliance Operations
MDCP - Medically Dependent Children’s Program
MRSA - Medicaid Rural Service Area
PAS - Personal Attendant Services
PCP - Primary Care Provider
PDL - Preferred Drug List
PDN - Private Duty Nursing
TDD - Telephonic Device for the Deaf