Embed Size (px)
Citation preview

SARVA SHIKSHA ABHIYAN
TAMIL NADU
HHHAAANNNDDDBBBOOOOOOKKK
222000111000
Tamil Nadu State Mission of Education for All
State Project Directorate
Tamil Nadu


Tamil Nadu State Mission of Education for All
Sarva Shiksha Abhiyan
Thiru. Dr. Kalaignar M. Karunanidhi Hon’ble Chief Minister of Tamil Nadu
Chairman, Governing Council.
Thiru. Thangam Thennarasu
Hon’ble Minister for School Education,
Government of Tamil Nadu.
Thiru. M. Kutralingam, I.A.S.,
Principal Secretary to Government
School Education Department.
Thiru.R.Venkatesan, I.A.S.,
State Project Director
Sarva Shiksha Abhiyan
Chennai – 600 006.
Thiru.M.P.Vijayakumar, I.A.S., State Project Director (Retd.)
Honorary Advisor
Sarva Shiksha Abhiyan
Chennai – 600 006.

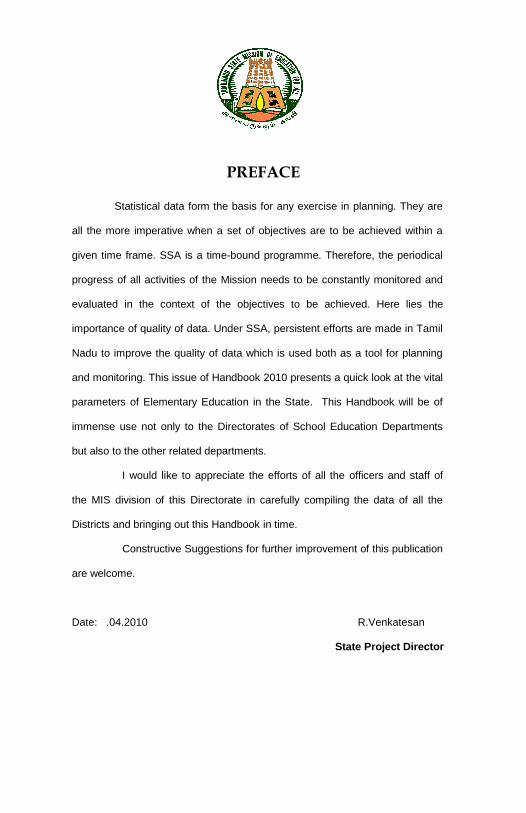
PREFACE
Statistical data form the basis for any exercise in planning. They are
all the more imperative when a set of objectives are to be achieved within a
given time frame. SSA is a time-bound programme. Therefore, the periodical
progress of all activities of the Mission needs to be constantly monitored and
evaluated in the context of the objectives to be achieved. Here lies the
importance of quality of data. Under SSA, persistent efforts are made in Tamil
Nadu to improve the quality of data which is used both as a tool for planning
and monitoring. This issue of Handbook 2010 presents a quick look at the vital
parameters of Elementary Education in the State. This Handbook will be of
immense use not only to the Directorates of School Education Departments
but also to the other related departments.
I would like to appreciate the efforts of all the officers and staff of
the MIS division of this Directorate in carefully compiling the data of all the
Districts and bringing out this Handbook in time.
Constructive Suggestions for further improvement of this publication
are welcome.
Date: .04.2010 R.Venkatesan
State Project Director

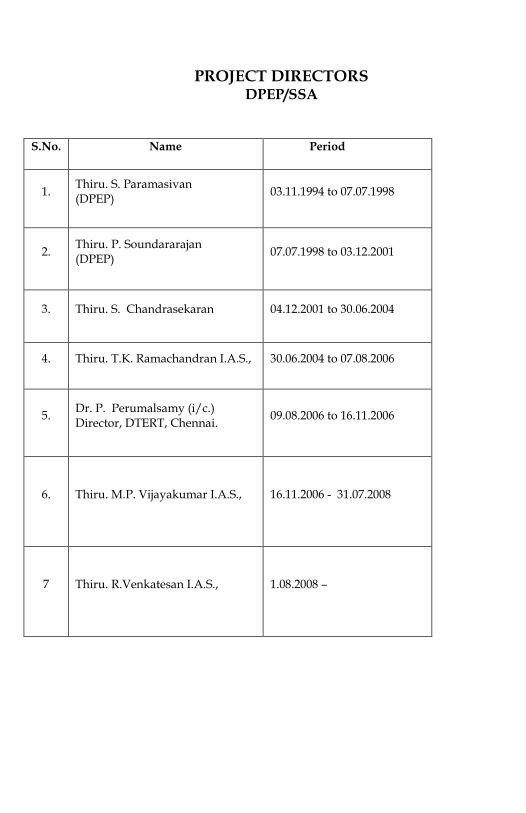
PROJECT DIRECTORS
DPEP/SSA
S.No. Name Period
1. Thiru. S. Paramasivan (DPEP)
03.11.1994 to 07.07.1998
2. Thiru. P. Soundararajan (DPEP)
07.07.1998 to 03.12.2001
3. Thiru. S. Chandrasekaran 04.12.2001 to 30.06.2004
4. Thiru. T.K. Ramachandran I.A.S., 30.06.2004 to 07.08.2006
5. Dr. P. Perumalsamy (i/c.) Director, DTERT, Chennai.
09.08.2006 to 16.11.2006
6.
Thiru. M.P. Vijayakumar I.A.S.,
16.11.2006 - 31.07.2008
7 Thiru. R.Venkatesan I.A.S.,
1.08.2008 –


CONTENTS S. No. Title Page No.
1 The Right of Free and Compulsory Act 2009 1
2 Important events in the SSA Project Period 2-4
3 Norms for Interventions under SSA 5-15
4 SSA Four Tier Committee 16-18
5 State Project Directorate - Officers/Staff posts 19
6 District Project Office – Officers/Staff Posts 20
7 District wise No. of BRCs, CRC and VEC/WEC 21
8 No. of BRC/UCRC and Resource Persons 22
9 Disrtict wise Educational Districts , Blocks, Revenue Villages ,
Village Panchayats and Habitations
23
10 Demographic Profile 24-26
DATA TABLES Table No. Title Page No.
1 Districtwise Area and Population – Census 2001 27-28
2 District wise Literacy Rate – Census 2001 29
3 District wise Population – Household Survey 2005 30-31
4 House Hold Survey –School Age Population-2005 32-35
5 School Age Population-2006-07 36-39
6 School Age Population-2007-08 40-43
7 School Age Population-2008-09 44-47
8 School Age Population-2009-10 48-51
9 District wise school access to schoolage population – 2009-10 52
10 Habitations and Access (Primary)- 2009 53
11 Habitations and Access (Upper Primary)- 2009 54-55
12 Total No. of Schools 2001-02 to 2009-10 56-60
13 Districtwise Schools by category 2004-05 61-63
14 District wise schools by category 2005-06 64-65
15 District wise schools by category 2006-07 66-68
16 District wise schools by category 2007-08 69-70
17 District wise schools by category 2008-09 71-72
18 District wise schools by category 2009-10 73-75
19 District wise schools by Age 2009-10 76-81
20 District wise No. of primary schools opened and No. of Teachers
appointed under SSA 2001-02 to 2009-10 82-83
21 District wise No. of Upper primary schools opened and No. of Teachers
appointed under SSA 2001-02 to 2009-10 84-85
22 District wise Enrolment in Primary 2003-04 86
23 District wise Enrolment in Primary 2004-05 87
24 District wise Enrolment in Primary 2005-06 88
25 District wise Enrolment in Primary 2006-07 89
Table
No. Title Page No.
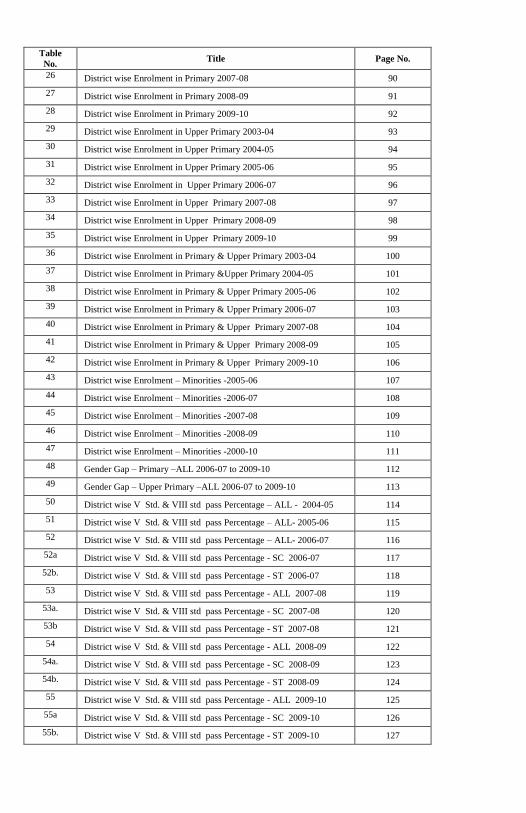
26 District wise Enrolment in Primary 2007-08 90
27 District wise Enrolment in Primary 2008-09 91
28 District wise Enrolment in Primary 2009-10 92
29 District wise Enrolment in Upper Primary 2003-04 93
30 District wise Enrolment in Upper Primary 2004-05 94
31 District wise Enrolment in Upper Primary 2005-06 95
32 District wise Enrolment in Upper Primary 2006-07 96
33 District wise Enrolment in Upper Primary 2007-08 97
34 District wise Enrolment in Upper Primary 2008-09 98
35 District wise Enrolment in Upper Primary 2009-10 99
36 District wise Enrolment in Primary & Upper Primary 2003-04 100
37 District wise Enrolment in Primary &Upper Primary 2004-05 101
38 District wise Enrolment in Primary & Upper Primary 2005-06 102
39 District wise Enrolment in Primary & Upper Primary 2006-07 103
40 District wise Enrolment in Primary & Upper Primary 2007-08 104
41 District wise Enrolment in Primary & Upper Primary 2008-09 105
42 District wise Enrolment in Primary & Upper Primary 2009-10 106
43 District wise Enrolment – Minorities -2005-06 107
44 District wise Enrolment – Minorities -2006-07 108
45 District wise Enrolment – Minorities -2007-08 109
46 District wise Enrolment – Minorities -2008-09 110
47 District wise Enrolment – Minorities -2000-10 111
48 Gender Gap – Primary –ALL 2006-07 to 2009-10 112
49 Gender Gap – Upper Primary –ALL 2006-07 to 2009-10 113
50 District wise V Std. & VIII std pass Percentage – ALL - 2004-05 114
51 District wise V Std. & VIII std pass Percentage – ALL- 2005-06 115
52 District wise V Std. & VIII std pass Percentage – ALL- 2006-07 116
52a District wise V Std. & VIII std pass Percentage - SC 2006-07 117
52b. District wise V Std. & VIII std pass Percentage - ST 2006-07 118
53 District wise V Std. & VIII std pass Percentage - ALL 2007-08 119
53a. District wise V Std. & VIII std pass Percentage - SC 2007-08 120
53b District wise V Std. & VIII std pass Percentage - ST 2007-08 121
54 District wise V Std. & VIII std pass Percentage - ALL 2008-09 122
54a. District wise V Std. & VIII std pass Percentage - SC 2008-09 123
54b. District wise V Std. & VIII std pass Percentage - ST 2008-09 124
55 District wise V Std. & VIII std pass Percentage - ALL 2009-10 125
55a District wise V Std. & VIII std pass Percentage - SC 2009-10 126
55b. District wise V Std. & VIII std pass Percentage - ST 2009-10 127
Table
No. Title Page No.
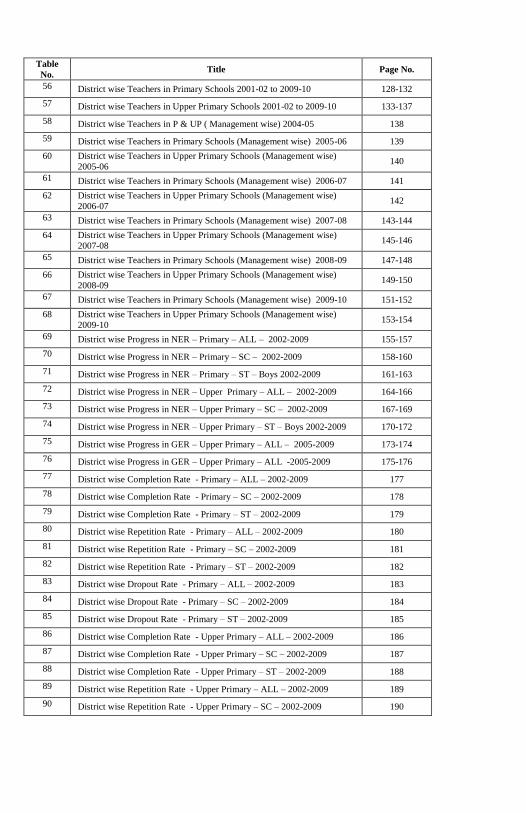
56 District wise Teachers in Primary Schools 2001-02 to 2009-10 128-132
57 District wise Teachers in Upper Primary Schools 2001-02 to 2009-10 133-137
58 District wise Teachers in P & UP ( Management wise) 2004-05 138
59 District wise Teachers in Primary Schools (Management wise) 2005-06 139
60 District wise Teachers in Upper Primary Schools (Management wise)
2005-06 140
61 District wise Teachers in Primary Schools (Management wise) 2006-07 141
62 District wise Teachers in Upper Primary Schools (Management wise)
2006-07 142
63 District wise Teachers in Primary Schools (Management wise) 2007-08 143-144
64 District wise Teachers in Upper Primary Schools (Management wise)
2007-08 145-146
65 District wise Teachers in Primary Schools (Management wise) 2008-09 147-148
66 District wise Teachers in Upper Primary Schools (Management wise)
2008-09 149-150
67 District wise Teachers in Primary Schools (Management wise) 2009-10 151-152
68 District wise Teachers in Upper Primary Schools (Management wise)
2009-10 153-154
69 District wise Progress in NER – Primary – ALL – 2002-2009 155-157
70 District wise Progress in NER – Primary – SC – 2002-2009 158-160
71 District wise Progress in NER – Primary – ST – Boys 2002-2009 161-163
72 District wise Progress in NER – Upper Primary – ALL – 2002-2009 164-166
73 District wise Progress in NER – Upper Primary – SC – 2002-2009 167-169
74 District wise Progress in NER – Upper Primary – ST – Boys 2002-2009 170-172
75 District wise Progress in GER – Upper Primary – ALL – 2005-2009 173-174
76 District wise Progress in GER – Upper Primary – ALL -2005-2009 175-176
77 District wise Completion Rate - Primary – ALL – 2002-2009 177
78 District wise Completion Rate - Primary – SC – 2002-2009 178
79 District wise Completion Rate - Primary – ST – 2002-2009 179
80 District wise Repetition Rate - Primary – ALL – 2002-2009 180
81 District wise Repetition Rate - Primary – SC – 2002-2009 181
82 District wise Repetition Rate - Primary – ST – 2002-2009 182
83 District wise Dropout Rate - Primary – ALL – 2002-2009 183
84 District wise Dropout Rate - Primary – SC – 2002-2009 184
85 District wise Dropout Rate - Primary – ST – 2002-2009 185
86 District wise Completion Rate - Upper Primary – ALL – 2002-2009 186
87 District wise Completion Rate - Upper Primary – SC – 2002-2009 187
88 District wise Completion Rate - Upper Primary – ST – 2002-2009 188
89 District wise Repetition Rate - Upper Primary – ALL – 2002-2009 189
90 District wise Repetition Rate - Upper Primary – SC – 2002-2009 190
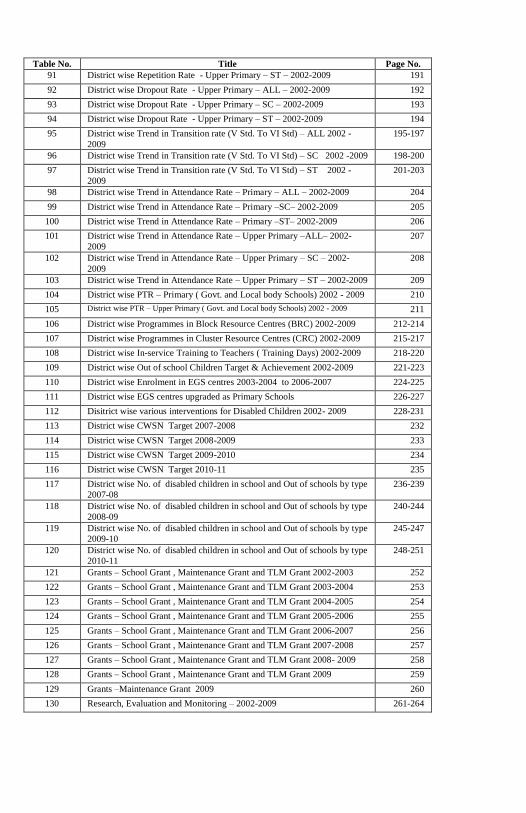
Table No. Title Page No.
91 District wise Repetition Rate - Upper Primary – ST – 2002-2009 191
92 District wise Dropout Rate - Upper Primary – ALL – 2002-2009 192
93 District wise Dropout Rate - Upper Primary – SC – 2002-2009 193
94 District wise Dropout Rate - Upper Primary – ST – 2002-2009 194
95 District wise Trend in Transition rate (V Std. To VI Std) – ALL 2002 -
2009
195-197
96 District wise Trend in Transition rate (V Std. To VI Std) – SC 2002 -2009 198-200
97 District wise Trend in Transition rate (V Std. To VI Std) – ST 2002 -
2009
201-203
98 District wise Trend in Attendance Rate – Primary – ALL – 2002-2009 204
99 District wise Trend in Attendance Rate – Primary –SC– 2002-2009 205
100 District wise Trend in Attendance Rate – Primary –ST– 2002-2009 206
101 District wise Trend in Attendance Rate – Upper Primary –ALL– 2002-
2009
207
102 District wise Trend in Attendance Rate – Upper Primary – SC – 2002-
2009
208
103 District wise Trend in Attendance Rate – Upper Primary – ST – 2002-2009 209
104 District wise PTR – Primary ( Govt. and Local body Schools) 2002 - 2009 210
105 District wise PTR – Upper Primary ( Govt. and Local body Schools) 2002 - 2009 211
106 District wise Programmes in Block Resource Centres (BRC) 2002-2009 212-214
107 District wise Programmes in Cluster Resource Centres (CRC) 2002-2009 215-217
108 District wise In-service Training to Teachers ( Training Days) 2002-2009 218-220
109 District wise Out of school Children Target & Achievement 2002-2009 221-223
110 District wise Enrolment in EGS centres 2003-2004 to 2006-2007 224-225
111 District wise EGS centres upgraded as Primary Schools 226-227
112 Disitrict wise various interventions for Disabled Children 2002- 2009 228-231
113 District wise CWSN Target 2007-2008 232
114 District wise CWSN Target 2008-2009 233
115 District wise CWSN Target 2009-2010 234
116 District wise CWSN Target 2010-11 235
117 District wise No. of disabled children in school and Out of schools by type
2007-08
236-239
118 District wise No. of disabled children in school and Out of schools by type
2008-09
240-244
119 District wise No. of disabled children in school and Out of schools by type
2009-10
245-247
120 District wise No. of disabled children in school and Out of schools by type
2010-11
248-251
121 Grants – School Grant , Maintenance Grant and TLM Grant 2002-2003 252
122 Grants – School Grant , Maintenance Grant and TLM Grant 2003-2004 253
123 Grants – School Grant , Maintenance Grant and TLM Grant 2004-2005 254
124 Grants – School Grant , Maintenance Grant and TLM Grant 2005-2006 255
125 Grants – School Grant , Maintenance Grant and TLM Grant 2006-2007 256
126 Grants – School Grant , Maintenance Grant and TLM Grant 2007-2008 257
127 Grants – School Grant , Maintenance Grant and TLM Grant 2008- 2009 258
128 Grants – School Grant , Maintenance Grant and TLM Grant 2009 259
129 Grants –Maintenance Grant 2009 260
130 Research, Evaluation and Monitoring – 2002-2009 261-264

Table No. Title Page No.
131 ECCE Centres and Enrolment 2002-2009 265-268
132 Girls Education – Beneficiaries 2002-2009 269-271
133 Education of SC/ST Children – Beneficiaries 2002-2009 272-274
134 Computer Aided Learning 2002-2009 275-278
135 Target for Remedial Teaching 2007-08 279
136 Target for Remedial Teaching 2008-09 to 2009-10 280
137 Community Mobilization 2002-2009 281-284
138 Innovative Intervention for Minority Children Education 2008-09 285
139 Innovative Intervention for Minority Children Education 2009-10 286
140 District wise Progress in Civil Works 2001-2009 287-292
141 Details of Educationally Backward Blocks (EBB) 293
142 Details of Model Cluster Schools 2003-2004 to 2006-2007 294
143 NPEGEL, EBBs, MCSs Beneficiaries 2007-2008 295
144 NPEGEL, EBBs, MCSs Beneficiaries 2008-2009 296
145 NPEGEL, EBBs, MCSs Beneficiaries 2009-10 297
146 Type of KGBV schools 298
147 Community wise Enrolment details in KGBV Schools 2005-06 & 2006-07 299
148 Community wise Enrolment details in KGBV Schools 2007-08 299
149 Community wise Enrolment details in KGBV Schools 2008-09 300
150 Community wise Enrolment details in KGBV Schools 2008-09 300
151 SSA Butget Outlay 2001-2009 301
152 SSA – Component wise Budget ( State Consolidation 2003-04 to 2005-06) 302-304
153 SSA – Component wise Budget ( State Consolidation 2006-07 to 2008-09) 305-311
154 SSA – Component wise Budget ( State Consolidation 2009-10 & 2010-11) 312-320
ABBREVIATIONS 321-322

SSA Objectives
All children in school, Education
Guarantee Centre, Alternative School
or ‘Back to School’ Camp by 2005.
Bridge all gender and social Category
gaps at Primary Stage by 2007 and
at Elementary Education level by 2010.
Universal Retention by 2010.
Focus on Elementary education of
Satisfactory quality with emphasis
on Education for life.
`


![Index [] · S. No. Name of Project Nos. of Villages* Nos. of Substation *The associated habitations, majra, tolaetc are also to be inspected. List of associated habitations, majra,](https://img.pdfslide.us/doc/110x75/5e4ca2a3276f7d3c893c2691/index-s-no-name-of-project-nos-of-villages-nos-of-substation-the-associated.jpg)