Embed Size (px)
Citation preview

Patient Safety in American Hospitals
July 2004
HealthGrades Quality Study
____________________________________________________________________________________________________________________________________________________________
Copyright 2004 Health Grades, Inc. All rights reserved. May not be reprinted or reproduced without permission fromHealth Grades, Inc.
1
Patient Safety in American Hospitals
Study Released by HealthGrades
July 2004
Introduction
Policymakers, providers, and consumers have made the safety of patients in United Stateshospitals a top priority. The need to monitor, track, assess, and improve the safety of inpatientcare is at the top of many stakeholders’ agendas.
Despite the shocking and widely publicized statistics on preventable deaths due to medical errorsin America’s hospitals, there is little evidence that patient safety has improved in the last fiveyears. During his keynote speech at the recent Annual Session of the American College ofPhysicians, leading patient safety expert and co-author of the five-year old Institute of Medicine(IOM) report “To Err Is Human,” Dr. Lucian Leape said that he has not seen a “bigimprovement” in patient safety since the publication of the IOM report.
This is highly unfortunate given that the IOM report found an estimated 98,000 preventabledeaths each year due to medical errors.1 With no significant improvement over the last fiveyears, we may have lost an additional 490,000 Americans due to our failure to improve patientsafety.
The United States loses more American lives to patient safety incidents every six months than itdid in the entire Vietnam War. This also equates to three fully loaded jumbo jets crashing everyother day for the last five years.2 Although not recognized as a cause of death by the Centers forDisease Control & Prevention (CDC) in its annual National Vital Statistics Report,3 if they were,medical errors would be ranked as the sixth leading cause of death in the United States andoutrank deaths due to diabetes, influenza and pneumonia, Alzheimer’s disease, and renal disease.
“You can’t manage what you can’t measure” is a widely held belief regularly professed by manyquality gurus. Without accurate measurement we can’t significantly improve the quality of care.There has been limited data and research on the magnitude of medical injuries and patient safetysubsequent to the unprecedented “To Err Is Human” IOM report in 1999. One reason for this isthat significant issues around defining, reporting, and using these measurements continue to bedebated. In response to the increased need for patient safety measurements, the Agency forHealthcare Research and Quality (AHRQ) recently developed and released a set of Patient SafetyIndicators (PSI), which are specifically designed for screening hospital administrative data forincidents of concern related to patient safety.4 See Appendix A for a complete list of the AHRQPatient Safety Indicators.
____________________________________________________________________________________________________________________________________________________________
Copyright 2004 Health Grades, Inc. All rights reserved. May not be reprinted or reproduced without permission fromHealth Grades, Inc.
2
Using this measurement tool, a recent study published in JAMA5 was the first to identify therates of, and excess length of stay and mortality associated with, these specific patient safetyindicators. Extrapolating from their sample data, representing approximately 20% of all U.S.hospitals (2000 Healthcare Cost and Utilization Project Nationwide Inpatient Sample*), Zhan andMiller estimated that the 18 patient safety indicators evaluated contributed to $9.3 billion excesscharges and 32,591 deaths in the United States annually.5 The March 2004 MedPAC Report tothe Congress-Medicare Payment Policy- found that not only are hundreds of thousands ofMedicare beneficiaries experiencing adverse events every year, but they are doing so atincreasing rates. MedPAC determined that the majority of patient safety adverse events inMedicare beneficiaries increased from 1995 to 2002.6 Although the estimates of patient safetyadverse events documented in these two studies vary, the sheer magnitude and impact of everyestimate clearly support the IOM’s contention that medical injuries are a serious epidemicconfronting the American health care system.
Given this serious epidemic and further economic burden on our already strained health caresystem, consumers and purchasers must be armed with information that allows them to makequality-oriented health care choices when choosing a hospital. To identify the patient safetyincident rates for every hospital in the country, HealthGrades applied AHRQ’s Patient SafetyIndicator software4 to three years of Medicare data (2000-2002) to identify incidences of patientsafety events by PSI. We then to applied the methodology referenced in the JAMA study5 toevaluate the mortality and cost associated with these patient safety incidents. To our knowledge,this is the first study to identify the impact of patient safety incidents on potentially avoidabledeaths and excess costs associated with AHRQ’s patient safety indicators in the Medicarepopulation across all U.S. hospitals.
Summary of Findings
AHRQ’s development of the Patient Safety Indicators was based on the Institute of Medicine’sdefinition of patient safety, which is “freedom from accidental injury due to medical care, ormedical errors.”1 Medical error is defined as “the failure of a planned action to be completed asintended or the use of a wrong plan to achieve an aim…[including] problems in practice,products, procedures, and systems.”7
In 2002, AHRQ, in collaboration with the University of California-Stanford Evidence-BasedPractice Center, identified 20 indicators that could be readily identified in hospital discharge dataand were deemed potentially preventable patient safety incidents. This tool set of 20 evidence-based PSIs was created and released to the public in 2003 to be used by various health carestakeholders to assess and improve patient safety in U.S. hospitals.4
Using AHRQ’s PSI Version 2.1, Revision 1, March 2004 software application4 which was appliedto approximately 37 million Medicare discharge, we identified the rates of 16 patient safetyincidents relevant to the Medicare population (excluded the four obstetric-related PSIs) in every * Additional information on the HCUP data is available at http://www.hcup-us.ahrq.gov/databases.jsp.
____________________________________________________________________________________________________________________________________________________________
Copyright 2004 Health Grades, Inc. All rights reserved. May not be reprinted or reproduced without permission fromHealth Grades, Inc.
3
hospital across the U.S. We then applied previous peer-reviewed research by Zhan and Miller,5
to assess the result of these safety incidents on mortality and cost in the same population. The 16PSIs studied are listed in Appendix A.
A summary of our findings follows:
1. Approximately 1.14 million total patient safety incidents occurred among the 37million hospitalizations in the Medicare population from 2000 through 2002.
2. The PSIs with the highest incident rates per 1,000 hospitalizations at risk were Failureto Rescue, Decubitus Ulcer, and Post-operative Sepsis. These three patient safetyincidents accounted for almost 60% of all patient safety incidents among Medicarepatients hospitalized from 2000 through 2002.
3. Of the total of 323,993 deaths among patients who experienced one or more PSIsfrom 2000 through 2002, 263,864, or 81%, of these deaths were potentiallyattributable to the patient safety incident(s).
4. Failure to Rescue (i.e., failure to diagnose and treat in time) and Death in LowMortality Diagnostic Related Groups (i.e., unexpected death in a low riskhospitalization) accounted for almost 75% of all mortality attributable to patientsafety incidents.
5. Of the remaining 65,972 deaths attributable to the other 14 patient safety indicators(excluding Failure to Rescue and Death in Low Mortality DRGs), almost 75% werein patients with Decubitus Ulcer (34,320), Post-operative Pulmonary Embolism orDeep Vein Thrombosis (8,445) or Post-operative Respiratory Failure (6,320).
6. There were small variations in PSI incident rates across hospitals and regions.7. Overall, the Central and Western regions of the U.S. performed better than the
Northeast and Sunbelt.8. Teaching hospitals and larger hospitals (>200 beds) had slightly higher patient safety
incident rates per 1,000 as compared to non-teaching hospitals across most PSIs.9. Patient safety incidents were more prevalent among medical admissions compared to
surgical admissions.10. Overall, the best performing hospitals (hospitals that had the lowest overall PSI
incident rates of all hospitals studied, defined as the top 7.5% of all hospitals studied)had five fewer deaths per 1,000 hospitalizations compared to the bottom 10th
percentile of hospitals. This significant mortality difference is attributable to fewerpatient safety incidents at the best performing hospitals. Fewer patient safetyincidents in the best performing hospitals resulted in a lower cost of $740,337 per1,000 hospitalizations as compared to the bottom 10th percentile of hospitals.
11. The 16 PSIs studied accounted for $8.54 billion in excess inpatient cost to theMedicare system over 3 years, or roughly $2.85 billion annually. Decubitus Ulcer($2.57 billion), Post-operative Pulmonary Embolism or Deep Vein Thrombosis($1.40 billion), and Selected Infections due to Medical Care ($1.71 billion) were themost costly and accounted for 66% of all excess attributable costs from 2000 through2002.

____________________________________________________________________________________________________________________________________________________________
Copyright 2004 Health Grades, Inc. All rights reserved. May not be reprinted or reproduced without permission fromHealth Grades, Inc.
4
Methodology
In order to evaluate overall hospital performance and to identify the best performing hospitalsacross the U.S., we used AHRQ’s Patient Safety Indicator Version 2.1, Revision 1, March 2004software application4 to evaluate every hospital in the country on each PSI and then developed aranking methodology to evaluate patient safety performance for each hospital overall. Tominimize potential impact of variation in hospital coding of specific E codes when assessingoverall hospital performance, we followed the recommendation of AHRQ8 to exclude three PSIs(Accidental Puncture or Laceration, Complications of Anesthesia, Transfusion Reaction) thatincluded these specific E codes in their definition from the overall hospital analysis. SeeAppendix B, Overall Hospital Patient Safety Performance Methodology, for full details.
After identifying the incident rates for each PSI (as mentioned above), we calculated the excesscharge and mortality attributable to the patient safety incidents using attributable charge andmortality data from previous peer-reviewed research by Zhan and Miller.5 In addition, we usedan assumption that cost was 50% of the total charge.9
Findings
Using the Patient Safety Indicator Version 2.1, Revision 1, March 2004 software applicationdeveloped by AHRQ4, HealthGrades identified a total of 1.14 million patient safety incidentsthat occurred in approximately 37 million hospitalizations in the Medicare population from 2000through 2002. Per 1,000 at risk hospital admissions, national patient safety incident rates variedby PSI from 0.01 (Transfusion Reaction) to 155 (Failure to Rescue). The most commonlyoccurring PSIs are noted in Table 1 below. These three PSIs accounted for almost 60% of allpatient safety incidents from 2000 through 2002.
Table 1: Most Commonly Occurring Patient Safety Incidents per 1,000 At RiskHospitalizations
Patient Safety Indicator Incident Rate per 1,000 At Risk HospitalizationsFailure to Rescue 155Decubitus Ulcer 30
Post-operative Sepsis 13
The rates of patient safety incidents that we identified are very consistent with previousstudies.5,6,10,11,12 Also consistent with previous findings, Medicare patients have higher patientsafety incident rates per 1,000 at risk hospital admissions compared to other patient groupsacross most PSIs.6,11,12 This is especially true for Post-operative Respiratory Failure and Death inLow Mortality DRG where the relative incident rate differences were 85% and 55% higher,respectively, in the Medicare population as compared to all patients. For the incident rates of all16 PSIs, see Appendix C. For a comparison of the incident rates found in this study to previousresearch, see Appendix D.
____________________________________________________________________________________________________________________________________________________________
Copyright 2004 Health Grades, Inc. All rights reserved. May not be reprinted or reproduced without permission fromHealth Grades, Inc.
5
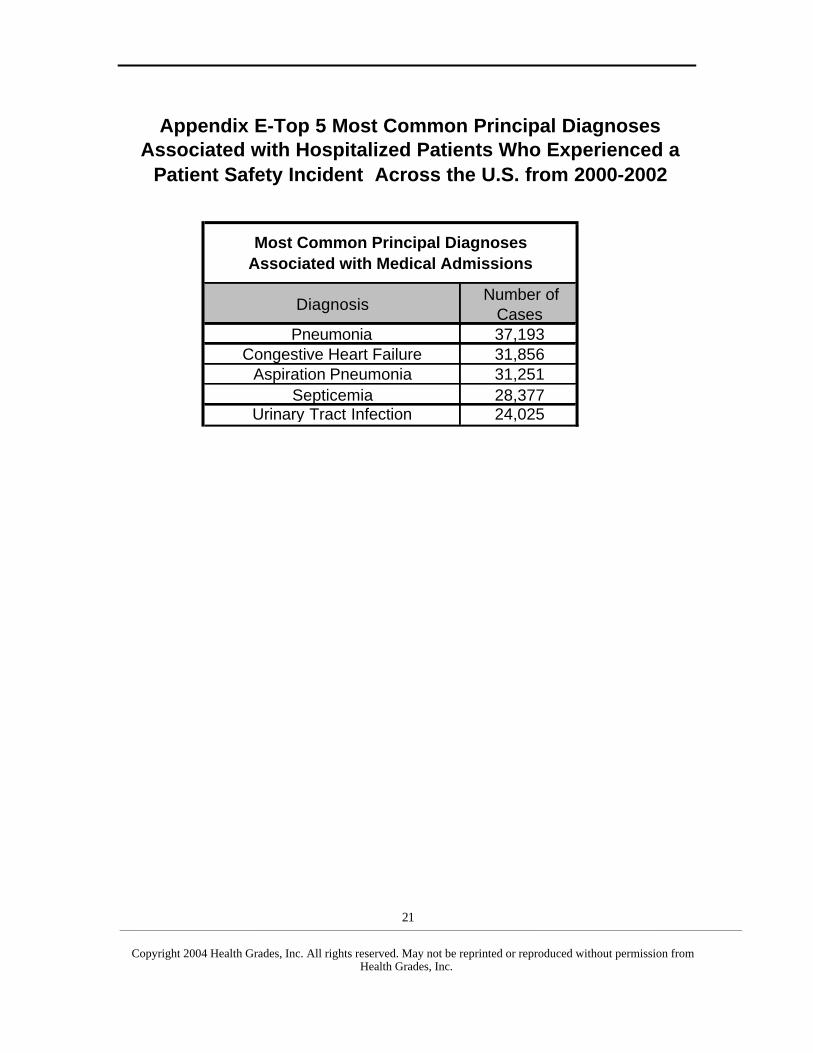
Similar to a recent study published in Health Affairs,10 we found that, overall, patient safetyincidents were more prevalent among medical admissions as compared to surgical admissions.When patients with patient safety incidents were analyzed, heart failure and pneumonia were thetop reasons for admission. For a list of the most common diagnoses associated with patient safetyincidents, see Appendix E.
In addition, we found slightly higher patient safety incident rates among teaching hospitals ascompared to non-teaching hospitals. This finding has been well documented in other studies. Assuch, AHRQ recommended8 dividing the hospitals by teaching status (teaching and non-teaching) when analyzing the data to assess comparative hospital performance within a peergroup. We found a 73% higher rate of Selected Infections due to Medical Care in teaching versusnon-teaching hospitals (3.61 per 1,000 vs. 2.08 per 1,000). Also driving the disparity betweenteaching and non-teaching hospitals were Post-operative Physiologic and MetabolicDerangement (1.62 per 1,000 vs. 0.96 per 1,000) and Accidental Puncture or Laceration (3.83per 1,000 vs. 2.35 per 1,000). Similar to teaching hospitals, larger hospitals (>200 beds) hadincreased rates of patient safety incidents compared to small hospitals (<200 beds). For rates ofeach PSI by hospital size and type, see Appendix C.
We determined that the 16 PSIs we studied may have contributed to 263,864 deaths in theMedicare population from 2000 through 2002. Eighty-one percent of these preventable deathswere potentially attributable to the patient safety incident. This translates to an approximate 25%overall mortality rate in Medicare patients with one or more patient safety incidents. Moresimply stated, one in every four Medicare patients who were hospitalized from 2000 through2002, and experienced a patient safety incident, died - compared to only 0.15 of every fourMedicare patients (3.7%) who did not experience a patient safety incident. The patient safetyincidents associated with the highest number of mortalities were Failure to Rescue (187,289),Decubitus Ulcer (34,320), and Post-operative Pulmonary Embolism or Deep Vein Thrombosis(8,445).
Although we found only small variations in patient safety incident rates across most hospitalsand regions, the Central and Western regions of the U.S. had lower overall patient safety incidentrates than the national median performance and the Northeast and Sunbelt regions, both of whichhad higher patient safety incident rates than the national median.
This study identified the best performing hospitals to establish a best practice benchmark againstwhich other hospitals could be evaluated. Best performing hospitals were identified as the top7.5% of hospitals based on overall hospital performance (see Appendix B). Best hospitals hadboth significantly lower patient safety incident rates and cost as compared to the average andhospitals in the bottom 10th percentile. See Table 2 below.
____________________________________________________________________________________________________________________________________________________________
Copyright 2004 Health Grades, Inc. All rights reserved. May not be reprinted or reproduced without permission fromHealth Grades, Inc.
6
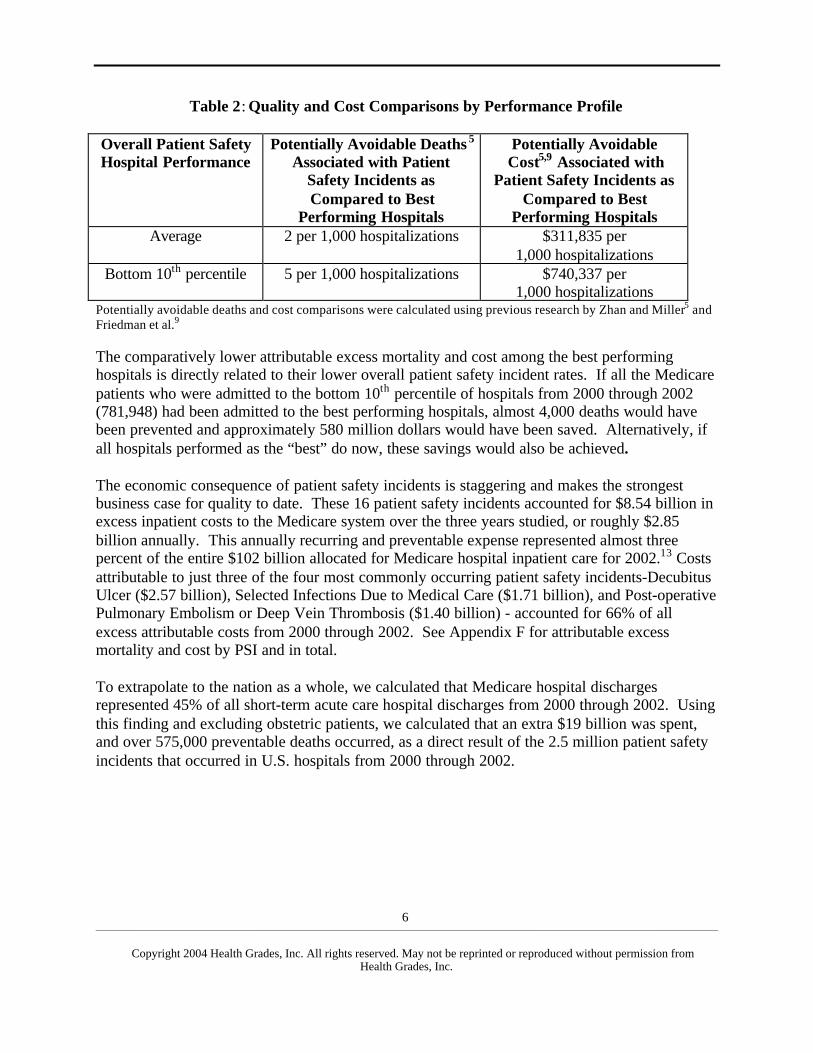
Table 2: Quality and Cost Comparisons by Performance Profile
Overall Patient SafetyHospital Performance
Potentially Avoidable Deaths 5
Associated with PatientSafety Incidents asCompared to Best
Performing Hospitals
Potentially AvoidableCost5,9 Associated with
Patient Safety Incidents asCompared to Best
Performing HospitalsAverage 2 per 1,000 hospitalizations $311,835 per
1,000 hospitalizationsBottom 10th percentile 5 per 1,000 hospitalizations $740,337 per
1,000 hospitalizationsPotentially avoidable deaths and cost comparisons were calculated using previous research by Zhan and Miller5 andFriedman et al.9
The comparatively lower attributable excess mortality and cost among the best performinghospitals is directly related to their lower overall patient safety incident rates. If all the Medicarepatients who were admitted to the bottom 10th percentile of hospitals from 2000 through 2002(781,948) had been admitted to the best performing hospitals, almost 4,000 deaths would havebeen prevented and approximately 580 million dollars would have been saved. Alternatively, ifall hospitals performed as the “best” do now, these savings would also be achieved.
The economic consequence of patient safety incidents is staggering and makes the strongestbusiness case for quality to date. These 16 patient safety incidents accounted for $8.54 billion inexcess inpatient costs to the Medicare system over the three years studied, or roughly $2.85billion annually. This annually recurring and preventable expense represented almost threepercent of the entire $102 billion allocated for Medicare hospital inpatient care for 2002.13 Costsattributable to just three of the four most commonly occurring patient safety incidents-DecubitusUlcer ($2.57 billion), Selected Infections Due to Medical Care ($1.71 billion), and Post-operativePulmonary Embolism or Deep Vein Thrombosis ($1.40 billion) - accounted for 66% of allexcess attributable costs from 2000 through 2002. See Appendix F for attributable excessmortality and cost by PSI and in total.
To extrapolate to the nation as a whole, we calculated that Medicare hospital dischargesrepresented 45% of all short-term acute care hospital discharges from 2000 through 2002. Usingthis finding and excluding obstetric patients, we calculated that an extra $19 billion was spent,and over 575,000 preventable deaths occurred, as a direct result of the 2.5 million patient safetyincidents that occurred in U.S. hospitals from 2000 through 2002.

____________________________________________________________________________________________________________________________________________________________
Copyright 2004 Health Grades, Inc. All rights reserved. May not be reprinted or reproduced without permission fromHealth Grades, Inc.
7
Interpretation of Results
This is the first study to look at the potentially avoidable mortality and cost impact of patientsafety incidents using AHRQ’s PSIs4 across all U.S. hospitals among the most concentrated atrisk patient population, Medicare patients. This study identified a substantial number of patientsafety incidents that resulted from failures in the processes of care in hospitals. The patientsafety events addressed in this study may represent only the tip of the iceberg. They are lowerthan those reported from other sources, most likely due to the fact that we analyzed selectedtypes of medical injuries that were discovered during hospitalizations of Medicare patients. Assuch, we believe that our findings underestimate the true rates and associated costs of patientsafety incidents in American hospitals.
Our estimates clearly support the IOM1 and MedPAC6 reports and the findings of Zhan andMiller5 which contend that medical errors and injuries are epidemics in the U.S. We agree withleading patient safety expert, Dr. Lucian Leape, that there have not been “big improvements” inpatient safety since the publication of the IOM report.
We now have a very compelling business case for quality improvement. So, how do we actuallyimprove quality? When the IOM issued its landmark report on medical errors in 1999, manyhealth care organizations reacted by creating reporting systems to track adverse events. Formany of those organizations, however, that’s where their efforts to prevent errors began andended. According to Dr. Lucian Leape, “To understand an adverse event and prevent futureproblems requires analysis. You have to examine, investigate, and talk to people.”14
Despite recognition of medical errors and injuries as a cause of death and patient safety as anarea in need of significant attention and improvement, the overall approach to patient safety anddefinitional issues continue to be debated. Despite these issues, some health professionals havepushed through and made strides in improving patient safety. For example, anesthesia-relatedmortality has dramatically improved in the last 40 years.15 Hospital-acquired infections havealso been substantially reduced over several decades.16
Unfortunately, the best practices associated with these past and ongoing successes have not beenreadily diffused and adopted by other areas of medicine. Why? We believe that the reasons forthis are multi-factorial: 1) Medical errors seem to be the elephant in the room that no one wantsto acknowledge or talk about. The lack of recognition and acknowledgement of the seriousnessand urgency of the problem fosters a culture of denial and complacency. Also, our culture hastypically viewed medical errors as a failure of people rather than systems, which preventsreporting and consequent analysis and solutions to prevent it from recurring. 2) Many industryexperts believe we need large and expensive reporting systems to adequately track and decreaseadverse events. Inadequate information systems and infrastructure are clearly one importantaspect of the patient safety problem. Nonetheless, the commonly talked-about “solutions” tohealth care’s broken system, computerized physician order entry system (CPOE) and electronicmedical records, for example, will not be able to prevent the majority of patient safety incidents
____________________________________________________________________________________________________________________________________________________________
Copyright 2004 Health Grades, Inc. All rights reserved. May not be reprinted or reproduced without permission fromHealth Grades, Inc.
8
we identified as significant contributors to preventable deaths and excess costs each year.3) Hospitals have resource constraints. Big problems usually require a lot of resources. Theaviation industry, well known for its safe practices and low incident rates of adverse events,spends about $3 million each year just analyzing near-misses. So, how can the providercommunity fix such an enormous problem without substantially more financing and resources?
According to the expert, Dr. Leape, “if a hospital has a real commitment to safety, it is going toget so much information that you don’t need an [expensive] reporting system. I can talk to anythree nurses in a unit for an hour about what bothers them, and come out with a safety agendathat will keep me busy for a year.”14 In recent years, AHRQ and other Federal agencies havesponsored extensive research on patient safety. In partnership with other Federal agencies,AHRQ has developed and funded a portfolio of research projects that 1) identify risks andhazards that lead to medical errors and the causes of patient injury associated with the delivery ofmedical care; 2) identify and design practices that eliminate medical errors and test them todetermine their effectiveness; 3) disseminate information on and educate health professionals,students, and practitioners about proven patient safety practices that reduce or prevent patientinjury associated with the delivery of medical care; and 4) monitor and evaluate threats to patientsafety. AHRQ has sought to improve patient safety by promoting best practices, training newresearchers, linking safety professionals and communication through Web-based tools, andpromoting international collaboration. AHRQ has also compiled and released various safety tipsfor patient and health care professionals based on available evidence.11
In addition to AHRQ’s directed efforts, other agencies, such as the Centers for Medicare andMedicaid Services, Department of Veterans Affairs, Food and Drug Administration, JointCommission on Accreditation of Healthcare Organizations, and the Institute of Medicine, haveall developed programs aimed at improving safety. The high visibility and priority of patientsafety in America’s hospitals has produced important and needed research that will identify bestpractices and optimal implementation to improve this national epidemic.
Until these best practices are developed, disseminated, and adopted to prevent medical errors andinjuries, focused improvement efforts on four key areas - Failure to Rescue, Decubitus Ulcer,Postoperative Sepsis, and Postoperative Pulmonary Embolism or Deep Vein Thrombosis - willsignificantly improve patient safety in our hospitals and reduce costs. If we focused our effortsamong Medicare beneficiaries on these four areas only and were able to reduce excessattributable mortality and costs by just 20%, we would prevent almost 18,000 avoidable deathsand save Medicare and society $380 million in excess inpatient costs annually. The enormity ofjust 20% of this situation is analogous to turning a deaf ear and blind eye to 35 jumbo jets filledwith Medicare beneficiaries crashing each year. This should result in an outcry from everyAmerican demanding the right to patient safety in our hospitals.
In conclusion, our results illustrate and validate previous studies that medical injuries in hospitalscontinue to be a real threat to Americans and are associated with significant negative economicconsequences. Most disturbingly, similar to previous study conclusions1,5,6,10 these figures likelyrepresent an underestimation of the true mortality and costs attributable to patient safety

____________________________________________________________________________________________________________________________________________________________
Copyright 2004 Health Grades, Inc. All rights reserved. May not be reprinted or reproduced without permission fromHealth Grades, Inc.
9
incidents within our U.S. health care system. As such, we recommend that more research bedone to assess patient outcomes beyond death and costs, to understand circumstances and riskfactors associated with medical injuries, and to develop strategies to prevent medical injuries.
Study Limitations
Several limitations should be recognized in interpreting the results of this study. The data setused, MedPAR, is administrative data and thus, the reliability and validity of the AHRQ PSIsdepend on the accuracy and completeness of the ICD-9-CM coding. There may be variouscoding errors or omissions of important diagnoses and complications. Also, lack of clinicaldetails limits the potential of administrative data in risk adjustment, which could result in biasesamong certain patient populations. The AHRQ PSIs incorporated the latest understanding of thepotential and limitations of administrative data and drew on broad consultations with clinicalcoding experts to ensure their clinical validity and reliability.10,17 We believe that today’s urgentsocial need to understand patient safety makes it sensible to use existing administrative datasources to assess and start to address the problem.18
Expert Consultation
We would like to thank Thomas Boardman, Ph.D., who assisted HealthGrades in developing theoverall hospital patient safety performance methodology (Appendix B). Dr. Boardman is aProfessor of Statistics and the Co-director of the Center for Quality and ProductivityImprovement at Colorado State University. He is also a partner in Boardman Associates, aconsulting firm offering services in the areas of continuous improvement and statistical thinking.We would also like to thank Dr. Denise Remus, Senior Research Scientist, Quality Indicators,Agency for Healthcare Research and Quality (AHRQ), for her guidance in the application of thePSI software and report review.
____________________________________________________________________________________________________________________________________________________________
Copyright 2004 Health Grades, Inc. All rights reserved. May not be reprinted or reproduced without permission fromHealth Grades, Inc.
10
References
1. Kohn LT, Corrigan JM, Donaldson MS, eds. To Err Is Human: Building a Safer HealthSystem (Washington: National Academy Press, 1999).
2. Preventing Fatal Medical Errors. New York Times. Dec 1, 1999:A22.3. Centers for Disease Control and Prevention. National Vital Statistics Report. 2004;52(13):4.
http://www.cdc.gov/nchs/nvss.htm4. Patient Safety Indicators, Version 2.1, Revision 1. March 2004. Agency for Healthcare
Research and Quality, Rockville, MD.http://www.qualityindicators.ahrq.gov/data/hcup/psi.htm
5. Zhan C, Miller MR. Excess Length of Stay, Charges, and Mortality Attributable to MedicalInjuries During Hospitalization. JAMA. 2003;290(14):1868-74.
6. MedPAC. Quality of care for Medicare beneficiaries. Report to the Congress: MedicarePayment Policy. March 2004.http://www.medpac.gov/publications/congressional_reports/Mar04
7. Quality Interagency Coordination Task Force, Doing What Counts for Patient Safety: FederalActions to Reduce Medical Errors and Their Impact (Washington: QuIC Task Force, 2000).
8. AHRQ recommendation was given via telephone conference call by Denise Remus Ph.D.,R.N., Senior Research Scientist, Quality Indicators to HealthGrades on May 7, 2004.
9. Friedman B, La Mare J, Andrews R, McKenzie D. Assuming an average cost to charge ratioof 0.5. Practical options for estimating cost of hospital inpatient stays. J Health CareFinance. 2002; 29(1): 1-13.
10. Romano PS et al. A National Profile of Patient Safety in U.S. Hospitals. Health Affairs2003;22(2):154-66.
11. U.S. Department of Health and Human Services Agency for Healthcare Research andQuality. National Healthcare Quality Report. December 2003. Rockville, MD.http://www.qualitytools.ahrq.gov/qualityreport/documents/quality_report.pdf
12. U.S. Department of Health and Human Services Agency for Healthcare Research andQuality. National Healthcare Disparities Report. July 2003. Rockville, MD.http://qualitytools.ahrq.gov/disparitiesreport/documents/Report%207.pdf
13. Congressional Budget Office. Projections of Medicare Spending Under Current Law.February 2002. www.house.gov/budget/hearings/crippen22802.pdf
14. ACP-Observer July 2004.15. Cooper JB, Gaba D. No Myth: Anesthesia Is a Model for Addressing Patient Safety.
Anesthesiology 2002;97:1335-7.16. Monitoring hospital-acquired infections to promote patient safety-United States, 1990-1999.
MMWR. 2000;49(149-153).17. University of California, San Francisco-Stanford Evidence-Based Practice Center. Evidence
Report for Measures of Patient Safety Based on Hospital Administrative Data–the PatientSafety Indicators. Rockville, MD: Agency for Healthcare Research and Quality; 2002.
18. Weingart SN, Iezzoni LI. Looking for Medical Injuries Where the Light Is Bright. JAMA2003; 290(14): 1917-19.
____________________________________________________________________________________________________________________________________________________________
Copyright 2004 Health Grades, Inc. All rights reserved. May not be reprinted or reproduced without permission fromHealth Grades, Inc.
11
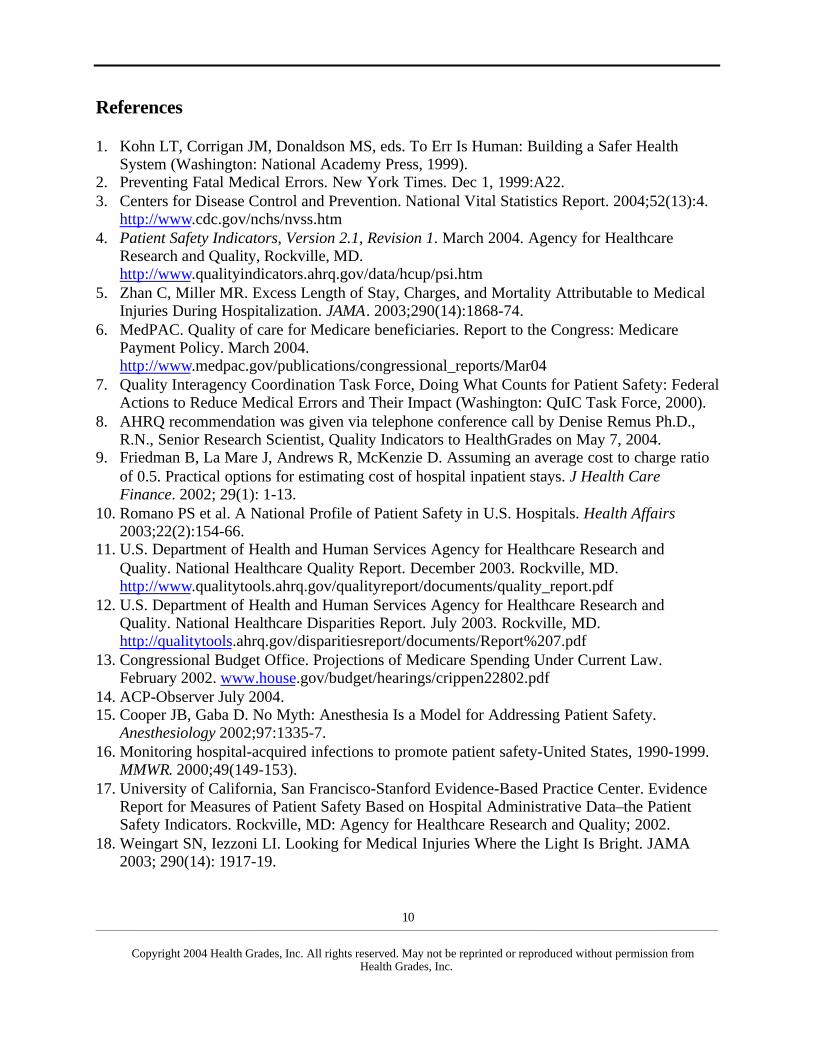
Appendix A
List of Patient Safety Indicators Used in the HealthGrades Study
• Accidental puncture or laceration• Complications of anesthesia• Death in low mortality Diagnostic Related Grouping (DRGs)• Decubitus ulcer• Failure to rescue• Foreign body left during procedure• Iatrogenic pneumothorax• Selected infections due to medical care• Post-operative hemorrhage or hematoma• Post-operative hip fracture• Post-operative physiologic and metabolic derangement• Post-operative pulmonary embolism or deep vein thrombosis• Post-operative respiratory failure• Post-operative sepsis• Post-operative wound dehiscence• Transfusion reaction
List of AHRQ Patient Safety Indicators Not Used in the HealthGrades Study
• Birth Trauma – injury to neonate• Obstetric trauma- cesarean delivery• Obstetric trauma – vaginal delivery with instrument• Obstetric trama – vaginal delivery without instrument

____________________________________________________________________________________________________________________________________________________________
Copyright 2004 Health Grades, Inc. All rights reserved. May not be reprinted or reproduced without permission fromHealth Grades, Inc.
12
Appendix B
Health Grades, Inc.Overall Hospital Patient Safety Performance
Methodology White Paper2004 Analysis (2000 - 2002 MedPAR Data)
Introduction
To help consumers evaluate and compare patient safety performance, HealthGrades analyzedpatient outcome data for virtually every hospital in the country. HealthGrades used data from theCenters for Medicare and Medicaid (CMS). The Medicare data (MedPAR file) from CMScontained the inpatient records for Medicare patients.
The steps listed below are those taken to determine the overall performance of hospitals withrespect to patient safety by creating an overall patient safety indicator score by hospital. Giventhe challenges of “rare events,” we believe that this is the best methodology for identifyingperformance across Patient Safety Indicators.
This methodology includes the following Patient Safety Indicators:• Death in low mortality Diagnostic Related Groups (DRGs)• Decubitus ulcer• Failure to rescue• Foreign body left during procedure• Iatrogenic pneumothorax• Selected infections due to medical care• Post-operative hip fracture• Post-operative hemorrhage or hematoma• Post-operative physiologic and metabolic derangements• Post-operative respiratory failure• Post-operative pulmonary embolism or deep vein thrombosis• Post-operative sepsis• Post-operative wound dehiscence
Data Acquisition
We used the CMS MedPAR data for several reasons. First, it included virtually every hospital inthe country, with the exception of military and Veterans Administration hospitals. Second,hospitals were required by law to submit complete and accurate information with substantialpenalties for those that report inaccurate or incomplete data. Third, HealthGrades calculated that

____________________________________________________________________________________________________________________________________________________________
Copyright 2004 Health Grades, Inc. All rights reserved. May not be reprinted or reproduced without permission fromHealth Grades, Inc.
13
the Medicare population represented approximately 45% of the adult patient admissions duringthe time period studied.
Data Exclusions
HealthGrades used the Patient Safety Indicators, Version 2.1, Revision 1, March 2004 softwarefrom the Agency for Healthcare Research and Quality (AHRQ), downloaded from:www.qualityindicators.ahrq.gov/data/hcup/psi.htm
Following all AHRQ guidelines for use of the PSI software, we applied it to all short-term acutecare hospitals in the MedPAR file for three years (2000-2002).
Given that this data set applies mostly to patients over the age of 65, we excluded the followingPSIs from the analysis:
• Birth trauma – injury to neonate• Obstetric trauma – cesarean delivery• Obstetric trauma – vaginal delivery with instrument• Obstetric trauma – vaginal delivery without instrument
Based on AHRQ’s recommendation,8 we excluded three additional indicators:
• Accidental puncture or laceration• Complications of anesthesia• Transfusion reaction
We also removed hospitals in the U.S. territories and Puerto Rico from the data set.
Overall Patient Safety Score
To determine the overall patient safety score by hospital, HealthGrades performed the followingsteps:
1. We calculated the AHRQ risk-adjusted rate and the smoothed rate for each hospitaland PSI.
2. We determined whether to use the AHRQ risk-adjusted or smoothed rate.• When the risk-adjusted rate was similar* to the smoothed rate, we used the risk-
adjusted rate.• Otherwise we used the smoothed rate.
* As recommended by AHRQ, “similar” was defined as a smoothed rate greater than 0.8times the risk-adjusted rate where both rates were measured relative to the nationalaverage (meaning a reliability in excess of 0.8).
____________________________________________________________________________________________________________________________________________________________
Copyright 2004 Health Grades, Inc. All rights reserved. May not be reprinted or reproduced without permission fromHealth Grades, Inc.
14
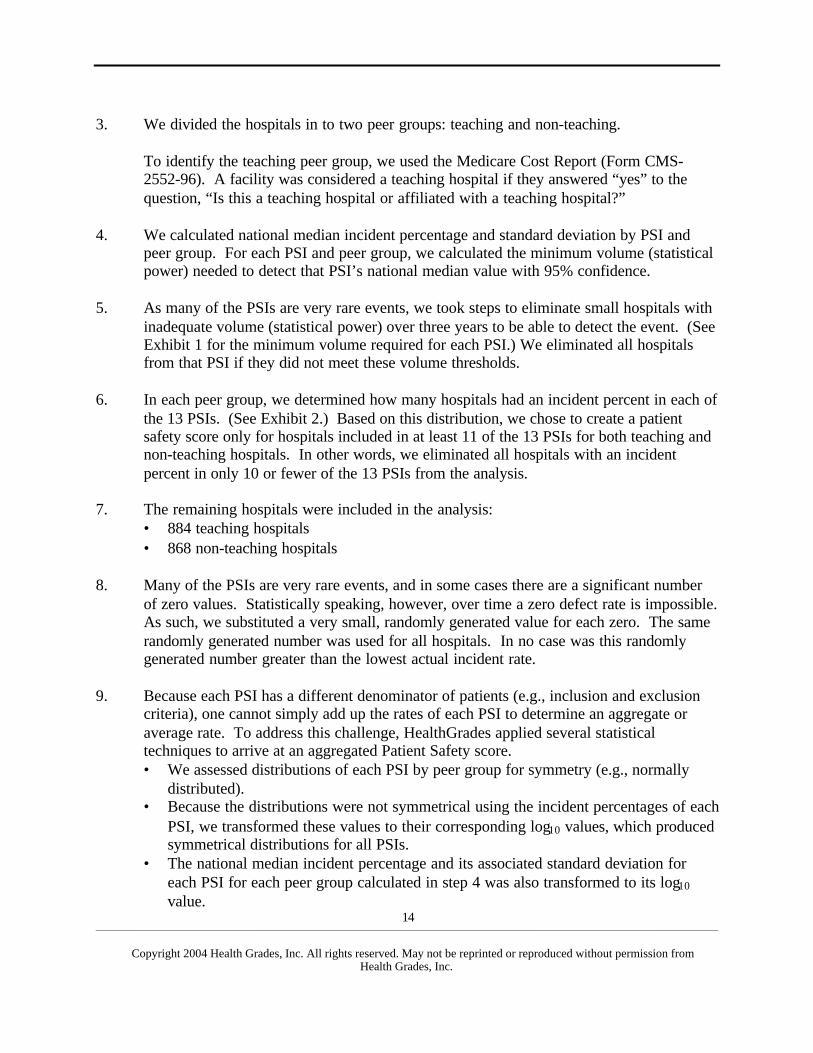
3. We divided the hospitals in to two peer groups: teaching and non-teaching.
To identify the teaching peer group, we used the Medicare Cost Report (Form CMS-2552-96). A facility was considered a teaching hospital if they answered “yes” to thequestion, “Is this a teaching hospital or affiliated with a teaching hospital?”
4. We calculated national median incident percentage and standard deviation by PSI andpeer group. For each PSI and peer group, we calculated the minimum volume (statisticalpower) needed to detect that PSI’s national median value with 95% confidence.
5. As many of the PSIs are very rare events, we took steps to eliminate small hospitals withinadequate volume (statistical power) over three years to be able to detect the event. (SeeExhibit 1 for the minimum volume required for each PSI.) We eliminated all hospitalsfrom that PSI if they did not meet these volume thresholds.
6. In each peer group, we determined how many hospitals had an incident percent in each ofthe 13 PSIs. (See Exhibit 2.) Based on this distribution, we chose to create a patientsafety score only for hospitals included in at least 11 of the 13 PSIs for both teaching andnon-teaching hospitals. In other words, we eliminated all hospitals with an incidentpercent in only 10 or fewer of the 13 PSIs from the analysis.
7. The remaining hospitals were included in the analysis:• 884 teaching hospitals• 868 non-teaching hospitals
8. Many of the PSIs are very rare events, and in some cases there are a significant numberof zero values. Statistically speaking, however, over time a zero defect rate is impossible.As such, we substituted a very small, randomly generated value for each zero. The samerandomly generated number was used for all hospitals. In no case was this randomlygenerated number greater than the lowest actual incident rate.
9. Because each PSI has a different denominator of patients (e.g., inclusion and exclusioncriteria), one cannot simply add up the rates of each PSI to determine an aggregate oraverage rate. To address this challenge, HealthGrades applied several statisticaltechniques to arrive at an aggregated Patient Safety score.• We assessed distributions of each PSI by peer group for symmetry (e.g., normally
distributed).• Because the distributions were not symmetrical using the incident percentages of each
PSI, we transformed these values to their corresponding log10 values, which producedsymmetrical distributions for all PSIs.
• The national median incident percentage and its associated standard deviation foreach PSI for each peer group calculated in step 4 was also transformed to its log10
value.

____________________________________________________________________________________________________________________________________________________________
Copyright 2004 Health Grades, Inc. All rights reserved. May not be reprinted or reproduced without permission fromHealth Grades, Inc.
15
• Zero substitution was performed for those hospitals where the incident percent was0% (cannot transform 0 to log10).
• We calculated the z-score, or distance from the national median ([hospital log10
value - national median log10 value]/national median standard deviation log10 value),for each hospital by PSI and peer group.
• We summed the z-scores across all PSIs for each hospital by peer group. We rankordered the aggregate z-scores by hospital by peer group from lowest z-score (mostnegative and “best” performers) to highest (most positive z-score and worstperformers).
• Qnorms were plotted for each peer group and the top 7.5 percentile was determined tobe the outlier performers from the rest of the normally distributed aggregate z-scores.
10. We identified both teaching and non-teaching hospitals in the top 7.5% as “bestperforming” and passing the initial qualifications to win the Distinguished HospitalAward for Patient Safety.
Additional CriteriaIn addition to being in the top 7.5%, hospitals had to meet the following criteria to win theDistinguished Hospital Award for Patient Safety:• Have an overall HealthGrades star rating of at least 2.5• Have a HealthGrades star rating in a minimum number of procedures/diagnoses:
− 21 out of 26 procedures/diagnoses for teaching hospitals− 20 out of 26 procedures/diagnoses for non-teaching hospitals
Number of Hospitals in each best performing category:
Hospital Type Number ofBest Performing Providers
Teaching hospitals 48
Non-teaching hospitals 40

____________________________________________________________________________________________________________________________________________________________
Copyright 2004 Health Grades, Inc. All rights reserved. May not be reprinted or reproduced without permission fromHealth Grades, Inc.
16
Exhibit 1
Minimum Volume* Necessary to Be Rated in Each PSI
Minimum VolumePatient Safety Indicator Teaching
Hospitals
Non-TeachingHospitals
Death in low mortality DRGs 249 328
Decubitus ulcer 18 22
Failure to rescue 6 6
Foreign body left during procedure 7614 8970
Iatrogenic pneumothorax 698 878
Selected infections due to medical care 193 316
Post-operative hip fracture 657 591
Post-operative hemorrhage or hematoma 295 398
Post-operative physiologic and metabolic derangements 305 184
Post-operative respiratory failure 88 123
Post-operative pulmonary embolism or deep veinthrombosis
48 68
Post-operative sepsis 48 60
Post-operative wound dehiscence 301 357
*The minimum volume is defined as the minimum number of discharges that wereeligible to be counted for the measure as defined in the Patient Safety IndicatorVersion 2.1 (Revision 1) software used in this analysis that would statisticallysignificantly detect one event with 95% confidence.

____________________________________________________________________________________________________________________________________________________________
Copyright 2004 Health Grades, Inc. All rights reserved. May not be reprinted or reproduced without permission fromHealth Grades, Inc.
17
Exhibit 2
Volume of Hospitalsby Number of PSIs Rated
Teaching Hospitals
Number ofPSIs
Number ofProviders
CumulativePercentage
13 807 65.72%12 78 72.07%11 66 77.44%10 69 83.06%9 52 87.30%8 39 90.47%7 34 93.24%6 27 95.44%5 25 97.48%4 15 98.70%3 6 99.19%2 6 99.67%1 4 100.00%
Non-Teaching Hospitals
Number ofPSIs
Number ofProviders
CumulativePercentage
13 542 14.99%12 160 19.41%11 330 28.54%10 355 38.36%9 203 43.97%8 131 47.59%7 163 52.10%6 208 57.85%5 516 72.12%4 367 82.27%3 307 90.76%2 169 95.44%1 165 100.00%
____________________________________________________________________________________________________________________________________________________________
Copyright 2004 Health Grades, Inc. All rights reserved. May not be reprinted or reproduced without permission fromHealth Grades, Inc.
18
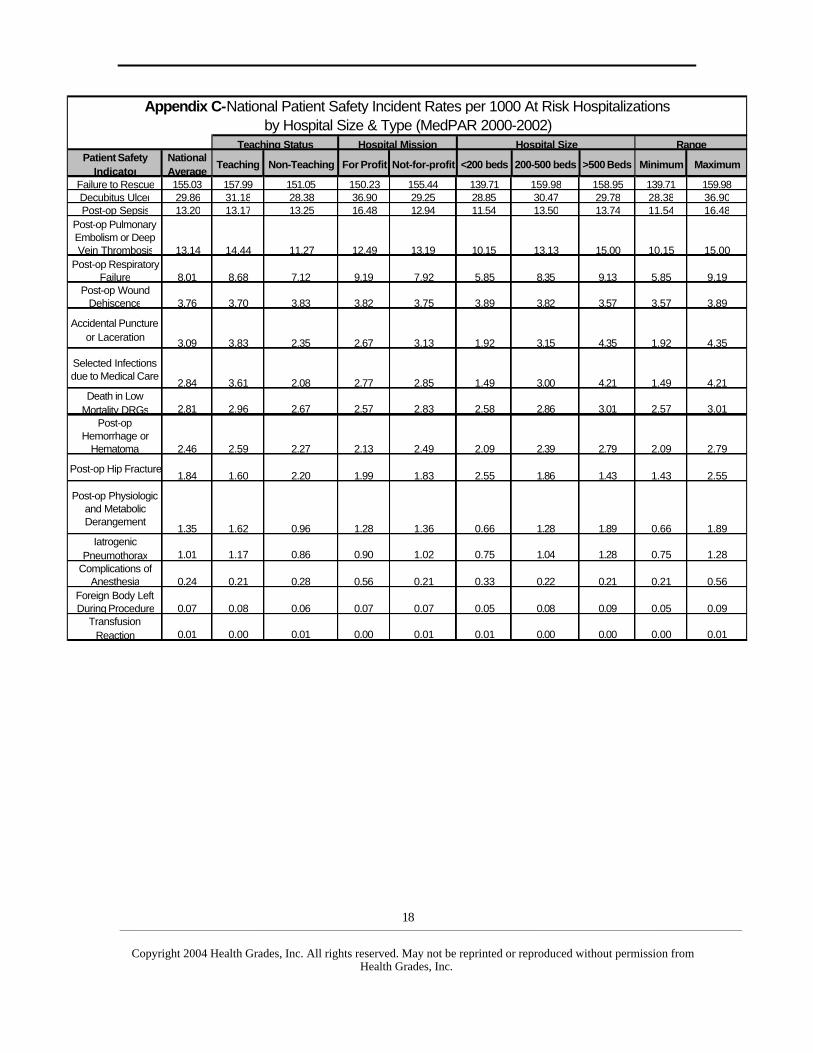
Patient Safety Indicator
National Average
Teaching Non-Teaching For Profit Not-for-profit <200 beds 200-500 beds >500 Beds Minimum Maximum
Failure to Rescue 155.03 157.99 151.05 150.23 155.44 139.71 159.98 158.95 139.71 159.98Decubitus Ulcer 29.86 31.18 28.38 36.90 29.25 28.85 30.47 29.78 28.38 36.90Post-op Sepsis 13.20 13.17 13.25 16.48 12.94 11.54 13.50 13.74 11.54 16.48
Post-op Pulmonary Embolism or Deep Vein Thrombosis 13.14 14.44 11.27 12.49 13.19 10.15 13.13 15.00 10.15 15.00
Post-op Respiratory Failure 8.01 8.68 7.12 9.19 7.92 5.85 8.35 9.13 5.85 9.19
Post-op Wound Dehiscence 3.76 3.70 3.83 3.82 3.75 3.89 3.82 3.57 3.57 3.89
Accidental Puncture or Laceration 3.09 3.83 2.35 2.67 3.13 1.92 3.15 4.35 1.92 4.35
Selected Infections due to Medical Care
2.84 3.61 2.08 2.77 2.85 1.49 3.00 4.21 1.49 4.21Death in Low
Mortality DRGs 2.81 2.96 2.67 2.57 2.83 2.58 2.86 3.01 2.57 3.01Post-op
Hemorrhage or Hematoma 2.46 2.59 2.27 2.13 2.49 2.09 2.39 2.79 2.09 2.79
Post-op Hip Fracture1.84 1.60 2.20 1.99 1.83 2.55 1.86 1.43 1.43 2.55
Post-op Physiologic and Metabolic Derangement
1.35 1.62 0.96 1.28 1.36 0.66 1.28 1.89 0.66 1.89Iatrogenic
Pneumothorax 1.01 1.17 0.86 0.90 1.02 0.75 1.04 1.28 0.75 1.28Complications of
Anesthesia 0.24 0.21 0.28 0.56 0.21 0.33 0.22 0.21 0.21 0.56Foreign Body Left During Procedure 0.07 0.08 0.06 0.07 0.07 0.05 0.08 0.09 0.05 0.09
Transfusion Reaction 0.01 0.00 0.01 0.00 0.01 0.01 0.00 0.00 0.00 0.01
Range
Appendix C-National Patient Safety Incident Rates per 1000 At Risk Hospitalizations by Hospital Size & Type (MedPAR 2000-2002)
Teaching Status Hospital Mission Hospital Size

____________________________________________________________________________________________________________________________________________________________
Copyright 2004 Health Grades, Inc. All rights reserved. May not be reprinted or reproduced without permission fromHealth Grades, Inc.
19
Patient Safety Indicator
HealthGrades1
(MedPAR 2000-2002)
MedPAC Analysis
2
(MedPAR 2002
Zhan and Miller
3
Romano, Geppert and
Davies4
Relative Difference Between
HealthGrades and MedPAC
Relative Difference
Between Zhan et al. and
HealthGrades
Relative Difference Between
Romano et al. and
HealthGradesFailure to Rescue 155.03 151.1 Not Analyzed 174.24 2.53% NA -12.39%
Decubitus Ulcer 29.86 31.9 21.51 21.3 -6.83% 27.96% 28.67%Post-op Sepsis 13.20 13.5 11.25 10.91 -2.29% 14.76% 17.33%
Post-op Pulmonary Embolism or Deep Vein Thrombosis 13.14 12.3 9.34 9.19 6.40% 28.93%
30.07%
Post-op Respiratory Failure 8.01 8.7 3.58 3.59 -8.62% 55.31% 55.18%
Post-op Wound Dehiscence 3.76 3.8 2.05 1.93 -1.13% 45.44% 48.64%
Accidental Puncture or Laceration 3.09 3.6 3.32 3.24 -16.33% -7.28%
-4.70%
Selected Infections due to Medical Care 2.84 3.0 1.99 1.93 -5.66% 29.92% 32.03%
Death in Low Mortality DRGs 2.81 3 Not Analyzed 0.43 -6.90% NA
84.68%
Post-op Hemorrhage or Hematoma 2.46 2.4 2.06 2.06 2.39% 16.22%
16.22%
Post-op Hip Fracture1.84 1.3 0.77 0.8 29.28% 58.11%
56.48%
Post-op Physiologic and Metabolic Derangement 1.35 1.4 1.00 0.89 -3.41% 26.13%
34.26%
Iatrogenic Pneumothorax 1.01 1.1 0.67 0.67 -8.48% 33.93%
33.93%
Complications of Anesthesia 0.24 Not Analyzed 0.71 0.56 NA -195.29%
-132.90%
Foreign Body Left During Procedure 0.07 Not Analyzed 0.09 0.08 NA -26.54%
-12.48%
Transfusion Reaction 0.01 Not Analyzed 0.004 0.0004 NA 22.23%
92.22%
Appendix D- Comparison of HealthGrades Patient Safety Incident Rates to Previous Research Using AHRQ PSI Methodology (Incidents per 1000 at risk hospitalizations)

____________________________________________________________________________________________________________________________________________________________
Copyright 2004 Health Grades, Inc. All rights reserved. May not be reprinted or reproduced without permission fromHealth Grades, Inc.
20
4 Romano et al. A National Profile of Patient Safety In U.S. Hospitals. Health Affairs 2003;22(2):154-66
.Romano et al.'s data source was Healthcare Cost and Utilization Project (HCUP) Nationwide
Inpatient Sample (NIS) from 1995 to 2000 (all payer discharge claims form 28 states representing approximately 20% of all US nonfederal short-term hospitals).
Appendix D continued- Comparison of HealthGrades Patient Safety Incident Rates to Previous Research Using AHRQ PSI Methodology
(Incidents per 1000 at risk hospitalizations) Footnote Explanations
1 HealthGrades' data source was MedPAR hospital discharge data from 2000 to 2002 (approximately
40 million Medicare hospital discharge claims from every nonfederal short-term hospital in every state)
2 MedPAC analysis of 100% of MedPAR data using Agency for Healthcare Research and Quality
indicators and methods. MedPAC. Quality of care for Medicare beneificiaries. Report to the Congress: Medicare Payment Policy. March 2004. 3
Zhan C. and Miller MR. Excess Length of Stay, Charges, and Mortality Attributable to Medical Injuries During Hospitalization. JAMA 2003;290(14): 1868-74. Zahn and Miller's data source was the Healthcare Cost and Utilization Project (HCUP) Nationwide Inpatient Sample (NIS) hosptial discharge
____________________________________________________________________________________________________________________________________________________________
Copyright 2004 Health Grades, Inc. All rights reserved. May not be reprinted or reproduced without permission fromHealth Grades, Inc.
21
Diagnosis Number of
CasesPneumonia 37,193
Congestive Heart Failure 31,856Aspiration Pneumonia 31,251
Septicemia 28,377Urinary Tract Infection 24,025
Appendix E-Top 5 Most Common Principal Diagnoses Associated with Hospitalized Patients Who Experienced a
Patient Safety Incident Across the U.S. from 2000-2002
Most Common Principal Diagnoses Associated with Medical Admissions

____________________________________________________________________________________________________________________________________________________________
Copyright 2004 Health Grades, Inc. All rights reserved. May not be reprinted or reproduced without permission fromHealth Grades, Inc.
22
Patient Safety Indicator
Actual Number of National Incidents
Percentage of Total Number of Incidents
All-cause National Medicare
Mortality Rate
Attributable Mortality Rates**
Total Number of National Deaths
(all-cause) in At Risk Patients
by PSI
Number of Deaths
Attributable to a PSI
(Attributable Mortality**)
Attributable Charge **
Excess Charge
Attributable to a PSI** In
Millions
Excess Cost Attributable to a PSI In
Millions
Decubitus Ulcer 474,692 41.59% 13.13% 7.23% 62,327 34,320 $10,845 $5,148.03 $2,574.02
Failure to Rescue* 187,289 16.41% 100.00% 100.00% 187,289 187,289 NA* NA* NA*Post-op Pulmonary
Embolism or Deep Vein Thrombosis 128,738 11.28% 12.21% 6.56% 15,719 8,445 $21,709 $2,794.77 $1,397.39
Accidental Puncture or Laceration 111,989 9.81% 7.65% 2.16% 8,567 2,419 $8,271 $926.26 $463.13
Selected Infections due to Medical Care 88,286 7.73% 13.16% 4.31% 11,618 3,805 $38,656 $3,412.78 $1,706.39
Iatrogenic Pneumothorax 33,571 2.94% 18.57% 6.99% 6,234 2,347 $17,312 $581.18 $290.59
Post-op Respiratory Failure 28,940 2.54% 30.97% 21.84% 8,963 6,320 $53,502 $1,548.35 $774.17
Post-Op Hemorrhage or Hematoma 24,108 2.11% 10.45% 3.01% 2,519 726 $21,431 $516.66 $258.33
Post-op Hip Fracture 12,042 1.05% 6.35% 4.52% 765 544 $13,441 $161.86 $80.93Post-op Sepsis 22,992 2.01% 29.01% 21.92% 6,670 5,040 $57,727 $1,327.26 $663.63
Death in Low Mortality DRG* 10,603 0.93% 100.00% 100.00% 10,603 10,603 NA* NA* NA*
Post-op Physiologic and Metabolic
Derangements 6,700 0.59% 23.12% 19.81% 1,549 1,327 $54,818 $367.28 $183.64Post-op Wound
Dehiscence 6,384 0.56% 14.99% 9.63% 957 615 $40,323 $257.42 $128.71Foreign Body left in during Procedure 2,591 0.23% 6.25% 2.14% 162 55 $13,315 $34.50 $17.25Complications of
Anesthesia 2,357 0.21% 1.44% 0.00% 34 0 $1,598 $3.77 $1.88
Transfusion Reaction 190 0.02% 8.95% 4.31% 17 8 $38,656 $7.34 $3.67Totals 1,141,472 - - - 323,993 263,864 - $17,087.47 8,543.73$
* By definition, all patients with the event died and were excluded from Zahn and Miller's analysis on attributable mortality and cost associated with PSI incidents.
**Based on previous research done by Zhan C and Miller MR. Excess Length of Stay, Charges, and Mortality Attributable to Medical Injuries During Hospitalization. JAMA. 2003; 290(14):1868-1874.
^ Assuming an average cost to charge ratio of 0.5 (Friedman B. La Mare J, Andrews R, McKenzie D. Practical options for estimating cost of hospital inpatient stays. J Health Care Finance. 2002; 29(1): 1-13
Appendix F-Patient Safety Incidents and Their Attributable Mortality and Excess Charge Among Medicare Beneficiaries by PSI from 2000-2002


![HG – Precise hollow shaft solution · HG+ 300 % 200 % 100 % Torsional backlash [arcmin] Torsional rigidity [Nm/arcmin] HG+ compared to the industry standard HG+ industry standard](https://img.pdfslide.us/doc/110x75/5e48715229d361412d748168/hg-a-precise-hollow-shaft-solution-hg-300-200-100-torsional-backlash-arcmin.jpg)