Embed Size (px)
Citation preview

INTERIM REPORT For the nine months ended
September 30, 2021

Consolidated Balance Sheetsas at September 30, 2021 and December 31, 2020 (unaudited - US$ thousands)
NotesSeptember 30,
2021December 31,
2020AssetsCash and cash equivalents 7, 18 80,719 66,052 Restricted cash deposits 13 — 7,525 Term deposits 13 12,392 12,392 Loans 6, 7, 13 73,968 76,175 Bonds 6, 7 19,894 58,829 Common shares 6, 7 161,117 89,510 Derivatives and guarantees 6, 7, 8, 13 50,852 13,252 Limited partnership investments 6, 7, 13 280,405 275,299 Total cash and investments 679,347 599,034
Interest receivable 5,153 8,961 Deferred income taxes — 835 Income taxes refundable 4,060 — Receivable from related parties 13 9,173 — Other assets 13, 16 4,983 1,946 Total assets 702,716 610,776
LiabilitiesAccounts payable and accrued liabilities 970 6,982 Automatic share purchase plan liability 9 2,458 — Payable to related parties 13 2,354 3,660 Income taxes payable — 399 Deferred income taxes 11 4,838 — Borrowings 8, 13 98,487 — Total liabilities 109,107 11,041
EquityCommon shareholders' equity 9 593,609 599,735
702,716 610,776
See accompanying notes.
1
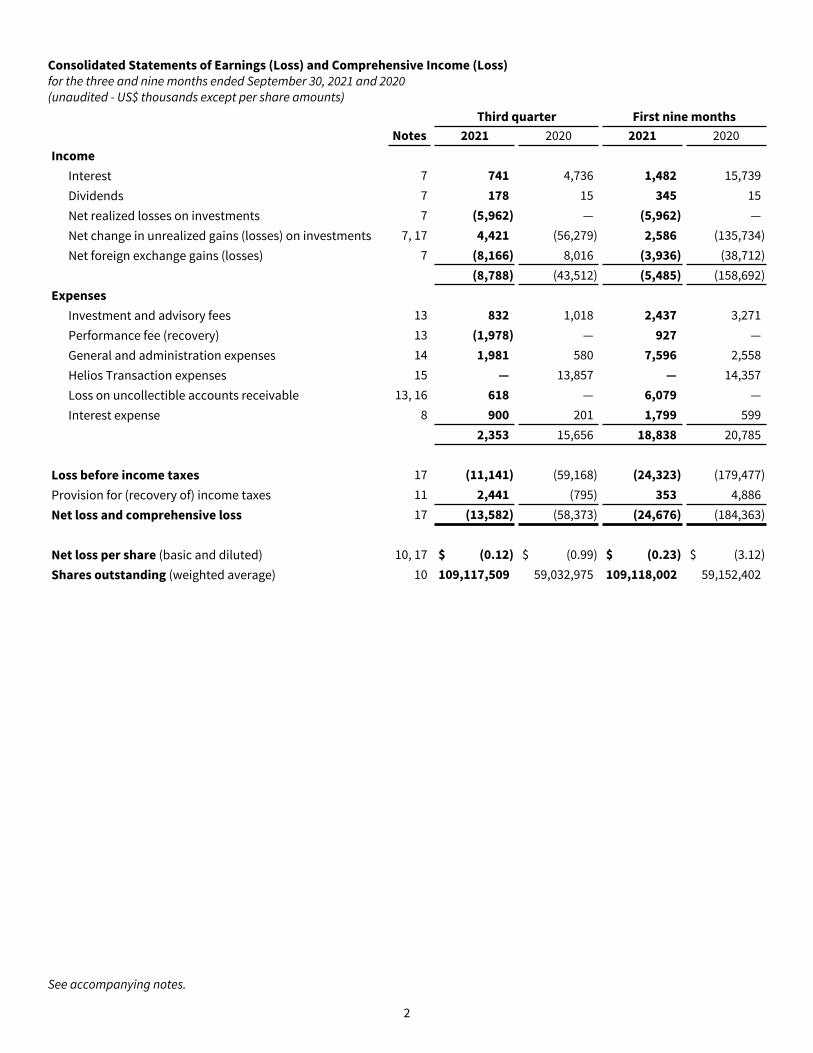
Consolidated Statements of Earnings (Loss) and Comprehensive Income (Loss)for the three and nine months ended September 30, 2021 and 2020(unaudited - US$ thousands except per share amounts)
Notes 2021 2020 2021 2020Income
Interest 7 741 4,736 1,482 15,739 Dividends 7 178 15 345 15 Net realized losses on investments 7 (5,962) — (5,962) — Net change in unrealized gains (losses) on investments 7, 17 4,421 (56,279) 2,586 (135,734) Net foreign exchange gains (losses) 7 (8,166) 8,016 (3,936) (38,712)
(8,788) (43,512) (5,485) (158,692) Expenses
Investment and advisory fees 13 832 1,018 2,437 3,271 Performance fee (recovery) 13 (1,978) — 927 — General and administration expenses 14 1,981 580 7,596 2,558 Helios Transaction expenses 15 — 13,857 — 14,357 Loss on uncollectible accounts receivable 13, 16 618 — 6,079 — Interest expense 8 900 201 1,799 599
2,353 15,656 18,838 20,785
Loss before income taxes 17 (11,141) (59,168) (24,323) (179,477) Provision for (recovery of) income taxes 11 2,441 (795) 353 4,886 Net loss and comprehensive loss 17 (13,582) (58,373) (24,676) (184,363)
Net loss per share (basic and diluted) 10, 17 $ (0.12) $ (0.99) $ (0.23) $ (3.12) Shares outstanding (weighted average) 10 109,117,509 59,032,975 109,118,002 59,152,402
Third quarter First nine months
See accompanying notes.
2

Consolidated Statements of Changes in Equity for the nine months ended September 30, 2021 and 2020(unaudited - US$ thousands)
Balance as of January 1, 2021 440,663 439,904 5,438 — 8,855 (295,125) 599,735 Net loss for the period — — — — — (24,676) (24,676) Issuances (notes 8, 9, 13) — — — 5,557 — — 5,557 Purchases for cancellation (note 9) (87) — — — — 45 (42) Automatic share purchase plan commitment (note 9) (5,122) — — — — 2,664 (2,458) Amortization — — 93 — — — 93 Capital contributions (notes 8, 13) — — — — 18,107 — 18,107 Tax expense on equity transactions (note 11) 12 — — — (2,719) — (2,707) Balance as of September 30, 2021 435,466 439,904 5,531 5,557 24,243 (317,092) 593,609
Subordinate voting shares
Multiple voting shares
Share-based
payments, net Warrants
Contributed surplus
Retained earnings (deficit)
Common share-
holders' equity
Balance as of January 1, 2020 310,078 300,000 (427) — — (90,836) 518,815 Net loss for the period — — — — — (184,363) (184,363) Purchases for cancellation (note 9) (4,810) — — — — 2,960 (1,850) Purchases and amortization — — 20 — — — 20 Capital contributions (note 9, 17) — — — — 8,855 — 8,855 Balance as of September 30, 2020 305,268 300,000 (407) — 8,855 (272,239) 341,477
See accompanying notes.
3

Consolidated Statements of Cash Flows for the three and nine months ended September 30, 2021 and 2020(unaudited - US$ thousands)
Third quarter First nine monthsNotes 2021 2020 2021 2020
Operating activitiesNet loss 17 (13,582) (58,373) (24,676) (184,363) Items not affecting cash and cash equivalents:
Net bond discount accretion (89) (366) (208) (1,031) Capitalized interest on loans and bonds 6 (171) (4,196) (535) (9,733) Performance fee (recovery) 13 (1,978) — 927 — Loss on uncollectible accounts receivable 13, 16 618 — 6,079 — Deferred income taxes 11 2,516 (1,165) 2,405 94 Amortization of share-based payment awards 31 32 93 92 Net realized losses on investments 7 5,962 — 5,962 — Net change in unrealized (gains) losses on investments 7, 17 (4,421) 56,279 (2,586) 135,734 Net foreign exchange (gains) losses 7 8,166 (8,016) 3,936 38,712
Net sales of short term investments — — — 104,095 Purchases of investments 6, 18 (9,600) (919) (62,013) (61,022) Disposals of investments 6, 18 7,433 — 7,433 — Settlement of guarantee liability 13, 16 — — (8,474) — Decrease in restricted cash deposits in support of investments 13 7,894 12,067 7,525 938 Increase in term deposits in support of investments 13 — (12,392) — (12,392) Changes in operating assets and liabilities:
Interest receivable (204) (45) (292) (2,459) Accounts payable and accrued liabilities (260) 10,868 (6,012) 11,583 Income taxes refundable (225) 112 (4,459) 3,897 Receivable from related parties — — (7,733) — Payable to related parties (13) 2,397 (2,233) 2,096 Other 214 244 53 1,036
Cash provided by (used in) operating activities 2,291 (3,473) (84,808) 27,277
Financing activitiesBorrowings: 8
Proceeds — — 100,000 — Subordinate voting shares: 9
Purchases for cancellation (42) — (42) (1,850) Cash provided by (used in) financing activities (42) — 99,958 (1,850)
Increase (decrease) in cash and cash equivalents 2,249 (3,473) 15,150 25,427 Cash and cash equivalents - beginning of period 79,282 68,526 66,052 44,334 Foreign currency translation (812) 407 (483) (4,301)
Cash and cash equivalents - end of period 80,719 65,460 80,719 65,460
See accompanying notes.
4

Index to Notes to Interim Consolidated Financial Statements
1. Business Operations 62. Helios Transaction 63. Basis of Presentation 74. Summary of Significant Accounting Policies 75. Critical Accounting Estimates and Judgments 86. Portfolio Investments 97. Cash and Investments 248. Borrowings 289. Common Shareholders' Equity 29
10. Net Earnings (Loss) per Share 3111. Income Taxes 3112. Financial Risk Management 3313. Related Party Transactions 3714. General and Administration Expenses 4115. Helios Transaction Expenses 4116. Other Assets 4117. Revision of Comparative Amounts 4218. Supplementary Cash Flow Information 43
5

Notes to Interim Consolidated Financial Statementsfor the three and nine months ended September 30, 2021 and 2020 (unaudited - US$ thousands except share and per share amounts and as otherwise indicated)
1. Business Operations
Helios Fairfax Partners Corporation ("the company" or "HFP", formerly known as Fairfax Africa Holdings Corporation) is an investment holding company whose objective is to achieve long term capital appreciation, while preserving capital, by investing in public and private equity securities and debt instruments in Africa and African businesses or other businesses with customers, suppliers or business primarily conducted in, or dependent on, Africa ("Portfolio Investments"). The company makes all or substantially all of its investments either directly or through one of its wholly-owned subsidiaries, which include a South Africa-based subsidiary HFP South Africa Investments Proprietary Limited ("SA Sub", formerly known as Fairfax Africa Investments Proprietary Limited), a Mauritius-based subsidiary HFP Investments Limited ("Mauritius Sub", formerly known as Fairfax Africa Holdings Investments Limited), and a U.S.-based subsidiary HFP US Investments, Inc. ("U.S. Sub").
HFA Topco, L.P. ("TopCo LP" or the "Portfolio Advisor"), an affiliate of Helios Holdings Limited ("HHL") (together with one or more of its affiliates, as the context requires, the "Helios Holdings Group"), is the portfolio advisor of the company and its consolidated subsidiaries, responsible to source and advise with respect to all investments. TopCo LP has appointed Helios Investment Partners LLP ("Helios" or, the "Manager"), a registered portfolio manager in the United Kingdom, as its sub-advisor. Both Fairfax Financial Holdings Limited ("Fairfax") and the Helios Holdings Group exert significant influence and, together, act as the ultimate controlling party of HFP, though there is no contractual arrangement requiring that Fairfax and the Helios Holdings Group concur on all decisions. Refer to note 13 for details on Fairfax's and the Helios Holdings Group's voting rights and equity interest in the company.
Fairfax provides certain services under a Management Services Agreement between HFP and Fairfax, effective December 8, 2020. Fairfax is a holding company which, through its subsidiaries, is engaged in property and casualty insurance and reinsurance and the associated investment management.
The company is federally incorporated and is domiciled in Ontario, Canada. The principal office of the company and Fairfax is located at 95 Wellington Street West, Suite 800, Toronto, Ontario, Canada, M5J 2N7. The principal office of the Portfolio Advisor is located at De Capatan House, Grange Road, St Peter Port, Guernsey, GY1 2QG. The principal office of the Manager is located on the 2nd Floor, 12 Charles II Street, St James’s, London, United Kingdom, SW1Y 4QU.
2. Helios Transaction
On December 8, 2020 the company closed the previously announced transaction with HHL, pursuant to which HHL contributed its entitlement to cash flows arising from certain fee streams (as described below) to HFP in exchange for a 45.9% equity and voting interest in HFP (the "Transaction"). Upon closing of the Transaction, the company was renamed Helios Fairfax Partners Corporation and its subordinate voting shares continued to be listed on the Toronto Stock Exchange. In December 2020, following completion of the Transaction, the TSX ticker for the company's subordinate voting shares was changed from FAH.U to HFPC.U.
Helios is an Africa-focused private investment firm led and predominantly staffed by African professionals and manages geographically diversified portfolios of private equity and credit investments in over 30 African countries.
As consideration for a 45.9% equity and voting interest in HFP, HHL contributed cash flows arising from the following fee stream entitlements:
• 100% of all management and other fees paid to the Helios Holdings Group in connection with the management of any existing or future fund (including the management of HFP and its subsidiaries), less expenses, administrative fees, and other operation fees relating to the management of those funds;
• 25% of carried interest amounts generated by any existing fund managed by Helios or any of its affiliates, excluding Helios Investors IV, L.P.; and
• 50% of carried interest amounts generated by any future fund managed by Helios or any of its affiliates, including Helios Investors IV, L.P.
(Existing and future funds managed by the Helios Holdings Group are referred to as "Helios Funds".)
6
On December 7, 2020, prior to closing of the Transaction, the company’s investment in Atlas Mara common shares was sold to Fairfax for proceeds of $40,000. Net proceeds were comprised of $20,000 in cash and $20,000 in an interest-free loan due from Fairfax no later than three years from closing of the Transaction (the "Fairfax Loan") (see note 13). In addition, Fairfax has guaranteed all repayment obligations of Atlas Mara under the Atlas Mara Facility, giving rise to the Atlas Mara Facility Guarantee (see note 13). Fairfax has also guaranteed to the company that the Atlas Mara Zambia Term Deposit of $12,392 plus accrued interest and up to $7,283 in deposit accounts with Access Bank SA (formerly Grobank) may be withdrawn at any time after December 8, 2021.
Upon closing of the Transaction, the company entered into an administration and investment advisory services agreement with TopCo LP (the "Investment Advisory Agreement"), which appointed the Manager as its sub-advisor. The Investment Advisory Agreement replaced the previous investment advisory agreement (the "Former Investment Advisory Agreement") with Hamblin Watsa Investment Counsel Ltd. ("HWIC" or the "Former Portfolio Advisor"). The Portfolio Advisor has discretionary authority to negotiate and complete investments on behalf of the company. The Portfolio Advisor will request approval from the company’s board of directors, by simple majority, prior to making any investment in excess of the greater of 10% of HFP’s Net Asset Value and $50,000; and will not make any insurance-related investment without the prior written consent of Fairfax.
Upon closing of the Transaction, Tope Lawani and Babatunde Soyoye (the co-founders and Managing Partners of the investment advisor to the Helios Funds) were appointed as Co-Chief Executive Officers of HFP and Michael Wilkerson was appointed Executive Vice Chairman of HFP.
The company entered into the Management Services Agreement with Fairfax, pursuant to which Fairfax will provide certain services to the company and its subsidiaries on a two-year transitional basis (see note 13).
Upon closing of the Transaction, the company adopted a new special incentive plan, pursuant to which options to purchase subordinate voting shares of the company were granted to certain employees, officers, members, partners or consultants of the Manager (the "SIP Recipients") (see note 9).
3. Basis of Presentation
The company's interim consolidated financial statements for the three and nine months ended September 30, 2021 have been prepared in accordance with International Financial Reporting Standards ("IFRS") as issued by the International Accounting Standards Board ("IASB") applicable to the preparation of interim financial statements, including International Accounting Standard 34 Interim Financial Reporting. Accordingly, certain information and disclosures normally included in annual consolidated financial statements prepared in accordance with IFRS as issued by the IASB have been omitted or condensed. These interim consolidated financial statements should be read in conjunction with the company’s annual consolidated financial statements for the year ended December 31, 2020, which have been prepared in accordance with IFRS as issued by the IASB.
These interim consolidated financial statements were approved for issue by the company’s Board of Directors on November 4, 2021.
4. Summary of Significant Accounting Policies
The principal accounting policies applied to the preparation of these interim consolidated financial statements are as set out in the company's annual consolidated financial statements for the year ended December 31, 2020, prepared in accordance with IFRS as issued by the IASB. Those policies and methods of computation have been consistently applied to all periods presented except as described below.
Hybrid contracts - Hybrid contracts are comprised of a non-derivative host contract and an embedded derivative. At inception, the company will bifurcate an embedded derivative from a non-derivative host contract that is not a financial asset within the scope of IFRS 9 if the economic characteristics and risks of the two are not closely related, the embedded derivative meets the definition of a derivative on a standalone basis, and the company has not irrevocably designated the entire hybrid contract as measured at FVTPL. The bifurcated non-derivative host contract and embedded derivative are recognized and measured in accordance with their respective accounting policies.
Warrants - Warrants issued by the company are classified as equity when there is no contractual obligation to transfer cash or other financial assets to the holder of the warrants, and if the warrants will or may be settled by the company exchanging a fixed amount of cash or other financial assets for a fixed number of its own equity instruments. Warrants are measured at fair value at inception and are not subsequently remeasured.
7

New accounting pronouncements adopted in 2021
Interest Rate Benchmark Reform - Phase 2 (Amendments to IFRS 9, IAS 39, IFRS 7, IFRS 4 and IFRS 16)
On August 27, 2020 the IASB issued amendments to IFRS 9 Financial Instruments, IAS 39 Financial Instruments: Recognition and Measurement, IFRS 7 Financial Instruments: Disclosures, IFRS 4 Insurance Contracts and IFRS 16 Leases to address financial statement impacts and practical expedients when an existing interest rate benchmark such as LIBOR is replaced with an alternative reference rate. Retrospective adoption of these amendments on January 1, 2021 did not have a significant impact on the company’s consolidated financial statements.
New accounting pronouncements issued but not yet effective
The IASB issued the following amendments in 2021 and 2020 which the company does not expect to adopt in advance of their respective effective dates: Onerous Contracts - Cost of Fulfilling a Contract (Amendments to IAS 37) and Annual Improvements to IFRS Standards 2018-2020, effective January 1, 2022; and Classification of Liabilities as Current or Non-current (Amendments to IAS 1), Disclosure of Accounting Policies (Amendments to IAS 1 and IFRS Practice Statement 2) and Definition of Accounting Estimates (Amendments to IAS 8) effective January 1, 2023. The company is currently evaluating the expected impact of these pronouncements on its consolidated financial statements.
5. Critical Accounting Estimates and Judgments
The company made a number of critical accounting estimates and judgements in the preparation of the company's interim consolidated financial statements.
Valuation of level 3 Portfolio Investments, income taxes, and determination of functional currency
In the preparation of the company’s interim consolidated financial statements, management has made a number of critical estimates and judgments in the preparation of notes 6, 7, 11, and 13 relating to the valuation of level 3 Portfolio Investments, income taxes and the determination of functional currency in a manner consistent with those as described in the company's annual consolidated financial statements for the year ended December 31, 2020. The broad effects of the COVID-19 pandemic on the company are described in note 12.
8
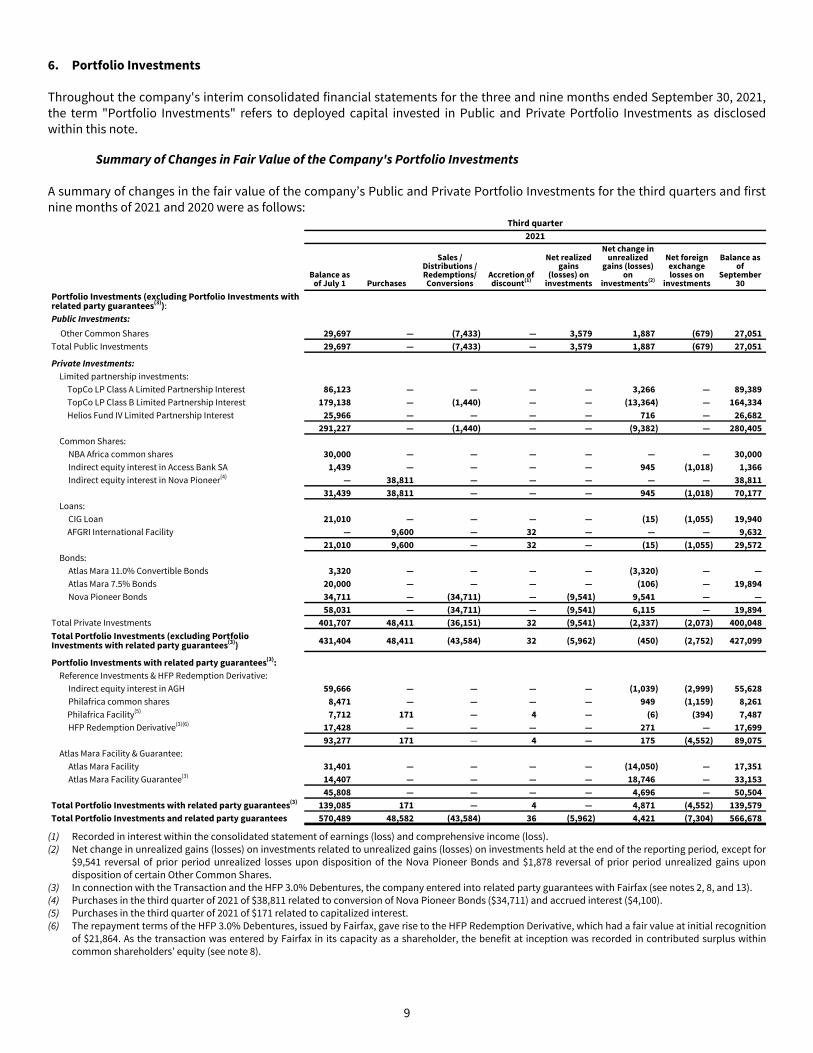
6. Portfolio Investments
Throughout the company's interim consolidated financial statements for the three and nine months ended September 30, 2021, the term "Portfolio Investments" refers to deployed capital invested in Public and Private Portfolio Investments as disclosed within this note.
Summary of Changes in Fair Value of the Company's Portfolio Investments
A summary of changes in the fair value of the company’s Public and Private Portfolio Investments for the third quarters and first nine months of 2021 and 2020 were as follows:
Third quarter2021
Balance as of July 1 Purchases
Sales / Distributions / Redemptions/ Conversions
Accretion of discount(1)
Net realized gains
(losses) on investments
Net change in unrealized
gains (losses) on
investments(2)
Net foreign exchange losses on
investments
Balance as of
September 30
Portfolio Investments (excluding Portfolio Investments with related party guarantees(3)):Public Investments:
Other Common Shares 29,697 — (7,433) — 3,579 1,887 (679) 27,051 Total Public Investments 29,697 — (7,433) — 3,579 1,887 (679) 27,051
Private Investments:Limited partnership investments:
TopCo LP Class A Limited Partnership Interest 86,123 — — — — 3,266 — 89,389 TopCo LP Class B Limited Partnership Interest 179,138 — (1,440) — — (13,364) — 164,334 Helios Fund IV Limited Partnership Interest 25,966 — — — — 716 — 26,682
291,227 — (1,440) — — (9,382) — 280,405 Common Shares:
NBA Africa common shares 30,000 — — — — — — 30,000 Indirect equity interest in Access Bank SA 1,439 — — — — 945 (1,018) 1,366 Indirect equity interest in Nova Pioneer(4) — 38,811 — — — — — 38,811
31,439 38,811 — — — 945 (1,018) 70,177 Loans:
CIG Loan 21,010 — — — — (15) (1,055) 19,940 AFGRI International Facility — 9,600 — 32 — — — 9,632
21,010 9,600 — 32 — (15) (1,055) 29,572 Bonds:
Atlas Mara 11.0% Convertible Bonds 3,320 — — — — (3,320) — — Atlas Mara 7.5% Bonds 20,000 — — — — (106) — 19,894 Nova Pioneer Bonds 34,711 — (34,711) — (9,541) 9,541 — —
58,031 — (34,711) — (9,541) 6,115 — 19,894 Total Private Investments 401,707 48,411 (36,151) 32 (9,541) (2,337) (2,073) 400,048 Total Portfolio Investments (excluding Portfolio Investments with related party guarantees(3)) 431,404 48,411 (43,584) 32 (5,962) (450) (2,752) 427,099
Portfolio Investments with related party guarantees(3):Reference Investments & HFP Redemption Derivative:
Indirect equity interest in AGH 59,666 — — — — (1,039) (2,999) 55,628 Philafrica common shares 8,471 — — — — 949 (1,159) 8,261 Philafrica Facility(5) 7,712 171 — 4 — (6) (394) 7,487 HFP Redemption Derivative(3)(6) 17,428 — — — — 271 — 17,699
93,277 171 — 4 — 175 (4,552) 89,075 Atlas Mara Facility & Guarantee:
Atlas Mara Facility 31,401 — — — — (14,050) — 17,351 Atlas Mara Facility Guarantee(3) 14,407 — — — — 18,746 — 33,153
45,808 — — — — 4,696 — 50,504 Total Portfolio Investments with related party guarantees(3) 139,085 171 — 4 — 4,871 (4,552) 139,579 Total Portfolio Investments and related party guarantees 570,489 48,582 (43,584) 36 (5,962) 4,421 (7,304) 566,678
(1) Recorded in interest within the consolidated statement of earnings (loss) and comprehensive income (loss). (2) Net change in unrealized gains (losses) on investments related to unrealized gains (losses) on investments held at the end of the reporting period, except for
$9,541 reversal of prior period unrealized losses upon disposition of the Nova Pioneer Bonds and $1,878 reversal of prior period unrealized gains upon disposition of certain Other Common Shares.
(3) In connection with the Transaction and the HFP 3.0% Debentures, the company entered into related party guarantees with Fairfax (see notes 2, 8, and 13).(4) Purchases in the third quarter of 2021 of $38,811 related to conversion of Nova Pioneer Bonds ($34,711) and accrued interest ($4,100).(5) Purchases in the third quarter of 2021 of $171 related to capitalized interest. (6) The repayment terms of the HFP 3.0% Debentures, issued by Fairfax, gave rise to the HFP Redemption Derivative, which had a fair value at initial recognition
of $21,864. As the transaction was entered by Fairfax in its capacity as a shareholder, the benefit at inception was recorded in contributed surplus within common shareholders’ equity (see note 8).
9

Third quarter2020
Balance as of July 1 Purchases
Accretion of discount/
(amortization of premium)(1)
Net change in unrealized
gains (losses) on
investments(2)
Net foreign exchange gains on investments
Balance as of September 30
Portfolio Investments (excluding Portfolio Investments with related party guarantees(3)):
Public Investments:Common shares:
CIG common shares 6,450 — — (5,675) 1,680 2,455 Other Common Shares 11,562 — — 211 445 12,218
Total Public Investments 18,012 — — (5,464) 2,125 14,673 Private Investments:
Common shares:Indirect equity interest in AGH 63,143 — — (8,858) 2,269 56,554 Philafrica common shares 15,156 — — (6,445) 780 9,491 Indirect equity interest in Access Bank SA 5,514 — — (4,967) 685 1,232
83,813 — — (20,270) 3,734 67,277 Loans:
CIG Loan 15,567 — 29 (529) 701 15,768 PGR2 Loan 18,552 — — (17,326) 817 2,043 Philafrica Facility(4) 5,714 137 36 7 240 6,134
39,833 137 65 (17,848) 1,758 23,945 Bonds:
Atlas Mara 11.0% Convertible Bonds(5) 19,551 521 (24) (5,027) — 15,021 Atlas Mara 7.5% Bonds 19,420 — 193 (5,111) — 14,502 Nova Pioneer Bonds(6) 43,774 2,536 (1) 105 — 46,414
82,745 3,057 168 (10,033) — 75,937 Derivatives: Atlas Mara Warrants 3 — — (2) — 1 Nova Pioneer Warrants 707 — — (344) — 363
710 — — (346) — 364 Total Private Investments 207,101 3,194 233 (48,497) 5,492 167,523
Total Portfolio Investments (excluding Portfolio Investments with related party guarantees(3)) 225,113 3,194 233 (53,961) 7,617 182,196
Portfolio Investments with related party guarantees(3):Atlas Mara Common Shares and Forward Derivative:
Atlas Mara common shares 34,396 — — (11,082) — 23,314 Atlas Mara Forward Derivative(3) — 6,056 — 9,730 — 15,786
34,396 6,056 — (1,352) — 39,100 Atlas Mara Facility & Guarantee:
Atlas Mara Facility(7) 39,612 1,921 136 (10,614) — 31,055 Atlas Mara Facility Guarantee(3) — 2,799 — 9,648 — 12,447
39,612 4,720 136 (966) — 43,502 Total Portfolio Investments with related party guarantees(3) 74,008 10,776 136 (2,318) — 82,602 Total Portfolio Investments and related party guarantees 299,121 13,970 369 (56,279) 7,617 264,798
(1) Recorded in interest within the consolidated statement of earnings (loss) and comprehensive income (loss).(2) Net change in unrealized gains (losses) on investments related to unrealized gains (losses) on investments held at the end of the reporting period.(3) In connection with the Transaction (see note 2), the company entered into related party guarantees with Fairfax (see note 13). The Atlas Mara Forward
Derivative and the Atlas Mara Facility Guarantee had fair values at initial recognition of $6,056 and $2,799 respectively. As the transactions were entered by Fairfax in its capacity as a shareholder, the benefit at inception was recorded in contributed surplus within common shareholders' equity (see note 9).
(4) Purchases in the third quarter of 2020 of $137 related to capitalized interest.(5) Purchases in the third quarter of 2020 of $521 related to capitalized interest.(6) Purchases in the third quarter of 2020 of $2,536 related to capitalized interest.(7) Purchases in the third quarter of 2020 included $1,002 related to capitalized interest.
10

First nine months2021
Balance as of January 1 Purchases
Sales / Distributions / Redemptions/ Conversions
Accretion of discount(1)
Net realized gains (losses)
on investments
Net change in unrealized
gains (losses) on
investments(2)
Net foreign exchange losses on
investments
Balance as of September
30
Portfolio Investments (excluding Portfolio Investments with related party guarantees(3)):
Public Investments:
Common shares:
Other Common Shares 14,836 5,812 (7,433) — 3,579 10,581 (324) 27,051 Total Public Investments 14,836 5,812 (7,433) — 3,579 10,581 (324) 27,051
Private Investments:
Limited partnership investments:
TopCo LP Class A Limited Partnership Interest(4) 88,465 — (5,812) — — 6,736 — 89,389 TopCo LP Class B Limited Partnership Interest 186,834 — (1,440) — — (21,060) — 164,334 Helios Fund IV Limited Partnership Interest — 22,413 — — — 4,269 — 26,682
275,299 22,413 (7,252) — — (10,055) — 280,405 Common shares:
NBA Africa common shares — 30,000 — — — — — 30,000 Indirect equity interest in Access Bank SA 1,399 — — — — 427 (460) 1,366 Indirect equity interest in Nova Pioneer(5) — 38,811 — — — — — 38,811
1,399 68,811 — — — 427 (460) 70,177 Loans:
CIG Loan 19,254 — — — — 1,163 (477) 19,940 AFGRI International Facility — 9,600 — 32 — — — 9,632
19,254 9,600 — 32 — 1,163 (477) 29,572 Bonds:
Atlas Mara 11.0% Convertible Bonds 2,442 — — — — (2,442) — — Atlas Mara 7.5% Bonds 19,966 — — — — (72) — 19,894 Nova Pioneer Bonds 36,421 — (34,711) — (9,541) 7,831 — —
58,829 — (34,711) — (9,541) 5,317 — 19,894
Total Private Investments 354,781 100,824 (41,963) 32 (9,541) (3,148) (937) 400,048
Total portfolio investments (excluding Portfolio Investments with related party guarantees(3)) 369,617 106,636 (49,396) 32 (5,962) 7,433 (1,261) 427,099
Portfolio investments with related party guarantees(3):
Reference Investments & HFP Redemption Derivative:
Indirect equity interest in AGH(6) 64,210 33 — — — (7,280) (1,335) 55,628 Philafrica common shares 9,065 — — — — (280) (524) 8,261 Philafrica Facility(7) 7,164 502 — 27 — (28) (178) 7,487 HFP Redemption Derivative(3)(8) — 21,864 — — — (4,165) — 17,699
80,439 22,399 — 27 — (11,753) (2,037) 89,075 Atlas Mara Facility and Guarantee:
Atlas Mara Facility 30,346 — — — — (12,995) — 17,351 Atlas Mara Facility Guarantee(3) 13,252 — — — — 19,901 — 33,153
43,598 — — — — 6,906 — 50,504 Total Portfolio Investments with Related Party Guarantees(3) 124,037 22,399 — 27 — (4,847) (2,037) 139,579 Total Portfolio Investments and related party guarantees 493,654 129,035 (49,396) 59 (5,962) 2,586 (3,298) 566,678
(1) Recorded in interest within the consolidated statement of earnings (loss) and comprehensive income (loss). (2) Net change in unrealized gains (losses) on investments related to unrealized gains (losses) on investments held at the end of the reporting period, except for
$7,831 reversal of prior period unrealized losses upon disposition of the Nova Pioneer Bonds and $626 reversal of prior period unrealized gains upon disposition of certain Other Common Shares.
(3) In connection with the Transaction and the HFP 3.0% Debentures, the company entered into related party guarantees with Fairfax (see notes 2, 8, and 13).(4) Distributions in the first nine months of 2021 of $5,812 related to a distribution of Carried Interest Proceeds in specie of Vivo common shares. (5) Purchases in the third quarter of 2021 of $38,811 related to conversion of Nova Pioneer Bonds ($34,711) and accrued interest ($4,100).(6) Purchases in the first nine months of 2021 of $33 related to capitalized interest.(7) Purchases in the first nine months of 2021 of $502 related to capitalized interest. (8) The repayment terms of the HFP 3.0% Debentures, issued by Fairfax, gave rise to the HFP Redemption Derivative, which had a fair value at initial recognition
of $21,864. As the transaction was entered by Fairfax in its capacity as a shareholder, the benefit at inception was recorded in contributed surplus within common shareholders’ equity (see note 8).
11

First nine months2020
Balance as of January 1 Purchases
Accretion of discount/
(amortization of premium)(1)
Net change in unrealized
gains (losses) on
investments(2)
Net foreign exchange gains
(losses) on investments
Balance as of September 30
Portfolio Investments (excluding Portfolio Investments with related party guarantees(3)):
Public Investments:Common shares:
CIG common shares 19,562 866 — (10,075) (7,898) 2,455
Other Common Shares — 10,053 — 1,110 1,055 12,218
Total Public Investments 19,562 10,919 — (8,965) (6,843) 14,673 Private Investments:
Common shares:Indirect equity interest in AGH 104,976 — — (33,670) (14,752) 56,554 Philafrica common shares 19,271 — — (6,023) (3,757) 9,491 Indirect equity interest in Access Bank SA 10,328 4,974 — (11,606) (2,464) 1,232
134,575 4,974 — (51,299) (20,973) 67,277 Loans:
CIG Loan 20,744 — 100 (1,649) (3,427) 15,768 PGR2 Loan(4) 21,240 1,358 — (16,957) (3,598) 2,043 Philafrica Facility(5) — 5,797 47 32 258 6,134
41,984 7,155 147 (18,574) (6,767) 23,945 Bonds:
Atlas Mara 11.0% Convertible Bonds(6) 18,296 1,521 (71) (4,725) — 15,021 Atlas Mara 7.5% Bonds 18,431 — 555 (4,484) — 14,502 Nova Pioneer Bonds(7) 42,093 5,107 65 (851) — 46,414
78,820 6,628 549 (10,060) — 75,937 Derivatives:
Atlas Mara Warrants 83 — — (82) — 1 Nova Pioneer Warrants 1,458 — — (1,095) — 363
1,541 — — (1,177) — 364 Total Private Investments 256,920 18,757 696 (81,110) (27,740) 167,523
Total Portfolio Investments (excluding Portfolio Investments with related party guarantees(3)) 276,482 29,676 696 (90,075) (34,583) 182,196
Portfolio Investments with related party guarantees(3):Atlas Mara Common Shares and Forward Derivative:
Atlas Mara common shares 78,075 — — (54,761) — 23,314 Atlas Mara Forward Derivative(3) — 6,056 — 9,730 — 15,786
78,075 6,056 — (45,031) — 39,100 Atlas Mara Facility & Guarantee:
Atlas Mara Facility(8) — 41,079 204 (10,228) — 31,055 Atlas Mara Facility Guarantee(3) — 2,799 — 9,648 — 12,447
— 43,878 204 (580) — 43,502 Total Portfolio Investments with related party guarantees(3) 78,075 49,934 204 (45,611) — 82,602 Total Portfolio Investments and related party guarantees 354,557 79,610 900 (135,686) (34,583) 264,798
(1) Recorded in interest within the consolidated statement of earnings (loss) and comprehensive income (loss). (2) Net change in unrealized gains (losses) on investments related to unrealized gains (losses) on investments held at the end of the reporting period.(3) In connection with the Transaction (see note 2), the company entered into related party guarantees with Fairfax (see note 13). The Atlas Mara Forward
Derivative and the Atlas Mara Facility Guarantee had fair values at initial recognition of $6,056 and $2,799 respectively. As the transactions were entered by Fairfax in its capacity as a shareholder, the benefit at inception was recorded in contributed surplus within common shareholders' equity (see note 9).
(4) Purchases in the first nine months of 2020 of $1,358 related to capitalized interest. (5) Purchases in the first nine months of 2020 included $175 related to capitalized interest. (6) Purchases in the first nine months of 2020 of $1,521 related to capitalized interest. (7) Purchases in the first nine months of 2020 of $5,107 related to capitalized interest. (8) Purchases in the first nine months of 2020 included $1,572 related to capitalized interest.
12

Public Portfolio Investments
The fair values of HFP's Public Portfolio Investments are determined using the bid prices of those investments (without adjustments or discounts) at the balance sheet date.
The changes in fair value of the company's Public Portfolio Investments for the third quarters and first nine months of 2021 and 2020 are presented in the tables disclosed earlier in note 6.
Investment in Atlas Mara Limited (Common Shares)
The company previously held Atlas Mara Limited ("Atlas Mara") common shares, which it sold to Fairfax on December 7, 2020 prior to closing of the Transaction, which is discussed in note 13.
Investment in Consolidated Infrastructure Group Limited (Common Shares)
Consolidated Infrastructure Group Limited ("CIG") is a Pan-African engineering infrastructure company previously listed on the Johannesburg Stock Exchange under the stock symbol CIL.
At September 30, 2021 and December 31, 2020 the company held 215,517,270 common shares of CIG, representing a 54.4% equity interest, which was acquired for net consideration of $49,881 (700.6 million South African rand). On November 9, 2020 CIG commenced voluntary business rescue proceedings which led to an application to voluntarily suspend trading of its shares on the Johannesburg Stock Exchange. On July 26, 2021 the common shares of CIG were delisted.
The company does not expect to recover any of its initial investment in the CIG common shares, which was written down to nil at December 31, 2020.
Investment in Other Common Shares
In the second quarter of 2020 the company acquired less than 5.0% of the common shares of public companies in various sectors, listed on the Johannesburg Stock Exchange, for aggregate cash consideration of $10,053 (185.3 million South African rand). In June 2021 the company received less than 5.0% of the common shares of Vivo Energy Plc ("Vivo"), a public company listed on the London Stock Exchange, as a distribution in specie from TopCo LP with an initial fair value of $5,812 (collectively, the "Other Common Shares"). Refer to the Private Portfolio Investments section under the heading Investment in TopCo LP later in note 6.
In the third quarter of 2021 the company sold an investment in Other Common Shares for total net proceeds of $7,433 (108.3 million South African rand), resulting in a realized gain of $3,579.
At September 30, 2021 the fair value of the company's investment in the Other Common Shares was $27,051 (December 31, 2020 - $14,836).
Private Portfolio Investments
The fair values of HFP's Private Portfolio Investments cannot be derived from an active market and accordingly, are determined using industry accepted valuation techniques and models. Market observable inputs are used where possible, with unobservable inputs used where necessary. Use of unobservable inputs can involve significant judgment and may materially affect the reported fair value of these investments.
The changes in fair value of the company's Private Portfolio Investments for the third quarters and first nine months of 2021 and 2020 are presented in the tables disclosed earlier in note 6.
Investment in TopCo LP
TopCo LP is a limited partnership established under the laws of Guernsey and is controlled by its general partner, HFA GP (Guernsey) Limited, an affiliate of the Helios Holdings Group. TopCo LP was formed as the investment vehicle through which HFP will receive cash flows from its entitlement to certain Helios fee streams. TopCo LP is the portfolio advisor of the company and its consolidated subsidiaries and has entered into a sub-advisory agreement with the Manager to provide the investment and advisory services to HFP. TopCo LP will earn investment advisory fees from HFP. Further details on the company's transactions with TopCo LP are discussed later in note 13.
13

Immediately prior to the closing of the Transaction, TopCo LP was admitted as a limited partner of the Carried Interest Recipients, defined below, entitling it to its share of the carried interest earned on Helios Funds by way of distributions arising from the Carried Interest Recipients. TopCo LP also entered into contractual arrangements with certain affiliates of the Helios Holdings Group, entitling it to the management fees earned on the Helios Funds.
On December 8, 2020, pursuant to the terms of the purchase and sale agreement entered into on July 10, 2020, HFP acquired all of the issued and outstanding TopCo LP Class A and Class B Limited Partnership Interests from HHL and Helios Holdings Partners Limited ("HHPL") for $88,465 and $186,834 respectively, in exchange for 25,452,865 multiple voting shares and 24,632,413 subordinate voting shares of HFP issued to HHL and HHPL, representing 45.9% of the equity and voting interest in HFP. Immediately following the closing of the Transaction, each of HHL and HHPL transferred the HFP shares to HFP Investment Holdings SARL ("Principal Holdco"), a Luxembourg holding company, indirectly owned by Tope Lawani and Babatunde Soyoye. HFP may not transfer or otherwise dispose of its TopCo LP Class A and Class B Limited Partnership Interests without consent from the general partner of TopCo LP. TopCo LP reports its financial performance in U.S. dollars.
TopCo LP Class A Limited Partnership Interest
TopCo LP is a limited partner of Helios Investors Genpar, L.P., HIP Equity II, L.P., HIP Equity III, L.P. and HIP Equity IV, L.P. (collectively, the “Carried Interest Recipients”) and as such is entitled to receive Carried Interest Proceeds. Carried Interest Proceeds include 25% of carried interest amounts generated by any existing fund managed by Helios or any of its affiliates, excluding Helios Investors IV, L.P.; and 50% of carried interest amounts generated by any future fund managed by Helios or any of its affiliates, including Helios Investors IV, L.P. HFP's TopCo LP Class A Limited Partnership Interest entitles HFP to receive the Carried Interest Proceeds received by TopCo LP when relevant amounts become available for distribution. The company may be subject to clawback obligations with respect to its TopCo LP Class A Limited Partnership Interest to the extent HFP has received Carried Interest Proceeds and a clawback is required. The risk is partially mitigated by escrow accounts required by each Helios Fund in accordance with their respective governing documents.
In September 2020 HHL, through its interest in Helios Investors Genpar, L.P, received carried interest as a distribution in specie from Helios Investors, L.P. ("Helios Fund I") in the form of Vivo common shares. On June 29, 2021 the company received Vivo common shares from HHL which reflected HFP’s pro rata share of Carried Interest Proceeds. Concurrent with the transaction, the company advanced $7,733 to HHL, and HHL and TopCo LP’s general partner agreed that HHL shall transfer $7,733 to TopCo LP for the benefit of the TopCo LP Class A Limited Partnership Interest holder. Prior to the distribution, the Carried Interest Proceeds arising from the Vivo common shares ($5,812) were included in the initial valuation of TopCo LP Class A Limited Partnership Interests at December 8, 2020 which reflected the fair value attributable to those common shares. Accordingly, on June 29, 2021 the company recorded: (i) Vivo common shares at an initial cost of $5,812; (ii) a return of capital of $5,812 on TopCo LP Class A Limited Partnership Interest; (iii) a net change in unrealized gain on Vivo common shares of $1,823 in the second quarter and first six months of 2021, partially offset by foreign exchange losses on Vivo common shares of $8 in the same periods; and (iv) a receivable from related parties of $7,733.
At September 30, 2021 the company estimated the fair value of its TopCo LP Class A Limited Partnership Interest using a discounted cash flow analysis based on multi-year free cash flow forecasts with assumed discount rates ranging from 22.4% to 28.4% (December 31, 2020 - 21.0% to 27.0%), target exit multiples of invested capital averaging 2.5x to 2.6x across Helios Fund II, Helios Fund III and Helios Fund IV (December 31, 2020 - 2.1x to 2.6x across all existing Helios funds), and forecasted exit dates ranging from 2021 to 2024 for Helios Fund II and Helios Fund III, and from 2022 to 2027 for Helios Fund IV (December 31, 2020 - 2021 to 2024 and 2022 to 2027). At September 30, 2021 free cash flow forecasts were based on estimates of Carried Interest Proceeds derived for each fund in accordance with waterfall provisions, prepared in the third quarter of 2021 by Helios' management (December 31, 2020 - fourth quarter of 2020).
The limited partnership agreement for each Helios Fund includes a distribution waterfall provision, which is common in private equity fund structures, and requires that proceeds (generated following realizations or partial realizations of the relevant fund’s investments or as other income becomes available to the relevant fund for distribution) are distributed in four stages: (i) a return of amounts contributed by investors and not previously repaid to those investors by the fund; (ii) an 8% preferred return to investors; (iii) a “catch-up” amount to the relevant Helios Holdings Group entity equal to 20% of all amounts distributed to all partners in excess of amounts distributed to limited partners to repay their drawn down capital contributions; and (iv) a split of all remaining profits between limited partners and the relevant Helios Holdings Group entity at an 80:20 ratio.
14

Free Cash Flow Forecast Inputs
The primary drivers of free cash flow estimates are the exit assumptions on Helios Funds' underlying portfolio investments, including the planned exit strategy, target exit multiples of invested capital and timing of exit. The target exit multiple of invested capital for an underlying portfolio investment is equal to the fund's expected total proceeds divided by the expected total cost from initial investment to exit. Carried Interest Proceeds which may arise in future Helios Funds have been excluded from free cash flow estimates. In the event that target exit timings are not met and delayed in future periods, this may result in a negative impact on the fair value of the company's TopCo LP Class A Limited Partnership Interest.
Current Model Assumptions
The following table describes the components of fair value, which include the Helios Funds and their underlying investments at June 30, 2021, and provides a summary of inputs used in the company's internal valuation model to estimate the fair value of the company's investment in the TopCo LP Class A Limited Partnership Interest at September 30, 2021:
Method of valuing underlying portfolio
investments Model inputs
Components of fair valueVintage
YearCommitted
CapitalTraded
share price
Internal valuation
modelTarget
exit year
Average target exit multiple of
invested capital
HFP's share of carried
interest
Fair value of carried interest
to HFP
Helios Investors II, L.P. ("Helios Fund II")(1) 2009 908,500 50.8 % 49.2 % 2022-2023 2.6x 25 % 34,811
Helios Investors III, L.P. ("Helios Fund III")(2) 2014 1,117,000 18.2 % 81.8 % 2021-2024 2.6x 25 % 54,118
Helios Investors IV, L.P. ("Helios Fund IV")(3) 2020 290,050 0.0 % 100.0 % 2022-2027 2.5x 50 % 460
89,389
(1) Helios Fund II is a private equity fund domiciled in the Cayman Islands that was formed in 2009 with the purpose of investing in companies that operate primarily in Africa. At June 30, 2021 the underlying portfolio investments in Helios Fund II were primarily comprised of investments in: (i) a public company operating in the fuel distribution sector across Africa (33.2% of portfolio); (ii) a private company offering electronic payment processing services in Nigeria (26.5% of portfolio); (iii) a public company operating in the telecommunication infrastructure sector across Africa (16.0% of portfolio); and (iv) a private company operating in the financial services sector across Africa (9.3% of portfolio).
(2) Helios Fund III is a private equity fund domiciled in the Cayman Islands that was formed in 2014 with the purpose of investing in companies that operate primarily in Africa. At June 30, 2021 the underlying portfolio investments in Helios Fund III were primarily comprised of investments in: (i) a private company operating in the financial services sector across Africa (18.9% of portfolio); (ii) a public company providing electronic payment processing services in Egypt (16.3% of portfolio); (iii) a private company operating in the gas distribution sector in Nigeria (12.8% of portfolio); (iv) a private company operating in the consumer goods sector across Africa (11.1% of portfolio; later exited in September 2021); (v) a private company that imports and distributes agricultural inputs across Africa (7.9% of portfolio); (vi) a private company that operates a liquefied natural gas terminal in Ghana (6.7% of portfolio); (vii) a private company operating in the agricultural sector in Egypt (4.6% of portfolio); and (viii) a private company that provides electronic payment processing services in Egypt (4.2% of portfolio).
(3) Helios Fund IV is a private equity fund domiciled in the Cayman Islands that was formed in 2020 with the purpose of investing in companies that operate primarily in Africa. At June 30, 2021 the underlying portfolio investments in Helios Fund IV were primarily comprised of investments in: (i) a private company operating in the consumer goods sector in Morocco (45.5% of portfolio); (ii) a private company that provides electronic payment processing services globally (including Africa) (37.4% of portfolio); and (iii) a private insurance company established in 2020 and expected to operate across Africa (17.1% of portfolio).
Discount rates were based on the company's assessment of risk premiums to the appropriate risk-free rate of the economic environment in which the Helios private equity funds operate. These risk premiums were reflective of the increased uncertainty of the free cash flow forecasts as a result of the economic and social impacts of the COVID-19 pandemic.
At September 30, 2021 the company's internal valuation model indicated that the fair value of its TopCo LP Class A Limited Partnership Interest was $89,389.
At December 31, 2020 the initial transaction price of the company's initial investment in the TopCo LP Class A Limited Partnership Interest on December 8, 2020 was considered to approximate fair value as there were no significant changes to TopCo LP's business, capital structure or operating environment and the key assumptions in the company's acquisition valuation model continued to be valid. At December 31, 2020 the fair value of the company's investment in TopCo LP Class A Limited Partnership Interest was $88,465.
TopCo LP Class B Limited Partnership Interest
TopCo LP entered into contractual arrangements with certain Helios Holdings Group entities, pursuant to which the Helios Holdings Group entities entitled to receive management fees assigned their respective rights to receive all management fees to TopCo LP and TopCo LP agreed to pay all expenses incurred in order to earn the management fees ("Excess Management Fees").
15

HFP's ownership of TopCo LP Class B Limited Partnership Interest entitles HFP to receive Excess Management Fees after a six-month holding period by TopCo LP. The initial six-month holding period ended June 30, 2021.
In the third quarter of 2021 the company recognized a distribution receivable from its TopCo LP Class B Limited Partnership Interest of $1,440, which reflected Excess Management Fees earned during the first six months of 2021. Accordingly, on September 30, 2021 the company recorded a reduction in the valuation of TopCo LP Class B Limited Partnership Interest and a receivable from related parties of $1,440.
At September 30, 2021 the company estimated the fair value of its TopCo LP Class B Limited Partnership Interest using a discounted cash flow analysis based on multi-year free cash flow forecasts with an assumed discount rate of 21.7%, a long term growth rate of 4.5% and a long term pre-tax profit margin of 52.2% (December 31, 2020 - discount rate of 19.3%, long term growth rate of 4.5% and long term pre-tax profit margin of 52.3%). At September 30, 2021 free cash flow forecasts were based on Excess Management Fee forecasts prepared in the fourth quarter of 2020 by Helios' management (December 31, 2020 - fourth quarter of 2020).
Free Cash Flow Forecast Inputs
The primary drivers of the free cash flow estimates are the forecasted growth in assets under management over eight years through the creation of new Helios private equity, infrastructure, and real estate funds, and the expected use of operating leverage to grow profit margins. Based on committed capital of the Helios Funds in place at the end of the fourth quarter of 2020 of approximately $2.3 billion (excluding Helios Fund I which is in the process of closing), the forecasted growth in assets under management implies a compound annual growth rate in committed capital of 18.7% over the eight year forecasting period. In the event that TopCo LP does not achieve its forecasted growth in assets under management in future periods, this may result in a negative impact on the fair value of the company's TopCo LP Class B Limited Partnership Interest.
Current Model Assumptions
As a result of the continued business disruptions caused by the COVID-19 pandemic, free cash flow forecasts reflected increased market volatility and government-mandated travel restrictions, which in the short term caused a delay in Helios' fundraising activities for Helios Fund IV. The development of these free cash flow forecasts was subject to a higher degree of estimation uncertainty that was primarily driven by a forecasting period of eight years, and forecasted growth in assets under management due to the expected demand for future Africa-focused alternative asset funds. A forecasting period of eight years was used due to the inherent long-term nature of Africa-focused private equity, infrastructure and real estate funds, which require additional time to fundraise, deploy capital and prepare investments for exit. These factors contributed to a higher degree of estimation uncertainty in the free cash flow estimates which was primarily reflected through higher discount rates and in the estimation of the long term pre-tax profit margin expected to be achieved at the end of the forecasting period.
The discount rate was based on the company's assessment of risk premiums to the appropriate risk-free rate of the economic environment in which the Helios Funds operate. These risk premiums were reflective of the increased uncertainty of free cash flow forecasts as a result of the economic and social impacts of the COVID-19 pandemic. Long term pre-tax profit margins were estimated based on comparable pre-tax management fee-related earnings margins of publicly listed global private equity asset managers. Long term growth rates were based on the expected long term sustainable growth rate of the economic environments in which TopCo LP conducts asset management activities. At September 30, 2021 the company's internal valuation model indicated that the fair value of its TopCo LP Class B Limited Partnership Interest was $164,334.
At December 31, 2020 the initial transaction price of the company's initial investment in the TopCo LP Class B Limited Partnership Interest on December 8, 2020 was considered to approximate fair value as there were no significant changes to TopCo LP's business, capital structure or operating environment and the key assumptions in the company's acquisition valuation model continued to be valid. At December 31, 2020 the fair value of the company's investment in TopCo LP Class B Limited Partnership Interest was $186,834.
Investment in Helios Investors IV, L.P.
Helios Investors IV, L.P. ("Helios Fund IV") is a limited partnership based in the Cayman Islands, structured to receive and deploy capital from limited partners with the objective of earning returns from investments directly or indirectly in, or with a nexus to, Africa. Helios Fund IV is controlled by its general partner, Helios Investors Genpar IV, Ltd. ("Helios Fund IV GP").
16

On March 31, 2021 the company committed to invest $50,000 in Helios Fund IV. At September 30, 2021 the company had funded aggregate capital calls of $21,897, plus equalization interest of $516, for total funding of $22,413, representing 17.2% of the limited partnership interest in Helios Fund IV. As agreed in a side letter with the Helios Fund IV GP, the company was admitted to Helios Fund IV as a "Listed Fund" under the terms of Helios Fund IV's limited partnership agreement, as amended and restated (the "Helios Fund IV LPA"), meaning that the company will not incur any management fees nor any carried interest payable to Helios Fund IV GP with respect to its investment in Helios Fund IV, which would otherwise be incurred in accordance with the Helios Fund IV LPA.
At September 30, 2021, the company estimated the fair value of its investment in Helios Fund IV Limited Partnership Interest to be $26,682 based on the June 30, 2021 net asset value provided by Helios Fund IV GP. The fair values of the underlying assets are determined using industry accepted valuation models for equity instruments.
At September 30, 2021 the company's remaining capital commitment to Helios Fund IV was $28,103, which may be called at any time by Helios Fund IV GP in accordance with the Helios Fund IV LPA.
Investment in NBA Africa
NBA Africa, LLC ("NBA Africa") is a new entity formed by the National Basketball Association ("NBA") to conduct the league's business in Africa including the Basketball Africa League, a partnership between the NBA and the International Basketball Federation.
In May 2021 the company formed a wholly-owned subsidiary, HFP US Investments, Inc. ("U.S. Sub"), for the sole purpose of investing in NBA Africa. On May 7, 2021 the company, through U.S. Sub, invested $30,000 in exchange for an equity interest in NBA Africa.
At September 30, 2021 the initial transaction price was considered to approximate fair value as there had been no significant changes to NBA Africa's business, capital structure, or operating environment and the key assumptions in the company's acquisition valuation model continued to be valid. At September 30, 2021 the fair value of the company's investment in NBA Africa was $30,000.
Investment in AGH
AFGRI Holdings Proprietary Limited ("AFGRI Holdings") is a private holding company based in South Africa that owns 100.0% of AFGRI Group Holdings Proprietary Limited ("AGH"), an investment holding company with interests in a number of agricultural and food-related companies providing products and services to ensure sustainable agriculture. AGH's core focus is grain commodities and it provides services across the entire grain production and storage cycle, offering financial support and solutions as well as high-tech equipment through the John Deere brand supported by a large retail footprint.
Indirect equity interest in AGH
At September 30, 2021 and December 31, 2020 the company had invested an aggregate of $98,876 in Joseph Holdings (comprised of 74.6% of the common shares and 73.7% of the Class A shares, providing a 74.6% voting interest; and a $10,132 shareholder loan). HFP is the largest beneficial shareholder of AGH, through its investment in Joseph Holdings, with a 46.8% indirect equity interest (December 31, 2020 - 46.8%).
On December 15, 2020 AFGRI Holdings and AGH entered into a standstill agreement with certain lenders (the "AGH standstill agreement") as a result of liquidity pressures arising from the trade volatility caused by the COVID-19 pandemic. The execution of the AGH standstill agreement was a key component of AGH's preliminary plan to restructure its balance sheet for the benefit of all stakeholders. On August 24, 2021 upon expiry of the AGH standstill agreement and concurrent with the execution of the AFGRI International Facility (defined below), AGH entered into a debt restructuring agreement with its lenders which formalized a monthly repayment plan to fully repay lenders by December 31, 2021 through monetization or sale of certain non-core assets.
At September 30, 2021 the company estimated the fair value of its indirect equity interest in AGH using a discounted cash flow analysis based on multi-year free cash flow forecasts with assumed after-tax discount rates ranging from 10.5% to 17.5% and a long term growth rate of 2.0% (December 31, 2020 - 9.3% to 21.2% and 2.5%). At September 30, 2021 free cash flow forecasts were based on EBITDA estimates derived from financial information for AGH's business units prepared in the second quarter of 2021 (December 31, 2020 - fourth quarter of 2020) by AGH's management.
17

Free Cash Flow Forecast Inputs
The primary driver of free cash flow estimates is EBITDA growth across AGH's major lines of business: the equipment, grain management, agribusiness finance, and food businesses in Philafrica, partially offset by corporate overhead costs.
Current Model Assumptions
Free cash flow forecasts were revised by AGH's management in the second quarter of 2021 primarily to reflect a decrease in forecasted corporate overhead costs related to the centralization of AGH's corporate function in connection with the debt restructuring. This was partially offset by lower free cash flow forecasts at Philafrica's animal feeds business which discontinued its plan to expand through vertical integration resulting in lower forecasted profit margins. The execution of AGH's debt restructuring agreement did not significantly impact the fair value of the company's indirect investment in AGH as the relevant features of the debt restructuring, such as the expected proceeds from monetizing and selling non-core assets and the associated increase in credit risk, were assessed in previous valuations.
Discount rates were based on the company's assessment of risk premiums to the appropriate risk-free rate of the economic environment in which AGH operates. These risk premiums were reflective of the increased uncertainty of the revised free cash flow forecasts as a result of the economic and social impacts of the COVID-19 pandemic, as well as the increased credit risk associated with AGH's plans to restructure its balance sheet. Long term growth rates were based on the expected long term sustainable growth rate of the economic environments and sectors in which AGH operates.
At September 30, 2021 the company's internal valuation model indicated that the fair value of its 46.8% indirect equity interest in AGH was $55,628 (December 31, 2020 - $64,210).
AFGRI International Facility
On August 20, 2021 the company entered into a secured lending arrangement with AFGRI International Proprietary Limited ("AFGRI International"), a wholly-owned South African subsidiary of AGH, pursuant to which the company agreed to provide up to $10,000 of financing (the "AFGRI International Facility"). The AFGRI International Facility is primarily secured by AFGRI International's pledge of its equity interests in its wholly-owned Australian equipment business, AFGRI Australia Proprietary Limited. The AFGRI International Facility bears interest at a rate of 12.75% per annum, accrued and capitalized quarterly. On August 26, 2021 the company advanced $9,600, net of $400 in raising fees, under the AFGRI International Facility. The AFGRI International Facility matures on August 26, 2022, one year from initial funding date.
At September 30, 2021 the company determined that the amortized cost of the AFGRI International Facility of $9,632 approximated fair value due to the short term nature of the investment.
In the third quarter and first nine months of 2021 the company recorded interest income of $257 in both periods within the consolidated statements of earnings (loss) and comprehensive income (loss) related to the AFGRI International Facility.
Investment in Philafrica Foods Proprietary Ltd.
Philafrica Foods Proprietary Ltd. ("Philafrica") is headquartered in South Africa, where it owns and operates maize mills, wheat mills, animal feed factories, snack production facilities, and bread production facilities. Philafrica has 15 production plants across the South African provinces of Gauteng, KwaZulu-Natal, Mpumalanga, Eastern Cape, Western Cape, and the Free State.
Philafrica Common Shares
At September 30, 2021 and December 31, 2020 the company had invested $23,254 (325.0 million South African rand) in 26,000 common shares of Philafrica, representing a 26.0% equity interest in Philafrica. A third party investor held a 14.0% equity interest and AGH controlled Philafrica through its 60.0% equity interest.
At September 30, 2021 the company estimated the fair value of its investment in Philafrica common shares using a discounted cash flow analysis based on multi-year free cash flow forecasts with assumed after-tax discount rates ranging from 13.9% to 15.8% and a long term growth rate of 2.0% (December 31, 2020 - 12.6% to 15.6% and 2.5%). At September 30, 2021 free cash flow projections were based on EBITDA estimates derived from financial information for Philafrica’s business units prepared in the second quarter of 2021 (December 31, 2020 - fourth quarter of 2020) by Philafrica’s management.
18

Free Cash Flow Forecast Inputs
The primary driver of free cash flow estimates is EBITDA growth at Philafrica's food businesses, partially offset by corporate overhead costs.
Current Model Assumptions
Free cash flow forecasts were revised by Philafrica's management in the second quarter of 2021 to primarily reflect a decrease in forecasted corporate overhead costs related to the centralization of Philafrica's corporate function. This was partially offset by lower free cash flow forecasts at Philafrica's animal feeds business which forecasted lower profit margins due to the discontinuation of expansion plans through vertical integration.
Discount rates were based on the company's assessment of risk premiums to the appropriate risk-free rate in the countries of Philafrica's operations. These risk premiums reflected increased uncertainty of the revised free cash flow forecasts as a result of the economic and social impacts of the COVID-19 pandemic, as well as the increased credit risk associated with debt restructuring plans at Philafrica's parent company, AGH. Long term growth rates were based on the expected long term sustainable growth rate of the economic environments and sectors in which Philafrica operates.
At September 30, 2021 the company's internal valuation model indicated that the fair value of its investment in Philafrica common shares was $8,261 (December 31, 2020 - $9,065) for the 26.0% equity interest.
Philafrica Facility
At September 30, 2021 and December 31, 2020 the company had advanced $5,622 (98.0 million South African rand), net of a 2.0% raising fee, to Philafrica under a secured lending arrangement (the "Philafrica Facility"). The Philafrica Facility bears interest at a rate of South African prime plus 2.0% per annum, which is accrued and capitalized monthly. The repayment of the Philafrica Facility is subordinated against other third party debt and is currently not repayable under its existing terms. The company continues to engage Philafrica and its lenders on the repayment of the Philafrica Facility. The Philafrica Facility is secured by a general guarantee from AGH and AGH's pledge of equity interests in Philafrica.
At September 30, 2021 the company estimated the fair value of its investment in the Philafrica Facility based on an expected recovery model with an expected recovery of 100.0% (December 31, 2020 - 100.0%). The expected recovery was supported by the value of the underlying guarantee and pledge from AGH.
At September 30, 2021 the company's internal valuation model indicated that the estimated fair value of its investment in the Philafrica Facility was $7,487 (December 31, 2020 - $7,164).
In the third quarter and first nine months of 2021 the company recorded interest income of $164 and $516 (2020 - $171 and $227) within the consolidated statements of earnings (loss) and comprehensive income (loss) related to the Philafrica Facility.
Indirect equity interest in Access Bank SA
GroCapital Holdings Limited ("GroCapital Holdings") is a bank holding company that owns 9.6% of Access Bank (South Africa) Limited ("Access Bank SA", formerly known as Grobank Limited ("Grobank")). Operating as a South African bank since 1947, Access Bank SA is focused on building on its established strengths in business and small medium enterprise banking, foreign exchange services, and alliance banking, as well as expanding Access Bank's footprint into South Africa.
On May 3, 2021 Access Bank Plc (“Access Bank”), a publicly listed Nigerian commercial bank, acquired a 90.4% equity interest in Grobank for 400.0 million South African rand ($27,787 at transaction date exchange rates). Upon closing of the transaction, GroCapital Holdings had a 9.6% equity interest in Grobank which was renamed Access Bank (South Africa) Limited.
At September 30, 2021 the company had invested an aggregate of $19,403 (285.7 million South African rand) for a 48.1% equity interest in GroCapital Holdings (December 31, 2020 - 48.1%). Through its investment in GroCapital Holdings, the company has a 4.6% indirect equity interest in Access Bank SA (December 31, 2020 - 48.1%).
At September 30, 2021 the company estimated the fair value of its indirect equity interest in Access Bank SA based on the transaction price implied by Access Bank's investment. At September 30, 2021 the fair value of the company's indirect equity interest in Access Bank SA was $1,366 (December 31, 2020 - $1,399) for the 48.1% equity interest.
19

Investment in Nova Pioneer Education Group
Nova Pioneer Education Group ("Nova Pioneer") is a Pan-African independent school network offering preschool through secondary education for students from ages 3 through 19. Nova Pioneer was started in 2013 with its first school opening in South Africa in 2015. Since then, Nova Pioneer has expanded across South Africa and launched its first campus in Kenya in 2016. Nova Pioneer operates thirteen schools with a combined enrollment of approximately 4,700 students. Nova Pioneer is wholly-owned by Ascendant Learning Limited ("Ascendant"), its Mauritius-based parent entity.
Indirect equity interest in Nova Pioneer
On July 1, 2021, Nova Pioneer redeemed the company's 20.0% Nova Pioneer debentures (the “Nova Pioneer Bonds”) with an aggregate fair value of $34,711 and settled interest accrued of $4,100 by issuing Ascendant common shares with a fair value of $38,811, representing a 56.3% equity interest in Ascendant (“Indirect equity interest in Nova Pioneer”). The company had invested an aggregate of $44,252 (inclusive of capitalized interest and accretion) in the Nova Pioneer Bonds, which was derecognized upon receipt of the Ascendant common shares. and The company recorded a realized loss of $9,541 on settlement of the Nova Pioneer Bonds and recorded the indirect equity interest in Nova Pioneer at its estimated fair value on the date of the transaction.
At September 30, 2021 the company held a 56.3% indirect equity interest in Nova Pioneer and no longer holds any Nova Pioneer Bonds or Warrants.
At September 30, 2021 the initial transaction price for the company's indirect equity interest in Nova Pioneer was considered to approximate fair value as there were no significant changes to its investment in Nova Pioneer's business, capital structure, and operating environment, and the key assumptions in the company's acquisition valuation model continue to be valid. At September 30, 2021 the company's internal valuation model indicated that the fair value of the company's indirect equity interest in Nova Pioneer was $38,811.
Nova Pioneer Bonds and Warrants
At December 31, 2020 the company had invested an aggregate of $45,539 in Nova Pioneer, which consisted of (i) $44,252 in Nova Pioneer Bonds (inclusive of capitalized interest and accretion) and (ii) $1,287 in 3,400,000 warrants with an exercise price of $2.06 per share (the "Nova Pioneer Warrants").
At December 31, 2020 the company estimated the fair value of its investment in the Nova Pioneer Bonds using an industry accepted discounted cash flow and option pricing model that incorporated Nova Pioneer's estimated credit spread of 28.2%. The estimated credit spread was based on the credit spreads of a peer group of comparable companies adjusted for credit risk specific to Ascendant given the deterioration of liquidity as a result of COVID-19 school closures. The company updated its assessment of the Nova Pioneer Bonds’ credit quality in the fourth quarter of 2020 which resulted in a significant increase in estimated credit spread. At December 31, 2020 the company's internal valuation model indicated that the estimated fair value of the investment in Nova Pioneer Bonds was $36,421.
In the third quarter and first nine months of 2021 the company recorded interest income of nil and a write-down of interest receivable of $202 (2020 - interest income of $2,324 and $6,639) within the consolidated statements of earnings (loss) and comprehensive income (loss) related to the Nova Pioneer Bonds.
The company does not expect to recover any of its initial investment in the Nova Pioneer Warrants which were written down to nil at December 31, 2020.
Investment in Atlas Mara Limited (Debt Instruments)
Atlas Mara is a Sub-Saharan African financial services group listed on the London Stock Exchange under the symbol ATMA. Since its inception, Atlas Mara has acquired control or significant influence in banks across seven Sub-Saharan African countries: Nigeria, Botswana, Zimbabwe, Mozambique, Rwanda, Tanzania and Zambia. During 2021 Atlas Mara sold its banking operations in Mozambique, Rwanda, and Botswana.
The company's investment in Atlas Mara is comprised of debt instruments classified as Level 3 in the fair value hierarchy. The Atlas Mara debt instruments discussed below are not rated.
20

On December 28, 2020 Atlas Mara entered into a standstill agreement with its lenders, (the "Atlas Mara standstill agreement"), as a result of continued liquidity pressures facing its African banks, partially due to the COVID-19 pandemic. On July 14, 2021 Atlas Mara and certain of its affiliates entered into a support and override agreement (the "Atlas Mara SOA") with its lenders which formalized plans to repay its outstanding debt obligations through orderly dispositions of certain of its underlying businesses. The key features of the Atlas Mara SOA were as follows:
(i) The Atlas Mara SOA formalizes the waterfall allocation to the lenders of proceeds from the orderly dispositions of certain of Atlas Mara's underlying businesses;
(ii) Certain of Atlas Mara's lenders, including HFP, agreed to grant a forbearance with respect to the maturities of their outstanding debts; and
(iii) For those lenders whose financing documents provide for an increase in the underlying interest rate as a result of default, event of default or other similar event, these lenders are entitled to additional default interest in accordance with those provisions effective December 28, 2020.
The company continues to be engaged with Atlas Mara and its lenders in formalizing the terms and extension of the Atlas Mara SOA including forbearance with respect to the maturities of Atlas Mara's outstanding debts beyond September 30, 2021.
The execution of the Atlas Mara standstill agreement and the Atlas Mara SOA were key components of Atlas Mara's plan to repay its outstanding debt obligations through orderly dispositions of certain of its underlying businesses. The expected proceeds from the proposed dispositions and the duration and outcome of negotiations with other lenders have increased risk of recovery, which has been reflected in the valuation of the Atlas Mara 11.0% Convertible Bonds (defined below) and the Atlas Mara 7.5% Bonds (defined below) (collectively, the "Atlas Mara Bonds") and the Atlas Mara Facility (defined below). As a result of the Atlas Mara standstill agreement and restructuring plan, the company changed its valuation technique to an expected recovery model in the fourth quarter of 2020 and has not accrued interest on the Atlas Mara Bonds or Atlas Mara Facility after December 28, 2020.
Atlas Mara 11.0% Convertible Bonds
At September 30, 2021 and December 31, 2020 the company had invested $16,000 in Atlas Mara convertible bonds. The bonds have a stated coupon of 11.0% per annum, accrued quarterly and payable in kind ("Atlas Mara 11.0% Convertible Bonds").
At September 30, 2021 the company estimated the fair value of its investment in the Atlas Mara 11.0% Convertible Bonds based on an expected recovery model with an estimated expected recovery of nil (December 31, 2020 - 12.2%). The expected recovery reflected the value of expected proceeds from Atlas Mara's planned asset disposals less expected repayments to higher-ranking and secured lenders as the Atlas Mara 11.0% Convertible Bonds are unsecured. At September 30, 2021 the company's internal valuation model indicated that the estimated fair value of its investment in the Atlas Mara 11.0% Convertible Bonds was nil (December 31, 2020 - $2,442).
Atlas Mara 7.5% Bonds
At September 30, 2021 and December 31, 2020 the company had invested $20,000 in Atlas Mara bonds and 6,200,000 Atlas Mara Warrants. The bonds have a stated coupon of 7.5% per annum, payable semi-annually ("Atlas Mara 7.5% Bonds"). The Atlas Mara 7.5% Bonds are secured by Atlas Mara's shares in Union Bank of Nigeria ("UBN").
At September 30, 2021, interest receivable of $2,832 on the Atlas Mara 7.5% Bonds reflects the same expected recovery as the principal.
At September 30, 2021 the company estimated the fair value of its investment in Atlas Mara 7.5% Bonds based on an expected recovery model with an estimated expected recovery of 99.5% (December 31, 2020 - 99.8%) of principal and interest. The expected recovery reflected the value of expected proceeds from Atlas Mara's planned asset disposals. At September 30, 2021 the company's internal valuation model indicated that the estimated fair value of its investment in the Atlas Mara 7.5% Bonds was $19,894 (December 31, 2020 - $19,966).
The company does not expect to recover any of its initial investment in the Atlas Mara Warrants which were written down to nil at December 31, 2020.
Atlas Mara Facility
At September 30, 2021 and December 31, 2020 the company had advanced $39,507, net of $493 in raising fees, under the terms of a secured lending arrangement with Atlas Mara (the "Atlas Mara Facility"). The Atlas Mara Facility has a stated coupon of 10.0%
21

per annum plus default interest of 7.5%, accrued quarterly and payable in kind. The Atlas Mara Facility was secured by Atlas Mara's shares in African Banking Corporation Botswana Limited ("Atlas Mara Botswana"), which were subsequently released in October 2021 upon sale to Access Bank.
At September 30, 2021 the company estimated the fair value of its investment in the Atlas Mara Facility based on an expected recovery model with an estimated expected recovery of 40.7% (December 31, 2020 - 71.3%). The expected recovery reflected the value of expected proceeds from Atlas Mara's planned asset disposals. At September 30, 2021 the company's internal valuation model indicated that the estimated fair value of its investment in the Atlas Mara Facility was $17,351 (December 31, 2020 - $30,346).
In the third quarter and first nine months of 2021 the company recorded interest income of nil in both periods (2020 - $1,739 and $4,642) within the consolidated statements of earnings (loss) and comprehensive income (loss) related to the Atlas Mara Bonds and the Atlas Mara Facility.
Atlas Mara Facility Guarantee
On July 10, 2020 in connection with the Transaction (see note 2), the company entered into an agreement with Fairfax whereby Fairfax guaranteed all principal and interest obligations of Atlas Mara under the Atlas Mara Facility, giving rise to a guarantee (the "Atlas Mara Facility Guarantee"), which was recorded in derivatives and guarantees within the consolidated balance sheet.
At inception, the difference of $2,799 between the fair value and transaction price of the Atlas Mara Facility Guarantee was recorded in contributed surplus within common shareholders’ equity. At September 30, 2021 the company estimated the fair value of the Atlas Mara Facility Guarantee using the fair value at that date of the Atlas Mara Facility compared to the present value of the interest and repayment obligations of the Atlas Mara Facility guaranteed by Fairfax, discounted using observable default spreads specific to Fairfax.
In the first nine months of 2021, as a result of the anticipated extension of the maturity of the Atlas Mara Facility to December 31, 2021 and the inclusion of 7.5% default interest effective December 28, 2020, the company recorded a net change in unrealized gain on the Atlas Mara Facility Guarantee of $19,901. At September 30, 2021 the company's internal valuation model indicated that the estimated fair value of its investment in the Atlas Mara Facility Guarantee was $33,153.
Subsequent to September 30, 2021
In October 2021 Atlas Mara completed the sale of its equity interest in Atlas Mara Botswana to Access Bank, a portion of which was pledged as security for the Atlas Mara Facility and subsequently released by the company in connection with the aforementioned sale. The proceeds from the sale to be paid in three tranches: (i) an upfront portion due on closing; (ii) a portion due no later than April 2022; and (iii) deferred consideration due two years from the date of closing. On October 14, 2021 upon Atlas Mara receiving the upfront portion of proceeds from the sale, the company received partial repayment on the Atlas Mara Facility of $11,325. Pursuant to the Atlas Mara SOA the company expects further repayments on the Atlas Mara Facility as Atlas Mara receives the remaining two tranches of proceeds from the sale.
Investment in Consolidated Infrastructure Group Limited (Debt Instrument)
CIG is a Pan-African engineering infrastructure company previously listed on the Johannesburg Stock Exchange under the stock symbol CIL. CIG has a diversified portfolio of operations including services and materials in power and electrical, waste management of oil and gas, building materials and the railway sector, with a footprint that spans over 20 African countries and the Middle East.
At September 30, 2021 and December 31, 2020 the company had advanced $23,270 (292.5 million South African rand), net of a 2.5% raising fee to CIG (the "CIG Loan"). The CIG Loan bears interest at South African prime plus 2.0% per annum and has a maturity date of June 4, 2023. The CIG Loan is secured by CIG's pledge of its equity interests in Conlog Proprietary Limited ("Conlog"), a wholly-owned subsidiary of CIG that provides metering solutions to utilities, municipalities and property management companies in South Africa, the Middle East and across Africa. The CIG Loan is not rated.
In June 2020 due to the impacts of COVID-19, the company allowed CIG to defer interest payments due June 4, 2020 and going forward. At September 30, 2021, interest receivable of $1,206 on the CIG Loan is expected to be received upon the sale of CIG's equity interest in Conlog.
22

At September 30, 2021 the company estimated the fair value of its investment in the CIG Loan using an expected recovery model with an estimated expected recovery of 100.0%. The expected recovery reflected the estimated value of expected proceeds from the sale of CIG's equity interest in Conlog, which is pledged as collateral for the CIG Loan. It is expected that CIG will sell its equity interest in Conlog in the first quarter of 2022 through an orderly sale process. Accordingly, the company determined that an expected recovery model was the most appropriate valuation technique and the company has not accrued interest on the CIG Loan after December 31, 2020.
At December 31, 2020 the company estimated the fair value of its investment in the CIG Loan using an industry accepted discounted cash flow and option pricing model that incorporated the security's estimated credit spread of 7.9%. The estimated credit spread was based on a peer group of comparable companies adjusted for credit risk specific to CIG. On November 9, 2020 CIG commenced voluntary business rescue proceedings. This did not significantly impact the fair value of the CIG Loan at December 31, 2020 as the Conlog shares pledged as collateral continued to support full recovery of the CIG Loan.
At September 30, 2021 the company's internal valuation model indicated that the estimated fair value of its investment in the CIG Loan was $19,940 (December 31, 2020 - $19,254).
In the third quarter and first nine months of 2021 the company recorded interest income of nil in both periods (2020 - $438 and $1,462) within the consolidated statements of earnings (loss) and comprehensive income (loss) related to the CIG Loan.
Investment in the PGR2 Loan (Debt Instrument)
At September 30, 2021 and December 31, 2020 in conjunction with the CIG Loan, the company had advanced $19,969 (260.0 million South African rand) to PGR2 Investments Proprietary Limited ("PGR2"), the largest shareholder of CIG at the time of the transaction (the "PGR2 Loan"). The PGR2 Loan was partially secured by common shares of CIG held by PGR2 and associated parties. The PGR2 Loan had a coupon of 15.0% per annum, payable semi-annually in cash or in kind at PGR2's option, with a maturity date of May 24, 2021.
As a result of the significant and prolonged decline in the fair value of CIG common shares pledged as security for the PGR2 Loan, the company does not expect to recover any of its initial investment in the PGR2 Loan, which was written down to nil at December 31, 2020.
In the third quarter and first nine months of 2020 the company recorded interest income reversal of $200 and interest income of $1,118 within the consolidated statements of earnings (loss) and comprehensive income (loss) related to the PGR2 Loan.
23

7. Cash and Investments
Fair Value Disclosures
The company’s use of quoted market prices (Level 1), valuation models using observable market information as inputs (Level 2) and valuation models without observable market information as inputs (Level 3) in the valuation of securities by type of issuer was as follows:
September 30, 2021 December 31, 2020
Quoted prices
(Level 1)
Significant other
observable inputs
(Level 2)
Significant unobservable
inputs(Level 3)
Total fair value
of assets
Quoted prices
(Level 1)
Significant other
observable inputs
(Level 2)
Significant unobservable
inputs(Level 3)
Total fair value
of assetsCash and cash equivalents 80,719 — — 80,719 66,052 — — 66,052 Restricted cash deposits — — — — 7,525 — — 7,525
80,719 — — 80,719 73,577 — — 73,577
Term deposits(1) — 12,392 — 12,392 — 12,392 — 12,392
Limited partnership investments:TopCo LP Class A Limited Partnership Interest — — 89,389 89,389 — — 88,465 88,465 TopCo LP Class B Limited Partnership Interest — — 164,334 164,334 — — 186,834 186,834 Helios Fund IV Limited Partnership Interest — — 26,682 26,682 — — — —
— — 280,405 280,405 — — 275,299 275,299
Common shares: Other Common Shares 27,051 — — 27,051 14,836 — — 14,836 NBA Africa common shares — — 30,000 30,000 — — — — Indirect equity interest in AGH — — 55,628 55,628 — — 64,210 64,210 Philafrica common shares — — 8,261 8,261 — — 9,065 9,065 Indirect equity interest in Access Bank SA — — 1,366 1,366 — — 1,399 1,399 Indirect equity interest in Nova Pioneer — — 38,811 38,811 — — — —
27,051 — 134,066 161,117 14,836 — 74,674 89,510
Loans:CIG Loan — — 19,940 19,940 — — 19,254 19,254 Atlas Mara Facility — — 17,351 17,351 — — 30,346 30,346 Philafrica Facility — — 7,487 7,487 — — 7,164 7,164 AFGRI International Facility — — 9,632 9,632 — — — — Fairfax Loan — — 19,558 19,558 — — 19,411 19,411
— — 73,968 73,968 — — 76,175 76,175
Bonds: Atlas Mara 11.0% Convertible Bonds — — — — — — 2,442 2,442 Atlas Mara 7.5% Bonds — — 19,894 19,894 — — 19,966 19,966 Nova Pioneer Bonds — — — — — — 36,421 36,421
— — 19,894 19,894 — — 58,829 58,829
Derivatives:
Atlas Mara Facility Guarantee — — 33,153 33,153 — — 13,252 13,252
HFP Redemption Derivative (2) — — 17,699 17,699 — — — — — — 50,852 50,852 — — 13,252 13,252
Total cash and investments 107,770 12,392 559,185 679,347 88,413 12,392 498,229 599,034
15.9% 1.8 % 82.3 % 100.0 % 14.8 % 2.0 % 83.2 % 100.0 %
(1) Cash placed on deposit with Atlas Mara Zambia and supported by collateral held for the benefit of the company (see note 13).(2) Relates to the issuance of the HFP Host Debentures and HFP Warrants and the HFP Redemption Derivative (see note 13). At inception, the difference of
$18,107 between the total net fair value of the financial instruments issued and received ($81,893) and the transaction amount ($100,000) was recorded in contributed surplus within common shareholders' equity.
24

Transfers between fair value hierarchy levels are considered effective from the beginning of the reporting period in which the transfer is identified. During the first nine months of 2021 there were no transfers of financial instruments between Level 1 and Level 2 and there were no transfers of financial instruments into or out of Level 3 as a result of changes in the observability of valuation inputs. The changes in fair value of the company's Private Portfolio Investments (classified as Level 3) are disclosed in note 6.
The table that follows illustrates the potential impact on net earnings (loss) of various combinations of changes in unobservable inputs in the company's internal valuation model for its financial instruments classified as Level 3 at September 30, 2021. The analysis assumes quarterly variations within a reasonably possible range determined by the company based on analysis of the return on various equity indices, management's knowledge of the applicable equity markets and the potential impact of changes in interest rates. The reasonably possible ranges of after-tax discount rates and discount rates reflect increased market volatility due to the economic and social impacts of the COVID-19 pandemic. The range also reflects the additional uncertainty in determining recoverability and the discounted cash flows for assessing the fair values of Private Portfolio Investments.
Investments
Fair value of
Investment Valuation techniqueSignificant unobservable
inputs
Significant unobservable inputs used in the internal
valuation models
Hypothetical $ change effect on
fair value measurement(1)
Hypothetical $ change effect on net earnings (loss) (1)(2)
Limited partnership investments:
TopCo LP Class A Limited Partnership Interest $89,389 Discounted cash flow
Discount rate 22.4% to 28.4% (975) / 997 (846) / 865
Exit multiple of invested capital (3) 2.5x to 2.6x 6,027 / (6,805) 5,229 / (5,904)
TopCo LP Class B Limited Partnership Interest $164,334 Discounted cash flow
Discount rate 21.7% (11,422) / 12,922 (9,908) / 11,210
Growth in assets under management 18.7% 14,505/(14,505) 12,583/(12,583)
Long term pre-tax profit margin 52.2% 1,473 / (1,473) 1,278 / (1,278)
Long term growth rate 4.5% 1,322/(1,284) 1,147/(1,114)
Common shares:
Indirect equity interest in AGH $55,628 Discounted cash flow After-tax discount rate 10.5% to 17.5% (8,682) / 10,769 (7,532) / 9,342
Long term growth rate 2.0% 1,693 / (1,607) 1,468 / (1,394)
Philafrica $8,261 Discounted cash flow After-tax discount rate 13.9% to 15.8% (1,729) / 2,029 (1,500) / 1,760
Long term growth rate 2.0% 295 / (284) 256 / (246)
Derivatives:
HFP Redemption Derivative $17,699 Discounted cash flow and option pricing model
Total fair value of the Reference Investments $71,376 7,138 / (7,138) 6,192 / (6,192)
(1) The impact on the internal valuation models from changes in significant unobservable inputs deemed to be subject to the most judgment and estimates disclosed in the above table shows the hypothetical increase (decrease) in net earnings. Changes in the after-tax discount rates (100 basis points), discount rates (100 basis points), long term growth rates (25 basis points), exit multiple of invested capital (5.0%), growth in assets under management (implied compound annual growth rates in committed capital of 17.9% and 19.4%), long term pre-tax profit margin (100 basis points), and the total fair value of the Reference Investments (10.0% of the total fair value) each in isolation, would hypothetically change the fair value of the company's investments as noted in the table above. Generally, an increase (decrease) in exit multiples of invested capital, growth in assets under management, long term pre-tax profit margin, and long term growth rates, or a decrease (increase) in after-tax discount rates, discount rates and total fair value of the Reference Investments would result in a higher (lower) fair value of the company’s investments classified as Level 3 in the fair value hierarchy. After-tax discount rates and discount rates are subject to a mitigating factor: increases (decreases) in after-tax discount rates and discount rates tend to be accompanied by increases (decreases) in free cash flows that may offset changes in fair value resulting from changes in after-tax discount rates and discount rates. Exit multiples of invested capital and growth in assets under management are subject to a mitigating factor: increases (decreases) in exit multiples of invested capital and growth in assets under management tend to be accompanied by increases (decreases) in discount rates that may offset changes in fair value resulting from changes in exit multiples of invested capital and growth in assets under management.
(2) For the purpose of this sensitivity analysis, the hypothetical $ change effect on net earnings (loss) includes an income tax impact that is calculated using the company’s marginal tax rate. Actual income tax expense (recovery) may differ significantly when earnings (losses) are realized.
(3) Target exit dates are a significant unobservable input and changes in target exit dates would hypothetically change the fair value of the company's investment in TopCo LP Class A Limited Partnership Interest. Target exit dates are subject to a mitigating factor: later (earlier) target exit dates tend to be accompanied by increases (decreases) in exit multiples of invested capital that may offset changes in fair value resulting from changes in target exit dates.
25

The table that follows illustrates the potential impact on net earnings (loss) of changes in expected recovery rates derived from collateral value and expected timing and proceeds from planned asset sales in the company’s expected recovery model for financial instruments classified as Level 3 at September 30, 2021. The analysis assumes quarterly variations within a reasonably possible range determined by the company based on analysis of the underlying assets.
Investments Fair value of Investment
Expected recovery used in the internal valuation
models
Hypothetical $ change effect on fair value
measurement(1)
Hypothetical $ change effect on net earnings
(loss) (1)(2)
Loans:
CIG Loan $19,940 100.0% - / (997) - / (865)
Atlas Mara Facility(3) $17,351 40.7% 2,219 / (2,219) 1,565 / (1,565)
Philafrica Facility $7,487 100.0% - / (374) - / (325)
Bonds:
Atlas Mara 11.0% Convertible Bonds — 0.0% 999 / - 735 / -
Atlas Mara 7.5% Bonds $19,894 99.5% 106 / (1,000) 78 / (735)
(1) The above table demonstrates the hypothetical increase (decrease) in net earnings from changes in the expected recovery rates disclosed. Changes in expected recovery rates (5.0%, to a maximum of 100.0% expected recovery and a minimum of nil expected recovery) would hypothetically change the fair value of the company's investments as noted in the table above. An increase (decrease) in expected recovery rates would result in a higher (lower) fair value of the company's Private Portfolio Investments classified as Level 3 in the fair value hierarchy.
(2) For the purpose of this sensitivity analysis, the hypothetical $ change effect on net earnings (loss) includes an income tax impact that is calculated using the company’s marginal tax rate. Actual income tax expense (recovery) may differ significantly when earnings (losses) are realized.
(3) A hypothetical increase (decrease) in the expected recovery of the Atlas Mara Facility would result in a commensurate decrease (increase) in fair value of the Atlas Mara Facility Guarantee, which had a fair value of $33,153 at September 30, 2021.
The company's investments in Helios Fund IV Limited Partnership Interest, NBA Africa common shares, AFGRI International Facility, indirect equity interest in Nova Pioneer, and indirect equity interest in Access Bank SA are excluded from this sensitivity analysis as the company determined that there were no significant unobservable inputs suited for a sensitivity analysis for these investments. Investment Income
An analysis of investment income for the three and nine months ended September 30 is summarized in the table that follows:Third quarter First nine months
2021 2020 2021 2020
Interest:
Cash and cash equivalents 125 63 180 665
Restricted cash deposits — 66 152 448
Term deposits 130 135 388 135
Short term investments - U.S. treasuries — — — 403
Loans 486 1,548 964 4,584
Bonds — 2,924 (202) 9,504
741 4,736 1,482 15,739
Dividends: Common shares 178 15 345 15
26
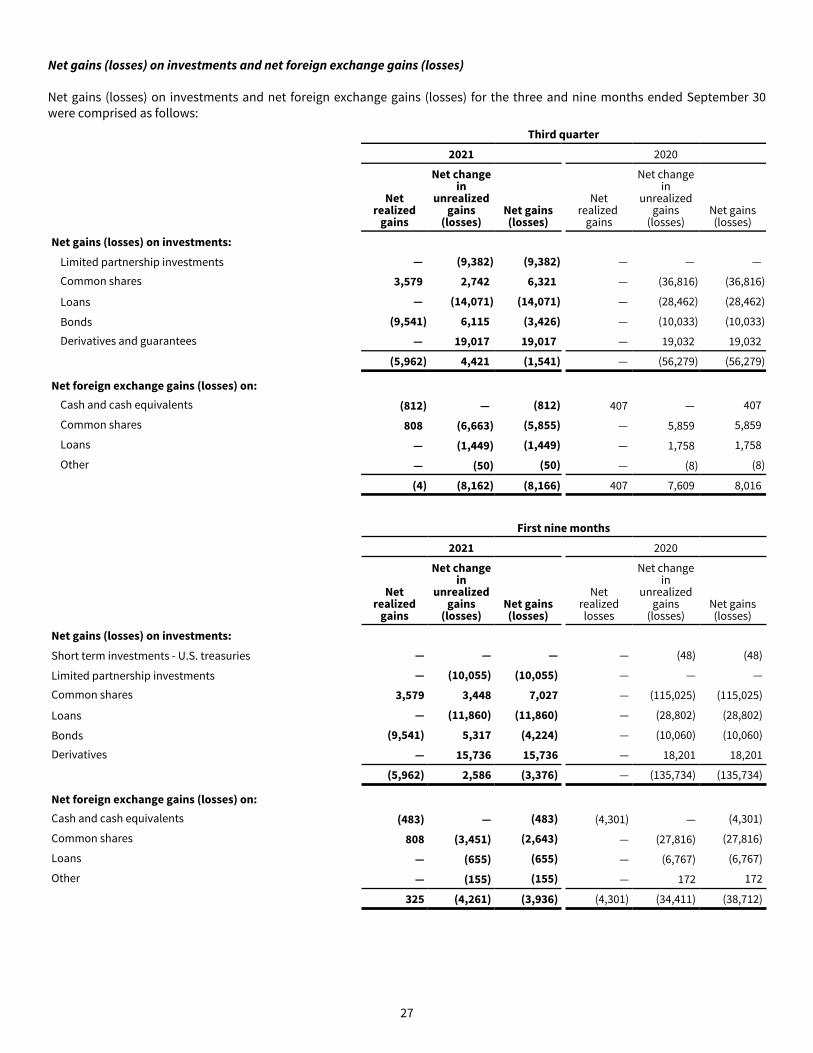
Net gains (losses) on investments and net foreign exchange gains (losses)
Net gains (losses) on investments and net foreign exchange gains (losses) for the three and nine months ended September 30 were comprised as follows:
Third quarter
2021 2020
Net realized
gains
Net change in
unrealized gains
(losses)Net gains (losses)
Net realized
gains
Net change in
unrealized gains
(losses)Net gains (losses)
Net gains (losses) on investments:
Limited partnership investments — (9,382) (9,382) — — —
Common shares 3,579 2,742 6,321 — (36,816) (36,816)
Loans — (14,071) (14,071) — (28,462) (28,462)
Bonds (9,541) 6,115 (3,426) — (10,033) (10,033)
Derivatives and guarantees — 19,017 19,017 — 19,032 19,032
(5,962) 4,421 (1,541) — (56,279) (56,279)
Net foreign exchange gains (losses) on:Cash and cash equivalents (812) — (812) 407 — 407
Common shares 808 (6,663) (5,855) — 5,859 5,859
Loans — (1,449) (1,449) — 1,758 1,758
Other — (50) (50) — (8) (8)
(4) (8,162) (8,166) 407 7,609 8,016
First nine months
2021 2020
Net realized
gains
Net change in
unrealized gains
(losses)Net gains (losses)
Net realized losses
Net change in
unrealized gains
(losses)Net gains (losses)
Net gains (losses) on investments:
Short term investments - U.S. treasuries — — — — (48) (48)
Limited partnership investments — (10,055) (10,055) — — —
Common shares 3,579 3,448 7,027 — (115,025) (115,025)
Loans — (11,860) (11,860) — (28,802) (28,802)
Bonds (9,541) 5,317 (4,224) — (10,060) (10,060)
Derivatives — 15,736 15,736 — 18,201 18,201
(5,962) 2,586 (3,376) — (135,734) (135,734)
Net foreign exchange gains (losses) on:Cash and cash equivalents (483) — (483) (4,301) — (4,301)
Common shares 808 (3,451) (2,643) — (27,816) (27,816)
Loans — (655) (655) — (6,767) (6,767)
Other — (155) (155) — 172 172
325 (4,261) (3,936) (4,301) (34,411) (38,712)
27

8. Borrowings September 30, 2021
Principal Carrying value Fair valueHFP 3.0% Debentures (host instrument) due March 31, 2024(1) 100,000 98,487 94,106
(1) Redeemable on either of the first two anniversary dates, at the option of Fairfax.
HFP 3.0% Debentures
On March 31, 2021, Fairfax, through its affiliates, invested $100,000 in 3.0% unsecured debentures of HFP (the "HFP 3.0% Debentures") and 3,000,000 warrants (the "HFP Warrants"). The Warrants are exercisable for one subordinate voting share of HFP, have an exercise price of $4.90 and are exercisable at any time prior to March 31, 2026. The HFP Warrants include anti-dilution features, which may increase or decrease the total number of subordinate voting shares issuable per HFP Warrant, in the event that certain share transactions are undertaken by the company which may increase or decrease the company’s outstanding subordinate voting shares. The net proceeds from the HFP 3.0% Debentures will be used primarily to invest in Portfolio Investments. The HFP 3.0% Debentures mature on March 31, 2024 or, at the option of Fairfax, on either of the first two anniversary dates. At maturity or on redemption by Fairfax, the principal amount to be repaid will be adjusted for the amount, if any, by which the aggregate fair value of the company’s investments in AGH (indirect via Joseph Holdings), Philafrica common shares, the Philafrica Facility, and the PGR2 Loan (collectively, the "Reference Investments") is lower than $102,600.
The company determined that the variability of cash flows arising from the redemption price, either on maturity or upon Fairfax's exercise of its put option, held economic characteristics and risks which were not closely related to the debt instrument and reflected those of a separate derivative financial instrument. Furthermore, Fairfax's put option and the adjustment to the redemption amount are both linked to the Reference Investments, and the exercise of Fairfax's put option and the adjustment to the redemption amount are not mutually exclusive. Accordingly, at inception, the company recorded the embedded derivative, inclusive of Fairfax's put option (the "HFP Redemption Derivative"), in derivatives and guarantees within the consolidated balance sheet, separately from the host debt instrument (the "HFP Host Debentures") recorded in borrowings within the consolidated balance sheet. The company did not elect to irrevocably designate the entire hybrid contract as measured at fair value through profit or loss.
At inception the company estimated the fair value of the HFP Host Debentures using a discounted cash flow analysis that incorporated HFP’s estimated credit spread of 3.3%. The estimated credit spread was based on the credit spreads of a peer group of companies adjusted for credit risk specific to HFP. At inception the company's internal valuation model indicated that the fair value of the HFP Host Debentures was $98,200 which was recorded in borrowings within the consolidated balance sheet. The HFP Host Debentures are carried at amortized cost.
At September 30, 2021 and at inception on March 31, 2021, the company estimated the fair value of the HFP Redemption Derivative using a discounted cash flow and option pricing model, which included the total fair value of the Reference Investments of $71,376 (March 31, 2021 - $74,808) and assumed historical share price volatilities ranging from 30.7% to 34.4% (March 31, 2021 - 34.2% to 38.1%). At September 30, 2021 the company’s internal valuation model indicated that the fair value of the HFP Redemption Derivative was $17,699 (March 31, 2021 - $21,864) which was recorded in derivatives and guarantees within the consolidated balance sheet.
At inception, the company estimated the fair value of the HFP Warrants using an industry accepted option pricing model that included HFP's underlying share price of $4.56, exercise price of $4.90, historical volatility of 48.5%, exercise period of five years, no expected dividends, and risk-free rate of 1.0%. At inception, the company determined that the fair value of the HFP Warrants issued was $5,557 which was recorded in warrants within common shareholders' equity.
The transaction was executed with Fairfax in its capacity as a shareholder of HFP and as such, at inception, the difference of $18,107 between the total net fair value of the financial instruments issued and received ($81,893) and the transaction amount ($100,000) was recorded in contributed surplus within common shareholders' equity.
Revolving Credit Facilities
On December 20, 2019 the company entered into an $80,000 secured, revolving demand credit facility with a syndicate of Canadian lenders, bearing interest at a rate of LIBOR plus 450 basis points (the "Credit Facility"). On December 20, 2020 the Credit Facility matured and was not renewed.
28

Interest Expense
In the third quarter and first nine months of 2021 the company recorded interest expense of $900 and $1,799 related to interest on the HFP 3.0% Debentures (2020 - $201 and $599 comprised of amortization of issuance costs).
9. Common Shareholders' Equity
Common stock
The number of shares outstanding was as follows:
2021 2020Subordinate voting shares - January 1 53,665,388 29,496,481
Purchases for cancellation (10,647) (463,506) Subordinate voting shares - September 30 53,654,741 29,032,975 Multiple voting shares - beginning and end of period 55,452,865 30,000,000 Common shares effectively outstanding - September 30 109,107,606 59,032,975
Capital Transactions
On December 4, 2020, shareholders of HFP approved an amendment to the company’s articles to permit, among other things, the issuance of an unlimited number of multiple voting shares to Fairfax, Principal Holdco, and certain of their respective subsidiaries and affiliates. On December 8, 2020 the company issued 24,632,413 subordinate voting shares and 25,452,865 multiple voting shares at a price of $5.50 per share to Principal Holdco as part of the Transaction. Principal Holdco and its subsidiaries and affiliates may not, without the prior written consent of Fairfax and the approval of Board of Directors by simple majority approval, transfer any of their shares in the company prior to the earlier of December 8, 2025 or upon termination of the Investment Advisory Agreement. In the event Fairfax transfers shares, Principal Holdco and its affiliates may transfer an equal proportion of their shares without the prior written consent of Fairfax or the Board of Directors.
Purchase of Shares
On June 30, 2020 the company announced that the TSX had accepted its intention to commence a normal course issuer bid to purchase up to 2,162,134 subordinate voting shares, representing approximately 10% of the public float of its subordinate voting shares, over a twelve month period from July 8, 2020 to July 7, 2021. On June 30, 2021 the company announced that the TSX had accepted its intention to commence a normal course issuer bid to purchase up to 2,666,826 subordinate voting shares, representing approximately 5% of the public float of its subordinate voting shares, over a twelve month period from July 8, 2021 to July 7, 2022. Any subordinate voting shares that may be purchased under the normal course issuer bid will be canceled. The actual number of subordinate voting shares that may be purchased under the normal course issuer bid and the timing of such purchases will be determined at the discretion of the company, with no assurances that any such purchases will be completed.
During the first nine months of 2021, under the terms of the normal course issuer bid, the company purchased for cancellation 10,647 subordinate voting shares for a net cost of $42 and $45 was recorded as a benefit in retained earnings. During the first nine months of 2020, under the terms of the normal course issuer bid, the company purchased for cancellation 463,506 subordinate voting shares for a net cost of $1,850 and $2,960 was recorded as a benefit in retained earnings.
Automatic Share Purchase Plan
On September 28, 2021 the company entered into an automatic share purchase plan with a designated broker to allow for the purchase of subordinated voting shares under its normal course issuer bid at times when the company normally would not be active in the market. Such purchases are determined by the broker in its sole discretion based on parameters established by the company prior to commencement of the applicable trading black-out period. At September 30, 2021 the automatic share purchase plan gave rise to an obligation to repurchase shares up to a maximum dollar limit of $2,458, which was recorded as an automatic share purchase plan liability within the consolidated balance sheets.
29

Subsequent to September 30, 2021
Subsequent to September 30, 2021, under the terms of the automatic share purchase plan, 29,878 subordinate voting shares were purchased on behalf of the company for a net cost of $125 and the automatic share purchase plan liability of $2,458 at September 30, 2021 was reversed.
Special Incentive Plan
On December 8, 2020 and in connection with the closing of the Transaction (see note 2), the company adopted a new special incentive plan (the "Special Incentive Plan"), pursuant to which 2,505,637 options to purchase subordinate voting shares of the company were granted to the SIP Recipients. Options issued under the Special Incentive Plan vested immediately on grant date and had an exercise price of $3.99 per share and maturity date of December 8, 2030. The options may also be exercised by way of a cashless exercise, at the participant’s option, where the company will issue shares equivalent to the amount by which the aggregate fair market value of the shares at time of exercise exceed the exercise price, less any applicable withholding taxes. At September 30, 2021 and December 31, 2020 the maximum number of options under the Special Incentive Plan had been issued, and none of the options granted were exercised.
Warrants
On March 31, 2021, Fairfax, through its affiliates, invested $100,000 in HFP 3.0% Debentures and HFP Warrants. At inception, the company determined that the fair value of the HFP Warrants issued was $5,557 which was recorded in warrants within common shareholders' equity.
Dividends
The company adopted a policy to provide for an annual dividend with respect to the subordinate voting shares and the multiple voting shares of an amount sufficient to produce a non-cumulative and non-accruing 2.0% dividend yield per share (the "Dividend Policy"), calculated based on the average closing market price of the subordinate voting shares on each trading day of the last fiscal quarter for the prior fiscal year. The declaration of any dividends is conditional upon assets exceeding the aggregate of liabilities and stated capital of multiple voting shares and subordinate voting shares after such declaration, and will be determined by the Board of Directors in its sole discretion. The company did not pay any dividends on its outstanding multiple and subordinate voting shares in the first nine months of 2021 and 2020.
Capital Contributions
On July 10, 2020 and in connection with the Transaction (see note 2), the company entered into an agreement to sell its 42.3% equity interest in Atlas Mara to Fairfax for proceeds of $40,000, giving rise to the Atlas Mara Forward Derivative, discussed later in note 13. At inception, the difference of $6,056 between the fair value and transaction price of the Atlas Mara Forward Derivative was recorded in contributed surplus within common shareholders' equity.
On July 10, 2020 in connection with the Transaction (see note 2), the company entered into an agreement with Fairfax whereby Fairfax guaranteed all principal and interest obligations of Atlas Mara under the Atlas Mara Facility, giving rise to the Atlas Mara Facility Guarantee. Refer to note 6 for details on the initial recognition and valuation methodology of the Atlas Mara Facility Guarantee which was recorded in derivatives and guarantees within the consolidated balance sheet. At inception, the difference of $2,799 between the fair value and transaction price of the Atlas Mara Facility Guarantee was recorded in contributed surplus within common shareholders’ equity.
On March 31, 2021, Fairfax, through its affiliates, invested $100,000 in HFP 3.0% Debentures and HFP Warrants. At maturity or on redemption by Fairfax, the principal amount to be repaid will be adjusted for the amount, if any, by which the aggregate fair value of the company’s investments in the Reference Investments is lower than $102,600. At inception, the difference of $18,107 between the total net fair value of the financial instruments issued and received ($81,893) and the transaction amount ($100,000) was recorded in contributed surplus within common shareholders' equity.
Deemed Distributions
On December 7, 2020, prior to closing of the Transaction, the company’s investment in Atlas Mara common shares was sold to Fairfax for proceeds of $40,000. Net proceeds were comprised of $20,000 in cash and $20,000 in the interest-free Fairfax Loan due from Fairfax no later than three years from closing of the Transaction. The company estimated the fair value of the benefit to
30

Fairfax of the interest-free loan to be $603, which was recognized in retained earnings (deficit) within the consolidated statement of changes in equity upon initial recognition.
10. Net Earnings (Loss) per Share
Net loss per common share is calculated in the following table based on the weighted average common shares outstanding:
2021 2020 2021 2020
Net earnings (loss) - basic and diluted (13,582) (58,373) (24,676) (184,363)
Weighted average common shares outstanding - basic and diluted 109,117,509 59,032,975 109,118,002 59,152,402
Net earnings (loss) per common share - basic and diluted $ (0.12) $ (0.99) $ (0.23) $ (3.12)
Third quarter First nine months
At September 30, 2021 there were 239,580 contingently issuable subordinate voting shares related to the performance fee payable to TopCo LP, which were excluded from the calculation of diluted weighted average common shares outstanding for the first nine months of 2021 because their effect would have been anti-dilutive. Under the Investment Advisory Agreement, the performance fee for the first calculation period, if applicable, will be payable after December 31, 2023. TopCo LP’s general partner may elect, no later than fifteen days from the end of the calculation period (the "election date"), to receive the performance fee, wholly or partly, in cash or in subordinate voting shares of the company. The number of subordinate voting shares to be issued will be calculated based on the volume-weighted average trading price of the company’s subordinate voting shares for the 10 trading days prior to and including the election date.
At September 30, 2021 there were 290,323 potential subordinate voting shares issuable relating to the Special Incentive Plan (see note 13), which were excluded from the calculation of diluted weighted average common shares outstanding for the first nine months of 2021 because their effect would have been anti-dilutive.
11. Income Taxes
The company's provision for income taxes for the three and nine months ended September 30 is summarized in the following table:
2021 2020 2021 2020
Current income tax:
Current year expense (recovery) (80) 262 (879) 4,674
Adjustment to prior years’ income taxes 5 108 (1,173) 118
(75) 370 (2,052) 4,792
Deferred income tax:
Origination and reversal of temporary differences 2,516 (1,119) 2,618 140
Adjustments to prior years' deferred income taxes — (46) (213) (46)
2,516 (1,165) 2,405 94
Provision for (recovery of) income taxes 2,441 (795) 353 4,886
Third quarter First nine months
A significant portion of the company's earnings (loss) before income taxes is earned or incurred outside of Canada. The statutory income tax rates for jurisdictions outside of Canada generally differ from the Canadian statutory income tax rate (and may be significantly higher or lower).
31

A reconciliation of the provision for (recovery of) income taxes calculated at the Canadian statutory income tax rate to the provision for income taxes at the effective tax rate in the consolidated financial statements for the three and nine months ended September 30 are summarized in the following table:
Third quarter First nine months
2021 2020 2021 2020
Canadian statutory income tax rate 26.5 % 26.5 % 26.5 % 26.5 %
Recovery of income taxes at the Canadian statutory income tax rate (2,952) (15,680) (6,445) (47,562)
Unrealized gains on investments 989 — 1,381 —
Tax rate differential on earnings (losses) incurred outside of Canada 2,381 9,838 1,400 38,630
Provision (recovery) relating to prior years 5 62 (1,386) 72
Change in unrecorded tax benefit of losses and temporary differences (677) 2,181 4,990 6,271
Foreign exchange effect 2,832 (529) 514 4,016
Other, including permanent differences (137) 3,333 (101) 3,459 Provision for (recovery of) income taxes 2,441 (795) 353 4,886
Unrealized gains on investments of $989 and $1,381 in the third quarter and first nine months of 2021 (2020 - nil in both periods) principally reflected unrealized taxable gains on investments in TopCo LP Class A and Class B Limited Partnership Interests and Helios Fund IV Limited Partnership Interest of $2,838 and $2,653, partially offset by unrealized taxable losses on investments of ($1,849) and ($1,272).
The tax rate differential on earnings (losses) earned outside of Canada of $2,381 and $1,400 in the third quarter and first nine months of 2021 (2020 - $9,838 and $38,630) principally reflected the current and deferred tax impact of foreign accrual property and capital losses, net investment losses taxed in Mauritius at lower rates, partially offset by losses incurred in South Africa taxed at marginally higher rates.
Provision (recovery) relating to prior years of $5 and $(1,386) in the third quarter and first nine months of 2021 principally reflected adjustments for impaired debts, the tax benefit of foreign accrual property loss carryback, and related foreign exchange adjustments. Provision (recovery) relating to prior years of $62 and $72 in the third quarter and first nine months of 2020 principally reflected an adjustment to legal fees, foreign accrual property loss carryforward, and a reclassification of the tax benefit on JIH Redemption of Class A Shares at a premium as exempt income.
The change in unrecorded tax benefit of losses and temporary differences of $(677) and $4,990 in the third quarter and first nine months of 2021 principally reflected the change in deferred tax assets (liabilities) in foreign accrual capital losses of $11 and $2,596, and investment and other temporary timing differences of $241 and $3,483 that were not recorded by the company as the related pre-tax losses did not meet the recognition criteria under IFRS and deferred tax assets (liabilities) in South Africa on investments of ($929) and ($1,089). The change in unrecorded tax benefit of losses and temporary differences of $2,181 in the third quarter of 2020 principally reflected unrecorded deferred tax assets incurred relating to foreign accrual property losses of $3,255, partially offset by deferred tax assets in South Africa on investments of $748 and other temporary timing differences of $326 with respect to the company's wholly-owned subsidiaries that were not recorded by the company as the pre-tax losses did not meet the recognition criteria under IFRS. The change in unrecorded tax benefit of losses and temporary differences of $6,271 in the first nine months of 2020 principally reflected unrecorded tax assets incurred relating to foreign accrual property losses of $3,255, deferred tax assets in South Africa on investments of $1,367 and other temporary timing differences of $1,649 with respect to the company's wholly-owned subsidiaries that were not recorded by the company as the pre-tax losses did not meet the recognition criteria under IFRS. At September 30, 2021 deferred tax assets in Canada of $34,286 and South Africa of $16,467 (December 31, 2020 - $28,208 and $17,555) were not recorded as it was considered not probable that those losses could be utilized by the company.
Foreign exchange effect of $2,832 and $514 in the third quarter and first nine months of 2021 (2020 - $(529) and $4,016) principally reflected the impact of fluctuations in the value of the Canadian dollar relative to the U.S. dollar as the company computes its corporate tax liability in Canadian dollars pursuant to the requirements of Canadian tax authorities, whereas the functional currency of the company and its subsidiaries is the U.S. dollar.
Other, including permanent differences of $(137) and $(101) in the third quarter and first nine months of 2021 (2020 - $3,333 and $3,459) principally reflected non-deductible expenses.
32

12. Financial Risk Management
Overview
There were no significant changes in the types of the company's risk exposures or the company's framework used to monitor, evaluate and manage the company's risk exposures at September 30, 2021 compared to those identified and disclosed in the company's annual consolidated financial statements for the year ended December 31, 2020, except as described below.
COVID-19
The rapid spread of the COVID-19 virus, which was declared by the World Health Organization to be a pandemic on March 11, 2020, and actions taken globally in response to COVID-19, have significantly disrupted business activities throughout the world. The company's Portfolio Investments rely, to a certain extent, on free movement of goods, services, and capital from around the world, which has been significantly restricted as a result of COVID-19.
Given the ongoing and dynamic nature of the circumstances surrounding COVID-19, it is difficult to predict how significant the impact of COVID-19, including any responses to it, will be on the global economy and the company's Portfolio Investments in particular, or for how long any disruptions are likely to continue. The extent of such impact will depend on future developments, which are highly uncertain, rapidly evolving and difficult to predict, including new information which may emerge concerning the severity of COVID-19 and additional actions which may be taken to contain COVID-19, as well as the timing of the re-opening of the economy in various parts of the world. In particular, the potential resurgence of COVID-19 cases and its new variants, and consequently the extension or reintroduction of containment measures may contribute to greater uncertainty and delay the recovery of economic activity. Such further developments could have a material adverse effect on the company's business, financial condition, results of operations and cash flows.
Market Risk
Market risk (comprised of foreign currency risk, interest rate risk and other price risk) is the risk that the fair value or future cash flows of a financial instrument will fluctuate due to changes in market price. The company is exposed to market risk principally in its investing activities and to the extent that those activities expose the company to foreign currency risk. The valuation of the company's investment portfolio is dependent upon the underlying performance of the companies within the portfolio, but may also be affected, along with other financial statement items by fluctuations in foreign currency exchange rates, interest rates, and market prices.
Foreign Currency Risk
Foreign currency risk is the risk that the fair value or future cash flows of a financial instrument or another asset or liability will fluctuate due to changes in exchange rates and as a result, could produce an adverse effect on net earnings and common shareholders' equity when measured in U.S. dollars, the company's functional currency.
In the first nine months of 2021 the company's net foreign currency exposure on balances denominated in currencies other than the U.S. dollar increased compared to December 31, 2020. The increase was principally related to investments in Other Common Shares denominated in pound sterling. The company has cash and cash equivalents, Portfolio Investments, and receivables in South African rand, and a Portfolio Investment in pound sterling. The company's common shareholders' equity and net earnings (loss) may be significantly affected by foreign currency movements resulting from the company's foreign currency-denominated investments. The company has not hedged its foreign currency risk. In addition, the company has cash and cash equivalents in Canadian dollars and Mauritian rupees, the impacts of which would be insignificant.
Interest Rate Risk
Interest rate risk is the risk that the fair value or future cash flows of a financial instrument will fluctuate due to changes in market interest rates. Typically, as interest rates rise, the fair values of fixed income investments decline and, conversely, as interest rates decline, the fair values of fixed income investments rise. In each case, the longer the maturity of the financial instrument, the greater the consequence of a change in interest rates. The company's interest rate risk management strategy is to position its fixed income portfolio based on its view of future interest rates and the yield curve, balanced with liquidity requirements. General economic conditions, political conditions and many other factors can also adversely affect the bond markets and, consequently, the value of fixed income securities held. Interest rate movements in African countries may affect the company's common
33
shareholders' equity and net earnings (loss). The Manager actively monitors interest rates in African countries for the potential impact changes in interest rates may have on the company's investment portfolio.
At September 30, 2021 the company held fixed income investments with a fair value of $64,672 (December 31, 2020 - $59,918), representing 68.9% (December 31, 2020 - 44.4%) of the fixed income portfolio, which were valued using expected recovery models. As expected recovery models are dependent on the expected proceeds from the planned orderly disposition of the issuer's assets or the fair value of the underlying collateral, these investments have limited exposure to interest rate risk.
Market Price Fluctuations
Market price fluctuation is the risk that the fair value or future cash flows of an equity investment or limited partnership investment will fluctuate due to changes in market prices (other than those arising from interest rate risk or foreign currency risk).
The company holds significant equity and limited partnership investments and is exposed to market price risk. The market value and the liquidity of these investments are volatile and may vary dramatically either up or down in short periods, and their ultimate value will therefore only be known over a period of time or on disposition.
The company's exposure to market price risk increased to $377,633 at September 30, 2021 from $364,809 at December 31, 2020 primarily as a result of investments in NBA Africa common shares and Helios Fund IV Limited Partnership Interest, and conversion of Nova Pioneer Bonds to indirect equity interest in Nova Pioneer, partially offset by the HFP Redemption Derivative (see note 13), which limits the company's exposure to market price risk on its investments in indirect equity interest in AGH and Philafrica common shares. The increase in market price risk was also partially offset by the decrease in the fair value of the company's equity and limited partnership investments.
The company estimates the potential impact on net earnings (loss) from a 20% increase or decrease in the fair value of its investments classified as Level 1 in the fair value hierarchy at September 30, 2021 to be an increase or decrease in net earnings (loss) of $3,976 (December 31, 2020 - $2,181). Refer to note 7 for the potential impact on net earnings (loss) of various combinations of changes in significant unobservable inputs in the company's internal valuation models for the company's investments classified as Level 3 in the fair value hierarchy.
Credit Risk
Credit risk is the risk of loss resulting from the failure of a counterparty to honour its financial obligations to the company and arises predominantly with respect to cash and cash equivalents, restricted cash deposits, term deposits, and investments in debt instruments. The company assesses the creditworthiness of each counterparty regularly and prior to entering into contracts. Management monitors credit risk from its Portfolio Investments in debt instruments through reviewing financial performance of its counterparties, collateral arrangements, diversification, and other credit risk mitigation techniques.
Cash and Cash Equivalents
At September 30, 2021 the company's cash and cash equivalents of $80,719 (December 31, 2020 - $66,052) were comprised of $54,673 (December 31, 2020 - $45,352) at the holding company (principally in major Canadian financial institutions) and $26,046 (December 31, 2020 - $20,700) at the company's wholly-owned subsidiaries.
In connection with the closing of the Transaction, Fairfax guaranteed that up to $7,283 in deposit accounts with Access Bank SA may be withdrawn at any time after December 8, 2021.
The company monitors risks associated with cash and cash equivalents and short term investments by regularly reviewing the financial strength and creditworthiness of these financial institutions. From these reviews, the company may transfer balances from financial institutions where it perceives heightened credit risk to others considered to be more stable.
Term Deposits
At September 30, 2021 the company's term deposits of $12,392 (December 31, 2020 - $12,392) was comprised of amounts in a deposit account with Atlas Mara Zambia (see note 13). At September 30, 2021 Atlas Mara Zambia had deposited Government of Zambia Eurobonds ("Zambia Eurobonds") with a fair value of $18,340 for the benefit of the company and cash collateral of $991 recorded within cash and cash equivalents, which are held by HFP. In connection with the closing of the Transaction, Fairfax has also guaranteed that the Atlas Mara Zambia Term Deposit of $12,392 plus accrued interest may be withdrawn at any time after
34

December 8, 2021. The company will continue to monitor the credit risk associated with term deposits by reviewing the financial strength and creditworthiness of the counterparties and the fair value of collateral deposited for the benefit of the company.
Other Assets
At September 30, 2021 the company's other assets of $4,983 (December 31, 2020 - $1,946) were primarily comprised of amounts receivable from Atlas Mara relating to the guarantee provided to TLG Credit Opportunities Fund ("TLG Capital") on Atlas Mara's facility with TLG Capital (the "TLG Facility"). At September 30, 2021 the company estimated the recoverable amount on its receivable from Atlas Mara to be $4,841 based on amounts expected to be received from the sale of Atlas Mara Botswana to Access Bank, pursuant to the terms of the Atlas Mara SOA. Refer to note 16 for details on the receivable from Atlas Mara.
Subsequent to September 30, 2021
In October 2021 Atlas Mara completed the sale of its equity interest in Atlas Mara Botswana to Access Bank, a portion of which was pledged as security for the TLG Facility Guarantee and subsequently released by the company in connection with the aforementioned sale. The proceeds from the sale to be paid in three tranches: (i) an upfront portion due on closing; (ii) a portion due no later than April 2022; and (iii) deferred consideration due two years from the date of closing. On October 14, 2021 upon Atlas Mara receiving the upfront portion of proceeds from the sale, the company received partial repayment on the TLG Facility Guarantee of $3,660. Pursuant to the Atlas Mara SOA the company expects further repayments on the TLG Facility Guarantee as Atlas Mara receives the remaining two tranches of proceeds from the sale.
Investments in Debt Instruments
Fixed Income Maturity Profile
Loans and bonds are summarized by their earliest contractual maturity date in the table that follows. Actual maturities may differ from maturities shown below due to the existence of call and put features. At September 30, 2021 loans and bonds with fair values of $54,410 and nil (December 31, 2020 - $56,764 and $38,863) contained call features. At September 30, 2021 and December 31, 2020 there were no debt instruments containing put features.
September 30, 2021 December 31, 2020Cost (1) Fair value Cost (1) Fair value
Loans:Due in 1 year or less(2) 82,171 54,410 72,011 56,764
Due after 1 year through 5 years 19,558 19,558 19,411 19,411 101,729 73,968 91,422 76,175
Bonds:Due in 1 year or less(2) 39,363 19,894 64,325 38,863 Due after 1 year through 5 years — — 19,290 19,966
39,363 19,894 83,615 58,829
141,092 93,862 175,037 135,004
(1) Cost is comprised of fair value on initial recognition and capitalized interest.(2) At September 30, 2021, includes instruments for which the contractual maturity has passed but have not yet been repaid.
At September 30, 2021 the company had debt instruments with a fair value of $93,862 (December 31, 2020 - $135,004) that were subject to credit risk, representing 13.8% (December 31, 2020 - 22.5%) of the total cash and investments. Management monitors term deposits and has determined that the associated credit risk is limited due to existing collateral arrangements discussed above.
The company's exposure to credit risk from its investments in fixed income securities decreased to $86,375 at September 30, 2021 from $135,004 at December 31, 2020 primarily as a result of the conversion of the Nova Pioneer Bonds to indirect equity interest in Nova Pioneer and the HFP Redemption Derivative (see note 13), which limits the company's exposure to credit risk on its investment in the Philafrica Facility.
Liquidity Risk
Liquidity risk is the risk that the company will encounter difficulty in meeting obligations associated with financial liabilities that are settled by delivering cash or another financial asset. The company manages liquidity risk by maintaining sufficient liquid
35

assets to enable settlement of financial commitments on their respective due dates. All accounts payable and accrued liabilities are due within three months, and income taxes payable must be remitted to the respective tax jurisdictions as they are due.
Cash and publicly traded investments at September 30, 2021 provide adequate liquidity to meet the company's remaining known significant commitments over the next twelve months, which are principally comprised of undrawn capital commitments to Helios Fund IV, interest expense on the HFP 3.0% Debentures, a commitment under the company's automatic share purchase plan, the investment and advisory fees, general and administration expenses, corporate income taxes, and the potential settlement of the HFP 3.0% Debentures if Fairfax exercises its put option, net of the fair value of the HFP Redemption Derivative. The company has adequate working capital to support its operations.
At September 30, 2021 the company's remaining capital commitment to Helios Fund IV was $28,103, which may be called at any time by Helios Fund IV GP in accordance with the Helios Fund IV LPA.
The company may be subject to clawback obligations with respect to its TopCo LP Class A Limited Partnership Interest to the extent HFP has received Carried Interest Proceeds and a clawback is required. The risk is partially mitigated by escrow accounts required by each Helios Fund in accordance with their respective governing documents. The company may be subject to capital call obligations with respect to its TopCo LP Class A and Class B Limited Partnership Interests to cover its pro rata share of expenses incurred by TopCo LP and TopCo LP's share of commitments to the general partners of the Helios Funds, the risk of which is partially mitigated by the six-month holding period of Excess Management Fee Proceeds by TopCo LP.
The company is required to compensate the Co-Chief Executive Officers up to a maximum of $500 each per year, to the extent that each of their annual salaries of $2,000 per year are not fully paid by the Manager.
Refer to note 13 for details on the settlement of the performance fees, if any, at the end of the first calculation period, December 31, 2023.
Concentration Risk
The company's investments are primarily concentrated in Africa and in African businesses or businesses with customers, suppliers or business primarily conducted in, or dependent on, Africa. The market value of the company's investments, the income generated by the company and the company's performance will be particularly sensitive to changes in the economic condition, interest rates, and regulatory environment of African countries in which the company has investments. Adverse changes to the economic condition, interest rates or regulatory environment in those African countries may have a material adverse effect on the company's business, cash flows, financial condition and net earnings.
The company's holdings of Public and Private Portfolio Investments (see note 6) at September 30, 2021 and December 31, 2020 are summarized by the issuer's primary sector in the table below:
September 30, 2021 December 31, 2020Asset management 280,405 275,299 Food and agriculture 81,008 80,439 Education 38,811 36,421 Financial services 38,611 54,153 Entertainment 30,000 — Infrastructure 19,940 19,254 Other 27,051 14,836
515,826 480,402
During the first nine months of 2021 the company's concentration risk in the asset management sector increased due to its investment in and unrealized gains on the Helios Fund IV Limited Partnership Interest. The company's concentration risk in the food and agriculture sector increased primarily due to its investment in the AFGRI International Facility and capitalized interest on the Philafrica Facility, partially offset by unrealized losses and foreign exchange losses on the company's indirect equity interest in AGH, Philafrica common shares, and the Philafrica Facility. The company's concentration risk in the financial services sector decreased primarily due to unrealized losses on the Atlas Mara Facility and the Atlas Mara Bonds. The company's concentration risk in the education sector increased due to conversion of Nova Pioneer Bonds and interest receivable, the latter of which were not part of Portfolio Investments, into indirect equity interest in Nova Pioneer, partially offset by realized losses on Nova Pioneer Bonds. The company's concentration risk in the entertainment sector increased due to its investment in NBA Africa common shares. The company's concentration risk in the infrastructure sector increased primarily due to unrealized gains on the CIG Loan, partially offset by foreign exchange losses on the CIG Loan. The company's concentration risk in the other sector
36

increased primarily due to investments in Other Common Shares and unrealized gains and realized gains on Other Common Shares, partially offset by foreign exchange losses on Other Common Shares.
The company will not make a Portfolio Investment if, after giving effect to such investment, the total invested amount of such investment would exceed 20.0% of the company's total assets at the time of the investment, provided, however, that the company is permitted to complete up to two Portfolio Investments where, after giving effect to each such investment, the total invested amount of each such investment would be less than or equal to 25.0% of the company's total assets (the "Investment Concentration Restriction"). On April 15, 2020 the company received common shareholders' approval of a special resolution allowing the company to make additional investments in Atlas Mara where, after giving effect to such investment, the total invested amount in Atlas Mara (calculated on a fair value basis) would be less than or equal to 40.0% of the company's total assets at the time of such investment. On December 4, 2020 the company received common shareholders’ approval of a special resolution allowing the company to invest in TopCo LP Class A and Class B Limited Partnership Interests where, after giving effect to such investment, the total invested amount in TopCo LP (calculated on a fair value basis) would exceed 25.0% of the company’s total assets at the time of such investment. The company's investment limit for a Portfolio Investment in accordance with the Investment Concentration Restriction increased at September 30, 2021 from December 31, 2020 principally as a result of the issuance of the HFP 3.0% Debentures, and foreign exchange gains, partially offset by unrealized losses on investments as described above.
Portfolio Investments may be financed through equity or debt offerings as part of the company's objective to reduce its cost of capital and provide returns to common shareholders. At September 30, 2021 the company determined that it was in compliance with the Investment Concentration Restriction.
Capital Management
The company's objective when managing capital is to optimize returns for common shareholders, while seeking attractive risk-adjusted returns. Total capital, comprised of common shareholders' equity and borrowings, was $692,096 at September 30, 2021 (December 31, 2020 - $599,735). The increase primarily reflected the issuances of the HFP Host Debentures ($98,487) and HFP Warrants ($5,557), and an increase in contributed surplus ($18,107) arising from the issuances of the HFP 3.0% Debentures and the HFP Warrants at a transaction amount ($100,000) greater than the total net fair value ($81,893), partially offset by a net loss of $24,676, tax expense on the HFP 3.0% Debentures recorded in equity of $2,719, and a commitment under the company's automatic share purchase plan recorded against common shareholders' equity of $2,458.
On March 31, 2021, Fairfax, through its affiliates, invested $100,000 in the HFP 3.0% Debentures and the HFP Warrants. On December 20, 2019 the company entered into the Credit Facility, which matured on December 20, 2020 and was not renewed. Refer to note 8 for details.
13. Related Party Transactions
Investment in TopCo LP
Upon closing of the Transaction, the company acquired all of the issued and outstanding TopCo LP Class A and Class B Limited Partnership Interests from HHL and HHPL. TopCo LP was formed as the investment vehicle through which HFP will receive cash flows from its entitlement to certain Helios fee streams and has entered into a sub-advisory agreement with the Manager, to provide investment and advisory services to HFP. Further details on the company’s transactions with TopCo LP are discussed earlier in note 6.
Investment in Helios Fund IV
On March 31, 2021 the company committed to invest $50,000 in Helios Fund IV, a limited partnership controlled by its general partner, Helios Fund IV GP, an affiliate of the Helios Holdings Group. At September 30, 2021 the company had funded an aggregate of $22,413. The company will not incur any management fees nor any carried interest payable to Helios Fund IV GP with respect to its investment in Helios Fund IV. Further details on the company’s transactions with Helios Fund IV are discussed earlier in note 6.
Investment in Other Common Shares
In June 2021 the company received Vivo common shares as a distribution in specie from TopCo LP with an initial fair value of $5,812. Refer to the Private Portfolio Investments section under the heading Investment in TopCo LP earlier in note 6.
37

Payable to Related Parties
The company's payable to related parties was comprised as follows:September 30, 2021 December 31, 2020
Helios (1) Fairfax Total Helios (1) Fairfax TotalPerformance fee 927 — 927 — — — Investment and advisory fees 832 — 832 201 709 910 Management services fees — 428 428 — 107 107 Helios Transaction expenses — — — — 2,532 2,532 Management compensation — — — 63 — 63 Other — 167 167 — 48 48
1,759 595 2,354 264 3,396 3,660
(1) Performance fee and Investment and advisory fees are paid to TopCo LP. Management compensation is paid to Tope Lawani and Babatunde Soyoye.
Investment Advisory Agreements
On December 8, 2020, the company and its subsidiaries terminated the Former Investment Advisory Agreement with HWIC and entered into the new Investment Advisory Agreement with TopCo LP, pursuant to which TopCo LP replaced HWIC and Fairfax and became the new portfolio advisor and portfolio administrator to the company and its subsidiaries. TopCo LP immediately entered into a sub-investment and advisory agreement with the Manager, pursuant to which the Manager was appointed as TopCo LP’s sub-advisor for the purposes of the Investment Advisory Agreement. As compensation for the provision of these services, the company and its subsidiaries pay an investment and advisory fee, and if applicable, a performance fee. Such fees are determined with reference to the company’s common shareholders’ equity adjusted to exclude TopCo LP.
Performance Fee
The performance fee under the Investment Advisory Agreement is accrued quarterly and is calculated, on a cumulative basis, as 20% of any increase in book value per share, excluding the TopCo LP Class A and Class B Limited Partnership Interests and any cash distributions made by TopCo LP ("Adjusted Book Value per Share"), above a 5% per annum increase less any performance fees settled in prior calculation periods. The amount of Adjusted Book Value per Share at any time which must be achieved before any performance fee would be payable is also referred to as the "hurdle per share".
Under the Investment Advisory Agreement, the period from January 1, 2021 to December 31, 2023 (the "first calculation period") is the first consecutive three-year period for which a performance fee, if applicable, will be payable to TopCo LP. At September 30, 2021 the company determined that a performance fee of $927 should be accrued to TopCo LP (December 31, 2020 - nil accrued to Fairfax) as the Adjusted Book Value per Share of $3.13 (before factoring in the impact of the performance fee) at September 30, 2021 was greater than the hurdle per share at that date of $3.08.
Under the Investment Advisory Agreement, the performance fee for the first calculation period, if applicable, will be payable after December 31, 2023. TopCo LP’s general partner may elect, no later than fifteen days from the end of the calculation period (the "election date"), to receive the performance fee, wholly or partly, in cash or in subordinate voting shares of the company. The number of subordinate voting shares to be issued will be calculated based on the volume-weighted average trading price of the company’s subordinate voting shares for the 10 trading days prior to and including the election date. At September 30, 2021 there were 239,580 (December 31, 2020 - nil) contingently issuable subordinate voting shares related to the performance fee payable to TopCo LP.
In the third quarter and first nine months of 2021 a performance fee recovery of $1,978 and a performance fee of $927 (2020 - nil in both periods) was recorded within the consolidated statements of earnings (loss) and comprehensive income (loss).
Investment and Advisory Fees
The investment and advisory fees are calculated and payable quarterly as 0.5% of the value of undeployed capital and 1.5% of the company's common shareholders' equity less the value of undeployed capital and the fair value of TopCo LP Class A and Class B Limited Partnership Interests. In the third quarter of 2021 the company determined that a significant portion of its assets were invested in Portfolio Investments, which are considered deployed capital. The investment and advisory fees recorded within the consolidated statements of earnings (loss) and comprehensive income (loss) in the third quarter and first nine months of 2021 were $832 and $2,437 (2020 - $1,018 and $3,271).
38

Management Services Agreement
On December 8, 2020 the company entered into a management services agreement with Fairfax (the "Management Services Agreement"), pursuant to which Fairfax will provide certain services to the company and its subsidiaries on a two-year transitional basis for $1,700 in the first year and $2,125 in the second year, paid quarterly in arrears. The management services fees recorded within the consolidated statements of earnings (loss) and comprehensive income (loss) in the third quarter and first nine months of 2021 were $484 and $1,376 (2020 - nil in both periods).
Helios Transaction Expenses
At September 30, 2021 there were no Helios Transaction expenses payable to related parties. At December 31, 2020 Helios Transaction expenses payable to related parties of $2,532 was comprised of amounts due to Fairfax for Transaction expenditures paid by Fairfax on behalf of the company.
Other
Other payable to related parties of $167 at September 30, 2021 (December 31, 2020 - $48) was primarily comprised of amounts due to Fairfax for expenses incurred by Fairfax and HWIC on behalf of the company.
Receivable from Related Parties
Receivable from related parties of $9,173 at September 30, 2021 (December 31, 2020 - nil) was comprised of $7,733 advanced to HHL in connection with the distribution in specie of Vivo common shares, and $1,440 distribution receivable from TopCo LP Class B Limited Partnership Interest in connection with Excess Management Fees earned during the period. HHL and the general partner of TopCo LP agreed that HHL shall transfer the cash consideration received from HFP of $7,733 to TopCo LP for the benefit of the company as sole investor of the TopCo LP Class A Limited Partnership Interest. Refer to the Private Portfolio Investments section under the heading Investment in TopCo LP earlier in note 6.
Subsequent to September 30, 2021
On October 5, 2021, HHL transferred the cash consideration received from HFP of $7,733 to TopCo LP for the benefit of the company as sole investor of the TopCo LP Class A Limited Partnership Interest.
Fairfax's Voting Rights and Equity Interest
At September 30, 2021 Fairfax, through its subsidiaries, owned 30,000,000 multiple voting shares and 5,279,489 subordinate voting shares of HFP (December 31, 2020 - 30,000,000 and 5,279,489 respectively), as well as 3,000,000 HFP Warrants exercisable for one subordinate voting share each, none of which have been exercised.
At September 30, 2021 Fairfax's holdings of multiple and subordinate voting shares represented 53.3% of the voting rights and 32.3% of the equity interest in HFP (December 31, 2020 - 53.3% and 32.3%).
Helios' Voting Rights and Equity Interest
At September 30, 2021 Principal Holdco, a Luxembourg holding company, indirectly owned by Tope Lawani and Babatunde Soyoye, owned 25,452,865 multiple voting shares and 24,632,413 subordinate voting shares of HFP (December 31, 2020 - 25,452,865 and 24,632,413).
At September 30, 2021 Helios' holdings of multiple and subordinate voting shares represented 45.9% of the voting rights and 45.9% of the equity interest in HFP (December 31, 2020 - 45.9% and 45.9%).
Special Incentive Plan
Upon closing of the Transaction, the company adopted the Special Incentive Plan, pursuant to which options to purchase subordinate voting shares of the company were granted to the SIP Recipients (see note 9).
39

Helios Transaction - Related Party Financial Instruments
In connection with the Transaction, the company entered into related party transactions with Fairfax to purchase and guarantee certain of the company’s cash and investment holdings (see note 2 and discussion below). These transactions were recorded on the consolidated balance sheet, the consolidated statement of earnings (loss) and comprehensive income (loss) and the consolidated statement of changes in equity as follows:
September 30, 2021 First nine months of 2021 Third quarter of 2021
Financial instrument Balance sheet lineCarrying amount asset/
(capital)
Net gains (losses) on
investments
Common shareholders'
equity
Net gains (losses) on
investments
Common shareholders'
equity
Fairfax Loan Loans 19,558 — — — —
Atlas Mara Facility Guarantee (1) Derivatives and guarantees 33,153 19,901 — 18,746 —
Atlas Mara Zambia Term Deposit Guarantee (2) Derivatives and guarantees — — — — —
Access Bank SA Deposit Guarantee (3) Derivatives and guarantees — — — — —
HFP Host Debentures (4) Borrowings (98,487) —
18,107
—
— HFP Redemption Derivative (4) Derivatives and guarantees 17,699 (4,165) 271
HFP Warrants (4) Warrants (5,557) — —
(1) Relates to the Atlas Mara Facility which had a fair value of $17,351 at September 30, 2021, recorded in loans within the consolidated balance sheet (December 31, 2020 - $30,346).
(2) Relates to the Atlas Mara Zambia Term Deposit which had a fair value of $12,392 at September 30, 2021, recorded in term deposits within the consolidated balance sheet (December 31, 2020 - $12,392).
(3) Relates to amounts on deposit at Access Bank SA which had a fair value of $6,553 at September 30, 2021, recorded in cash and cash equivalents within the consolidated balance sheet (December 31, 2020 - $7,525 recorded in restricted cash deposits).
(4) Relates to the issuance of the HFP Host Debentures and HFP Warrants and the HFP Redemption Derivative. At inception, the difference of $18,107 between the total net fair value of the financial instruments issued and received ($81,893) and the transaction amount ($100,000) was recorded in contributed surplus within common shareholders' equity.
Fairfax Loan
On December 7, 2020, prior to closing of the Transaction, the company’s investment in Atlas Mara common shares was sold to Fairfax for proceeds of $40,000. Net proceeds were comprised of $20,000 in cash and $20,000 in the interest-free Fairfax Loan due from Fairfax no later than three years from closing of the Transaction. The company estimated the fair value of the benefit to Fairfax of the interest-free loan to be $603, which was recognized in retained earnings (deficit) within the consolidated statement of changes in equity upon initial recognition.
At September 30, 2021 the company determined that the amortized cost of the Fairfax Loan of $19,558 approximated fair value.
In the third quarter and first nine months of 2021 the company recorded interest income of $50 and $147 (2020 - nil in both periods) within the consolidated statements of earnings (loss) and comprehensive income (loss) related to the Fairfax Loan.
Atlas Mara Facility Guarantee
On July 10, 2020 in connection with the Transaction (see note 2), the company entered into an agreement with Fairfax whereby Fairfax guaranteed all principal and interest obligations of Atlas Mara under the Atlas Mara Facility, giving rise to the Atlas Mara Facility Guarantee, which was recorded in derivatives and guarantees within the consolidated balance sheet. Refer to note 6 for details on the initial recognition and valuation methodology of the Atlas Mara Facility Guarantee.
Atlas Mara Zambia Term Deposit
On December 13, 2019 the company entered into a term deposit agreement with Atlas Mara Zambia whereby the company agreed to place up to $15,000 with Atlas Mara Zambia as a term deposit, bearing interest at a rate of LIBOR plus 400 basis points. The company placed the fixed deposit in Atlas Mara Zambia in two tranches: (i) $7,500 deposited on December 20, 2019 (the "First Tranche"; and (ii) $4,890 deposited on February 14, 2020 (the "Second Tranche"). Atlas Mara directed the company to wire the Second Tranche directly to a third party creditor and agreed to record the term deposit. Atlas Mara Zambia has been unable to record the term deposit as it has not yet received regulatory approval from the Central Bank of Zambia. Atlas Mara is pursuing this matter with the regulator and discussions are ongoing. The term deposit matured on June 18, 2021 and was renewed to December 17, 2021. At September 30, 2021 Atlas Mara Zambia had deposited Zambia Eurobonds with a fair value of $18,340 for
40

the benefit of the company and cash collateral of $991 recorded within cash and cash equivalents, which are held by HFP. In connection with the closing of the Transaction, Fairfax has also guaranteed that the Atlas Mara Zambia Term Deposit of $12,392 plus accrued interest may be withdrawn at any time after December 8, 2021.
At September 30, 2021 the company had a term deposit of $12,392 (December 31, 2020 - $12,392), recorded at the value of the cash placed on deposit with Atlas Mara Zambia and supported by the collateral held for the benefit of the company.
Deposits on Account with Access Bank SA
At September 30, 2021 the company held $6,553 in cash and cash equivalents (December 31, 2020 - $7,525 in restricted cash deposits) in deposit accounts with Access Bank SA. In connection with the closing of the Transaction, Fairfax guaranteed to the company that up to $7,283 on deposit at Access Bank SA may be withdrawn at any time after December 8, 2021.
HFP 3.0% Debentures
On March 31, 2021, Fairfax, through its affiliates, invested $100,000 in HFP 3.0% Debentures and HFP Warrants.
14. General and Administration Expenses
General and administration expenses for the three and nine months ended September 30 were comprised as follows:
2021 2020 2021 2020Audit, legal, tax and professional fees 508 197 2,941 1,017 Administrative expenses 245 130 465 396 Management service fees (note 13) 484 — 1,376 — Salaries and employee benefit expenses 733 251 2,784 1,108 Brokerage fees 11 2 30 37
1,981 580 7,596 2,558
Third quarter First nine months
15. Helios Transaction Expenses
The Helios Transaction expenses relate to amounts incurred by HFP and Helios with respect to the Transaction. The company has agreed to pay all Transaction-related expenses, including legal, advisory, and other professional fees related to the Transaction.
Helios Transaction expenses payable was nil at September 30, 2021 (December 31, 2020 - $8,247). Helios Transaction expenses payable of $8,247 at December 31, 2020 included $5,715 recorded in accounts payable and accrued liabilities and $2,532 due to Fairfax recorded in payable to related parties within the consolidated balance sheet.
Helios Transaction expenses for the three and nine months ended September 30 were comprised as follows:Third quarter First nine months
2021 2020 2021 2020Advisor to the Special Committee of the Board of Directors of HFP — 1,000 — 1,500 Financial Advisor to Helios — 5,000 — 5,000 Other legal and financial professional fees — 7,857 — 7,857
— 13,857 — 14,357
16. Other Assets
Other assets at September 30, 2021 and December 31, 2020 were comprised as follows:September30,2021 December31,2020
Gross Loss Net Gross Loss NetReceivable from Atlas Mara 8,474 3,633 4,841 — — — Sales tax refundable 2,499 2,446 53 1,928 — 1,928 Other 89 — 89 18 — 18
11,062 6,079 4,983 1,946 — 1,946
41

Receivable from Atlas Mara
On December 31, 2019 the company agreed to guarantee up to $20,000 in principal on a facility provided to Atlas Mara by TLG Capital. The guarantee was secured by certain of Atlas Mara's shares in Atlas Mara Botswana. In 2020, Atlas Mara had drawn an aggregate of $8,000 on the TLG Facility.
On January 8, 2021, Atlas Mara defaulted on the TLG Facility and TLG Capital enforced under the guarantee with the company. On January 19, 2021, the company paid $8,474 in principal, interest, and fees to TLG Capital in settlement of the guarantee. Also on January 19, 2021, the company enforced the security, which provided the company with certain rights, including the right to transfer and sell the underlying Atlas Mara Botswana shares, which had a fair value of $11,044 on the date of enforcement. The company recorded a receivable of $8,474 given its right to receive Atlas Mara Botswana shares with a fair value in excess of the amount paid to TLG.
In March 2021 given the proposed terms of Atlas Mara's sale of Atlas Mara Botswana to Access Bank (the "Access Bank Transaction"), the company remeasured the receivable from Atlas Mara based on the net proceeds expected to be recovered from Atlas Mara using the price implied by the Access Bank Transaction. As a result at September 30, 2021 the company estimated the recoverable amount on its receivable from Atlas Mara was $4,841.
In the third quarter and first nine months of 2021 the company recorded a loss of $618 and $3,633 in loss on uncollectible accounts receivable within the consolidated statements of earnings (loss) and comprehensive income (loss) related to the receivable from Atlas Mara.
Subsequent to September 30, 2021
In October 2021 Atlas Mara completed the sale of its equity interest in Atlas Mara Botswana to Access Bank, a portion of which was pledged as security for the TLG Facility Guarantee and subsequently released by the company in connection with the aforementioned sale. The proceeds from the sale to be paid in three tranches: (i) an upfront portion due on closing; (ii) a portion due no later than April 2022; and (iii) deferred consideration due two years from the date of closing. On October 14, 2021 upon Atlas Mara receiving the upfront portion of proceeds from the sale, the company received partial repayment on the TLG Facility Guarantee of $3,660. Pursuant to the Atlas Mara SOA the company expects further repayments on the TLG Facility Guarantee as Atlas Mara receives the remaining two tranches of proceeds from the sale.
Sales Tax Refundable
In the first quarter of 2021 the company determined that sales tax refundable in Canada is uncollectible and in the third quarter and first nine months of 2021 the company recorded a loss of nil and $2,446 in loss on uncollectible accounts receivable within the consolidated statements of earnings (loss) and comprehensive income (loss).
17. Revision of Comparative Amounts
Net loss and comprehensive loss for the third quarter of 2020 were revised for the impact of reclassifying $8,855 in unrealized gains to contributed surplus, reflecting the difference at inception on July 10, 2020 between fair value and the transaction price on the Atlas Mara Forward Derivative ($6,056) and the Atlas Mara Facility Guarantee ($2,799). Net loss per share (basic and diluted) for the third quarter and first nine months of 2020 were revised accordingly from $0.84 and $2.97 to $0.99 and $3.12 respectively. The above revisions for the third quarter of 2020 did not impact common shareholders' equity at September 30, 2020.
42

18. Supplementary Cash Flow Information
Cash and cash equivalents were included within the consolidated balance sheets and statements of cash flows as follows:September 30, 2021 December 31, 2020
Cash and balances with banks 59,908 43,551 U.S. treasuries 20,811 22,501
80,719 66,052
Details of certain cash flows included within the consolidated statements of cash flows for the three and nine months ended September 30 were as follows:
2021 2020 2021 2020Purchases of investments
Limited partnership investments — — (22,413) — Common shares — — (30,000) (15,893) Loans (9,600) (919) (9,600) (45,129)
(9,600) (919) (62,013) (61,022)
Disposals of investmentsCommon stocks 7,433 — 7,433 —
Interest received (paid)Interest received 375 107 432 2,494 Interest paid on borrowings (756) — (1,512) —
(381) 107 (1,080) 2,494
Dividends received 178 15 345 15
Income taxes paid 35 (76) (1,845) (362)
Third quarter First nine months
43
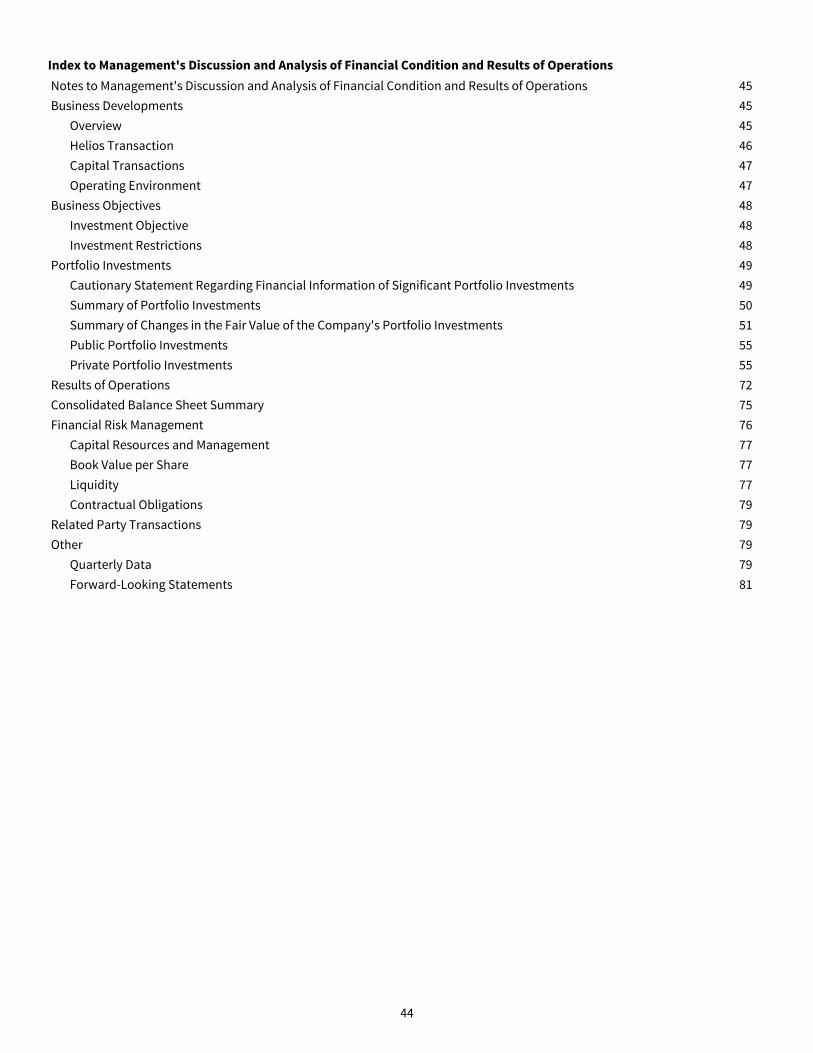
Index to Management's Discussion and Analysis of Financial Condition and Results of OperationsNotes to Management's Discussion and Analysis of Financial Condition and Results of Operations 45Business Developments 45
Overview 45Helios Transaction 46Capital Transactions 47Operating Environment 47
Business Objectives 48Investment Objective 48Investment Restrictions 48
Portfolio Investments 49Cautionary Statement Regarding Financial Information of Significant Portfolio Investments 49Summary of Portfolio Investments 50Summary of Changes in the Fair Value of the Company's Portfolio Investments 51Public Portfolio Investments 55Private Portfolio Investments 55
Results of Operations 72Consolidated Balance Sheet Summary 75Financial Risk Management 76
Capital Resources and Management 77Book Value per Share 77Liquidity 77Contractual Obligations 79
Related Party Transactions 79Other 79
Quarterly Data 79Forward-Looking Statements 81
44

Management's Discussion and Analysis of Financial Condition and Results of Operations (as of November 4, 2021)(Figures and amounts are in US$ and $ thousands except share and per share amounts and as otherwise indicated. Figures may not add due to rounding.)
Notes to Management's Discussion and Analysis of Financial Condition and Results of Operations
(1) Readers of the Management's Discussion and Analysis of Financial Condition and Results of Operations ("MD&A") should review the notes to the interim consolidated financial statements for the three and nine months ended September 30, 2021 and the company's 2020 Annual Report.
(2) Unless otherwise noted, consolidated financial information of the company within this MD&A is derived from the consolidated financial statements of the company prepared in accordance with International Financial Reporting Standards ("IFRS") as issued by the International Accounting Standards Board ("IASB") applicable to the preparation of interim financial statements, including International Accounting Standard 34 Interim Financial Reporting, and is presented in U.S. dollars which is also the functional currency of the company and its consolidated subsidiaries.
(3) The MD&A contains references to book value per share. On any date, book value per share is calculated as common shareholders' equity at the end of the period, determined in accordance with IFRS, divided by the total number of common shares of the company effectively outstanding on that date. Those amounts are presented in the consolidated balance sheet and note 9 (Common Shareholders' Equity under the heading Common Stock) respectively within the consolidated financial statements for the three and nine months ended September 30, 2021. Book value per share is a key performance measure of the company and is closely monitored as it is used to calculate the performance fee payable, if any, to HFA Topco, L.P. ("TopCo LP" or the "Portfolio Advisor").
(4) The MD&A contains references to "Cash used in operating activities excluding the impact of changes in restricted cash deposits and net sales (purchases) of investments", which provides a measure of the cash generated by (used in) the company’s head office operations, primarily comprised of cash inflows (outflows) from interest and dividend income, interest expense, investment and advisory fees, current income taxes, and general and administration expenses, and excludes the impact of changes to restricted cash deposits and purchases and sales of investments. This measure is not a standard measurement under IFRS and therefore may not be comparable to similar measures presented by other issuers.
(5) Throughout this MD&A, the term "Portfolio Investments" refers to deployed capital invested in Public and Private Portfolio Investments as disclosed in note 6 (Portfolio Investments) to the interim consolidated financial statements for the three and nine months ended September 30, 2021.
Business Developments
Overview
TopCo LP, an affiliate of Helios Holdings Limited ("HHL") (together with one or more of its affiliates, as the context requires, the "Helios Holdings Group"), is the portfolio advisor of the company and its consolidated subsidiaries, responsible to source and advise with respect to all investments. TopCo LP has appointed Helios Investment Partners LLP ("Helios" or, the "Manager"), a registered portfolio manager in the United Kingdom, as its sub-advisor. The company's subordinate voting shares trade on the Toronto Stock Exchange ("TSX") under the symbol HFPC.U. The multiple voting shares of the company are not traded.
Fairfax Financial Holdings Limited ("Fairfax") provides certain services under a Management Services Agreement between Helios Fairfax Partners Corporation ("HFP") and Fairfax, effective December 8, 2020. Fairfax is a holding company which, through its subsidiaries, is engaged in property and casualty insurance and reinsurance and the associated investment management.
Book value per share at September 30, 2021 was $5.44 compared to $5.50 at December 31, 2020, representing a decrease of 1.1% in the first nine months of 2021 and primarily reflected a net loss of $24,676 (principally due to general and administration expenses, loss on uncollectible accounts receivable, realized losses on investments, foreign exchange losses, investment and advisory fees, and interest expense, partially offset by net change in unrealized gains on investments), tax expense on the HFP 3.0% Debentures recorded in equity of $2,719, and a commitment under the company's automatic share purchase plan recorded against common shareholders' equity of $2,458, partially offset by an increase in contributed surplus ($18,107) arising from the issuances of the HFP 3.0% Debentures and the HFP Warrants at a transaction amount ($100,000) greater than the total net fair value ($81,893).
The following narrative sets out the company’s key business developments in the first nine months of 2021.
45

Helios Transaction
On December 8, 2020 the company closed the previously announced transaction with HHL, pursuant to which HHL contributed its entitlement to cash flows arising from certain fee streams (as described below) to HFP in exchange for a 45.9% equity and voting interest in HFP (the "Transaction"). Upon closing of the Transaction, the company was renamed Helios Fairfax Partners Corporation and its subordinate voting shares continued to be listed on the Toronto Stock Exchange.
Helios is the largest Africa-focused private investment firm, with a record that spans creating start-ups to providing established companies with growth capital and expertise. Led and predominantly staffed by African professionals with the language skills and cultural affinity to engage with local entrepreneurs, managers and intermediaries on the continent, Helios leverages its local and global networks to identify business opportunities and structure proprietary transactions around them. The firm’s unique combination of a deep knowledge of the African operating environment, a singular commitment to the region and a proven capability to manage complexity, is reflected in the firm’s diverse portfolio of growing, market-leading businesses and its position as a partner of choice of multinational corporations in Africa. Helios is among the world’s largest emerging markets-focused private equity firms to receive B Corp certification. B Corp status recognizes the firm’s long-standing commitment to sustainability and responsible business practices.
As consideration for a 45.9% equity and voting interest in HFP, HHL contributed cash flows arising from the following fee stream entitlements:
• 100% of all management and other fees paid to the Helios Holdings Group in connection with the management of any existing or future fund (including the management of HFP and its subsidiaries), less expenses, administrative fees, and other operation fees relating to the management of those funds;
• 25% of carried interest amounts generated by any existing fund managed by Helios or any of its affiliates, excluding Helios Investors IV, L.P.; and
• 50% of carried interest amounts generated by any future fund managed by Helios or any of its affiliates, including Helios Investors IV, L.P.
(Existing and future funds managed by the Helios Holdings Group are referred to as "Helios Funds".)
On December 7, 2020, prior to closing of the Transaction, the company’s investment in Atlas Mara common shares was sold to Fairfax for proceeds of $40,000. Net proceeds were comprised of $20,000 in cash and $20,000 in an interest-free loan due from Fairfax no later than three years from closing of the Transaction (the "Fairfax Loan"). In addition, Fairfax has guaranteed all repayment obligations of Atlas Mara under the Atlas Mara Facility, giving rise to the Atlas Mara Facility Guarantee. Fairfax has also guaranteed to the company that the Atlas Mara Zambia Term Deposit of $12,392 plus accrued interest and up to $7,283 in deposit accounts with Access Bank SA (formerly Grobank) may be withdrawn at any time after December 8, 2021.
Upon closing of the Transaction, the company entered into an administration and investment advisory services agreement with TopCo LP (the "Investment Advisory Agreement"), which appointed the Manager as its sub-advisor. The Investment Advisory Agreement replaced the previous investment advisory agreement (the "Former Investment Advisory Agreement") with Hamblin Watsa Investment Counsel Ltd. ("HWIC" or the "Former Portfolio Advisor"). The Portfolio Advisor has discretionary authority to negotiate and complete investments on behalf of the company. The Portfolio Advisor will request approval from the company’s board of directors, by simple majority, prior to making any investment in excess of the greater of 10% of HFP’s Net Asset Value and $50,000; and will not make any insurance-related investment without the prior written consent of Fairfax.
Upon closing of the Transaction, Tope Lawani and Babatunde Soyoye (the co-founders and Managing Partners of the investment advisor to the Helios Funds) were appointed as Co-Chief Executive Officers of HFP and Michael Wilkerson was appointed Executive Vice Chairman of HFP.
The company entered into the Management Services Agreement with Fairfax, pursuant to which Fairfax will provide certain services to the company and its subsidiaries on a two-year transitional basis (see note 13 (Related Party Transactions) to the consolidated financial statements for the nine months ended September 30, 2021).
Upon closing of the Transaction, the company adopted a new special incentive plan, pursuant to which options to purchase subordinate voting shares of the company were granted to certain employees, officers, members, partners or consultants of the Manager (the "SIP Recipients") (see note 9 (Common Shareholders' Equity) to the interim consolidated financial statements for the three and nine months ended September 30, 2021).
46

After the closing of the Transaction, HFP is positioned as the leading, Africa-focused listed investment holding company that will offer high-quality investments in African markets, while receiving the benefit of diversified revenue streams through an entitlement to cash flows arising from recurring and predictable fee streams (Excess Management Fees and Carried Interest Proceeds) from Helios Funds. Going forward the company will also benefit from a broader team of experienced investment professionals fully focused on Africa, with deep local knowledge, differentiated capabilities and a successful track record across the continent in identifying and securing high-quality, largely proprietary, investment opportunities.
Capital Transactions
On March 31, 2021, Fairfax, through its affiliates, invested $100,000 in 3.0% unsecured debentures of HFP (the "HFP 3.0% Debentures") and 3,000,000 warrants (the "HFP Warrants").
On December 20, 2019 the company entered into an $80,000 secured, revolving demand credit facility with a syndicate of Canadian lenders, bearing interest at a rate of LIBOR plus 450 basis points (the "Credit Facility"). On December 20, 2020 the Credit Facility matured and was not renewed. Refer to note 8 (Borrowings) to the interim consolidated financial statements for the three and nine months ended September 30, 2021 for additional details.
On December 4, 2020, shareholders of HFP approved an amendment to the company’s articles to permit, among other things, the issuance of an unlimited number of multiple voting shares to Fairfax, HFP Investment Holdings SARL ("Principal Holdco"), and certain of their respective subsidiaries and affiliates. On December 8, 2020 the company issued 24,632,413 subordinate voting shares and 25,452,865 multiple voting shares at a price of $5.50 per share to Principal Holdco as part of the Transaction. Principal Holdco and its subsidiaries and affiliates may not, without the prior written consent of Fairfax and the approval of Board of Directors by simple majority approval, transfer any of their shares in the company prior to the earlier of December 8, 2025 or upon termination of the Investment Advisory Agreement. In the event Fairfax transfers shares, Principal Holdco and its affiliates may transfer an equal proportion of their shares without the prior written consent of Fairfax or the Board of Directors.
During the first nine months of 2021, under the terms of the normal course issuer bid, the company purchased for cancellation 10,647 subordinate voting shares for a net cost of $42 and $45 was recorded as a benefit in retained earnings.
Subsequent to September 30, 2021
Subsequent to September 30, 2021, under the terms of the automatic share purchase plan, 29,878 subordinate voting shares were purchased on behalf of the company for a net cost of $125 and the automatic share purchase plan liability of $2,458 at September 30, 2021 was reversed.
Operating Environment
Overview
Over a year into the COVID-19 pandemic, global recovery continues, but momentum has slowed due to the Delta variant. The International Monetary Fund ("IMF") in its October 2021 report, "World Economic Outlook - Recovery During a Pandemic", revised its estimate of 2020 global GDP to a contraction of 3.1%, with an expected recovery to 5.9% growth in 2021, moderating to 4.9% growth in 2022. The IMF projects that the divergence in expected economic recovery between advanced economies and developing economies will grow wider as a result of the disparity in vaccine access and policy support.
Sub-Saharan Africa
The IMF projected that GDP in Sub-Saharan Africa ("SSA") is expected to recover from a contraction of 1.7% in 2020 to 3.7% growth in 2021 and 3.8% growth in 2022. These region-wide forecasts mask considerable differences in the growth performance and prospects of countries across the region. The World Bank reports that SSA's rebound is fueled by elevated commodity prices, relaxing containment measures, and recovery in global trade, but is vulnerable to low vaccine uptake and a slow pace of recovery. Although all economies in SSA have been affected by the pandemic, tourism-dependent, oil-exporting, and other resource-intensive economies were hit hardest. The region entered the COVID-19 crisis with constrained fiscal space and many SSA economies are now faced with higher debt levels and output losses even as governments aim to continue providing monetary and fiscal support to underpin economic recovery. Vaccination programs are in progress in SSA and the region is expected to achieve herd immunity in late 2022; in the interim, the risk of new infection waves remains prevalent in SSA.
47

South Africa
In October 2021, the IMF estimated that South Africa's 2020 GDP contracted by 6.4%, with a projected recovery to 5.0% growth in 2021 and 2.2% growth in 2022. The construction, transportation, communication, manufacturing, and mining industries were greatly impacted by the COVID-19 pandemic, though the nation's debt structure is favourable and the banking sector remains well-capitalized. South Africa's COVID-19 fiscal stimulus package represented 10.4% of its GDP and focused spending on healthcare, tax cuts, unemployment benefits, and loan deferrals. Fiscal consolidation remains a key priority and managing public finances is integral to achieving medium-term projections. One-year public sector wage negotiations were finalized in the third quarter of 2021. Economic activity recovered from the July 2021 civil unrest following the arrest of former president Jacob Zuma. The South African Reserve Bank ("SARB") has kept the South Africa prime overdraft rate stable at 7.0% since the beginning of the year. The South African rand weakened relative to the U.S. dollar during the third quarter of 2021, from 14.28 at June 30, 2021 to 15.05 at September 30, 2021. Moody's Investors Service ("Moody's"), Fitch Ratings Inc. ("Fitch") and Standard & Poor's Financial Services LLC ("S&P") have maintained their ratings at Ba2 with a negative outlook, BB- with a negative outlook, and BB- with a stable outlook respectively.
Nigeria
In October 2021, the IMF estimated that Nigeria's 2020 GDP contracted by 1.8%, with a projected recovery to 2.6% growth in 2021 and 2.7% growth in 2022. Nigeria is SSA's largest economy and is historically heavily oil-dependent. The tumbling crude oil prices in 2020 had a spillover effect into non-oil industries and resulted in an economic recession, though the 2021 recovery in the oil price is expected to support Nigeria's economy. Fitch stated that Nigeria's credit rating is supported by the large size of the economy, low government debt to GDP ratio, and developed financial system, counterbalanced by weak fiscal revenue, high dependence on the oil sector, continued weak growth, and high inflation. The mandated cash reserve ratio of 27.5% for Nigerian banks is higher than in peer SSA countries, limiting banks' ability to extend credit and attain interest margin targets. Inflation in Nigeria is forecasted to average 16.9% in 2021 and 13.3% in 2022. Moody's, Fitch, and S&P have maintained their ratings at B2 with a negative outlook, B with a stable outlook, and B- with a stable outlook respectively.
Kenya
In October 2021, the IMF estimated that Kenya's 2020 GDP contracted by 0.3%, with a projected recovery to 5.6% growth in 2021 and 6.0% growth in 2022. Kenya, one of the most economically diverse countries in SSA, has fared better in the COVID-19 pandemic than its resource-intensive counterparts. Kenya's tourism and services industries, which contribute significantly to Kenya's GDP, have been severely impacted given the fall in international travel, while the nation's agricultural production has supported economic growth. Fitch reports that Kenya's credit rating is supported by its strong growth, macroeconomic stability, and favourable debt structure, but rising public debt, high external debt, and uncertain pace of planned fiscal consolidation lead to a negative outlook. Public debt surged to 72% of GDP in 2020, driven by COVID-19 related spending, and fiscal consolidation has been delayed by the effects of the pandemic. Moody's, Fitch, and S&P have maintained their ratings at B2 with a negative outlook, B+ with a negative outlook, and B with a stable outlook respectively.
Business Objectives
Investment Objective
HFP is an investment holding company whose objective is to achieve long term capital appreciation, while preserving capital, by investing in public and private equity securities and debt instruments in Africa and African businesses or other businesses with customers, suppliers or business primarily conducted in, or dependent on, Africa ("Portfolio Investments"). The company makes all or substantially all of its investments either directly or through one of its wholly-owned subsidiaries, which include a South Africa-based subsidiary HFP South Africa Investments Proprietary Limited ("SA Sub", formerly known as Fairfax Africa Investments Proprietary Limited), a Mauritius-based subsidiary HFP Investments Limited ("Mauritius Sub", formerly known as Fairfax Africa Holdings Investments Limited), and a U.S.-based subsidiary HFP US Investments, Inc. ("U.S. Sub").
Investment Restrictions
The company will not make a Portfolio Investment if, after giving effect to such investment, the total invested amount of such investment would exceed 20.0% of the company's total assets at the time of the investment, provided, however, that the company is permitted to complete up to two Portfolio Investments where, after giving effect to each such investment, the total invested amount of each such investment would be less than or equal to 25.0% of the company's total assets (the "Investment Concentration Restriction"). On April 15, 2020 the company received common shareholders' approval of a special resolution
48

allowing the company to make additional investments in Atlas Mara where, after giving effect to such investment, the total invested amount in Atlas Mara (calculated on a fair value basis) would be less than or equal to 40.0% of the company's total assets at the time of such investment. On December 4, 2020 the company received common shareholders’ approval of a special resolution allowing the company to invest in TopCo LP Class A and Class B Limited Partnership Interests where, after giving effect to such investment, the total invested amount in TopCo LP (calculated on a fair value basis) would exceed 25.0% of the company’s total assets at the time of such investment. The company's investment limit for a Portfolio Investment in accordance with the Investment Concentration Restriction increased at September 30, 2021 from December 31, 2020 principally as a result of the issuance of the HFP 3.0% Debentures, and foreign exchange gains, partially offset by unrealized losses on investments.
The company intends to make multiple different investments as part of its prudent investment strategy. Portfolio Investments may be financed through equity or debt offerings as part of the company's objective to reduce its cost of capital and provide returns to common shareholders. At September 30, 2021 the company determined that it was in compliance with the Investment Concentration Restriction.
Portfolio Investments
Cautionary Statement Regarding Financial Information of Significant Portfolio Investments
HFP has agreed to voluntarily provide within its MD&A, summarized unaudited financial information prepared for all of its Portfolio Investments for which it had previously filed a business acquisition report in accordance with section 8.2 of National Instrument 51-102 Continuous Disclosure Obligations. AFGRI Group Holdings Proprietary Limited ("AGH") prepares its financial statements in accordance with IFRS as issued by IASB; TopCo LP is required to prepare its financial statements in accordance with U.S. generally accepted accounting principles ("U.S. GAAP") pursuant to its amended and restated limited partnership agreement ("TopCo LP and AGH collectively, "Significant Portfolio Investments"). At November 4, 2021 TopCo LP had not yet completed its audited consolidated financial statements for the period ended December 31, 2020 and no prior period financial statements are available. The company is limited in respect to the amount of independent verification it is able to perform with respect to the financial statements of the Significant Portfolio Investments. Such unaudited financial information is the responsibility of the respective managements and has been prepared by them using recognition, measurement and presentation principles consistent with their respective accounting standards, and provided to the company in their underlying functional currencies.
The company's investments in TopCo LP and AGH have fiscal years which end on December 31 and March 31 respectively. Summarized financial information of the company's Significant Portfolio Investments has generally been provided for the periods subsequent to the company's investment and to the extent that the most recent interim financial information is available to the company's management. Significant Portfolio Investments' summarized financial information should be read in conjunction with HFP's historical interim and annual consolidated financial statements including the notes thereto and the related MD&A as well as HFP's other public filings.
HFP has no knowledge that would indicate that the Significant Portfolio Investments' summarized financial information contained herein requires material modifications. However, readers are cautioned that the Significant Portfolio Investments' summarized financial information contained in this MD&A may not be appropriate for their purposes.
49

Summary of Portfolio Investments
The table below provides a summary of the company's Portfolio Investments:September 30, 2021 December 31, 2020
Date Acquired
Net consider-ation (1)
Fair value
Net change
Net consider-ation (1)
Fair value
Net change
Portfolio Investments (excluding Portfolio Investments with related party guarantees)(2):Public Investments:
CIG common shares(3) Fourth quarters of 2017 and 2018, January and December 2019, and first and second quarters of 2020 — — — 54,720 — (54,720)
Other Common Shares Various 12,818 27,051 14,233 10,053 14,836 4,783
Total Public Investments 12,818 27,051 14,233 64,773 14,836 (49,937)
Private Investments:
Limited partnership investments:
TopCo LP Class A Limited Partnership Interest(4) December 2020 82,653 89,389 6,736 88,465 88,465 —
TopCo LP Class B Limited Partnership Interest(4) December 2020 185,394 164,334 (21,060) 186,834 186,834 —
Helios Fund IV Limited Partnership Interest March and April 2021 22,413 26,682 4,269 — — —
290,460 280,405 (10,055) 275,299 275,299 —
Common Stocks:
NBA Africa common shares May 2021 30,000 30,000 — — — —
Indirect equity interest in Access Bank SA Fourth quarter of 2018, April 2019, February and June 2020 19,403 1,366 (18,037) 19,403 1,399 (18,004)
Indirect equity interest in Nova Pioneer July 2021 38,811 38,811 — — — —
88,214 70,177 (18,037) 19,403 1,399 (18,004)
Loans:
CIG Loan June 2018 23,270 19,940 (3,330) 23,270 19,254 (4,016)
AFGRI International Facility August 2021 9,600 9,632 32 — — —
32,870 29,572 (3,298) 23,270 19,254 (4,016)
Bonds:
Atlas Mara 11.0% Convertible Bonds December 2018 15,040 — (15,040) 15,040 2,442 (12,598)
Atlas Mara 7.5% Bonds November 2018 16,476 19,894 3,418 16,476 19,966 3,490
Nova Pioneer Bonds Third and fourth quarters of 2017 and 2018, and first and second quarters of 2019 32,713 — (32,713) 32,713 36,421 3,708
64,229 19,894 (44,335) 64,229 58,829 (5,400)
Derivatives:
Atlas Mara Warrants(3) November 2018 — — — 2,324 — (2,324)
Nova Pioneer Warrants(3) Third and fourth quarters of 2017 and 2018, and first and second quarters of 2019 — — — 1,287 — (1,287)
— — — 3,611 — (3,611)
Total Private Investments 475,773 400,048 (75,725) 385,812 354,781 (31,031) Total Portfolio Investments (excluding Portfolio Investments with related party guarantees) 488,591 427,099 (61,492) 450,585 369,617 (80,968)
Portfolio Investments with related party guarantees(2):
Reference Investments & HFP Redemption Derivative:
Indirect equity interest in AGH February 2017, January and November 2018, December 2020 97,073 55,628 (41,445) 97,073 64,210 (32,863)
Philafrica common shares November 2018 23,254 8,261 (14,993) 23,254 9,065 (14,189)
Philafrica Facility Second quarter of 2020 5,622 7,487 1,865 5,622 7,164 1,542
PGR2 Loan(3) June and December 2018 — — — 19,969 — (19,969)
HFP Redemption Derivative(2)(5) March 2021 — 17,699 17,699 — — —
125,949 89,075 (36,874) 145,918 80,439 (65,479)
Atlas Mara Facility & Guarantee
Atlas Mara Facility Second and third quarters of 2020 39,507 17,351 (22,156) 39,507 30,346 (9,161)
Atlas Mara Facility Guarantee July 2020 — 33,153 33,153 — 13,252 13,252
39,507 50,504 10,997 39,507 43,598 4,091
Total Portfolio Investments with related party guarantees 165,456 139,579 (25,877) 185,425 124,037 (61,388)
Total Portfolio Investments and related party guarantees 654,047 566,678 (87,369) 636,010 493,654 (142,356)
50

(1) Comprised of net cash consideration invested since inception, with the exception of TopCo LP Class A and Class B Limited Partnership Interests and indirect equity interest in Nova Pioneer.
(2) In connection with the Transaction and the HFP 3.0% Debentures, the company entered into related party guarantees with Fairfax (see notes 2, 8, and 13 to the interim consolidated financial statements for the three and nine months ended September 30, 2021).
(3) At December 31, 2020 the company did not expect to recover any of its initial investment in CIG common shares, the PGR2 Loan, Atlas Mara Warrants, and Nova Pioneer Warrants, and the fair values of these investments are nil.
(4) On December 8, 2020 HFP acquired all of the issued and outstanding TopCo LP Class A and Class B Limited Partnership Interests from Helios Holdings Limited and Helios Holdings Partners Limited for $88,465 and $186,834 respectively, in exchange for non-cash consideration of 25,452,865 multiple voting shares and 24,632,413 subordinate voting shares of HFP, representing 45.9% of the equity and voting interest in HFP.
(5) The repayment terms of the HFP 3.0% Debentures, issued by Fairfax, gave rise to the HFP Redemption Derivative, which had a fair value at initial recognition of $21,864. As the transaction was entered by Fairfax in its capacity as a shareholder, the benefit at inception was recorded in contributed surplus within common shareholders’ equity (see note 8 to the interim consolidated financial statements for the three and nine months ended September 30, 2021).
Summary of Changes in the Fair Value of the Company's Portfolio Investments
A summary of changes in the fair value of the company’s Public and Private Portfolio Investments for the third quarters and first nine months of 2021 and 2020 were as follows:
Third quarter2021
Balance as of July 1 Purchases
Sales / Distributions / Redemptions/ Conversions
Accretion of discount(1)
Net realized gains
(losses) on investments
Net change in unrealized
gains (losses) on
investments
Net foreign exchange losses on
investments
Balance as of
September 30
Portfolio Investments (excluding Portfolio Investments with related party guarantees(2)):Public Investments:
Other Common Shares 29,697 — (7,433) — 3,579 1,887 (679) 27,051 Total Public Investments 29,697 — (7,433) — 3,579 1,887 (679) 27,051
Private Investments:Limited partnership investments:
TopCo LP Class A Limited Partnership Interest 86,123 — — — — 3,266 — 89,389 TopCo LP Class B Limited Partnership Interest 179,138 — (1,440) — — (13,364) — 164,334 Helios Fund IV Limited Partnership Interest 25,966 — — — — 716 — 26,682
291,227 — (1,440) — — (9,382) — 280,405 Common Shares:
NBA Africa common shares 30,000 — — — — — — 30,000 Indirect equity interest in Access Bank SA 1,439 — — — — 945 (1,018) 1,366 Indirect equity interest in Nova Pioneer — 38,811 — — — — — 38,811
31,439 38,811 — — — 945 (1,018) 70,177 Loans:
CIG Loan 21,010 — — — — (15) (1,055) 19,940 AFGRI International Facility — 9,600 — 32 — — — 9,632
21,010 9,600 — 32 — (15) (1,055) 29,572 Bonds:
Atlas Mara 11.0% Convertible Bonds 3,320 — — — — (3,320) — — Atlas Mara 7.5% Bonds 20,000 — — — — (106) — 19,894 Nova Pioneer Bonds 34,711 — (34,711) — (9,541) 9,541 — —
58,031 — (34,711) — (9,541) 6,115 — 19,894 Total Private Investments 401,707 48,411 (36,151) 32 (9,541) (2,337) (2,073) 400,048 Total Portfolio Investments (excluding Portfolio Investments with related party guarantees(2)) 431,404 48,411 (43,584) 32 (5,962) (450) (2,752) 427,099
Portfolio Investments with related party guarantees(2):Reference Investments & HFP Redemption Derivative:
Indirect equity interest in AGH 59,666 — — — — (1,039) (2,999) 55,628 Philafrica common shares 8,471 — — — — 949 (1,159) 8,261 Philafrica Facility(3) 7,712 171 — 4 — (6) (394) 7,487 HFP Redemption Derivative(2)(4) 17,428 — — — — 271 — 17,699
93,277 171 — 4 — 175 (4,552) 89,075 Atlas Mara Facility & Guarantee:
Atlas Mara Facility 31,401 — — — — (14,050) — 17,351 Atlas Mara Facility Guarantee(2) 14,407 — — — — 18,746 — 33,153
45,808 — — — — 4,696 — 50,504 Total Portfolio Investments with related party guarantees(2) 139,085 171 — 4 — 4,871 (4,552) 139,579 Total Portfolio Investments and related party guarantees 570,489 48,582 (43,584) 36 (5,962) 4,421 (7,304) 566,678
(1) Recorded in interest within the consolidated statement of earnings (loss) and comprehensive income (loss). (2) In connection with the Transaction and the HFP 3.0% Debentures, the company entered into related party guarantees with Fairfax (see notes 2, 8, and 13).(3) Purchases in the third quarter of 2021 of $171 related to capitalized interest. (4) The repayment terms of the HFP 3.0% Debentures, issued by Fairfax, gave rise to the HFP Redemption Derivative, which had a fair value at initial recognition
of $21,864. As the transaction was entered by Fairfax in its capacity as a shareholder, the benefit at inception was recorded in contributed surplus within common shareholders’ equity (see note 8).
51

Third quarter2020
Balance as of July 1 Purchases
Accretion of discount/
(amortization of premium)(1)
Net change in unrealized
gains (losses) on investments
Net foreign exchange gains on investments
Balance as of September 30
Portfolio Investments (excluding Portfolio Investments with related party guarantees(2)):
Public Investments:Common shares:
CIG common shares 6,450 — — (5,675) 1,680 2,455 Other Common Shares 11,562 — — 211 445 12,218
Total Public Investments 18,012 — — (5,464) 2,125 14,673 Private Investments:
Common shares:Indirect equity interest in AGH 63,143 — — (8,858) 2,269 56,554 Philafrica common shares 15,156 — — (6,445) 780 9,491 Indirect equity interest in Access Bank SA 5,514 — — (4,967) 685 1,232
83,813 — — (20,270) 3,734 67,277 Loans:
CIG Loan 15,567 — 29 (529) 701 15,768 PGR2 Loan 18,552 — — (17,326) 817 2,043 Philafrica Facility(3) 5,714 137 36 7 240 6,134
39,833 137 65 (17,848) 1,758 23,945 Bonds:
Atlas Mara 11.0% Convertible Bonds(4) 19,551 521 (24) (5,027) — 15,021 Atlas Mara 7.5% Bonds 19,420 — 193 (5,111) — 14,502 Nova Pioneer Bonds(5) 43,774 2,536 (1) 105 — 46,414
82,745 3,057 168 (10,033) — 75,937 Derivatives: Atlas Mara Warrants 3 — — (2) — 1 Nova Pioneer Warrants 707 — — (344) — 363
710 — — (346) — 364 Total Private Investments 207,101 3,194 233 (48,497) 5,492 167,523
Total Portfolio Investments (excluding Portfolio Investments with related party guarantees(2)) 225,113 3,194 233 (53,961) 7,617 182,196
Portfolio Investments with related party guarantees(2):Atlas Mara Common Shares and Forward Derivative:
Atlas Mara common shares 34,396 — — (11,082) — 23,314 Atlas Mara Forward Derivative(2) — 6,056 — 9,730 — 15,786
34,396 6,056 — (1,352) — 39,100 Atlas Mara Facility & Guarantee:
Atlas Mara Facility(6) 39,612 1,921 136 (10,614) — 31,055 Atlas Mara Facility Guarantee(2) — 2,799 — 9,648 — 12,447
39,612 4,720 136 (966) — 43,502 Total Portfolio Investments with related party guarantees(2) 74,008 10,776 136 (2,318) — 82,602 Total Portfolio Investments and related party guarantees 299,121 13,970 369 (56,279) 7,617 264,798
(1) Recorded in interest within the consolidated statement of earnings (loss) and comprehensive income (loss).(2) In connection with the Transaction (see note 2), the company entered into related party guarantees with Fairfax (see note 13).(3) Purchases in the third quarter of 2020 of $137 related to capitalized interest.(4) Purchases in the third quarter of 2020 of $521 related to capitalized interest.(5) Purchases in the third quarter of 2020 of $2,536 related to capitalized interest.(6) Purchases in the third quarter of 2020 included $1,002 related to capitalized interest.
52

First nine months2021
Balance as of January 1 Purchases
Sales / Distributions / Redemptions/ Conversions
Accretion of discount(1)
Net realized gains (losses)
on investments
Net change in unrealized
gains (losses) on
investments
Net foreign exchange losses on
investments
Balance as of September
30
Portfolio Investments (excluding Portfolio Investments with related party guarantees(2)):
Public Investments:
Common shares:
Other Common Shares 14,836 5,812 (7,433) — 3,579 10,581 (324) 27,051 Total Public Investments 14,836 5,812 (7,433) — 3,579 10,581 (324) 27,051
Private Investments:
Limited partnership investments:
TopCo LP Class A Limited Partnership Interest(3) 88,465 — (5,812) — — 6,736 — 89,389 TopCo LP Class B Limited Partnership Interest 186,834 — (1,440) — — (21,060) — 164,334 Helios Fund IV Limited Partnership Interest — 22,413 — — — 4,269 — 26,682
275,299 22,413 (7,252) — — (10,055) — 280,405 Common shares:
NBA Africa common shares — 30,000 — — — — — 30,000 Indirect equity interest in Access Bank SA 1,399 — — — — 427 (460) 1,366 Indirect equity interest in Nova Pioneer — 38,811 — — — — — 38,811
1,399 68,811 — — — 427 (460) 70,177 Loans:
CIG Loan 19,254 — — — — 1,163 (477) 19,940 AFGRI International Facility — 9,600 — 32 — — — 9,632
19,254 9,600 — 32 — 1,163 (477) 29,572 Bonds:
Atlas Mara 11.0% Convertible Bonds 2,442 — — — — (2,442) — — Atlas Mara 7.5% Bonds 19,966 — — — — (72) — 19,894 Nova Pioneer Bonds 36,421 — (34,711) — (9,541) 7,831 — —
58,829 — (34,711) — (9,541) 5,317 — 19,894
Total Private Investments 354,781 100,824 (41,963) 32 (9,541) (3,148) (937) 400,048
Total portfolio investments (excluding Portfolio Investments with related party guarantees(2)) 369,617 106,636 (49,396) 32 (5,962) 7,433 (1,261) 427,099
Portfolio investments with related party guarantees(2):
Reference Investments & HFP Redemption Derivative:
Indirect equity interest in AGH(4) 64,210 33 — — — (7,280) (1,335) 55,628 Philafrica common shares 9,065 — — — — (280) (524) 8,261 Philafrica Facility(5) 7,164 502 — 27 — (28) (178) 7,487 HFP Redemption Derivative(2)(6) — 21,864 — — — (4,165) — 17,699
80,439 22,399 — 27 — (11,753) (2,037) 89,075 Atlas Mara Facility and Guarantee:
Atlas Mara Facility 30,346 — — — — (12,995) — 17,351 Atlas Mara Facility Guarantee(2) 13,252 — — — — 19,901 — 33,153
43,598 — — — — 6,906 — 50,504 Total Portfolio Investments with Related Party Guarantees(2) 124,037 22,399 — 27 — (4,847) (2,037) 139,579 Total Portfolio Investments and related party guarantees 493,654 129,035 (49,396) 59 (5,962) 2,586 (3,298) 566,678
(1) Recorded in interest within the consolidated statement of earnings (loss) and comprehensive income (loss). (2) In connection with the Transaction and the HFP 3.0% Debentures, the company entered into related party guarantees with Fairfax (see notes 2, 8, and 13).(3) Distributions in the first nine months of 2021 of $5,812 related to a distribution of Carried Interest Proceeds in specie of Vivo common shares. (4) Purchases in the first nine months of 2021 of $33 related to capitalized interest.(5) Purchases in the first nine months of 2021 of $502 related to capitalized interest. (6) The repayment terms of the HFP 3.0% Debentures, issued by Fairfax, gave rise to the HFP Redemption Derivative, which had a fair value at initial recognition
of $21,864. As the transaction was entered by Fairfax in its capacity as a shareholder, the benefit at inception was recorded in contributed surplus within common shareholders’ equity (see note 8).
53
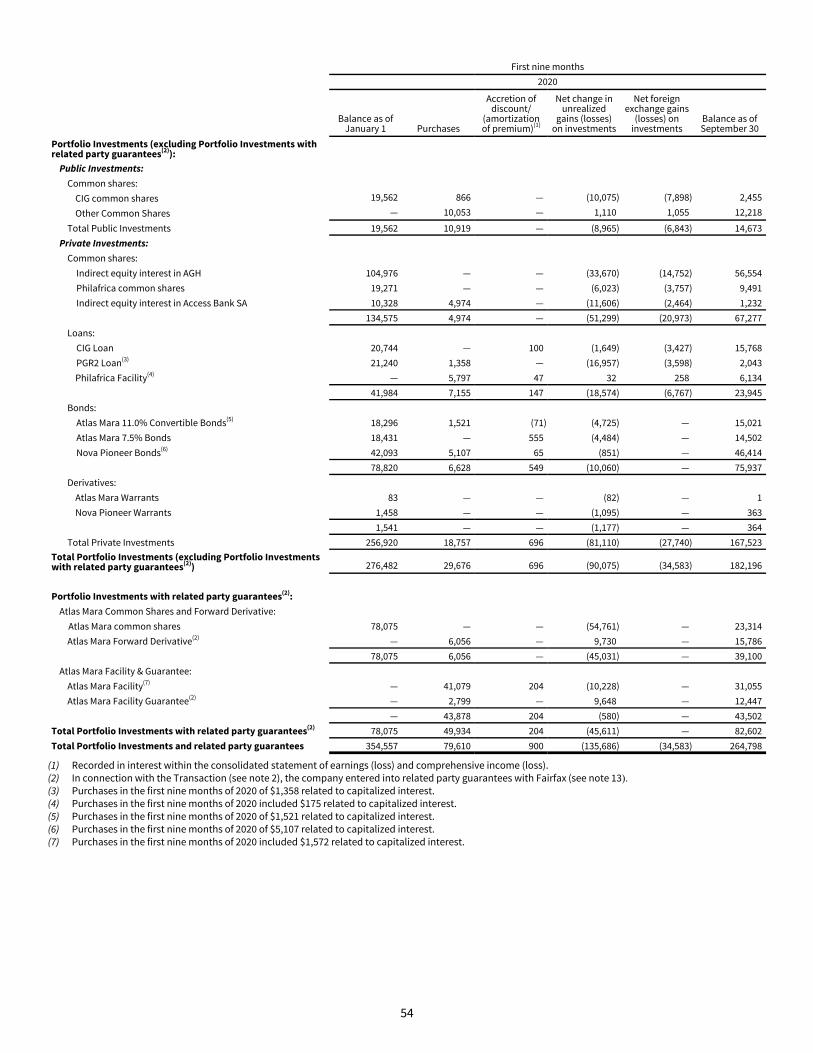
First nine months2020
Balance as of January 1 Purchases
Accretion of discount/
(amortization of premium)(1)
Net change in unrealized
gains (losses) on investments
Net foreign exchange gains
(losses) on investments
Balance as of September 30
Portfolio Investments (excluding Portfolio Investments with related party guarantees(2)):
Public Investments:Common shares:
CIG common shares 19,562 866 — (10,075) (7,898) 2,455
Other Common Shares — 10,053 — 1,110 1,055 12,218
Total Public Investments 19,562 10,919 — (8,965) (6,843) 14,673 Private Investments:
Common shares:Indirect equity interest in AGH 104,976 — — (33,670) (14,752) 56,554 Philafrica common shares 19,271 — — (6,023) (3,757) 9,491 Indirect equity interest in Access Bank SA 10,328 4,974 — (11,606) (2,464) 1,232
134,575 4,974 — (51,299) (20,973) 67,277 Loans:
CIG Loan 20,744 — 100 (1,649) (3,427) 15,768 PGR2 Loan(3) 21,240 1,358 — (16,957) (3,598) 2,043 Philafrica Facility(4) — 5,797 47 32 258 6,134
41,984 7,155 147 (18,574) (6,767) 23,945 Bonds:
Atlas Mara 11.0% Convertible Bonds(5) 18,296 1,521 (71) (4,725) — 15,021 Atlas Mara 7.5% Bonds 18,431 — 555 (4,484) — 14,502 Nova Pioneer Bonds(6) 42,093 5,107 65 (851) — 46,414
78,820 6,628 549 (10,060) — 75,937 Derivatives:
Atlas Mara Warrants 83 — — (82) — 1 Nova Pioneer Warrants 1,458 — — (1,095) — 363
1,541 — — (1,177) — 364 Total Private Investments 256,920 18,757 696 (81,110) (27,740) 167,523
Total Portfolio Investments (excluding Portfolio Investments with related party guarantees(2)) 276,482 29,676 696 (90,075) (34,583) 182,196
Portfolio Investments with related party guarantees(2):Atlas Mara Common Shares and Forward Derivative:
Atlas Mara common shares 78,075 — — (54,761) — 23,314 Atlas Mara Forward Derivative(2) — 6,056 — 9,730 — 15,786
78,075 6,056 — (45,031) — 39,100 Atlas Mara Facility & Guarantee:
Atlas Mara Facility(7) — 41,079 204 (10,228) — 31,055 Atlas Mara Facility Guarantee(2) — 2,799 — 9,648 — 12,447
— 43,878 204 (580) — 43,502 Total Portfolio Investments with related party guarantees(2) 78,075 49,934 204 (45,611) — 82,602 Total Portfolio Investments and related party guarantees 354,557 79,610 900 (135,686) (34,583) 264,798
(1) Recorded in interest within the consolidated statement of earnings (loss) and comprehensive income (loss). (2) In connection with the Transaction (see note 2), the company entered into related party guarantees with Fairfax (see note 13).(3) Purchases in the first nine months of 2020 of $1,358 related to capitalized interest. (4) Purchases in the first nine months of 2020 included $175 related to capitalized interest. (5) Purchases in the first nine months of 2020 of $1,521 related to capitalized interest. (6) Purchases in the first nine months of 2020 of $5,107 related to capitalized interest. (7) Purchases in the first nine months of 2020 included $1,572 related to capitalized interest.
54
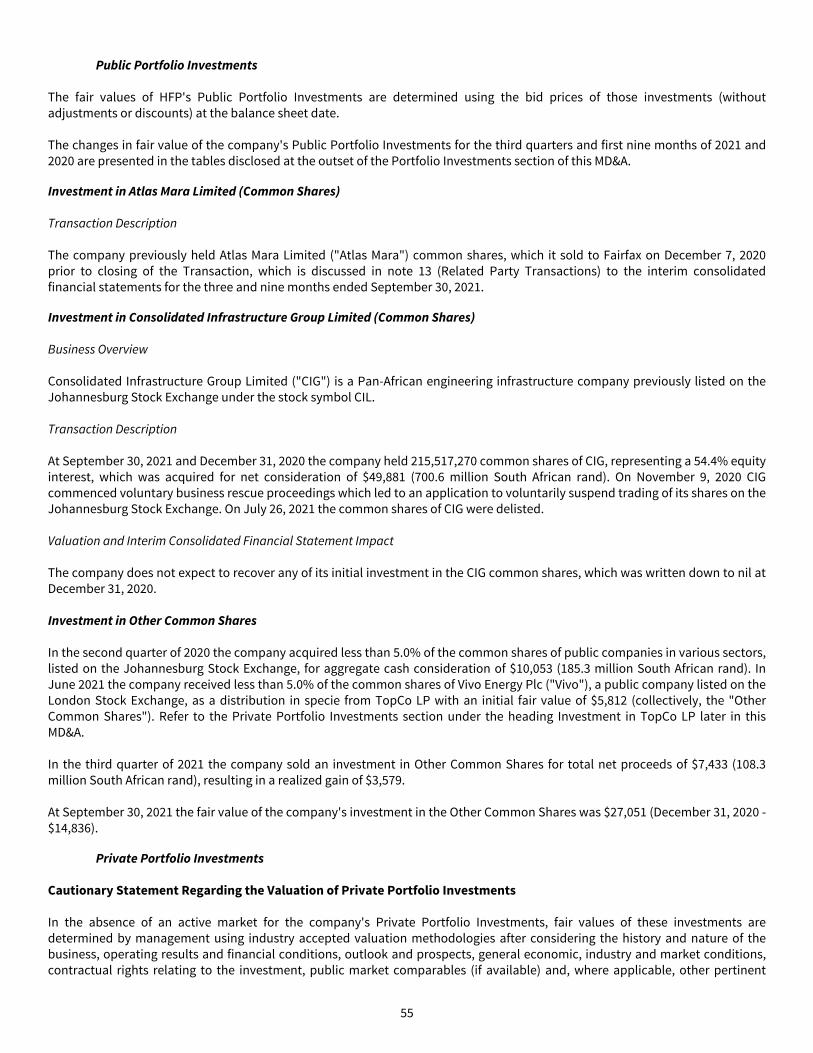
Public Portfolio Investments
The fair values of HFP's Public Portfolio Investments are determined using the bid prices of those investments (without adjustments or discounts) at the balance sheet date.
The changes in fair value of the company's Public Portfolio Investments for the third quarters and first nine months of 2021 and 2020 are presented in the tables disclosed at the outset of the Portfolio Investments section of this MD&A.
Investment in Atlas Mara Limited (Common Shares)
Transaction Description
The company previously held Atlas Mara Limited ("Atlas Mara") common shares, which it sold to Fairfax on December 7, 2020 prior to closing of the Transaction, which is discussed in note 13 (Related Party Transactions) to the interim consolidated financial statements for the three and nine months ended September 30, 2021.
Investment in Consolidated Infrastructure Group Limited (Common Shares)
Business Overview
Consolidated Infrastructure Group Limited ("CIG") is a Pan-African engineering infrastructure company previously listed on the Johannesburg Stock Exchange under the stock symbol CIL.
Transaction Description
At September 30, 2021 and December 31, 2020 the company held 215,517,270 common shares of CIG, representing a 54.4% equity interest, which was acquired for net consideration of $49,881 (700.6 million South African rand). On November 9, 2020 CIG commenced voluntary business rescue proceedings which led to an application to voluntarily suspend trading of its shares on the Johannesburg Stock Exchange. On July 26, 2021 the common shares of CIG were delisted.
Valuation and Interim Consolidated Financial Statement Impact
The company does not expect to recover any of its initial investment in the CIG common shares, which was written down to nil at December 31, 2020.
Investment in Other Common Shares
In the second quarter of 2020 the company acquired less than 5.0% of the common shares of public companies in various sectors, listed on the Johannesburg Stock Exchange, for aggregate cash consideration of $10,053 (185.3 million South African rand). In June 2021 the company received less than 5.0% of the common shares of Vivo Energy Plc ("Vivo"), a public company listed on the London Stock Exchange, as a distribution in specie from TopCo LP with an initial fair value of $5,812 (collectively, the "Other Common Shares"). Refer to the Private Portfolio Investments section under the heading Investment in TopCo LP later in this MD&A.
In the third quarter of 2021 the company sold an investment in Other Common Shares for total net proceeds of $7,433 (108.3 million South African rand), resulting in a realized gain of $3,579.
At September 30, 2021 the fair value of the company's investment in the Other Common Shares was $27,051 (December 31, 2020 - $14,836).
Private Portfolio Investments
Cautionary Statement Regarding the Valuation of Private Portfolio Investments
In the absence of an active market for the company's Private Portfolio Investments, fair values of these investments are determined by management using industry accepted valuation methodologies after considering the history and nature of the business, operating results and financial conditions, outlook and prospects, general economic, industry and market conditions, contractual rights relating to the investment, public market comparables (if available) and, where applicable, other pertinent
55

considerations. The process of valuing investments for which no active market exists is inevitably based on inherent uncertainties and the resulting values may differ from values that would have been used had an active market existed. The amounts at which the company's Private Portfolio Investments could be disposed of may differ from the fair values assigned and those differences may be material.
While the company's valuation techniques for Private Portfolio Investments remained unchanged (with the exception of the company's investment in the CIG Loan) during the third quarter and first nine months of 2021, the development of unobservable inputs included added uncertainty related to the economic disruption caused by the ongoing COVID-19 pandemic. The uncertainty in those assumptions has been incorporated into the company's valuations of Private Portfolio Investments primarily through wider credit spreads and higher risk premiums, as applicable.
The changes in fair value of the company's Private Portfolio Investments for the third quarters and first nine months of 2021 and 2020 are presented in the tables disclosed at the outset of the Portfolio Investments section of this MD&A.
Investment in TopCo LP
Business Overview
TopCo LP is a limited partnership established under the laws of Guernsey and is controlled by its general partner, HFA GP (Guernsey) Limited, an affiliate of the Helios Holdings Group. TopCo LP was formed as the investment vehicle through which HFP will receive cash flows from its entitlement to certain Helios fee streams. TopCo LP is the portfolio advisor of the company and its consolidated subsidiaries and has entered into a sub-advisory agreement with the Manager to provide the investment and advisory services to HFP. TopCo LP will earn investment advisory fees from HFP. Further details on the company's transactions with TopCo LP are discussed in note 13 (Related Party Transactions) to the interim consolidated financial statements for the three and nine months ended September 30, 2021.
Immediately prior to the closing of the Transaction, TopCo LP was admitted as a limited partner of the Carried Interest Recipients, defined below, entitling it to its share of the carried interest earned on Helios Funds by way of distributions arising from the Carried Interest Recipients. TopCo LP also entered into contractual arrangements with certain affiliates of the Helios Holdings Group, entitling it to the management fees earned on the Helios Funds.
Transaction Description
On December 8, 2020, pursuant to the terms of the purchase and sale agreement entered into on July 10, 2020, HFP acquired all of the issued and outstanding TopCo LP Class A and Class B Limited Partnership Interests from HHL and Helios Holdings Partners Limited ("HHPL") for $88,465 and $186,834 respectively, in exchange for 25,452,865 multiple voting shares and 24,632,413 subordinate voting shares of HFP issued to HHL and HHPL, representing 45.9% of the equity and voting interest in HFP. Immediately following the closing of the Transaction, each of HHL and HHPL transferred the HFP shares to Principal Holdco, a Luxembourg holding company, indirectly owned by Tope Lawani and Babatunde Soyoye. HFP may not transfer or otherwise dispose of its TopCo LP Class A and Class B Limited Partnership Interests without consent from the general partner of TopCo LP. TopCo LP reports its financial performance in U.S. dollars.
TopCo LP Class A Limited Partnership Interest
TopCo LP is a limited partner of Helios Investors Genpar, L.P., HIP Equity II, L.P., HIP Equity III, L.P. and HIP Equity IV, L.P. (collectively, the “Carried Interest Recipients”) and as such is entitled to receive Carried Interest Proceeds. Carried Interest Proceeds include 25% of carried interest amounts generated by any existing fund managed by Helios or any of its affiliates, excluding Helios Investors IV, L.P.; and 50% of carried interest amounts generated by any future fund managed by Helios or any of its affiliates, including Helios Investors IV, L.P. HFP's TopCo LP Class A Limited Partnership Interest entitles HFP to receive the Carried Interest Proceeds received by TopCo LP when relevant amounts become available for distribution. The company may be subject to clawback obligations with respect to its TopCo LP Class A Limited Partnership Interest to the extent HFP has received Carried Interest Proceeds and a clawback is required. The risk is partially mitigated by escrow accounts required by each Helios Fund in accordance with their respective governing documents.
In September 2020 HHL, through its interest in Helios Investors Genpar, L.P, received carried interest as a distribution in specie from Helios Investors, L.P. ("Helios Fund I") in the form of Vivo common shares. On June 29, 2021 the company received Vivo common shares from HHL which reflected HFP’s pro rata share of Carried Interest Proceeds. Concurrent with the transaction, the company advanced $7,733 to HHL, and HHL and TopCo LP’s general partner agreed that HHL shall transfer $7,733 to TopCo LP
56

for the benefit of the TopCo LP Class A Limited Partnership Interest holder. Prior to the distribution, the Carried Interest Proceeds arising from the Vivo common shares ($5,812) were included in the initial valuation of TopCo LP Class A Limited Partnership Interests at December 8, 2020 which reflected the fair value attributable to those common shares. Accordingly, on June 29, 2021 the company recorded: (i) Vivo common shares at an initial cost of $5,812; (ii) a return of capital of $5,812 on TopCo LP Class A Limited Partnership Interest; (iii) a net change in unrealized gain on Vivo common shares of $1,823 in the second quarter and first six months of 2021, partially offset by foreign exchange losses on Vivo common shares of $8 in the same periods; and (iv) a receivable from related parties of $7,733.
TopCo LP Class B Limited Partnership Interest
TopCo LP entered into contractual arrangements with certain Helios Holdings Group entities, pursuant to which the Helios Holdings Group entities entitled to receive management fees assigned their respective rights to receive all management fees to TopCo LP and TopCo LP agreed to pay all expenses incurred in order to earn the management fees ("Excess Management Fees"). HFP's ownership of TopCo LP Class B Limited Partnership Interest entitles HFP to receive Excess Management Fees after a six-month holding period by TopCo LP. The initial six-month holding period ended June 30, 2021.
In the third quarter of 2021 the company recognized a distribution receivable from its TopCo LP Class B Limited Partnership Interest of $1,440, which reflected Excess Management Fees earned during the first six months of 2021. Accordingly, on September 30, 2021 the company recorded a reduction in the valuation of TopCo LP Class B Limited Partnership Interest and a receivable from related parties of $1,440.
Key Business Drivers, Events, and Risks
TopCo LP is structured to accumulate and distribute Carried Interest Proceeds from the Carried Interest Recipients and Excess Management Fees from the Helios Holdings Group to HFP by virtue of HFP's TopCo LP Class A and Class B Limited Partnership Interests respectively, and the investment and advisory fees from HFP to the Helios Holdings Group. The Carried Interest Proceeds and Excess Management Fees are earned from underlying Helios Funds, managed by the Helios Holdings Group.
Valuation and Consolidated Financial Statement Impact
TopCo LP Class A Limited Partnership Interest
At September 30, 2021 the company estimated the fair value of its TopCo LP Class A Limited Partnership Interest using a discounted cash flow analysis based on multi-year free cash flow forecasts with assumed discount rates ranging from 22.4% to 28.4% (December 31, 2020 - 21.0% to 27.0%), target exit multiples of invested capital averaging 2.5x to 2.6x across Helios Fund II, Helios Fund III and Helios Fund IV (December 31, 2020 - 2.1x to 2.6x across all existing Helios funds), and forecasted exit dates ranging from 2021 to 2024 for Helios Fund II and Helios Fund III, and from 2022 to 2027 for Helios Fund IV (December 31, 2020 - 2021 to 2024 and 2022 to 2027). At September 30, 2021 free cash flow forecasts were based on estimates of Carried Interest Proceeds derived for each fund in accordance with waterfall provisions, prepared in the third quarter of 2021 by Helios' management (December 31, 2020 - fourth quarter of 2020).
The limited partnership agreement for each Helios Fund includes a distribution waterfall provision, which is common in private equity fund structures, and requires that proceeds (generated following realizations or partial realizations of the relevant fund’s investments or as other income becomes available to the relevant fund for distribution) are distributed in four stages: (i) a return of amounts contributed by investors and not previously repaid to those investors by the fund; (ii) an 8% preferred return to investors; (iii) a “catch-up” amount to the relevant Helios Holdings Group entity equal to 20% of all amounts distributed to all partners in excess of amounts distributed to limited partners to repay their drawn down capital contributions; and (iv) a split of all remaining profits between limited partners and the relevant Helios Holdings Group entity at an 80:20 ratio.
Free Cash Flow Forecast Inputs
The primary drivers of free cash flow estimates are the exit assumptions on Helios Funds' underlying portfolio investments, including the planned exit strategy, target exit multiples of invested capital and timing of exit. The target exit multiple of invested capital for an underlying portfolio investment is equal to the fund's expected total proceeds divided by the expected total cost from initial investment to exit. Carried Interest Proceeds which may arise in future Helios Funds have been excluded from free cash flow estimates. In the event that target exit timings are not met and delayed in future periods, this may result in a negative impact on the fair value of the company's TopCo LP Class A Limited Partnership Interest.
57

Current Model Assumptions
The following table describes the components of fair value, which include the Helios Funds and their underlying investments at June 30, 2021, and provides a summary of inputs used in the company's internal valuation model to estimate the fair value of the company's investment in the TopCo LP Class A Limited Partnership Interest at September 30, 2021:
Method of valuing underlying portfolio
investments Model inputs
Components of valueVintage
YearCommitted
CapitalTraded
share price
Internal valuation
modelTarget
exit year
Average target exit multiple of
invested capital
HFP's share of carried
interest
Fair value of carried interest
to HFP
Helios Investors II, L.P. ("Helios Fund II")(1) 2009 908,500 50.8 % 49.2 % 2022-2023 2.6x 25 % 34,811
Helios Investors III, L.P. ("Helios Fund III")(2) 2014 1,117,000 18.2 % 81.8 % 2021-2024 2.6x 25 % 54,118
Helios Investors IV, L.P. ("Helios Fund IV")(3) 2020 290,050 0.0 % 100.0 % 2022-2027 2.5x 50 % 460
89,389
(1) Helios Fund II is a private equity fund domiciled in the Cayman Islands that was formed in 2009 with the purpose of investing in companies that operate primarily in Africa. At June 30, 2021 the underlying portfolio investments in Helios Fund II were primarily comprised of investments in: (i) a public company operating in the fuel distribution sector across Africa (33.2% of portfolio); (ii) a private company offering electronic payment processing services in Nigeria (26.5% of portfolio); (iii) a public company operating in the telecommunication infrastructure sector across Africa (16.0% of portfolio); and (iv) a private company operating in the financial services sector across Africa (9.3% of portfolio).
(2) Helios Fund III is a private equity fund domiciled in the Cayman Islands that was formed in 2014 with the purpose of investing in companies that operate primarily in Africa. At June 30, 2021 the underlying portfolio investments in Helios Fund III were primarily comprised of investments in: (i) a private company operating in the financial services sector across Africa (18.9% of portfolio); (ii) a public company providing electronic payment processing services in Egypt (16.3% of portfolio); (iii) a private company operating in the gas distribution sector in Nigeria (12.8% of portfolio); (iv) a private company operating in the consumer goods sector across Africa (11.1% of portfolio; later exited in September 2021); (v) a private company that imports and distributes agricultural inputs across Africa (7.9% of portfolio); (vi) a private company that operates a liquefied natural gas terminal in Ghana (6.7% of portfolio); (vii) a private company operating in the agricultural sector in Egypt (4.6% of portfolio); and (viii) a private company that provides electronic payment processing services in Egypt (4.2% of portfolio).
(3) Helios Fund IV is a private equity fund domiciled in the Cayman Islands that was formed in 2020 with the purpose of investing in companies that operate primarily in Africa. At June 30, 2021 the underlying portfolio investments in Helios Fund IV were primarily comprised of investments in: (i) a private company operating in the consumer goods sector in Morocco (45.5% of portfolio); (ii) a private company that provides electronic payment processing services globally (including Africa) (37.4% of portfolio); and (iii) a private insurance company established in 2020 and expected to operate across Africa (17.1% of portfolio).
Discount rates were based on the company's assessment of risk premiums to the appropriate risk-free rate of the economic environment in which the Helios private equity funds operate. These risk premiums were reflective of the increased uncertainty of the free cash flow forecasts as a result of the economic and social impacts of the COVID-19 pandemic.
At September 30, 2021 the company's internal valuation model indicated that the fair value of its TopCo LP Class A Limited Partnership Interest was $89,389.
At December 31, 2020 the initial transaction price of the company's initial investment in the TopCo LP Class A Limited Partnership Interest on December 8, 2020 was considered to approximate fair value as there were no significant changes to TopCo LP's business, capital structure or operating environment and the key assumptions in the company's acquisition valuation model continued to be valid. At December 31, 2020 the fair value of the company's investment in TopCo LP Class A Limited Partnership Interest was $88,465.
TopCo LP Class B Limited Partnership Interest
At September 30, 2021 the company estimated the fair value of its TopCo LP Class B Limited Partnership Interest using a discounted cash flow analysis based on multi-year free cash flow forecasts with an assumed discount rate of 21.7%, a long term growth rate of 4.5% and a long term pre-tax profit margin of 52.2% (December 31, 2020 - discount rate of 19.3%, long term growth rate of 4.5% and long term pre-tax profit margin of 52.3%). At September 30, 2021 free cash flow forecasts were based on Excess Management Fee forecasts prepared in the fourth quarter of 2020 by Helios' management (December 31, 2020 - fourth quarter of 2020).
Free Cash Flow Forecast Inputs
The primary drivers of the free cash flow estimates are the forecasted growth in assets under management over eight years through the creation of new Helios private equity, infrastructure, and real estate funds, and the expected use of operating leverage to grow profit margins. Based on committed capital of the Helios Funds in place at the end of the fourth quarter of 2020 of approximately $2.3 billion (excluding Helios Fund I which is in the process of closing), the forecasted growth in assets under
58

management implies a compound annual growth rate in committed capital of 18.7% over the eight year forecasting period. In the event that TopCo LP does not achieve its forecasted growth in assets under management in future periods, this may result in a negative impact on the fair value of the company's TopCo LP Class B Limited Partnership Interest.
Current Model Assumptions
As a result of the continued business disruptions caused by the COVID-19 pandemic, free cash flow forecasts reflected increased market volatility and government-mandated travel restrictions, which in the short term caused a delay in Helios' fundraising activities for Helios Fund IV. The development of these free cash flow forecasts was subject to a higher degree of estimation uncertainty that was primarily driven by a forecasting period of eight years, and forecasted growth in assets under management due to the expected demand for future Africa-focused alternative asset funds. A forecasting period of eight years was used due to the inherent long-term nature of Africa-focused private equity, infrastructure and real estate funds, which require additional time to fundraise, deploy capital and prepare investments for exit. These factors contributed to a higher degree of estimation uncertainty in the free cash flow estimates which was primarily reflected through higher discount rates and in the estimation of the long term pre-tax profit margin expected to be achieved at the end of the forecasting period.
The discount rate was based on the company's assessment of risk premiums to the appropriate risk-free rate of the economic environment in which the Helios Funds operate. These risk premiums were reflective of the increased uncertainty of free cash flow forecasts as a result of the economic and social impacts of the COVID-19 pandemic. Long term pre-tax profit margins were estimated based on comparable pre-tax management fee-related earnings margins of publicly listed global private equity asset managers. Long term growth rates were based on the expected long term sustainable growth rate of the economic environments in which TopCo LP conducts asset management activities. At September 30, 2021 the company's internal valuation model indicated that the fair value of its TopCo LP Class B Limited Partnership Interest was $164,334.
At December 31, 2020 the initial transaction price of the company's initial investment in the TopCo LP Class B Limited Partnership Interest on December 8, 2020 was considered to approximate fair value as there were no significant changes to TopCo LP's business, capital structure or operating environment and the key assumptions in the company's acquisition valuation model continued to be valid. At December 31, 2020 the fair value of the company's investment in TopCo LP Class B Limited Partnership Interest was $186,834.
TopCo LP's Summarized Financial Information
TopCo LP and the company's fiscal year ends on December 31. Summarized below are TopCo LP’s key performance measures:
Excess management fees are accrued each quarter by TopCo LP as they are earned by the underlying general partner of the Helios Funds. Excess management fees are equal to the total management fees which are a fixed percentage of the underlying capital of the funds, less expenses incurred during the period in earning such fees from the Helios Funds.
Carried interest reflects TopCo LP's share of a Helios Fund's cumulative net returns allocated to the general partner of the Helios Fund after a pre-determined minimum preferred return to limited partners of the Helios Fund has been achieved. Carried interest is recognized and distributable to the Class A unitholder of TopCo LP when the fund’s cumulative returns are in excess of the minimum preferred returns and when the underlying portfolio investment is sold or otherwise liquidated.
Unrealized carried interest is a non-GAAP measure and reflects the hypothetical amount that would be received as carried interest by TopCo LP if all Helios Funds had exceeded their minimum preferred return and the related underlying portfolio assets that gave rise to carried interest were realized at their fair values at the reporting date, less any carried interest recorded to date. The valuations of the underlying portfolio assets are performed in accordance with the International Private Equity and Venture Capital Valuation ("IPEV") Guidelines. Unrealized carried interest is not recognized on TopCo LP's balance sheets or statements of earnings (loss) and comprehensive income (loss) as it is related to future realizations of investments, future investment performance and timing of monetizations, for which the probability of reversal and timing of realizations is uncertain.
Total realized and unrealized carried interest is a non-GAAP measure and is calculated as the aggregate of carried interest and unrealized carried interest.
59

Summarized below are TopCo LP's balance sheets at June 30, 2021 and December 31, 2020.
Balance Sheets (unaudited - US$ thousands)
US$June 30, 2021 December 31, 2020
Carriedinterest — 7,234 Duefromaffiliates 12,225 — Duetoaffiliates 678 — Otherliabilities 2,373 — Partners'capital 9,174 7,234
Carried interest decreased from $7,234 at December 31, 2020 to nil at June 30, 2021. The decrease is a result of the distribution in specie of carried interest received from Helios Fund I.
Summarized below is selected financial information of TopCo LP for the six months ended June 30, 2021.
Excess management fees(unaudited - US$ thousands)
US$
Six months ended June 30, 2021
Managementfeesearned 15,428 Expensesincurred 13,988 Excessmanagementfees(duetoHFP) 1,440
TopCo LP’s carried interest balance and reconciliation to total realized and unrealized carried interest as at June 30, 2021 and December 31, 2020 are presented below:
(unaudited - US$ thousands)US$
June 30, 2021 December 31, 2020Carriedinterest — 7,234 Unrealizedcarriedinterest 83,557 49,525 Totalrealizedandunrealizedcarriedinterest 83,557 56,759
The increase in the total realized and unrealized carried interest from December 31, 2020 to June 30, 2021 was $26,798. The increase in total realized and unrealized carried interest was principally a result of strong performance of portfolio assets held in Helios Fund II and Helios Fund III.
Investment in Helios Investors IV, L.P.
Business Overview
Helios Investors IV, L.P. ("Helios Fund IV") is a limited partnership based in the Cayman Islands, structured to receive and deploy capital from limited partners with the objective of earning returns from investments directly or indirectly in, or with a nexus to, Africa. Helios Fund IV is controlled by its general partner, Helios Investors Genpar IV, Ltd. ("Helios Fund IV GP").
Transaction Description
On March 31, 2021 the company committed to invest $50,000 in Helios Fund IV. At September 30, 2021 the company had funded aggregate capital calls of $21,897, plus equalization interest of $516, for total funding of $22,413, representing 17.2% of the limited partnership interest in Helios Fund IV. As agreed in a side letter with the Helios Fund IV GP, the company was admitted to Helios Fund IV as a "Listed Fund" under the terms of Helios Fund IV's limited partnership agreement, as amended and restated (the "Helios Fund IV LPA"), meaning that the company will not incur any management fees nor any carried interest payable to
60

Helios Fund IV GP with respect to its investment in Helios Fund IV, which would otherwise be incurred in accordance with the Helios Fund IV LPA.
Key Business Drivers, Events, Risks
At September 30, 2021 Helios Fund IV's portfolio included investments in (i) a payments network providing interconnectivity between payment companies and methods across emerging markets, operating across over 80 countries in Africa, Asia, and Latin America; (ii) a reinsurer and managing agent specializing in corporate and specialty risk in Africa; and (iii) a North African discount grocery retailer with over 500 stores. At September 30, 2021 Helios Fund IV had capital commitments from its general and limited partners of $290,050, of which $160,456 remained uncalled.
Valuation and Interim Consolidated Financial Statement Impact
At September 30, 2021, the company estimated the fair value of its investment in Helios Fund IV Limited Partnership Interest to be $26,682 based on the June 30, 2021 net asset value provided by Helios Fund IV GP. The fair values of the underlying assets are determined using industry accepted valuation models for equity instruments.
At September 30, 2021 the company's remaining capital commitment to Helios Fund IV was $28,103, which may be called at any time by Helios Fund IV GP in accordance with the Helios Fund IV LPA.
Investment in NBA Africa
Business Overview
NBA Africa, LLC ("NBA Africa") is a new entity formed by the National Basketball Association ("NBA") to conduct the league's business in Africa including the Basketball Africa League, a partnership between the NBA and the International Basketball Federation.
Transaction Description
In May 2021 the company formed a wholly-owned subsidiary, HFP US Investments, Inc. ("U.S. Sub"), for the sole purpose of investing in NBA Africa. On May 7, 2021 the company, through U.S. Sub, invested $30,000 in exchange for an equity interest in NBA Africa.
Valuation and Interim Consolidated Financial Statement Impact
At September 30, 2021 the initial transaction price was considered to approximate fair value as there had been no significant changes to NBA Africa's business, capital structure, or operating environment and the key assumptions in the company's acquisition valuation model continued to be valid. At September 30, 2021 the fair value of the company's investment in NBA Africa was $30,000.
Investment in AGH
Business Overview
AFGRI Holdings Proprietary Limited ("AFGRI Holdings") is a private holding company based in South Africa that owns 100.0% of AFGRI Group Holdings Proprietary Limited ("AGH"), an investment holding company with interests in a number of agricultural and food-related companies providing products and services to ensure sustainable agriculture. AGH's core focus is grain commodities and it provides services across the entire grain production and storage cycle, offering financial support and solutions as well as high-tech equipment through the John Deere brand supported by a large retail footprint. AGH is one of the largest John Deere distributors outside of the United States, with presence in Southern Africa and Western Australia.AGH’s investment philosophy is to create long term sustainable value by targeting investments in agriculture and food processing, by building or acquiring equity interests in companies which provide AGH control or significant influence. AGH’s long term growth strategy is based on a vision to ensure sustainable agriculture and enable food security across Africa. In addition to South Africa, AGH currently has operational activities aimed at supporting agriculture in Zimbabwe, Mozambique, and Botswana. AGH has a John Deere operation in Australia, an animal feeds research and development venture in the United Kingdom, and an investment in animal feeds in the United States of America.
61

AGH's principal lines of business are comprised of:• A 73.2% controlling interest in AFGRI Agri Services Proprietary Limited ("AFGRI") (agricultural services company which
focuses on grain management, silo management, equipment sales through the John Deere brand, agricultural finance and insurance, and retail and farmer development);
• A 60.0% controlling interest in Philafrica Foods Proprietary Ltd. ("Philafrica") (a food processing provider operating primarily in South Africa);
• GroCapital Advisory Services Proprietary Limited ("GroCapital Advisory"), a collateral management solutions provider as well as a commodity brokering services provider; and
• AFGRI International Proprietary Limited ("AFGRI International") (focus on operations outside of South Africa, primarily comprised of the Western Australian equipment business).
Transaction Description
Indirect equity interest in AGH
At September 30, 2021 and December 31, 2020 the company had invested an aggregate of $98,876 in Joseph Holdings (comprised of 74.6% of the common shares and 73.7% of the Class A shares, providing a 74.6% voting interest; and a $10,132 shareholder loan). HFP is the largest beneficial shareholder of AGH, through its investment in Joseph Holdings, with a 46.8% indirect equity interest (December 31, 2020 - 46.8%).
On December 15, 2020 AFGRI Holdings and AGH entered into a standstill agreement with certain lenders (the "AGH standstill agreement") as a result of liquidity pressures arising from the trade volatility caused by the COVID-19 pandemic. The execution of the AGH standstill agreement was a key component of AGH's preliminary plan to restructure its balance sheet for the benefit of all stakeholders. On August 24, 2021 upon expiry of the AGH standstill agreement and concurrent with the execution of the AFGRI International Facility, AGH entered into a debt restructuring agreement with its lenders which formalized a monthly repayment plan to fully repay lenders by December 31, 2021 through monetization or sale of certain non-core assets.
AFGRI International Facility
On August 20, 2021 the company entered into a secured lending arrangement with AFGRI International, a wholly-owned South African subsidiary of AGH, pursuant to which the company agreed to provide up to $10,000 of financing (the "AFGRI International Facility"). The AFGRI International Facility is primarily secured by AFGRI International's pledge of its equity interests in its wholly-owned Australian equipment business, AFGRI Australia Proprietary Limited. The AFGRI International Facility bears interest at a rate of 12.75% per annum, accrued and capitalized quarterly. On August 26, 2021 the company advanced $9,600, net of $400 in raising fees, under the AFGRI International Facility. The AFGRI International Facility matures on August 26, 2022, one year from initial funding date.
Key Business Drivers, Events, and Risks
AGH is headquartered in South Africa. Refer to the Business Developments section under the heading Operating Environment of this MD&A for a description of the macroeconomic conditions in South Africa.
AGH's key business drivers relate to its ability to sustain and grow its grain management and equipment operations through capital upgrades, support the growth of Philafrica, and offer financial services to the agricultural sector.
In 2019 AGH formed AFGRI Grain Silo Company Proprietary Limited ("AFGRI Grain Silo Company"), a grain storage platform, to grow capacity in South Africa and improve food security. AFGRI Grain Silo Company plans to expand its current storage from 4.7 million tonnes to 6.0 million tonnes. The current storage footprint consists of grain silos and bunker complexes throughout six provinces in South Africa. Four institutional investors have invested alongside AGH and its current Black Economic Empowerment ("BEE") employee partner, Izitsalo Employee Investments. This investment consortium owns storage facilities previously acquired from AFGRI, which owns AGH's grain management division. At September 30, 2021 AGH's remaining equity interest in AFGRI Grain Silo Company was 11.0%. AFGRI continues to manage the storage facilities on behalf of AFGRI Grain Silo Company through a management service agreement.
AGH's strategic focus for the balance of 2021 is to (i) focus on its core business to ensure efficiencies; (ii) expand its grain storage footprint through AFGRI Grain Silo Company and diversify storage services into a broader commodity pool; (iii) continue to streamline agricultural operations to ensure more efficient capital deployment in South Africa; and (iv) execute its debt restructuring plan.
62

Valuation and Interim Consolidated Financial Statement Impact
Indirect equity interest in AGH
At September 30, 2021 the company estimated the fair value of its indirect equity interest in AGH using a discounted cash flow analysis based on multi-year free cash flow forecasts with assumed after-tax discount rates ranging from 10.5% to 17.5% and a long term growth rate of 2.0% (December 31, 2020 - 9.3% to 21.2% and 2.5%). At September 30, 2021 free cash flow forecasts were based on EBITDA estimates derived from financial information for AGH's business units prepared in the second quarter of 2021 (December 31, 2020 - fourth quarter of 2020) by AGH's management.
Free Cash Flow Forecast Inputs
The primary driver of free cash flow estimates is EBITDA growth across AGH's major lines of business: the equipment, grain management, agribusiness finance, and food businesses in Philafrica, partially offset by corporate overhead costs.
Current Model Assumptions
Free cash flow forecasts were revised by AGH's management in the second quarter of 2021 primarily to reflect a decrease in forecasted corporate overhead costs related to the centralization of AGH's corporate function in connection with the debt restructuring. This was partially offset by lower free cash flow forecasts at Philafrica's animal feeds business which discontinued its plan to expand through vertical integration resulting in lower forecasted profit margins. The execution of AGH's debt restructuring agreement did not significantly impact the fair value of the company's indirect investment in AGH as the relevant features of the debt restructuring, such as the expected proceeds from monetizing and selling non-core assets and the associated increase in credit risk, were assessed in previous valuations.
Discount rates were based on the company's assessment of risk premiums to the appropriate risk-free rate of the economic environment in which AGH operates. These risk premiums were reflective of the increased uncertainty of the revised free cash flow forecasts as a result of the economic and social impacts of the COVID-19 pandemic, as well as the increased credit risk associated with AGH's plans to restructure its balance sheet. Long term growth rates were based on the expected long term sustainable growth rate of the economic environments and sectors in which AGH operates.
At September 30, 2021 the company's internal valuation model indicated that the fair value of its 46.8% indirect equity interest in AGH was $55,628 (December 31, 2020 - $64,210).
AFGRI International Facility
At September 30, 2021 the company determined that the amortized cost of the AFGRI International Facility of $9,632 approximated fair value due to the short term nature of the investment.
In the third quarter and first nine months of 2021 the company recorded interest income of $257 in both periods within the consolidated statements of earnings (loss) and comprehensive income (loss) related to the AFGRI International Facility.
AGH's Summarized Financial Information
To avoid the distortion caused by foreign currency translation, the tables below present AGH's financial and operating results in both U.S. dollars and South African rand (AGH's functional currency). The discussion which follows refers to those South African rand figures unless indicated otherwise.
The company's fiscal year ends on December 31 and AGH's fiscal year ends on March 31. Summarized below are AGH's balance sheets at June 30, 2021 and March 31, 2021.
63

Balance Sheets (unaudited - South African rand and US$ thousands)
South African rand US$June 30, 2021 March 31, 2021 June 30, 2021 (1) March 31, 2021 (1)
Current assets 8,936,924 6,539,181 625,835 442,734 Non-current assets 3,434,323 3,455,532 240,499 233,956 Current liabilities 9,082,987 6,739,344 636,064 456,286 Non-current liabilities 1,506,644 1,463,208 105,507 99,066 Shareholders' equity 1,781,616 1,792,161 124,763 121,338
(1) The net assets of AGH were translated at June 30, 2021 at $1 U.S. dollar = 14.28 South African rand and at March 31, 2021 at $1 U.S. dollar = 14.77 South African rand. The exchange rates used were the spot rates prevailing on those respective dates.
Current assets increased, primarily reflecting increased trade and other receivables driven by increased equipment sales as a result of a strong agricultural environment, and elevated commodity prices. Current liabilities increased, primarily reflecting fluctuations in timing of repayments from farmers on seasonal facilities and the submission thereof to the Land Bank as well as delayed payments to suppliers at March 31, 2021. The grain management business reported higher volume commodities bought on behalf of clients due to the seasonality of the business, which, together with the increase in commodity prices, resulted in an increase in both trade receivables and borrowings to finance trade receivables. Non-current assets, non-current liabilities, and shareholders' equity remained stable.
Summarized below are AGH's statements of earnings for the three months ended June 30, 2021 and 2020.
Statements of Earnings(unaudited - South African rand and US$ thousands)
South African rand US$
Three months ended June 30, 2021
Three months ended June 30, 2020
Three months ended June 30, 2021 (1)
Three months ended June 30, 2020 (1)
Revenue from continuing operations 4,060,652 3,532,030 287,582 197,210
Profit (loss) before taxes 33,213 (101,468) 2,352 (5,665)
Net loss (19,501) (131,181) (1,381) (7,324)
(1) Amounts for the period ended June 30, 2021 and 2020 were translated into US$ using the average exchange rates of $1 U.S. dollar = 14.12 South African rand and $1 U.S. dollar = 17.91 South African rand prevailing during those periods.
Revenues increased primarily due to increased equipment sales in both South Africa and Australia following a strong harvest year, which provided capital to farmers and stimulated the replacement of capital equipment. Philafrica's animal feeds business also contributed to increased revenue through elevated commodity prices despite a slight reduction in volumes. These were partially offset by lower grain management volumes at AFGRI International given the exit strategy for the business, as well as volume and margin pressure reported at AFGRI's financial services business, UNIGRO, due to the implementation of its transitional service level agreement with the Land Bank, which subsequently expired on September 30, 2021 and was not renewed. Effective October 1, 2020, revenues include retail operations, previously equity-accounted, following the acquisition of certain retail-related assets from a former joint venture. Improvement in profit before taxes and net loss reflects the revenue drivers stated above, as well as stringent cost savings measures and disposition of discontinued greenfield businesses.
Investment in Philafrica Foods Proprietary Ltd.
Business Overview
Philafrica is headquartered in South Africa, where it owns and operates maize mills, wheat mills, animal feed factories, snack production facilities, and bread production facilities. Philafrica has 15 production plants across the South African provinces of Gauteng, KwaZulu-Natal, Mpumalanga, Eastern Cape, Western Cape, and the Free State.
Philafrica's vision is to be a leading partner in agribusiness by serving as the home of all farmer or farming oriented business units or investments and focusing exclusively on servicing and supplying the farmer's activities and needs.
64
Philafrica's principal lines of business are comprised of:• Grain Milling (involved in the industrial milling of yellow corn (maize) and wheat);• Animal Feeds (production of balanced feed for animal production);• Pet Food Production (through Afrique Pet Food);• Snack Manufacturing (through Pakworks); and• Bread Production (through Sunshine Bakery).
Transaction Description
Philafrica Common Shares
At September 30, 2021 and December 31, 2020 the company had invested $23,254 (325.0 million South African rand) in 26,000 common shares of Philafrica, representing a 26.0% equity interest in Philafrica. A third party investor held a 14.0% equity interest and AGH controlled Philafrica through its 60.0% equity interest.
Philafrica Facility
At September 30, 2021 and December 31, 2020 the company had advanced $5,622 (98.0 million South African rand), net of a 2.0% raising fee, to Philafrica under a secured lending arrangement (the "Philafrica Facility"). The Philafrica Facility bears interest at a rate of South African prime plus 2.0% per annum, which is accrued and capitalized monthly. The repayment of the Philafrica Facility is subordinated against other third party debt and is currently not repayable under its existing terms. The company continues to engage Philafrica and its lenders on the repayment of the Philafrica Facility. The Philafrica Facility is secured by a general guarantee from AGH and AGH's pledge of equity interests in Philafrica.
Key Business Drivers, Events, and Risks
Philafrica is headquartered in South Africa. Refer to the Business Developments section under the heading Operating Environment of this MD&A for a description of the macroeconomic conditions in South Africa.
Philafrica's key business drivers relate to its ability to grow and vertically integrate its share in the food value chain. In April 2021 Philafrica completed the structuring of a pet foods joint venture, Afrique Pet Food, which is expected to increase production capacity in the near term. In 2020, Philafrica exited the poultry and mussels greenfield businesses; in 2021, Philafrica exited its cassava processing and soya crushing and extraction businesses.
In the balance of 2021, Philafrica will continue to focus on (i) developing and expanding existing business units by implementing operational improvements and maintaining disciplined procurement practices; (ii) continued drive for organic growth across all South African businesses; (iii) expanding its footprint in South Africa's pet food market; and (iv) exiting non-core businesses.
Valuation and Interim Consolidated Financial Statement Impact
Philafrica Common Shares
At September 30, 2021 the company estimated the fair value of its investment in Philafrica common shares using a discounted cash flow analysis based on multi-year free cash flow forecasts with assumed after-tax discount rates ranging from 13.9% to 15.8% and a long term growth rate of 2.0% (December 31, 2020 - 12.6% to 15.6% and 2.5%). At September 30, 2021 free cash flow projections were based on EBITDA estimates derived from financial information for Philafrica’s business units prepared in the second quarter of 2021 (December 31, 2020 - fourth quarter of 2020) by Philafrica’s management.
Free Cash Flow Forecast Inputs
The primary driver of free cash flow estimates is EBITDA growth at Philafrica's food businesses, partially offset by corporate overhead costs.
Current Model Assumptions
Free cash flow forecasts were revised by Philafrica's management in the second quarter of 2021 to primarily reflect a decrease in forecasted corporate overhead costs related to the centralization of Philafrica's corporate function. This was partially offset by
65

lower free cash flow forecasts at Philafrica's animal feeds business which forecasted lower profit margins due to the discontinuation of expansion plans through vertical integration.
Discount rates were based on the company's assessment of risk premiums to the appropriate risk-free rate in the countries of Philafrica's operations. These risk premiums reflected increased uncertainty of the revised free cash flow forecasts as a result of the economic and social impacts of the COVID-19 pandemic, as well as the increased credit risk associated with debt restructuring plans at Philafrica's parent company, AGH. Long term growth rates were based on the expected long term sustainable growth rate of the economic environments and sectors in which Philafrica operates.
At September 30, 2021 the company's internal valuation model indicated that the fair value of its investment in Philafrica common shares was $8,261 (December 31, 2020 - $9,065) for the 26.0% equity interest.
Philafrica Facility
At September 30, 2021 the company estimated the fair value of its investment in the Philafrica Facility based on an expected recovery model with an expected recovery of 100.0% (December 31, 2020 - 100.0%). The expected recovery was supported by the value of the underlying guarantee and pledge from AGH.
At September 30, 2021 the company's internal valuation model indicated that the estimated fair value of its investment in the Philafrica Facility was $7,487 (December 31, 2020 - $7,164).
In the third quarter and first nine months of 2021 the company recorded interest income of $164 and $516 (2020 - $171 and $227) within the consolidated statements of earnings (loss) and comprehensive income (loss) related to the Philafrica Facility.
Indirect equity interest in Access Bank SA
Business Overview
GroCapital Holdings Limited ("GroCapital Holdings") is a bank holding company that owns 9.6% of Access Bank (South Africa) Limited ("Access Bank SA", formerly known as Grobank Limited ("Grobank")). Operating as a South African bank since 1947, Access Bank SA is focused on building on its established strengths in business and small medium enterprise banking, foreign exchange services, and alliance banking, as well as expanding Access Bank's footprint into South Africa.
On May 3, 2021 Access Bank Plc (“Access Bank”), a publicly listed Nigerian commercial bank, acquired a 90.4% equity interest in Grobank for 400.0 million South African rand ($27,787 at transaction date exchange rates). Upon closing of the transaction, GroCapital Holdings had a 9.6% equity interest in Grobank which was renamed Access Bank (South Africa) Limited.
Transaction Description
At September 30, 2021 the company had invested an aggregate of $19,403 (285.7 million South African rand) for a 48.1% equity interest in GroCapital Holdings (December 31, 2020 - 48.1%). Through its investment in GroCapital Holdings, the company has a 4.6% indirect equity interest in Access Bank SA (December 31, 2020 - 48.1%).
Valuation and Consolidated Financial Statement Impact
At September 30, 2021 the company estimated the fair value of its indirect equity interest in Access Bank SA based on the transaction price implied by Access Bank's investment. At September 30, 2021 the fair value of the company's indirect equity interest in Access Bank SA was $1,366 (December 31, 2020 - $1,399) for the 48.1% equity interest.
Investment in Nova Pioneer Education Group
Business Overview
Nova Pioneer Education Group ("Nova Pioneer") is a Pan-African independent school network offering preschool through secondary education for students from ages 3 through 19. Nova Pioneer was started in 2013 with its first school opening in South Africa in 2015. Since then, Nova Pioneer has expanded across South Africa and launched its first campus in Kenya in 2016. Nova Pioneer operates thirteen schools with a combined enrollment of approximately 4,700 students. Nova Pioneer is wholly-owned by Ascendant Learning Limited ("Ascendant"), its Mauritius-based parent entity.
66

The middle class has rapidly expanded across key regions in Africa. As a result, the demand for affordable, quality private education has grown in excess of available supply. Nova Pioneer is well-positioned to become a leading brand in the African education sector. Average tuition per student is approximately $3,500 per year and is priced to target emerging middle to upper-middle income families.
Transaction Description
Indirect equity interest in Nova Pioneer
On July 1, 2021, Nova Pioneer redeemed the company's 20.0% Nova Pioneer debentures (the “Nova Pioneer Bonds”) with an aggregate fair value of $34,711 and settled interest accrued of $4,100 by issuing Ascendant common shares with a fair value of $38,811, representing a 56.3% equity interest in Ascendant (“Indirect equity interest in Nova Pioneer”). The company had invested an aggregate of $44,252 (inclusive of capitalized interest and accretion) in the Nova Pioneer Bonds, which was derecognized upon receipt of the Ascendant common shares. and The company recorded a realized loss of $9,541 on settlement of the Nova Pioneer Bonds and recorded the indirect equity interest in Nova Pioneer at its estimated fair value on the date of the transaction.
At September 30, 2021 the company held a 56.3% indirect equity interest in Nova Pioneer and no longer holds any Nova Pioneer Bonds or Warrants.
Nova Pioneer Bonds and Warrants
At December 31, 2020 the company had invested an aggregate of $45,539 in Nova Pioneer, which consisted of (i) $44,252 in Nova Pioneer Bonds (inclusive of capitalized interest and accretion) and (ii) $1,287 in 3,400,000 warrants with an exercise price of $2.06 per share (the "Nova Pioneer Warrants").
Key Business Drivers, Events, and Risks
Nova Pioneer's key business drivers relate to its success in meeting its enrollment targets, scaling and expanding its operations across multiple campuses in Kenya and South Africa through efficient sourcing of financing and capital to support the planned expansion, and building its talent pool of teachers and administrators. In January 2020 Nova Pioneer opened new schools in Eldoret, Kenya and Ruimsig, South Africa and expanded capacity at its existing schools. These initiatives have increased total potential student capacity by approximately 30% from approximately 10,000 to 13,000. In May 2020 and in July 2021 Nova Pioneer obtained financing to fund operations and will continue to pursue growth opportunities in Kenya and in South Africa while ensuring each opportunity presents a strong business case.
Valuation and Interim Consolidated Financial Statement Impact
Indirect equity interest in Nova Pioneer
At September 30, 2021 the initial transaction price for the company's indirect equity interest in Nova Pioneer was considered to approximate fair value as there were no significant changes to its investment in Nova Pioneer's business, capital structure, and operating environment, and the key assumptions in the company's acquisition valuation model continue to be valid. At September 30, 2021 the company's internal valuation model indicated that the fair value of the company's indirect equity interest in Nova Pioneer was $38,811.
Nova Pioneer Bonds and Warrants
At December 31, 2020 the company estimated the fair value of its investment in the Nova Pioneer Bonds using an industry accepted discounted cash flow and option pricing model that incorporated Nova Pioneer's estimated credit spread of 28.2%. The estimated credit spread was based on the credit spreads of a peer group of comparable companies adjusted for credit risk specific to Ascendant given the deterioration of liquidity as a result of COVID-19 school closures. The company updated its assessment of the Nova Pioneer Bonds’ credit quality in the fourth quarter of 2020 which resulted in a significant increase in estimated credit spread. At December 31, 2020 the company's internal valuation model indicated that the estimated fair value of the investment in Nova Pioneer Bonds was $36,421.
67

In the third quarter and first nine months of 2021 the company recorded interest income of nil and a write-down of interest receivable of $202 (2020 - interest income of $2,324 and $6,639) within the consolidated statements of earnings (loss) and comprehensive income (loss) related to the Nova Pioneer Bonds.
The company does not expect to recover any of its initial investment in the Nova Pioneer Warrants which were written down to nil at December 31, 2020.
Investment in Atlas Mara Limited (Debt Instruments)
Business Overview
Atlas Mara is a Sub-Saharan African financial services group listed on the London Stock Exchange under the symbol ATMA. Since its inception, Atlas Mara has acquired control or significant influence in banks across seven Sub-Saharan African countries: Nigeria, Botswana, Zimbabwe, Mozambique, Rwanda, Tanzania and Zambia. During 2021 Atlas Mara sold its banking operations in Mozambique, Rwanda, and Botswana.
The company's investment in Atlas Mara is comprised of debt instruments. The Atlas Mara debt instruments discussed below are not rated.
On December 28, 2020 Atlas Mara entered into a standstill agreement with its lenders, (the "Atlas Mara standstill agreement"), as a result of continued liquidity pressures facing its African banks, partially due to the COVID-19 pandemic. On July 14, 2021 Atlas Mara and certain of its affiliates entered into a support and override agreement (the "Atlas Mara SOA") with its lenders which formalized plans to repay its outstanding debt obligations through orderly dispositions of certain of its underlying businesses. The key features of the Atlas Mara SOA were as follows:
(i) The Atlas Mara SOA formalizes the waterfall allocation to the lenders of proceeds from the orderly dispositions of certain of Atlas Mara's underlying businesses;
(ii) Certain of Atlas Mara's lenders, including HFP, agreed to grant a forbearance with respect to the maturities of their outstanding debts; and
(iii) For those lenders whose financing documents provide for an increase in the underlying interest rate as a result of default, event of default or other similar event, these lenders are entitled to additional default interest in accordance with those provisions effective December 28, 2020.
The company continues to be engaged with Atlas Mara and its lenders in formalizing the terms and extension of the Atlas Mara SOA including forbearance with respect to the maturities of Atlas Mara's outstanding debts beyond September 30, 2021.
The execution of the Atlas Mara standstill agreement and the Atlas Mara SOA were key components of Atlas Mara's plan to repay its outstanding debt obligations through orderly dispositions of certain of its underlying businesses. The expected proceeds from the proposed dispositions and the duration and outcome of negotiations with other lenders have increased risk of recovery, which has been reflected in the valuation of the Atlas Mara 11.0% Convertible Bonds (defined below) and the Atlas Mara 7.5% Bonds (defined below) (collectively, the "Atlas Mara Bonds") and the Atlas Mara Facility (defined below). As a result of the Atlas Mara standstill agreement and restructuring plan, the company changed its valuation technique to an expected recovery model in the fourth quarter of 2020 and has not accrued interest on the Atlas Mara Bonds or Atlas Mara Facility after December 28, 2020.
Transaction Description
Atlas Mara 11.0% Convertible Bonds
At September 30, 2021 and December 31, 2020 the company had invested $16,000 in Atlas Mara convertible bonds. The bonds have a stated coupon of 11.0% per annum, accrued quarterly and payable in kind ("Atlas Mara 11.0% Convertible Bonds").
Atlas Mara 7.5% Bonds
At September 30, 2021 and December 31, 2020 the company had invested $20,000 in Atlas Mara bonds and 6,200,000 Atlas Mara Warrants. The bonds have a stated coupon of 7.5% per annum, payable semi-annually ("Atlas Mara 7.5% Bonds"). The Atlas Mara 7.5% Bonds are secured by Atlas Mara's shares in Union Bank of Nigeria ("UBN").
At September 30, 2021, interest receivable of $2,832 on the Atlas Mara 7.5% Bonds reflects the same expected recovery as the principal.
68

Atlas Mara Facility
At September 30, 2021 and December 31, 2020 the company had advanced $39,507, net of $493 in raising fees, under the terms of a secured lending arrangement with Atlas Mara (the "Atlas Mara Facility"). The Atlas Mara Facility has a stated coupon of 10.0% per annum plus default interest of 7.5%, accrued quarterly and payable in kind. The Atlas Mara Facility was secured by Atlas Mara's shares in African Banking Corporation Botswana Limited ("Atlas Mara Botswana"), which were subsequently released in October 2021 upon sale to Access Bank.
Atlas Mara Facility Guarantee
On July 10, 2020 in connection with the Transaction (see note 2 (Helios Transaction) to the interim consolidated financial statements for the three and nine months ended September 30, 2021), the company entered into an agreement with Fairfax whereby Fairfax guaranteed all principal and interest obligations of Atlas Mara under the Atlas Mara Facility, giving rise to a guarantee (the "Atlas Mara Facility Guarantee"), which was recorded in derivatives and guarantees within the consolidated balance sheet.
Valuation and Interim Consolidated Financial Statement Impact
Atlas Mara 11.0% Convertible Bonds
At September 30, 2021 the company estimated the fair value of its investment in the Atlas Mara 11.0% Convertible Bonds based on an expected recovery model with an estimated expected recovery of nil (December 31, 2020 - 12.2%). The expected recovery reflected the value of expected proceeds from Atlas Mara's planned asset disposals less expected repayments to higher-ranking and secured lenders as the Atlas Mara 11.0% Convertible Bonds are unsecured. At September 30, 2021 the company's internal valuation model indicated that the estimated fair value of its investment in the Atlas Mara 11.0% Convertible Bonds was nil (December 31, 2020 - $2,442).
Atlas Mara 7.5% Bonds
At September 30, 2021 the company estimated the fair value of its investment in Atlas Mara 7.5% Bonds based on an expected recovery model with an estimated expected recovery of 99.5% (December 31, 2020 - 99.8%) of principal and interest. The expected recovery reflected the value of expected proceeds from Atlas Mara's planned asset disposals. At September 30, 2021 the company's internal valuation model indicated that the estimated fair value of its investment in the Atlas Mara 7.5% Bonds was $19,894 (December 31, 2020 - $19,966).
The company does not expect to recover any of its initial investment in the Atlas Mara Warrants which were written down to nil at December 31, 2020.
Atlas Mara Facility
At September 30, 2021 the company estimated the fair value of its investment in the Atlas Mara Facility based on an expected recovery model with an estimated expected recovery of 40.7% (December 31, 2020 - 71.3%). The expected recovery reflected the value of expected proceeds from Atlas Mara's planned asset disposals. At September 30, 2021 the company's internal valuation model indicated that the estimated fair value of its investment in the Atlas Mara Facility was $17,351 (December 31, 2020 - $30,346).
In the third quarter and first nine months of 2021 the company recorded interest income of nil in both periods (2020 - $1,739 and $4,642) within the consolidated statements of earnings (loss) and comprehensive income (loss) related to the Atlas Mara Bonds and the Atlas Mara Facility.
Atlas Mara Facility Guarantee
At inception, the difference of $2,799 between the fair value and transaction price of the Atlas Mara Facility Guarantee was recorded in contributed surplus within common shareholders’ equity. At September 30, 2021 the company estimated the fair value of the Atlas Mara Facility Guarantee using the fair value at that date of the Atlas Mara Facility compared to the present value of the interest and repayment obligations of the Atlas Mara Facility guaranteed by Fairfax, discounted using observable default spreads specific to Fairfax.
69

In the first nine months of 2021, as a result of the anticipated extension of the maturity of the Atlas Mara Facility to December 31, 2021 and the inclusion of 7.5% default interest effective December 28, 2020, the company recorded a net change in unrealized gain on the Atlas Mara Facility Guarantee of $19,901. At September 30, 2021 the company's internal valuation model indicated that the estimated fair value of its investment in the Atlas Mara Facility Guarantee was $33,153.
Subsequent to September 30, 2021
In October 2021 Atlas Mara completed the sale of its equity interest in Atlas Mara Botswana to Access Bank, a portion of which was pledged as security for the Atlas Mara Facility and subsequently released by the company in connection with the aforementioned sale. The proceeds from the sale to be paid in three tranches: (i) an upfront portion due on closing; (ii) a portion due no later than April 2022; and (iii) deferred consideration due two years from the date of closing. On October 14, 2021 upon Atlas Mara receiving the upfront portion of proceeds from the sale, the company received partial repayment on the Atlas Mara Facility of $11,325. Pursuant to the Atlas Mara SOA the company expects further repayments on the Atlas Mara Facility as Atlas Mara receives the remaining two tranches of proceeds from the sale.
Investment in Consolidated Infrastructure Group Limited (Debt Instrument)
Business Overview
CIG is a Pan-African engineering infrastructure company previously listed on the Johannesburg Stock Exchange under the stock symbol CIL. CIG has a diversified portfolio of operations including services and materials in power and electrical, waste management of oil and gas, building materials and the railway sector, with a footprint that spans over 20 African countries and the Middle East.
Transaction Description
At September 30, 2021 and December 31, 2020 the company had advanced $23,270 (292.5 million South African rand), net of a 2.5% raising fee to CIG (the "CIG Loan"). The CIG Loan bears interest at South African prime plus 2.0% per annum and has a maturity date of June 4, 2023. The CIG Loan is secured by CIG's pledge of its equity interests in Conlog Proprietary Limited ("Conlog"), a wholly-owned subsidiary of CIG that provides metering solutions to utilities, municipalities and property management companies in South Africa, the Middle East and across Africa. The CIG Loan is not rated.
In June 2020 due to the impacts of COVID-19, the company allowed CIG to defer interest payments due June 4, 2020 and going forward. At September 30, 2021, interest receivable of $1,206 on the CIG Loan is expected to be received upon the sale of CIG's equity interest in Conlog.
Valuation and Interim Consolidated Financial Statement Impact
At September 30, 2021 the company estimated the fair value of its investment in the CIG Loan using an expected recovery model with an estimated expected recovery of 100.0%. The expected recovery reflected the estimated value of expected proceeds from the sale of CIG's equity interest in Conlog, which is pledged as collateral for the CIG Loan. It is expected that CIG will sell its equity interest in Conlog in the first quarter of 2022 through an orderly sale process. Accordingly, the company determined that an expected recovery model was the most appropriate valuation technique and the company has not accrued interest on the CIG Loan after December 31, 2020.
At December 31, 2020 the company estimated the fair value of its investment in the CIG Loan using an industry accepted discounted cash flow and option pricing model that incorporated the security's estimated credit spread of 7.9%. The estimated credit spread was based on a peer group of comparable companies adjusted for credit risk specific to CIG. On November 9, 2020 CIG commenced voluntary business rescue proceedings. This did not significantly impact the fair value of the CIG Loan at December 31, 2020 as the Conlog shares pledged as collateral continued to support full recovery of the CIG Loan.
At September 30, 2021 the company's internal valuation model indicated that the estimated fair value of its investment in the CIG Loan was $19,940 (December 31, 2020 - $19,254).
In the third quarter and first nine months of 2021 the company recorded interest income of nil in both periods (2020 - $438 and $1,462) within the consolidated statements of earnings (loss) and comprehensive income (loss) related to the CIG Loan.
70

Investment in the PGR2 Loan (Debt Instrument)
Transaction Description
At September 30, 2021 and December 31, 2020 in conjunction with the CIG Loan, the company had advanced $19,969 (260.0 million South African rand) to PGR2 Investments Proprietary Limited ("PGR2"), the largest shareholder of CIG at the time of the transaction (the "PGR2 Loan"). The PGR2 Loan was partially secured by common shares of CIG held by PGR2 and associated parties. The PGR2 Loan had a coupon of 15.0% per annum, payable semi-annually in cash or in kind at PGR2's option, with a maturity date of May 24, 2021.
Valuation and Interim Consolidated Financial Statement Impact
As a result of the significant and prolonged decline in the fair value of CIG common shares pledged as security for the PGR2 Loan, the company does not expect to recover any of its initial investment in the PGR2 Loan, which was written down to nil at December 31, 2020.
In the third quarter and first nine months of 2020 the company recorded interest income reversal of $200 and interest income of $1,118 within the consolidated statements of earnings (loss) and comprehensive income (loss) related to the PGR2 Loan.
71

Results of Operations
HFP's consolidated statements of earnings (loss) and comprehensive income (loss) for the three and nine months ended September 30 are shown in the following table:
Third quarter First nine monthsIncome 2021 2020 2021 2020
Interest 741 4,736 1,482 15,739 Dividends 178 15 345 15 Net realized losses on investments (5,962) — (5,962) — Net change in unrealized gains (losses) on investments 4,421 (56,279) 2,586 (135,734) Net foreign exchange gains (losses) (8,166) 8,016 (3,936) (38,712)
(8,788) (43,512) (5,485) (158,692) Expenses
Investment and advisory fees 832 1,018 2,437 3,271 Performance fee (recovery) (1,978) — 927 — General and administration expenses 1,981 580 7,596 2,558 Helios Transaction expenses — 13,857 14,357 Loss on uncollectible accounts receivable 618 — 6,079 — Interest expense 900 201 1,799 599
2,353 15,656 18,838 20,785
Loss before income taxes (11,141) (59,168) (24,323) (179,477) Provision for (recovery of) income taxes 2,441 (795) 353 4,886 Net loss and comprehensive loss (13,582) (58,373) (24,676) (184,363)
Net loss per share (basic and diluted) $ (0.12) $ (0.99) $ (0.23) $ (3.12)
Total loss from income of $8,788 in the third quarter of 2021 decreased compared to total loss from income of $43,512 in the third quarter of 2020 primarily reflecting net change in unrealized gains on investments, partially offset by net foreign exchange losses, realized losses on investments, and decreased interest income.
Net gains (losses) on investments for the third quarters of 2021 and 2020 were comprised as follows:Third quarter
2021 2020
Net realized
gains
Net change in
unrealized gains
(losses)Net gains (losses)
Net realized
gains
Net change in
unrealized gains
(losses)Net gains (losses)
Net gains (losses) on investments:Limited partnership investments — (9,382) (9,382) — — — Common shares 3,579 2,742 6,321 — (36,816) (36,816) Loans — (14,071) (14,071) — (28,462) (28,462) Bonds (9,541) 6,115 (3,426) — (10,033) (10,033) Derivatives and guarantees — 19,017 19,017 — 19,032 19,032
(5,962) 4,421 (1,541) — (56,279) (56,279)
Net realized losses on investments of $5,962 in the third quarter of 2021 was comprised of realized losses on the Nova Pioneer Bonds ($9,541), partially offset by realized gains on the Other Common Shares ($3,579).
Net change in unrealized gains on investments of $4,421 in the third quarter of 2021 was principally comprised of unrealized gains on the Atlas Mara Facility Guarantee ($18,746), Other Common Shares ($3,765), TopCo LP Class A Limited Partnership Interest ($3,266), and reversal of prior period unrealized losses on the Nova Pioneer Bonds ($9,541), partially offset by unrealized losses on the Atlas Mara Facility ($14,050), TopCo LP Class B Limited Partnership Interest ($13,364), the Atlas Mara Bonds ($3,426),
72

and indirect equity interest in AGH ($1,039), and reversal of prior period unrealized gains on Other Common Shares ($1,878). Net change in unrealized losses on investments of $56,279 in the third quarter of 2020 was principally comprised of unrealized losses on the company's investments in the PGR2 Loan ($17,326), Atlas Mara common shares ($11,082), the Atlas Mara Facility ($10,614), indirect equity interest in AGH ($8,858), Philafrica common shares ($6,445), CIG common shares ($5,675), Atlas Mara 7.5% Bonds ($5,111), Atlas Mara 11.0% Convertible Bonds ($5,027), and indirect equity interest in Access Bank SA ($4,967), partially offset by unrealized gains on the Atlas Mara Forward Derivative ($9,730) and the Atlas Mara Facility Guarantee ($9,648).
Net foreign exchange gains (losses) for the third quarters of 2021 and 2020 were comprised as follows:Third quarter
2021 2020
Net realized
gains
Net change in
unrealized gains
(losses)Net gains (losses)
Net realized
gains
Net change in
unrealized gains
(losses)Net gains (losses)
Net foreign exchange gains (losses) on:Cash and cash equivalents (812) — (812) 407 — 407 Common shares 808 (6,663) (5,855) — 5,859 5,859 Loans — (1,449) (1,449) — 1,758 1,758 Other — (50) (50) — (8) (8)
(4) (8,162) (8,166) 407 7,609 8,016
Net foreign exchange losses of $8,166 in the third quarter of 2021 were primarily a result of the weakening of the South African rand relative to the U.S. dollar during the period, principally related to the company's indirect equity interest in AGH ($2,999), investments in Philafrica common shares ($1,159), the CIG Loan ($1,055), and indirect equity interest in Access Bank SA ($1,018). Net foreign exchange gains of $8,016 in the third quarter of 2020 were primarily a result of the strengthening of the South African rand relative to the U.S. dollar during the period, principally relating to the company's indirect equity interest in AGH ($2,269), investments in CIG common shares ($1,680), the PGR2 Loan ($817), Philafrica common shares ($780), the CIG Loan ($701), indirect equity interest in Access Bank SA ($685), Other Common Shares ($445), as well as holdings of cash and cash equivalents ($407).
Total loss from income of $5,485 in the first nine months of 2021 decreased compared to total loss from income of $158,692 in the first nine months of 2020 primarily reflecting net change in unrealized gains on investments and decreased net foreign exchange losses, partially offset by decreased interest income and net realized losses.
Net gains (losses) on investments for the nine months ended September 30, 2021 and 2020 were comprised as follows:First nine months
2021 2020
Net realized
gains
Net change in
unrealized gains
(losses)Net gains (losses)
Net realized losses
Net change in
unrealized gains
(losses)Net gains (losses)
Net gains (losses) on investments:Short term investments - U.S. treasuries — — — — (48) (48) Limited partnership investments — (10,055) (10,055) — — — Common shares 3,579 3,448 7,027 — (115,025) (115,025) Loans — (11,860) (11,860) — (28,802) (28,802) Bonds (9,541) 5,317 (4,224) — (10,060) (10,060) Derivatives — 15,736 15,736 — 18,201 18,201
(5,962) 2,586 (3,376) — (135,734) (135,734)
Net realized losses on investments of $5,962 in the first nine months of 2021 was comprised of realized losses on the Nova Pioneer Bonds ($9,541), partially offset by realized gains on the Other Common Shares ($3,579).
Net change in unrealized gains on investments of $2,586 in the first nine months of 2021 was principally comprised of unrealized gains on the company's investments in the Atlas Mara Facility Guarantee ($19,901), Other Common Shares ($11,207), TopCo LP Class A Limited Partnership Interest ($6,736), Helios Fund IV Limited Partnership Interest ($4,269), and the CIG Loan ($1,163), and reversal of prior period unrealized losses on the Nova Pioneer Bonds ($7,831), partially offset by unrealized losses on the
73

company's investments in the TopCo LP Class B Limited Partnership Interest ($21,060), the Atlas Mara Facility ($12,995), indirect equity interest in AGH ($7,280), HFP Redemption Derivative ($4,165), and the Atlas Mara Bonds ($2,514). Net change in unrealized losses on investments of $135,734 in the first nine months of 2020 was principally comprised of unrealized losses on the company's investments in Atlas Mara common shares ($54,761), indirect equity interest in AGH ($33,670), the PGR2 Loan ($16,957), indirect equity interest in Access Bank SA ($11,606), the Atlas Mara Facility ($10,228), CIG common shares ($10,075), Philafrica common shares ($6,023), Atlas Mara 11.0% Convertible Bonds ($4,725), Atlas Mara 7.5% Bonds ($4,484), the CIG Loan ($1,649), and Nova Pioneer Warrants ($1,095), partially offset by unrealized gains on the Atlas Mara Forward Derivative ($9,730) and the Atlas Mara Facility Guarantee ($9,648) and Other Common Shares ($1,110).
Net foreign exchange gains (losses) for the nine months ended September 30, 2021 and 2020 were comprised as follows:First nine months
2021 2020
Net realized
gains
Net change in
unrealized gains
(losses)Net gains (losses)
Net realized losses
Net change in
unrealized gains
(losses)Net gains (losses)
Net foreign exchange gains (losses) on:Cash and cash equivalents (483) — (483) (4,301) — (4,301) Common shares 808 (3,451) (2,643) — (27,816) (27,816) Loans — (655) (655) — (6,767) (6,767) Other — (155) (155) — 172 172
325 (4,261) (3,936) (4,301) (34,411) (38,712)
Net foreign exchange losses of $3,936 in the first nine months of 2021 were primarily a result of the weakening of the South African rand relative to the U.S. dollar during the period, principally related to the company's indirect equity interest in AGH ($1,335), investments in Philafrica common shares ($524), the CIG Loan ($477), indirect equity interest in Access Bank SA ($460), and Other Common Shares ($324), as well as holdings of cash and cash equivalents ($483). Net foreign exchange losses of $38,712 in the first nine months of 2020 were primarily a result of the weakening of the South African rand relative to the U.S. dollar during the period, principally relating to the company's indirect equity interest in AGH ($14,752), CIG common shares ($7,898), Philafrica common shares ($3,757), the PGR2 Loan ($3,598), the CIG Loan ($3,427), and indirect equity interest in Access Bank SA ($2,464), as well as holdings of cash and cash equivalents ($4,301), partially offset by net foreign exchange gains on Other Common Shares ($1,055).
Total expenses of $2,353 in the third quarter of 2021 decreased compared to total expenses of $15,656 in the third quarter of 2020 principally as a result of no Helios Transaction expenses, performance fee recovery and decreased investment and advisory fees, partially offset by increased general and administration expenses (primarily due to legal and professional fees arising from new Portfolio Investments, the Management Services Agreement with Fairfax, and compensation for the Co-Chief Executive Officers), increased interest expense, and loss on uncollectible accounts receivable. Total expenses of $18,838 in the first nine months of 2021 decreased compared to total expenses of $20,785 in the first nine months of 2020 principally as a result of no Helios Transaction expenses and decreased investment and advisory fees, partially offset by increased general and administration expenses (primarily due to legal and professional fees arising from new Portfolio Investments, the Management Services Agreement with Fairfax, and compensation for the Co-Chief Executive Officers), loss on uncollectible accounts receivable, increased interest expense, and performance fees.
The investment and advisory fees are calculated and payable quarterly as 0.5% of the value of undeployed capital and 1.5% of the company's common shareholders' equity less the value of undeployed capital and the fair value of TopCo LP Class A and Class B Limited Partnership Interests. In the third quarter and first nine months 2021 the company determined that a significant portion of its assets were invested in Portfolio Investments, which are considered deployed capital. In the third quarter and first nine months of 2021 the investment and advisory fees recorded in the consolidated statements of earnings (loss) and comprehensive income (loss) were $832 and $2,437 (2020 - $1,018 and $3,271).
At September 30, 2021 the company determined that a performance fee of $927 should be accrued to TopCo LP as of September 30, 2021 (December 31, 2020 - nil accrued to Fairfax) as the Adjusted Book Value per Share of $3.13 (before factoring in the impact of the performance fee) at September 30, 2021 was greater than the hurdle per share at that date of $3.08. In the third quarter and first nine months of 2021 a performance fee recovery of $1,978 and a performance fee of $927 (2020 - nil in both periods) was recorded within the consolidated statements of earnings (loss) and comprehensive income (loss).
74

Interest expense of $900 and $1,799 in the third quarter and first nine months of 2021 related to interest on the HFP 3.0% Debentures (2020 - $201 and $599 comprised of amortization of issuance costs).
The provision for income taxes of $2,441 in the third quarter of 2021 differed from the recovery of income taxes determined by applying the company's Canadian statutory income tax rate of 26.5% to the company's losses before income taxes primarily as a result of tax rate differential on losses incurred outside of Canada and the impact of foreign exchange fluctuations, partially offset by changes in unrecorded deferred tax assets. The recovery of income taxes of $795 in the third quarter of 2020 differed from the recovery for income taxes determined by applying the company's Canadian statutory income tax rate of 26.5% to the company's losses before income taxes primarily as a result of the tax rate differential on income and losses outside of Canada, other permanent differences and the change in unrecorded benefit of losses and temporary differences, partially offset by the impact of foreign exchange fluctuations.
The provision for income taxes of $353 in the first nine months of 2021 differed from the recovery of income taxes determined by applying the company's Canadian statutory income tax rate of 26.5% to the company's losses before income taxes primarily as a result of changes in unrecorded deferred tax assets, tax rate differential on losses incurred outside of Canada and the impact of foreign exchange fluctuations, partially offset by provision to return adjustments. The provision for income taxes of $4,886 in the first nine months of 2020 differed from the recovery for income taxes determined by applying the company's Canadian statutory income tax rate of 26.5% to the company's losses before income taxes primarily as a result of the tax rate differential on income and losses outside of Canada, the change in unrecorded benefit of losses and temporary differences, other permanent differences and the impact of foreign exchange fluctuations.
The company reported a net loss of $13,582 (a net loss of $0.12 per basic and diluted share) in the third quarter of 2021 compared to a net loss of $58,373 (a net loss of $0.99 per basic and diluted share) in the third quarter of 2020. The decrease in net loss primarily reflected net change in unrealized gains on investments, no Helios Transaction expenses, and performance fee recovery, partially offset by net foreign exchange losses, realized losses on investments, decreased interest income, increased provision for income taxes, and increased general and administration expenses. The company reported a net loss of $24,676 (a net loss of $0.23 per basic and diluted share) in the first nine months of 2021 compared to a net loss of $184,363 (a net loss of $3.12 per basic and diluted share) in the first nine months of 2020. The decrease in net loss primarily reflected net change in unrealized gains on investments, decreased net foreign exchange losses, no Helios Transaction expenses, decreased provision for income taxes, and decreased investment and advisory fees, partially offset by decreased interest income, loss on uncollectible accounts receivable, realized losses on investments, increased general and administration expenses, and increased interest expense.
Consolidated Balance Sheet Summary
Total Assets
Total assets at September 30, 2021 of $702,716 (December 31, 2020 - $610,776) were principally comprised as follows:
Total cash and investments increased to $679,347 at September 30, 2021 from $599,034 at December 31, 2020. The movements in the company's cash and investments were principally as follows:
Cash and cash equivalents increased to $80,719 at September 30, 2021 from $66,052 at December 31, 2020 primarily as a result of the issuance of the $100,000 HFP 3.0% Debentures and HFP Warrants to Fairfax and a transfer of amounts in deposit accounts with Access Bank SA from restricted cash deposits to cash and cash equivalents, partially offset by funds deployed for the company's new Portfolio Investments, amounts paid to TLG in settlement of the TLG Facility Guarantee, payment of Helios Transaction expenses accrued in the prior year, and income taxes paid.
Restricted cash deposits decreased to nil at September 30, 2021 from $7,525 at December 31, 2020 reflecting a transfer of amounts in deposit accounts with Access Bank SA from restricted cash deposits to cash and cash equivalents. See note 13 (Related Party Transactions) to the interim consolidated financial statements for the three and nine months ended September 30, 2021.
Term deposits of $12,392 at September 30, 2021 and December 31, 2020 reflected the Atlas Mara Zambia Fixed Deposit. See note 13 (Related Party Transactions) to the interim consolidated financial statements for the three and nine months ended September 30, 2021.
75

Loans, Bonds, Common shares, Derivatives and guarantees, and Limited partnership investments - The company is actively seeking investment opportunities in Africa and will continue to redirect capital from its cash and cash equivalents, and short term investments portfolio into Portfolio Investments as and when those opportunities are identified. For more information about recent Portfolio Investments, see the Portfolio Investments section of this MD&A. Loans and Derivatives and guarantees include the Fairfax Loan of $19,558, the Atlas Mara Facility Guarantee of $33,153, and the HFP Redemption Derivative of $17,699, which are not Portfolio Investments. See note 13 (Related Party Transactions) to the interim consolidated financial statements for the three and nine months ended September 30, 2021.
Interest receivable of $5,153 at September 30, 2021 primarily related to interest receivable on the company's investments in the Atlas Mara 7.5% Bonds, the CIG Loan, and the Atlas Mara Zambia Fixed Deposit. Interest receivable of $8,961 at December 31, 2020 primarily related to interest receivable on the company's investments in the Nova Pioneer Bonds, the Atlas Mara 7.5% Bonds, and the CIG Loan.
Income taxes refundable increased to $4,060 at September 30, 2021 from a payable position of $399 at December 31, 2020 primarily as a result of timing of income tax payments and current income tax recovery recorded in the interim consolidated statements of earnings (loss) and comprehensive income (loss) for the nine months ended September 30, 2021.
Receivable from related parties increased to $9,173 at September 30, 2021 from a nil balance at December 31, 2020 reflecting $7,733 advanced to HHL in connection with the distribution in specie of Vivo common shares, and $1,440 distribution receivable from TopCo LP Class B Limited Partnership Interest in connection with Excess Management Fees earned during the period. On October 5, 2021, HHL transferred the cash consideration received from HFP of $7,733 to TopCo LP for the benefit of the company as sole investor of the TopCo LP Class A Limited Partnership Interest.
Other assets increased to $4,983 at September 30, 2021 from $1,946 at December 31, 2020 primarily reflecting a receivable from Atlas Mara in connection with the company's settlement of the TLG Facility Guarantee on January 19, 2021, partially offset by loss on uncollectible receivable from Atlas Mara.
Total Liabilities
Total liabilities at September 30, 2021 of $109,107 (December 31, 2020 - $11,041) were principally comprised as follows:
Accounts payable and accrued liabilities decreased to $970 at September 30, 2021 from $6,982 at December 31, 2020 primarily as a result of settlement of Helios Transaction expenses incurred by HFP and Helios.
Automatic share purchase plan liability of $2,458 at September 30, 2021 (December 31, 2020 - nil) related to a liability recognized in connection with the company's automatic securities purchase plan under the normal course issuer bid, representing an obligation for the potential repurchases of common shares.
Payable to related parties decreased to $2,354 at September 30, 2021 from $3,660 at December 31, 2020 primarily as a result of performance fees and increased management services fees, partially offset by settlement of amounts due to Fairfax for Helios Transaction expenses.
Deferred income taxes liability increased to $4,838 at September 30, 2021 from an asset position of $835 at December 31, 2020 primarily related to temporary timing differences relating to the redemption price of the HFP 3.0% Debentures, unrealized gains on the company's Other Common Shares, partially offset by amortization of tax benefit on share issuance costs.
Borrowings increased to $98,487 at September 30, 2021 from nil at December 31, 2020 as a result of the issuance of the $100,000 HFP 3.0% Debentures.
Financial Risk Management
The primary goals of the company's financial risk management program are to ensure that the outcomes of activities involving elements of risk are consistent with the company's objectives and risk tolerance, while maintaining an appropriate balance between risk and reward and protecting the company's consolidated balance sheets from events that have the potential to materially impair its financial strength. There were no significant changes in the types of the company's risk exposures or the processes used by the company for managing those risk exposures at September 30, 2021 compared to those identified at December 31, 2020 and disclosed in the company's 2020 Annual Report, other than as outlined in note 12 (Financial Risk Management) to the interim consolidated financial statements for the three and nine months ended September 30, 2021.
76

Capital Resources and Management
For a detailed analysis, refer to note 12 (Financial Risk Management, under the heading Capital Management) to the interim consolidated financial statements for the three and nine months ended September 30, 2021.
Book Value per Share
Common shareholders' equity at September 30, 2021 was $593,609 (December 31, 2020 - $599,735). Book value per share at September 30, 2021 was $5.44 compared to $5.50 at December 31, 2020, representing a decrease of 1.1% in the first nine months of 2021 and primarily reflected a net loss of $24,676 (principally due to general and administration expenses, loss on uncollectible accounts receivable, realized losses on investments, foreign exchange losses, investment and advisory fees, and interest expense, partially offset by net change in unrealized gains on investments), tax expense on the HFP 3.0% Debentures recorded in equity of $2,719, and a commitment under the company's automatic share purchase plan recorded against common shareholders' equity of $2,458, partially offset by an increase in contributed surplus ($18,107) arising from the issuances of the HFP 3.0% Debentures and the HFP Warrants at a transaction amount ($100,000) greater than the total net fair value ($81,893).
September 30, 2021 December 31, 2020Common shareholders' equity 593,609 599,735 Number of common shares outstanding 109,107,606 109,118,253 Book value per share $5.44 $5.50
On June 30, 2020 the company announced that the TSX had accepted its intention to commence a normal course issuer bid to purchase up to 2,162,134 subordinate voting shares, representing approximately 10% of the public float of its subordinate voting shares, over a twelve month period from July 8, 2020 to July 7, 2021. On June 30, 2021 the company announced that the TSX had accepted its intention to commence a normal course issuer bid to purchase up to 2,666,826 subordinate voting shares, representing approximately 5% of the public float of its subordinate voting shares, over a twelve month period from July 8, 2021 to July 7, 2022. Decisions regarding any future repurchases will be based on market conditions, share price and other factors including opportunities to invest capital for growth. The Notice of Intention to Make a Normal Course Issuer Bid is available, without charge, by contacting the Corporate Secretary of the company.
During the first nine months of 2021, under the terms of the normal course issuer bid, the company purchased for cancellation 10,647 subordinate voting shares for a net cost of $42 and $45 was recorded as a benefit in retained earnings. During the first nine months of 2020, under the terms of the normal course issuer bid, the company purchased for cancellation 463,506 subordinate voting shares for a net cost of $1,850 and $2,960 was recorded as a benefit in retained earnings.
Liquidity
Cash and publicly traded investments at September 30, 2021 provide adequate liquidity to meet the company's remaining known significant commitments over the next twelve months, which are principally comprised of undrawn capital commitments to Helios Fund IV, interest expense on the HFP 3.0% Debentures, a commitment under the company's automatic share purchase plan, the investment and advisory fees, general and administration expenses, corporate income taxes, and the potential settlement of the HFP 3.0% Debentures if Fairfax exercises its put option, net of the fair value of the HFP Redemption Derivative. The company has adequate working capital to support its operations.
Refer to the Contractual Obligations section of this MD&A for details on the settlement of the performance fees, if any, at the end of the first calculation period, December 31, 2023.
77

Highlights in the first nine months of 2021 (with comparisons to the first nine months of 2020 except as otherwise noted) of major components of cash flow are presented in the following table:
First nine months2021 2020
Operating activitiesCash used in operating activities excluding the impact of changes in restricted cash deposits and net sales (purchases) of investments (37,753) (4,342) Net sales of short term investments — 104,095 Purchases of investments (62,013) (61,022) Disposals of investments 7,433 — Decrease in restricted cash deposits in support of investments 7,525 938 Increase in term deposits in support of investments — (12,392)
Financing activitiesNet proceeds from the HFP 3.0% Debentures and HFP Warrants 100,000 — Purchases of subordinate voting shares for cancellation (42) (1,850)
Increase in cash and cash equivalents during the period 15,150 25,427
"Cash used in operating activities excluding the impact of changes in restricted cash deposits and net sales (purchases) of investments" provides a measure of the cash generated by (used in) the company’s head office operations, primarily comprised of cash inflows (outflows) from interest and dividend income, interest expense, investment and advisory fees, current income taxes, and general and administration expenses, and excludes the impact of changes to restricted cash deposits, and purchases and sales of investments. Cash used in operating activities excluding the impact of changes in restricted cash deposits and net sales (purchases) of investments of $37,753 in the first nine months of 2021 increased compared to $4,342 in the first nine months of 2020 primarily due to amounts paid to TLG in settlement of the TLG Facility Guarantee, payment of Helios Transaction expenses accrued in the prior year, decreased cash interest received, increased income taxes paid and interest paid on the HFP 3.0% Debentures.
Net sales of short term investments were nil in the first nine months of 2021. Net sales of short term investments of $104,095 in the first nine months of 2020 related to net sales of short term U.S. treasuries for deployment into Portfolio Investments and reinvestment into cash equivalent U.S. treasuries.
Purchases of investments of $62,013 in the first nine months of 2021 related to the company's investments in the NBA Africa common shares, Helios Fund IV Limited Partnership Interest, and the AFGRI International Facility. Purchases of investments of $61,022 in the first nine months of 2020 related to the company's investments in the Atlas Mara Facility, Other Common Shares, the Philafrica Facility, indirect equity interest in Access Bank SA, and CIG common shares.
Disposals of investments of $7,433 in the first nine months of 2021 related to sales of Other Common Shares.
Decrease in restricted cash deposits in support of investments of $7,525 in the first nine months of 2021 reflected a transfer of amounts in deposit accounts with Access Bank SA from restricted cash deposits to cash and cash equivalents. Decrease in restricted cash deposits in support of investments of $938 in the first nine months of 2020 reflected a transfer of the Atlas Mara Zambia Term Deposit from restricted cash deposits to term deposits, partially offset by a transfer of amounts in deposit accounts with Access Bank SA to restricted cash deposits. Refer to note 13 (Related Party Transactions) to the interim consolidated financial statements for the three and nine months ended September 30, 2021 for details.
Increase in term deposits in support of investments of $12,392 in the first nine months of 2020 reflected a transfer of the Atlas Mara Zambia Term Deposit from restricted cash deposits to term deposits. Refer to note 13 (Related Party Transactions) to the interim consolidated financial statements for the three and nine months ended September 30, 2021 for details.
Net proceeds from the HFP 3.0% Debentures and HFP Warrants of $100,000 in the first nine months of 2021 related to proceeds from the company's issuance of the HFP 3.0% Debentures and HFP Warrants to Fairfax. Refer to note 8 (Borrowings) to the interim consolidated financial statements for the three and nine months ended September 30, 2021 for details.
Purchases of subordinate voting shares of $42 in the first nine months of 2021 related to the cash paid for the company's purchases for cancellation of 10,647 subordinate voting shares under the terms of the normal course issuer bid that were settled
78
in the period. Purchases of subordinate voting share of $1,850 in the first nine months of 2020 related to the cash paid for the company's purchases for cancellation of 463,506 subordinate voting shares under the terms of the normal course issuer bid that were settled in the period. Refer to note 9 (Common Shareholders' Equity) to the interim consolidated financial statements for the three and nine months ended September 30, 2021 for details.
Contractual Obligations
On March 31, 2021, Fairfax, through its affiliates, invested $100,000 in the HFP 3.0% Debentures and HFP Warrants. The HFP 3.0% Debentures mature on March 31, 2024 or, at the option of Fairfax, on either of the first two anniversary dates. At maturity or on redemption by Fairfax, the principal amount to be repaid will be adjusted for the amount, if any, by which the aggregate fair value of the company’s investments in AGH (indirect via Joseph Holdings), Philafrica common shares, the Philafrica Facility, and the PGR2 Loan (collectively, the "Reference Investments") is lower than $102,600.
Under the terms of the Investment Advisory Agreement (defined in note 13 (Related Party Transactions) to the interim consolidated financial statements for the three and nine months ended September 30, 2021), the company is contractually obligated to pay TopCo LP an investment and advisory fee and, if applicable, a performance fee. These fees will vary based on the company's common shareholders' equity and book value per share.
The investment and advisory fees recorded within the consolidated statements of earnings (loss) and comprehensive income (loss) in the third quarter and first nine months of 2021 were $832 and $2,437 (2020 - $1,018 and $3,271).
At September 30, 2021 the company determined that a performance fee of $927 should be accrued to TopCo LP as of September 30, 2021 (December 31, 2020 - nil accrued to Fairfax) as the Adjusted Book Value per Share of $3.13 (before factoring in the impact of the performance fee) at September 30, 2021 was greater than the hurdle per share at that date of $3.08. At September 30, 2021 there were 239,580 (December 31, 2020 - nil) contingently issuable subordinate voting shares related to the performance fee payable to TopCo LP. Refer to note 13 (Related Party Transactions) to the interim consolidated financial statements for the three and nine months ended September 30, 2021 for discussion on the performance fee.
On March 31, 2021 the company committed to invest $50,000 in Helios Fund IV. At September 30, 2021 the company's remaining capital commitment to Helios Fund IV was $28,103, which may be called at any time by Helios Fund IV GP in accordance with the Helios Fund IV LPA.
On September 28, 2021 the company entered into an automatic share purchase plan with a designated broker to allow for the purchase of subordinated voting shares under its normal course issuer bid at times when the company normally would not be active in the market. Such purchases are determined by the broker in its sole discretion based on parameters established by the company prior to commencement of the applicable trading black-out period. At September 30, 2021 the automatic share purchase plan gave rise to an obligation to repurchase shares up to a maximum dollar limit of $2,458, which was recorded as an automatic share purchase plan liability within the consolidated balance sheets.
Related Party Transactions
The company's related party transactions are disclosed in note 13 (Related Party Transactions) to the interim consolidated financial statements for the three and nine months ended September 30, 2021.
Other
Quarterly Data (unaudited)
US$ thousands, except per share amountsSeptember 30,
2021June 30,
2021March 31,
2021December 30,
2020September 30,
2020 (1)June 30,
2020March 31,
2020December 31,
2019
Income (loss) (8,788) 2,502 801 (14,341) (43,512) 503 (115,683) 11,331 Expenses 2,353 5,947 10,538 10,151 15,656 2,809 2,320 2,747 Provision for (recovery of) income taxes 2,441 (3,500) 1,412 (2,209) (795) 1,880 3,801 (182) Net earnings (loss) (13,582) 55 (11,149) (22,283) (58,373) (4,186) (121,804) 8,766 Net earnings (loss) per share $ (0.12) $ — $ (0.10) $ (0.31) $ (0.99) $ (0.07) $ (2.05) $ 0.15 Net earnings (loss) per diluted share $ (0.12) $ — $ (0.10) $ (0.31) $ (0.99) $ (0.07) $ (2.05) $ 0.15
(1) Loss and net loss for the third quarter of 2020 were revised for the impact of reclassifying $8,855 in unrealized gains to contributed surplus, reflecting the difference at inception on July 10, 2020 between fair value and the transaction price on the Atlas Mara Forward Derivative ($6,056) and the Atlas Mara Facility Guarantee ($2,799). Net loss per share (basic and diluted) were revised accordingly. The above revisions for the third quarter of 2020 did not impact book value per share. Refer to note 9 (Common Shareholders' Equity) to the interim consolidated financial statements for the three and nine months ended September 30, 2021 for details.
79

Income (loss) is primarily comprised of net change in unrealized gains (losses) on investments, net foreign exchange gains (losses), net realized gains (losses) on investments, interest income, and dividend income. Net loss in the third quarter of 2021 were primarily a result of net foreign exchange losses, the timing of which are not predictable, realized losses on investments, general and administration expenses, interest expense, investment and advisory fees, and loss on uncollectible accounts receivable, partially offset by net change in unrealized gains on investments (principally comprised of unrealized gains on the company's investments in the Atlas Mara Facility Guarantee, Other Common Shares, and TopCo LP Class A Limited Partnership Interest, and reversal of prior period unrealized losses on Nova Pioneer Bonds, partially offset by unrealized losses on the company's investments in the Atlas Mara Facility, TopCo LP Class B Limited Partnership Interest, the Atlas Mara Bonds, and indirect equity interest in AGH, and reversal of prior period unrealized gains on Other Common Shares), recovery of performance fees, and interest income.
Individual quarterly results have been (and may in the future be) affected by increased expenses impacted by the change in fair value of the company's Portfolio Investments which result in higher performance fees, if applicable, and investment and advisory fees.
80

Forward-Looking Statements
This interim report may contain forward-looking statements within the meaning of applicable securities legislation. Forward-looking statements may relate to the company's or a Portfolio Investment's future outlook and anticipated events or results and may include statements regarding the financial position, business strategy, growth strategy, budgets, operations, financial results, taxes, dividends, plans and objectives of the company. Particularly, statements regarding future results, performance, achievements, prospects or opportunities of the company, a Portfolio Investment, or the African market are forward-looking statements. In some cases, forward-looking statements can be identified by the use of forward-looking terminology such as "plans", "expects" or "does not expect", "is expected", "budget", "scheduled", "estimates", "forecasts", "intends", "anticipates" or "does not anticipate" or "believes", or variations of such words and phrases or state that certain actions, events or results "may", "could", "would", "might", "will" or "will be taken", "occur" or "be achieved".
Forward-looking statements are based on our opinions and estimates as of the date of this interim report and they are subject to known and unknown risks, uncertainties, assumptions and other factors that may cause the actual results, level of activity, performance or achievements to be materially different from those expressed or implied by such forward-looking statements, including but not limited to the following factors: the COVID-19 pandemic; geographic concentration of investments; financial market fluctuations; pace of completing investments; minority investments; reliance on key personnel and risks associated with the Investment Advisory Agreement; operating and financial risks of Portfolio Investments; valuation methodologies involve subjective judgments; lawsuits; use of leverage; foreign currency fluctuation; investments may be made in foreign private businesses where information is unreliable or unavailable; significant ownership by Fairfax and Principal Holdco may adversely affect the market price of the subordinate voting shares; emerging markets; South African black economic empowerment; economic risk; weather risk; taxation risks; MLI; and trading price of subordinate voting shares relative to book value per share. Additional risks and uncertainties are described in the company’s annual information form dated March 5, 2021 which is available on SEDAR at www.sedar.com and on the company’s website at www.heliosfairfax.com. These factors and assumptions are not intended to represent a complete list of the factors and assumptions that could affect the company. These factors and assumptions, however, should be considered carefully.
Although the company has attempted to identify important factors that could cause actual results to differ materially from those contained in forward-looking statements, there may be other factors that cause results not to be as anticipated, estimated or intended. There can be no assurance that such statements will prove to be accurate, as actual results and future events could differ materially from those anticipated in such statements. Accordingly, readers should not place undue reliance on forward-looking statements. The company does not undertake to update any forward-looking statements contained herein, except as required by applicable securities laws.
81