Embed Size (px)
Citation preview

HFMA Maryland
Capital Markets Update
August 19, 2016
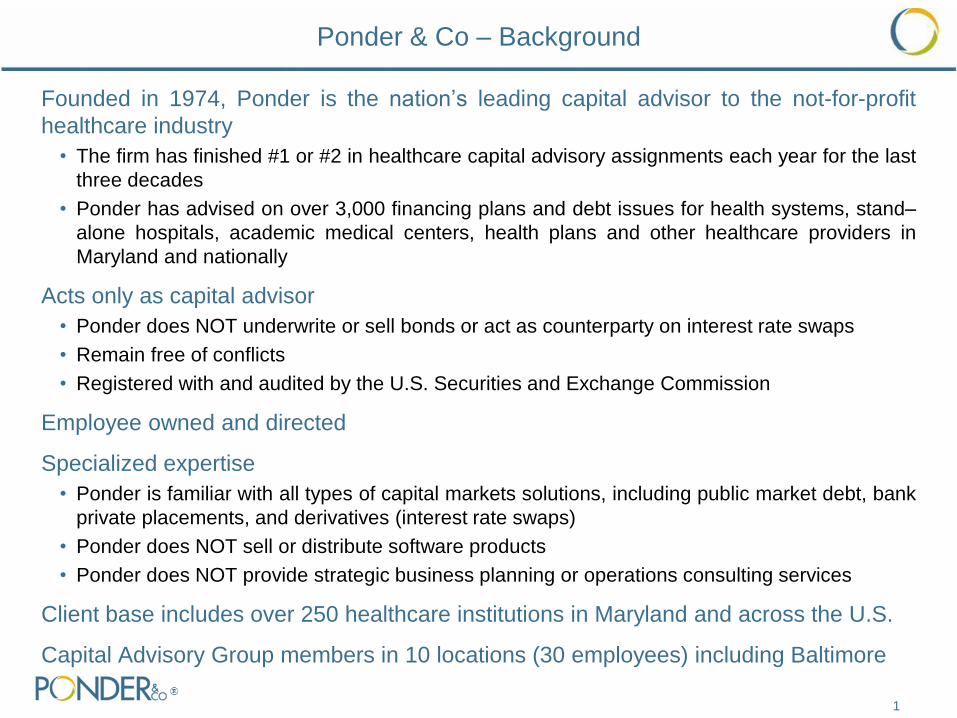
Founded in 1974, Ponder is the nation’s leading capital advisor to the not-for-profit
healthcare industry
• The firm has finished #1 or #2 in healthcare capital advisory assignments each year for the last
three decades
• Ponder has advised on over 3,000 financing plans and debt issues for health systems, stand–
alone hospitals, academic medical centers, health plans and other healthcare providers in
Maryland and nationally
Acts only as capital advisor
• Ponder does NOT underwrite or sell bonds or act as counterparty on interest rate swaps
• Remain free of conflicts
• Registered with and audited by the U.S. Securities and Exchange Commission
Employee owned and directed
Specialized expertise
• Ponder is familiar with all types of capital markets solutions, including public market debt, bank
private placements, and derivatives (interest rate swaps)
• Ponder does NOT sell or distribute software products
• Ponder does NOT provide strategic business planning or operations consulting services
Client base includes over 250 healthcare institutions in Maryland and across the U.S.
Capital Advisory Group members in 10 locations (30 employees) including Baltimore
1
Ponder & Co – Background
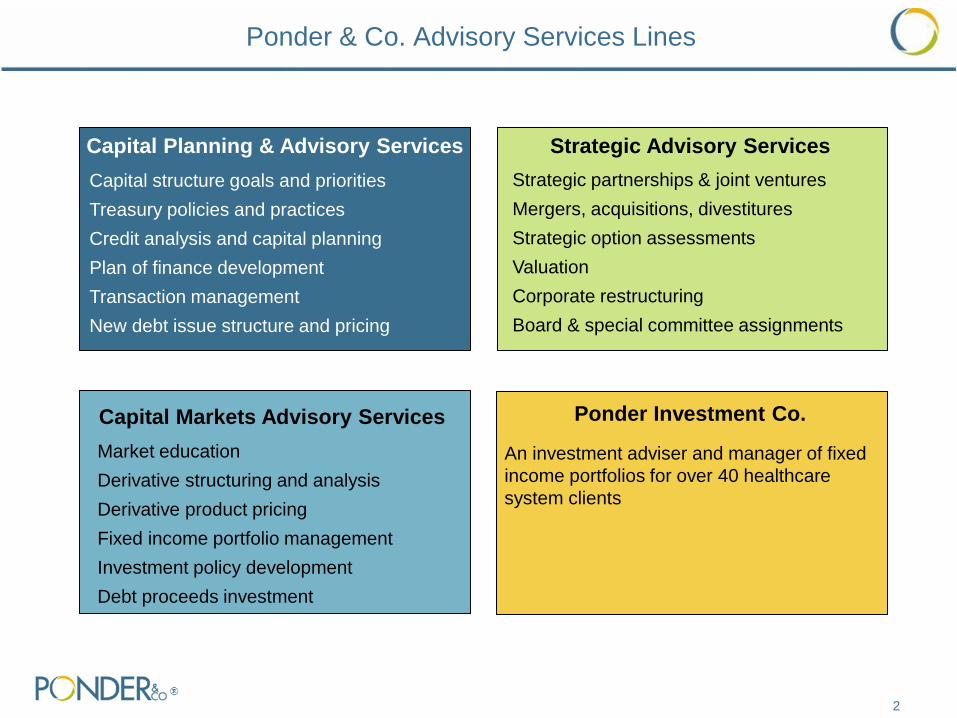
Ponder & Co. Advisory Services Lines
2
Capital Planning & Advisory Services
Capital structure goals and priorities
Treasury policies and practices
Credit analysis and capital planning
Plan of finance development
Transaction management
New debt issue structure and pricing
Capital Markets Advisory Services
Market education
Derivative structuring and analysis
Derivative product pricing
Fixed income portfolio management
Investment policy development
Debt proceeds investment
Ponder Investment Co.
An investment adviser and manager of fixed
income portfolios for over 40 healthcare
system clients
Strategic Advisory Services
Strategic partnerships & joint ventures
Mergers, acquisitions, divestitures
Strategic option assessments
Valuation
Corporate restructuring
Board & special committee assignments

Three Presentation Objectives
1. Provide Update on Current Tax-exempt Bond Market
2. Comment on Rating Agency Outlook on Non-profit Healthcare Industry
3. Discuss Recent Merger & Acquisition Activity in the Healthcare Market
3

4
Tax-exempt Bond Market
5
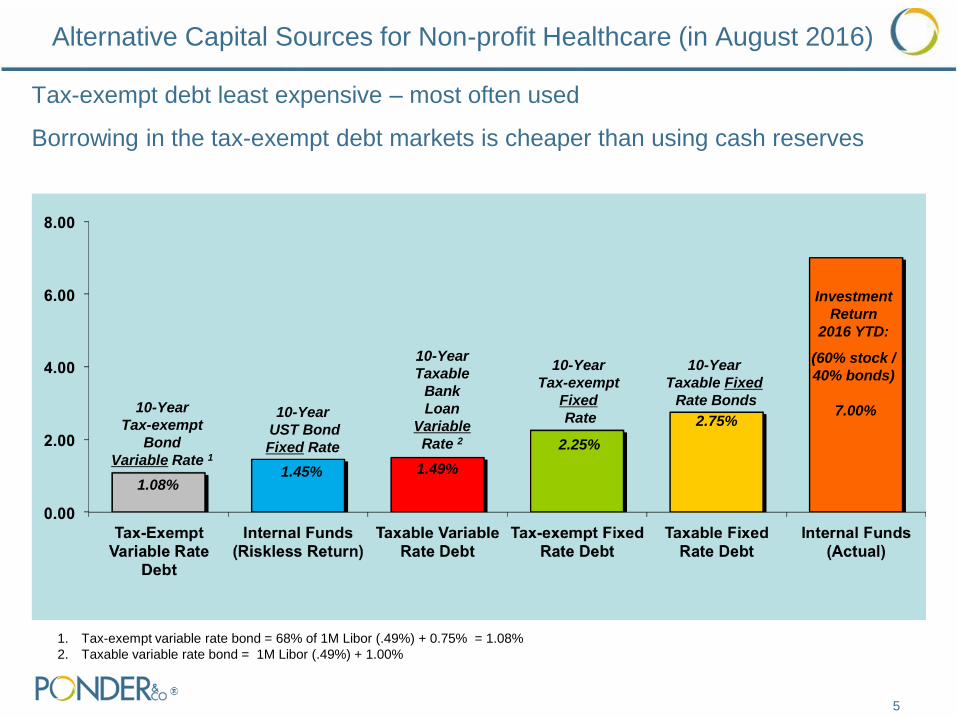
Alternative Capital Sources for Non-profit Healthcare (in August 2016)
Tax-exempt debt least expensive – most often used
Borrowing in the tax-exempt debt markets is cheaper than using cash reserves
Investment
Return
2016 YTD:
(60% stock /
40% bonds)
7.00%
10-Year
UST Bond
Fixed Rate
10-Year
Taxable
Bank
Loan
Variable
Rate 2
1. Tax-exempt variable rate bond = 68% of 1M Libor (.49%) + 0.75% = 1.08%
2. Taxable variable rate bond = 1M Libor (.49%) + 1.00%
1.08%
1.49%
2.25%
10-Year
Tax-exempt
Fixed
Rate
1.45%
10-Year
Tax-exempt
Bond
Variable Rate 1
10-Year
Taxable Fixed
Rate Bonds
2.75%
0
100,000
200,000
300,000
400,000
500,000
2005 2007 2009 2011 2013 2015
Other Municipal Bonds Healthcare
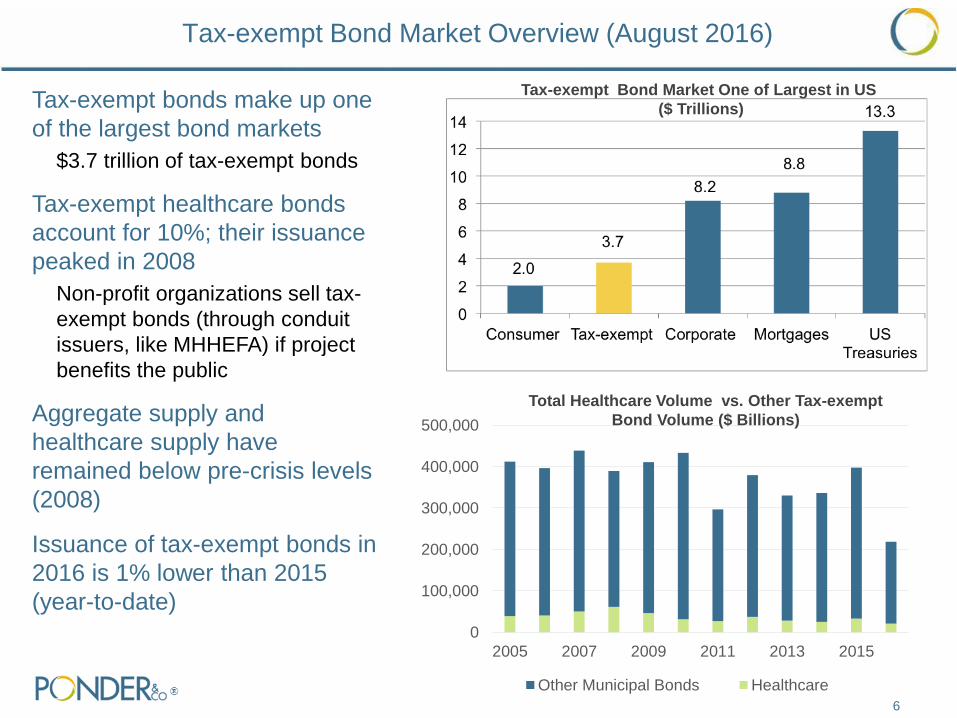
Tax-exempt Bond Market Overview (August 2016)
6
Tax-exempt bonds make up one
of the largest bond markets
$3.7 trillion of tax-exempt bonds
Tax-exempt healthcare bonds
account for 10%; their issuance
peaked in 2008
Non-profit organizations sell tax-
exempt bonds (through conduit
issuers, like MHHEFA) if project
benefits the public
Aggregate supply and
healthcare supply have
remained below pre-crisis levels
(2008)
Issuance of tax-exempt bonds in
2016 is 1% lower than 2015
(year-to-date)
Total Healthcare Volume vs. Other Tax-exempt
Bond Volume ($ Billions)
Tax-exempt Bond Market One of Largest in US
($ Trillions)
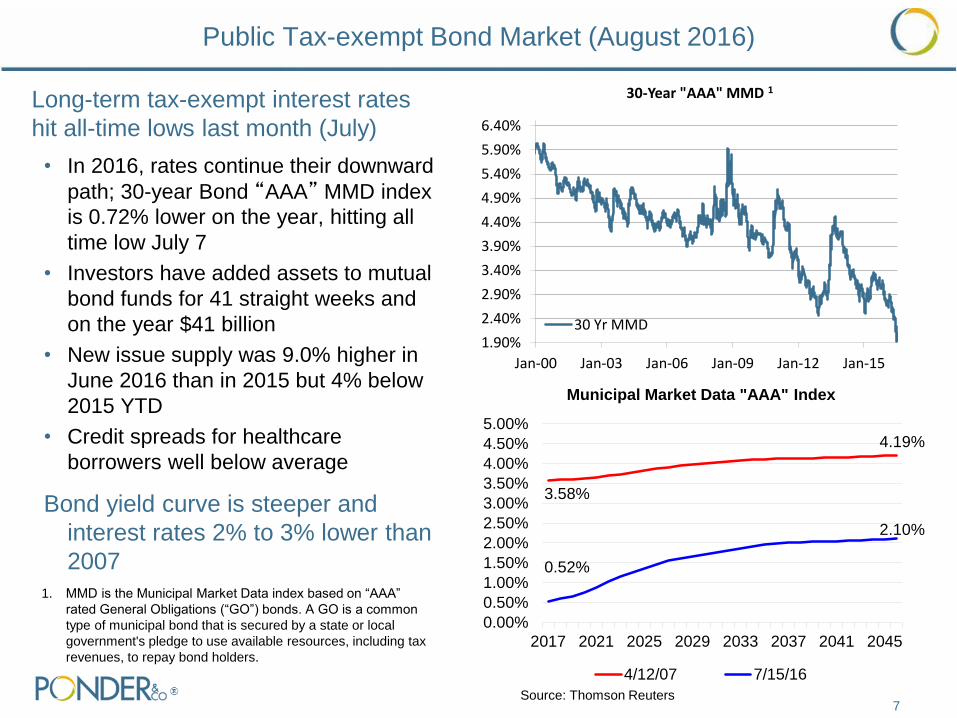
Public Tax-exempt Bond Market (August 2016)
Long-term tax-exempt interest rates
hit all-time lows last month (July)
• In 2016, rates continue their downward
path; 30-year Bond “AAA” MMD index
is 0.72% lower on the year, hitting all
time low July 7
• Investors have added assets to mutual
bond funds for 41 straight weeks and
on the year $41 billion
• New issue supply was 9.0% higher in
June 2016 than in 2015 but 4% below
2015 YTD
• Credit spreads for healthcare
borrowers well below average
Bond yield curve is steeper and
interest rates 2% to 3% lower than
2007
7
0.00%
0.50%
1.00%
1.50%
2.00%
2.50%
3.00%
3.50%
4.00%
4.50%
5.00%
2017 2021 2025 2029 2033 2037 2041 2045
Municipal Market Data "AAA" Index
4/12/07 7/15/16
4.19%
2.10%
3.58%
0.52%
1.90%
2.40%
2.90%
3.40%
3.90%
4.40%
4.90%
5.40%
5.90%
6.40%
Jan-00 Jan-03 Jan-06 Jan-09 Jan-12 Jan-15
30-Year "AAA" MMD 1
30 Yr MMD
Source: Thomson Reuters
1. MMD is the Municipal Market Data index based on “AAA”
rated General Obligations (“GO”) bonds. A GO is a common
type of municipal bond that is secured by a state or local
government's pledge to use available resources, including tax
revenues, to repay bond holders.
Healthcare tax-exempt bonds are viewed as riskier investments
Investors demand higher interest rates due to perceived vulnerability to
reimbursement changes and cost pressures in the healthcare industry
Credit spreads have narrowed since the 2008 financial crisis and continue to grind
tighter as investors search for yield in the current low rate environment
Not-For-Profit Healthcare Bond Credit Spreads Have Tightened
8
Lehman Bankruptcy, Breaking of the
“Buck” for Money Market Mutual Funds
Spread to 30-Year MMD
50 b
ps
11
0 b
ps
70
bp
s
45
bp
s
60
bp
s
75
bp
s
July 2006 July 2016
Source: Ponder & Co. The 10-year average “BBB” healthcare credit spread is 175 bps
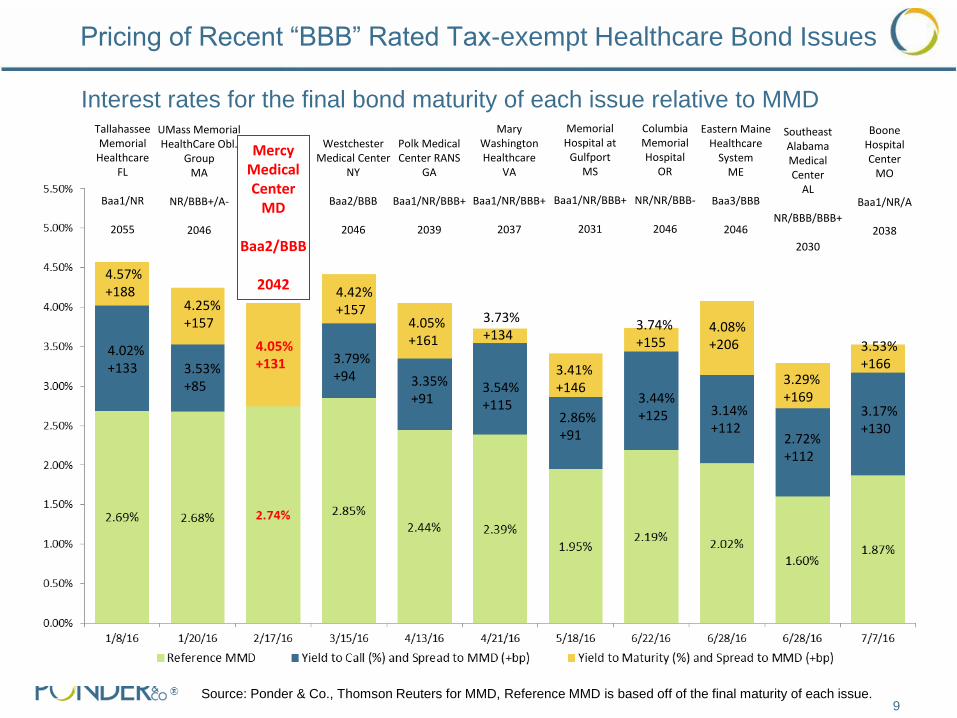
Pricing of Recent “BBB” Rated Tax-exempt Healthcare Bond Issues
9 Source: Ponder & Co., Thomson Reuters for MMD, Reference MMD is based off of the final maturity of each issue.
Interest rates for the final bond maturity of each issue relative to MMD Memorial Hospital at
Gulfport MS
Baa1/NR/BBB+
2031
3.41% +146
Tallahassee Memorial
Healthcare FL
Baa1/NR
2055
4.02% +133
4.57% +188
UMass Memorial HealthCare Obl.
Group MA
NR/BBB+/A-
2046
3.53% +85
4.25% +157
Mercy Medical Center
MD
Baa2/BBB
2042
4.05% +131
Westchester Medical Center
NY
Baa2/BBB
2046
3.79% +94
4.42% +157
Polk Medical Center RANS
GA
Baa1/NR/BBB+
2039
Mary Washington Healthcare
VA
Baa1/NR/BBB+
2037
3.35% +91
4.05% +161
3.54% +115
3.73% +134
2.86% +91
Columbia Memorial Hospital
OR
NR/NR/BBB-
2046
Eastern Maine Healthcare
System ME
Baa3/BBB
2046
Southeast Alabama Medical Center
AL
NR/BBB/BBB+
2030
3.44% +125
3.74% +155
4.08% +206
3.14% +112
2.72% +112
3.29% +169
Boone Hospital Center
MO
Baa1/NR/A
2038
3.17% +130
3.53% +166
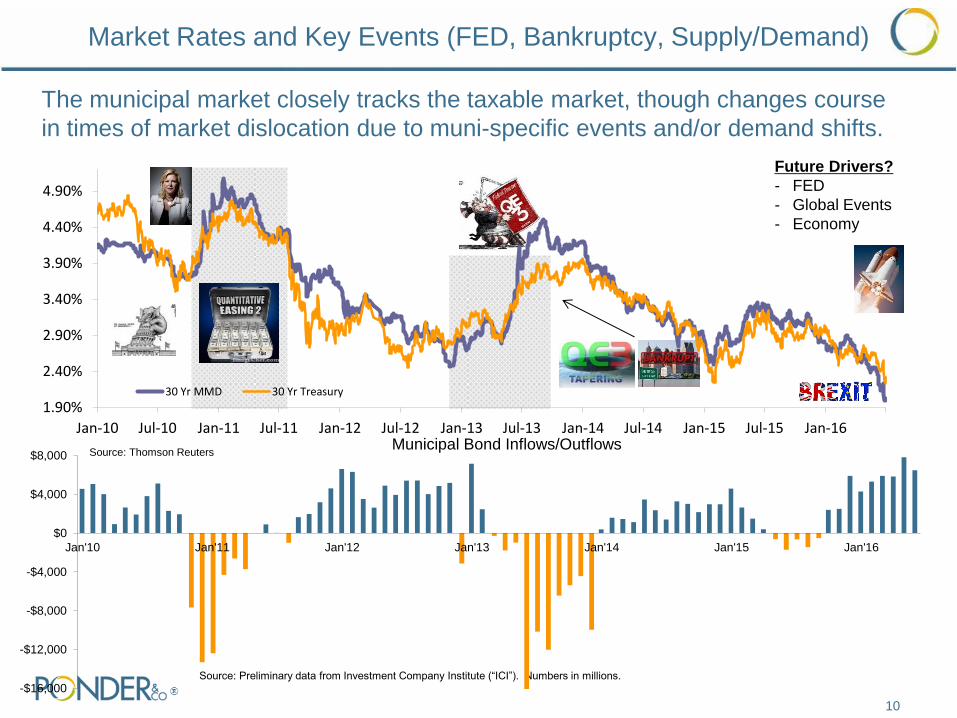
Market Rates and Key Events (FED, Bankruptcy, Supply/Demand)
Source: Preliminary data from Investment Company Institute (“ICI”). Numbers in millions.
The municipal market closely tracks the taxable market, though changes course
in times of market dislocation due to muni-specific events and/or demand shifts.
Future Drivers?
- FED
- Global Events
- Economy
Source: Thomson Reuters
-$16,000
-$12,000
-$8,000
-$4,000
$0
$4,000
$8,000
Jan'10 Jan'11 Jan'12 Jan'13 Jan'14 Jan'15 Jan'16
Municipal Bond Inflows/Outflows
10
1.90%
2.40%
2.90%
3.40%
3.90%
4.40%
4.90%
Jan-10 Jul-10 Jan-11 Jul-11 Jan-12 Jul-12 Jan-13 Jul-13 Jan-14 Jul-14 Jan-15 Jul-15 Jan-16
30 Yr MMD 30 Yr Treasury
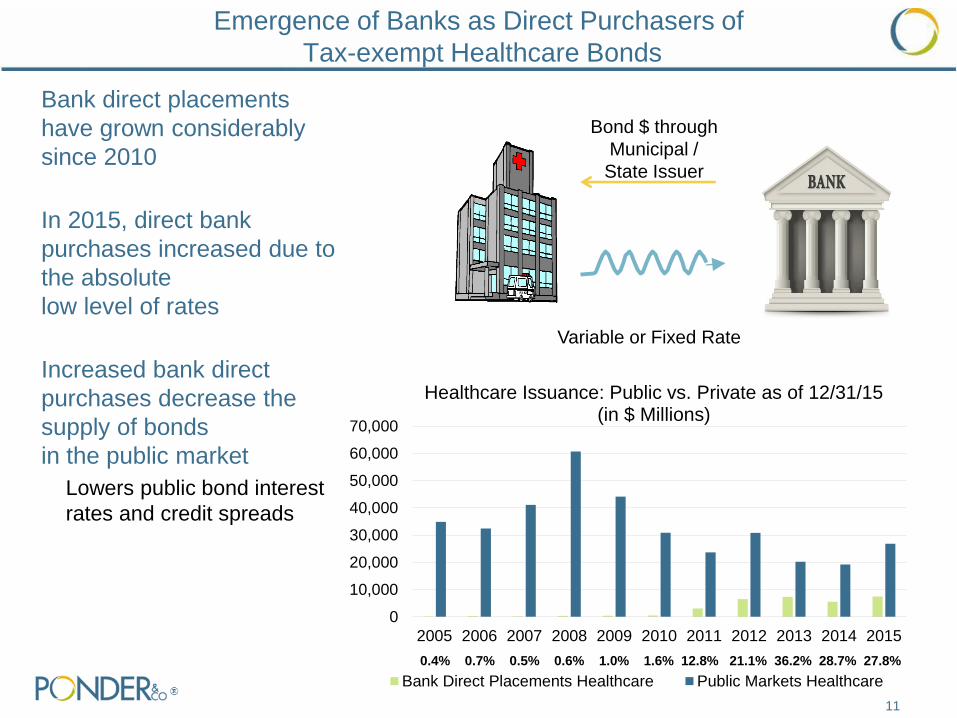
Emergence of Banks as Direct Purchasers of
Tax-exempt Healthcare Bonds
0
10,000
20,000
30,000
40,000
50,000
60,000
70,000
2005 2006 2007 2008 2009 2010 2011 2012 2013 2014 2015
Healthcare Issuance: Public vs. Private as of 12/31/15 (in $ Millions)
Bank Direct Placements Healthcare Public Markets Healthcare
0.4% 0.7% 0.5% 0.6% 1.0% 1.6% 12.8% 21.1% 36.2% 28.7% 27.8%
Bank direct placements
have grown considerably
since 2010
In 2015, direct bank
purchases increased due to
the absolute
low level of rates
Increased bank direct
purchases decrease the
supply of bonds
in the public market
Lowers public bond interest
rates and credit spreads
Variable or Fixed Rate
Bond $ through
Municipal /
State Issuer
11

Tax-exempt Bond Issue Options for Maryland Hospitals
Public Fixed Rate Bonds 1
Key Characteristics:
Bond Issue Maturity Up to 35 years (2051)
Interest Rate
Adjustment Frequency
Fixed for life of bonds (35 years)
Payment Demand
Frequency
Bond principal and interest
payment dates
Committed Capital Yes
Interest Rate Risk No
Bank Renewal Risk No
Bond Ratings? Yes
Current Indicative Pricing:
Tax-exempt Interest
Rate
4.00% (average fixed interest
rate)
Financing Costs $750,000 for $50 million issue
(1) Assumes Maryland non-profit hospital with “BBB” bond rating and current market conditions (August 2016).
(2) Assumes 10-year initial term
12
Bank Purchase Bonds
(Fixed or Variable Rate) 2
Up to 32 years (2048)
Fixed or variable for a fixed period (e.g. 10
yrs.); and less than life of bonds
Bank may require borrower to purchase
bonds at end of initial term
No
Yes, at end of initial term for fixed rate and
monthly for variable rate bonds
Yes, bank may elect NOT to extend
No
Fixed Rate: 2.25%
Variable Rate: 1.08% (historical average =
2.6%)
$300 million for $50 million issue

13
Rating Agency Outlook on Non-Profit Healthcare Industry
14
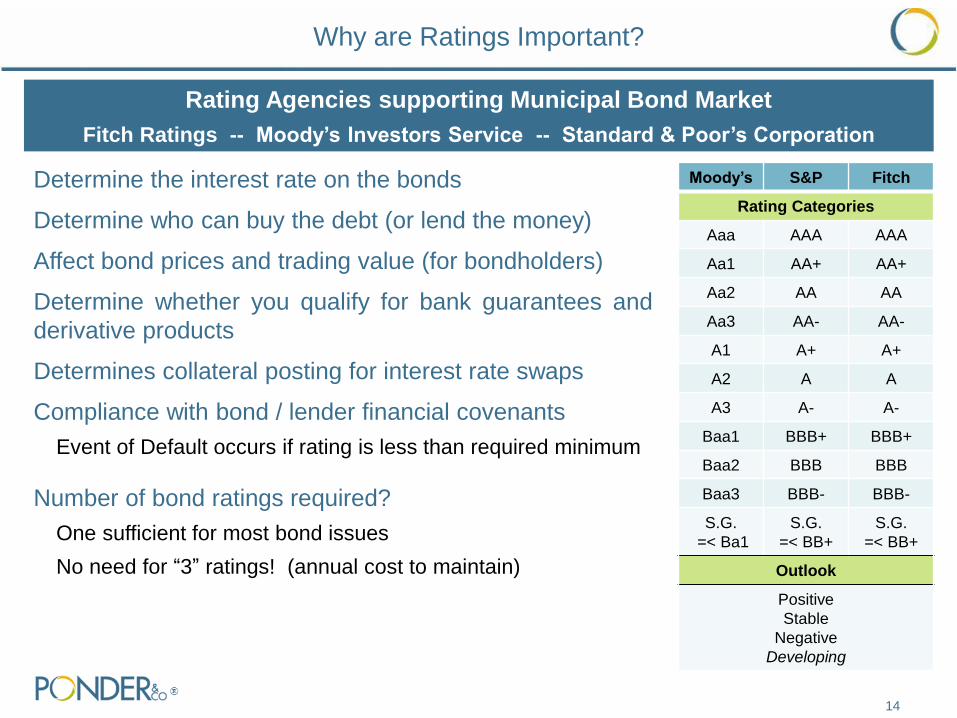
Why are Ratings Important?
Determine the interest rate on the bonds
Determine who can buy the debt (or lend the money)
Affect bond prices and trading value (for bondholders)
Determine whether you qualify for bank guarantees and
derivative products
Determines collateral posting for interest rate swaps
Compliance with bond / lender financial covenants
Event of Default occurs if rating is less than required minimum
Number of bond ratings required?
One sufficient for most bond issues
No need for “3” ratings! (annual cost to maintain)
Rating Agencies supporting Municipal Bond Market
Fitch Ratings -- Moody’s Investors Service -- Standard & Poor’s Corporation
Moody’s S&P Fitch
Rating Categories
Aaa AAA AAA
Aa1 AA+ AA+
Aa2 AA AA
Aa3 AA- AA-
A1 A+ A+
A2 A A
A3 A- A-
Baa1 BBB+ BBB+
Baa2 BBB BBB
Baa3 BBB- BBB-
S.G.
=< Ba1
S.G.
=< BB+
S.G.
=< BB+
Outlook
Positive
Stable
Negative
Developing
15
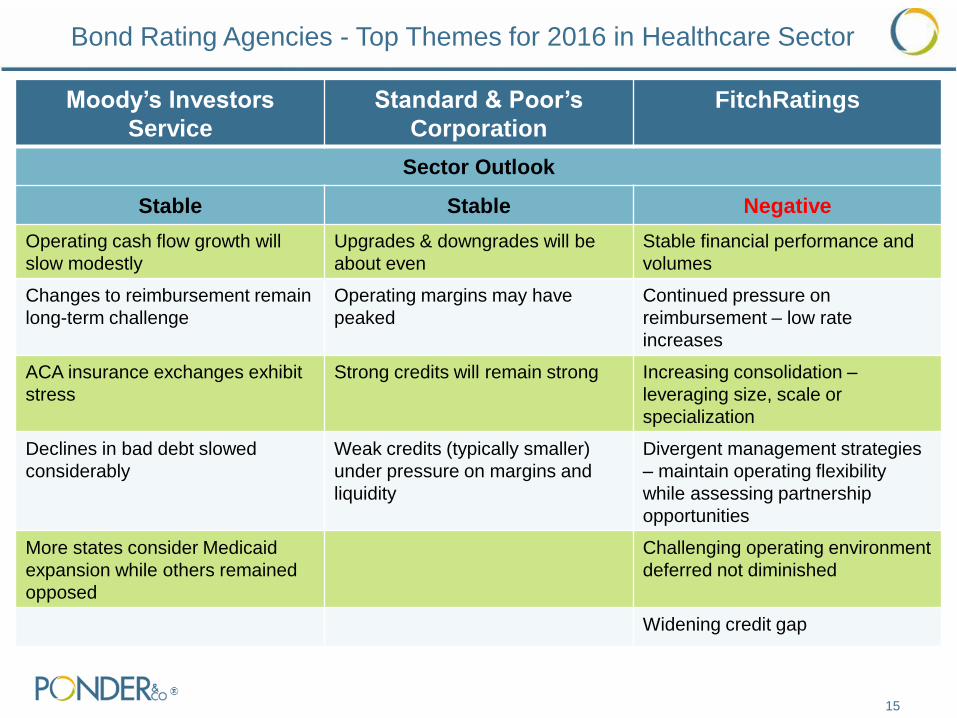
Bond Rating Agencies - Top Themes for 2016 in Healthcare Sector
Moody’s Investors
Service
Standard & Poor’s
Corporation
FitchRatings
Sector Outlook
Stable Stable Negative
Operating cash flow growth will
slow modestly
Upgrades & downgrades will be
about even
Stable financial performance and
volumes
Changes to reimbursement remain
long-term challenge
Operating margins may have
peaked
Continued pressure on
reimbursement – low rate
increases
ACA insurance exchanges exhibit
stress
Strong credits will remain strong Increasing consolidation –
leveraging size, scale or
specialization
Declines in bad debt slowed
considerably
Weak credits (typically smaller)
under pressure on margins and
liquidity
Divergent management strategies
– maintain operating flexibility
while assessing partnership
opportunities
More states consider Medicaid
expansion while others remained
opposed
Challenging operating environment
deferred not diminished
Widening credit gap
16
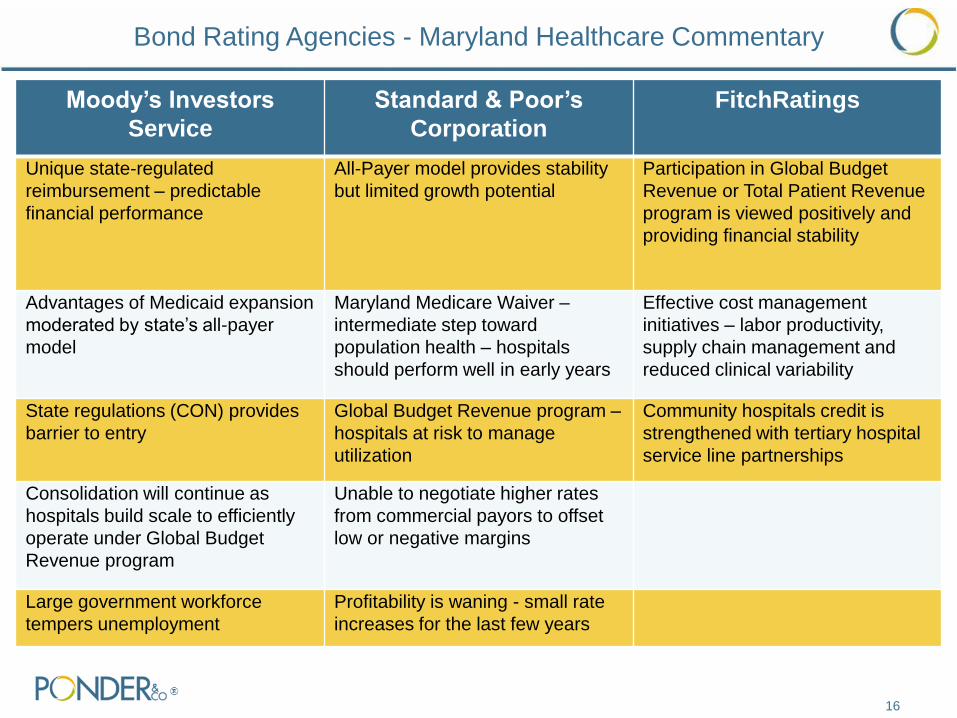
Bond Rating Agencies - Maryland Healthcare Commentary
Moody’s Investors
Service
Standard & Poor’s
Corporation
FitchRatings
Unique state-regulated
reimbursement – predictable
financial performance
All-Payer model provides stability
but limited growth potential
Participation in Global Budget
Revenue or Total Patient Revenue
program is viewed positively and
providing financial stability
Advantages of Medicaid expansion
moderated by state’s all-payer
model
Maryland Medicare Waiver –
intermediate step toward
population health – hospitals
should perform well in early years
Effective cost management
initiatives – labor productivity,
supply chain management and
reduced clinical variability
State regulations (CON) provides
barrier to entry
Global Budget Revenue program –
hospitals at risk to manage
utilization
Community hospitals credit is
strengthened with tertiary hospital
service line partnerships
Consolidation will continue as
hospitals build scale to efficiently
operate under Global Budget
Revenue program
Unable to negotiate higher rates
from commercial payors to offset
low or negative margins
Large government workforce
tempers unemployment
Profitability is waning - small rate
increases for the last few years
17
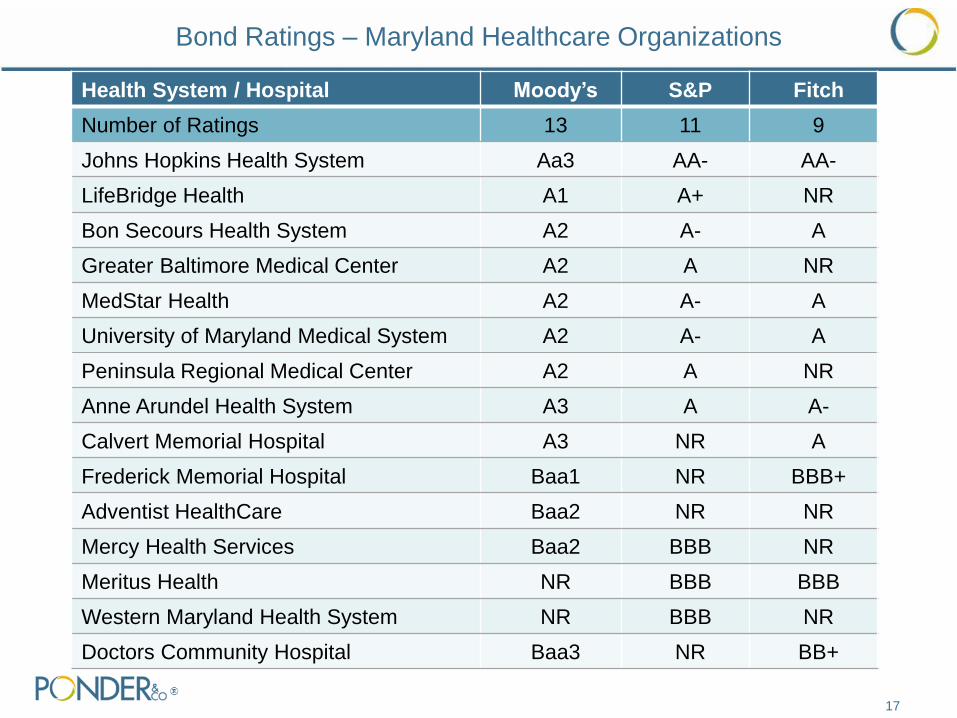
Health System / Hospital Moody’s S&P Fitch
Number of Ratings 13 11 9
Johns Hopkins Health System Aa3 AA- AA-
LifeBridge Health A1 A+ NR
Bon Secours Health System A2 A- A
Greater Baltimore Medical Center A2 A NR
MedStar Health A2 A- A
University of Maryland Medical System A2 A- A
Peninsula Regional Medical Center A2 A NR
Anne Arundel Health System A3 A A-
Calvert Memorial Hospital A3 NR A
Frederick Memorial Hospital Baa1 NR BBB+
Adventist HealthCare Baa2 NR NR
Mercy Health Services Baa2 BBB NR
Meritus Health NR BBB BBB
Western Maryland Health System NR BBB NR
Doctors Community Hospital Baa3 NR BB+
Bond Ratings – Maryland Healthcare Organizations
18
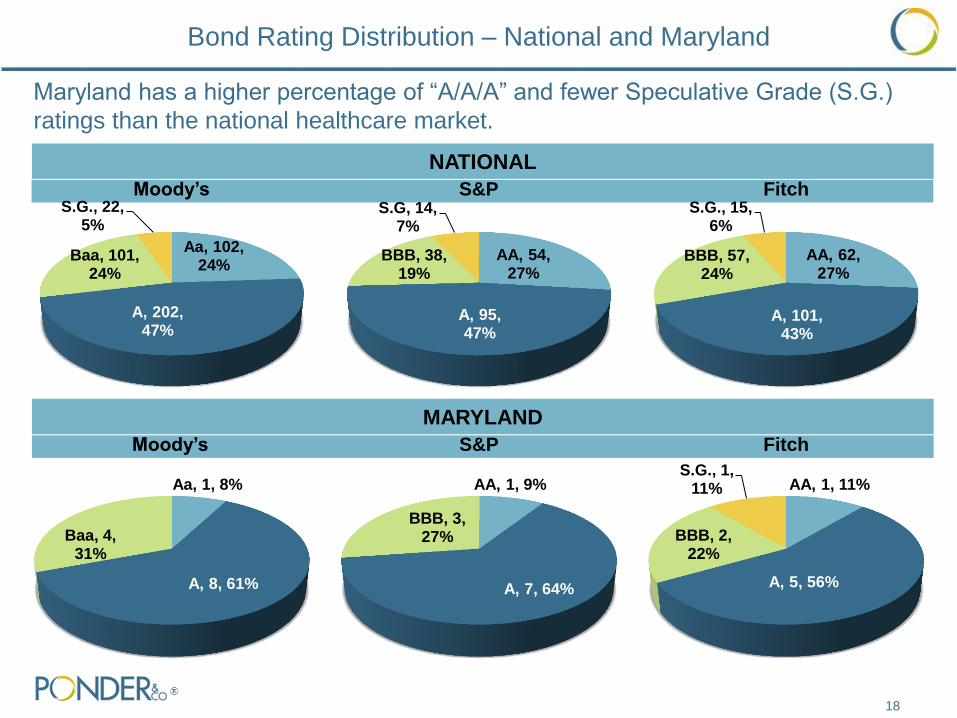
Maryland has a higher percentage of “A/A/A” and fewer Speculative Grade (S.G.)
ratings than the national healthcare market.
AA, 54, 27%
A, 95, 47%
BBB, 38, 19%
S.G, 14, 7%
S&P
Aa, 102, 24%
A, 202, 47%
Baa, 101, 24%
S.G., 22, 5%
Moody’s
NATIONAL
MARYLAND
Aa, 1, 8%
A, 8, 61%
Baa, 4, 31%
Moody’s
AA, 1, 9%
A, 7, 64%
BBB, 3, 27%
S&P
Bond Rating Distribution – National and Maryland
AA, 62, 27%
A, 101, 43%
BBB, 57, 24%
S.G., 15, 6%
Fitch
AA, 1, 11%
A, 5, 56%
BBB, 2, 22%
S.G., 1, 11%
Fitch
19
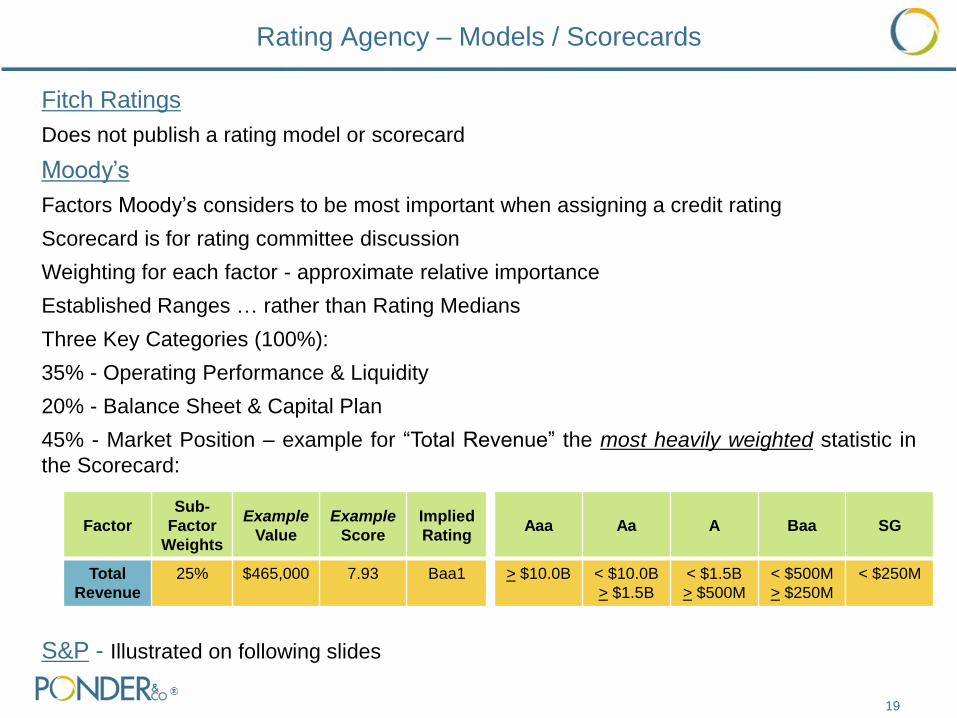
Fitch Ratings
Does not publish a rating model or scorecard
Moody’s
Factors Moody’s considers to be most important when assigning a credit rating
Scorecard is for rating committee discussion
Weighting for each factor - approximate relative importance
Established Ranges … rather than Rating Medians
Three Key Categories (100%):
35% - Operating Performance & Liquidity
20% - Balance Sheet & Capital Plan
45% - Market Position – example for “Total Revenue” the most heavily weighted statistic in
the Scorecard:
S&P - Illustrated on following slides
Rating Agency – Models / Scorecards
Factor
Sub-
Factor
Weights
Example
Value
Example
Score
Implied
Rating Aaa Aa A Baa SG
Total
Revenue
25% $465,000 7.93 Baa1 > $10.0B < $10.0B
> $1.5B
< $1.5B
> $500M
< $500M
> $250M
< $250M
Initial
Indicative
Rating
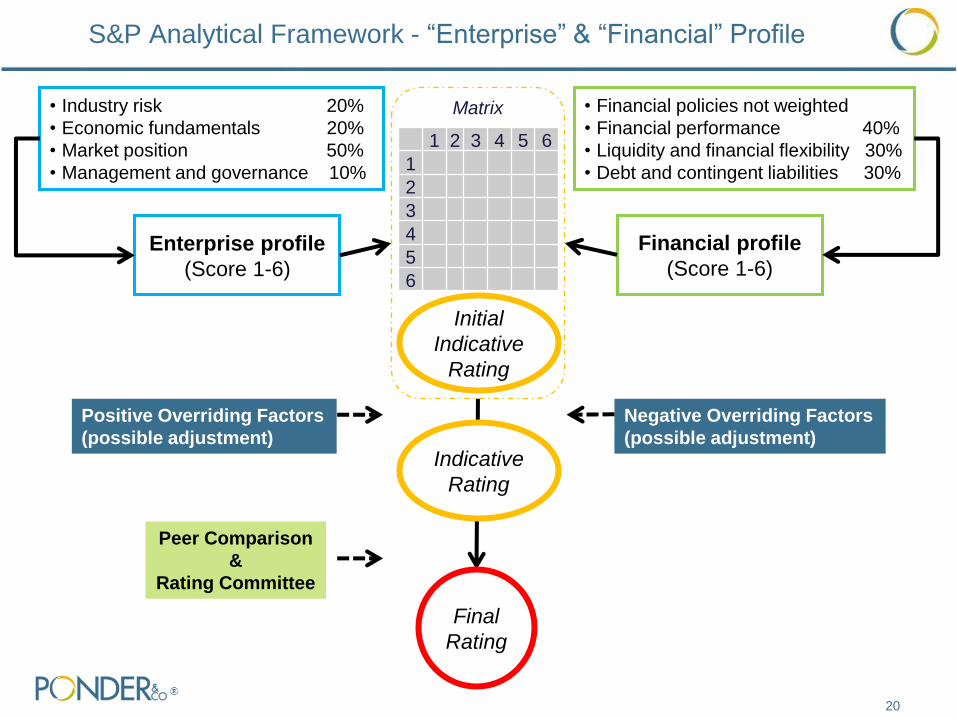
Enterprise profile
(Score 1-6)
• Financial policies not weighted
• Financial performance 40%
• Liquidity and financial flexibility 30%
• Debt and contingent liabilities 30%
Financial profile
(Score 1-6)
Matrix
1 2 3 4 5 6
1
2
3
4
5
6
20
S&P Analytical Framework - “Enterprise” & “Financial” Profile
• Industry risk 20%
• Economic fundamentals 20%
• Market position 50%
• Management and governance 10%
Final
Rating
Indicative
Rating
Positive Overriding Factors
(possible adjustment)
Negative Overriding Factors
(possible adjustment)
Peer Comparison
&
Rating Committee
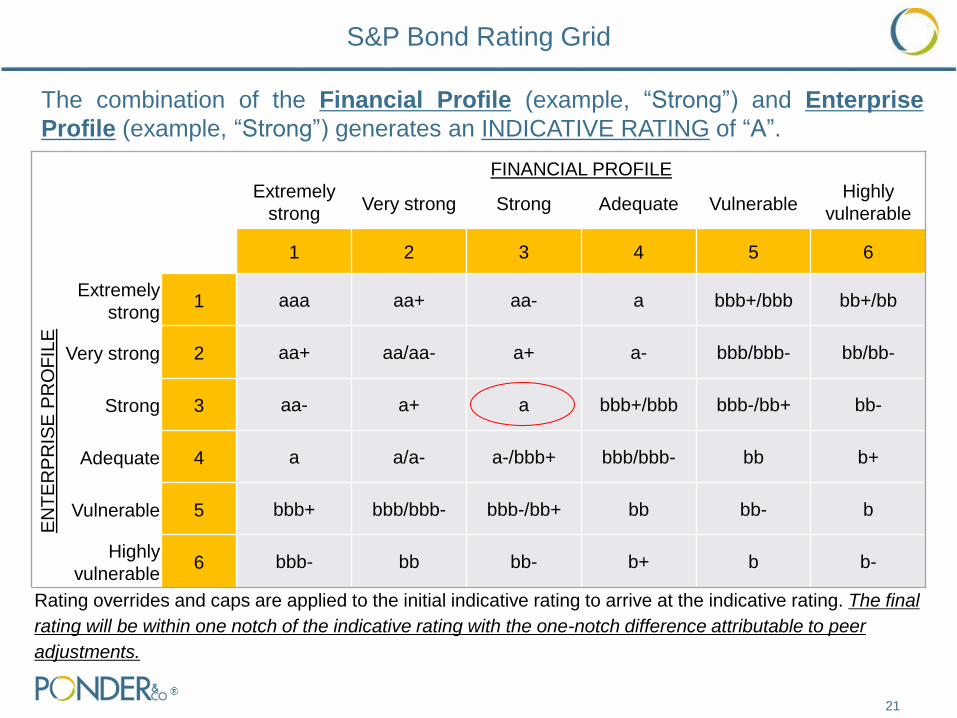
FINANCIAL PROFILE Extremely
strong Very strong Strong Adequate Vulnerable
Highly
vulnerable
1 2 3 4 5 6
EN
TE
RP
RIS
E P
RO
FIL
E
Extremely
strong 1 aaa aa+ aa- a bbb+/bbb bb+/bb
Very strong 2 aa+ aa/aa- a+ a- bbb/bbb- bb/bb-
Strong 3 aa- a+ a bbb+/bbb bbb-/bb+ bb-
Adequate 4 a a/a- a-/bbb+ bbb/bbb- bb b+
Vulnerable 5 bbb+ bbb/bbb- bbb-/bb+ bb bb- b
Highly
vulnerable 6 bbb- bb bb- b+ b b-
Rating overrides and caps are applied to the initial indicative rating to arrive at the indicative rating. The final
rating will be within one notch of the indicative rating with the one-notch difference attributable to peer
adjustments.
21
The combination of the Financial Profile (example, “Strong”) and Enterprise
Profile (example, “Strong”) generates an INDICATIVE RATING of “A”.
S&P Bond Rating Grid
Rating Evaluation Services
22
Rating evaluation service is a tool to evaluate major strategic options, such as
• Large capital project expenditures funded with cash or additional debt
• Key financing document revisions (e.g. change in security, reserve funds, financial
covenants and hospital lease changes)
• Merger & acquisition impact
How does the rating evaluation work?
• Provide rating agency analyst with hypothetical scenarios
• S&P will assess potential credit impact of proposed strategic initiatives
• May be viewed as less favorable or more favorable
Value to Healthcare Organization?
• Confidential assessment (will not affect existing bond ratings)
• Assess how proposed initiatives may affect your creditworthiness ahead of time
• Cost can be credited to bond rating fee (if obtained in 6 to 12 months)

23
Recent Merger & Acquisition Activity in the Healthcare Market
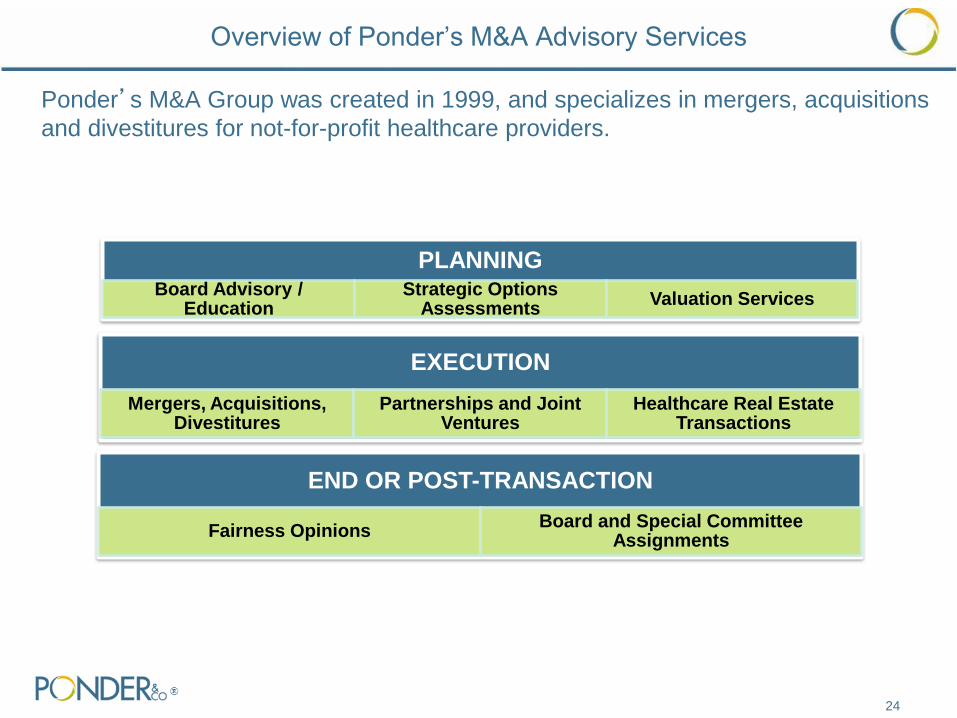
Overview of Ponder’s M&A Advisory Services
Ponder’s M&A Group was created in 1999, and specializes in mergers, acquisitions
and divestitures for not-for-profit healthcare providers.
24
EXECUTION
Mergers, Acquisitions, Divestitures
Partnerships and Joint Ventures
Healthcare Real Estate Transactions
END OR POST-TRANSACTION
Fairness Opinions Board and Special Committee
Assignments
PLANNING Board Advisory /
Education Strategic Options
Assessments Valuation Services
Overview of Ponder’s M&A Advisory Services
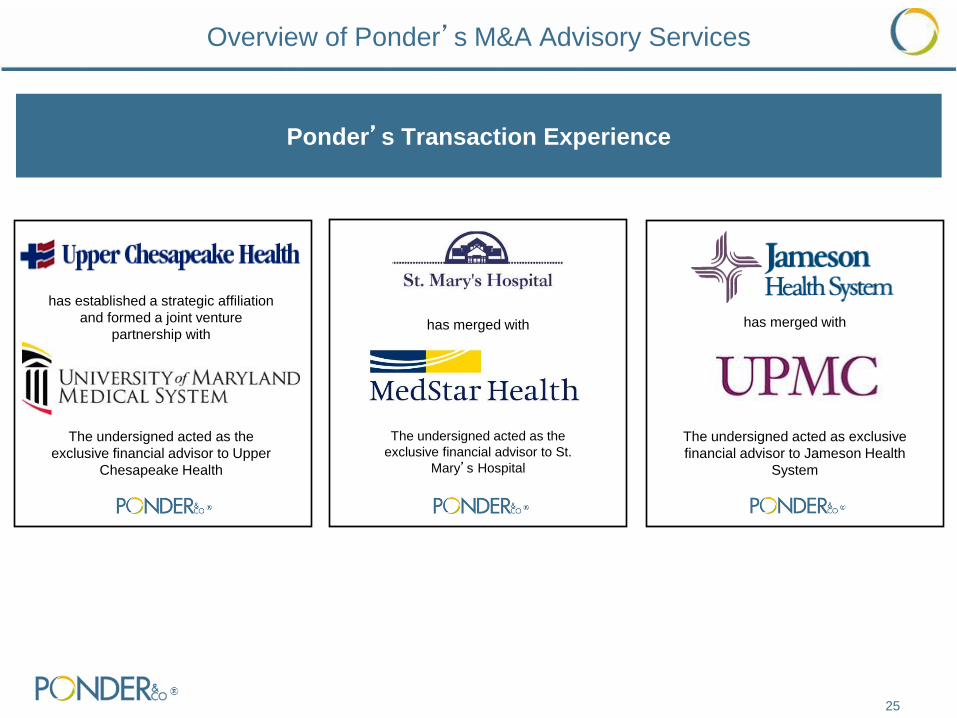
Ponder’s Transaction Experience
25
has established a strategic affiliation
and formed a joint venture
partnership with
The undersigned acted as the
exclusive financial advisor to Upper
Chesapeake Health
has merged with
The undersigned acted as exclusive
financial advisor to Jameson Health
System
has merged with
The undersigned acted as the
exclusive financial advisor to St.
Mary’s Hospital
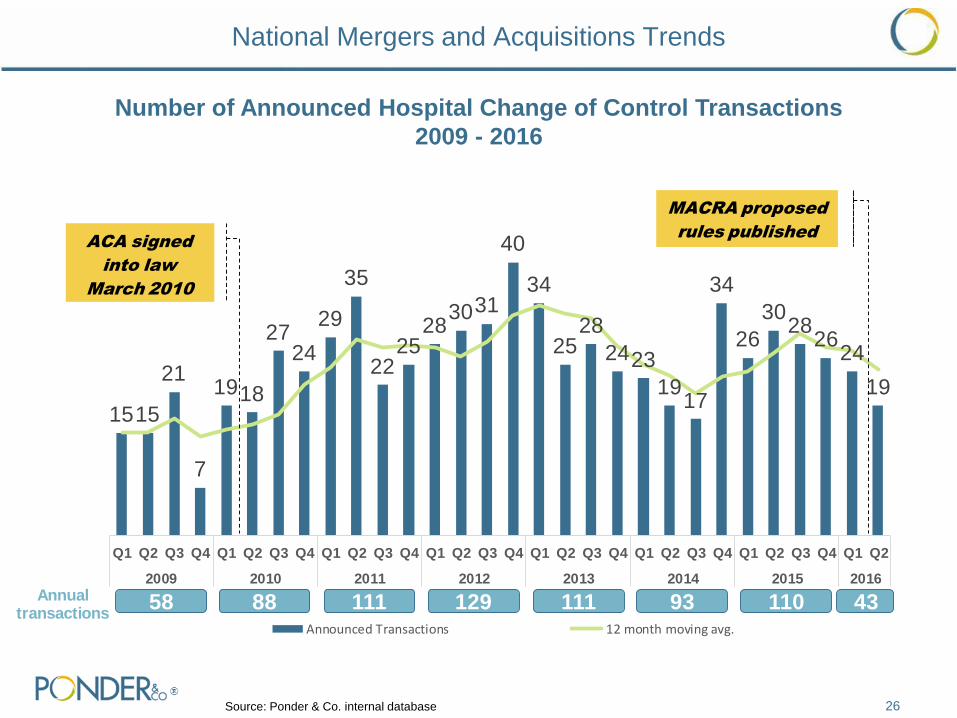
National Mergers and Acquisitions Trends
26 Source: Ponder & Co. internal database
1515
21
7
1918
2724
29
35
2225
283031
40
34
2528
2423
1917
34
26
3028
2624
19
Q1 Q2 Q3 Q4 Q1 Q2 Q3 Q4 Q1 Q2 Q3 Q4 Q1 Q2 Q3 Q4 Q1 Q2 Q3 Q4 Q1 Q2 Q3 Q4 Q1 Q2 Q3 Q4 Q1 Q2
2009 2010 2011 2012 2013 2014 2015 2016
Announced Transactions 12 month moving avg.
ACA signed
into law
March 2010
58 88 111Annual transactions
129 111 93 110 43
MACRA proposed
rules published
Number of Announced Hospital Change of Control Transactions
2009 - 2016
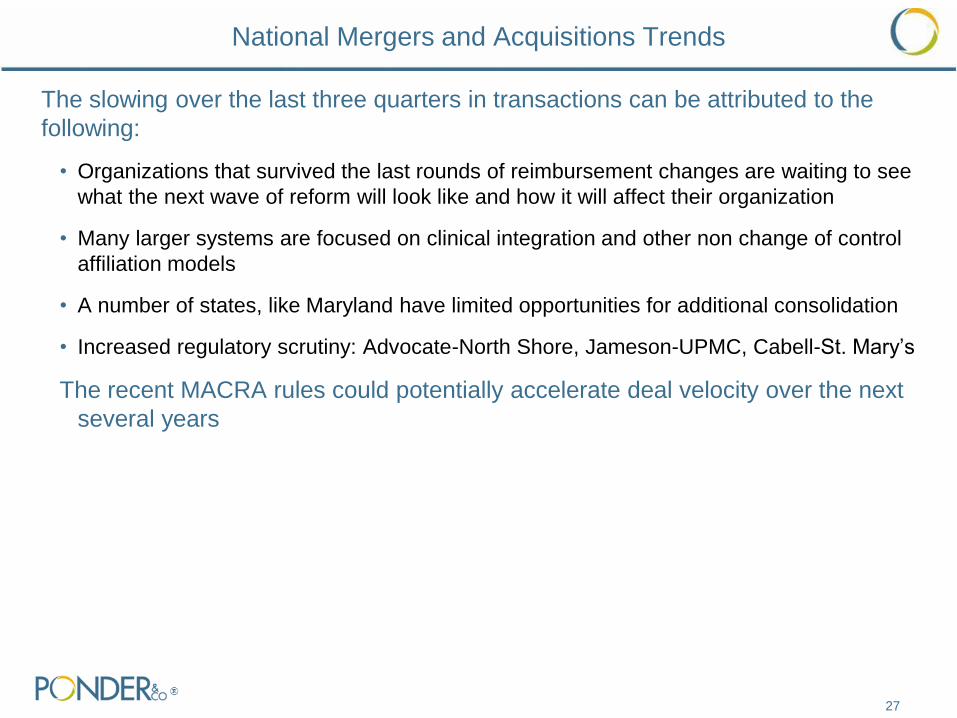
The slowing over the last three quarters in transactions can be attributed to the
following:
• Organizations that survived the last rounds of reimbursement changes are waiting to see
what the next wave of reform will look like and how it will affect their organization
• Many larger systems are focused on clinical integration and other non change of control
affiliation models
• A number of states, like Maryland have limited opportunities for additional consolidation
• Increased regulatory scrutiny: Advocate-North Shore, Jameson-UPMC, Cabell-St. Mary’s
The recent MACRA rules could potentially accelerate deal velocity over the next
several years
27
National Mergers and Acquisitions Trends
28
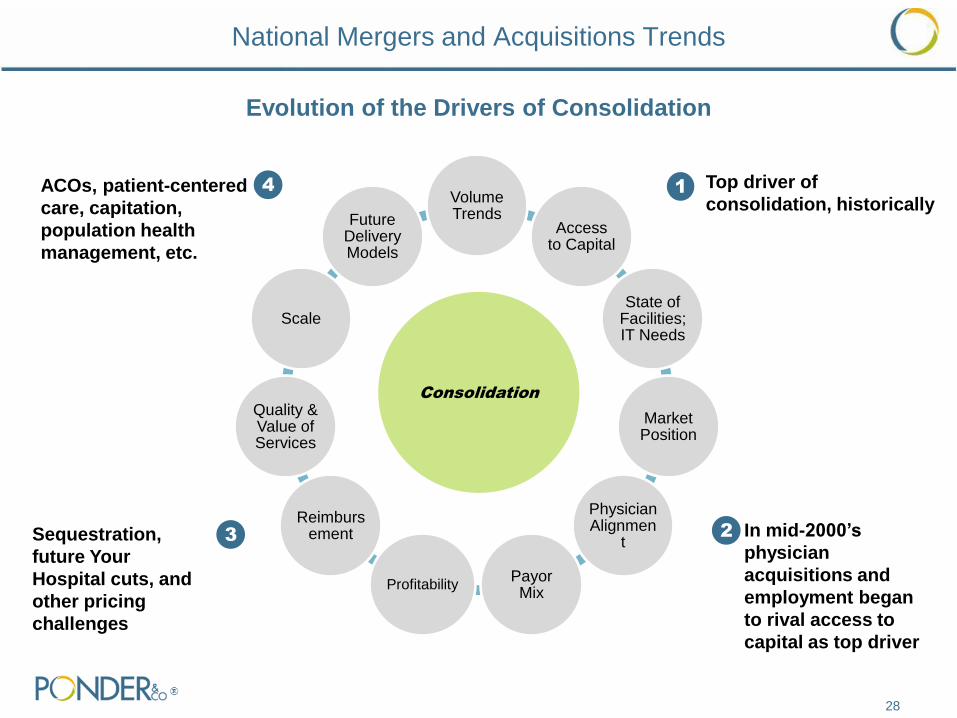
Volume Trends
Access to Capital
State of Facilities; IT Needs
Market Position
Physician Alignmen
t
Payor Mix
Profitability
Reimbursement
Quality & Value of Services
Scale
Future Delivery Models
Consolidation
1 Top driver of
consolidation, historically
2 In mid-2000’s
physician
acquisitions and
employment began
to rival access to
capital as top driver
3 Sequestration,
future Your
Hospital cuts, and
other pricing
challenges
4 ACOs, patient-centered
care, capitation,
population health
management, etc.
Evolution of the Drivers of Consolidation
National Mergers and Acquisitions Trends
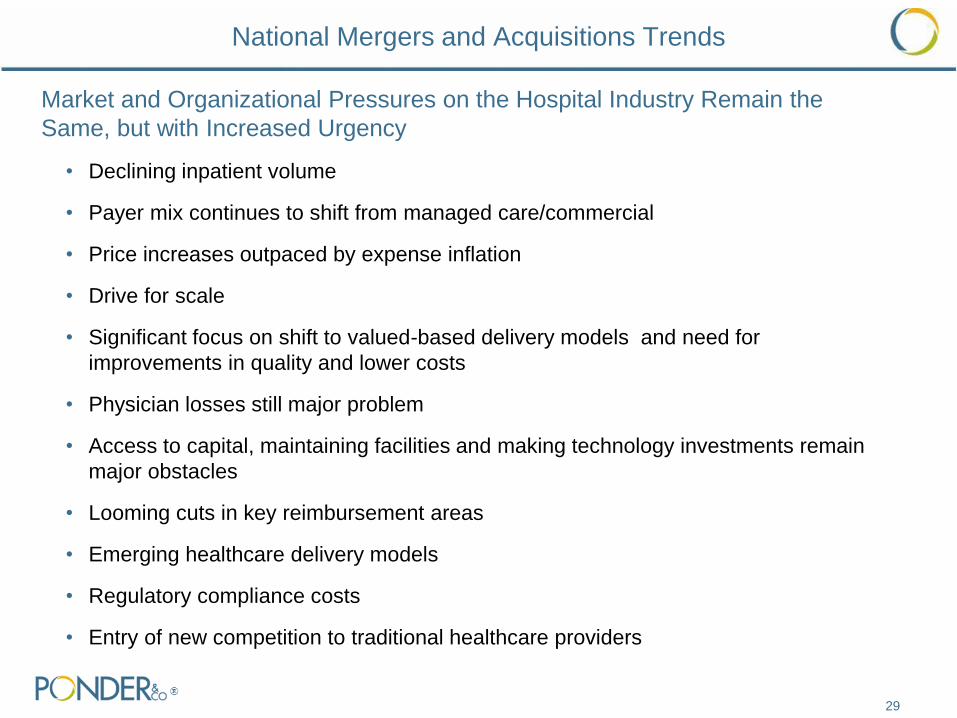
Market and Organizational Pressures on the Hospital Industry Remain the
Same, but with Increased Urgency
• Declining inpatient volume
• Payer mix continues to shift from managed care/commercial
• Price increases outpaced by expense inflation
• Drive for scale
• Significant focus on shift to valued-based delivery models and need for
improvements in quality and lower costs
• Physician losses still major problem
• Access to capital, maintaining facilities and making technology investments remain
major obstacles
• Looming cuts in key reimbursement areas
• Emerging healthcare delivery models
• Regulatory compliance costs
• Entry of new competition to traditional healthcare providers
29
National Mergers and Acquisitions Trends
National Mergers and Acquisitions Trends
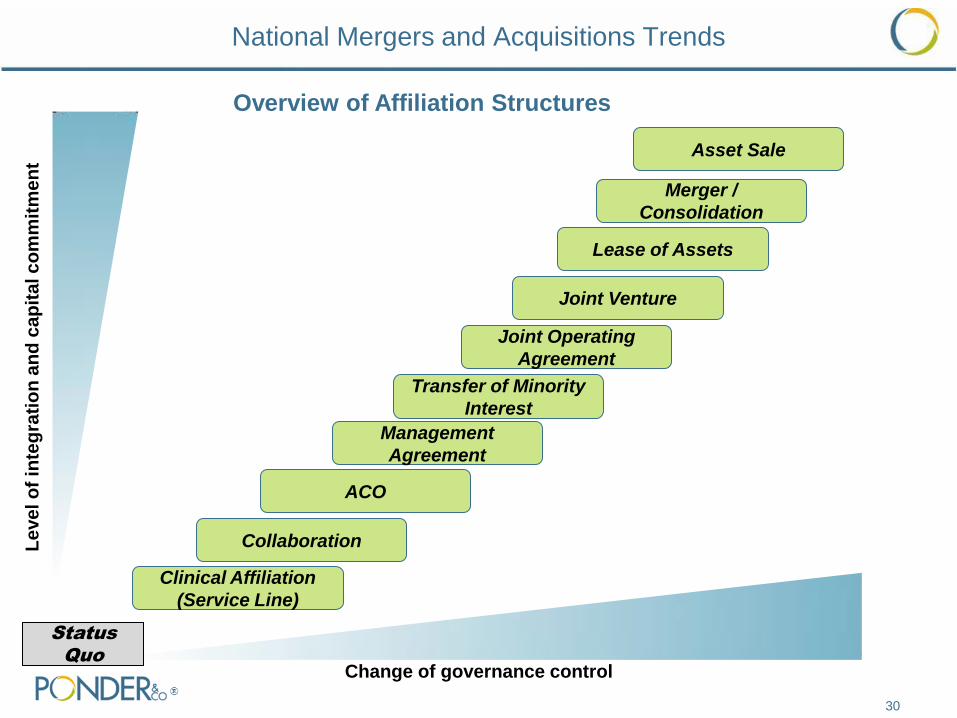
30
Le
ve
l o
f in
teg
rati
on
an
d c
ap
ita
l c
om
mit
me
nt
Change of governance control
Clinical Affiliation
(Service Line)
Collaboration
Management
Agreement
Joint Operating
Agreement
Joint Venture
Lease of Assets
Merger /
Consolidation
Asset Sale
Transfer of Minority
Interest
ACO
Status
Quo
Overview of Affiliation Structures

Increased Challenges to Change of Control Transactions
31
Regulatory challenges have become more prevalent, often causing significant
delays and, in some cases, abandoned efforts. Regulatory issues related to
hospital transactions continue to increase due to the following:
Anti-trust challenges have prevented or unraveled a number of major
transactions:
• ProMedica and St. Luke’s Hospital in Ohio
• Jameson Health System
Self-disclosures related to poorly structured physician arrangements have
regularly come up in due diligence and may extend the timing from
announcement of a transaction to closing
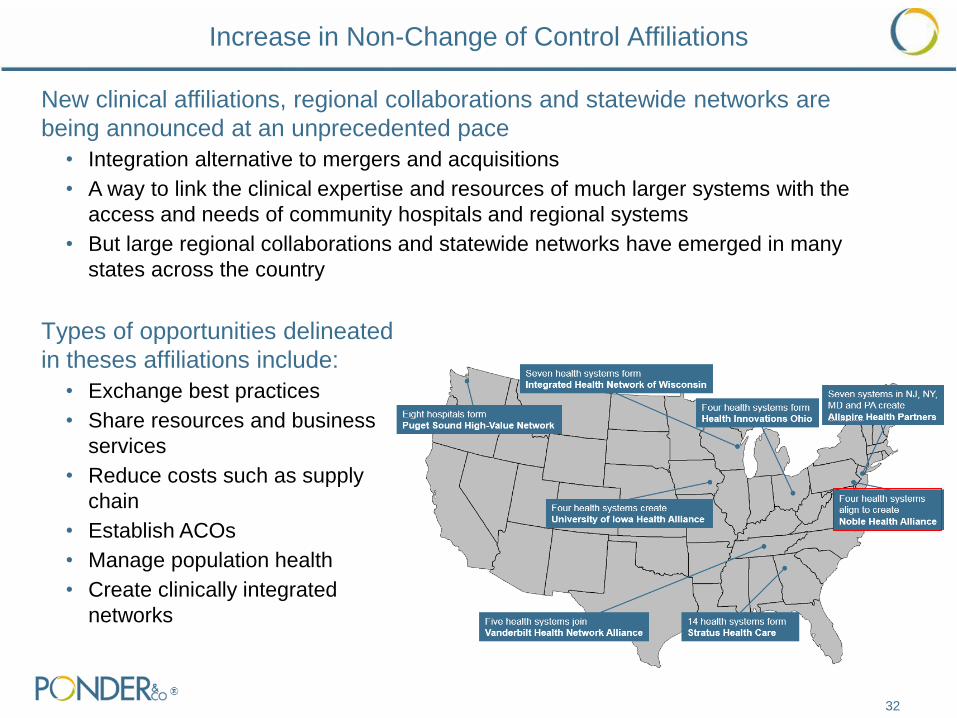
Increase in Non-Change of Control Affiliations
32
Types of opportunities delineated
in theses affiliations include:
• Exchange best practices
• Share resources and business
services
• Reduce costs such as supply
chain
• Establish ACOs
• Manage population health
• Create clinically integrated
networks
New clinical affiliations, regional collaborations and statewide networks are
being announced at an unprecedented pace
• Integration alternative to mergers and acquisitions
• A way to link the clinical expertise and resources of much larger systems with the
access and needs of community hospitals and regional systems
• But large regional collaborations and statewide networks have emerged in many
states across the country
33
Other Strategies Being Pursued
Acquisition of ancillary service companies
• Large health systems continue to look at vertical integration to diversify revenue streams
• Examples include: Ascension Health investment in Accretive Health, Intermountain
Healthcare acquired Amerinet, UPMC supply-chain venture with IBM
Ambulatory Strategy
• Invest in freestanding ERs, urgent care centers, ambulatory surgery centers
• Examples include: Tenet Health acquired United Surgical Partners International
Physician Trends
• Physician alignment continues to be central strategy of health systems nationally
• Clinical integration continues to be a major focus of many systems
AMCs
• Many Academic Medical Centers continue to utilize M&A to grow a wide foot print to
support their mission and grow tertiary/quaternary capabilities
Collaborations
• Collaborations to date have demonstrated mixed results but still awaiting big payoff
34
The level of consolidation activity over the last several years in Maryland has
remained slow as compared to national trends, which has experienced the
following change-of-control activity:
• 2009 – 3 announced transactions
• 2011 – 1 announced transaction
• 2012 – 2 announced transactions
• 2015 – 1 announced transaction
Large not-for-profit systems are leading the consolidating wave in the state
• University of Maryland Medical System has completed five affiliations since 2009,
including a management agreement with Union Hospital
• Medstar Health has affiliated with three hospitals since 2008, building a system of 10
hospitals
Collaborations
• Advanced Health Collaborative, a collaboration of five Maryland based health systems
• Trivergent Health Alliance, management services organization of three Maryland based
health systems
Maryland Mergers and Acquisitions Trends

Maryland Hospitals, More than 150 Beds
35
Independent Hospitals

36
Maryland Mergers and Acquisitions Trends
Date
Announced Target City State
Target
Tax
Status Acquirer
Acquirer
Tax
Status
Target
Beds
1 05/01/09 Suburban Hospital Healthcare Bethesda MD NFP Johns Hopkins Health System NFP 238
2 07/06/09 Upper Chesapeake Health System Bel Air MD NFP University of Maryland Medical System NFP 276
3 09/22/09 St Mary's Hospital Leonardtown MD NFP MedStar Health NFP 103
4 05/26/11 Civista Health La Plata MD NFP University of Maryland Medical System NFP 130
5 03/23/12 St. Joseph Medical Center (Catholic Health Initiatives) Baltimore MD NFP University of Maryland Medical System NFP 263
6 07/31/12 Southern Maryland Hospital Center Clinton MD NFP MedStar Health NFP 265
7 03/27/15 Carroll Hospital Center Westminster MD NFP LifeBridge Health NFP 158
1
2
3
4
5
6
7
What are characteristics of an ideal partner?
• Cultural fit & shared strategic vision
• Complementary clinical assets
• Complementary geography
• Strong brand name
• Scale
• Willingness to share referrals
What can Your Hospital expect to gain through a partnership?
• Increased Scale
• Intellectual capital
• Physician recruitment
• IT support through a common platform
• Expense and cost reduction
What will Your Hospital concede to execute a partnership?
• How important is local control?
What are the implications of first to market vs. last to market?
• Choice ... Act from a position of financial strength
Partnership Considerations
37

38
Ponder & Co. Representatives
Speaker Biography
John Cheney, Managing Director, Capital Advisory Group
410-435-6745
Mr. Cheney has provided financial advisory services for more than 30 years to non-profit
organizations. He specializes in healthcare services, healthcare insurance and life science
research. Mr. Cheney joined Ponder & Co. in 2003.
Mr. Cheney has advised many organizations on raising debt capital for major building and
equipment projects. During his financing career, he completed approximately 200 debt
issues, totaling more than $5 billion. He has extensive experience with both taxable and tax-
exempt debt offerings, including all types of fixed and variable rate indebtedness and has also
worked with clients to structure more than $2 billion in interest rate swaps and other interest
rate hedges.
Prior to Ponder & Co., Mr. Cheney served as an investment banker with Salomon Brothers,
Alex. Brown & Sons Incorporated and Banc of America Securities LLC.
Mr. Cheney holds an M.B.A. from Northwestern University’s J. L. Kellogg School of
Management and a bachelor’s degree with honors from Northwestern in Evanston, Illinois.
Mr. Cheney is a member of Healthcare Financial Management Association.
39

Speaker Biography
Donald Persinski, Managing Director, Capital Advisory Group
412-668-0567
Mr. Persinski joined Ponder & Co. in 2014. Prior to joining Ponder, Mr. Persinski worked for
almost 30 years in the investment banking and banking industries specializing in debt
management and capital planning for healthcare organizations. During his tenure with PNC
Capital Markets LLC, Mr. Persinski served as the Manager of the Healthcare and Non-Profit
Group (included healthcare, higher education and other 501(c)3 organizations).
Mr. Persinski has worked with multi-state health systems, academic medical centers, specialty
hospitals, community hospitals and long-term care corporations. He has advised clients and
structured fixed rate and multimodal debt plans; tax-exempt and taxable public bond issues
and private debt placements. He supported the implementation of various bank credit facilities
and derivative strategies.
He has been an invited guest speaker at HFMA meetings and healthcare corporate board
retreats. He has guided management teams through the development of credit analyses, debt
capacity analyses, and the preparation for rating agency, bank and investor presentations.
Mr. Persinski holds an M.B.A. with an emphasis in finance from the Joseph M. Katz Graduate
School of Business, University of Pittsburgh and a B.S. degree in finance from The Ohio State
University.
Mr. Persinski is a member of Healthcare Financial Management Association.
40

Speaker Biography
Christopher Schoeplein, Associate, Strategic Advisory Group
615-690-5543
Mr. Schoeplein joined Ponder & Co. Mergers and Acquisitions Group in 2014. His
responsibilities include evaluating the financial performance of hospitals and healthcare
systems, performing market analyses and developing financial models and valuations for clients
and prospects. Mr. Schoeplein also focuses on strategic options assessments and assists in
transaction development and execution.
Prior to joining Ponder & Co., Mr. Schoeplein was a consultant at Health Care Futures, LP, a
strategy and management consulting firm specializing in not-for-profit healthcare systems. He
focused on joint venture development, mergers and acquisitions, capital planning and financial
feasibility studies concentrating in financial modeling customized to individual client strategy
and positioning.
Mr. Schoeplein is a graduate from St. Louis University, with a degree in Finance.
Mr. Schoeplein is a member of the Health Financial Management Association.
41