Embed Size (px)
Citation preview

HFCT-based Detection of Partial Discharge Currents
on GIS Enclosures
L. C. Castro Heredia and A. Rodrigo Mor Department of Electrical Sustainable Energy
Delft University of Technology
Delft, The Netherlands
Abstract- This work introduces an approach for partial
discharge (PD) detection on GIS that makes use of HFCT. The
novelty of this method is that the HFCT is installed at the bolts of
the external-type spacers to measure, with a bandwidth in the
range of hundreds of MHz, the induced PD surface currents
flowing along the GIS compartments. Experiments with
calibrator signals were conducted to prove that the PD events
induce currents in the compartments and to understand their
distribution. Next, measurements with test cells were carried out
to estimate the spatial sensitivity of the measuring circuit and the
effect of noise and disturbances. Finally, the spectral power ratio
clustering technique was applied to test results as a method to
discriminate PD and non-PD signals.
I. INTRODUCTION
Gas insulated systems (GIS) are components of the HV
networks especially suitable when the overall size of a
substation needs to be scaled down. This becomes cornerstone
in offshore applications where the price and availability of
space comes to a high premium. For a reliable operation, GIS
are equipped with VHF/UHF antennas for the monitoring and
diagnostics of partial discharges (PD). Documents such as the
IEC TS 62478 [1] and CIGRE WG. D1.25 [2] offer good
reference guidelines for implementation and also define a
“sensitivity check” as a means to verify that a VHF/UHF
measuring system on-field is able to pick up signals equivalent
to 5 pC as measured by the conventional IEC 60270 method
during laboratory tests. Several decades of field experience
have supported that the VHF/UHF systems are sensitive and
high resilient to noise due to the high frequency range at
which they record PD signals. Nevertheless, this high
frequency range also accounts for some important limitations
according to the IEC TS 62478. A correlation of the measured
signal to an apparent charge is not possible because the
resonating frequency of the antenna in the range of hundreds
of MHz to GHz is far away from the DC component (or low
frequency components) of the PD current that needs to be
measured to estimate the value of apparent charge. In addition,
the GHz range of the UHF systems demands acquisition units
with higher requirements. The antennas, having a GIS-
dependent design, also contributes to step up the overall cost
of this type of system. Moreover, its complexity may soar due
to the number of antennas that are required to monitor a long
GIS.
While it is true that going up in frequency is desirable to
reduce the effect of noise and disturbances, lowering the
measuring frequency range may downplay the requirements of
a VHF/UHF system and increase its spatial sensitivity. Thus,
the aim of this paper is to present experimental results of an
alternative approach for measuring PD in the low frequency
range. In the following sections, it will be documented how
this approach uses HFCT sensors installed conveniently at the
GIS spacers to measure the induced currents on the GIS
compartments by a PD event. In addition, it will be
demonstrated by laboratory measurements that in such a low
frequency range the attenuation of the PD-induced currents is
lower which may be seized to enhance the spatial sensitivity.
Finally, the limitations and the effect of noise and disturbances
in this frequency range will be commented.
II. TEST OBJECT
All the laboratory measurements here reported were conducted
on the actual size, 380kV GIS of Figure 1, comprised of
spacers, T-joints, a bushing, a disconnector switch, a ground
switch and a circuit breaker.
The GIS end at the bottom of the Figure 1 was utilized to
place test cells to produce corona and surface discharges and
to connect a pulse calibrator. The arrangement of sensors
consisted of an HFCT at the GIS end labeled as “source
HFCT” and two HFCT installed at the spacers in position 1
and 2 (“HFCT 1” and “HFCT 2”). A Tektronix MSO5
oscilloscope recorded simultaneously the signals from every
sensor. Test voltages, SF6 pressure and amplifier
specifications for each test are summarized in Table 1. It is
important to mention that all the voltage signals reported in
the following sections correspond to the voltage at the output
of the amplifiers, not the voltage at the HFCT output.
Fig. 1. Test object and location of HFCT sensors.
Test cell
Source
HFCT
HFCT 1
HFCT 2
102
2nd International Conference on Electrical Materials and Power Equipment - Guangzhou - China
978-1-5386-8434-4/19/$31.00 ©2019 IEEE

TABLE I. Test Parameters.
Corona Surface
Source HFCT Sensor: 5 mV/mA, BW 3.92 kHz-1.11 GHz
Amp: 26dB, BW 100 kHz-1.3 GHz
HFCT 1 Sensor: 9.1 mV/mA, BW 62 kHz-136 MHz
Amps: 50.4dB, 30 kHz-1.23 GHz
HFCT 2 Sensor: 9.1mV/mA, BW 62 kHz-136 MHz
Amps: 44.4dB, 30 kHz-1.23 GHz
VAC 15 kVRMS 20 kVRMS
SF6 3 Bar 1.2 Bar
III. PD-INDUCED CURRENTS IN THE GIS COMPARTMENTS
The main concept that plays a role for the detection of PD
pulses in GIS is that upon a fast PD event, electromagnetic
waves are excited which travel guided by the transmission line
structure of the GIS. The way the propagation of the PD signal
occurs depends on the frequency range of the PD spectrum. At
sufficiently high frequencies, the transverse electric (TE) and
transverse magnetic (TM) are the predominant propagation
modes of PD electromagnetic waves and each of these modes
has a cut-off frequency below which it will not propagate
[3][4][5]. UHF antennas resonates at these frequencies picking
up the radio frequency energy of the PD pulse. At lower
frequencies, the propagation follows the transverse
electromagnetic (TEM) mode which suffers from less
attenuation than the other high frequency modes. This is the
phenomena seized in our approach with the particularity that
an HFCT is used to measure the induced PD currents in the
GIS compartments instead of UHF antennas to measure
radiated energy.
The measuring arrangement to do so consists of an HFCT
installed at one of the bolts of a spacer as depicted in Figure 2.
Note that at the spacer location, the PD current pulse flows
along the bolts before reaching the next compartment.
Insulating sleeves in the bolts make the current to flow first
through the sensor before returning to the compartment and
therefore the HFCT is enabled to measure the PD signal
flowing in the compartments.
Fig. 2. Installation of HFCT in the spacer bolts.
The GIS used in this work has 16 bolts connecting two
adjacent compartments, therefore a part of the PD current
should flow along each of these bolts. Likewise, other
questions arise from this measuring approach such as: is the
current evenly distributed among all the bolts?, how do the
noise and disturbances affect the sensitivity?, is the spatial
sensitivity better than that of the UHF systems?
In the following subsection a set of experiments were
conducted to answer these questions.
A. Current Distribution and Attenuation
To determine the current distribution and attenuation a
calibrator signal was injected at the GIS end and the signals
from the source HFCT and HFCTs at location 1 were
recorded.
Three configurations were used. Measurements in
configuration 1 consisted of having only one sensor installed
at the spacer while the remaining 15 bolts were unchanged. In
configuration 2, four sensors were installed, and the remaining
12 bolts were unchanged. In configuration 3, only one sensor
was installed but the remaining 15 bolts were insulated so the
current only flowed along the bolt having the sensor installed.
Fig. 3. Results from configuration 1.
Results from configuration 1 in Figure 3 indicated that the
peak amplitude of the HFCT 1 signal was 5.43% that of the
source HFCT. This ratio is quite close to the 6.25% that is
expected if the current is split equally into the 16 bolts, the
difference possibly coming as a result of the transfer
impedance of the HFCT added to the path. Moreover, this
results already suggests that the current flows evenly
distributed along the compartment. In order to further prove
this claim, measurements in configuration 2 were carried out
and its results displayed in Figure 4.
Fig. 4. Results from configuration 2.
The amplitude of the four sensors was nearly equal to that of
the sensor in configuration 1, yielding a ratio of 5.51%
confirming that the current along each bolt can be considered
the same.
103

Configuration 3 came as an attempt to increase the sensitivity
of the sensor by forcing all of the current through the sensor.
However, as shown in Figure 5, there was a mismatch of the
amplitude of the injected pulse and that of the HFCT 1. The
shape of the HFCT 1 pulse also showed a big undershoot,
which led to the conclusion that in this configuration the
transmission line structure of the GIS is broken and the effect
of reflections of the pulse is significant as to lead to major
errors in the quantification of the signal amplitude. In
consequence, configuration 1 was preferred for the
experiments with PD test cells.
Fig. 5. Results from configuration 3.
IV. Measurements with Test Cells
Experiments with the test cells had the purpose of verifying
that the signals from the HFCT at location 1 and 2 correspond
to actual PD signals and checking the attenuation of the
signals with distance.
The first step in this verification procedure was to collect the
PRPD patterns (Figure 6) produced by the test cells (measured
with the HFCT at the source) that will be used as the reference
PD signals.
Fig. 6. PRPD patterns of the two PD sources measured by the source HFCT.
Because the source HFCT was used as the trigger of the
oscilloscope, then the phase of the PRPD patterns obtained
from HFCT 1 and 2 necessarily was the same as that of
patterns in Figure 6. The amplitude and pulse shape, however,
needed to be screened in order to verify that the recorded
signals corresponded to the actual PD pulses that triggered the
acquisition.
Fig. 7. Smallest PD signals recorded by the source HFCT.
By using the software PDflex [6] the signals from all the
sensors were contrasted resulting in that the test-cell PD pulses
with the highest amplitude were recorded properly by the
HFCT 1 and 2. With decreased amplitude disturbances and
noise were easier to be coupled to the sensors. For instance,
consider signals in Figure 7 corresponding to one of the
smallest signals of the PRDP patterns in Figure 6. As shown
in Figure 8 and 9 (signals corresponding to the signals in
Figure 7), the SNR decreased and signals from HFCT 2 are
notably affected by reflections produced as the PD pulse
travels along the GIS components.
Fig. 8. Smallest corona signals recorded by HFCT 1 and 2.
Fig. 9. Smallest surface signals recorded by HFCT 1 and 2.
Nevertheless, these results also prove that the sensitivity of the
HFCT at the spacers may be enough to pick up PD signals
produced at the test cell 16 m away. A contribution from the
authors in [7] reported that an UHF antenna installed next to
HFCT 1 picked up also a true PD signal but didn’t do so when
located next to HFCT 2.
In a real implementation, the trigger source certainly would
have to be one HFCT installed at a given spacer in which case
a low SNR, disturbances and noise may imply false
acquisitions, i.e. recording of signals not corresponding to PD
pulses. It is a matter of fact that this is one of the limitations of
the HFCT-based PD detection reported in this work, although
it does not necessarily mean that acquisition and clustering
104
techniques cannot be applied as a possible mitigation of this
limitation. This is tested in the next section.
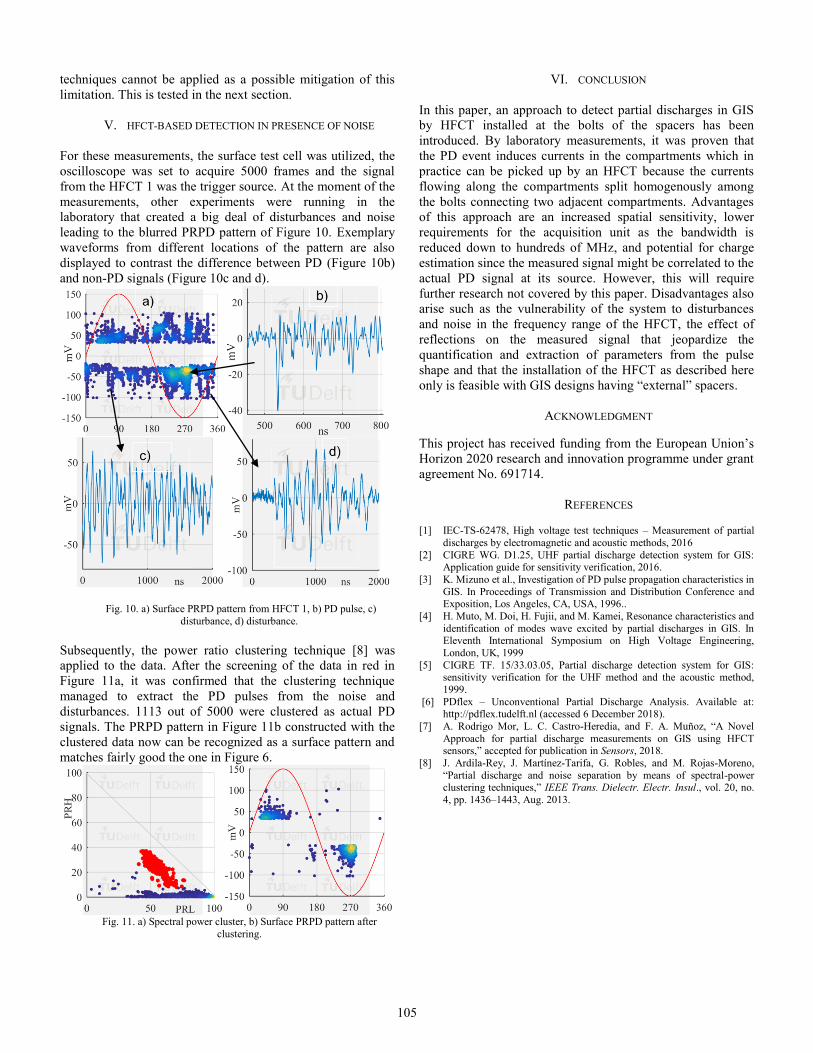
V. HFCT-BASED DETECTION IN PRESENCE OF NOISE
For these measurements, the surface test cell was utilized, the
oscilloscope was set to acquire 5000 frames and the signal
from the HFCT 1 was the trigger source. At the moment of the
measurements, other experiments were running in the
laboratory that created a big deal of disturbances and noise
leading to the blurred PRPD pattern of Figure 10. Exemplary
waveforms from different locations of the pattern are also
displayed to contrast the difference between PD (Figure 10b)
and non-PD signals (Figure 10c and d).
Fig. 10. a) Surface PRPD pattern from HFCT 1, b) PD pulse, c)
disturbance, d) disturbance.
Subsequently, the power ratio clustering technique [8] was
applied to the data. After the screening of the data in red in
Figure 11a, it was confirmed that the clustering technique
managed to extract the PD pulses from the noise and
disturbances. 1113 out of 5000 were clustered as actual PD
signals. The PRPD pattern in Figure 11b constructed with the
clustered data now can be recognized as a surface pattern and
matches fairly good the one in Figure 6.
Fig. 11. a) Spectral power cluster, b) Surface PRPD pattern after
clustering.
VI. CONCLUSION
In this paper, an approach to detect partial discharges in GIS
by HFCT installed at the bolts of the spacers has been
introduced. By laboratory measurements, it was proven that
the PD event induces currents in the compartments which in
practice can be picked up by an HFCT because the currents
flowing along the compartments split homogenously among
the bolts connecting two adjacent compartments. Advantages
of this approach are an increased spatial sensitivity, lower
requirements for the acquisition unit as the bandwidth is
reduced down to hundreds of MHz, and potential for charge
estimation since the measured signal might be correlated to the
actual PD signal at its source. However, this will require
further research not covered by this paper. Disadvantages also
arise such as the vulnerability of the system to disturbances
and noise in the frequency range of the HFCT, the effect of
reflections on the measured signal that jeopardize the
quantification and extraction of parameters from the pulse
shape and that the installation of the HFCT as described here
only is feasible with GIS designs having “external” spacers.
ACKNOWLEDGMENT
This project has received funding from the European Union’s
Horizon 2020 research and innovation programme under grant
agreement No. 691714.
REFERENCES
[1] IEC-TS-62478, High voltage test techniques – Measurement of partial
discharges by electromagnetic and acoustic methods, 2016
[2] CIGRE WG. D1.25, UHF partial discharge detection system for GIS: Application guide for sensitivity verification, 2016.
[3] K. Mizuno et al., Investigation of PD pulse propagation characteristics in
GIS. In Proceedings of Transmission and Distribution Conference and Exposition, Los Angeles, CA, USA, 1996..
[4] H. Muto, M. Doi, H. Fujii, and M. Kamei, Resonance characteristics and
identification of modes wave excited by partial discharges in GIS. In Eleventh International Symposium on High Voltage Engineering,
London, UK, 1999
[5] CIGRE TF. 15/33.03.05, Partial discharge detection system for GIS: sensitivity verification for the UHF method and the acoustic method,
1999.
[6] PDflex – Unconventional Partial Discharge Analysis. Available at: http://pdflex.tudelft.nl (accessed 6 December 2018).
[7] A. Rodrigo Mor, L. C. Castro-Heredia, and F. A. Muñoz, “A Novel
Approach for partial discharge measurements on GIS using HFCT sensors,” accepted for publication in Sensors, 2018.
[8] J. Ardila-Rey, J. Martínez-Tarifa, G. Robles, and M. Rojas-Moreno,
“Partial discharge and noise separation by means of spectral-power clustering techniques,” IEEE Trans. Dielectr. Electr. Insul., vol. 20, no.
4, pp. 1436–1443, Aug. 2013.
105