Embed Size (px)
Citation preview
Koos Fockens, PA0KDF VERON EMC Committee Date 10/04/2003
HF radio reception compatibility test of an in-house PLC system using two brands of
modems. Executive summary. Tests have been performed on the EMC of two types of in-house PLC modems, developed according the HomePlug® standard, that recently appeared on the European market. Some measurements were done in a laboratory set-up (mains disturbance voltage, field strength, background noise), other were performed in the house of the author (interference on amateur radio receiving antenna, background signals and noise on mains). One type PLC modem seems just to meet the mains disturbance limit in EN55022 for residential environment, the second type showed a level which was approximately 20 dB higher. Under the condition that the in-house PLC modem complies with the current EN55022 B standard, and that the modem additionally uses notches for the bands of the amateur services according to the Homeplug® standard, the general conclusions drawn were:
• Only when when a reasonable well constructed outdoor antenna is used the interference from the modems is probably not a threat to the radio amateur service ,
• outside the notches harmful interference may be caused to the broadcasting services. • In the laboratory environment with many PCs running, as well as in the author's home environment, the
background mains disturbance level was 30 or more dB's below the EN55022 B limit.
Rietmolen, April 2003, Koos Fockens, PA0KDF. Correspondence: VERON EMC Committee, P.O. Box 1166, NL6801BD Arnhem, The Netherlands. Email: [email protected] Copyright © 2003. Vereniging voor Experimenteel Radio Onderzoek Nederland (VERON) in the Netherlands. This report is published by VERON EMC Committee. All rights reserved. No part of this work may be reproduced in any form except by written permission by the publisher.
-1-
Koos Fockens, PA0KDF VERON EMC Committee Date 10/04/2003
HF radio reception compatibility test of an in-house PLC system using two brands of modems.
1. Object. Measuring the influence of the radiation of an indoor PLC or PLT system on HF radio reception inside and outside amateur radio frequency bands. 1.2. PLT adapters used. There are two brands of PLT adapters used, from hereon called as Modem type 1 and Modem type 2. Both PLT adapters use the same PLT chipset, and operate in accordance with the Homeplug® standard. The specified RF bandwidth is 4.3 to 20.9 MHz. The manufactures of both models claim conformity with CE directive 89/336/EWG, standard EN 55022 and compliance with Part 15 of the FCC Rules.
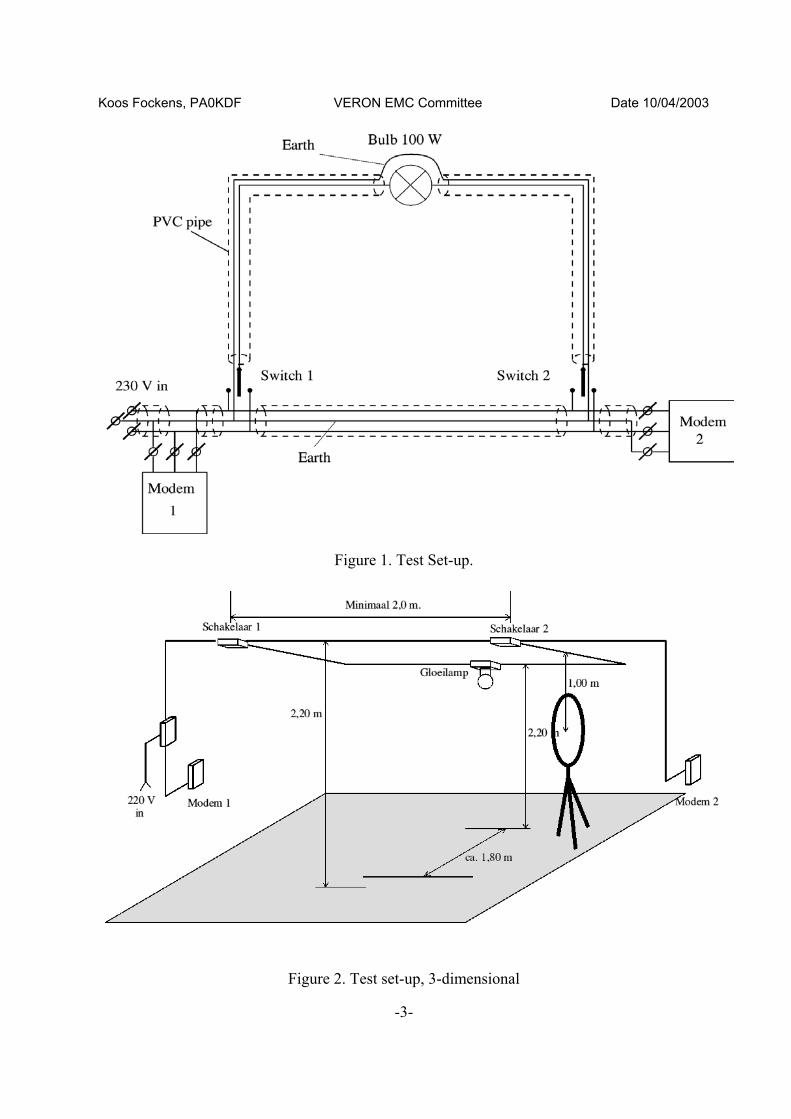
2. Description of the test configurations. 2.1. Lab test configuration. For this purpose two sets of modems were sequentially connected to a mains network test set-up according figure 1 in laboratory situation. (Note: the shown connections between earth and the modems are not used, because these modems do not have an earth connection.) A laboratory test set up was built simulating a configuration which exists manifold in domestic buildings, see figure 1. Here a configuration has been constructed, where at a height for a lowered ceiling, being 2.20 m, a 230 V cable is placed (standard 230 V wire in PVC pipe) according to figure 1.
-2-
Koos Fockens, PA0KDF VERON EMC Committee Date 10/04/2003
Figure 1. Test Set-up.
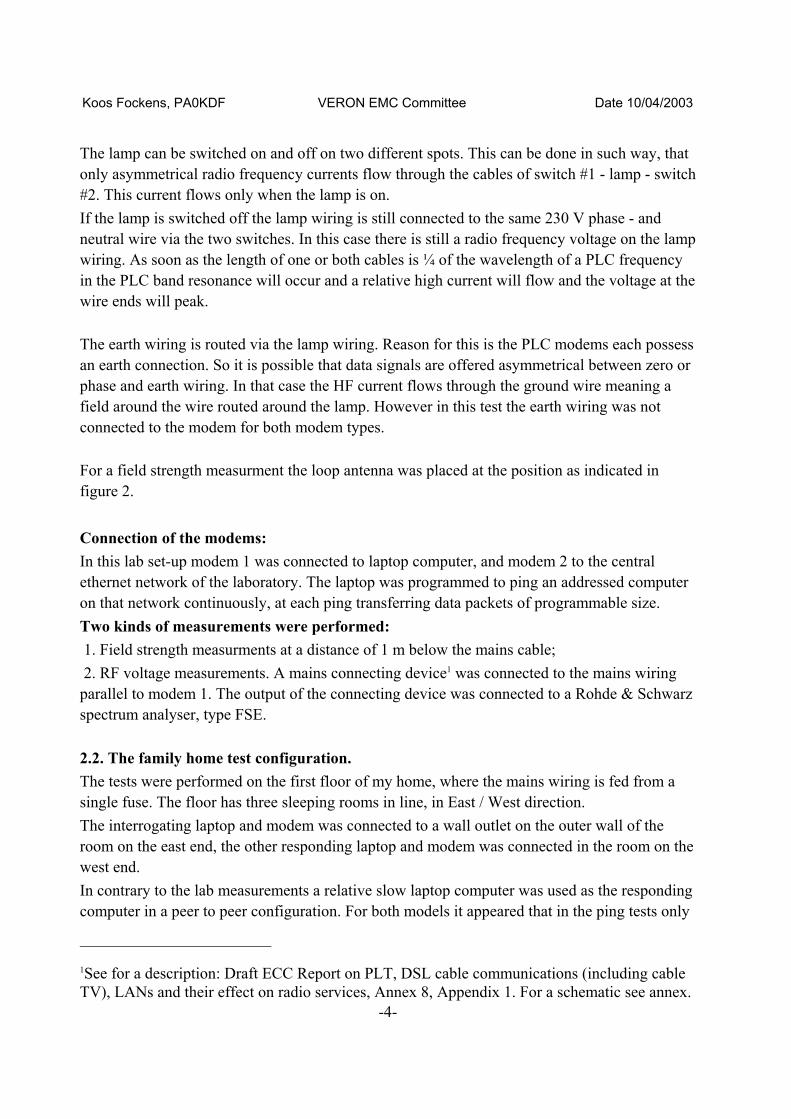
Figure 2. Test set-up, 3-dimensional
-3-
Koos Fockens, PA0KDF VERON EMC Committee Date 10/04/2003
The lamp can be switched on and off on two different spots. This can be done in such way, that only asymmetrical radio frequency currents flow through the cables of switch #1 - lamp - switch #2. This current flows only when the lamp is on. If the lamp is switched off the lamp wiring is still connected to the same 230 V phase - and neutral wire via the two switches. In this case there is still a radio frequency voltage on the lamp wiring. As soon as the length of one or both cables is ¼ of the wavelength of a PLC frequency in the PLC band resonance will occur and a relative high current will flow and the voltage at the wire ends will peak. The earth wiring is routed via the lamp wiring. Reason for this is the PLC modems each possess an earth connection. So it is possible that data signals are offered asymmetrical between zero or phase and earth wiring. In that case the HF current flows through the ground wire meaning a field around the wire routed around the lamp. However in this test the earth wiring was not connected to the modem for both modem types. For a field strength measurment the loop antenna was placed at the position as indicated in figure 2. Connection of the modems: In this lab set-up modem 1 was connected to laptop computer, and modem 2 to the central ethernet network of the laboratory. The laptop was programmed to ping an addressed computer on that network continuously, at each ping transferring data packets of programmable size. Two kinds of measurements were performed: 1. Field strength measurments at a distance of 1 m below the mains cable; 2. RF voltage measurements. A mains connecting device1 was connected to the mains wiring parallel to modem 1. The output of the connecting device was connected to a Rohde & Schwarz spectrum analyser, type FSE. 2.2. The family home test configuration. The tests were performed on the first floor of my home, where the mains wiring is fed from a single fuse. The floor has three sleeping rooms in line, in East / West direction. The interrogating laptop and modem was connected to a wall outlet on the outer wall of the room on the east end, the other responding laptop and modem was connected in the room on the west end. In contrary to the lab measurements a relative slow laptop computer was used as the responding computer in a peer to peer configuration. For both models it appeared that in the ping tests only
-4-
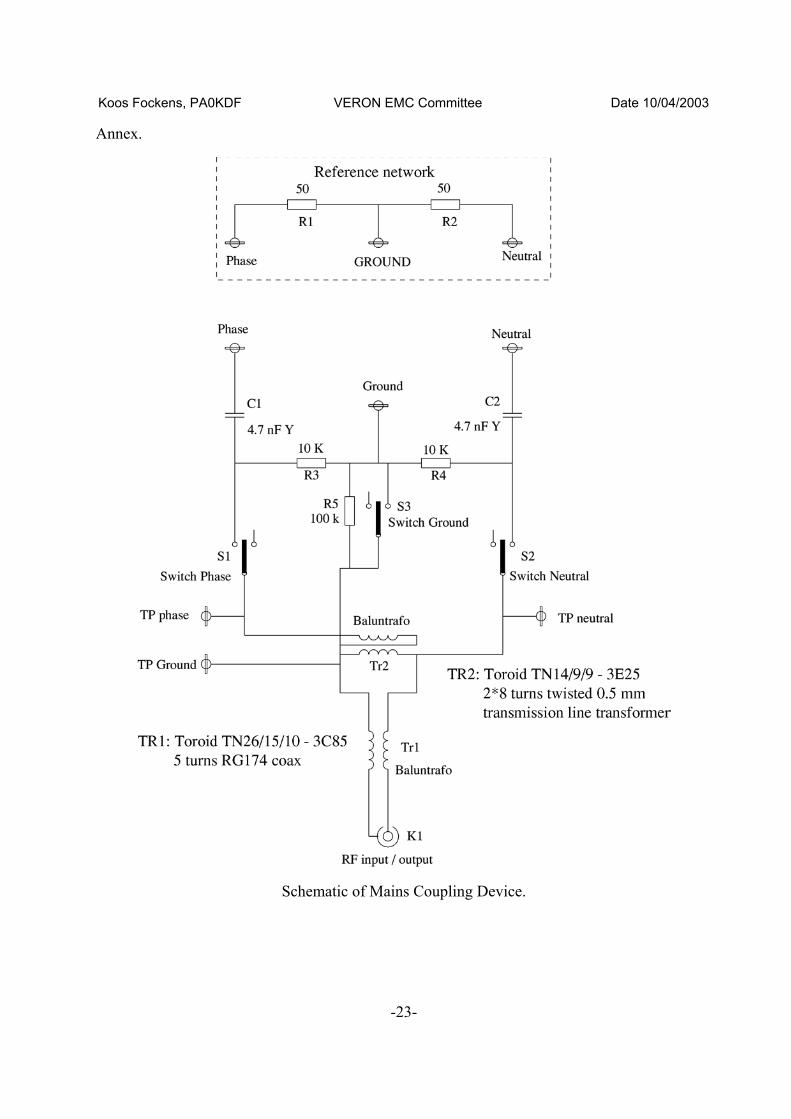
1See for a description: Draft ECC Report on PLT, DSL cable communications (including cable TV), LANs and their effect on radio services, Annex 8, Appendix 1. For a schematic see annex.
Koos Fockens, PA0KDF VERON EMC Committee Date 10/04/2003
small data packets of maximal 500 bytes could be transmitted at a repetition rate of approximately 2 Hz. This results in small bursts of interference with a burst length of approximately 2 ms. 2.2.1. The antenna. East of the house the German Quad antenna is situated. This antenna consists of a horizontal square loop with sides of 20 m, at the moment of the measurements hanging at a height of 5.5 m above ground. The closest leg of the loop is at 12 m from the room with the interrogating laptop. The far end of the loop is at 32 m. For the amateur service this is a relative wide spaced configuration. In most cases the distance from the antenna to the house is far less. Also RF voltage measurements were performed here.
-5-
Koos Fockens, PA0KDF VERON EMC Committee Date 10/04/2003
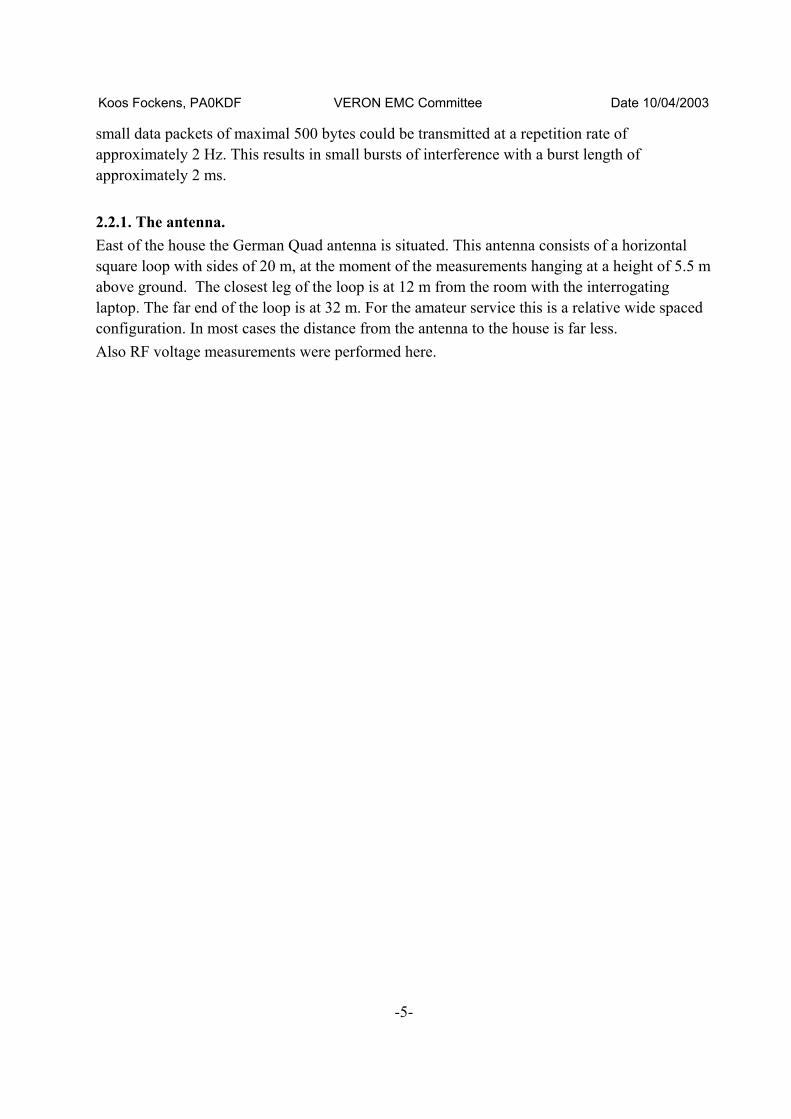
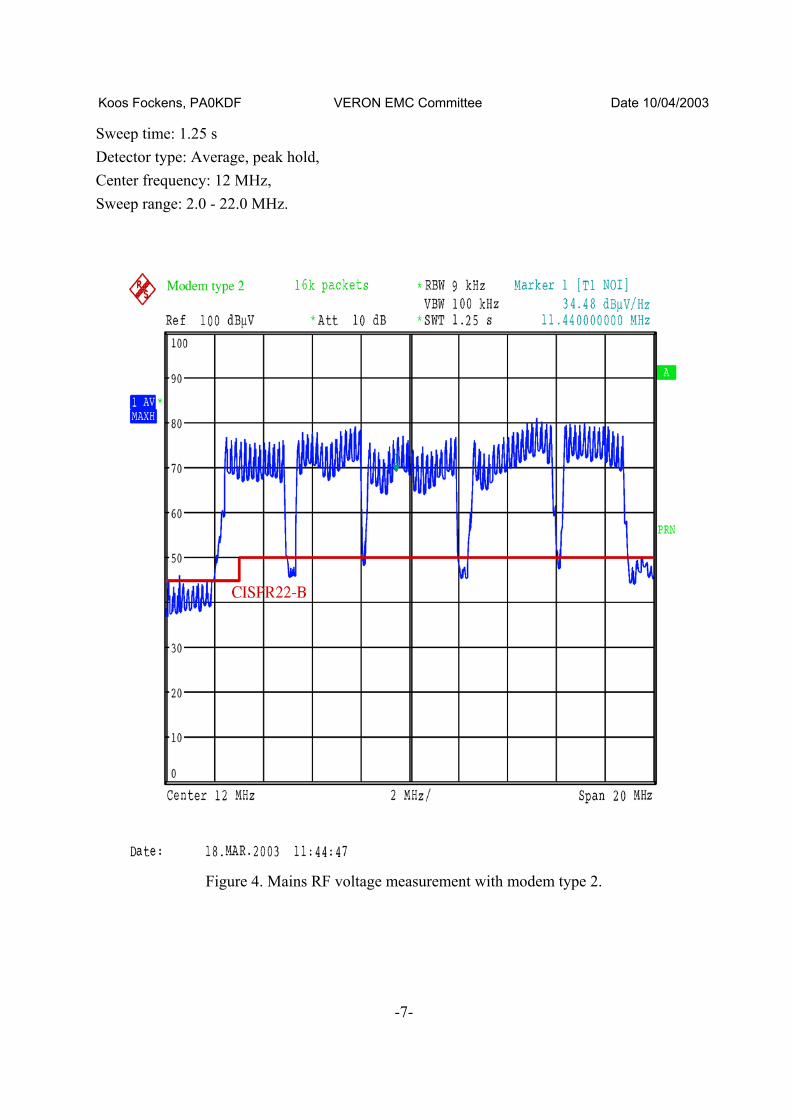
3. Measurements and results. 3.1. Laboratory. 3.1.1. Mains RF voltage measurements. Figures 3 and 4 show the results of the RF voltage measurements for respectively the modem type 1 and the modem type 2. The modem type 1 seems to comply with EN55022-B (CISPR 22B), while the modem type 2 seems to exceed this limit by 20 dB. This limit has been added in figure 4.
Ref 100 dBµV
*
A
RBW 9 kHzVBW 100 kHzSWT 1.25 s
Center 12 MHz Span 20 MHz2 MHz/
Att 10 dB* *
*1 AVVIEW
PRN
0
10
20
30
40
50
60
70
80
90
100
1
Marker 1 [T1 ]50.96 dBµV
12.500000000 MHz
Date: 18.MAR.2003 09:50:36 Figure 3. Mains RF voltage measurement with modem type 1.
The settings of the spectrum analyser can be read in the figures: Resolution bandwidth: 9 kHz, Video bandwidth: 100 kHz,
-6-
Koos Fockens, PA0KDF VERON EMC Committee Date 10/04/2003
Sweep time: 1.25 s Detector type: Average, peak hold, Center frequency: 12 MHz, Sweep range: 2.0 - 22.0 MHz.
Figure 4. Mains RF voltage measurement with modem type 2.
-7-
Koos Fockens, PA0KDF VERON EMC Committee Date 10/04/2003
Ref 100 dBµV
*
A
RBW 9 kHzVBW 100 kHzSWT 1.25 s
Center 12 MHz Span 20 MHz2 MHz/
Att 10 dB* *
*1 AVVIEW
Background Lab symm
PRN
0
10
20
30
40
50
60
70
80
90
100
1
Marker 1 [T1 ] 18.35 dBµV 12.500000000 MHz
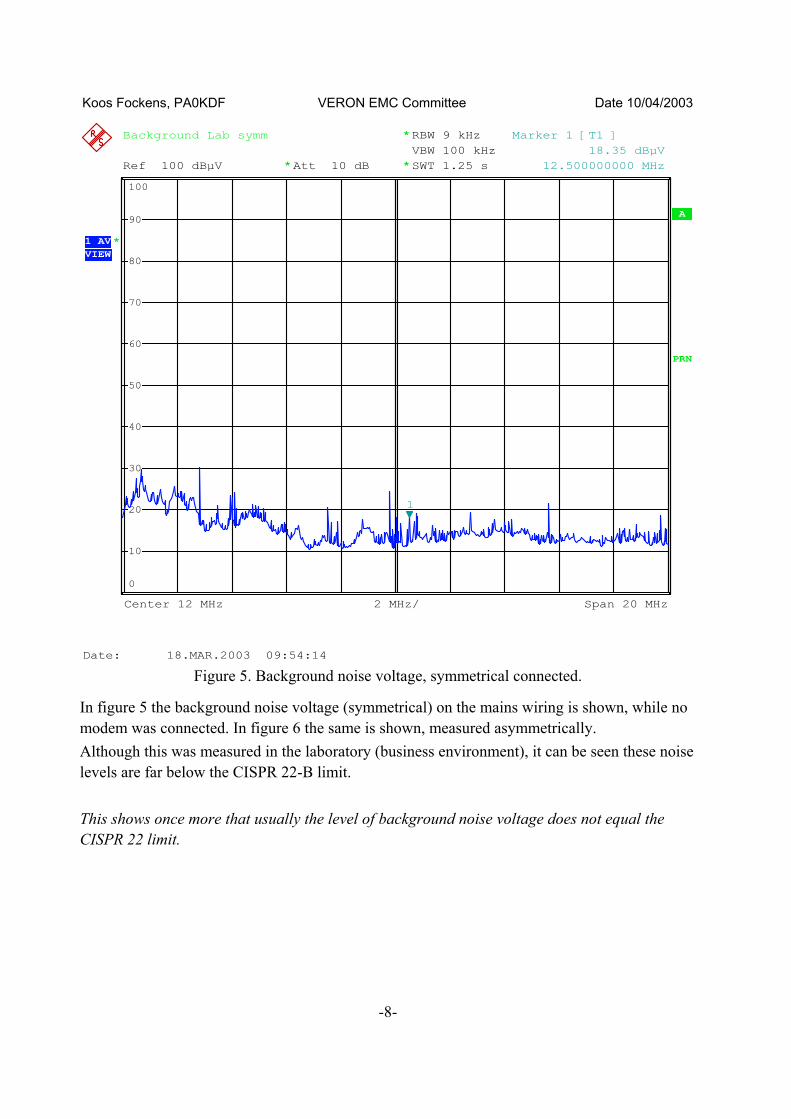
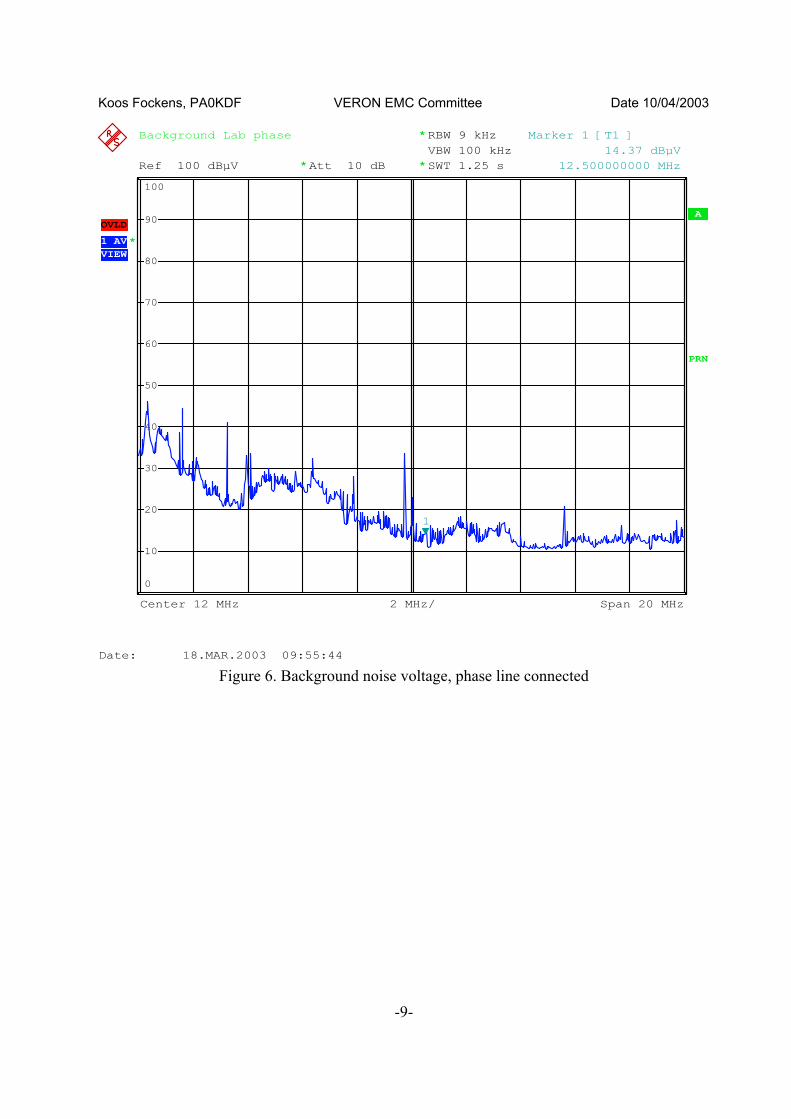
Date: 18.MAR.2003 09:54:14 Figure 5. Background noise voltage, symmetrical connected.
In figure 5 the background noise voltage (symmetrical) on the mains wiring is shown, while no modem was connected. In figure 6 the same is shown, measured asymmetrically. Although this was measured in the laboratory (business environment), it can be seen these noise levels are far below the CISPR 22-B limit. This shows once more that usually the level of background noise voltage does not equal the CISPR 22 limit.
-8-
Koos Fockens, PA0KDF VERON EMC Committee Date 10/04/2003
Ref 100 dBµV
*
A
RBW 9 kHzVBW 100 kHzSWT 1.25 s
Center 12 MHz Span 20 MHz2 MHz/
Att 10 dB* *
*1 AVVIEW
Background Lab phase
PRN
OVLD
0
10
20
30
40
50
60
70
80
90
100
1
Marker 1 [T1 ] 14.37 dBµV 12.500000000 MHz
Date: 18.MAR.2003 09:55:44 Figure 6. Background noise voltage, phase line connected
-9-
Koos Fockens, PA0KDF VERON EMC Committee Date 10/04/2003
A
*RBW 9 kHz
SWT 65 msAtt 20 dB*Ref 100 dBµV
Center 14.2 MHz Span 1 MHz100 kHz/
VBW 100 kHz
*2 AVVIEW
*1 AVVIEW
Modem type 1 16k
PRN
0
10
20
30
40
50
60
70
80
90
100
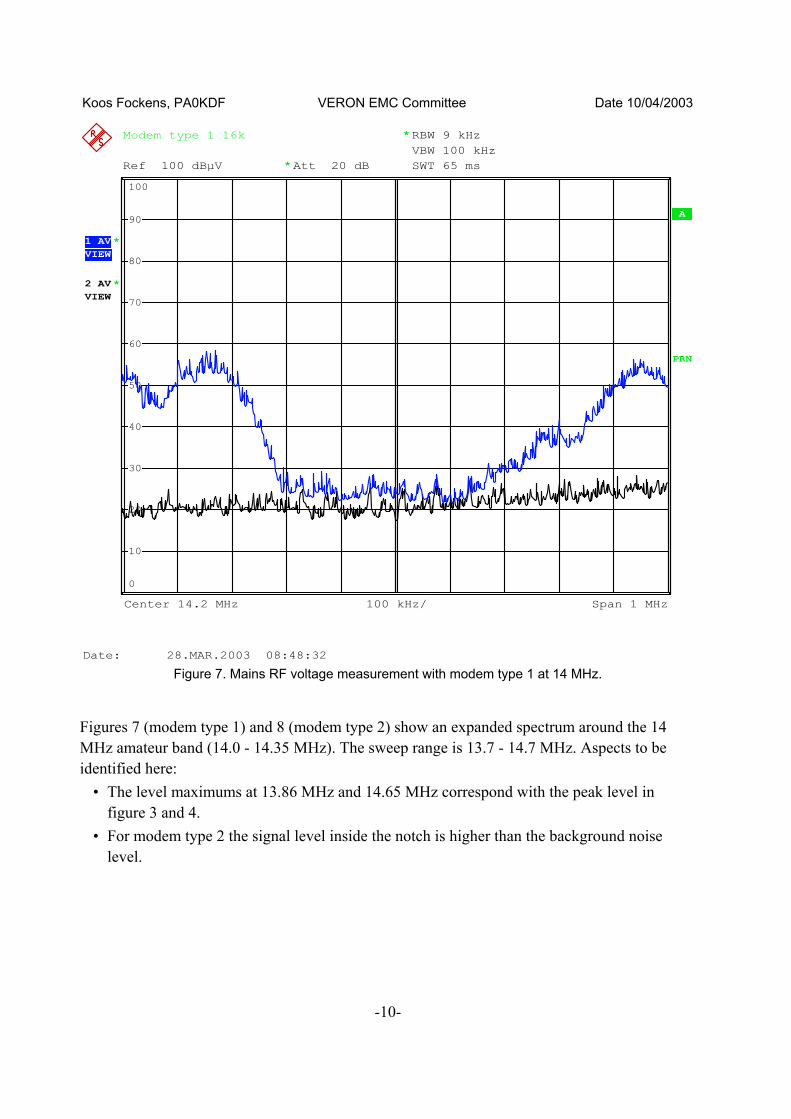
Date: 28.MAR.2003 08:48:32 Figure 7. Mains RF voltage measurement with modem type 1 at 14 MHz.
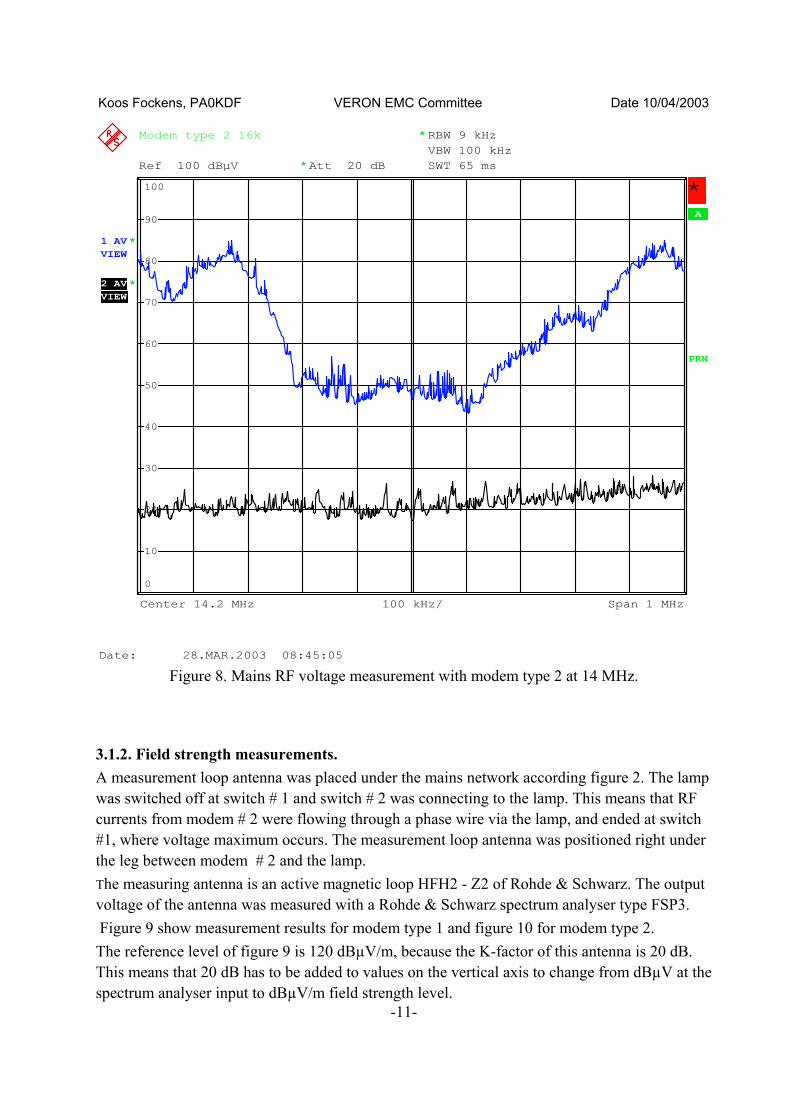
Figures 7 (modem type 1) and 8 (modem type 2) show an expanded spectrum around the 14 MHz amateur band (14.0 - 14.35 MHz). The sweep range is 13.7 - 14.7 MHz. Aspects to be identified here:
• The level maximums at 13.86 MHz and 14.65 MHz correspond with the peak level in figure 3 and 4.
• For modem type 2 the signal level inside the notch is higher than the background noise level.
-10-
Koos Fockens, PA0KDF VERON EMC Committee Date 10/04/2003
A
*RBW 9 kHz
SWT 65 msAtt 20 dB*Ref 100 dBµV
Center 14.2 MHz Span 1 MHz100 kHz/
*1 AVVIEW
VBW 100 kHz
*
*2 AVVIEW
Modem type 2 16k
PRN
0
10
20
30
40
50
60
70
80
90
100
Date: 28.MAR.2003 08:45:05 Figure 8. Mains RF voltage measurement with modem type 2 at 14 MHz.
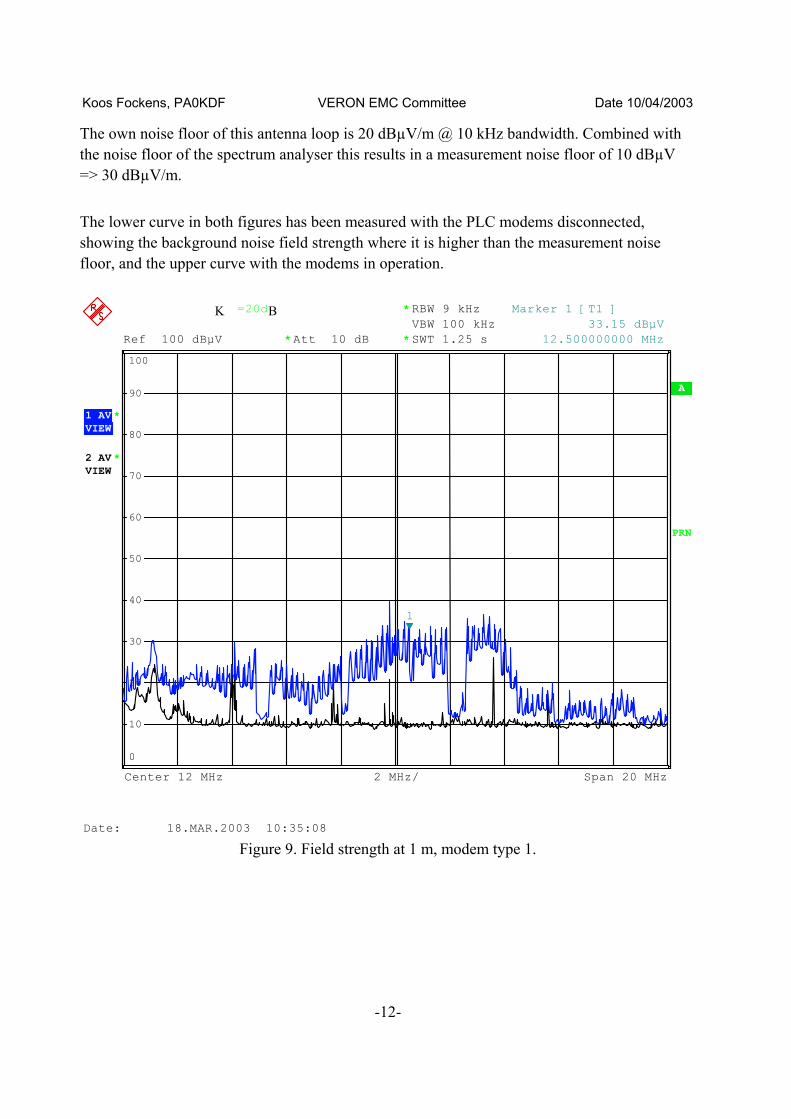
3.1.2. Field strength measurements. A measurement loop antenna was placed under the mains network according figure 2. The lamp was switched off at switch # 1 and switch # 2 was connecting to the lamp. This means that RF currents from modem # 2 were flowing through a phase wire via the lamp, and ended at switch #1, where voltage maximum occurs. The measurement loop antenna was positioned right under the leg between modem # 2 and the lamp. The measuring antenna is an active magnetic loop HFH2 - Z2 of Rohde & Schwarz. The output voltage of the antenna was measured with a Rohde & Schwarz spectrum analyser type FSP3. Figure 9 show measurement results for modem type 1 and figure 10 for modem type 2.
-11-
The reference level of figure 9 is 120 dBµV/m, because the K-factor of this antenna is 20 dB. This means that 20 dB has to be added to values on the vertical axis to change from dBµV at the spectrum analyser input to dBµV/m field strength level.
Koos Fockens, PA0KDF VERON EMC Committee Date 10/04/2003
The own noise floor of this antenna loop is 20 dBµV/m @ 10 kHz bandwidth. Combined with the noise floor of the spectrum analyser this results in a measurement noise floor of 10 dBµV => 30 dBµV/m. The lower curve in both figures has been measured with the PLC modems disconnected, showing the background noise field strength where it is higher than the measurement noise floor, and the upper curve with the modems in operation.
Ref 100 dBµV
*
A
RBW 9 kHzVBW 100 kHzSWT 1.25 s
Center 12 MHz Span 20 MHz2 MHz/
Att 10 dB*
*2 AVVIEW
*
*1 AVVIEW
K =20dB
PRN
0
10
20
30
40
50
60
70
80
90
100
1
Marker 1 [T1 ]33.15 dBµV
12.500000000 MHz
Date: 18.MAR.2003 10:35:08 Figure 9. Field strength at 1 m, modem type 1.
-12-
Koos Fockens, PA0KDF VERON EMC Committee Date 10/04/2003
Ref 100 dBµV
*
A
RBW 9 kHzVBW 100 kHzSWT 1.25 s
Center 12 MHz Span 20 MHz2 MHz/
Att 10 dB*
*1 AVVIEW
*
*2 AVVIEW
K 20dB
PRN
0
10
20
30
40
50
60
70
80
90
100
1
Marker 1 [T1 ]58.50 dBµV
12.500000000 MHz
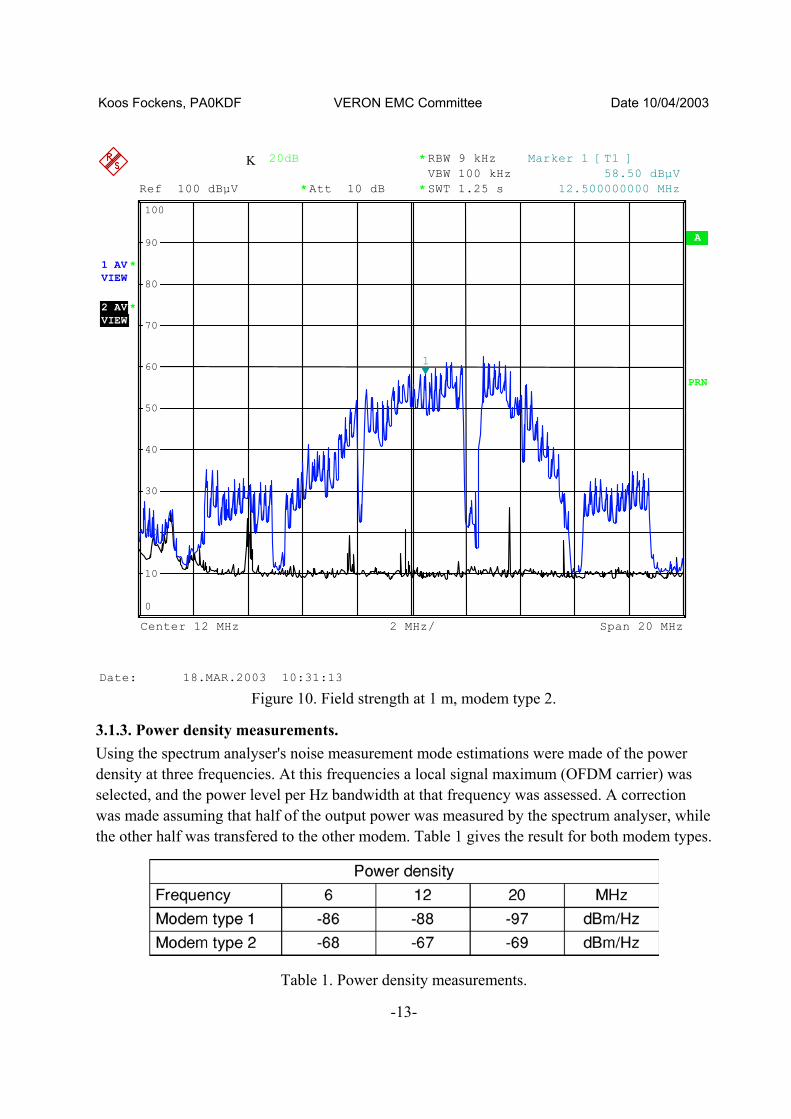
Date: 18.MAR.2003 10:31:13 Figure 10. Field strength at 1 m, modem type 2.
3.1.3. Power density measurements. Using the spectrum analyser's noise measurement mode estimations were made of the power density at three frequencies. At this frequencies a local signal maximum (OFDM carrier) was selected, and the power level per Hz bandwidth at that frequency was assessed. A correction was made assuming that half of the output power was measured by the spectrum analyser, while the other half was transfered to the other modem. Table 1 gives the result for both modem types.
Table 1. Power density measurements.
-13-
Koos Fockens, PA0KDF VERON EMC Committee Date 10/04/2003
3.2. Family home measurements.
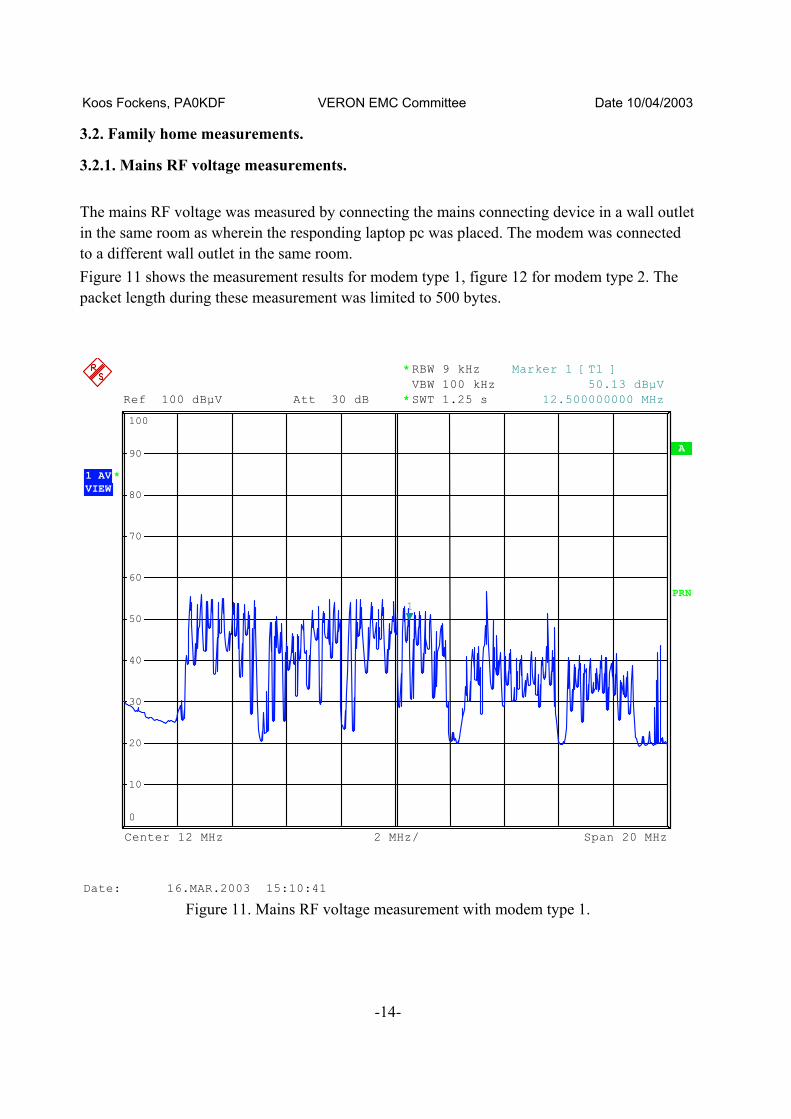
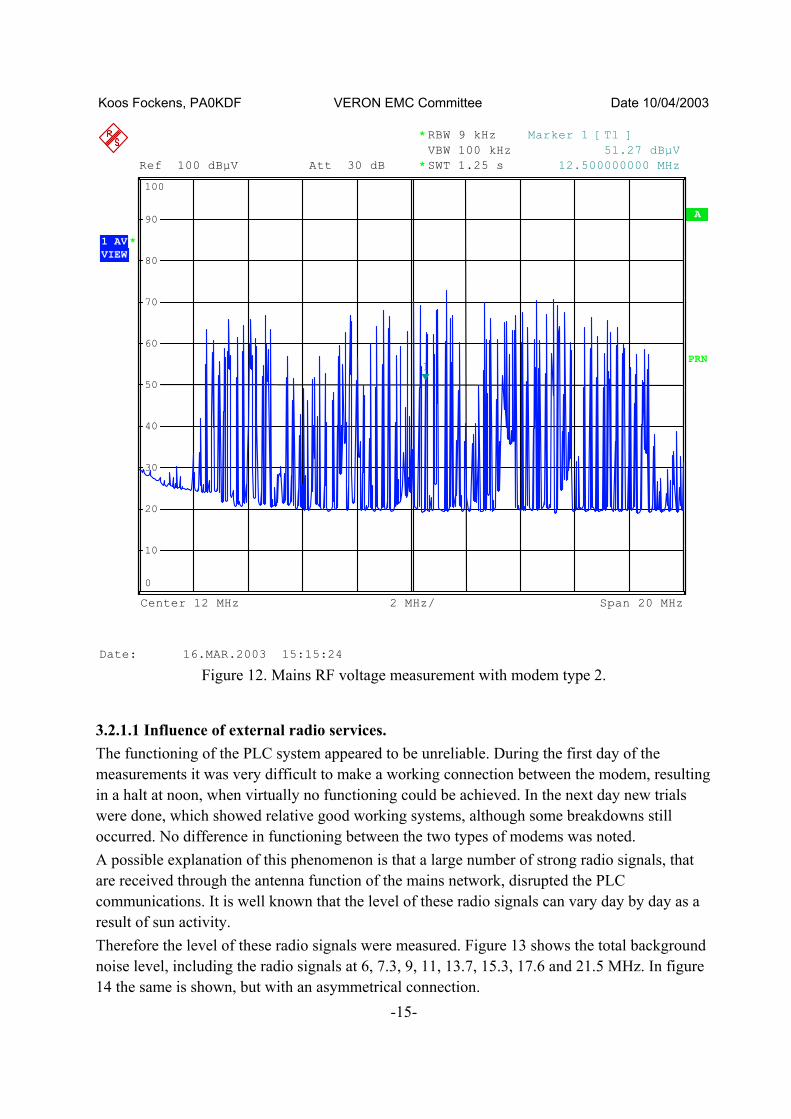
3.2.1. Mains RF voltage measurements. The mains RF voltage was measured by connecting the mains connecting device in a wall outlet in the same room as wherein the responding laptop pc was placed. The modem was connected to a different wall outlet in the same room. Figure 11 shows the measurement results for modem type 1, figure 12 for modem type 2. The packet length during these measurement was limited to 500 bytes.
Ref 100 dBµV Att 30 dB
*
A
RBW 9 kHzVBW 100 kHzSWT 1.25 s
Center 12 MHz Span 20 MHz2 MHz/
*
*1 AVVIEW
PRN
0
10
20
30
40
50
60
70
80
90
100
1
Marker 1 [T1 ]50.13 dBµV
12.500000000 MHz
Date: 16.MAR.2003 15:10:41 Figure 11. Mains RF voltage measurement with modem type 1.
-14-
Koos Fockens, PA0KDF VERON EMC Committee Date 10/04/2003
Ref 100 dBµV Att 30 dB
*
A
RBW 9 kHzVBW 100 kHzSWT 1.25 s
Center 12 MHz Span 20 MHz2 MHz/
*
*1 AVVIEW
PRN
0
10
20
30
40
50
60
70
80
90
100
1
Marker 1 [T1 ]51.27 dBµV
12.500000000 MHz
Date: 16.MAR.2003 15:15:24 Figure 12. Mains RF voltage measurement with modem type 2.
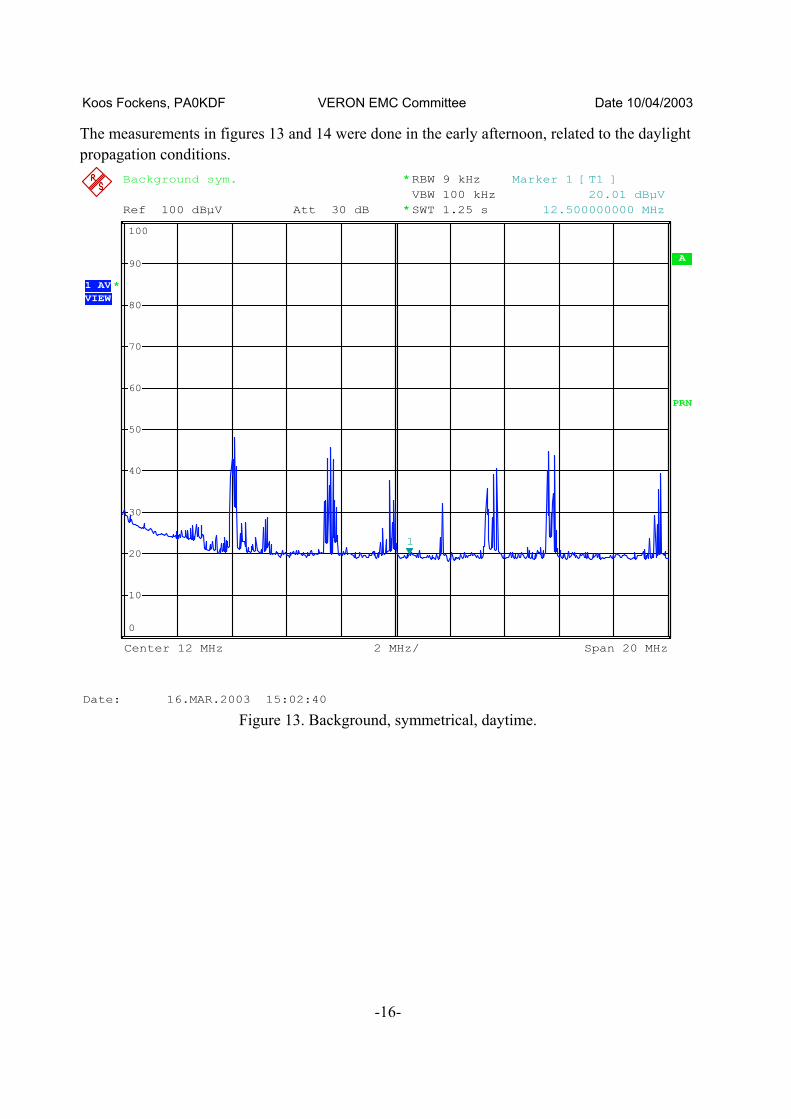
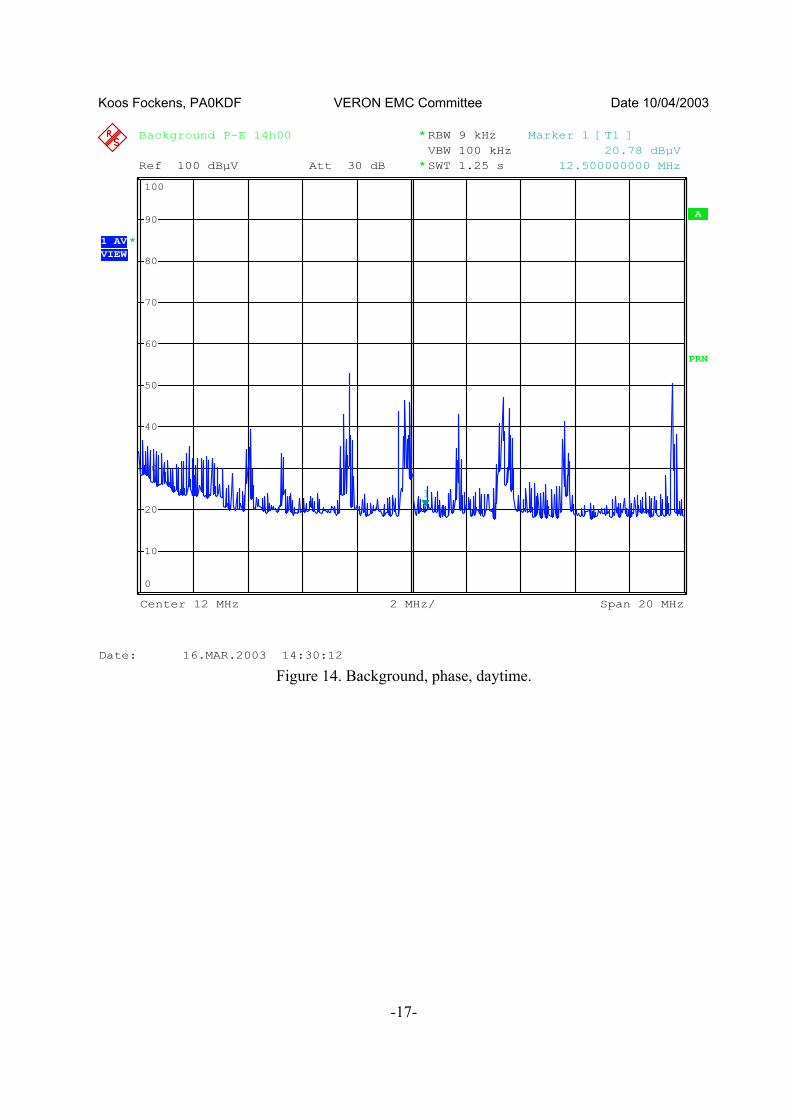
3.2.1.1 Influence of external radio services. The functioning of the PLC system appeared to be unreliable. During the first day of the measurements it was very difficult to make a working connection between the modem, resulting in a halt at noon, when virtually no functioning could be achieved. In the next day new trials were done, which showed relative good working systems, although some breakdowns still occurred. No difference in functioning between the two types of modems was noted. A possible explanation of this phenomenon is that a large number of strong radio signals, that are received through the antenna function of the mains network, disrupted the PLC communications. It is well known that the level of these radio signals can vary day by day as a result of sun activity. Therefore the level of these radio signals were measured. Figure 13 shows the total background noise level, including the radio signals at 6, 7.3, 9, 11, 13.7, 15.3, 17.6 and 21.5 MHz. In figure 14 the same is shown, but with an asymmetrical connection.
-15-
Koos Fockens, PA0KDF VERON EMC Committee Date 10/04/2003
The measurements in figures 13 and 14 were done in the early afternoon, related to the daylight propagation conditions.
Ref 100 dBµV Att 30 dB
*
A
RBW 9 kHzVBW 100 kHzSWT 1.25 s
Center 12 MHz Span 20 MHz2 MHz/
*
*1 AVVIEW
Background sym.
PRN
0
10
20
30
40
50
60
70
80
90
100
1
Marker 1 [T1 ] 20.01 dBµV 12.500000000 MHz
Date: 16.MAR.2003 15:02:40 Figure 13. Background, symmetrical, daytime.
-16-
Koos Fockens, PA0KDF VERON EMC Committee Date 10/04/2003
A
*RBW 9 kHz
Att 30 dBRef 100 dBµV
Center 12 MHz Span 20 MHz2 MHz/
SWT 1.25 sVBW 100 kHz
*
*1 AVVIEW
Background P-E 14h00
PRN
0
10
20
30
40
50
60
70
80
90
100
1
Marker 1 [T1 ] 20.78 dBµV 12.500000000 MHz
Date: 16.MAR.2003 14:30:12 Figure 14. Background, phase, daytime.
-17-
Koos Fockens, PA0KDF VERON EMC Committee Date 10/04/2003
Ref 100 dBµV
A
Center 12 MHz Span 20 MHz2 MHz/
*RBW 9 kHzVBW 100 kHzSWT 1.25 sAtt 10 dB* *
*1 AVVIEW
Background night symm
PRN
0
10
20
30
40
50
60
70
80
90
100
1
Marker 1 [T1 ] 9.81 dBµV 12.500000000 MHz
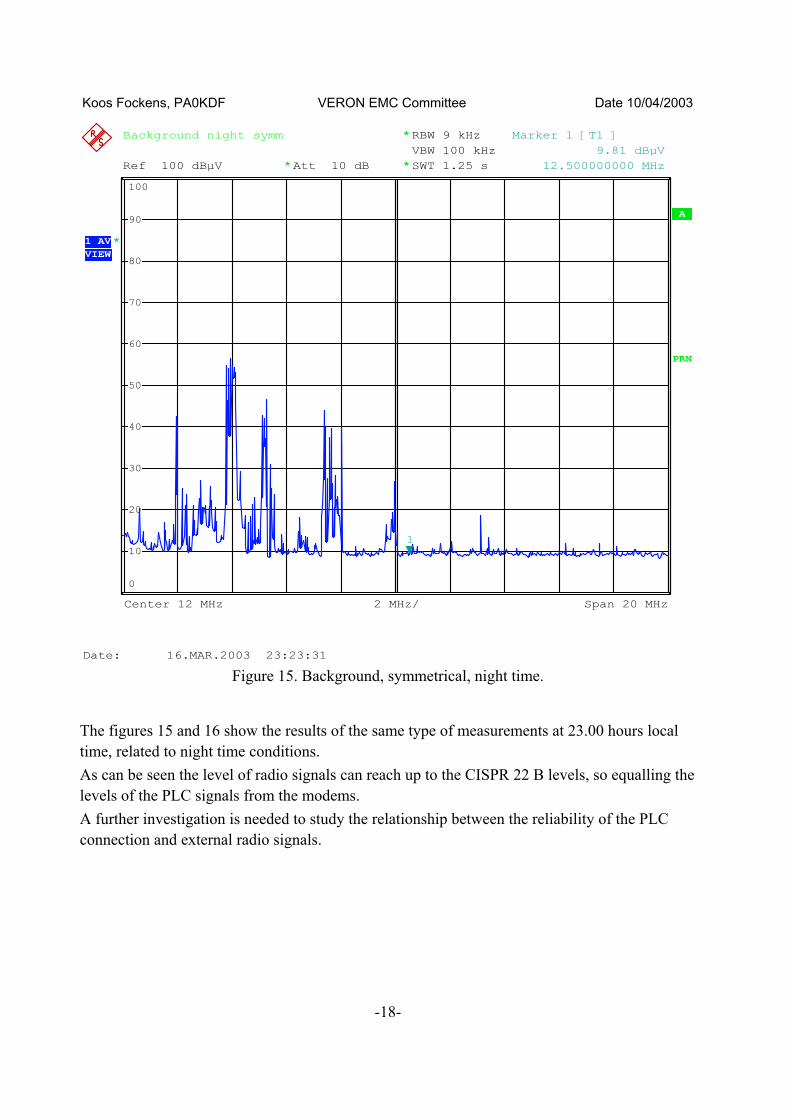
Date: 16.MAR.2003 23:23:31 Figure 15. Background, symmetrical, night time.
The figures 15 and 16 show the results of the same type of measurements at 23.00 hours local time, related to night time conditions. As can be seen the level of radio signals can reach up to the CISPR 22 B levels, so equalling the levels of the PLC signals from the modems. A further investigation is needed to study the relationship between the reliability of the PLC connection and external radio signals.
-18-
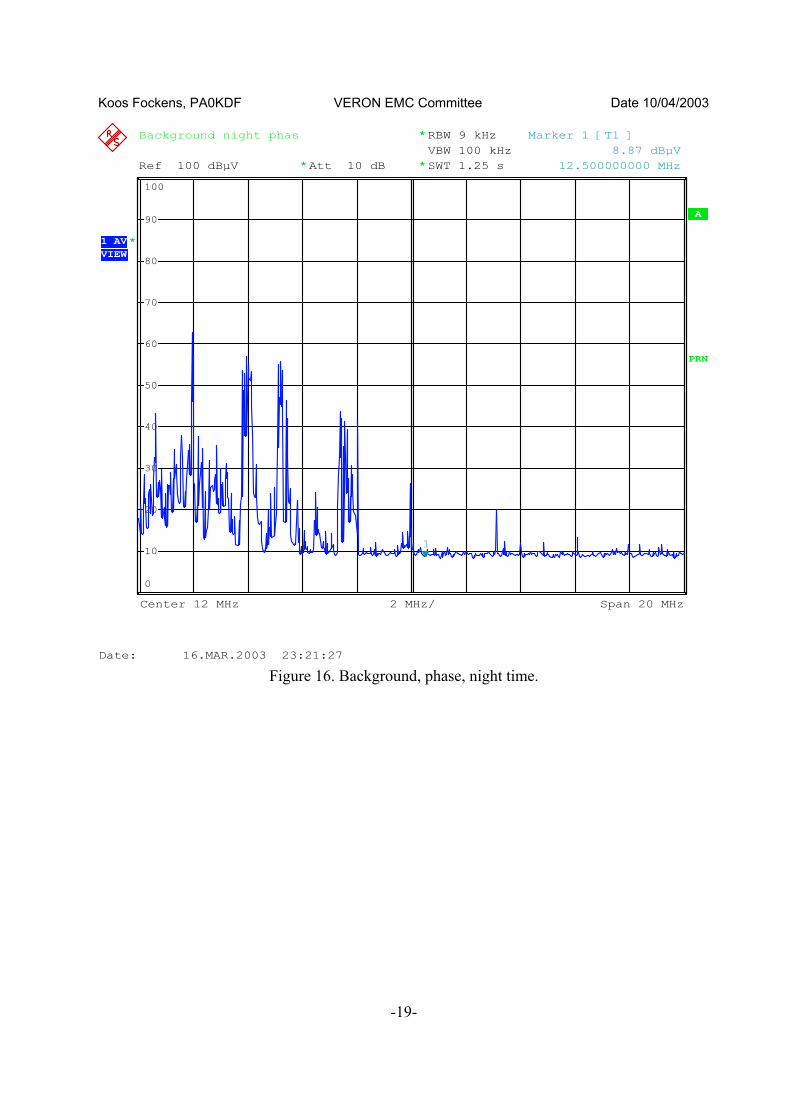
Koos Fockens, PA0KDF VERON EMC Committee Date 10/04/2003
Ref 100 dBµV
A
Center 12 MHz Span 20 MHz2 MHz/
*RBW 9 kHzVBW 100 kHzSWT 1.25 s
Background night phas
*Att 10 dB*
*1 AVVIEW
PRN
0
10
20
30
40
50
60
70
80
90
100
1
Marker 1 [T1 ] 8.87 dBµV 12.500000000 MHz
Date: 16.MAR.2003 23:21:27 Figure 16. Background, phase, night time.
-19-
Koos Fockens, PA0KDF VERON EMC Committee Date 10/04/2003
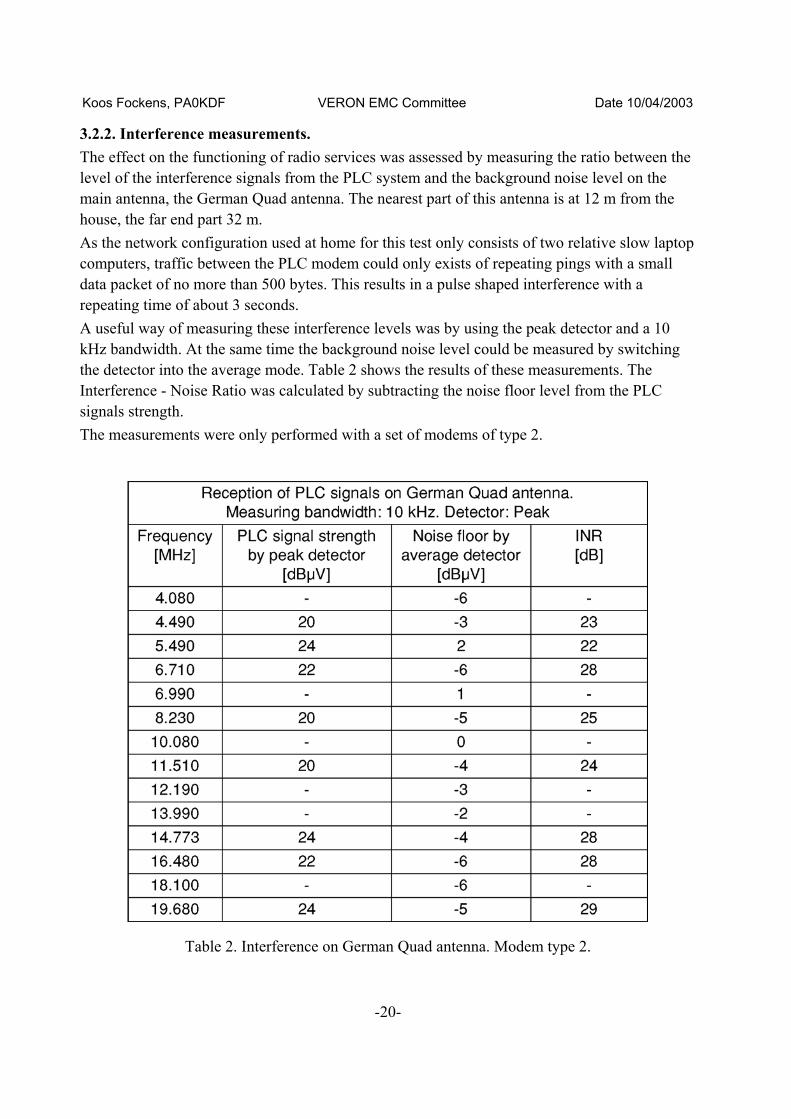
3.2.2. Interference measurements. The effect on the functioning of radio services was assessed by measuring the ratio between the level of the interference signals from the PLC system and the background noise level on the main antenna, the German Quad antenna. The nearest part of this antenna is at 12 m from the house, the far end part 32 m. As the network configuration used at home for this test only consists of two relative slow laptop computers, traffic between the PLC modem could only exists of repeating pings with a small data packet of no more than 500 bytes. This results in a pulse shaped interference with a repeating time of about 3 seconds. A useful way of measuring these interference levels was by using the peak detector and a 10 kHz bandwidth. At the same time the background noise level could be measured by switching the detector into the average mode. Table 2 shows the results of these measurements. The Interference - Noise Ratio was calculated by subtracting the noise floor level from the PLC signals strength. The measurements were only performed with a set of modems of type 2.
Table 2. Interference on German Quad antenna. Modem type 2.
-20-
Koos Fockens, PA0KDF VERON EMC Committee Date 10/04/2003
4. Conclusion. From the measurements the following conclusions have been drawn: Conducted RF Voltage: Modem type 1 seems to comply with the EN55022 B limit, while modem type 2 seems to exceed this limit by 20 dB. The notches for the radioamateur bands are about 30 dB deep. Background Mains disturbance: In the laboratory environment with many PCs running, as well as in the author's home environment, the background mains disturbance level was 30 or more dB's below the EN55022 B limit. Field strength: In this laboratory test set-up magnetic field strengths, expressed in the far field equivalent electric field strength, has been measured for modem type 1: 54 dBµV/m@1m, and for modem type 2: 80 dBµV/m@1m. Power density: Power densities have been measured for modem type 1: -86 to -97 dBm/Hz, and for modem type 2: -67 to -69 dBm/Hz. Interference: The interference measurements shows that for the modem type 2 in the given circumstances, where the receiving antenna is standing off from the house at a relative large distance, a much larger distance than is common for the amateur or the broadcasting listener, the interference from the PLC system can be 20 - 30 dB above the background noise level at frequencies outside the notches for the amateur bands. Inside the radio amateur bands with this antenna distance the interference level was too low to measure. The modem type 1 had an interference level which is generally 20 dB lower. The interference could be heard outside the radio amateur bands. No attempt was made to measure it. General conclusions: Tests have been performed on the EMC of two types of in-house PLC modems, developed according the HomePlug® standard, that recently appeared on the European market. Some measurements were done in a laboratory set-up (mains disturbance voltage, field strength, background noise), other were performed in the house of the author (interference on amateur radio receiving antenna, background signals and noise on mains).
-21-
Koos Fockens, PA0KDF VERON EMC Committee Date 10/04/2003
One type PLC modem seems just to meet the mains disturbance limit in EN55022 for residential environment, the second type showed a level which was approximately 20 dB higher.
Under the condition that the in-house PLC modem complies with the current EN55022 B standard, and that the modem additionally uses notches for the bands of the amateur services according to the Homeplug® standard, the general conclusions drawn were:
• Only when when a reasonable well constructed outdoor antenna is used the interference from the modems is probably not a threat to the radio amateur service ,
• outside the notches harmful interference may be caused to the broadcasting services. • In the laboratory environment with many PCs running, as well as in the author's home
environment, the background mains disturbance level was 30 or more dB's below the EN55022 B limit.
-22-
Koos Fockens, PA0KDF VERON EMC Committee Date 10/04/2003
Annex.
Schematic of Mains Coupling Device.
-23-


![Preparing for Advanced Heart Failure Certificationwcm/@gra/documents/... · Title: Microsoft PowerPoint - DSC Adv HF 03.11.16 B & W.ppt [Compatibility Mode] Author: Isbeyc Created](https://img.pdfslide.us/doc/110x75/5b860c597f8b9a3a608bfba4/preparing-for-advanced-heart-failure-certification-wcmgradocuments-title.jpg)

![Will power ppt hf [compatibility mode]](https://img.pdfslide.us/doc/110x75/58ee86131a28ab34468b45b9/will-power-ppt-hf-compatibility-mode.jpg)