Embed Size (px)
Citation preview

Hexabundles: imaging fibre arrays for low-light astronomical applications
Joss Bland-Hawthorn*1,2, Julia Bryant1, Gordon Robertson1, Peter Gillingham3, John O’Byrne1, Gerald Cecil4, Roger Haynes3,5, Scott Croom1, Simon Ellis1, Martin Maack6,
Peter Skovgaard6, Danny Noordegraaf6,7
1Sydney Institute for Astronomy, School of Physics, University of Sydney, NSW 2006, Australia 2Institute of Photonics & Optical Science, University of Sydney, NSW 2006, Australia
3Anglo-Australian Observatory, PO Box 296, Epping, NSW 2121, Australia 4Dept. of Physics & Astronomy, University of N. Carolina, Chapel Hill, NC 27599, USA
5InnoFSPEC, Astrophysikalisches institut Potsdam, 14482 Potsdam, Germany 6NKT Photonics A/S, Blokken 84, DK 3460 Birkerød, Denmark
7DTU Photonik, Technical University of Denmark, DK 2800, Denmark *Corresponding author: [email protected]
Abstract: We demonstrate a novel imaging fibre bundle (“hexabundle”) that is suitable for low-light applications in astronomy. The most successful survey instruments at optical-infrared wavelengths use many multimode fibres fed to one or more spectrographs. Since most celestial sources are spatially extended on the celestial sphere, a hexabundle provides spectroscopic information at many distinct locations across the source. We discuss two varieties of hexabundles: (i) lightly fused, closely packed, circular cores; (ii) heavily fused non-circular cores with higher fill fractions. In both cases, we find the important result that the cladding can be reduced to ~2µm over the short fuse length, well below the conventional ~10λ thickness employed more generally, with a consequent gain in fill factor. Over the coming decade, it is to be expected that fibre-based instruments will be upgraded with hexabundles in order to increase the spatial multiplex capability by two or more orders of magnitude. ©2011 Optical Society of America OCIS codes: (000.0000) General; (060.2430) Fibers, single-mode, multimode
References and links 1. S.C. Barden, W.L. Ramsey, & R.J. Truax, “Evaluation of some fibre optical waveguides for astronomy,” PASP, 93, 154 (1981). 2. P. Gray, “Astronomical uses of optical fibres at the Anglo-Australian Observatory,” SPIE, 374, 160 (1983). 3. M.M. Colless, “First results from the 2dF Galaxy Redshift Survey,” Phil. Trans. Roy. Soc. Lond. A. 357, 105 (1999). 4. D.H. Jones, W. Saunders, M. Colless, M. A. Read, Q. A. Parker, F. G. Watson, L. A. Campbell, D. Burkey, T. Mauch, L. Moore, M. Hartley, P. Cass, D. James, K. Russell, K. Fiegert, J. Dawe, J. Huchra, T. Jarrett, O. Lahav, J. Lucey, G. A. Mamon, D. Proust, E. M. Sadler, and K.-I. Wakamatsu, “The 6dF Galaxy Survey: samples, observational techniques and the first data release,” MNRAS 355, 747 (2004). 5. M. A. Strauss, M. A., D. H. Weinberg, R. H. Lupton, V. K. Narayanan, J. Annis, M. Bernardi, M. Blanton, S. Burles, A. J. Connolly, J. Dalcanton, M. Doi, D. Eisenstein, J. A. Frieman, M. Fukugita, J. E. Gunn, Z. Ivezic, S. Kent, R. S. J. Kim, G. R. Knapp, R. G. Kron, J. A. Munn, H. J. Newberg, R. C. Nichol, S. Okamura, T. R. Quinn, M. W. Richmond, D. J. Schlegel, K. Shimasaku, M. SubbaRao, A. S. Szalay, D. Vanden Berk, M. Vogeley, B. Yanny, N. Yasuda, D. G. York, and I. Zehavi, “Spectroscopic Target Selection in the Sloan Digital Sky Survey: The Main Galaxy Sample,” AJ 124, 1810 (2002). 6. S. B. Mignot, “Overview of the GYES instrument: a multifibre high-resolution spectrograph for the prime focus of the Canada-France-Hawaii Telescope,” SPIE 7735-161 (2010). 7. http://www.sdss3.org/instruments/boss_spectrograph.php 8. Y. Zhu, Z. Hu, Q. Zhang, L. Wang, and J. Wang, “A multipurpose fiber-fed VPHG spectrograph for LAMOST,” SPIE 6269, 20 (2006).

9. S.C. Ellis, Driver, S. P., Allen, P.D., Liske, J., Bland-Hawthorn, J., De Propris, R., “The Millenium Galaxy Catalogue: On the Natural Subdivision of Galaxies,” MNRAS 363, 1257 (2005). 10. G. J. Hill, P. J. MacQueen, M. P. Smith, J. R. Tufts, M. M. Roth, A. Kelz, J. J. Adams, N. Drory, F. Grupp, S. I. Barnes, G. A. Blanc, J. D. Murphy, W. Altmann, G. L. Wesley, P. R. Segura, J. M. Good, J. A. Booth, S.-M. Bauer, E. Popow, J. A. Goertz, R. D. Edmonston, and C. P. Wilkinson, “The Design, Construction and Performance of VIRUS-P: the Prototype for a Highly Replicated Integral Field Spectrograph for HET,” SPIE, 7014, 231 (2008). 11. S.C. Barden & R.A. Wade, “DensePak and Spectral Imaging with Fibre Optics,” In Fibre Optics in Astronomy, 113 (1988). 12. I. J. Lewis, M. Balogh, R. De Propris, W. Couch, R. Bower, A. Offer, J. Bland-Hawthorn, I. K. Baldry, C. Baugh, T. Bridges, R. Cannon, S. Cole, M. Colless, C. Collins, N. Cross, G. Dalton, S. P. Driver, G. Efstathiou, R. S. Ellis, C. S. Frenk, K. Glazebrook, E. Hawkins, C. Jackson, O. Lahav, S. Lumsden, S. Maddox, D. Madgwick, P. Norberg, J. A. Peacock, W. Percival, B. A. Peterson, W. Sutherland, and K. Taylor, “The Anglo-Australian Observatory 2dF facility,” MNRAS 333, 279 (2002). 13. G.J. Hill, Department of Astronomy, University of Texas, Austin, TX, USA (2010). 14. R. Bacon, Observatoire de Lyon, CRAL – Université de Lyon, Lyon, France (2010). 15. A.W. Snyder & J.D. Love, Optical Waveguide Theory, Chapman & Hall, 2nd ed. (2000). 16. J.J. Bryant, J. O’Byrne, J. Bland-Hawthorn & S. Leon-Saval, “Characterisation of hexabundles: initial results,” MNRAS, submitted (2010). 17. A.M. Moore, R. Dekany, D. Jones, R. Smith, K. Taylor, and V. Velur, “Spine development for the Echidna fibre positioner,” SPIE 4841, 1429 (2003). 18. A.M. Moore, P. R. Gillingham, J. S. Griesbach, and M. Akiyama, “POSM: a new concept for fibre positioning,” SPIE 6269, 54 (2006). 19. G. Wang, “Fibre positioning of LAMOST,” SPIE, 4008, 922 (2000).
1. Introduction
Historically, telescopes were used to observe one source at a time on the celestial sphere. But with advances in optical fibres, it was realized in the early 1980s that many sources could be observed across the telescope focal plane simultaneously by positioning optical fibres across the field [1,2]. This led to an explosion in wide-field astronomical surveys: the Two Degree Field Galaxy Redshift Survey [3], the Six Degree Field Galaxy Survey [4], the Sloan Galaxy Redshift Survey [5], to name a few, which between them have obtained spectra on more than a million extragalactic targets. New instruments recently commissioned or in construction (e.g. [6−8]) are able to observe thousands of sources at a time. But all of these machines suffer a common problem. For many of the targets in these huge surveys, the aperture of the optical fibre encloses only a fraction of the available signal, and moreover the single fiber’s sample may not be representative of the total. In other words, the celestial sources are spatially extended, with properties such as composition and internal motions, which vary across the object. The measured signal depends on many things: (i) intrinsic properties like source luminosity, size and distance, (ii) atmospheric conditions, (iii) instrumental properties like fibre aperture size and optical focus over the field, (iv) pointing and positioning accuracies, and so on. Many published papers make the mistake of assuming the surveys provide spectrobolometry rather than spectroscopy. The inherent dangers of aperture effects are long known in astronomy and rarely appreciated (e.g. [9]).
With the advent of adaptive optics and ever-increasing telescope apertures, essentially all of the sources studied to date can be spatially imaged with ground-based telescopes. This argues for a new photonic imaging device that has the flexibility of an optical fibre and can be positioned over the wide focal plane with existing robotic technology – we refer to such a device as the hexabundle. In this paper, we describe the development of the hexabundle along with some early test results. We close by presenting our first on-sky measurements.
2. Early considerations
Consider Fig. 1. For lightly fused fibres, one imagines that the only deleterious effect in the fibre transmission is the focal ratio degradation (FRD), sometimes referred to as NA upscattering, normally associated with multimode optical fibres. In contrast, heavily fused fibre bundles have the cores packed so closely that interstitial holes are essentially removed.

The fused fibre formats provide the best covering fraction at the expense of distortion of the fibre cores. This case is analogous to microlens arrays with hexagonal elements, where one finds additional FRD, which we refer to as geometrical FRD, due to the hexagonal pyramid of illumination onto the fibre being converted to a conical beam at the fibre output. There is also reflection loss at the lens surfaces and loss due to imperfections at the corners of the lenses. For a fused fibre bundle, in which the individual cores are near hexagonal, there is bound to be an effect analogous to the geometrical FRD with the hexagonal lens array. It appears, from simple geometrical Zemax simulations, that there is no FRD directly attributable to having a polygonal rather than a circular cross section (nor even a square cross section), so long as the polygon does not change along the fibre length. But in reality there is likely to be some additional FRD in the transition to a circular fibre core.
Fig. 1. Unfused hexagonal fibre formats (top) and unfused circular fibre formats (bottom) for 1, 7, 19, 37, 61, 91 and 127 cores. The relative physical sizes are also shown. For a core size of 100µm, the largest device shown here has a diameter of ≤1.5 mm that falls well within the space envelope of existing robot grippers, even allowing for the protective jacket (see text).
A case can be made that the fused format is intrinsically superior to the unfused format because it samples the object in the spatial domain more completely. But if there is no spatial frequency content with a pitch less than twice the inter-element spacing, then the sampling theorem indicates that no information is lost in reconstructing the image. It may seem that, for cases in which higher spatial frequencies are significant, there is an argument in favour of the near-contiguous sampling with the fused format. However, it is often the case in galaxy surveys that the observations are read-noise limited such that multiple dithered exposures can be taken of the same source. For a moderately stable atmosphere, the reconstructed images can often show very good sampling properties consistent with near-contiguous sampling.
For a large number of circles closely packed in a hexagonal array (so that the outer periphery effect can be disregarded), the fraction of area within the circles is equal to f = π/√12 ≈ 91% although the presence of cladding will reduce this. For the fully fused fibres, the fill fraction can be higher than 91% depending on the cladding thickness. In passing, we note that the fill fractions discussed here are much higher than achieved to date for astronomical uses. For example, the state-of-the-art fibre bundles (260 µm core diameter) being developed for the VIRUS instrument on the Hobby-Eberly telescope have f ≈ 33% [10]. There are occasional claims of higher values of f but these are always associated with very large fibre core sizes that exploit >10λ cladding, rather than the smaller, more widely used fibre apertures discussed here. For example, the DensePak II instrument has a slightly higher f value but uses 320 µm core diameters each with 415 µm OD [11].
So does a commercial product exist with a high fill fraction? The short answer is no. Initially, we investigated a wide range of commercial products only to find inter alia that none of these

preserve the integrity of the input signal and/or transport light with minimum insertion loss along their lengths. As our starting point, we considered the principle of multimode beam combiners and high power pump combiners. These are manufactured either with photonic crystal fibre techniques or with fused fibre bundles. Hexagonal configurations of n MMFs are used to transport light from n laser diodes to a single focal point. The NA on output can be considerably higher than the NA of the individual MMFs in order to focus the laser output and achieve high laser brightness. Typical insertion losses are very low going from low NA to high NA but, until the present research, never in reverse (typically 3-5 dB in the other direction).
Before we describe the new devices, we touch on the issue of cheap spectrographs, a critical goal of astrophotonics. This is a fundamental requirement that must be met if a multi-object hexabundle spectrograph is to be a viable front-line instrument on major telescopes.
3. Cheap spectrographs
In Fig. 2, we illustrate the case for two hexabundles positioned across the focal plane of a telescope. Our goal is to deploy ~100 of these devices over the widest possible angular field, i.e. of order degrees on medium-sized to large telescopes. Such an instrument will need to employ a large number of cheap spectrographs to receive the output of many thousands of fibres. As a benchmark, the 2dF instrument on the Anglo-Australian Telescope [12] used two spectrographs to receive 800 fibres from the focal plane at a total cost of $2M. A unit cost of $2500 per fibre is too high by an order of magnitude if we are to achieve an affordable multi-object hexabundle spectrograph employing ~100 bundles, each with ~100 cores, say. The VIRUS instrument on the Hobby-Eberly Telescope will utilise ~200 spectrographs to accept the light from 40,000 individual fibres at a cost of $500 per fibre [13]. This is comparable to the cost per spatial element of the MUSE spectrograph soon to be commissioned on the Very Large Telescope [14]. The unit cost for both instruments is of the right order for the hexabundle concept to be realized.
Fig. 2. A schematic of the deployment of two hexabundles over the focal plane. Hexabundles retain the operational advantages of fibre-based spectrographs, i.e. deployment over a very wide field, and efficient packing of the CCD. A practical system is likely to employ ~100 such devices.

4. Hexabundles
In order to carry out a differential study, we investigated both lightly fused and heavily fused fibre bundles with our commercial partners NKT Photonics (formerly Crystal Fibre) in Denmark. We explored how to fuse multimode fibres (MMF) into a solid element in such a way that the NA can be controlled along the fibre axis.
Fig. 3. (Left) Polished face of a fully fused 1×61 hexabundle with a random back illumination of the multimode fibres. (Right) Zoomed image to show detail, in particular, that there are no interstitial holes.
4.1 Heavily fused hexabundles
In Table 1, we list the key parameters and measurements of our first two 1×61 (one input; 61 outputs) fused hexabundles. These were made to be roughly 5m in length to allow for testing at the Morehead 0.61m telescope. The initial cladding layer of 125µm needed to be etched away over a distance of about 3 cm to realize a higher packing fraction. This etching process is described in Section 4.2.
The fibres were inserted into a glass tube and gradually fused along the length of the bundle. The fusing power and duration was so high that the interstitial holes completely disappeared. The end of the bundle was inserted into a specially-made FC/PC connector using slow cure, low-stress epoxy glue. The end of the connector was polished using standard telecom procedures (Ultra-Physical Contact standard).
For mechanical protection, a long aluminium tube was attached to the back end of the connector. Soft silicone glue was pumped into the aluminium tube to surround the glass element. A length of steel re-enforced cable was attached to the aluminium tube using hard epoxy glue. The other end of the cable was terminated with a similar aluminium tube. At the end of the aluminium tube, the inside was lined with soft rubber to avoid contact with metallic edges.
After polishing, both bundle facets were inspected to ensure that the bundle was fully fused and to verify the polishing quality. Micrograph images are shown in Fig. 3: the outer reflecting steel ferrule of the connector can be seen at the corners (white). Inside, the darker (non reflecting) glue can be seen. The polished glass facet can be seen as different shades of grey; cores are lighter than cladding when the fibre ends are illuminated. A higher magnification image is also shown of the details of the fused bundle. It is clear that the structure is fully fused and that no interstitial holes are left (cf. Fig. 4).
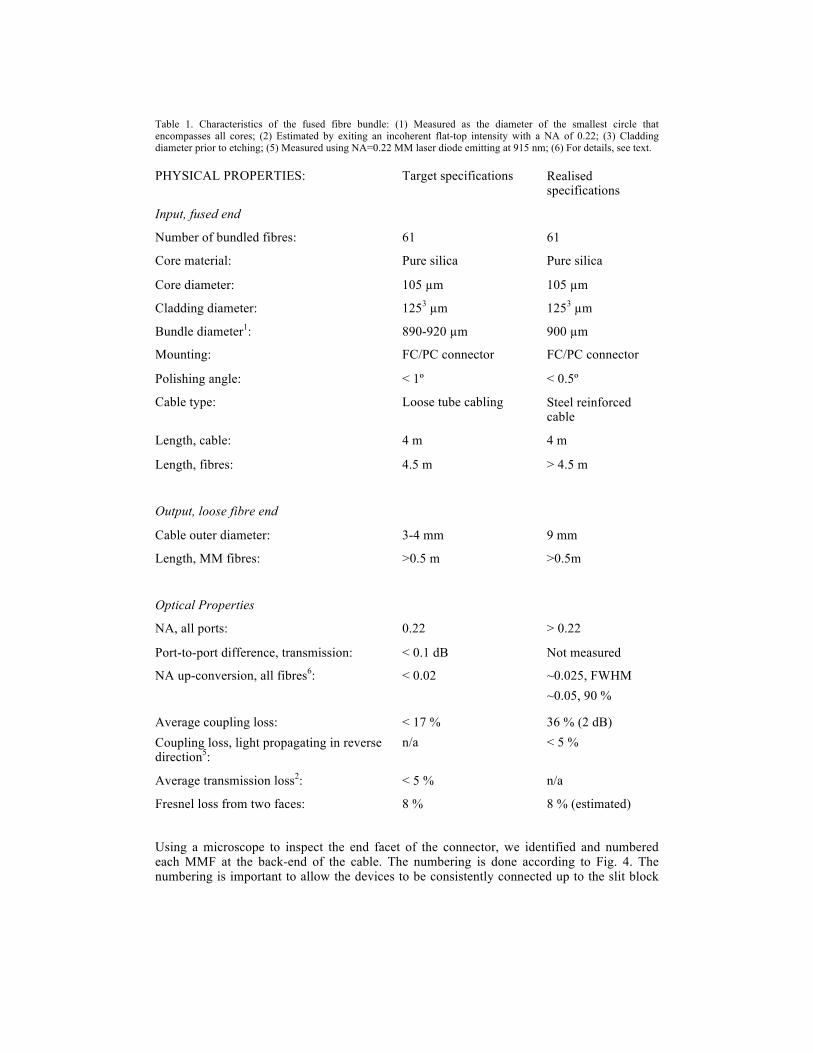
Table 1. Characteristics of the fused fibre bundle: (1) Measured as the diameter of the smallest circle that encompasses all cores; (2) Estimated by exiting an incoherent flat-top intensity with a NA of 0.22; (3) Cladding diameter prior to etching; (5) Measured using NA=0.22 MM laser diode emitting at 915 nm; (6) For details, see text.
PHYSICAL PROPERTIES: Target specifications Realised
specifications
Input, fused end
Number of bundled fibres: 61 61
Core material: Pure silica Pure silica
Core diameter: 105 µm 105 µm
Cladding diameter: 1253 µm 1253 µm
Bundle diameter1: 890-920 µm 900 µm
Mounting: FC/PC connector FC/PC connector
Polishing angle: < 1º < 0.5º
Cable type: Loose tube cabling Steel reinforced cable
Length, cable: 4 m 4 m
Length, fibres: 4.5 m > 4.5 m
Output, loose fibre end
Cable outer diameter: 3-4 mm 9 mm
Length, MM fibres: >0.5 m >0.5m
Optical Properties
NA, all ports: 0.22 > 0.22
Port-to-port difference, transmission: < 0.1 dB Not measured
NA up-conversion, all fibres6: < 0.02 ~0.025, FWHM ~0.05, 90 %
Average coupling loss: < 17 % 36 % (2 dB) Coupling loss, light propagating in reverse direction5:
n/a < 5 %
Average transmission loss2: < 5 % n/a
Fresnel loss from two faces: 8 % 8 % (estimated)
Using a microscope to inspect the end facet of the connector, we identified and numbered each MMF at the back-end of the cable. The numbering is done according to Fig. 4. The numbering is important to allow the devices to be consistently connected up to the slit block
mounts; this work was carried out by OzOptics in Canada. We have made a movie available at http://www.physics.usyd.edu.au/research/sifa/astrophotonics/hexabundle.shtml showing the front face illumination of the hexabundle due to a light source irradiating fibres in sequence along the slit block.
Fig. 4: (Left) Heavily fused 1×61 hexabundle showing reduced interstitial holes. (Right) Lightly fused hexabundle with the same number of cores. These are preferred for astronomical observations: see text.
Initial characterisation. We now briefly describe our characterization of the hexabundles.
Optical transmission. We used three different lasers emitting at 1064 nm, 1310 nm and 1550 nm. Each laser is pigtailed with a fibre cable and a FC/PC termination. One at a time, the light was coupled into a standard MM patchcord (core diameter: 600 µm) using a standard FC/PC mating sleeve. Using another FC/PC mating sleeve, the light was coupled from the MM patch cord into the fused bundle. The combined optical power out of the 61 individual MMFs was then measured with an integrating sphere. Comparing with the power emitted from the MM patch cord, the transmission loss was found. The transmission loss for all wavelengths was measured to be 2±0.2 dB, corresponding to 37%.
Numerical Aperture. To measure the level of NA up-conversion (FRD), we used a 915nm Bookham MM diode laser. The light from the diode was coupled into the 600µm patch cord and the far field illumination (FF) was measured (green curve in Fig. 5). The light was then coupled into the hexabundle device and, for a random selection of MMFs, the far field illumination was measured again. Fig. 5 shows that there is significant up-conversion of the NA, in that all curves lie to the right of the input (green) curve. The figure includes FFs for a number of randomly selected ports; these are shown as black curves in Fig. 5. It is clear that there are large differences between individual fibres that are due to bubbles in the fused section of the F-doped cladding glass, which arise at high temperatures.
By comparing the properties of the hexabundle pair, we believe the mechanical packaging steps (glueing, connectorisation, polishing, cabling, etc.) are well under control and are reproducible. However, the results presented in Fig. 5 are sufficiently compromised that we decided to move forward with the “lightly fused” fibre development, particularly since the overall transmission loss of 37% (inclusive of area loss due to fill fraction < 100%) was not optimal. It was speculated that a lower F-dopant concentration would improve the performance of the fused hexabundle, but at the expense of lower input fibre NA.
4.2 Lightly fused hexabundles
The fill fraction of circular fibres is given by

€
f =π12(1− 2δr
r)
where r is the core radius and δr is the radial cladding thickness (δr/r « 1). (A more general formula for any δr/r is f = (πr2/√12)(r+δr)-2.) For no cladding, the filling or packing fraction has a maximum of 91% for circular cores. At optical wavelengths using 100µm cores (r=50µm), if we were to adopt a conventional cladding thickness δr ≈ 10λ to ensure efficient guiding up to a wavelength of 1µm, the filling fraction of the cores then falls to 55%. Therefore, a key consideration for lightly fused hexabundles is the extent to which the cladding can be etched down to some minimal thickness.
Fig. 5: First measurements of acceptance angle vs. power fraction across individual fibres in the heavily fused 1×61 hexabundle. The so-called “integrated far field (FF)” is shown as a red curve. The green curve shows the FF illumination from the 600µm MM patchcord as a function of angle. This demonstrates that fused hexabundles have undesirable FRD properties.
Snyder & Love [15] describe the power exchange between two multimode fibres as
⎟⎠
⎞⎜⎝
⎛ −=LL
PzP sin1
21
)0()(
1
2
(1)
where
€
L ≈ 8ρπdV⎛
⎝ ⎜
⎞
⎠ ⎟ 1/ 2 zρexp − d − 2ρ
ρV
⎛
⎝ ⎜
⎞
⎠ ⎟ (2)
for which
€
V = kρ(nco2 − ncl
2 )1/ 2 (3)
is the fibre parameter (V»1 for multimode fibers), ρ is the fibre radius, d is the distance between fibre centres, and P1(0) is the total power entering the first fibre. The other constants describe properties of the material. This has a clear dependence on cladding thickness (δr = 0.5d-ρ), and on the distance (z) light propagates along one of the fibres. (Remarkably, the coupling between MMFs can be much less if the diameters differ by only a few percent.) This is an important clue that it may be worthwhile to explore different values of δr or fuse length although the latter is limited by the Vytran fuser.
We have explored Eq. (1)-(3) within the photonics simulation package RSoft for one or more neighbouring cores. We find that over the adopted short fuse length of the hexabundle (a few cm typically), the cladding thickness can be as small as δr ≈ 2 µm, equivalent to a fill fraction of f ≈ 84%, a factor of three improvement over the best fill fractions achieved to date in

devices that use much larger core sizes. This cladding thickness is much less than the 10-100µm thicknesses exploited in all MMF-based instruments to date [10-12,17-19].
To explore different cladding parameters, we experimented with cladding thicknesses of 1, 2, 4, 6 and 8µm. We were able to achieve these with a high level of control and repeatability, typically within 10% of the cladding thickness.
Etching. An optical micrograph of a fibre facet (Figs. 3, 4) has excellent contrast between glass and air but limited contrast between core and cladding glass. For this reason, the fibre diameter can be accurately measured while the core diameter, and thereby the cladding thickness, is associated with larger uncertainty. Since the cross talk as a function of cladding thickness is central to our study, an accurate measurement of the cladding thickness is crucial, but also very difficult. To further improve accuracy, we carried out the following experiment: for various etch durations, we measured the outer diameter of the fibre accurately and plotted this quantity vs. etch duration. Since the F-doped cladding glass etches at a higher rate than the pure silica core material, the diameter vs. time plot shows a change in the slope corresponding to the core/cladding interface. From this calibration, knowledge of the etch duration is sufficient to accurately determine the remaining cladding thickness.
Fig. 6. Plot showing the fibre diameter as a function of etch duration. The etch rates for the core and cladding materials are derived. The intersection of linear fits for both regions yields a core diameter of 104.2 µm for this fibre.
Light Fusing. We refer to these devices as “lightly fused” bundles. From device to device, small adjustments had to be made between bundles since the volume of glass changed with the cladding etch. The adjustments are made to achieve the same “degree of fusing.” This degree of fusing is estimated by the size of the interstitial triangle in between the fibres in the bundle. Looking at the centre port, the fusing is made so that about a third of the fibre surface is surrounded by air. This yields a compromise between small cladding and core deformation, high mechanical strength and low air filling fraction. In order to reduce stresses, it was necessary to change the silicone potting material so that it is significantly softer after curing (Durometer hardness [Shore A] ≈ 35).
In Fig. 7, we present a collage of the five manufactured 1×7 hexabundles. The micrographs of the facets are shown after polishing. For each device, low, medium and high magnification images are presented. Also, the minimum distance between two neighbouring ports has been measured. This distance depends both on the etching and the degree of fusing. The left column shows the cladding thickness calculated from the etch duration. Note that the barrier

between two cores is twice the cladding thickness, i.e. a 2µm cladding leads to a 4µm cladding barrier between cores. This helps minimize cross talk between fibres but does not assist the guiding within an individual fibre.
Etch [µm]
Low magnification
Medium magnification
High magnification
C-C [µm]
1
1.7
2
2.9
4
5.5
6
8.1
8
11.5
Fig. 7. A collage of the lightly fused hexabundles presented here (see text). The left column shows the cladding thickness calculated from the etch duration. The minimum distance between two neighbouring ports has been measured. This distance depends both on the etching and the degree of fusing. This minimum Core-to-Core distance is referred to as “C-C” in col. 5. In the final devices, the interstitial holes are filled with soft, low refractive index glue.
The thicknesses, especially for the thin layers of F-doped glass, are difficult to measure accurately. However, there is a clear resemblance between what is calculated from the etch duration and what is measured on the polished facet. It is clear that the softer F-doped glass is “squeezed” together during fusing and deforms more than the pure silica glass.

By inspecting Fig. 8, if we denote the cross-talk fraction by X and the Fresnel reflection by R, the cross-talk term can be expressed as follows:
€
PX ≈ 2P0α2RX
X =10⋅ log Px2Rα 2P0
⎛
⎝ ⎜
⎞
⎠ ⎟ , α ≈
PTP0 1− R( )
where the P values are defined in Fig. 8. The measurement data in Fig. 8 clearly shows that a thinner cladding guides more weakly as expected. At some point, the light is so weakly guided that that it leaks into the neighbouring ports. This results in transmission loss and cross talk. To investigate the origin of the losses and cross talk, we measured the far field illumination emitted from the bundles; the results are presented in Fig. 9. The equipment used is an in-house-built automatic scanning system where the aperture for the detector is moved in two orthogonal directions on a sphere with the emitter facet placed at the centre. First, we set up the light source by splicing a spool of 105 µm MMF to our 0.12 NA amplified spontaneous emission (ASE) source (1530 nm). We then measured the far-field illumination emitted from this fibre (reference curve in Fig. 9). For each of the 5 devices, we spliced the MMF to one of the outer input ports and measured the far field illumination.
Fig. 8. (Left) Schematic drawing showing the cross-talk measurement setup. P0 is the inserted power, PT is the transmitted signal and PX is the reflected signal in the neighbouring fibre. (Right) Transmission and cross talk as a function of core-to-core barrier thickness.
Fig. 9. (Left) Logarithmic plot of far field power vs. divergence angle. (Right) “Power in the bucket” from 80% to 100% power fraction versus “effective” NA for the 5 devices.
A more informative way of looking at the data (Fig. 9) is to integrate the power as a function of the divergence (solid) angle to achieve “power in the bucket”. It can be seen that for decreasing cladding thickness, an increasing amount of light is scattered to very high divergence angles. If we use the 95% and 98% levels for determining the NA, the 2 devices with the thinnest cladding thicknesses have significantly increased “effective NAs”

(divergence angles) on exit, whereas the others have NAs very close to the input. The data suggest that the losses and the divergence are coupled. Our explanation is that the light lost out of the fibres is due to light reaching the rough, etched surface/interface, which is then scattered to higher divergence angles.
It can be seen that when decreasing the cladding thickness from 8µm to 4µm, a portion of the light shows increased divergence angles. We believe this to be due to evanescent coupling. When the cladding thickness gets smaller, the evanescent field strength increases and a larger part of the light “feels” the rough outer surface of the cladding. This light shows up as scattered light in large divergence angles or leaks out into neighbouring ports and can be detected as increased cross talk. The extreme sensitivity of our detector in the far field is such that we can detect light levels 6 orders of magnitude lower than the “unscattered” light levels. Even for cladding thicknesses reduced to 2µm, the losses and the level of NA upscattering are still below 10% which is adequate for our purposes.
Fig. 10. (A) First optical observations from the Morehead 0.61m telescope (University of North Carolina) with a 1×61 heavily fused fibre bundle. The dispersed light from one slit block (roughly half the fibres) is shown where the spectral dispersion is along the horizontal axis. The cleaned spectroscopic image clearly shows the Fraunhofer absorption spectrum from the twilight sky. (B) An intensity plot of the summed spectra where wavelength is along the horizontal axis.
5. First on-sky test results
For the on-sky tests, a 1×61 heavily fused fibre bundle (Fig. 4) was retrofitted to a Boller-Chivens spectrograph mounted at the Morehead 0.61m f/13.5 Cassegrain telescope at the University of North Carolina. The instrument has a 50 mm pupil, 450 grooves/mm reflection grating used in 2nd order. The 61 output MMFs are spread across four slit blocks (Fig. 10) that illuminate the collimator directly. The f/4 camera images the dispersed spectra onto an SBIG-8XMe 1530×1020 thermo-cooled CCD, for which the 9µm pixels are binned 2×2. The peak CCD QE is ~50% at 450 nm.
In Fig. 10, we show the outcome of observing a diffuse bright source, in this case the twilight sky. We find that the nominal 0.1nm spectral resolution is well match to the hexabundle core size. The fused bundle shows direct evidence of FRD: the f/13.5 expands out to f/9 but this is partly due to a tarnished collimator which scatters some of the exeunt light. These preliminary
results constitute our acceptance testing of the fused hexabundles. Devices with cladding as low as 2µm (84% fill fraction) are ideal for use in wide-field imaging spectroscopy. A more detailed characterization of both the fused and lightly fused hexabundles is provided in our companion paper [16].
6. The future
We see many advantages arising from the use of hexabundles in wide-field surveys, both instrumental and astronomical in nature. These include:
Instrumental
(i) Ease of mass production, simple to install; (ii) Super-wide-field reformatting, adaptive optics or natural seeing, optical/IR; (iii) Less sensitive to losses due to blurring by the atmosphere (seeing); (iv) Less sensitive to positioning error enabling the use of inexpensive industrial robots for positioning over the telescope focal plane.
Astronomical
(i) Removes traditional aperture effects allowing for better photometric and bolometric estimates (what we refer to as spectrobolometry); (ii) Less sensitive to source distance, intrinsic size, asymmetry and sub-structure; (iii) The ability to map the internal structure of celestial sources.
Our on-sky tests impressed upon us the efficacy of using hexabundles. The core size in arcsec was not quite optimal but this was easily fixed with a monolithic lens; the bundle face can accept a complex AR coating more easily than a single fibre, and so on. We note that the weight and thickness of the hexabundle does pose a challenge for a robotic positioner that uses retraction (e.g. XY gantry) although this is less of a problem with Echidna [17], PMOS [18] or LAMOST [19] positioning systems. For larger formats, in contrast to what is illustrated in Fig. 1, the hexagonal pattern of cores must be circularized such that the hexagonal numbers are increased to fill the inscribed circle. Possible solutions are 1x91⇒1×10⁹, 1×127 ⇒ 1×154, 1×169 ⇒ 1×199, 1×217 ⇒ 1×253, 1×271 ⇒ 1×313, 1×331 ⇒ 1×379, 1×397 ⇒ 1×451, and so on. This is necessary to ensure symmetric forces between cores in the plane of cross-section when the bundle is lightly fused. In a gentle fusing process, the fibres arrange themselves into a quasi-regularised format (see Fig. 4).
Finally, we believe that the time has come to put aside the use of aperture-limited MMFs in the study of spatially resolved celestial sources. We live in an era of precision measurement in many areas of astronomy. We therefore anticipate that multi-object hexabundle spectrographs will revolutionize extragalactic astronomy in the same manner that single fibre multi-object spectrographs have done over past two decades. Acknowledgment. JBH is supported by a Federation Fellowship from the Australian Research Council. This work was completed during the Hilary and Trinity terms (2010) at the Beecroft Institute of Particle Astrophysics & Cosmology, Oxford University. JBH is indebted to the Leverhulme Foundation for sponsoring a Visiting Professorship to Oxford and to Merton College for a Visiting Fellowship.