Embed Size (px)
Citation preview
Heuristic Economic Assessment of the Afghanistan Construction Materials Sector—Cement and Dimension Stone Production
Open-File Report 2014–1208
U.S. Department of the Interior U.S. Geological Survey

COVER Photograph of a marble fabricator, 2011, Herat, Afghanistan (U.S. Geological Survey photograph by Victor Mossotti).
Heuristic Economic Assessment of the Afghanistan Construction Materials Sector—Cement and Dimension Stone Production
By Victor G. Mossotti
Open-File Report 2014–1208
U.S. Department of the Interior U.S. Geological Survey
ii
U.S. Department of the Interior SALLY JEWELL, Secretary
U.S. Geological Survey Suzette M. Kimball, Acting Director
U.S. Geological Survey, Reston, Virginia: 2014
For more information on the USGS—the Federal source for science about the Earth, its natural and living resources, natural hazards, and the environment—visit http://www.usgs.gov or call 1–888–ASK–USGS
For an overview of USGS information products, including maps, imagery, and publications, visit http://www.usgs.gov/pubprod
To order this and other USGS information products, visit http://store.usgs.gov
Suggested citation: Mossotti, V.G., 2014, Heuristic economic assessment of the Afghanistan construction materials sector—Cement and dimension stone production: U.S. Geological Survey Open-File Report 2014–1208, 114 p., http://dx.doi.org/10.3133/ofr20141208.
Any use of trade, product, or firm names is for descriptive purposes only and does not imply endorsement by the U.S. Government.
Although this report is in the public domain, permission must be secured from the individual copyright owners to reproduce any copyrighted material contained within this report.
ISSN 2331-1258 (online)
Contents Summary ........................................................................................................................................................................ 1 Introduction .................................................................................................................................................................... 2 Availability and Uses of Domestic Nonfuel Industrial Minerals ....................................................................................... 4 Framework for Subsector Appraisal ............................................................................................................................... 5
Value Chain ................................................................................................................................................................ 5 Supply Chain .............................................................................................................................................................. 7
General Structure.................................................................................................................................................... 7 Enterprise Responsibilities ...................................................................................................................................... 8
Domestic Demand for Construction Materials .............................................................................................................. 10 Domestic Manufacturing of Construction Materials ...................................................................................................... 13
Clay for Residential Construction ............................................................................................................................. 13 Domestic Concrete Production ................................................................................................................................. 15
Sand and Gravel for Making Concrete .................................................................................................................. 16 Cement for Making Concrete ................................................................................................................................ 18
Basic Cement Chemistry ................................................................................................................................... 19 Afghan Cement Factories .................................................................................................................................. 20 Raw Materials ................................................................................................................................................... 24
Limestone for Making Cement ....................................................................................................................... 25 Clay, Bauxite, Gypsum for Making Cement ................................................................................................... 26
Infrastructure and Use of Natural Gas for Cement Production .......................................................................... 26 Water Requirements for Making Cement ....................................................................................................... 26 Electrical Energy for Making Cement ............................................................................................................ 27 Thermal Energy for Making Cement .............................................................................................................. 28
Domestic Supply and Demand for Electrical and Thermal Energy .................................................................... 29 Feasibility—Natural Gas for Pyroprocessing and for Electric Power ............................................................. 36
Dimension Stone ...................................................................................................................................................... 38 Sandstone and Quartzite ...................................................................................................................................... 39 Granite .................................................................................................................................................................. 39 Slate...................................................................................................................................................................... 40 Limestone ............................................................................................................................................................. 41 Travertine .............................................................................................................................................................. 41 Marble ................................................................................................................................................................... 44
Discussion and Conclusions ........................................................................................................................................ 52 Comments on the Technical Feasibility of NG-to-Thermal and NG-to-Electrical Use in Cement Production ............ 54 Comments on Construction Material Subsectors—Adobe Clay, Limestone, Clay (Limestone Shale), Bauxite, Gypsum, and Aggregate ........................................................................................................................................... 54
Closing Comments ....................................................................................................................................................... 55 Acknowledgments ........................................................................................................................................................ 55 References Cited ......................................................................................................................................................... 55 Appendix 1—Deposit Models ....................................................................................................................................... 64
Limestone [Cement Grade] ...................................................................................................................................... 64 Cement Shale ........................................................................................................................................................... 65 Marble [Dimension Stone] ........................................................................................................................................ 67
Appendix 2—Performance Standards for Cement ....................................................................................................... 70 Appendix 3—Performance Standards for Ready-Mixed Concrete 9 (from ASTM, 2010) ............................................. 72 Appendix 4–Afghanistan Geological Survey Archival Studies on Cement Raw Materials ............................................ 73
iv
Appendix 5–Afghanistan Electrical-Grid Structure Diagrams ....................................................................................... 79
Figures 1. Map of Afghanistan showing locations of areas of interest for industrial minerals ..................................... 5 2. Illustration showing a schematic representation of a hypothetical value chain showing Venn sets of supply and demand attributes ................................................................................................................... 7 3. Illustration showing an example supply chain network for Afghanistan. .................................................... 8 4. Illustration showing the interrelations of enterprise responsibility centers and communications links. ...... 9 5. Illustration showing flow of funds to the Afghanistan Irrigation-Restoration and Development Project and to related shovel-ready projects ....................................................................................................... 11 6. Illustration of hypothetical value-chain and demand-profile for project structure represented in figure 5 .................................................................................................................................................... 12 7. Photograph of a village built of adobe brick in the Hari River Valley west of Chesht-e-Sharif, Herat Province, Afghanistan ............................................................................................................................. 13 8. Photograph of a mud-brick structure with deferred maintenance, Kabul, Afghanistan ............................ 14 9. Illustration of the value chain for the sun-dried and baked brick subsector in Afghanistan ..................... 15 10. Illustration of the value chain for domestic Afghan production of sorted and washed aggregate showing heuristically estimated relative supply and demand profiles...................................................... 17 11. Map of Afghanistan showing geologically permissive tracts for limestone, gypsum, and bauxite and locations for current and potential cement factories ................................................................................ 18 12. Illustration showing relations in the allocation of free lime (C, CaO) among primary clinker minerals ..... 20 13. Photograph of Ghori I cement plant in Pul-e-Khumri, Baghlan Province, Afghanistan ............................ 21 14. Photograph of Ghori-II cement plant in Pul-e-Khumri, Baghlan Province, Afghanistan ........................... 22 15. Illustration showing the value chain for the production of cement for use in concrete at the subsector scale for Afghanistan .............................................................................................................................. 23 16. Illustration showing the value chain for the processing of limestone, clay, bauxite, and gypsum for production of cement at the subsector scale for Afghanistan .................................................................. 25 17. Graph showing specific electrical energy consumption (SEEC) and specific thermal energy consumption (STEC) for wet and dry cement production worldwide during the period 1978–2008 ........ 28 18. Graphs showing Afghan domestic electrical power production and consumption for the period 1980 to 2011 ........................................................................................................................................... 30 19. U.S. Agency for International Development (USAID)/Afghan Energy Information Center (AEIC) map of installed electrical power substations in Afghanistan .......................................................................... 31 20. Map showing distribution of coal-bearing rocks in Afghanistan ............................................................... 32 21. Map showing the proposed route for the Turkmenistan-Afghanistan-Pakistan-India (TAPI) natural gas pipeline ................................................................................................................................................... 35 22. Illustration showing potential combinations of energy types for satisfying the thermal and electrical energy needs of a cement plant. ............................................................................................................. 37 23. Photograph of a bird sculpture on display at the Afghanistan International Marble Conference in Herat (April 2010), typifying the use of calcareous dimension stone as decorative art form ............................. 38 24. Map showing permissive and favorable tracts for granite dimension stone ............................................ 40 25. Map showing permissive and favorable tracts in Afghanistan for limestone and dimension limestone ... 41 26. Map showing permissive and favorable tracts for travertine dimension stone in Afghanistan ................. 42 27. Map showing permissive and favorable tracts for travertine dimension stone within tract dms04, Helmand Province, Afghanistan .............................................................................................................. 43 28. Illustration showing examples of marble varieties available in Afghanistan ............................................ 45 29. Map showing sites of known marble extraction and processing in Afghanistan ...................................... 47 30. Photograph of Lrg-FirmHerat marble-extraction operations showing waste flow ....................................... 49
v
31. Photograph of Med-FirmKabul marble-finishing operation ......................................................................... 49 32. Photograph of synthetic tile made by Med-FirmKabul from marble chips and concrete ............................. 50 33. Illustration of the value chain for a marble product line produced by a large production firm .................. 50 34. Illustration of the value chain for a marble product line produced by a medium sized production firm .... 51 35. Electrical-grid diagram for the North East Power System, Sheberghan, Afghanistan ............................. 79 36. Electrical-grid diagram for the North East Power System, Mazar Sharif, Aybak, and Pul-e-Khumri, Afghanistan ............................................................................................................................................. 80 37. Electrical-grid diagram for the North East Power System, Kunduz, Baghlan, and Pul-e-Khumri, Afghanistan ............................................................................................................................................. 81 38. Electrical-grid diagram for the North East Power System, Kabul, Afghanistan ....................................... 82 39. Electrical-grid diagram for the South East Power System, Helmand and Kandahar, Afghanistan .......... 83 40. Electrical-grid diagram for Afghan electric grid-F, Western Power System, Herat, Afghanistan, with imported power coming from Iran and Turkmenistan .............................................................................. 84 41. Electrical-grid diagram for the North East Power System, South East Power System, and Western Power System in Afghanistan, showing power generation and imported power for 2008–2012 ............. 85
Tables 1. Agencies and organizations contributing to April 30, 2012, Special Inspector General for Afghanistan Reconstruction (SIGAR) data call ............................................................................................................. 86 2. Information sources for Afghanistan reconstruction projects .................................................................... 87 3. Industrial minerals north of the Herat Suture Zone cross-referenced to areas of interest for Afghanistan............................................................................................................................................... 88 4. Industrial minerals south of the Herat Suture Zone cross-referenced to areas of interest for Afghanistan............................................................................................................................................... 88 5. Potential use of Afghan industrial minerals for finished products .............................................................. 89 6. Examples of physical reconstruction projects in Afghanistan ................................................................... 95 7. Potential benefits of blended cement ........................................................................................................ 97 8. Cement chemist notation (CCN) and phase properties ............................................................................ 98 9. Typical contents of cement-grade limestone and clinker .......................................................................... 99 10. Examples of documented cement-grade limestone workings in Afghanistan ......................................... 100 11. Allocation of electrical energy for cement production in kilowatt hours per metric ton (kWh/t) ................ 101 12. Allocation of electrical energy for cement production in Afghanistan, in kilowatt hours per metric ton (kWh/t) .................................................................................................................................................... 101 13. Value chain challenges for coal production in Afghanistan ..................................................................... 101 14. Value chain steps for natural gas production in Afghanistan .................................................................. 102 15. United Kingdom cement plants that used natural gas ............................................................................ 102 16. Potential support organizations for the marble sector in Afghanistan ..................................................... 103 17. Attributes of Med-FirmKabul and Lrg-FirmHerat, which are representative of medium and large marble fabrication firms in Afghanistan ............................................................................................................... 104 18. Marble quarries in Afghanistan ............................................................................................................... 105 19. Marble carvers, Kabul Province, Afghanistan ......................................................................................... 107 20. Marble processing plants in Afghanistan ................................................................................................ 108
vi
Abbreviations A aluminate (Al2O3)
ADB Asian Development Bank
AEIC Afghanistan Energy Information Center
AGS Afghanistan Geological Survey
AFP Afghan First Policy
AISA Afghanistan Investment Support Agency
AR alumina modulus
AREU Afghanistan Research and Evaluation
AOI Area of interest
ARTF O Reconstruction Trust Fund
atm atmospheres
bcm Billion cubic meters
C free lime (CaO)
CAO Afghanistan Control and Audit Office
CCCA Commercial Competitiveness Commission of Afghanistan
CCN Cement chemistry notation
CIA Central Intelligence Agency
cm centimeters
CRS Congressional Research Service
C3A tricalcium aluminate
C4AF ttetracalcium aluminoferrite
C2S dicalcium silicate
CSH2 calcium sulfate dehydrate (Gypsum)
DABS Da Afghanistan Breshna Sherkat (The Afghan National Electric Utility Company)
DFARS Defense Federal Acquisition Regulation Supplement
DOD U.S. Department of Defense
DOS U.S. Department of State
DOT U.S. Department of the Treasury
F ferrite (Fe2O3)
GAO Government Accountability Office
IDB Islamic Development Bank
IFFs informal facilitation fees
kPa kilopascals
kV kilovolt
kWh kilowatt hours
kWh/t kilowatt hours per metric ton
LNG liquid natural gas
vii
LOTFA Law and Order Trust Fund for Afghanistan
LSF lime saturation factor
MBtu million British thermal units
MoF Afghanistan Ministry of Finance
MoMP Afghanistan Ministry of Mines and Petroleum
MV megavolts
MVA megavolt amps
MW/Mt megawatts per million metric ton
NCD North Coal District
NEPS North East Power System
NG natural gas
NGO nongovernmental organization
OTF On The Frontier Group
psi pounds per square inch
S silicate (SiO2)
SCMs supplementary cementitious materials
SIGAR Special Inspector General for Afghanistan Reconstruction
SEEC specific electrical energy consumption
SR silica modulus
STEC specific thermal energy consumption
TAPI Turkmenistan-Afghanistan-Pakistan-India natural gas pipeline
tcm trillion cubic meters
TFBSO Task Force for Business and Stability and Operations
UN United Nations
UNAMA United Nations Assistance Mission for Afghanistan
UNDP United Nations Development Program
USD U.S. dollars
USAID U.S. Agency for International Development
USGS U.S. Geological Survey
WB World Bank
Heuristic Economic Assessment of the Afghanistan Construction Materials Sector—Cement and Dimension Stone Production
By Victor G. Mossotti
Summary Over the past decade, the U.S. Government has invested more than $106 billion for physical,
societal, and governmental reconstruction assistance to Afghanistan (Special Inspector General for Afghanistan Reconstruction, 2012a). This funding, along with private investment, has stimulated a growing demand for particular industrial minerals and construction materials. In support of this effort, the U.S. Geological Survey released a preliminary mineral assessment in 2007 on selected Afghan nonfuel minerals (Peters and others, 2007). More recently, the 2007 mineral assessment was updated with the inclusion of a more extensive array of Afghan nonfuel minerals (Peters and others, 2011). As a follow-up on the 2011 assessment, this report provides an analysis of the current use and prospects of the following Afghan industrial minerals required to manufacture construction materials: clays of various types, bauxite, gypsum, cement-grade limestone, aggregate (sand and gravel), and dimension stone (sandstone, quartzite, granite, slate, limestone, travertine, marble). The intention of this paper is to assess the:
• Use of Afghan industrial minerals to manufacture construction materials, • Prospects for growth in domestic construction materials production sectors, • Factors controlling the competitiveness of domestic production relative to foreign imports of
construction materials, and • Feasibility of using natural gas as the prime source of thermal energy and for generating
electrical energy for cement production.
The discussion here is based on classical principles of supply and demand. Imbedded in these principles is an understanding that the attributes of supply and demand are highly variable. For construction materials, demand for a given product may depend on seasons of the year, location of construction sites, product delivery time, political factors, governmental regulations, cultural issues, price, and how essential a given product might be to the buyer. Moreover, failure on the supply side to mirror such attributes can be deal-breakers in a transaction.
For qualitative interpretation of the findings in this report, the value chain was used to conceptualize the relation between supply and demand. Although quantitative data on the Afghan construction materials sector have been hard to come by, the premise herein was that qualitative aspects of supply and demand are revealed by following the flow of funding through projects of varying sizes. It was found that the spectrum of attributes on the demand side of large multimillion dollar reconstruction projects is generally high dimensional, distributed over a broad line of construction materials at diverse locations, and in varying quantities. As interpreted herein, project funds dispensed at the higher hierarchical levels of a project are often concentrated on procurement of construction materials and
2
services at the upper end of the value chain. In contrast, project funds dispensed at the lower hierarchical levels are disseminated across a multiplicity of subprojects, thus restricting project acquisitions to the lower end of the value chain. Evidence suggests that under the current conditions in Afghanistan producers of construction materials at the lower end of the value chain (adobe brick, aggregate, low-end marble products) can successfully compete in local markets and turn a profit. In contrast, producers of energy-intensive products such as cement will continue to face intense competition from imports, at least in the near-term. In the long-term, as infrastructure issues are resolved, and as business conditions in Afghanistan improve, domestic producers will have a locational advantage in establishing a solid niche in their respective home markets.
In the process of tendering properties for cement production, the pivotal issues of abundant, reliable, and cost-effective thermal and electrical energy sources for cement production have become prominent. Over the past 50 years, powdered coal and natural gas have been proven to be excellent fuels for firing kilns at cement plants, and both fuels are used as energy sources for electricity generation. After reviewing the main aspects of the coal and natural gas sectors, it is concluded here that the issues for plant design are not that of energy source feasibility but rather that of optimization of energy technologies for a given plant at a particular time and place, based on a diverse mix of energy and transport technologies.
Introduction Over the past decade, construction projects in Afghanistan have stimulated a growing demand
for particular industrial minerals and construction materials. By the year 2004, the Afghan construction sector was already flourishing (Special Inspector General for Afghanistan Reconstruction [SIGAR], 2009). The policy of “Afghanistan First” was put into effect in 2008 as part of the larger effort to help Afghans rebuild their country (National Defense Authorization Act of 2008; Public Law 110-181, Sections 886, January 2008, and implemented by the Defense Federal Acquisition Regulation Supplement (DFARS), Subpart 225.77). The Afghanistan First policy (AFP) was to stimulate the Afghan economy by giving Afghan-owned companies priority in the distribution of contract awards and by requiring U.S. and Coalition forces to buy as many commodities, services, and domestically produced construction materials from Afghan companies as was practical. It was expected that the AFP would be especially favorable for the construction materials sector because all industrial minerals needed to manufacture finished construction materials for reconstruction projects are abundant in Afghanistan.
Implicit in the AFP was the expectation that the Afghan production capacity of construction materials from indigenous industrial minerals was to be in place. However, over the period since the AFP was started, the marginal effect of the AFP on the construction materials sector is still difficult to resolve from the nascent economic trend and fluctuations in the sector. The chief problem is the scarcity of reliable data on the use of indigenous industrial minerals by construction materials subsectors. For these reasons, a heuristic approach was adopted for the study reported here. Firsthand information was collected by the author through interviews with business owners, factory and quarry visits, staff at the Afghan Ministry of Mines and Petroleum, the open literature, and the gray literature. A simple graphic, based on fundamental economic principles, was developed to represent a body of complex interlaced semiquantitative information for the purpose of assessing the health, challenges, and prospects of construction sectors that have available indigenous industrial minerals. The evidence discussed in this report shows that:
• On the demand side, funding for large construction projects is mainly distributed at the upper end
of the value chain for procurement of capital equipment and for certain finished construction materials (for example, cement, highly finished marble, ceramic tile, terrazzo, rebar, I-beam,
3
roofing materials, insulation, plumbing); such products are imported from Afghanistan’s neighboring countries.
• On the supply side, domestic raw materials requiring minimal beneficiation are primarily used for culturally traditional construction at the lower end of the value chain (adobe, aggregate) or for export for beneficiation outside Afghanistan at the higher end of the value chain (marble).
Marble and cement are notable examples of the comparative advantage enjoyed by Afghanistan’s
neighbors at the mid-to-upper end of the construction materials value chain. In the case of marble—the Afghan commodity celebrated to have the greatest potential for international trade—the barriers to entry for new marble extraction and finishing firms are relatively low for the mining industry (Rassin, 2012). Nevertheless, much of the high-quality finished marble used for reconstruction is still imported. For cement production, domestic production capacity is currently insufficient to meet the demand for new concrete construction; the demand-gap for the past decade has been filled by imported cement (Mossotti, 2011a). The challenge for this study is the development of perspective on the factors controlling market dynamics in construction material subsectors where indigenous industrial minerals are available for raw materials. Although the assessments provided here are qualitative, they provide insight into the fundamental economic factors shaping domestic and international trade in Afghanistan.
Credible sources for macroeconomic data on the use of domestic industrial minerals for construction in Afghanistan are scarce. The Coalition military is less than fully transparent regarding details on its procurement and use of construction materials. Apart from the relatively few U.S. Government reports available on the Internet, most information available was 6 to 10 years out of date. Also, none of the individuals interviewed for this study could offer a sector wide perspective on construction projects instigated over the past few years. The few quantitative estimates of the demand for construction materials that were discovered were highly variable. For example, published and anecdotal estimates for the demand for hydraulic cement varied from 1.5 to 12 million metric tons (t) per year, thus invalidating the use of cement production statistics as a quantitative proxy for sector wide construction activity. Thus, it was assumed for the objectives of this report that the most up-to-date and reliable barometer for economic activity in the construction material sector has been the level and pattern of funding targeted for physical reconstruction projects in Afghanistan.
As a point of clarification, reconstruction funding is based on a broadly defined rubric that includes many activities, many of which do not specify improvements of the Afghan physical infrastructure. For example, monies in the Afghanistan Reconstruction Trust Fund (ARTF) have been allocated to cover the recurrent costs of the Afghan government, such as the salaries of civilian staff in ministries and provinces, salaries for teachers and health workers, expenditures associated with physical operations and maintenance, costs of bulk purchases of essential goods for the government, and expenses related to the return of expatriate Afghans; only a fraction of ARTF monies are allocated to physical infrastructure reconstruction. ARTF is fully transparent in providing Information on ARTF funded projects.
Data on the effectiveness of reconstruction funding are published in quarterly reports by the SIGAR. SIGAR data are compiled from U.S. agencies and from non-U.S. participants in ARTF. Agencies contributing to the SIGAR data call for the April 30, 2012, quarterly report are listed in table 1. SIGAR data were supplemented by numerous reports by ARTF-affiliated agencies and others in the open literature. Additional information, mostly anecdotal at the less formal level, was obtained in interviews with officials in governmental and nongovernmental (NGO) agencies, and with Afghan cement and marble producers that took place in Kabul, Afghanistan, and in Fremont, California, which is the home of about 75,000 Afghan immigrants (Oeppen, 2010). Table 2 lists sources of general information for this report. Information provided by the Afghanistan Research and Evaluation Unit (AREU) A to Z Guide (AREU, 2012) was especially useful. Tables 18–20 and figure 28 in the marble section below list information sources specific to the marble sector. The SIGAR findings sharpened the
4
focus of this report to that of assessing the extent of market equilibrium between domestic supply and overall demand in construction material subsectors where industrial minerals are used for raw materials. Although the assessments provided here are qualitative, they provide insight into the fundamental economic factors shaping domestic and international trade in Afghanistan.
Availability and Uses of Domestic Nonfuel Industrial Minerals In 2007 the United States Agency for International Development (USAID) and the U.S.
Geological Survey (USGS) began a cooperative effort to assess the nonfuel mineral resource potential of Afghanistan (Peters, 2007). In 2009 the USGS, working with the Task Force for Business and Stability Operations (TFBSO) of the Department of Defense, applied remote sensing imagery and advanced spatial analysis of existing and updated geological data to prioritize permissive areas of mineralization for their economic potential; this work resulted in an extensive compilation of reports published in 2011 on Afghan nonfuel minerals (Peters and others, 2011). The Peters report summarizes studies on 24 areas of interest (AOIs) for potential mining investment. Because of the importance of concrete to infrastructure development, a chapter on cement production also is included in the published summaries (Mossotti, 2011b). The work continued in 2012 with the addition of four AOIs to the original set of 24. The Peters 2011 compilation is based on digital data that are now hosted at the Afghanistan Geological Survey Data Center in Kabul. This database includes geophysical, geohydrology, and hyperspectral remote-sensing data; mineral assessments for AOIs; archival reports; and non-USGS reports on each AOI (http://afghanistan.cr.usgs.gov/minerals).
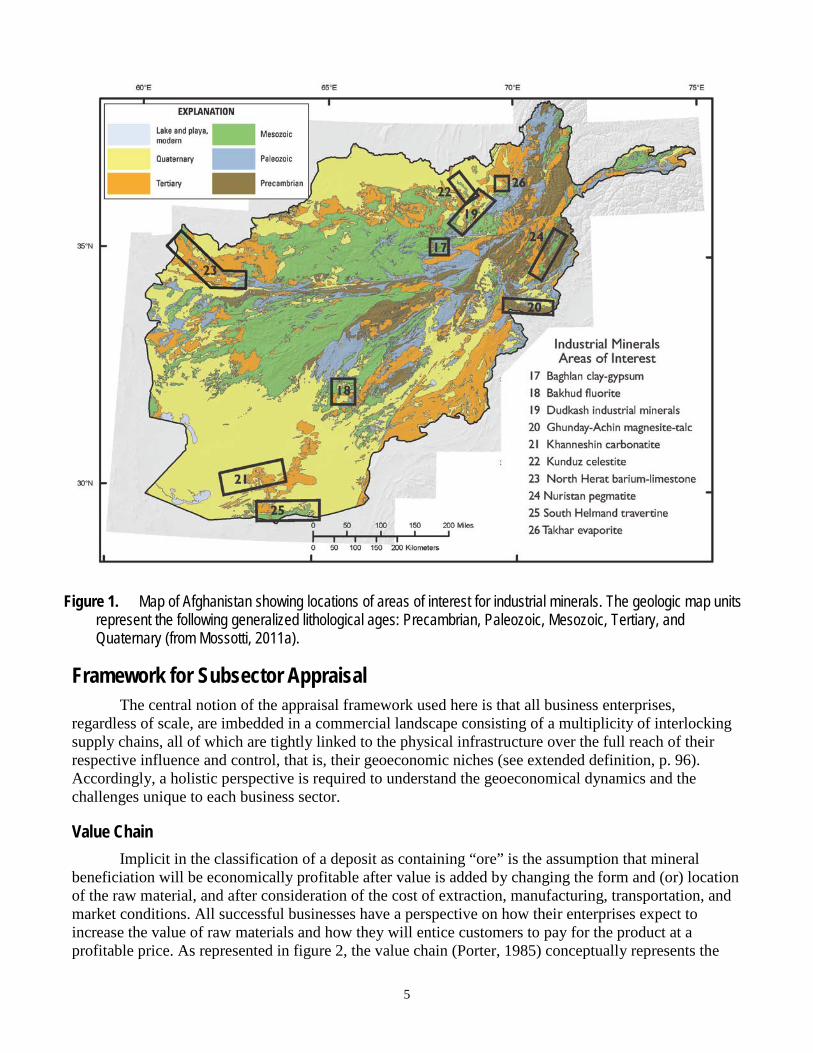
Included in these USGS publications are data on the locations and depositional settings of industrial minerals, many of which are well placed for use as raw materials to manufacture construction materials (Mossotti, 2011a). Figure 1 shows a highly generalized geologic map of Afghanistan with the 2011 AOIs as a layer. Because a given commodity may occur in any of a number of AOIs, tables 3 and 4 are provided to cross reference target commodities with AOIs hosting the minerals. Entries in table 3 represent commodities associated with the North Afghan Platform geological setting.
Table 4 represents industrial minerals involving hydrothermal fluids during ore genesis. Table 5 reviews potential uses for Afghan industrial minerals as raw materials for manufacturing finished construction materials. Permissive tracts for each of the industrial minerals in Afghanistan are referenced in table 5.
5
Figure 1. Map of Afghanistan showing locations of areas of interest for industrial minerals. The geologic map units represent the following generalized lithological ages: Precambrian, Paleozoic, Mesozoic, Tertiary, and Quaternary (from Mossotti, 2011a).
Framework for Subsector Appraisal The central notion of the appraisal framework used here is that all business enterprises,
regardless of scale, are imbedded in a commercial landscape consisting of a multiplicity of interlocking supply chains, all of which are tightly linked to the physical infrastructure over the full reach of their respective influence and control, that is, their geoeconomic niches (see extended definition, p. 96). Accordingly, a holistic perspective is required to understand the geoeconomical dynamics and the challenges unique to each business sector.
Value Chain Implicit in the classification of a deposit as containing “ore” is the assumption that mineral
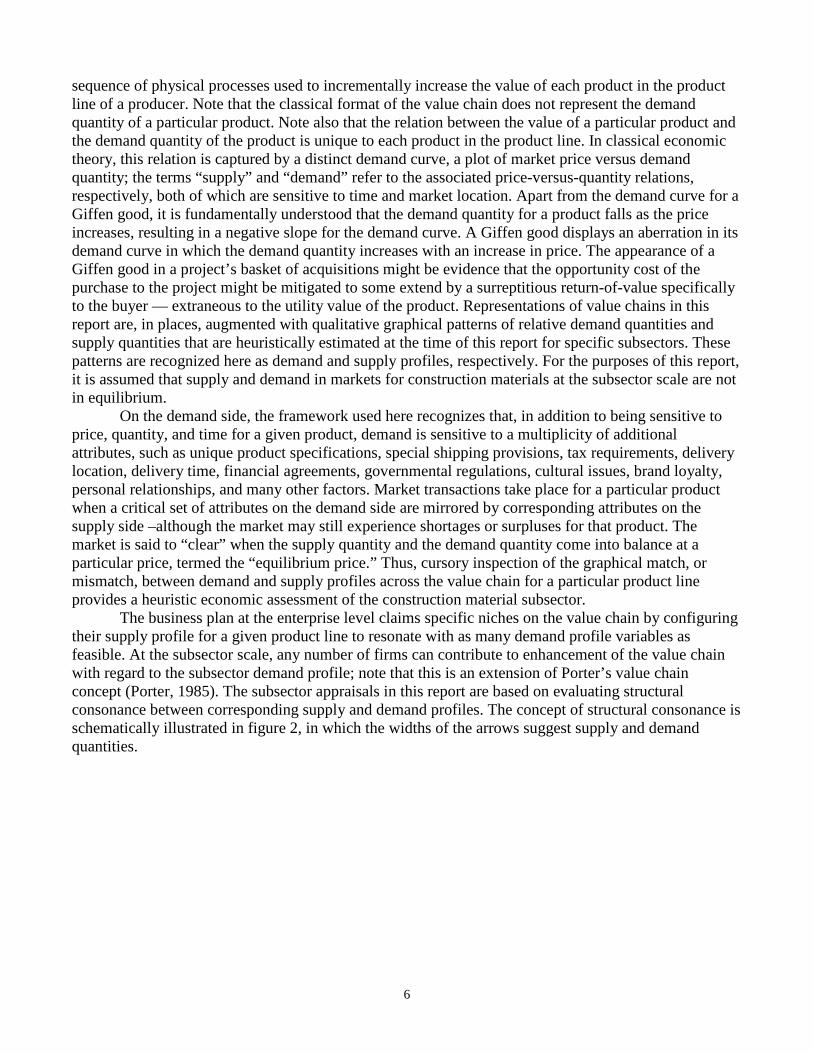
beneficiation will be economically profitable after value is added by changing the form and (or) location of the raw material, and after consideration of the cost of extraction, manufacturing, transportation, and market conditions. All successful businesses have a perspective on how their enterprises expect to increase the value of raw materials and how they will entice customers to pay for the product at a profitable price. As represented in figure 2, the value chain (Porter, 1985) conceptually represents the
6
sequence of physical processes used to incrementally increase the value of each product in the product line of a producer. Note that the classical format of the value chain does not represent the demand quantity of a particular product. Note also that the relation between the value of a particular product and the demand quantity of the product is unique to each product in the product line. In classical economic theory, this relation is captured by a distinct demand curve, a plot of market price versus demand quantity; the terms “supply” and “demand” refer to the associated price-versus-quantity relations, respectively, both of which are sensitive to time and market location. Apart from the demand curve for a Giffen good, it is fundamentally understood that the demand quantity for a product falls as the price increases, resulting in a negative slope for the demand curve. A Giffen good displays an aberration in its demand curve in which the demand quantity increases with an increase in price. The appearance of a Giffen good in a project’s basket of acquisitions might be evidence that the opportunity cost of the purchase to the project might be mitigated to some extend by a surreptitious return-of-value specifically to the buyer — extraneous to the utility value of the product. Representations of value chains in this report are, in places, augmented with qualitative graphical patterns of relative demand quantities and supply quantities that are heuristically estimated at the time of this report for specific subsectors. These patterns are recognized here as demand and supply profiles, respectively. For the purposes of this report, it is assumed that supply and demand in markets for construction materials at the subsector scale are not in equilibrium.
On the demand side, the framework used here recognizes that, in addition to being sensitive to price, quantity, and time for a given product, demand is sensitive to a multiplicity of additional attributes, such as unique product specifications, special shipping provisions, tax requirements, delivery location, delivery time, financial agreements, governmental regulations, cultural issues, brand loyalty, personal relationships, and many other factors. Market transactions take place for a particular product when a critical set of attributes on the demand side are mirrored by corresponding attributes on the supply side –although the market may still experience shortages or surpluses for that product. The market is said to “clear” when the supply quantity and the demand quantity come into balance at a particular price, termed the “equilibrium price.” Thus, cursory inspection of the graphical match, or mismatch, between demand and supply profiles across the value chain for a particular product line provides a heuristic economic assessment of the construction material subsector.
The business plan at the enterprise level claims specific niches on the value chain by configuring their supply profile for a given product line to resonate with as many demand profile variables as feasible. At the subsector scale, any number of firms can contribute to enhancement of the value chain with regard to the subsector demand profile; note that this is an extension of Porter’s value chain concept (Porter, 1985). The subsector appraisals in this report are based on evaluating structural consonance between corresponding supply and demand profiles. The concept of structural consonance is schematically illustrated in figure 2, in which the widths of the arrows suggest supply and demand quantities.
7
Figure 2. Illustration showing a schematic representation of a hypothetical value chain showing Venn sets of supply and demand attributes. The illustration suggests that the attributes of the supply profile mirror those of the demand profile for a relatively small set of supply and demand attributes, thus clearing the market only at production step C. The widths of the arrows suggest unit quantities in the supply and demand transactions.
Supply Chain
General Structure Although the value chain conceptually represents the relation between supply and demand
profiles for a given product line, the supply chain is the physical link between supply and demand in the marketplace. The supply chain and the value chain are tightly linked through the intersection of the familiar supply and demand curves. At the equilibrium point, the allocation of goods is at optimal efficiency because the quantity of goods supplied is matched by the quantity of goods consumed. Thus, the supply chain and the value chain for a particular product line collectively shape consumption, production capacity, delivery, and profitability across all scales of production—from the enterprise level to the subsector level.
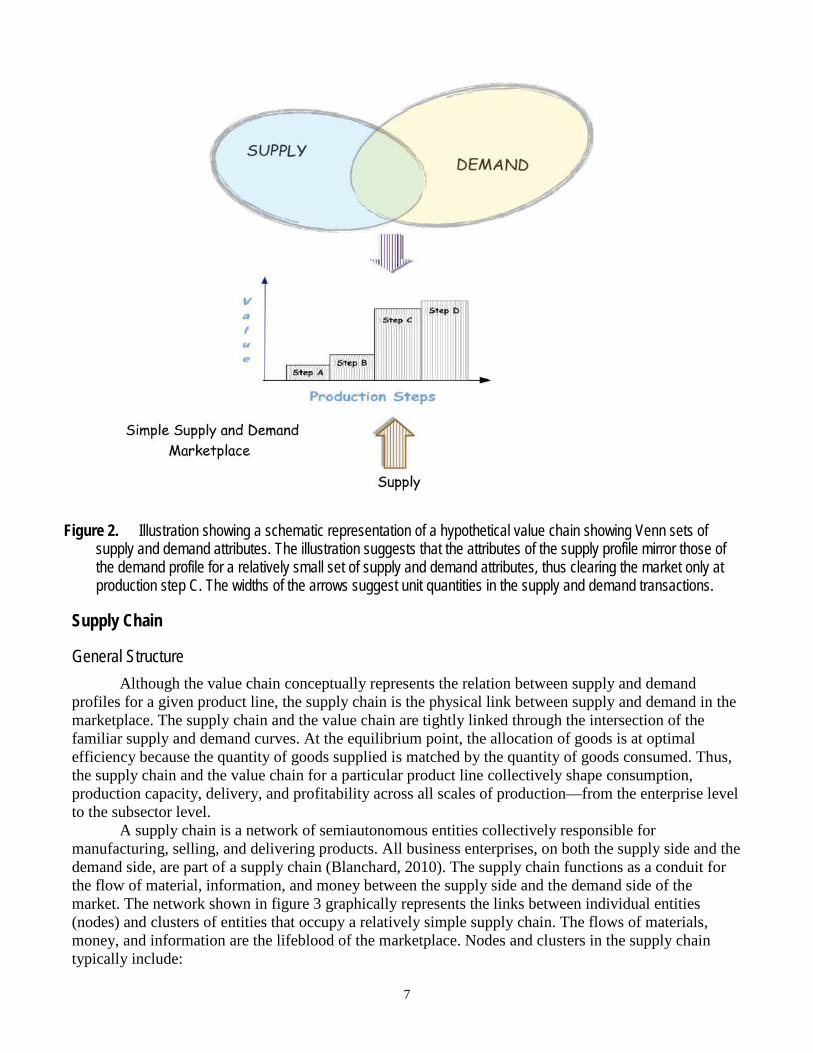
A supply chain is a network of semiautonomous entities collectively responsible for manufacturing, selling, and delivering products. All business enterprises, on both the supply side and the demand side, are part of a supply chain (Blanchard, 2010). The supply chain functions as a conduit for the flow of material, information, and money between the supply side and the demand side of the market. The network shown in figure 3 graphically represents the links between individual entities (nodes) and clusters of entities that occupy a relatively simple supply chain. The flows of materials, money, and information are the lifeblood of the marketplace. Nodes and clusters in the supply chain typically include:
8
• Sources of raw materials (extraction operations, agriculture), • Manufacturing facilities (mechanized factories, artisanal operations,), • Financial and transaction services (investors, currency dealers, banks), • Suppliers of manufactured goods (machinery, parts, lubricants), • Sources of market information (market research, business-support organizations), • Transport and storage services (freight forwarders, warehouses), • Support and regulatory organizations, • Wholesale and retail agents (brokers, distribution centers, retailers, customers, competitors).
Figure 3. Illustration showing an example supply chain network for Afghanistan.
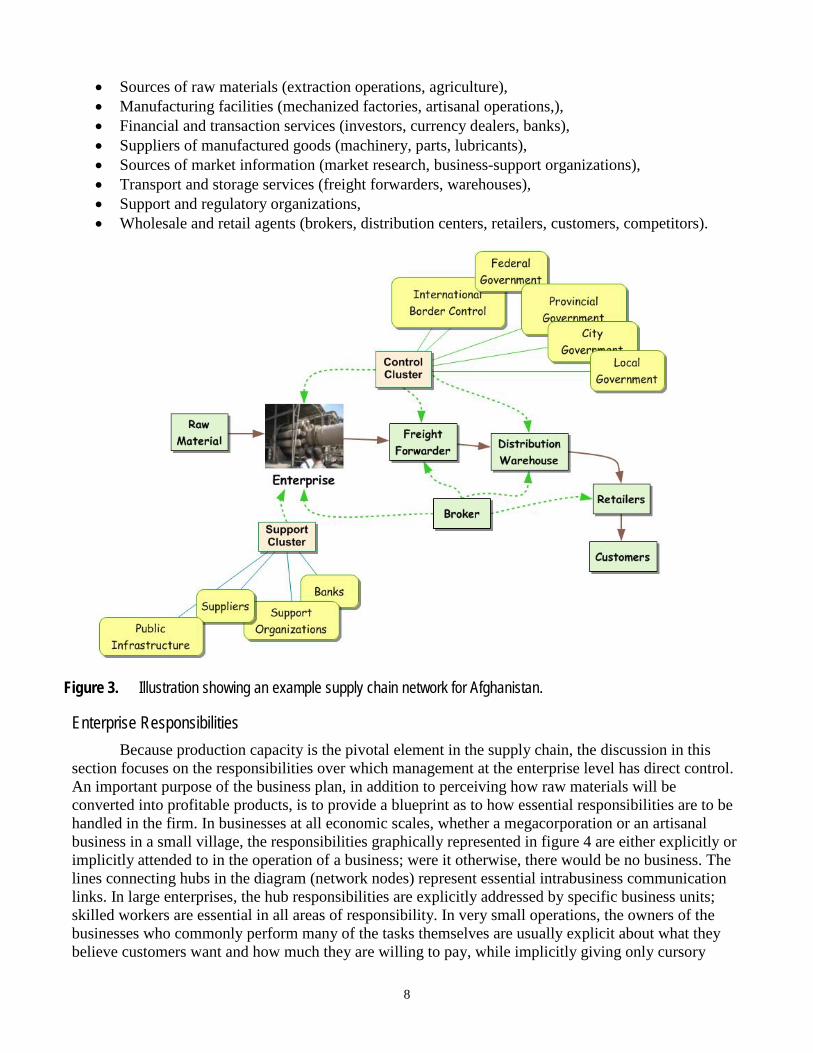
Enterprise Responsibilities Because production capacity is the pivotal element in the supply chain, the discussion in this
section focuses on the responsibilities over which management at the enterprise level has direct control. An important purpose of the business plan, in addition to perceiving how raw materials will be converted into profitable products, is to provide a blueprint as to how essential responsibilities are to be handled in the firm. In businesses at all economic scales, whether a megacorporation or an artisanal business in a small village, the responsibilities graphically represented in figure 4 are either explicitly or implicitly attended to in the operation of a business; were it otherwise, there would be no business. The lines connecting hubs in the diagram (network nodes) represent essential intrabusiness communication links. In large enterprises, the hub responsibilities are explicitly addressed by specific business units; skilled workers are essential in all areas of responsibility. In very small operations, the owners of the businesses who commonly perform many of the tasks themselves are usually explicit about what they believe customers want and how much they are willing to pay, while implicitly giving only cursory
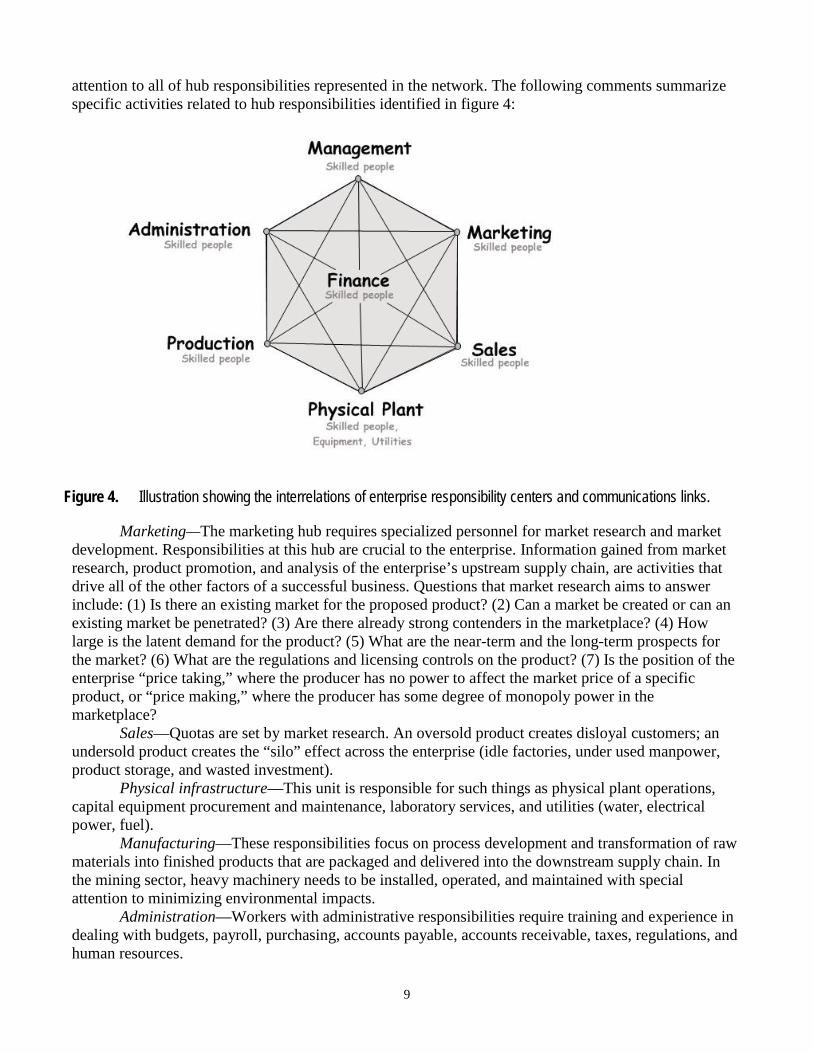
9
attention to all of hub responsibilities represented in the network. The following comments summarize specific activities related to hub responsibilities identified in figure 4:
Figure 4. Illustration showing the interrelations of enterprise responsibility centers and communications links.
Marketing—The marketing hub requires specialized personnel for market research and market development. Responsibilities at this hub are crucial to the enterprise. Information gained from market research, product promotion, and analysis of the enterprise’s upstream supply chain, are activities that drive all of the other factors of a successful business. Questions that market research aims to answer include: (1) Is there an existing market for the proposed product? (2) Can a market be created or can an existing market be penetrated? (3) Are there already strong contenders in the marketplace? (4) How large is the latent demand for the product? (5) What are the near-term and the long-term prospects for the market? (6) What are the regulations and licensing controls on the product? (7) Is the position of the enterprise “price taking,” where the producer has no power to affect the market price of a specific product, or “price making,” where the producer has some degree of monopoly power in the marketplace?
Sales—Quotas are set by market research. An oversold product creates disloyal customers; an undersold product creates the “silo” effect across the enterprise (idle factories, under used manpower, product storage, and wasted investment).
Physical infrastructure—This unit is responsible for such things as physical plant operations, capital equipment procurement and maintenance, laboratory services, and utilities (water, electrical power, fuel).
Manufacturing—These responsibilities focus on process development and transformation of raw materials into finished products that are packaged and delivered into the downstream supply chain. In the mining sector, heavy machinery needs to be installed, operated, and maintained with special attention to minimizing environmental impacts.
Administration—Workers with administrative responsibilities require training and experience in dealing with budgets, payroll, purchasing, accounts payable, accounts receivable, taxes, regulations, and human resources.
10
Management—The management team is informed by continuous communications from marketing, administration, and finance in order to make strategic and tactical decisions on the operation of the enterprise. One of the chief responsibilities of management is oversight of the supply chain that the firm depends on for raw materials and for delivery of products to customers. In the mining sector, there are special nuances in the supply chain that need to be navigated on the input and output sides of the production operations related to transport of massive quantities of materials with relatively low unit value.
Finance—This hub is responsible for acquiring equity inputs, funding of working capital, and long-term finance. There are special challenges for finance in the mining sector because of extended periods of exploration without revenue, high capital investment for specialized equipment, cyclical revenue due to variable commodity prices, and planning for large expenses for environmental restoration at the end of operations at a given mining site.
Domestic Demand for Construction Materials Investment for Afghan infrastructure construction can be considered in seven broad categories:
• Military-related projects, • Afghanistan government projects, • Counterinsurgency-related construction projects, • ARTF physical infrastructure construction, • Private business construction (factories, offices, hotels, shops), • Private home construction (modern houses, villas), and • Private rural residential and farm structures (adobe brick).
Because the military, governmental, counterinsurgency, and ARTF construction projects
represented in categories 1–4 are generally very large projects, it is reasonable to assume that the demand profiles for construction materials in these categories are structurally similar in complexity and contour across the value chain. The aim of the analysis in this section is to discover the general structural features of the demand profiles common to such very large construction projects.
Inasmuch as market demand is actualized by funding, the view here is that the flow of funds through a typical large ARTF project can reveal the general features of the demand profile for similar large reconstruction projects. The most accessible and reliable data on the allocation of ARTF project funds for physical infrastructure reconstruction construction activities are available through The World Bank (WB). Table 6 lists a sampling of 18 infrastructure projects selected from the WB database of nearly 1,000 ARTF projects. These projects include reconstruction of roads, water resources, electrical power, and buildings. The Web addresses in table 6 are links to information on project maps, financials, procurement protocols, tenders, and project results. The World Bank serves as the hub for international funding of reconstruction projects in Afghanistan by pooling contributions from at least 33 donors into two main trust funds—the Law and Order Trust Fund for Afghanistan (LOTFA) and ARTF; of the two, only the ARTF provides funding for physical construction projects (ARTF, 2012, p. 45). ARTF coordinates project funding in conjunction with projects supported by the Asian Development Bank (ADB), the Islamic Development Bank (IDB), the United Nations Assistance Mission for Afghanistan (UNAMA), and the United Nations Development Program (UNDP) (The World Bank, 2007).
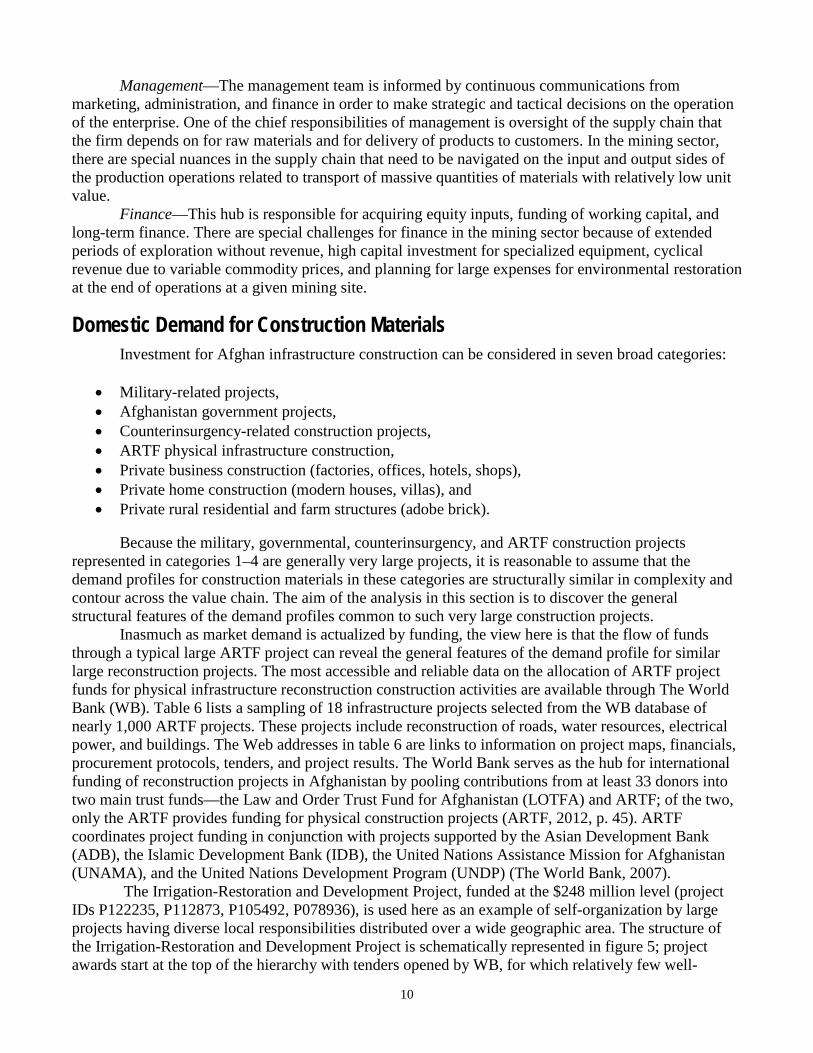
The Irrigation-Restoration and Development Project, funded at the $248 million level (project IDs P122235, P112873, P105492, P078936), is used here as an example of self-organization by large projects having diverse local responsibilities distributed over a wide geographic area. The structure of the Irrigation-Restoration and Development Project is schematically represented in figure 5; project awards start at the top of the hierarchy with tenders opened by WB, for which relatively few well-
11
capitalized contractors compete for large primary contracts. Project proposals are evaluated in collaboration with UNDP, UNAMA, IDB, and ADB. The approved proposals are then funneled from WB through ARTF to a variety of Afghanistan ministries for modification and authorization, including Ministry of Finance (MoF), Ministry of Rural Rehabilitation and Development (MRRD), Ministry of Mines and Petroleum (MoMP), and Ministry of Energy and Water (MEW). In keeping with their custodial responsibilities, the primary projects generally spawn a multiplicity of subprojects that, in turn, contract work to subcontractors. By relegating the physical aspects of restoration to local subprojects staffed by workers with knowledge of the local hydrology, agriculture, terrain, legacy facilities, and culture, the primary project can concentrate on management and guidance with a regional perspective. For the Irrigation-Restoration and Development Project, as of 2007, 842 irrigation subprojects have been approved, 432 irrigation subprojects have been awarded, and 288 irrigation subprojects are reported to have been completed.
Figure 5. Illustration showing flow of funds to the Afghanistan Irrigation-Restoration and Development Project and to related shovel-ready projects. DOD, U.S. Department of Defense; USAID, United States Agency for International Development; UNAMA, United Nations Assistance Mission for Afghanistan; UNDP, United Nations Development Program; WB, World Bank; ADB, Asian Development Bank; IDB, Islamic Development Bank; MoF, Ministry of Finance; MRRD, Ministry of Rural Rehabilitation and Development; MoMP, Ministry of Mines and Petroleum; MEW, Ministry of Energy and Water.
12
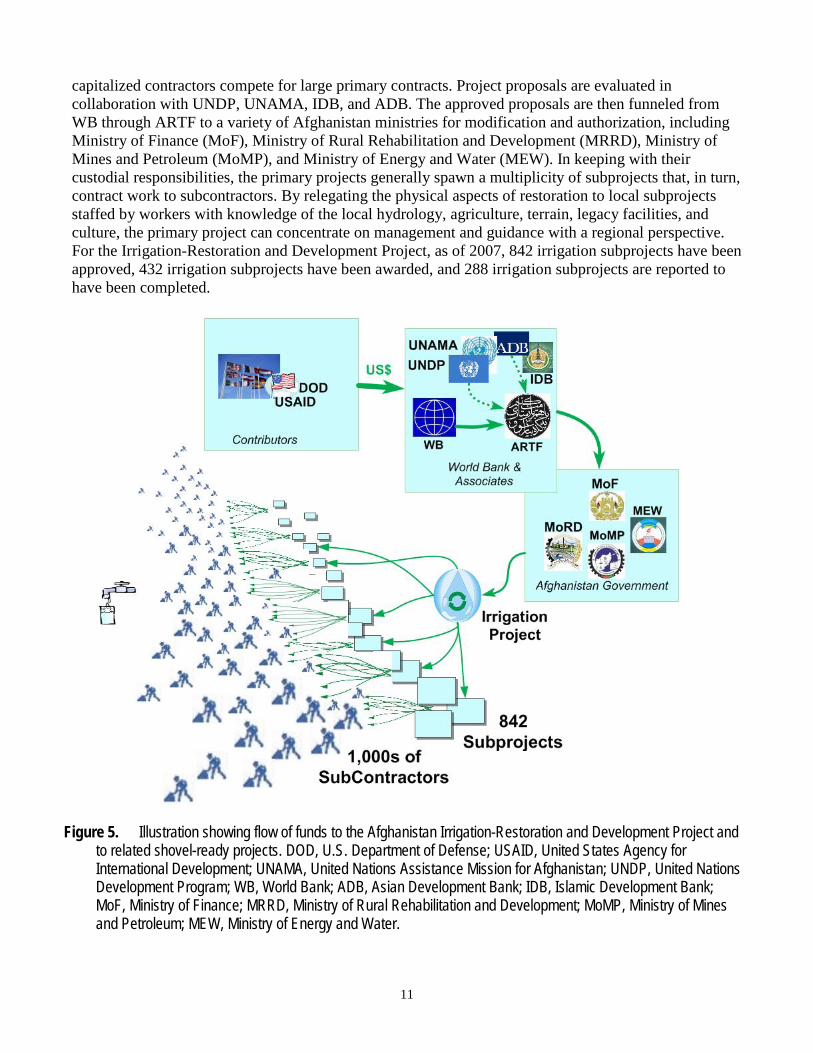
The project structure in figure 5 suggests that there is the potential for oligopsonic (few buyers) and oligopolistic (few sellers) conditions in the market flooded by project funding. For example, well-funded projects with geographically distributed responsibilities may be oligopsonic at the highest level where relatively few ministries control the allocation of funds to primary projects. Also at the top, well-capitalized contractors may be oligopolistic where relatively few contractors have the gravitas to compete for large primary contracts. In contrast, at the lowest subproject level, the multiplicity of contenders for contractors, and the availability of construction workers, depends on the market factors at specific locations. For example, narrowly focused subprojects may be subject to oligopolistic market conditions at locations with limited availability of technically prepared contractors. Insofar as procurement of construction materials and equipment is concerned, it can be expected that the concentrated purchasing power at the hierarchical top of a large project can be applied to a relatively small number of acquisitions at the upper end of the value chain (for example, large earth-moving machinery). At the mid-hierarchal levels, purchasing is more likely focused on limited quantities of fairly sophisticated equipment available at the mid-levels of the value chain. At the lowest subproject level, money for equipment will have been highly disseminated across a large number of contractors, leaving funds available mostly for basic tools and materials (shovels, cement).
Figure 6 shows a hypothetical value chain and demand profile that represents the requirements of a large project as discussed above (see fig. 5). A significant feature of the potential market represented in the demand profile depicted in figure 6 is the basic truncated power-law function (distribution) in the allocation of funds across the value chain. The statistical significance of such a distribution is that the mean value of demand is not well defined and the predictability of the market nearly impossible to gauge based on market data. As is shown in the next section, demand profiles are generally sharply focused on specific products produced by construction materials subsectors, yielding market metrics that are more reliable as predictors than are the demand profiles associated with large projects.
Figure 6. Illustration of hypothetical value-chain and demand-profile for project structure represented in figure 5. The widths of the arrows suggest demand quantities for a power law distribution along the value chain, in which case, there is relatively low unit demand for exceedingly costly equipment (cranes, earth movers), and increasing unit demand toward the lower end of the value chain.
13
Domestic Manufacturing of Construction Materials Products in demand for modern construction in Afghanistan include concrete and concrete block;
sand and gravel; asphalt, clay bricks; wood; steel and steel products; plumbing products; sanitary fixtures; dimension stone; and glass. An overview of the production of these materials from indigenous industrial minerals, and the relation of such production to current and potential demand, is addressed below. For this analysis, the degree of consonance between the supply and demand of products and services is assessed at the construction material subsector level. In this discussion, subsector is defined by the indigenous industrial minerals required for manufacturing of a given set of construction materials.
Clay for Residential Construction The most commonly used construction material for traditional structures, and perhaps the most
visible construction material in Afghanistan, is adobe brick; this ubiquitous material is used for houses, livestock enclosures, and village walls. These thick-walled mud-slacked structures provide substantial thermal mass, which helps to modulate interior temperatures by absorbing excess heat during the day and by slowly releasing heat at night. The USGS/Afghanistan Geological Survey (AGS) assessment team has identified three types of indigenous clay in Afghanistan—(1) porcelain clay, for ceramic products; (2) refractory clay, for linings for kilns and boilers; and (3) adobe clay, for sun-dried bricks for construction (Peters and others, 2011).
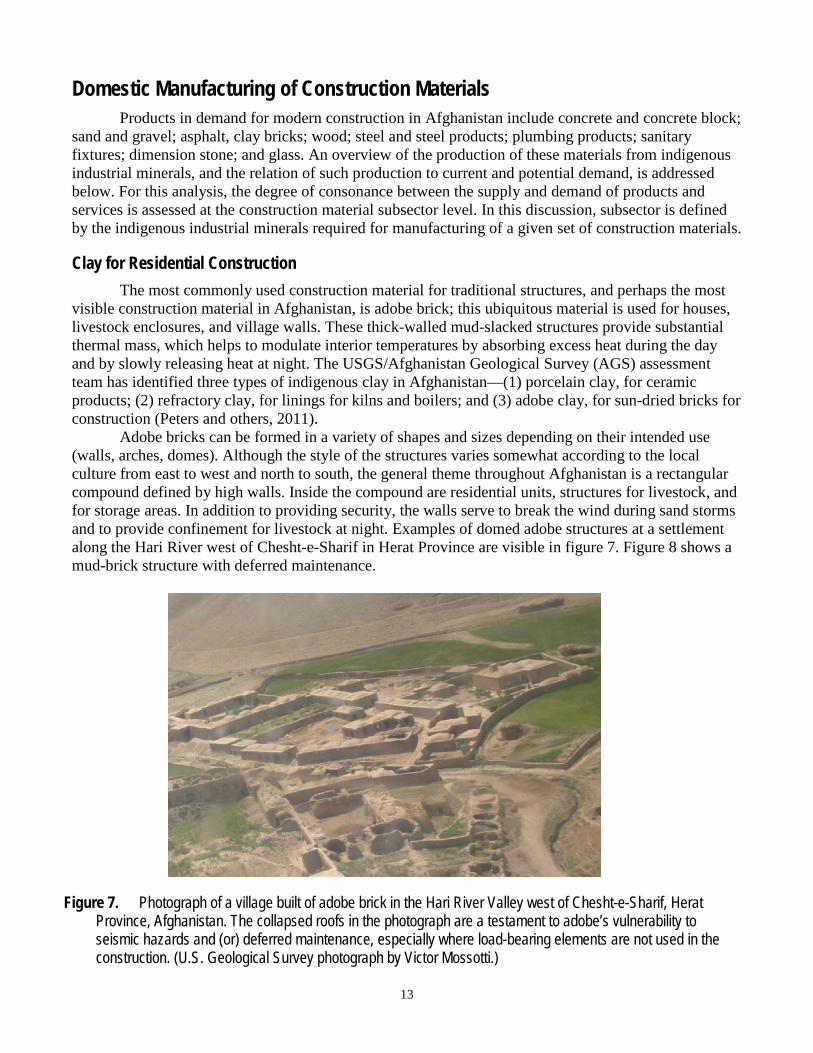
Adobe bricks can be formed in a variety of shapes and sizes depending on their intended use (walls, arches, domes). Although the style of the structures varies somewhat according to the local culture from east to west and north to south, the general theme throughout Afghanistan is a rectangular compound defined by high walls. Inside the compound are residential units, structures for livestock, and for storage areas. In addition to providing security, the walls serve to break the wind during sand storms and to provide confinement for livestock at night. Examples of domed adobe structures at a settlement along the Hari River west of Chesht-e-Sharif in Herat Province are visible in figure 7. Figure 8 shows a mud-brick structure with deferred maintenance.
Figure 7. Photograph of a village built of adobe brick in the Hari River Valley west of Chesht-e-Sharif, Herat Province, Afghanistan. The collapsed roofs in the photograph are a testament to adobe’s vulnerability to seismic hazards and (or) deferred maintenance, especially where load-bearing elements are not used in the construction. (U.S. Geological Survey photograph by Victor Mossotti.)
14
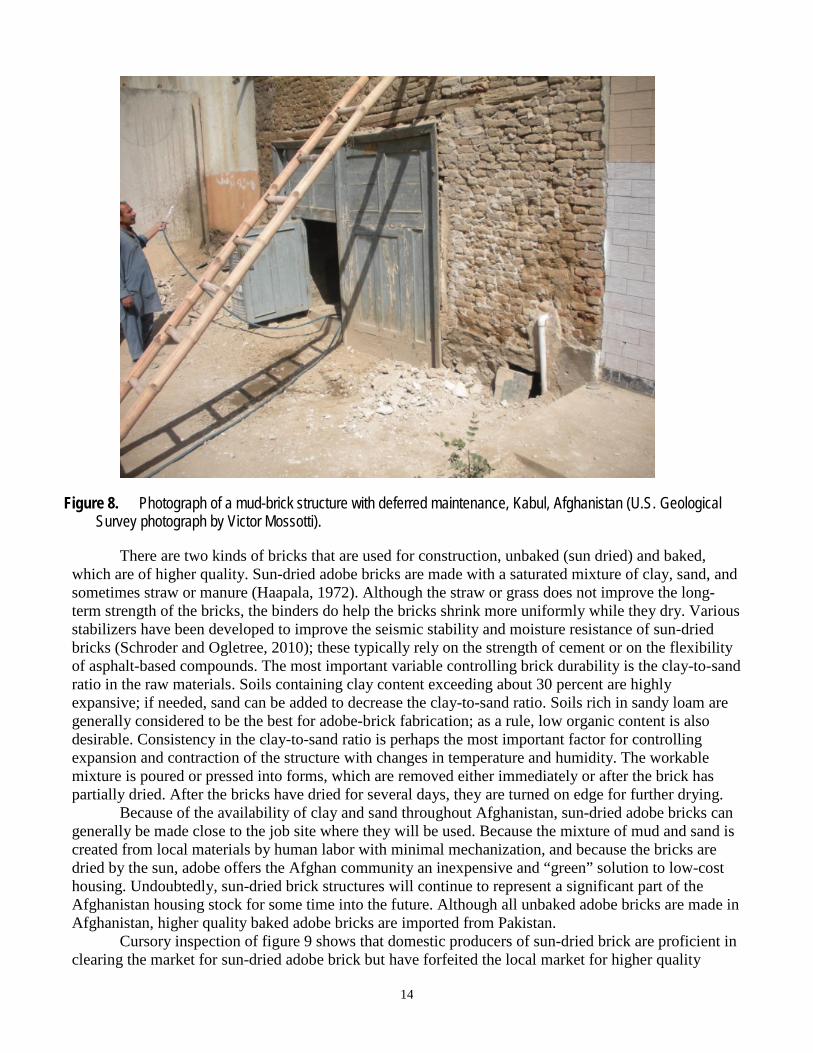
Figure 8. Photograph of a mud-brick structure with deferred maintenance, Kabul, Afghanistan (U.S. Geological Survey photograph by Victor Mossotti).
There are two kinds of bricks that are used for construction, unbaked (sun dried) and baked, which are of higher quality. Sun-dried adobe bricks are made with a saturated mixture of clay, sand, and sometimes straw or manure (Haapala, 1972). Although the straw or grass does not improve the long-term strength of the bricks, the binders do help the bricks shrink more uniformly while they dry. Various stabilizers have been developed to improve the seismic stability and moisture resistance of sun-dried bricks (Schroder and Ogletree, 2010); these typically rely on the strength of cement or on the flexibility of asphalt-based compounds. The most important variable controlling brick durability is the clay-to-sand ratio in the raw materials. Soils containing clay content exceeding about 30 percent are highly expansive; if needed, sand can be added to decrease the clay-to-sand ratio. Soils rich in sandy loam are generally considered to be the best for adobe-brick fabrication; as a rule, low organic content is also desirable. Consistency in the clay-to-sand ratio is perhaps the most important factor for controlling expansion and contraction of the structure with changes in temperature and humidity. The workable mixture is poured or pressed into forms, which are removed either immediately or after the brick has partially dried. After the bricks have dried for several days, they are turned on edge for further drying.
Because of the availability of clay and sand throughout Afghanistan, sun-dried adobe bricks can generally be made close to the job site where they will be used. Because the mixture of mud and sand is created from local materials by human labor with minimal mechanization, and because the bricks are dried by the sun, adobe offers the Afghan community an inexpensive and “green” solution to low-cost housing. Undoubtedly, sun-dried brick structures will continue to represent a significant part of the Afghanistan housing stock for some time into the future. Although all unbaked adobe bricks are made in Afghanistan, higher quality baked adobe bricks are imported from Pakistan.
Cursory inspection of figure 9 shows that domestic producers of sun-dried brick are proficient in clearing the market for sun-dried adobe brick but have forfeited the local market for higher quality
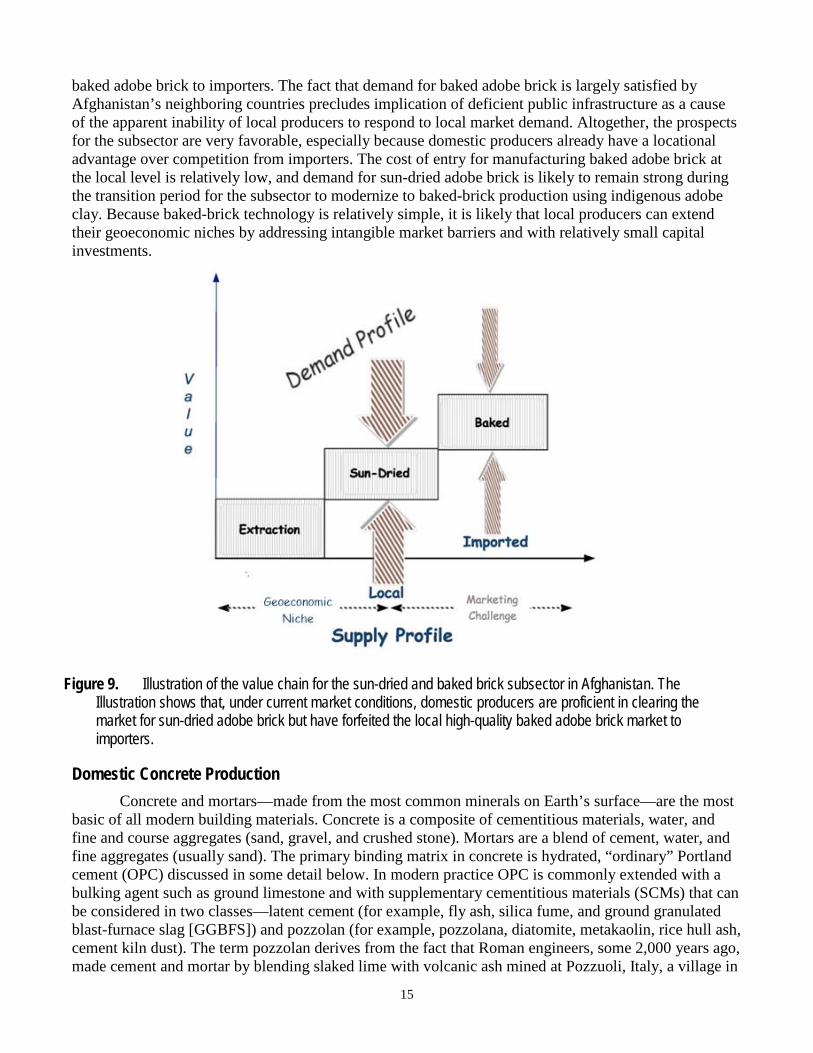
15
baked adobe brick to importers. The fact that demand for baked adobe brick is largely satisfied by Afghanistan’s neighboring countries precludes implication of deficient public infrastructure as a cause of the apparent inability of local producers to respond to local market demand. Altogether, the prospects for the subsector are very favorable, especially because domestic producers already have a locational advantage over competition from importers. The cost of entry for manufacturing baked adobe brick at the local level is relatively low, and demand for sun-dried adobe brick is likely to remain strong during the transition period for the subsector to modernize to baked-brick production using indigenous adobe clay. Because baked-brick technology is relatively simple, it is likely that local producers can extend their geoeconomic niches by addressing intangible market barriers and with relatively small capital investments.
Figure 9. Illustration of the value chain for the sun-dried and baked brick subsector in Afghanistan. The Illustration shows that, under current market conditions, domestic producers are proficient in clearing the market for sun-dried adobe brick but have forfeited the local high-quality baked adobe brick market to importers.
Domestic Concrete Production Concrete and mortars—made from the most common minerals on Earth’s surface—are the most
basic of all modern building materials. Concrete is a composite of cementitious materials, water, and fine and course aggregates (sand, gravel, and crushed stone). Mortars are a blend of cement, water, and fine aggregates (usually sand). The primary binding matrix in concrete is hydrated, “ordinary” Portland cement (OPC) discussed in some detail below. In modern practice OPC is commonly extended with a bulking agent such as ground limestone and with supplementary cementitious materials (SCMs) that can be considered in two classes—latent cement (for example, fly ash, silica fume, and ground granulated blast-furnace slag [GGBFS]) and pozzolan (for example, pozzolana, diatomite, metakaolin, rice hull ash, cement kiln dust). The term pozzolan derives from the fact that Roman engineers, some 2,000 years ago, made cement and mortar by blending slaked lime with volcanic ash mined at Pozzuoli, Italy, a village in
16
the shadow of Mount Vesuvius. To a large extent, all pozzolans, regardless of origin, have a vitreous surface layer at the micro scale (Ghiazza and others, 2009; Holland, 2005). Pozzolans referred to as pozzolana are recognized specifically as natural volcanic ash. ASTM (formerly known as the American Society for Testing and Materials) active standard ASTM C618 defines a pozzolan as siliceous or siliceous and aluminous material that in itself possesses little or no cementitious value but under suitable conditions can react chemically with calcium hydroxide at ordinary temperature to form compounds possessing hydraulic cementitious properties (Helmuth, 1987). The use of pozzolans in concrete has increased steadily, mainly outside of the United States, since the late 18th century in step with increases in the quantity of vitreous and other suitable byproducts spun off by industrial processes. For example, appreciable quantities of granulated iron slag and fly ash have been deployed as pozzolanic OPC-extender and sequestered in concrete structures across the developed world. Pozzolanic OPC can be optimized for the specific characteristics of the concrete application, where the beneficial features, as in table 7, depend on the OPC type and on the physical properties of pozzolanic materials in the blend. In Afghanistan, the role of pozzolans in the near term may be constrained because of the limited availability of slag and fly ash.
Because a wide variety of concrete recipes are tailored to specific applications, blended cement is traditionally compounded in separate batching facilities. At such plants, ready-mixed concrete is prepared from one of hundreds of recipes and loaded in concrete trucks. Ready-mixed refers to concrete that is ordered by the batch for delivery from a central plant instead of being mixed on the job site (ASTM, 2010). According to the Portland Cement Association, ready-mixed concrete is the most common form of concrete used in construction, accounting for at least three-fourths of all concrete at construction sites in the United States and in other bulk cement markets (USGS, 2010, p.38).
In batching facilities, SCMs are blended with OPC along with aggregate and water. The normal ratios of aggregate and water to cementitious material in the mix remains about the same as in the normal mix. Depending on the application, the slightest concrete-mixing mishap can render an entire batch of concrete useless. However, because ready-mixed concrete is batched in a factory using a specific formula, it reduces the instances and costs associated with bad concrete mixtures. Also, ready-mixed concrete eliminates the need for storage at the job site of bulk ingredients and equipment needed to mix concrete. The widespread availability of ready-mixed concrete allows concrete finishers to do their jobs faster because they don't have the added task of mixing concrete. Ready-mixed concrete can be used for both residential and commercial purposes. Once the ready-mix concrete is ordered, the mixture is prepared and delivered to the job site. Of course, the ready-mixed concrete truck needs to reach the construction site in time for the workers to use the concrete before it sets, or worse, hardens. Homeowners and concrete finishers can also purchase dry premixed concrete in 40 to 80 pound bags. Because ingredients in the bagged premixed concrete are already measured, all that is needed to complete the mixture is water. Appendix 2 lists 40 ASTM standards for ready-mixed concrete (ASTM, 2010).
In large metropolitan areas blanketed with networks of good roads and with a high density of construction jobs, contemporary cement plants may vertically integrate by adding batching facilities in the output spaces of such plants (U.S. Department of Transportation, 1990). Cement plants are generally prepared to operate high-quality batching operations because of their superior personnel, facilities, and experience with sophisticated chemical analysis methods. In Afghanistan, it is reasonable to expect that batching facilities will be scattered some distance from cement plants, at least until the infrastructure for rapid bulk transport is further developed.
Sand and Gravel for Making Concrete In most developed countries, sand and gravel (aggregate) is the construction material greatest in
demand, leading that of cement by at least a factor of ten. Sand and gravel are integral components of
17
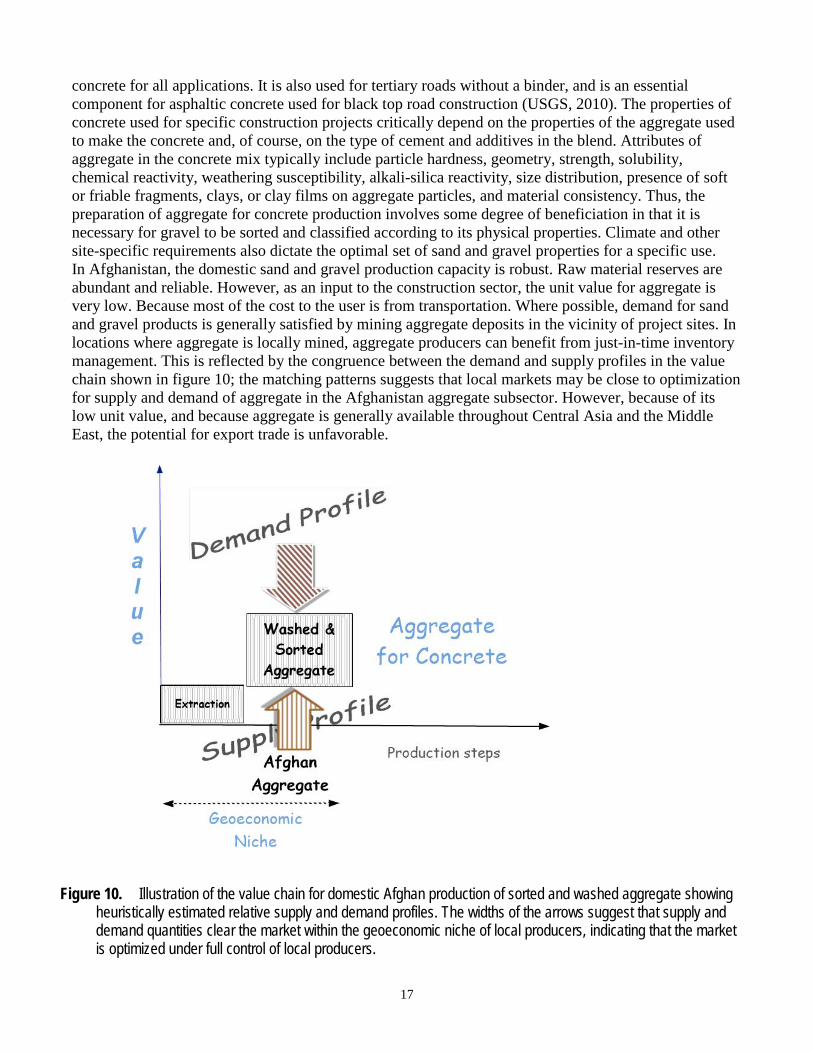
concrete for all applications. It is also used for tertiary roads without a binder, and is an essential component for asphaltic concrete used for black top road construction (USGS, 2010). The properties of concrete used for specific construction projects critically depend on the properties of the aggregate used to make the concrete and, of course, on the type of cement and additives in the blend. Attributes of aggregate in the concrete mix typically include particle hardness, geometry, strength, solubility, chemical reactivity, weathering susceptibility, alkali-silica reactivity, size distribution, presence of soft or friable fragments, clays, or clay films on aggregate particles, and material consistency. Thus, the preparation of aggregate for concrete production involves some degree of beneficiation in that it is necessary for gravel to be sorted and classified according to its physical properties. Climate and other site-specific requirements also dictate the optimal set of sand and gravel properties for a specific use. In Afghanistan, the domestic sand and gravel production capacity is robust. Raw material reserves are abundant and reliable. However, as an input to the construction sector, the unit value for aggregate is very low. Because most of the cost to the user is from transportation. Where possible, demand for sand and gravel products is generally satisfied by mining aggregate deposits in the vicinity of project sites. In locations where aggregate is locally mined, aggregate producers can benefit from just-in-time inventory management. This is reflected by the congruence between the demand and supply profiles in the value chain shown in figure 10; the matching patterns suggests that local markets may be close to optimization for supply and demand of aggregate in the Afghanistan aggregate subsector. However, because of its low unit value, and because aggregate is generally available throughout Central Asia and the Middle East, the potential for export trade is unfavorable.
Figure 10. Illustration of the value chain for domestic Afghan production of sorted and washed aggregate showing heuristically estimated relative supply and demand profiles. The widths of the arrows suggest that supply and demand quantities clear the market within the geoeconomic niche of local producers, indicating that the market is optimized under full control of local producers.
18
Of the various deposit models for sand and gravel (Bliss and Page, 1994), the comprehensive quantitative assessment by the USGS focuses on the most extractable sand and gravel resources in Afghanistan (Bliss and Bolm, 2007). Extraction of unconsolidated aggregate is the most expeditious by any measure when compared to the production of aggregate by crushing bedrock. Accordingly, the Bliss and Bolm (2007) assessment concentrated on unconsolidated surficial fluvial sand and gravel along rivers and streams and on such resources on alluvial fans.
Cement for Making Concrete The mineralized content of finished OPC is highly sensitive to the chemical makeup of the raw
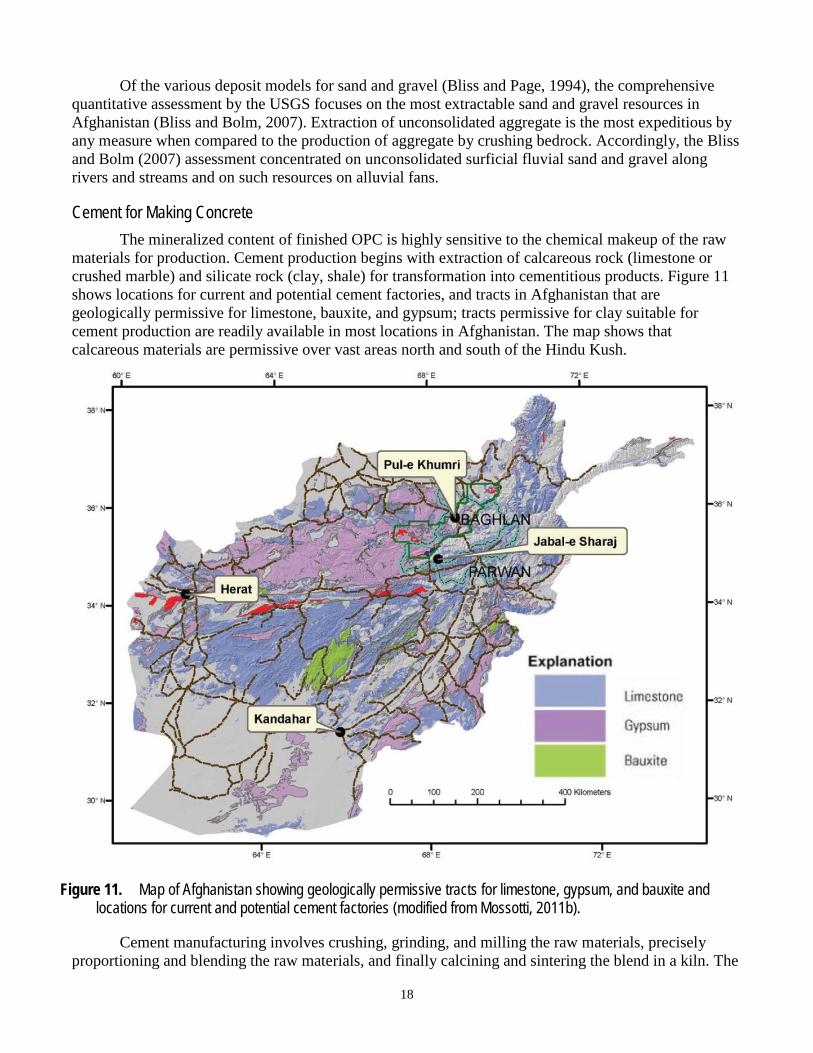
materials for production. Cement production begins with extraction of calcareous rock (limestone or crushed marble) and silicate rock (clay, shale) for transformation into cementitious products. Figure 11 shows locations for current and potential cement factories, and tracts in Afghanistan that are geologically permissive for limestone, bauxite, and gypsum; tracts permissive for clay suitable for cement production are readily available in most locations in Afghanistan. The map shows that calcareous materials are permissive over vast areas north and south of the Hindu Kush.
Figure 11. Map of Afghanistan showing geologically permissive tracts for limestone, gypsum, and bauxite and locations for current and potential cement factories (modified from Mossotti, 2011b).
Cement manufacturing involves crushing, grinding, and milling the raw materials, precisely proportioning and blending the raw materials, and finally calcining and sintering the blend in a kiln. The
19
product from the kiln, called clinker, can either be stored for later processing or sale or can be directly milled with additives for sale as cement. Two options, either “wet” or “dry,” are available for homogenizing the raw materials; for both processes, the raw materials are crushed to softball size at the point of extraction before being transported to the plant. In the dry process, the raw materials are comminuted in accordance with a standardized particle-size distribution, proportioned, and dry blended with dynamic correction of the mineral proportions. In the wet method, a properly proportioned mix is prepared in a batch process by first mixing the silicate minerals (clays) with water in a holding facility (wash mill) and proportioning the kiln meal by blending and grinding the clay slurry with the calcareous materials and with additional water. In some respects, the wet process is simpler to engineer and provides superior homogenization relative to the dry process. However, as expected, the wet process requires much more energy and a longer, heaver kiln than the dry process—mainly for water evaporation. After undergoing sintering in the lower third of the kiln near the flame (1,800–2,000 degrees Celsius, °C), the clicker nodules, ranging between 0.5–10 centimeters (cm), are cooled at the output of the kiln. The clinker can either be stored temporarily in a clinker silo, or it can pass directly to the cement-finishing mill. The cement mill grinds the clinker to a fine powder, usually with the addition of 1–5 percent of gypsum. The gypsum controls the setting properties of the cement when water is added.
Basic Cement Chemistry The manufacture of clinker for OPC requires meticulous chemical transformation of a precisely
proportioned blend of calcium carbonate (CaCO3), silica (SiO2), alumina (Al2O3), and ferric oxide (Fe2O3). Optimization of the stoichiometry of the high-temperature solid-state chemical reactions is essential for the manufacture of the desired cementitious mineral phases in the clinker. Limestone and clay are the prime sources for calcium carbonate and silica, respectively. Bauxite is often used to adjust the Al2O3 content of the blend fed to the kiln. In some plants, small quantities of fluorite are used to lower the melting point of the blend and to promote clinker mineralization, especially in plants outside the United States. Clinker quality is primarily judged by the hydraulic performance of the cement made from the clinker. Important properties include hydration rates, heat of hydration, strength development over time, and durability in specific applications; setting characteristics are mainly controlled by the addition of gypsum (CaSO4•2H2O) in the clinker milling step in the conversion of clinker into cement products.
Because the manufacture of clinker from raw materials requires a series of solid-state chemical transformations (sintering), the raw materials must be finely ground and homogenized to provide large surface areas in close physical contact. The first stage of chemical transformation is calcination, where the CaCO3 in the blend dissociates over the temperature range 720–1,000 °C (van Oss, 2005) to form reactive CaO (free lime). After the blend of minerals is preheated in route to a precalciner or kiln, the blend is exposed to increasingly elevated temperatures while moving down a rotary kiln. After calcination, free lime, silica, and mineral phases in solid solution react to form an entirely new set of hydraulic silicate minerals; this set is represented by four primary clinker phases, which include tricalcium silicate ((CaO)3•SiO2) or alite; dicalcium silicate ((CaO)2•SiO2, or belite; tricalcium aluminate ((CaO)3•Al2O3); and tetracalciumaluminoferrite ((CaO)4•Al2O3•Fe2O3). It should be noted that these primary mineral phases are mineralogical approximations to the actual compositions of clinker minerals. This is because the structure of each primary phase can vary to the extent that the primary minerals become infused with minor components with which they coexist in solid solution.
To facilitate cement-chemistry dialog, cement chemists worldwide have adopted a standard notation for the common oxides found in cement. This cement chemistry notation (CCN) exploits the fact that most of the elements are present in their highest oxidation state and that chemical analyses of cement are expressed as mass percent of these oxides; the CCN notation system is summarized in table 8
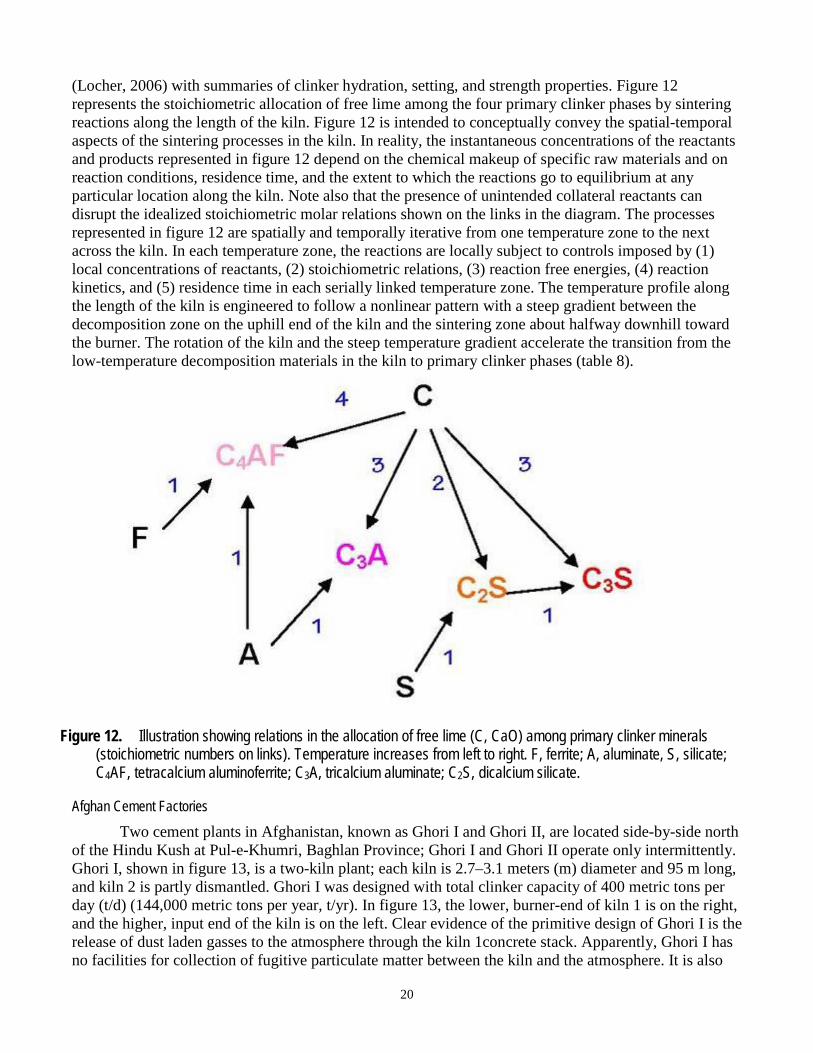
20
(Locher, 2006) with summaries of clinker hydration, setting, and strength properties. Figure 12 represents the stoichiometric allocation of free lime among the four primary clinker phases by sintering reactions along the length of the kiln. Figure 12 is intended to conceptually convey the spatial-temporal aspects of the sintering processes in the kiln. In reality, the instantaneous concentrations of the reactants and products represented in figure 12 depend on the chemical makeup of specific raw materials and on reaction conditions, residence time, and the extent to which the reactions go to equilibrium at any particular location along the kiln. Note also that the presence of unintended collateral reactants can disrupt the idealized stoichiometric molar relations shown on the links in the diagram. The processes represented in figure 12 are spatially and temporally iterative from one temperature zone to the next across the kiln. In each temperature zone, the reactions are locally subject to controls imposed by (1) local concentrations of reactants, (2) stoichiometric relations, (3) reaction free energies, (4) reaction kinetics, and (5) residence time in each serially linked temperature zone. The temperature profile along the length of the kiln is engineered to follow a nonlinear pattern with a steep gradient between the decomposition zone on the uphill end of the kiln and the sintering zone about halfway downhill toward the burner. The rotation of the kiln and the steep temperature gradient accelerate the transition from the low-temperature decomposition materials in the kiln to primary clinker phases (table 8).
Figure 12. Illustration showing relations in the allocation of free lime (C, CaO) among primary clinker minerals (stoichiometric numbers on links). Temperature increases from left to right. F, ferrite; A, aluminate, S, silicate; C4AF, tetracalcium aluminoferrite; C3A, tricalcium aluminate; C2S, dicalcium silicate.
Afghan Cement Factories Two cement plants in Afghanistan, known as Ghori I and Ghori II, are located side-by-side north
of the Hindu Kush at Pul-e-Khumri, Baghlan Province; Ghori I and Ghori II operate only intermittently. Ghori I, shown in figure 13, is a two-kiln plant; each kiln is 2.7–3.1 meters (m) diameter and 95 m long, and kiln 2 is partly dismantled. Ghori I was designed with total clinker capacity of 400 metric tons per day (t/d) (144,000 metric tons per year, t/yr). In figure 13, the lower, burner-end of kiln 1 is on the right, and the higher, input end of the kiln is on the left. Clear evidence of the primitive design of Ghori I is the release of dust laden gasses to the atmosphere through the kiln 1concrete stack. Apparently, Ghori I has no facilities for collection of fugitive particulate matter between the kiln and the atmosphere. It is also
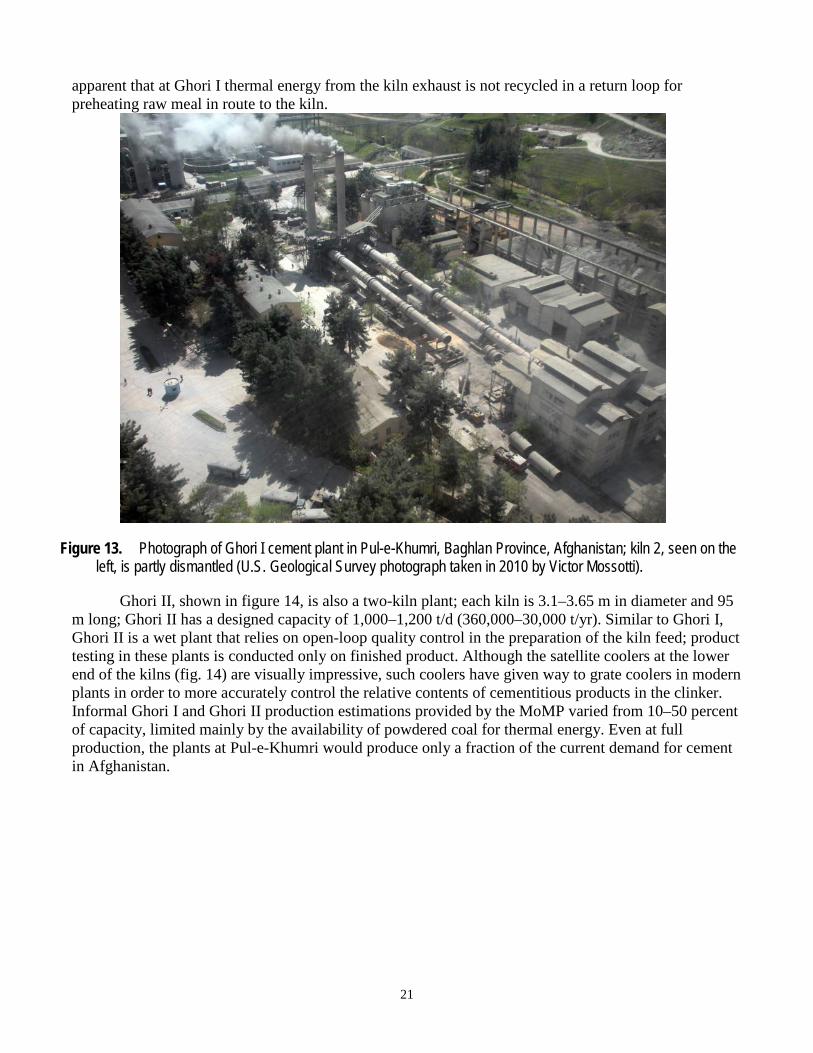
21
apparent that at Ghori I thermal energy from the kiln exhaust is not recycled in a return loop for preheating raw meal in route to the kiln.
Figure 13. Photograph of Ghori I cement plant in Pul-e-Khumri, Baghlan Province, Afghanistan; kiln 2, seen on the left, is partly dismantled (U.S. Geological Survey photograph taken in 2010 by Victor Mossotti).
Ghori II, shown in figure 14, is also a two-kiln plant; each kiln is 3.1–3.65 m in diameter and 95 m long; Ghori II has a designed capacity of 1,000–1,200 t/d (360,000–30,000 t/yr). Similar to Ghori I, Ghori II is a wet plant that relies on open-loop quality control in the preparation of the kiln feed; product testing in these plants is conducted only on finished product. Although the satellite coolers at the lower end of the kilns (fig. 14) are visually impressive, such coolers have given way to grate coolers in modern plants in order to more accurately control the relative contents of cementitious products in the clinker. Informal Ghori I and Ghori II production estimations provided by the MoMP varied from 10–50 percent of capacity, limited mainly by the availability of powdered coal for thermal energy. Even at full production, the plants at Pul-e-Khumri would produce only a fraction of the current demand for cement in Afghanistan.
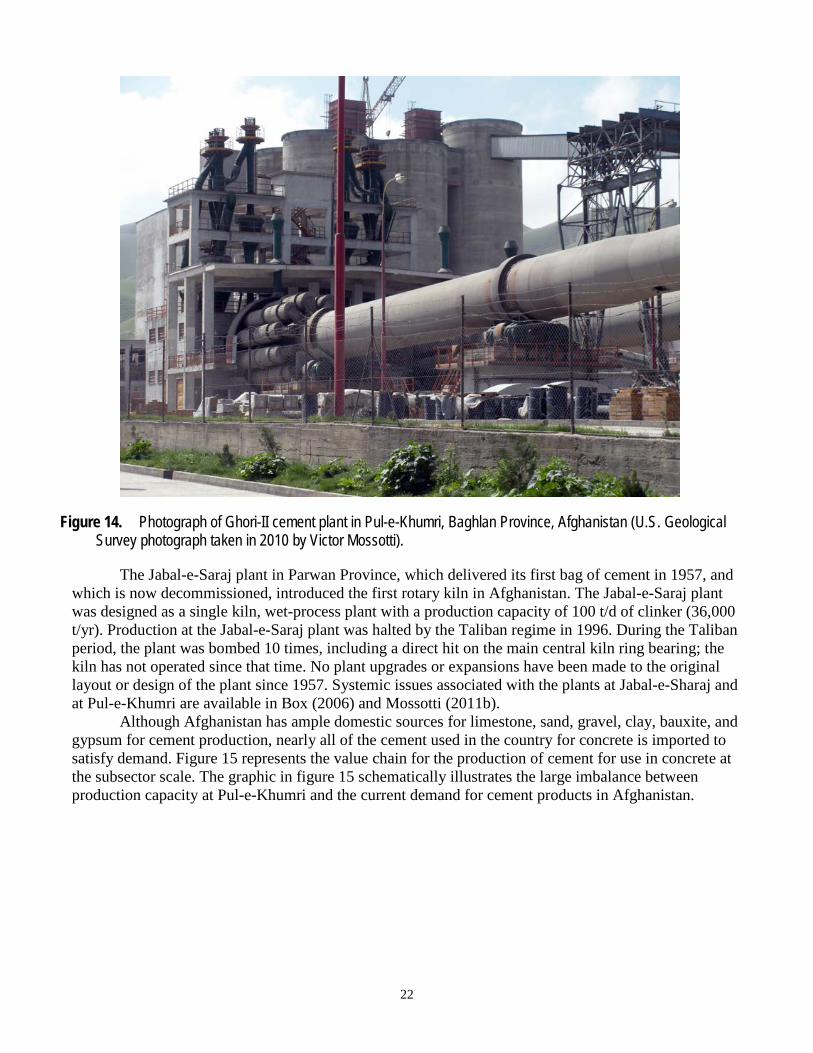
22
Figure 14. Photograph of Ghori-II cement plant in Pul-e-Khumri, Baghlan Province, Afghanistan (U.S. Geological Survey photograph taken in 2010 by Victor Mossotti).
The Jabal-e-Saraj plant in Parwan Province, which delivered its first bag of cement in 1957, and which is now decommissioned, introduced the first rotary kiln in Afghanistan. The Jabal-e-Saraj plant was designed as a single kiln, wet-process plant with a production capacity of 100 t/d of clinker (36,000 t/yr). Production at the Jabal-e-Saraj plant was halted by the Taliban regime in 1996. During the Taliban period, the plant was bombed 10 times, including a direct hit on the main central kiln ring bearing; the kiln has not operated since that time. No plant upgrades or expansions have been made to the original layout or design of the plant since 1957. Systemic issues associated with the plants at Jabal-e-Sharaj and at Pul-e-Khumri are available in Box (2006) and Mossotti (2011b).
Although Afghanistan has ample domestic sources for limestone, sand, gravel, clay, bauxite, and gypsum for cement production, nearly all of the cement used in the country for concrete is imported to satisfy demand. Figure 15 represents the value chain for the production of cement for use in concrete at the subsector scale. The graphic in figure 15 schematically illustrates the large imbalance between production capacity at Pul-e-Khumri and the current demand for cement products in Afghanistan.
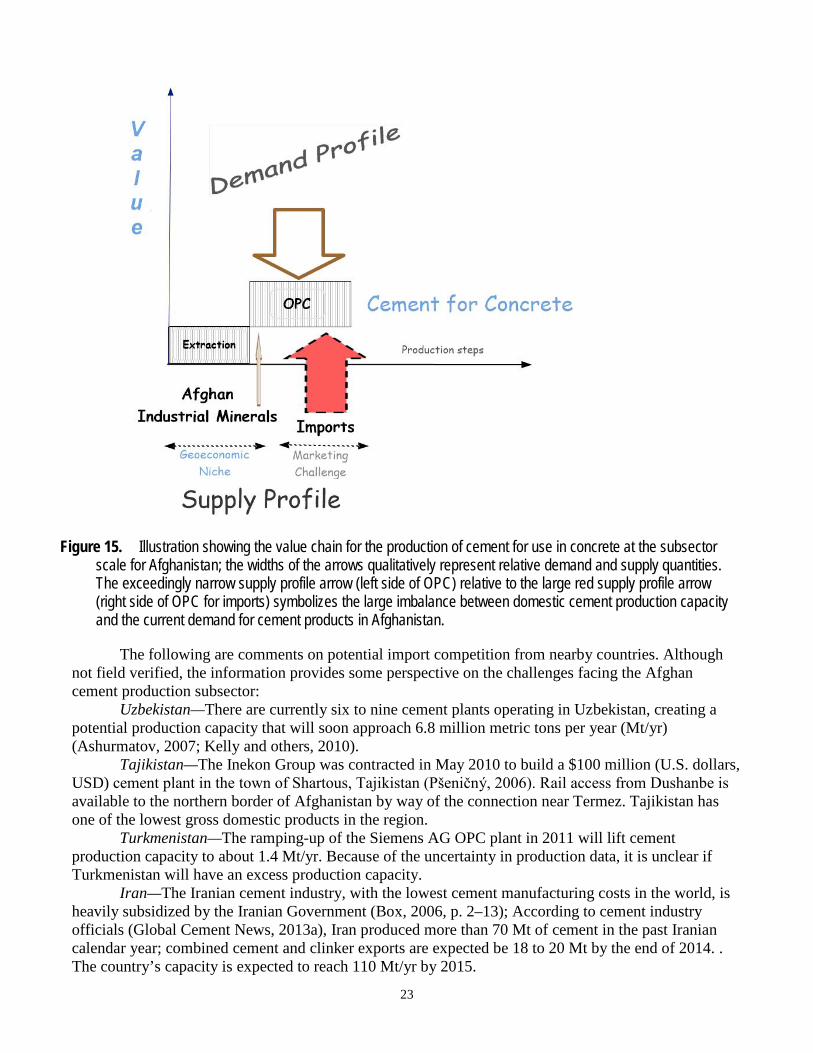
23
Figure 15. Illustration showing the value chain for the production of cement for use in concrete at the subsector scale for Afghanistan; the widths of the arrows qualitatively represent relative demand and supply quantities. The exceedingly narrow supply profile arrow (left side of OPC) relative to the large red supply profile arrow (right side of OPC for imports) symbolizes the large imbalance between domestic cement production capacity and the current demand for cement products in Afghanistan.
The following are comments on potential import competition from nearby countries. Although not field verified, the information provides some perspective on the challenges facing the Afghan cement production subsector:
Uzbekistan—There are currently six to nine cement plants operating in Uzbekistan, creating a potential production capacity that will soon approach 6.8 million metric tons per year (Mt/yr) (Ashurmatov, 2007; Kelly and others, 2010).
Tajikistan—The Inekon Group was contracted in May 2010 to build a $100 million (U.S. dollars, USD) cement plant in the town of Shartous, Tajikistan (Pšeničný, 2006). Rail access from Dushanbe is available to the northern border of Afghanistan by way of the connection near Termez. Tajikistan has one of the lowest gross domestic products in the region.
Turkmenistan—The ramping-up of the Siemens AG OPC plant in 2011 will lift cement production capacity to about 1.4 Mt/yr. Because of the uncertainty in production data, it is unclear if Turkmenistan will have an excess production capacity.
Iran—The Iranian cement industry, with the lowest cement manufacturing costs in the world, is heavily subsidized by the Iranian Government (Box, 2006, p. 2–13); According to cement industry officials (Global Cement News, 2013a), Iran produced more than 70 Mt of cement in the past Iranian calendar year; combined cement and clinker exports are expected be 18 to 20 Mt by the end of 2014. . The country’s capacity is expected to reach 110 Mt/yr by 2015.
24
Pakistan—Domestic cement sales in Pakistan reached 25.1 Mt in 2012–13. Overall, the industry produced 33.4 Mt of cement in 2012–13 year, with 8.3 Mt exported (Global Cement News, 2013b). For the most part, Pakistan cement plants are modern and efficient, making them cost competitive. Cement produced in northern Punjab Province and Khyber Pakhtunkhwa Province is exported to Afghanistan principally along the Peshawar-Jalalabad highway using Torkham as the port of entry. Torkham is a border town located on the Durand Line on the eastern edge of Afghanistan’s Nangarhar Province. Torkham is the busiest port of entry between Afghanistan and Pakistan. Pakistan cement exports also come into Afghanistan from the southern Provinces of Balochistan and Sindh through Chaman, a town situated in Pakistan just south of the Afghanistan town of Spin Boldak in the Province of Kandahar. Pakistani OPC dominates the cement markets in Kabul and Kandahar (Box, 2006, p. 2–10). Pakistan cement is even competitive with imports from Afghanistan’s neighbors north of the Hindu Kush, which must be trucked through the Salang Tunnel (Box, 2006, p. 2–10). Analysts recently reported that Pakistan exported 4.7 million tons to Afghanistan during 2010–11 and 2.5 million tons during the first half of 2011–12, capturing almost the entire Afghan market, apart from some overflow demand met by Iran (Hussain, 2012).
Cement production in Afghanistan cannot compete with imported products without modernizing facilities at Pul-e-Khumri and by expanding domestic capacity with a number of greenfield plants. It is notable that on September 22, 2013, greenfield plants were tendered by MoMP in Pul-e-Khumri, Jabal-e-Saraj, and Herat (MoMP, 2013, http://www.afghancementtenders.com/jabal-saraj-tender.html). The goal for the three greenfield plants is to provide domestically produced cement for the Afghan construction materials markets north and south of the Hindu Kush and to the west in Herat and neighboring Provinces. Because of their locational advantage, Afghan cement producers may eventually be able to successfully compete in the Afghan domestic market. However, because it is expected that there will be freedom of entry to the market, competition from Afghanistan‘s neighbors will be intense. Comparable cement products will be traded in a market with many sellers and buyers in such a marketplace, no individual entity will be able to affect prices.
Raw Materials The use of the word “ordinary” to describe OPC understates and diminishes the complexity and
importance of the building material that literally provides for the physical foundation of civilization. As an ordinary building material, OPC is the crucial binder for the conversion of awkward, erratically shaped, rocky raw materials into new rocks that are precisely tailored for shape, dimension, and strength for use in thousands of applications in the world. The value chain for cement production in figure 16 provides perspective on the geoeconomic niche currently occupied by the cement raw material subsector and on synergetic relation between the ordinary raw materials required for production of clinker and OPC — limestone, clay, bauxite, and gypsum. As represented in figure 16, the value chains for limestone, clay, and bauxite for cement production are conflated as a group. This is because the blending step in the preparation of the meal for the kiln begins essentially at the point of extraction of the raw materials. No separately identifiable products are brought to market until clinker is produced; gypsum is blended with clinker at the final step of OPM production. It follows that the geoeconomic niches for the raw materials are, in every respect, are identical with the geoeconomic niche filled by the domestic cement manufacturing subsector. The value added to the raw materials is the consequence of the chemical synergy of the of the materials as rendered by the knowledge, skills, and abilities of the people associated with the activities of the enterprise, the quality of the infrastructure, and the thermal and electrical energy used for the manufacturing processes.
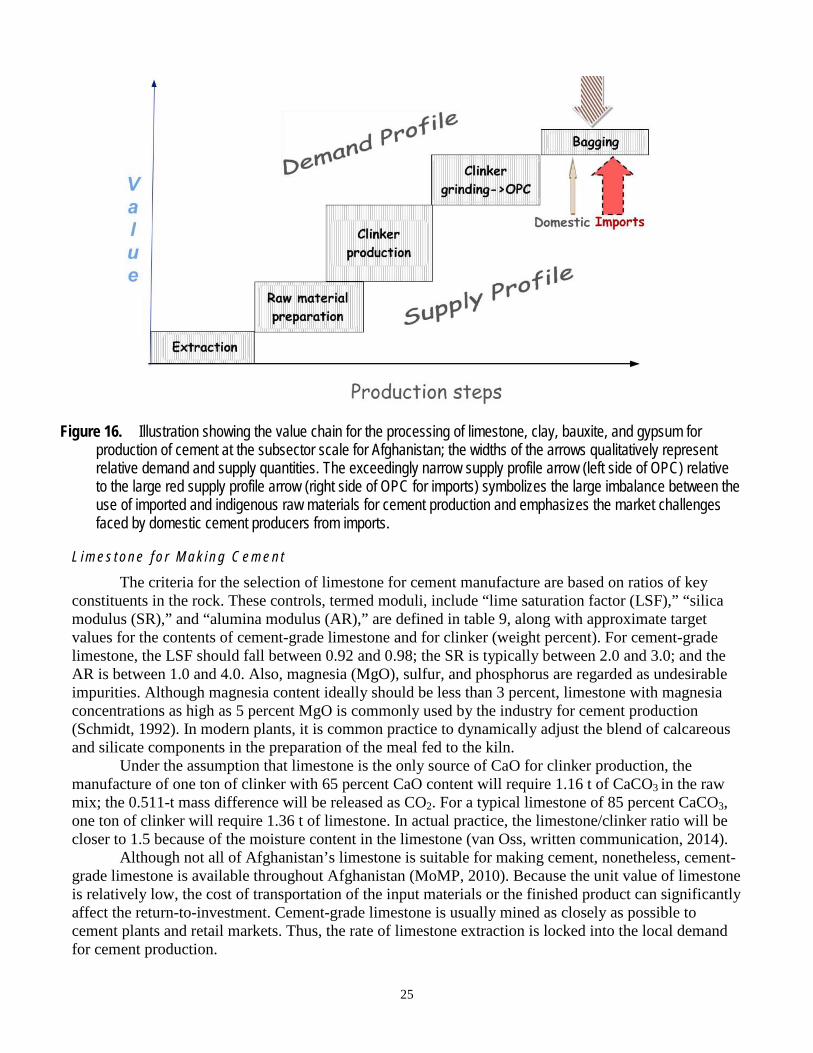
25
Figure 16. Illustration showing the value chain for the processing of limestone, clay, bauxite, and gypsum for production of cement at the subsector scale for Afghanistan; the widths of the arrows qualitatively represent relative demand and supply quantities. The exceedingly narrow supply profile arrow (left side of OPC) relative to the large red supply profile arrow (right side of OPC for imports) symbolizes the large imbalance between the use of imported and indigenous raw materials for cement production and emphasizes the market challenges faced by domestic cement producers from imports.
L i m e s t o n e f o r M a k i n g C e m e n t
The criteria for the selection of limestone for cement manufacture are based on ratios of key constituents in the rock. These controls, termed moduli, include “lime saturation factor (LSF),” “silica modulus (SR),” and “alumina modulus (AR),” are defined in table 9, along with approximate target values for the contents of cement-grade limestone and for clinker (weight percent). For cement-grade limestone, the LSF should fall between 0.92 and 0.98; the SR is typically between 2.0 and 3.0; and the AR is between 1.0 and 4.0. Also, magnesia (MgO), sulfur, and phosphorus are regarded as undesirable impurities. Although magnesia content ideally should be less than 3 percent, limestone with magnesia concentrations as high as 5 percent MgO is commonly used by the industry for cement production (Schmidt, 1992). In modern plants, it is common practice to dynamically adjust the blend of calcareous and silicate components in the preparation of the meal fed to the kiln.
Under the assumption that limestone is the only source of CaO for clinker production, the manufacture of one ton of clinker with 65 percent CaO content will require 1.16 t of CaCO3 in the raw mix; the 0.511-t mass difference will be released as CO2. For a typical limestone of 85 percent CaCO3, one ton of clinker will require 1.36 t of limestone. In actual practice, the limestone/clinker ratio will be closer to 1.5 because of the moisture content in the limestone (van Oss, written communication, 2014).
Although not all of Afghanistan’s limestone is suitable for making cement, nonetheless, cement-grade limestone is available throughout Afghanistan (MoMP, 2010). Because the unit value of limestone is relatively low, the cost of transportation of the input materials or the finished product can significantly affect the return-to-investment. Cement-grade limestone is usually mined as closely as possible to cement plants and retail markets. Thus, the rate of limestone extraction is locked into the local demand for cement production.
26
Unlike the extraction of limestone for use as dimension stone, the extraction of cement-grade limestone is not a particularly delicate operation. On-the-job training of workers for extraction is common practice. Limestone is normally obtained by surface quarrying. A typical mining process includes removal of the overburden followed by fracturing of the rock—usually by blasting—and extraction. The limestone is then loaded and transported to the crushing and screening facilities. In some cases cement-grade limestone is precrushed and screened for size segregation before being transported by belt conveyors to the cement plant. Table 10 provides examples of documented cement-grade limestone workings. The information in table 10 was sourced from the open literature and is reported here with only minor editing; the information has not been field checked by the assessment team for accuracy. A deposit model for cement-grade limestone is provided in appendix 1 (Ames and others, 1994, p. 296–216). Appendix 4 lists document locators in the AGS archives for approximately 100 studies conducted in Afghanistan on cement-grade limestone and on cement.
C l a y , B a u x i t e , G y p s u m f o r M a k i n g C e m e n t
Whereas clay is used to make clinker, the particular clay mineralogy—or type of clay—is less important to the quality of the cement than is precise knowledge of the bulk clay chemistry. The blend of clay and limestone may require adjustment of aluminous material in the mix with bauxite for a particular batch. In a modern cement plant, real-time chemical analysis is used to control mechanized online compositional corrections of raw materials in the blending stage. Gypsum, which controls OPC setting time, is blended with clinker during the final milling stage. Gypsum and bauxite are available in abundance in Afghanistan.
Infrastructure and Use of Natural Gas for Cement Production Energy efficiency is an important concern for the cement industry. On a plant-by-plant level,
energy inputs account for 50–60 percent of the total cost of production (Wang and others, 2009). The demand for energy is distributed between electrical energy for grinding and milling and thermal energy for firing the kiln. Pyroprocessing in the kiln is the most energy-intensive stage in cement production, accounting for about 90 percent of total sector energy consumption. It is worth noting that the cement industry's energy demand is estimated to be about 2 percent of global primary energy consumption and almost 5 percent of total industrial energy consumption (International Energy Agency, 1999). For every metric ton of clinker produced, about 0.59 t of CO2 is generated, of which 0.5 t is due to the decomposition of raw materials and about 0.08–0.15 t is from fuel combustion. These values are quite variable, depending on the type and quality of fuel, the moisture content of the blend, and the condition of the equipment (Jänicke and others, 1985; Mossotti, 2011b). The paragraphs below address the supply and demand for water, electrical energy, and thermal energy for the production of cement. The use of alternative fuels is briefly reviewed, and the feasibility of using natural gas as a single primary energy source for cement production is also taken-up within the context of the current energy capacity of Afghanistan.
W a t e r R e q u i r e m e n t s f o r M a k i n g C e m e n t
Potential sources of water for cement production include rainfall (storm water), groundwater, surface water, water from quarry dewatering, local community reservoirs, and natural lakes and rivers. Metrics for specific water consumption are rarely quoted because water demand per-unit production generally varies over a wide range from plant to plant and from season to season. In plants using wet processing, water is used mainly for slurry preparation of raw materials. In such plants, all of the water in the slurry is evaporated during the cement manufacturing process. Some wet processing plants use water more efficiently than others with closed-loop recycle systems. In plants using dry processing, water is used mainly to spray on planetary/satellite coolers and to cool motors. Most modern plants
27
require larger amounts of water to meet stringent requirements on dust control and for sequestering of toxic materials from flue gases. In addition water consumption metrics do not linearly scale with operational capacity. At some plants, where quarry dewatering is exceptionally high, conventional water consumption metrics can be negative because more water is discharged to local sources than is withdrawn (World Business Council for Sustainable Development, 2012).
E l e c t r i c a l E n e r g y f o r M a k i n g C e m e n t
Wet versus dry processing Electrical energy for cement production is needed mainly for crushing, grinding, and milling operations (van der Vleuten, 1994, p. 58). Table 11 provides perspective on the relative allocation of the specific electrical energy consumption (SEEC; measured as kilowatt hours per metric ton; kWh/t)—also referred to as electrical intensity—across production processes using wet and dry methods. In actual practice, absolute SEEC values are highly variable. Madlool and others, 2011, published average SEEC values for 12 countries, with the lowest value reported at 65 kWh/t (possibly a grinding-only plant) and the highest at 141 kWh/t. The overall electrical power requirements for a given production capacity vary as much as 20 percent, depending on the hardness of the raw materials, the methods used for grinding and milling, and the condition of the factory equipment. Estimates based on the open literature indicate that wet processing plants require about 19±3 megawatts per million metric ton (MW/Mt) clinker, and dry processing plants about 15.5±3.5 MW/Mt clinker.
Figure 17 illustrates changes in the demand for electrical energy for wet and dry processing with modernization of cement plants worldwide over the period 1978 to 2008 (Olsen and others, 2010, p. 12). The upper three plots in figure 17 represent the SEEC for wet and dry processing (electrical energy units on the left-hand scale). As might be expected, the SEEC for dry processing is generally greater than that for wet processing. It is also apparent that consistent efficiency improvements in the use of electrical energy for both dry and wet processing resulted in convergence of SEEC for wet and dry processing by 2008. The lower three plots in figure 17 represent the specific thermal energy consumption (STEC) for pyroprocessing (thermal energy units on right-hand scale). These patterns show that STEC for wet and dry processing are closely correlated over the period 1978–2008. This tracking reflects efficiency changes common to both wet and dry processing, apart from the requisite energy cost associated with water evaporation during wet processing. Also, note in figure 17 that the SEEC is nominally less than 10 percent of the STEC in absolute magnitude (energetically, 1 million Btu is equivalent to 293 kWh).
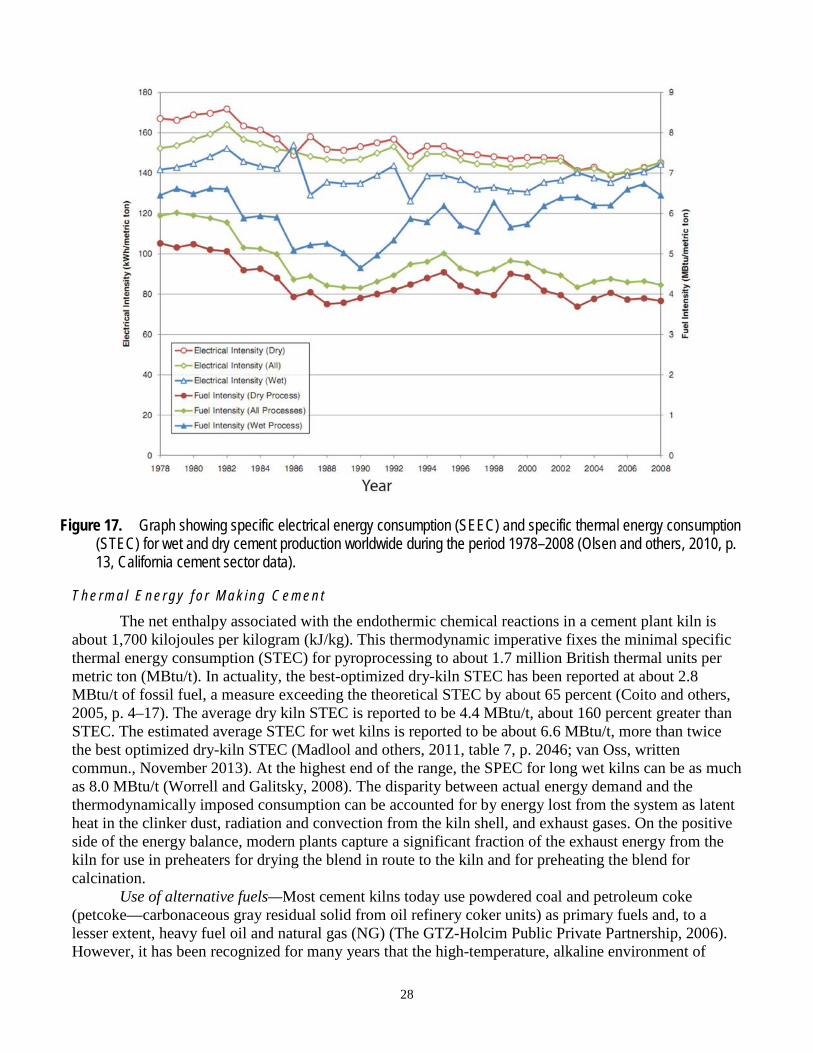
28
Figure 17. Graph showing specific electrical energy consumption (SEEC) and specific thermal energy consumption (STEC) for wet and dry cement production worldwide during the period 1978–2008 (Olsen and others, 2010, p. 13, California cement sector data).
T h e r m a l E n e r g y f o r M a k i n g C e m e n t
The net enthalpy associated with the endothermic chemical reactions in a cement plant kiln is about 1,700 kilojoules per kilogram (kJ/kg). This thermodynamic imperative fixes the minimal specific thermal energy consumption (STEC) for pyroprocessing to about 1.7 million British thermal units per metric ton (MBtu/t). In actuality, the best-optimized dry-kiln STEC has been reported at about 2.8 MBtu/t of fossil fuel, a measure exceeding the theoretical STEC by about 65 percent (Coito and others, 2005, p. 4–17). The average dry kiln STEC is reported to be 4.4 MBtu/t, about 160 percent greater than STEC. The estimated average STEC for wet kilns is reported to be about 6.6 MBtu/t, more than twice the best optimized dry-kiln STEC (Madlool and others, 2011, table 7, p. 2046; van Oss, written commun., November 2013). At the highest end of the range, the SPEC for long wet kilns can be as much as 8.0 MBtu/t (Worrell and Galitsky, 2008). The disparity between actual energy demand and the thermodynamically imposed consumption can be accounted for by energy lost from the system as latent heat in the clinker dust, radiation and convection from the kiln shell, and exhaust gases. On the positive side of the energy balance, modern plants capture a significant fraction of the exhaust energy from the kiln for use in preheaters for drying the blend in route to the kiln and for preheating the blend for calcination.
Use of alternative fuels—Most cement kilns today use powdered coal and petroleum coke (petcoke—carbonaceous gray residual solid from oil refinery coker units) as primary fuels and, to a lesser extent, heavy fuel oil and natural gas (NG) (The GTZ-Holcim Public Private Partnership, 2006). However, it has been recognized for many years that the high-temperature, alkaline environment of
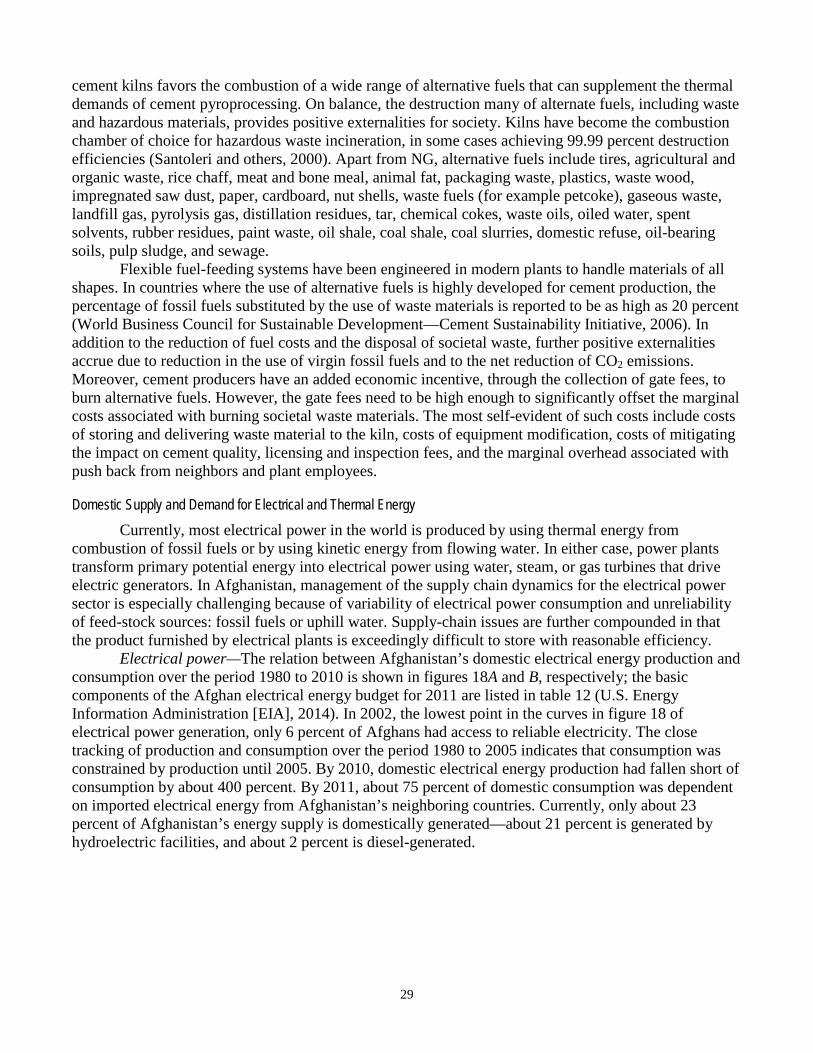
29
cement kilns favors the combustion of a wide range of alternative fuels that can supplement the thermal demands of cement pyroprocessing. On balance, the destruction many of alternate fuels, including waste and hazardous materials, provides positive externalities for society. Kilns have become the combustion chamber of choice for hazardous waste incineration, in some cases achieving 99.99 percent destruction efficiencies (Santoleri and others, 2000). Apart from NG, alternative fuels include tires, agricultural and organic waste, rice chaff, meat and bone meal, animal fat, packaging waste, plastics, waste wood, impregnated saw dust, paper, cardboard, nut shells, waste fuels (for example petcoke), gaseous waste, landfill gas, pyrolysis gas, distillation residues, tar, chemical cokes, waste oils, oiled water, spent solvents, rubber residues, paint waste, oil shale, coal shale, coal slurries, domestic refuse, oil-bearing soils, pulp sludge, and sewage.
Flexible fuel-feeding systems have been engineered in modern plants to handle materials of all shapes. In countries where the use of alternative fuels is highly developed for cement production, the percentage of fossil fuels substituted by the use of waste materials is reported to be as high as 20 percent (World Business Council for Sustainable Development—Cement Sustainability Initiative, 2006). In addition to the reduction of fuel costs and the disposal of societal waste, further positive externalities accrue due to reduction in the use of virgin fossil fuels and to the net reduction of CO2 emissions. Moreover, cement producers have an added economic incentive, through the collection of gate fees, to burn alternative fuels. However, the gate fees need to be high enough to significantly offset the marginal costs associated with burning societal waste materials. The most self-evident of such costs include costs of storing and delivering waste material to the kiln, costs of equipment modification, costs of mitigating the impact on cement quality, licensing and inspection fees, and the marginal overhead associated with push back from neighbors and plant employees.
Domestic Supply and Demand for Electrical and Thermal Energy Currently, most electrical power in the world is produced by using thermal energy from
combustion of fossil fuels or by using kinetic energy from flowing water. In either case, power plants transform primary potential energy into electrical power using water, steam, or gas turbines that drive electric generators. In Afghanistan, management of the supply chain dynamics for the electrical power sector is especially challenging because of variability of electrical power consumption and unreliability of feed-stock sources: fossil fuels or uphill water. Supply-chain issues are further compounded in that the product furnished by electrical plants is exceedingly difficult to store with reasonable efficiency.
Electrical power—The relation between Afghanistan’s domestic electrical energy production and consumption over the period 1980 to 2010 is shown in figures 18A and B, respectively; the basic components of the Afghan electrical energy budget for 2011 are listed in table 12 (U.S. Energy Information Administration [EIA], 2014). In 2002, the lowest point in the curves in figure 18 of electrical power generation, only 6 percent of Afghans had access to reliable electricity. The close tracking of production and consumption over the period 1980 to 2005 indicates that consumption was constrained by production until 2005. By 2010, domestic electrical energy production had fallen short of consumption by about 400 percent. By 2011, about 75 percent of domestic consumption was dependent on imported electrical energy from Afghanistan’s neighboring countries. Currently, only about 23 percent of Afghanistan’s energy supply is domestically generated—about 21 percent is generated by hydroelectric facilities, and about 2 percent is diesel-generated.
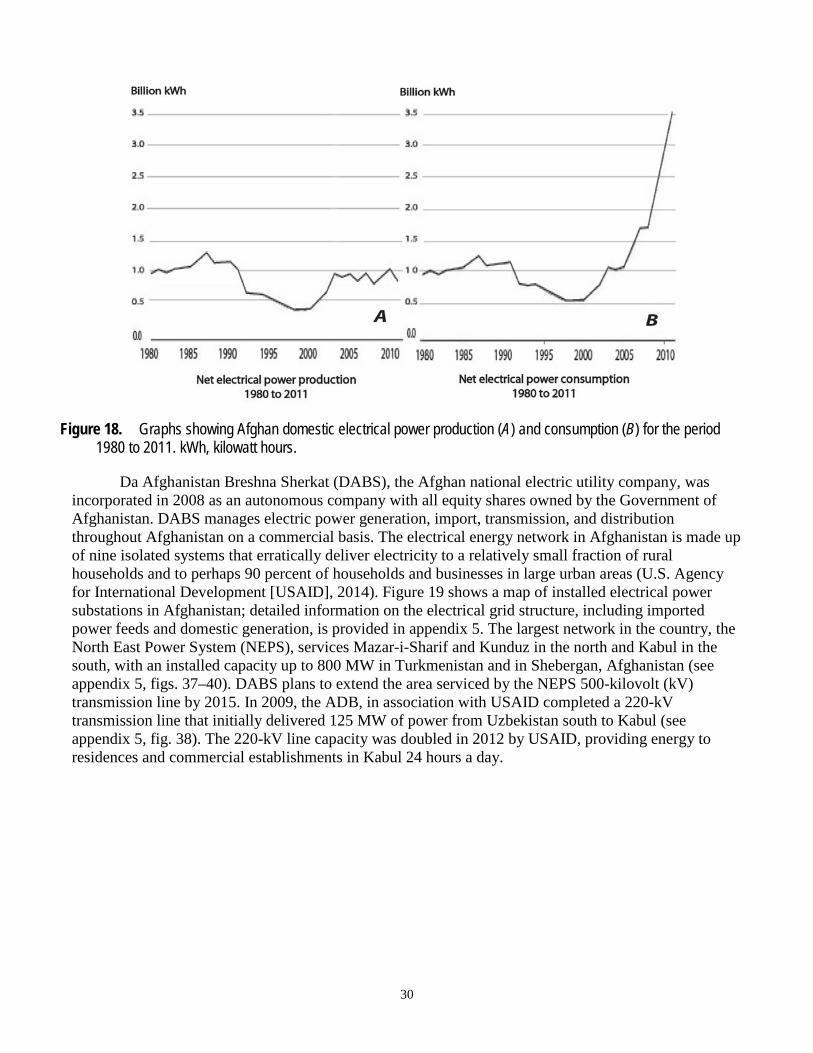
30
Figure 18. Graphs showing Afghan domestic electrical power production (A) and consumption (B) for the period 1980 to 2011. kWh, kilowatt hours.
Da Afghanistan Breshna Sherkat (DABS), the Afghan national electric utility company, was incorporated in 2008 as an autonomous company with all equity shares owned by the Government of Afghanistan. DABS manages electric power generation, import, transmission, and distribution throughout Afghanistan on a commercial basis. The electrical energy network in Afghanistan is made up of nine isolated systems that erratically deliver electricity to a relatively small fraction of rural households and to perhaps 90 percent of households and businesses in large urban areas (U.S. Agency for International Development [USAID], 2014). Figure 19 shows a map of installed electrical power substations in Afghanistan; detailed information on the electrical grid structure, including imported power feeds and domestic generation, is provided in appendix 5. The largest network in the country, the North East Power System (NEPS), services Mazar-i-Sharif and Kunduz in the north and Kabul in the south, with an installed capacity up to 800 MW in Turkmenistan and in Shebergan, Afghanistan (see appendix 5, figs. 37–40). DABS plans to extend the area serviced by the NEPS 500-kilovolt (kV) transmission line by 2015. In 2009, the ADB, in association with USAID completed a 220-kV transmission line that initially delivered 125 MW of power from Uzbekistan south to Kabul (see appendix 5, fig. 38). The 220-kV line capacity was doubled in 2012 by USAID, providing energy to residences and commercial establishments in Kabul 24 hours a day.
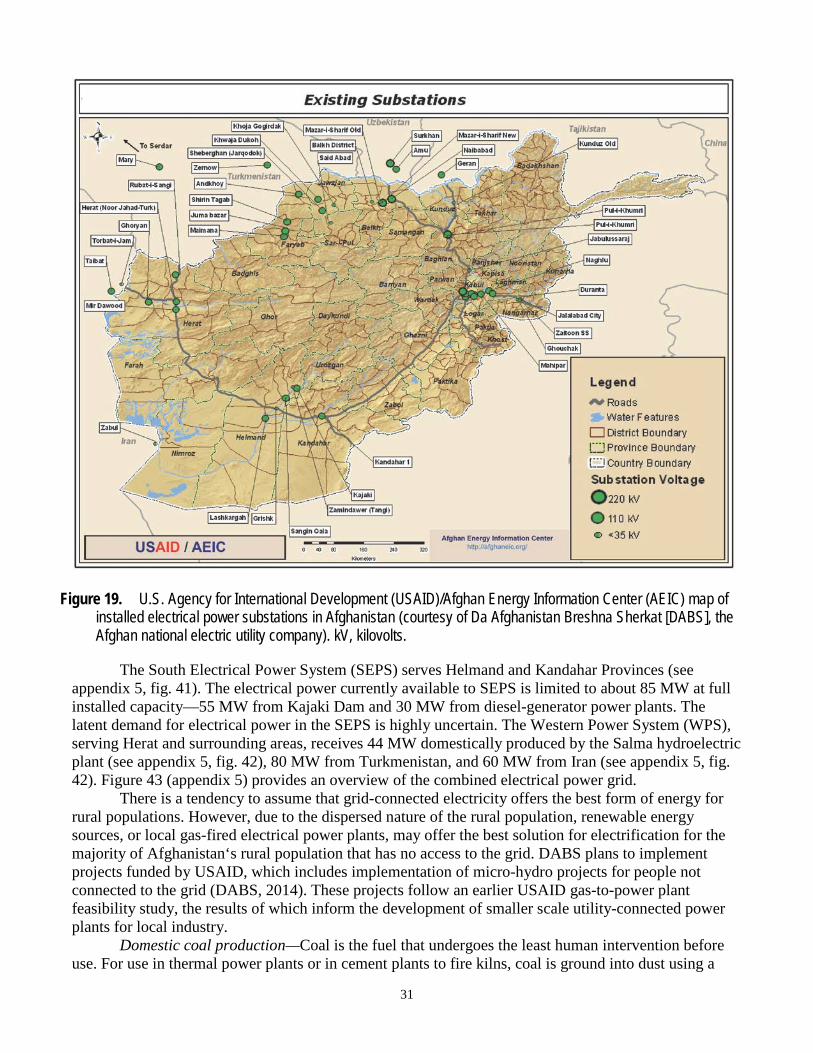
31
Figure 19. U.S. Agency for International Development (USAID)/Afghan Energy Information Center (AEIC) map of installed electrical power substations in Afghanistan (courtesy of Da Afghanistan Breshna Sherkat [DABS], the Afghan national electric utility company). kV, kilovolts.
The South Electrical Power System (SEPS) serves Helmand and Kandahar Provinces (see appendix 5, fig. 41). The electrical power currently available to SEPS is limited to about 85 MW at full installed capacity—55 MW from Kajaki Dam and 30 MW from diesel-generator power plants. The latent demand for electrical power in the SEPS is highly uncertain. The Western Power System (WPS), serving Herat and surrounding areas, receives 44 MW domestically produced by the Salma hydroelectric plant (see appendix 5, fig. 42), 80 MW from Turkmenistan, and 60 MW from Iran (see appendix 5, fig. 42). Figure 43 (appendix 5) provides an overview of the combined electrical power grid.
There is a tendency to assume that grid-connected electricity offers the best form of energy for rural populations. However, due to the dispersed nature of the rural population, renewable energy sources, or local gas-fired electrical power plants, may offer the best solution for electrification for the majority of Afghanistan‘s rural population that has no access to the grid. DABS plans to implement projects funded by USAID, which includes implementation of micro-hydro projects for people not connected to the grid (DABS, 2014). These projects follow an earlier USAID gas-to-power plant feasibility study, the results of which inform the development of smaller scale utility-connected power plants for local industry.
Domestic coal production—Coal is the fuel that undergoes the least human intervention before use. For use in thermal power plants or in cement plants to fire kilns, coal is ground into dust using a
32
powdered coal mill; for cement production, this step is usually carried out at the cement plant. Because coal is delivered to the customer in essentially the same condition in which it is removed from the mine, the value chain has only three basic steps, as summarized in table 13.
Bituminous coals are most often used in the cement industry, largely because bituminous coals are generally more abundant and because anthracite is more expensive. Advanced assessment of coal resources in Afghanistan has yet to be completed. However, it has been definitively demonstrated that there is a significant coal endowment in Afghanistan north of the Hindu Kush (Mikhailov and others, 1965, 1967; Orris and Bliss, 2002, p. 16–74). Historically, there has been governmentally owned and artisanally operated coal mines scattered across a wide belt covering the southern half of the northern Afghanistan platform, a region referred to as the North Coal District (NCD) (Tewalt and others, 2010). It is well known that the NCD hosts a multiplicity of deposits that are of primarily of Jurassic age. The district spans a 700 kilometer (km) reach from Takhar Province in the east to the Herat-Badghis border in the west, terminating at Kotal-i-Sabzak Pass (34°38'35.74" N., 63°6'51.19" E.); the southern perimeter of the district is delimited by the Hari Rud fault complex as is clearly apparent in the map in figure 20 (Hare and others, 2008).
Figure 20. Map showing distribution of coal-bearing rocks in Afghanistan (from Sanfilippo, 2005). m, meters.
33
Based on reports in the open literature (Sanfilippo and others, 2006; USGS, 2014) it appears that conditions at essentially all coal mining operations in the NCD are primitive and dangerous. Miners work at considerable depth in intense heat, extracting coal with hand-tools and old equipment. Engineers have advised the suspension of mining in certain licensed coal mines in the Dara-i-Suf District of northern Samangan Province after a survey found that tunnels are on the verge of collapsing (Aljazeera, 2013; USGS, 2014). The risk of explosion from methane gas is also high, and worker fatalities are not uncommon (Wadsam, 2014). During the past 6 months officials have confirmed the deaths of 43 coal miners and injuries of dozens of workers in two separate a mine explosions in Samangan Province (Rahimzai, 2013; Afghan Zariza, 2014).
Mining companies add commercial value to coal minerals by changing the location of the coal. As such, the coal-mining sector faces the challenge of transporting coal from mine areas to customers throughout Afghanistan. Fortunately, since 2003, the Asian Development Fund (ADF) has financed construction of Afghanistan’s 2,200-km Highway 1, formally called the Ring Road. The thoroughfare circles the country, serially connecting Afghanistan's most important commercial centers—Kabul, Kandahar, Herat, Maymaneh, Sheberghan, and Mazar-e-Sharif. Furthermore, work is in progress to connect the heart of Afghanistan to the Ring Road with modern highways running east-west and north-south. At the regional level, the NCD is served, to some extent, by a new 100 km segment along the North-South Corridor road connecting the Yakawlang District in Bamyan Province with the Ring Road in Sholgara District in Balkh Province. However, there is a sharp contrast between regional and local transport infrastructures in the NCD. For many coal-mining operations, the transport bottleneck is the distance between the points of coal extraction and the tipple (a structure used to load coal for transshipping). Because many of the mines in the NCD are located in rugged terrain where modern transport facilities are unavailable, much of the coal is bagged and delivered to villages by mules for local use.
Information on coal resources and infrastructure south of the Hindu Kush is more provisory. Occurrences and some deposits of Paleogene coal are reported in the Katawaz Basin (fig. 20), but information on the quality of the Paleogene coals is limited, and commercial activities are on a relatively small scale in the area. Most likely, future development of coal production capacity will be focused north of the Hindu Kush. Considering that the current limitation on production capacity at Ghori I and Ghori II is the availability of coal for thermal energy, it follows that the country will need 50–100 times more coal than presently produced to supply the three greenfield plants presently being tendered by MoMP at Pul-e-Khumri, Jabal-e-Sharaj, and Herat.
Natural gas—Evidence is mounting that Afghanistan will soon have abundant supplies of natural gas (NG), either imported or produced domestically. Advanced technologies for the use of NG are being used in many locations in the world. At this crucial time for the Afghan cement sector, a feasibility study is warranted for use of NG for powering captured electrical power plants and for firing cement kilns. The basic steps in the value chain for NG production, with focal points for discussion, are outlined in (table 14).
Natural gas genesis, exploration and extraction—Petroleum and natural gas fields are produced by anaerobic digestion of organic matter that is then exposed to intense heat and pressure deep under Earth's surface over thousands of years. Because oil and natural gas are less dense than water, they tend to rise from their sources until they either percolate to Earth’s surface or are trapped by nonpermeable anticlinal rock layers; seismic-reflection tomography is generally the technique of choice for locating stratigraphic layers that are permissible for trapped NG. In many natural gas fields, although not all, volatile hydrocarbons associated with oil—such as butane, pentane, and hexane—move through sediments in consort with methane, the main constituent of natural gas. Although the driest and cleanest gas can be extracted from depths as much as 8 km, for the most part, NG is extracted by drilling directly into deposit layers that are located at depths of about 3 km. Gasses in prospective stratigraphic horizons are brought to the surface through perforations in the steel drill casing and the surrounding cement
34
sheath. Although any number of factors in the underground environment can impede the free flow of gas to the surface, primary recovery first relies on underground pressure to drive gas to the surface. When the pressure falls, enhanced recovery techniques that increase the contact area between the well and the reservoir are used help bring more gas to the surface. Today, advanced technology allows production of about 60 percent of the available resources from a formation.
The historically interesting natural gas fields in Afghanistan include Djarquduk, Khowaja Gogerdak, and Yatimtaq, all of which are located within about 30 km of Sheberghan in Jowzjan Province. The Djarquduk field was brought online in the mid-1970s. At its peak in the late 1970s, Afghanistan exported 70–90 percent of its natural gas production to the Soviet Union through the Uzbek pipeline. Production at Sheberghan was interrupted with the pullout of the Soviet Union and with the onset of the Afghan civil war. Recently, proved reserves of commercially recoverable NG in the assessed region of northern Afghanistan were estimated to be 50 billion cubic meters (bcm) (Central Intelligence Agency, 2014); reserves in the Turkmenistan Dauletabad gas field near the Iran border were estimated to be 25–50 trillion cubic meters (tcm) (Clarke and others, 1992).
Gathering, scrubbing, drying—As gas reaches the surface, it enters a low-pressure gathering system that funnels gas from a set of wells through relatively small diameter pipes into a central collection point. The gathering system generally includes a processing facility that prepares the gas for transport. Because the hydrocarbon dew point of the heaver gaseous components exceeds that for methane in raw natural gas, the higher molecular weight components condense as liquids as the mix cools by rising toward the wellhead (Mokhatab and Poe, 2012, p. 195). In preparation for transport and sale, raw NG must be processed to remove particulate solids and hydrocarbons other than methane, and to reduce moisture, carbon dioxide, nitrogen, and hydrogen sulfide in the product (Mokhatab and Poe, 2012, p. 317). In reality, the heavier hydrocarbon components often acquire significant economic unit-value as natural gas liquids (NGLs) in the petrochemical feedstock market.
Transport—The two primarily methods in current use for transport of NG energy are as a gas through pipelines and as liquefied natural gas (LNG) in overland conveyances. In Afghanistan the main pipeline is expected to be the Turkmenistan-Afghanistan-Pakistan-India pipeline (TAPI). Alternative transport technologies developed in recent years are yet to be widely adopted. Transport as LNG is more flexible than transport through pipelines because the destination is not preset by virtue of installed physical infrastructure; also, transport as LNG is really the only option for crossing oceans and large stretches of water. However, the delivery of natural gas from its origin through pipeline networks over thousands of miles to markets is the most reliable and safest method of transportation. Where LNG batch delivery is subject to supply-chain disruptions (for example, weather), NG pipelines operate 24 hours a day through all seasons of the year.
Long distance—NG pipelines consist of components that ensure the efficiency, safety, and reliability of pipeline systems. Actual physical pipelines are made of coated carbon steel material, engineered to meet vigorous standards for strength and resistance to corrosion. To ensure that the gas flows efficiently through the pipeline, the gas is compressed at stations placed at 40- to 100-mile (~64–160 km) intervals along the pipeline. Metering stations and valves are liberally distributed along the pipeline to allow control stations to regulate the gas flow in accordance with downstream demand or to gate-off sections of the pipeline as needed (Mokhatab and Poe, 2012, p. 447).
The idea for a trans-Afghanistan pipeline first took form in the 1990s as a consortium under the leadership of the Government of Turkmenistan, the Union Oil Company of California, and Delta Oil of Saudi Arabia. Other original members of the consortium were companies licensed in Russia, Japan, South Korea, and Pakistan. In 2013, leadership of the TAPI project was transferred to TAPI, Ltd., a Dubai-based autonomous company formed by energy ministers of the four TAPI countries. The current plan for the TAPI project is to construct a 1,430 km NG pipeline to transect Afghanistan and Pakistan from the Dauletabad gas field in the Turkmenistan part of the Amu-Darya oil-gas province and to terminate in the Punjab at Fazilka, near the Pakistan-India border. The pipeline is planned to be 56
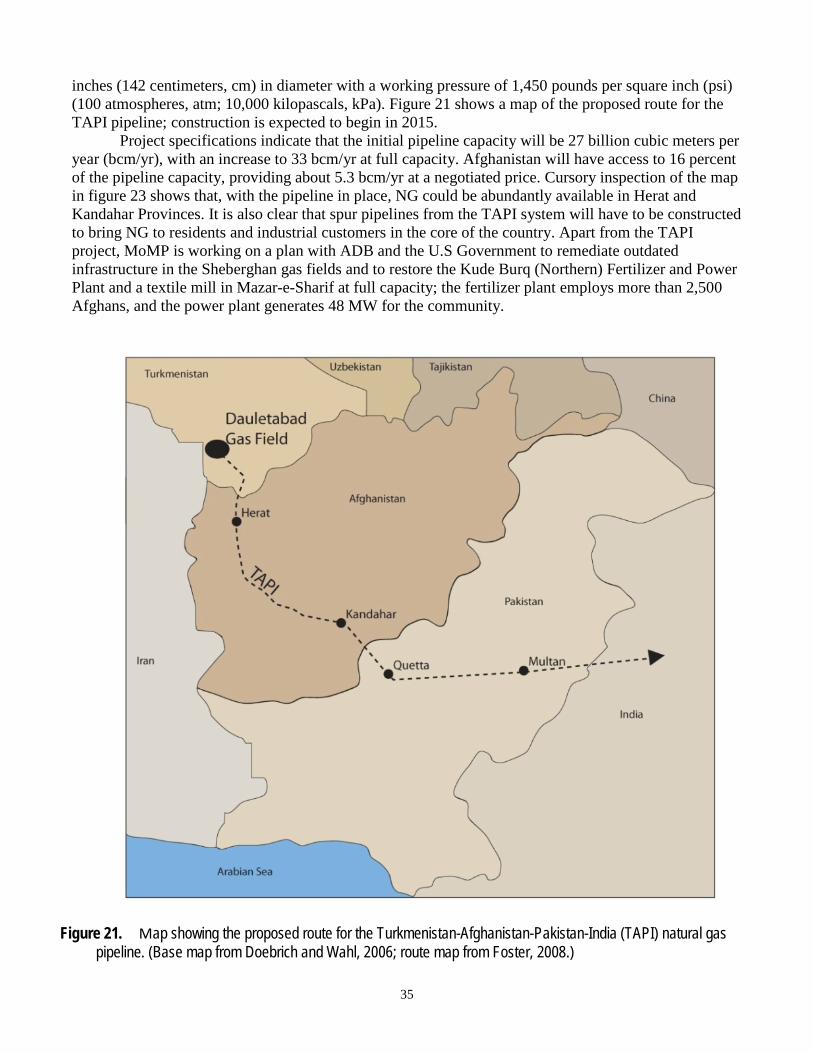
35
inches (142 centimeters, cm) in diameter with a working pressure of 1,450 pounds per square inch (psi) (100 atmospheres, atm; 10,000 kilopascals, kPa). Figure 21 shows a map of the proposed route for the TAPI pipeline; construction is expected to begin in 2015.
Project specifications indicate that the initial pipeline capacity will be 27 billion cubic meters per year (bcm/yr), with an increase to 33 bcm/yr at full capacity. Afghanistan will have access to 16 percent of the pipeline capacity, providing about 5.3 bcm/yr at a negotiated price. Cursory inspection of the map in figure 23 shows that, with the pipeline in place, NG could be abundantly available in Herat and Kandahar Provinces. It is also clear that spur pipelines from the TAPI system will have to be constructed to bring NG to residents and industrial customers in the core of the country. Apart from the TAPI project, MoMP is working on a plan with ADB and the U.S Government to remediate outdated infrastructure in the Sheberghan gas fields and to restore the Kude Burq (Northern) Fertilizer and Power Plant and a textile mill in Mazar-e-Sharif at full capacity; the fertilizer plant employs more than 2,500 Afghans, and the power plant generates 48 MW for the community.
Figure 21. Map showing the proposed route for the Turkmenistan-Afghanistan-Pakistan-India (TAPI) natural gas pipeline. (Base map from Doebrich and Wahl, 2006; route map from Foster, 2008.)
36
F e a s i b i l i t y — N a t u r a l G a s f o r P y r o p r o c e s s i n g a n d f o r E l e c t r i c P o w e r
The discussion in this section addresses the feasibility of using domestically harvested NG as the primary fuel source for all energy requirements in the production of cement. Factors driving the selection of electrical and thermal energy sources for cement production include (1) availability of energy supply in sufficient quantity to satisfy plant capacity, (2) reliability of supply, (3) caloric quality of fuel, (4) unit energy price, and (5) capacity for positive and negative societal externalities.
Natural gas for electric power—In January 2005, USAID initiated a feasibility study to evaluate the physical infrastructure required to develop a 100-MW gas-fired power plant and gas treatment plant in Gerquduq (near Sheberghan) using indigenous Afghan natural gas. The USAID study concluded that, from a technical standpoint, there are no issues that have not already been successfully addressed by the industry and that the Sheberghan gas fields host sufficient NG to fuel a 100-MW power plant for some extended period. The study also concluded that, from an economic point of view, the operating cost of delivered wholesale power could be about 3 cents per kWh (in 2005 USD). From an environmental perspective, compared to the average air emissions from coal-fired generation, natural gas produces half as much carbon dioxide, less than a third as much nitrogen oxides, and 1 percent as much sulfur oxides per unit energy generated.
Today, gas-to-power facilities are ubiquitous, serving manufacturers at all scales around the world. The most basic fossil fuel-fired electric-generation technology consists of a steam-generation unit that feeds a turbine to generate electricity; such technology is commonly found in large coal-fired power plants. The discussion here focuses on distributed electrical generation, which refers to the use of smaller electric power units located at sites where a specified amount of electrical power is locally needed. Distributed generation can take many forms, from small, low output generators used to back up the supply of electricity obtained from the centralized electric utilities, to larger, independent generators that supply enough electricity to power an entire factory. In their basic configuration, small-scale power plants are primarily powered by combustion engine/turbine systems or by integrated NG-fired turbine units. Similar to large coal-fired power plants, in their basic configuration, heat produced simultaneously with electricity is expelled into the environment, and only about 33–35 percent of the thermal energy spent by the generator is converted into electrical energy.
NG-fired internal combustion engines (reciprocating engines) typically generate from 5 kW to 7 MW of electrical power. Industrial NG-fired turbines, with a capacity from 5–400 MW, produce electricity through the use of high-temperature, high-pressure gas to turn a turbine that generates electrical current. When used for cement production, a NG-fired turbine system can be engineered to yield a decisive advantage relative to NG-fired internal combustion engines. With a NG-fired turbine system, exhaust heat cogenerated with electrical power can be harnessed for drying raw materials, for preheating the kiln and kiln blend, and for precalcining the kiln feed. As used here, the term “cogeneration” broadly refers to facilities that constructively deploy heat produced simultaneously with the production of electrical power.
Natural gas for thermal (pyroprocessing)—The global use of NG to fire a rotary kiln for clinker production is something of a mixed picture. Before the 1970s in the United States, NG and coal were regarded as viable fuels for pyroprocessing. Although kiln design was usually optimized for the particular fuel, the choice of fuel depended on the local fuel price at the location of the cement plant in the country. But in 1974, the U.S. Congress passed the Energy Supply and Environmental Coordination Act (Public Law 93-319) that compelled electric power plants, cement plants, and other fossil-fuel-intensive installations to burn coal instead of natural gas and petroleum. Four years later, the law was relaxed somewhat; industrial plants requiring power exceeding 50 million Btu/h—with a waiver from the Department of Energy—were allowed to seek Congressional approval of noncompliance of the ban on natural gas (Power Plant and Industrial Fuel Use Act of 1978, Public Law 95-620). In response to Congressional support for coal production, coal production increased, the unit price of coal fell, and the
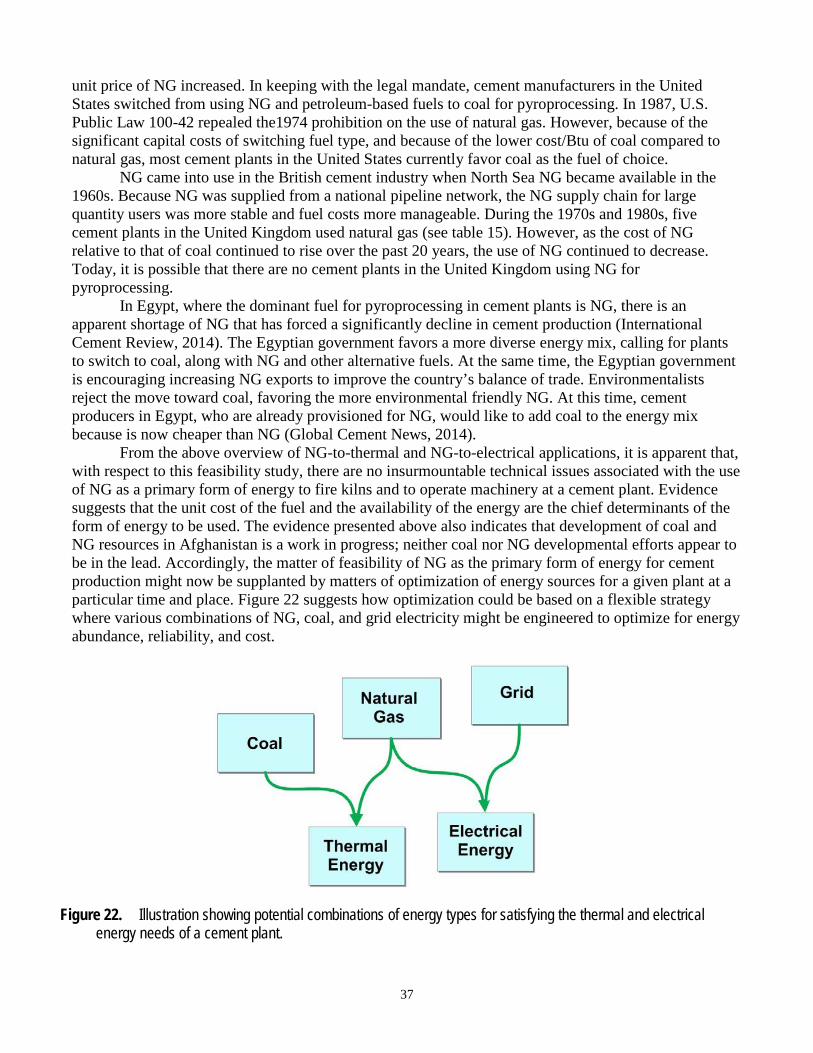
37
unit price of NG increased. In keeping with the legal mandate, cement manufacturers in the United States switched from using NG and petroleum-based fuels to coal for pyroprocessing. In 1987, U.S. Public Law 100-42 repealed the1974 prohibition on the use of natural gas. However, because of the significant capital costs of switching fuel type, and because of the lower cost/Btu of coal compared to natural gas, most cement plants in the United States currently favor coal as the fuel of choice.
NG came into use in the British cement industry when North Sea NG became available in the 1960s. Because NG was supplied from a national pipeline network, the NG supply chain for large quantity users was more stable and fuel costs more manageable. During the 1970s and 1980s, five cement plants in the United Kingdom used natural gas (see table 15). However, as the cost of NG relative to that of coal continued to rise over the past 20 years, the use of NG continued to decrease. Today, it is possible that there are no cement plants in the United Kingdom using NG for pyroprocessing.
In Egypt, where the dominant fuel for pyroprocessing in cement plants is NG, there is an apparent shortage of NG that has forced a significantly decline in cement production (International Cement Review, 2014). The Egyptian government favors a more diverse energy mix, calling for plants to switch to coal, along with NG and other alternative fuels. At the same time, the Egyptian government is encouraging increasing NG exports to improve the country’s balance of trade. Environmentalists reject the move toward coal, favoring the more environmental friendly NG. At this time, cement producers in Egypt, who are already provisioned for NG, would like to add coal to the energy mix because is now cheaper than NG (Global Cement News, 2014).
From the above overview of NG-to-thermal and NG-to-electrical applications, it is apparent that, with respect to this feasibility study, there are no insurmountable technical issues associated with the use of NG as a primary form of energy to fire kilns and to operate machinery at a cement plant. Evidence suggests that the unit cost of the fuel and the availability of the energy are the chief determinants of the form of energy to be used. The evidence presented above also indicates that development of coal and NG resources in Afghanistan is a work in progress; neither coal nor NG developmental efforts appear to be in the lead. Accordingly, the matter of feasibility of NG as the primary form of energy for cement production might now be supplanted by matters of optimization of energy sources for a given plant at a particular time and place. Figure 22 suggests how optimization could be based on a flexible strategy where various combinations of NG, coal, and grid electricity might be engineered to optimize for energy abundance, reliability, and cost.
Figure 22. Illustration showing potential combinations of energy types for satisfying the thermal and electrical energy needs of a cement plant.
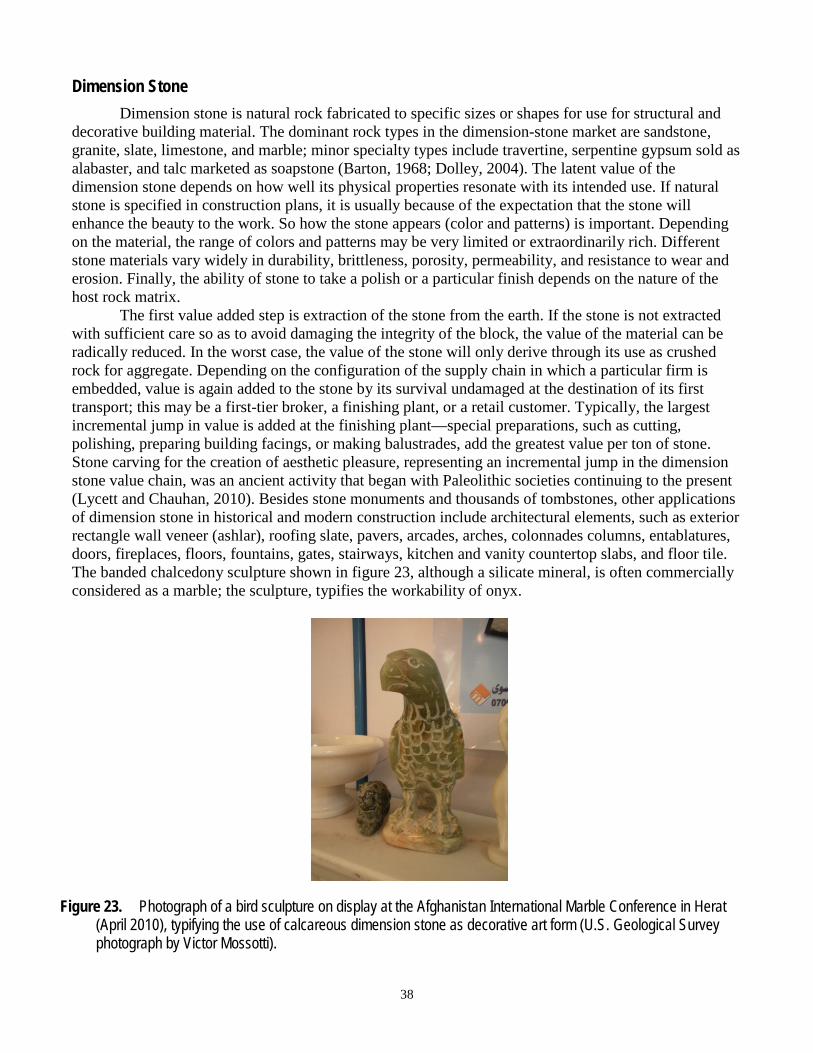
38
Dimension Stone Dimension stone is natural rock fabricated to specific sizes or shapes for use for structural and
decorative building material. The dominant rock types in the dimension-stone market are sandstone, granite, slate, limestone, and marble; minor specialty types include travertine, serpentine gypsum sold as alabaster, and talc marketed as soapstone (Barton, 1968; Dolley, 2004). The latent value of the dimension stone depends on how well its physical properties resonate with its intended use. If natural stone is specified in construction plans, it is usually because of the expectation that the stone will enhance the beauty to the work. So how the stone appears (color and patterns) is important. Depending on the material, the range of colors and patterns may be very limited or extraordinarily rich. Different stone materials vary widely in durability, brittleness, porosity, permeability, and resistance to wear and erosion. Finally, the ability of stone to take a polish or a particular finish depends on the nature of the host rock matrix.
The first value added step is extraction of the stone from the earth. If the stone is not extracted with sufficient care so as to avoid damaging the integrity of the block, the value of the material can be radically reduced. In the worst case, the value of the stone will only derive through its use as crushed rock for aggregate. Depending on the configuration of the supply chain in which a particular firm is embedded, value is again added to the stone by its survival undamaged at the destination of its first transport; this may be a first-tier broker, a finishing plant, or a retail customer. Typically, the largest incremental jump in value is added at the finishing plant—special preparations, such as cutting, polishing, preparing building facings, or making balustrades, add the greatest value per ton of stone. Stone carving for the creation of aesthetic pleasure, representing an incremental jump in the dimension stone value chain, was an ancient activity that began with Paleolithic societies continuing to the present (Lycett and Chauhan, 2010). Besides stone monuments and thousands of tombstones, other applications of dimension stone in historical and modern construction include architectural elements, such as exterior rectangle wall veneer (ashlar), roofing slate, pavers, arcades, arches, colonnades columns, entablatures, doors, fireplaces, floors, fountains, gates, stairways, kitchen and vanity countertop slabs, and floor tile. The banded chalcedony sculpture shown in figure 23, although a silicate mineral, is often commercially considered as a marble; the sculpture, typifies the workability of onyx.
Figure 23. Photograph of a bird sculpture on display at the Afghanistan International Marble Conference in Herat (April 2010), typifying the use of calcareous dimension stone as decorative art form (U.S. Geological Survey photograph by Victor Mossotti).
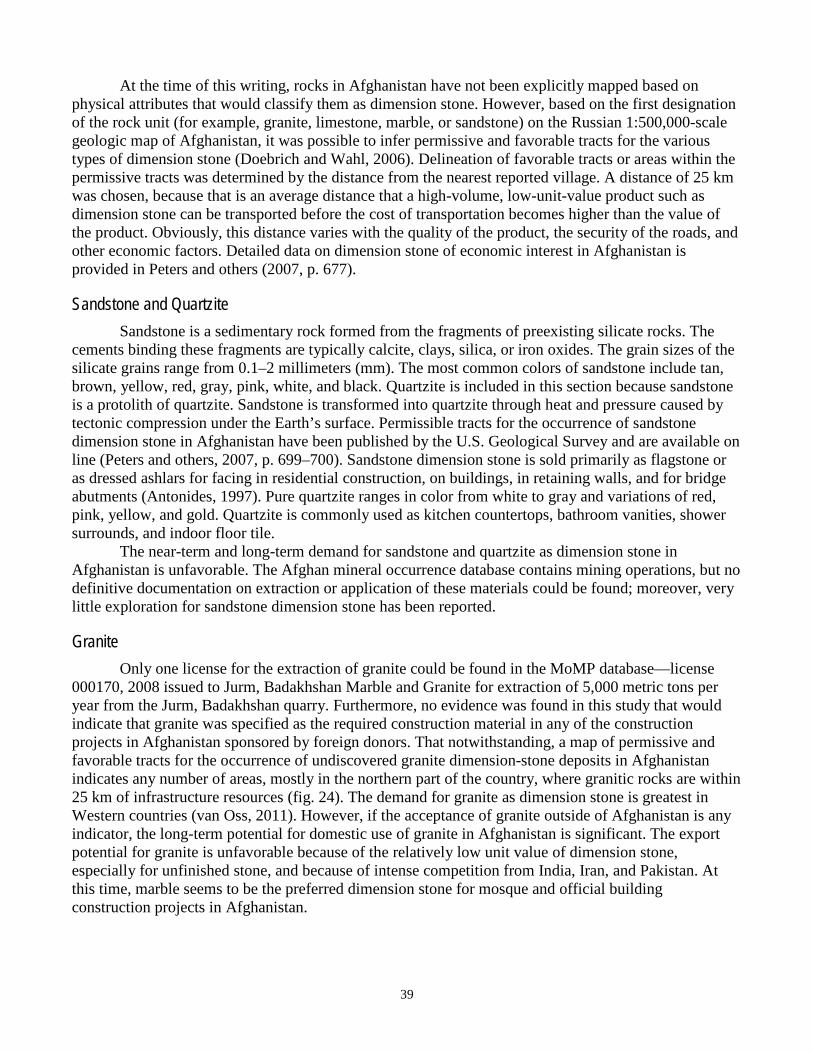
39
At the time of this writing, rocks in Afghanistan have not been explicitly mapped based on physical attributes that would classify them as dimension stone. However, based on the first designation of the rock unit (for example, granite, limestone, marble, or sandstone) on the Russian 1:500,000-scale geologic map of Afghanistan, it was possible to infer permissive and favorable tracts for the various types of dimension stone (Doebrich and Wahl, 2006). Delineation of favorable tracts or areas within the permissive tracts was determined by the distance from the nearest reported village. A distance of 25 km was chosen, because that is an average distance that a high-volume, low-unit-value product such as dimension stone can be transported before the cost of transportation becomes higher than the value of the product. Obviously, this distance varies with the quality of the product, the security of the roads, and other economic factors. Detailed data on dimension stone of economic interest in Afghanistan is provided in Peters and others (2007, p. 677).
Sandstone and Quartzite Sandstone is a sedimentary rock formed from the fragments of preexisting silicate rocks. The
cements binding these fragments are typically calcite, clays, silica, or iron oxides. The grain sizes of the silicate grains range from 0.1–2 millimeters (mm). The most common colors of sandstone include tan, brown, yellow, red, gray, pink, white, and black. Quartzite is included in this section because sandstone is a protolith of quartzite. Sandstone is transformed into quartzite through heat and pressure caused by tectonic compression under the Earth’s surface. Permissible tracts for the occurrence of sandstone dimension stone in Afghanistan have been published by the U.S. Geological Survey and are available on line (Peters and others, 2007, p. 699–700). Sandstone dimension stone is sold primarily as flagstone or as dressed ashlars for facing in residential construction, on buildings, in retaining walls, and for bridge abutments (Antonides, 1997). Pure quartzite ranges in color from white to gray and variations of red, pink, yellow, and gold. Quartzite is commonly used as kitchen countertops, bathroom vanities, shower surrounds, and indoor floor tile.
The near-term and long-term demand for sandstone and quartzite as dimension stone in Afghanistan is unfavorable. The Afghan mineral occurrence database contains mining operations, but no definitive documentation on extraction or application of these materials could be found; moreover, very little exploration for sandstone dimension stone has been reported.
Granite Only one license for the extraction of granite could be found in the MoMP database—license
000170, 2008 issued to Jurm, Badakhshan Marble and Granite for extraction of 5,000 metric tons per year from the Jurm, Badakhshan quarry. Furthermore, no evidence was found in this study that would indicate that granite was specified as the required construction material in any of the construction projects in Afghanistan sponsored by foreign donors. That notwithstanding, a map of permissive and favorable tracts for the occurrence of undiscovered granite dimension-stone deposits in Afghanistan indicates any number of areas, mostly in the northern part of the country, where granitic rocks are within 25 km of infrastructure resources (fig. 24). The demand for granite as dimension stone is greatest in Western countries (van Oss, 2011). However, if the acceptance of granite outside of Afghanistan is any indicator, the long-term potential for domestic use of granite in Afghanistan is significant. The export potential for granite is unfavorable because of the relatively low unit value of dimension stone, especially for unfinished stone, and because of intense competition from India, Iran, and Pakistan. At this time, marble seems to be the preferred dimension stone for mosque and official building construction projects in Afghanistan.
40
Figure 24. Map showing permissive and favorable tracts (yellow, and orange, respectively) for granite dimension stone (from Peters and others, 2007, p. 684).
Slate Although there are many uses to which slate can be applied (see table 5), perhaps the most
common uses—at least as a dimension stone—are for roofing, flooring, and fireplace hearths. Slate is a fine-grained, foliated, fissile, homogeneous metamorphic rock derived from an original shale-type sedimentary rock composed of clay or volcanic ash (mudstone) through low-grade regional metamorphism. In contrast to shale, which splits along the sedimentary bedding planes of the rock, slate fractures along mineralized layers oriented in response to a regional stress field during low-grade regional metamorphism. These planes may be parallel to the bedding planes, but more likely are not. Slate is usually dark gray in color, but can be found in purple, green, or blue. Although slate mines are found around the world, virtually no information on slate exploration or use in Afghanistan was discovered in this study.
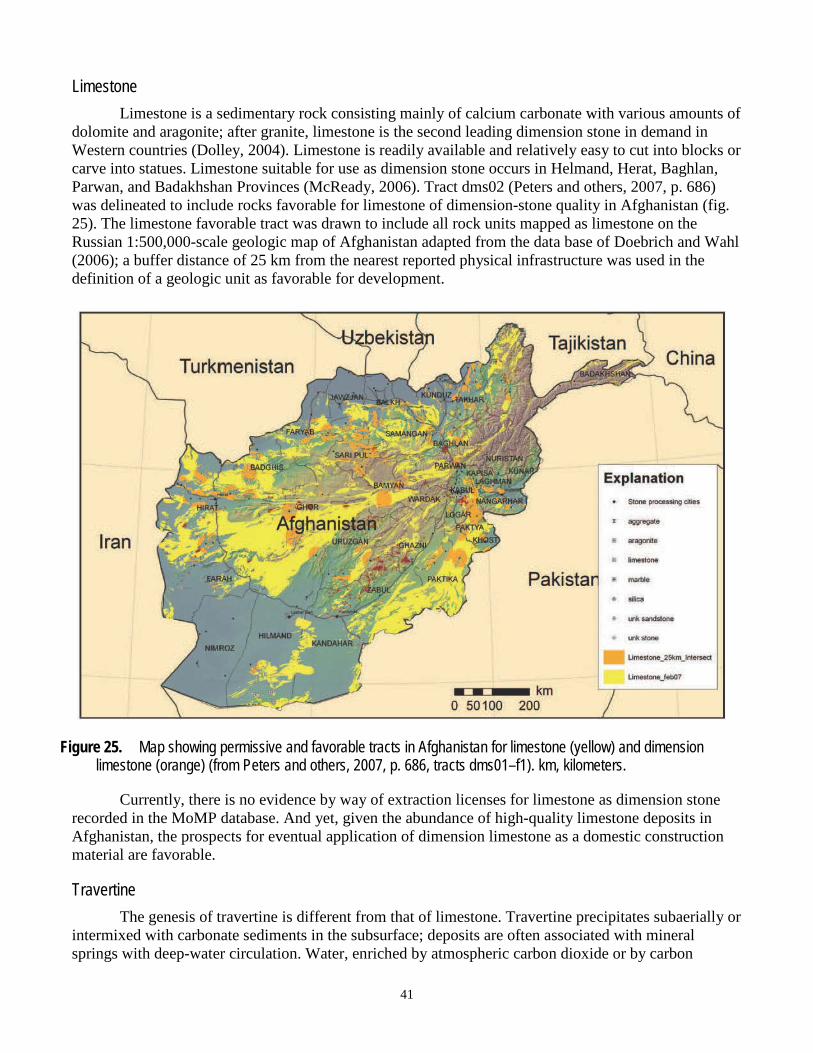
41
Limestone Limestone is a sedimentary rock consisting mainly of calcium carbonate with various amounts of
dolomite and aragonite; after granite, limestone is the second leading dimension stone in demand in Western countries (Dolley, 2004). Limestone is readily available and relatively easy to cut into blocks or carve into statues. Limestone suitable for use as dimension stone occurs in Helmand, Herat, Baghlan, Parwan, and Badakhshan Provinces (McReady, 2006). Tract dms02 (Peters and others, 2007, p. 686) was delineated to include rocks favorable for limestone of dimension-stone quality in Afghanistan (fig. 25). The limestone favorable tract was drawn to include all rock units mapped as limestone on the Russian 1:500,000-scale geologic map of Afghanistan adapted from the data base of Doebrich and Wahl (2006); a buffer distance of 25 km from the nearest reported physical infrastructure was used in the definition of a geologic unit as favorable for development.
Figure 25. Map showing permissive and favorable tracts in Afghanistan for limestone (yellow) and dimension limestone (orange) (from Peters and others, 2007, p. 686, tracts dms01–f1). km, kilometers.
Currently, there is no evidence by way of extraction licenses for limestone as dimension stone recorded in the MoMP database. And yet, given the abundance of high-quality limestone deposits in Afghanistan, the prospects for eventual application of dimension limestone as a domestic construction material are favorable.
Travertine The genesis of travertine is different from that of limestone. Travertine precipitates subaerially or
intermixed with carbonate sediments in the subsurface; deposits are often associated with mineral springs with deep-water circulation. Water, enriched by atmospheric carbon dioxide or by carbon
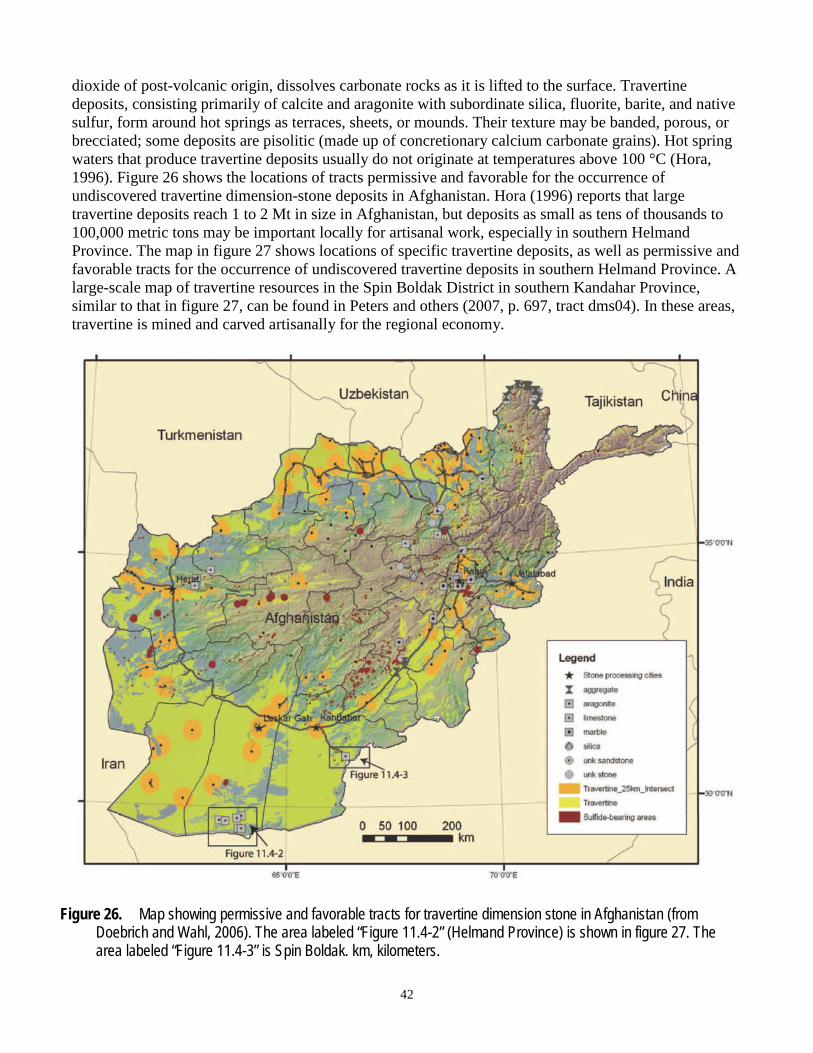
42
dioxide of post-volcanic origin, dissolves carbonate rocks as it is lifted to the surface. Travertine deposits, consisting primarily of calcite and aragonite with subordinate silica, fluorite, barite, and native sulfur, form around hot springs as terraces, sheets, or mounds. Their texture may be banded, porous, or brecciated; some deposits are pisolitic (made up of concretionary calcium carbonate grains). Hot spring waters that produce travertine deposits usually do not originate at temperatures above 100 °C (Hora, 1996). Figure 26 shows the locations of tracts permissive and favorable for the occurrence of undiscovered travertine dimension-stone deposits in Afghanistan. Hora (1996) reports that large travertine deposits reach 1 to 2 Mt in size in Afghanistan, but deposits as small as tens of thousands to 100,000 metric tons may be important locally for artisanal work, especially in southern Helmand Province. The map in figure 27 shows locations of specific travertine deposits, as well as permissive and favorable tracts for the occurrence of undiscovered travertine deposits in southern Helmand Province. A large-scale map of travertine resources in the Spin Boldak District in southern Kandahar Province, similar to that in figure 27, can be found in Peters and others (2007, p. 697, tract dms04). In these areas, travertine is mined and carved artisanally for the regional economy.
Figure 26. Map showing permissive and favorable tracts for travertine dimension stone in Afghanistan (from Doebrich and Wahl, 2006). The area labeled “Figure 11.4-2” (Helmand Province) is shown in figure 27. The area labeled “Figure 11.4-3” is Spin Boldak. km, kilometers.
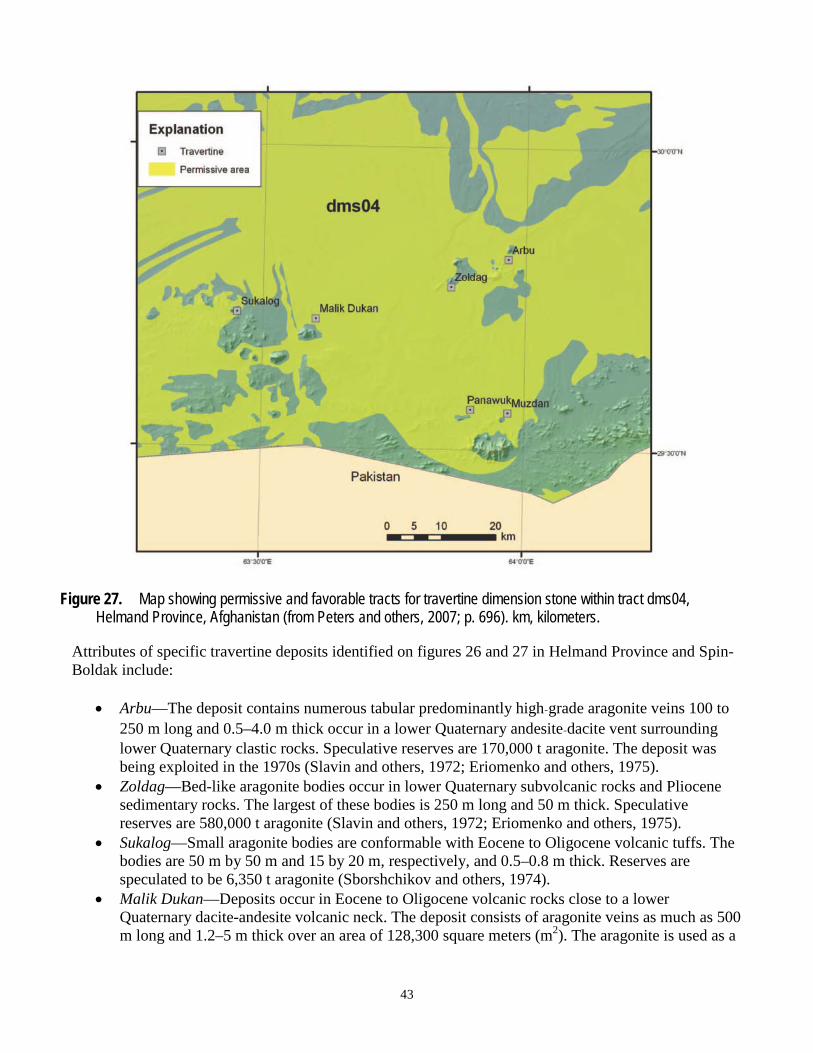
43
Figure 27. Map showing permissive and favorable tracts for travertine dimension stone within tract dms04, Helmand Province, Afghanistan (from Peters and others, 2007; p. 696). km, kilometers.
Attributes of specific travertine deposits identified on figures 26 and 27 in Helmand Province and Spin-Boldak include:
• Arbu—The deposit contains numerous tabular predominantly high‐grade aragonite veins 100 to 250 m long and 0.5–4.0 m thick occur in a lower Quaternary andesite-dacite vent surrounding lower Quaternary clastic rocks. Speculative reserves are 170,000 t aragonite. The deposit was being exploited in the 1970s (Slavin and others, 1972; Eriomenko and others, 1975).
• Zoldag—Bed-like aragonite bodies occur in lower Quaternary subvolcanic rocks and Pliocene sedimentary rocks. The largest of these bodies is 250 m long and 50 m thick. Speculative reserves are 580,000 t aragonite (Slavin and others, 1972; Eriomenko and others, 1975).
• Sukalog—Small aragonite bodies are conformable with Eocene to Oligocene volcanic tuffs. The bodies are 50 m by 50 m and 15 by 20 m, respectively, and 0.5–0.8 m thick. Reserves are speculated to be 6,350 t aragonite (Sborshchikov and others, 1974).
• Malik Dukan—Deposits occur in Eocene to Oligocene volcanic rocks close to a lower Quaternary dacite-andesite volcanic neck. The deposit consists of aragonite veins as much as 500 m long and 1.2–5 m thick over an area of 128,300 square meters (m2). The aragonite is used as a
44
high-grade green and yellow facing and ornamental stone. The reserves are 42,200 t of aragonite (Slavin and others, 1972).
• Panawuk—A dense, fine-grained, light-green, yellowish-green, white, and brownish aragonite that occurs in Eocene to Oligocene volcanic rocks. The aragonite forms a tabular body 12 m in diameter and 3 m thick. Reserves are speculated to be 1,000 t of aragonite (Sborshchikov and others, 1974).
• Muzdan—Deposits occur in Eocene to Oligocene volcanic rocks as three aragonite bodies 200 m long and 1–2 m thick. The bodies consist of large, blocky, green and yellow aragonite. Reserves are speculated to be 11,800 t of aragonite (Sborshchikov and others, 1974).
• Spin-Boldak—Several aragonite veins occur in Lower Cretaceous calcareous sedimentary inliers in Quaternary rocks. The veins are 0.1–0.5 m thick. The coarse, medium- and fine-grained cryptocrystalline aragonite is yellow, dark yellow, grey, and white. The deposit is worked by hand to produce small items.
Marble Mineralogically, marble is calcareous nonfoliated metamorphosed limestone, either massive or
bioclastic (containing fossil fragments), consisting mainly of calcium carbonate with various amounts of dolomite and aragonite. The temperatures and pressures necessary to form marble usually destroy any fossils and sedimentary textures present in the original rock. Pure white marble is the result of metamorphism of very pure limestone. Afghan marble is available in a great variety of colors and patterns. Serpentine, a magnesium iron phyllosilicate, and onyx, a banded variety of chalcedony (cryptocrystalline form of quartz), are also included in the broad definition of marble used by those in the commercial stone business. The characteristic swirls and veins of many colored marble varieties are usually due to various mineral impurities, such as clay, silt, sand, iron oxides, or chert, which were originally present as grains or layers in the limestone. For example, green coloration is often due to members of the serpentine group of common rock-forming hydrousmagnesium-iron-phyllosilicate minerals (Mg,Fe)3Si2O5(OH)4) present in the limestone or dolostone paleolith. Afghan marbles are also texturally variable and can be variegated, brecciated, or banded and commonly contain braided or folded veins of quartz or calcite.
Commercially, marble is recognized as any crystalline sedimentary rock capable of taking a polish (Power, 1994). After granite and limestone, marble is the third most popular dimension stone in demand in Western countries (Dolley, 2004). Marble is extensively used as a building material, as well as for many other applications. Afghan Proterozoic marble is considered to be of the highest quality for use in dimension stone applications. As summarized by Peters and others (2007, p. 688), marble quarries have been worked in provinces throughout Afghanistan, including Badakshan, Maydan, Wardak, Nangahar, Kabul, and Ghazni, Faryab, Logar, Balk, Helmand, Samangan, and Parwan Provinces. Figure 28 shows examples of the remarkable variety of marble colors and patterns available in Afghanistan. USAID, On The Frontier (OTF) Group, and Commercial Competitiveness Commission of Afghanistan (CCCA) (2006) identified six Afghan cities where dimension stone is processed. At the time, little information was available on production at Mazar Sharif, except that the area is a source for a wide variety of marble types. Herat and Kabul, together with about 25 companies in operation, are generally recognized as producing the highest quality marble; Jalalabad produces a medium-quality white stone with three factories; Kandahar, with only one factory, produces low quality marble in a variety of colors; and Lashkar Gah produces white stone and onyx (fig. 29).
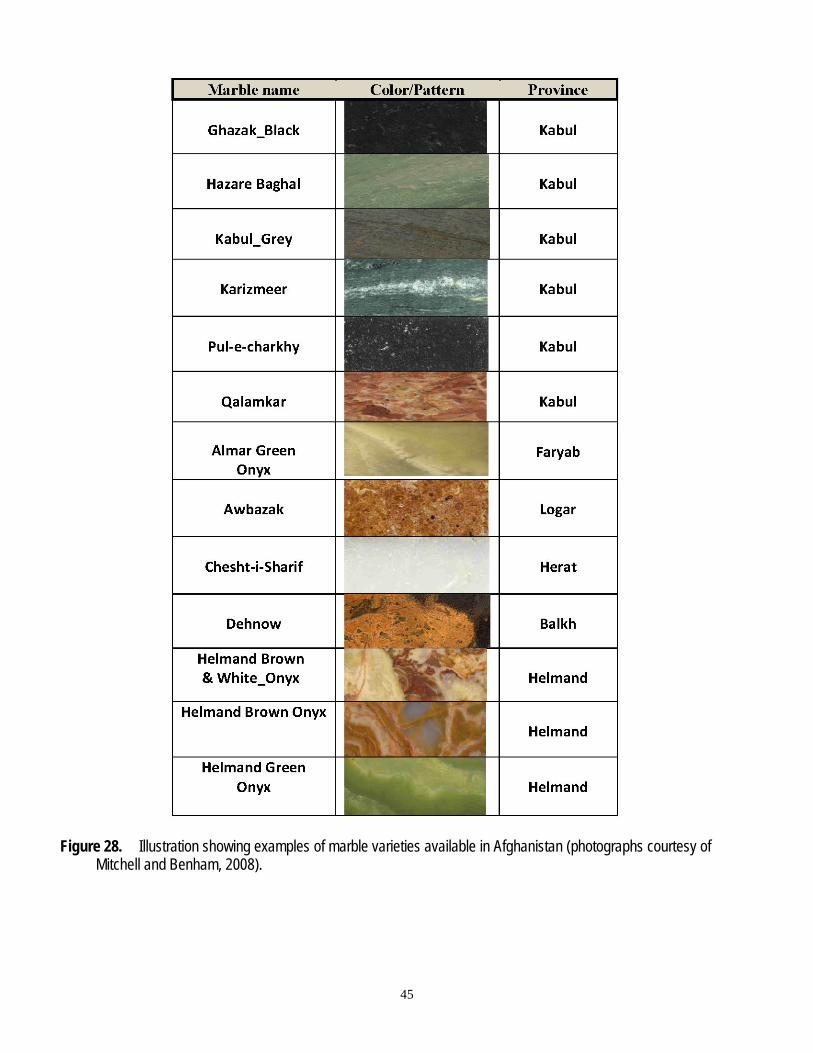
45
Figure 28. Illustration showing examples of marble varieties available in Afghanistan (photographs courtesy of Mitchell and Benham, 2008).
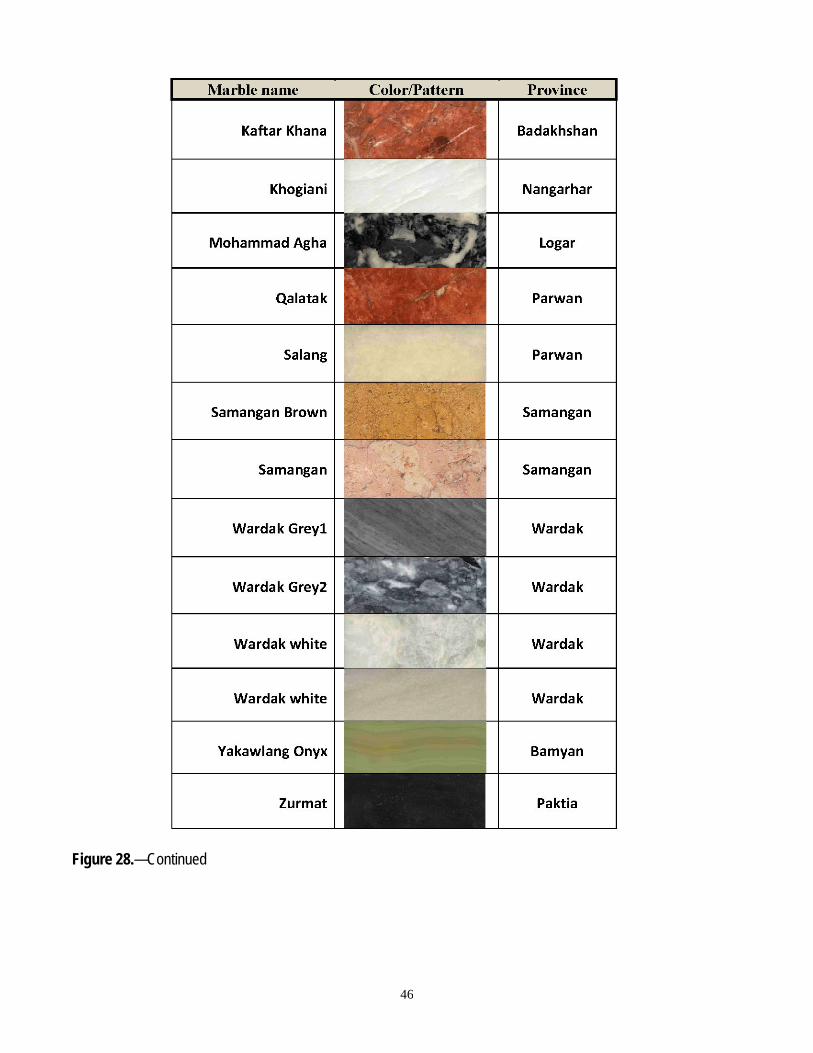
46
Figure 28.—Continued
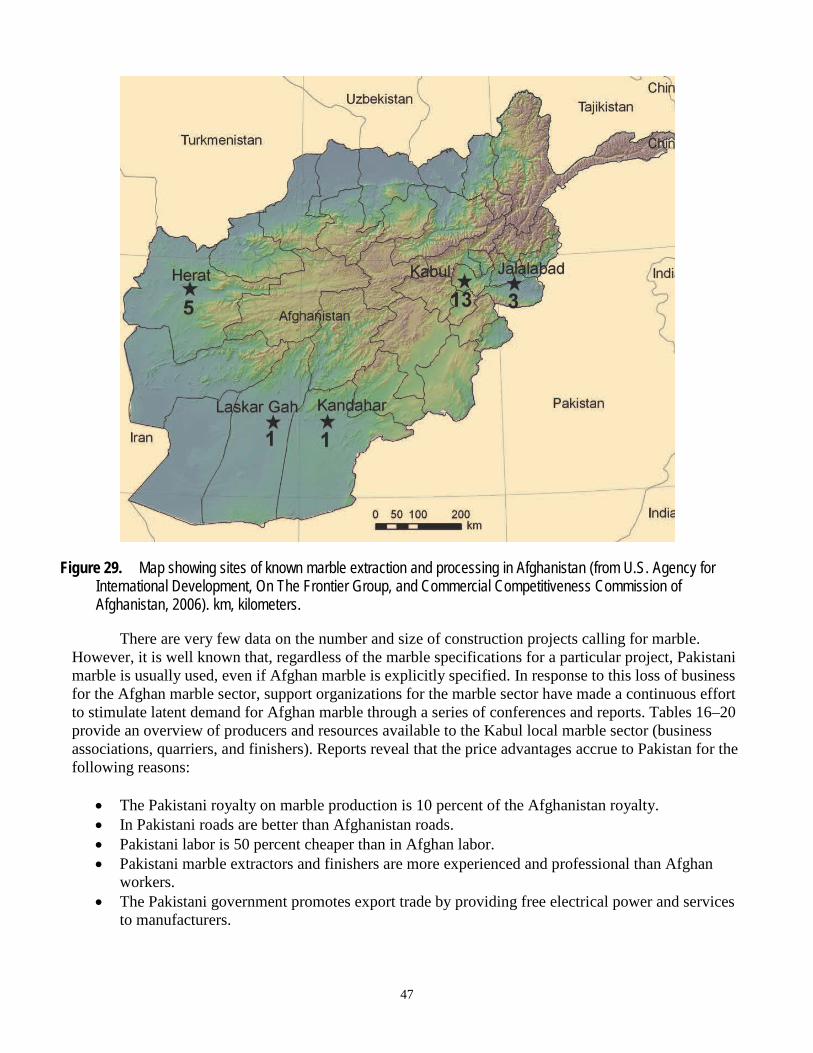
47
Figure 29. Map showing sites of known marble extraction and processing in Afghanistan (from U.S. Agency for International Development, On The Frontier Group, and Commercial Competitiveness Commission of Afghanistan, 2006). km, kilometers.
There are very few data on the number and size of construction projects calling for marble. However, it is well known that, regardless of the marble specifications for a particular project, Pakistani marble is usually used, even if Afghan marble is explicitly specified. In response to this loss of business for the Afghan marble sector, support organizations for the marble sector have made a continuous effort to stimulate latent demand for Afghan marble through a series of conferences and reports. Tables 16–20 provide an overview of producers and resources available to the Kabul local marble sector (business associations, quarriers, and finishers). Reports reveal that the price advantages accrue to Pakistan for the following reasons:
• The Pakistani royalty on marble production is 10 percent of the Afghanistan royalty. • In Pakistani roads are better than Afghanistan roads. • Pakistani labor is 50 percent cheaper than in Afghan labor. • Pakistani marble extractors and finishers are more experienced and professional than Afghan
workers. • The Pakistani government promotes export trade by providing free electrical power and services
to manufacturers.
48
• In Pakistan, many quarry operations are clustered because of their longer history of business. Many retail outlets are readily available to provide services and machine parts. Moreover, many expenses are shared; examples include waste management and road maintenance.
• Pakistan producers have control of the supply chain for replacement parts for mining and finishing machinery used in Afghanistan. There are few if any local retail stores for Pakistani parts in Afghanistan. Because much of the manufacturing equipment is made in Pakistan, replacement parts need to be ordered from Pakistan, with long delays, or backed up in Afghanistan, tying up money. From the Afghan perspective, there is virtually no transparency of the supply chain for machine parts. Afghan production operations can be delayed for weeks and even months, whereas in Pakistan, parts are locally available.
In the discussion to follow, the operational dynamics of two Afghan marble companies are
contrasted with a goal of revealing the relations between their respective value chains, supply chains, business plans, and current profitability. The firms are not hypothetical but were selected as representative of mid-level to upper-level marble producers as measured by their respective geoeconomic niches in the domestic and global marble markets. However, for simplicity and anonymity, the well capitalized firm operating in west Afghanistan with 30–70 permanent employees is identified here as Lrg-FirmHerat, and the mid-sized company operating in east Afghanistan with 5 permanent and 15 temporary employees is identified here as Med-FirmKabul.
Since the well-capitalized firm, Lrg-FirmHerat, was founded in 2006, the company has invested about $40 million (USD) into a modern marble finishing factory and into highly mechanized large quarry operations (fig. 30). By comparison, the family-owned Med-FirmKabul conducts marble extraction on a significantly smaller scale, relying primarily on high-explosive methods for rock extraction, diamond wire saws, diesel-driven power generators, cooling water from tank trucks, and rented wheel loaders. For marble finishing, Med-FirmKabul uses irregular marble blocks for making relatively small slabs and polished tiles for the regional domestic market (fig. 31). Some larger irregular blocks are sold to marble traders for finishing in Pakistan. Med-FirmKabul also uses broken marble pieces and fragments to fabricate synthetic tile by binding marble pieces with colored cement (fig. 32). This product is made to order and is also sold locally in at the Med-FirmKabul retail outlet; nothing extracted by Med-FirmKabul from the marble deposit is wasted. Apart from the obvious differences in scale, both companies extract high-quality white marble under contract to the MoMP. Both firms employ skilled workers, and both recognize that cutting, carving, and polishing marble in-house can incrementally increase the value of the product over unfinished stone taken directly from the quarry. Figures 33 and 34 can be used to facilitate comparison of the value chains, supply and demand profiles, and geoeconomic niches for Lrg-FirmHerat and Med-FirmKabul. Comments on figures 33 and 34 are summarized in table 17.
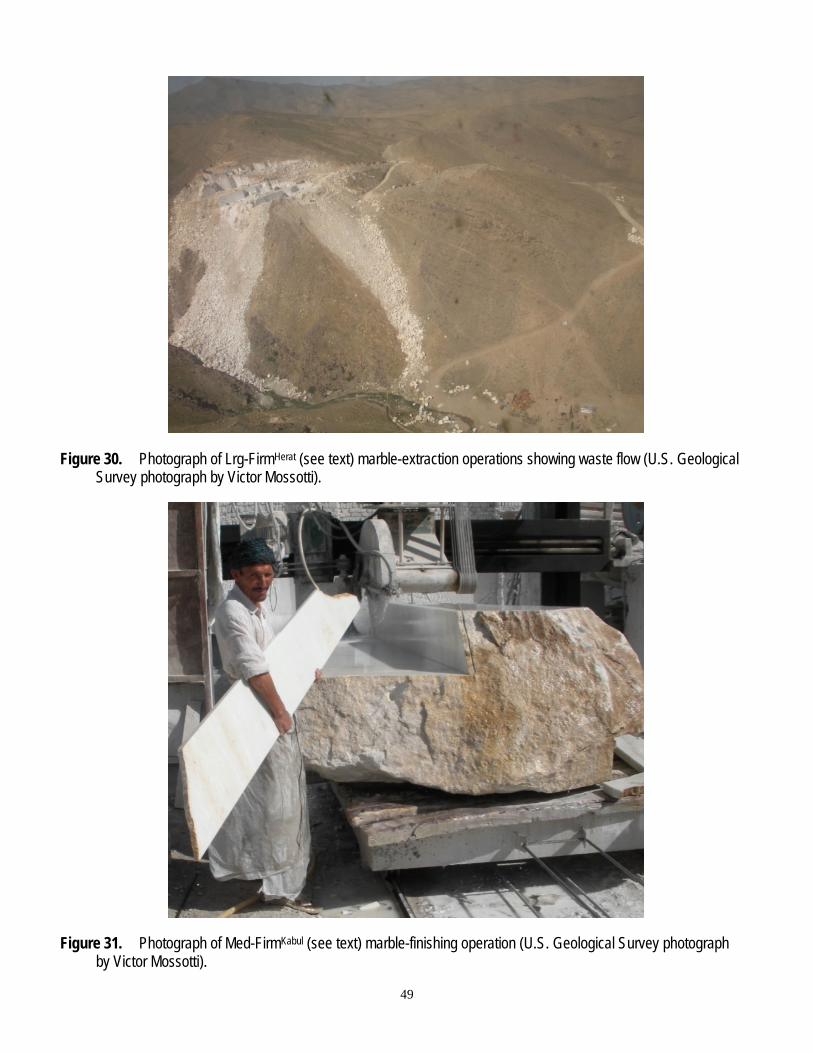
49
Figure 30. Photograph of Lrg-FirmHerat (see text) marble-extraction operations showing waste flow (U.S. Geological Survey photograph by Victor Mossotti).
Figure 31. Photograph of Med-FirmKabul (see text) marble-finishing operation (U.S. Geological Survey photograph by Victor Mossotti).
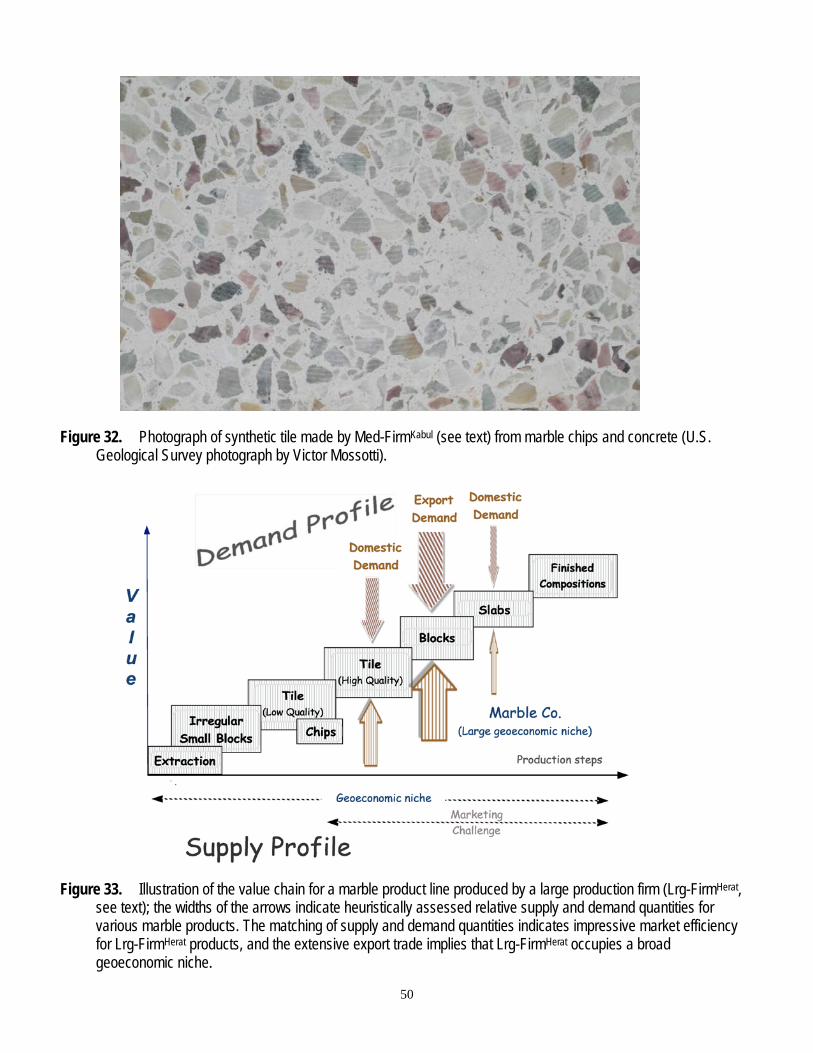
50
Figure 32. Photograph of synthetic tile made by Med-FirmKabul (see text) from marble chips and concrete (U.S. Geological Survey photograph by Victor Mossotti).
Figure 33. Illustration of the value chain for a marble product line produced by a large production firm (Lrg-FirmHerat, see text); the widths of the arrows indicate heuristically assessed relative supply and demand quantities for various marble products. The matching of supply and demand quantities indicates impressive market efficiency for Lrg-FirmHerat products, and the extensive export trade implies that Lrg-FirmHerat occupies a broad geoeconomic niche.
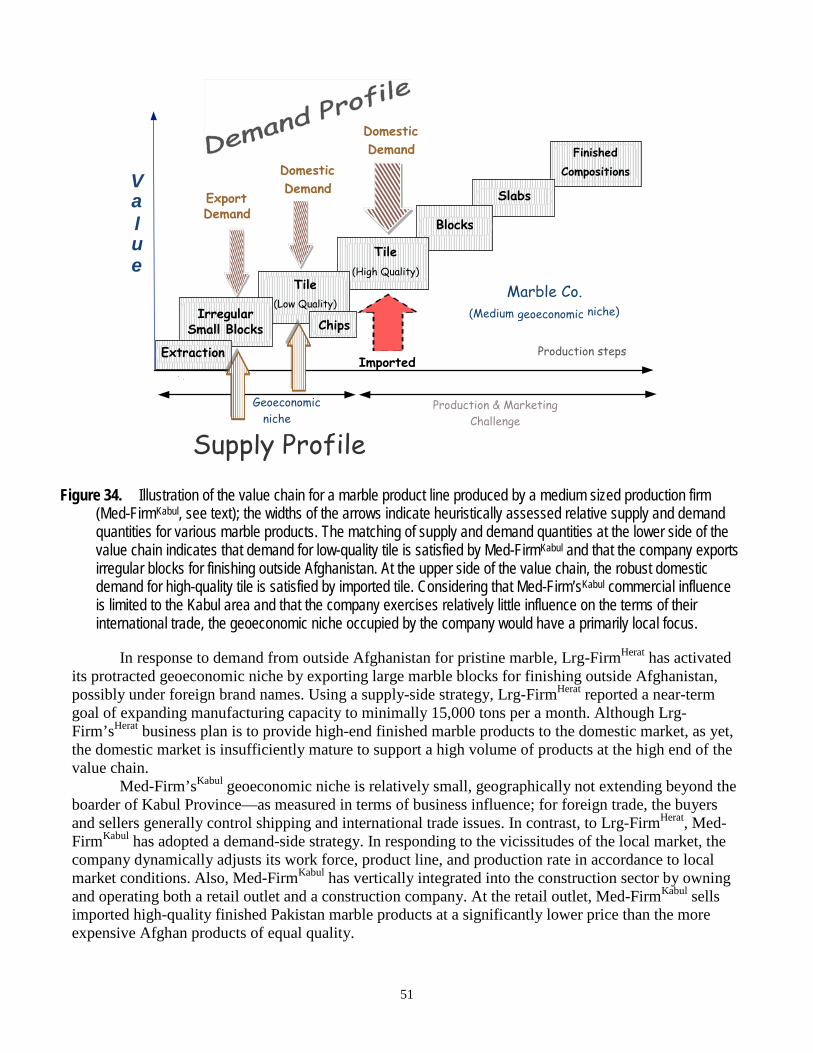
51
Figure 34. Illustration of the value chain for a marble product line produced by a medium sized production firm (Med-FirmKabul, see text); the widths of the arrows indicate heuristically assessed relative supply and demand quantities for various marble products. The matching of supply and demand quantities at the lower side of the value chain indicates that demand for low-quality tile is satisfied by Med-FirmKabul and that the company exports irregular blocks for finishing outside Afghanistan. At the upper side of the value chain, the robust domestic demand for high-quality tile is satisfied by imported tile. Considering that Med-Firm’sKabul commercial influence is limited to the Kabul area and that the company exercises relatively little influence on the terms of their international trade, the geoeconomic niche occupied by the company would have a primarily local focus.
In response to demand from outside Afghanistan for pristine marble, Lrg-FirmHerat has activated its protracted geoeconomic niche by exporting large marble blocks for finishing outside Afghanistan, possibly under foreign brand names. Using a supply-side strategy, Lrg-FirmHerat reported a near-term goal of expanding manufacturing capacity to minimally 15,000 tons per a month. Although Lrg-Firm’sHerat business plan is to provide high-end finished marble products to the domestic market, as yet, the domestic market is insufficiently mature to support a high volume of products at the high end of the value chain.
Med-Firm’sKabul geoeconomic niche is relatively small, geographically not extending beyond the boarder of Kabul Province—as measured in terms of business influence; for foreign trade, the buyers and sellers generally control shipping and international trade issues. In contrast, to Lrg-FirmHerat, Med-FirmKabul has adopted a demand-side strategy. In responding to the vicissitudes of the local market, the company dynamically adjusts its work force, product line, and production rate in accordance to local market conditions. Also, Med-FirmKabul has vertically integrated into the construction sector by owning and operating both a retail outlet and a construction company. At the retail outlet, Med-FirmKabul sells imported high-quality finished Pakistan marble products at a significantly lower price than the more expensive Afghan products of equal quality.
Finished Compositions
Slabs
Blocks
Tile (High Quality)
Tile (Low Quality)
Irregular Small Blocks
Extraction
Chips
Production steps
Marble Co. (Medium geoeconomic niche)
V a l u e
Supply Profile
Geoeconomic niche
Export Demand
Domestic Demand
Imported
Domestic Demand
Production & Marketing Challenge
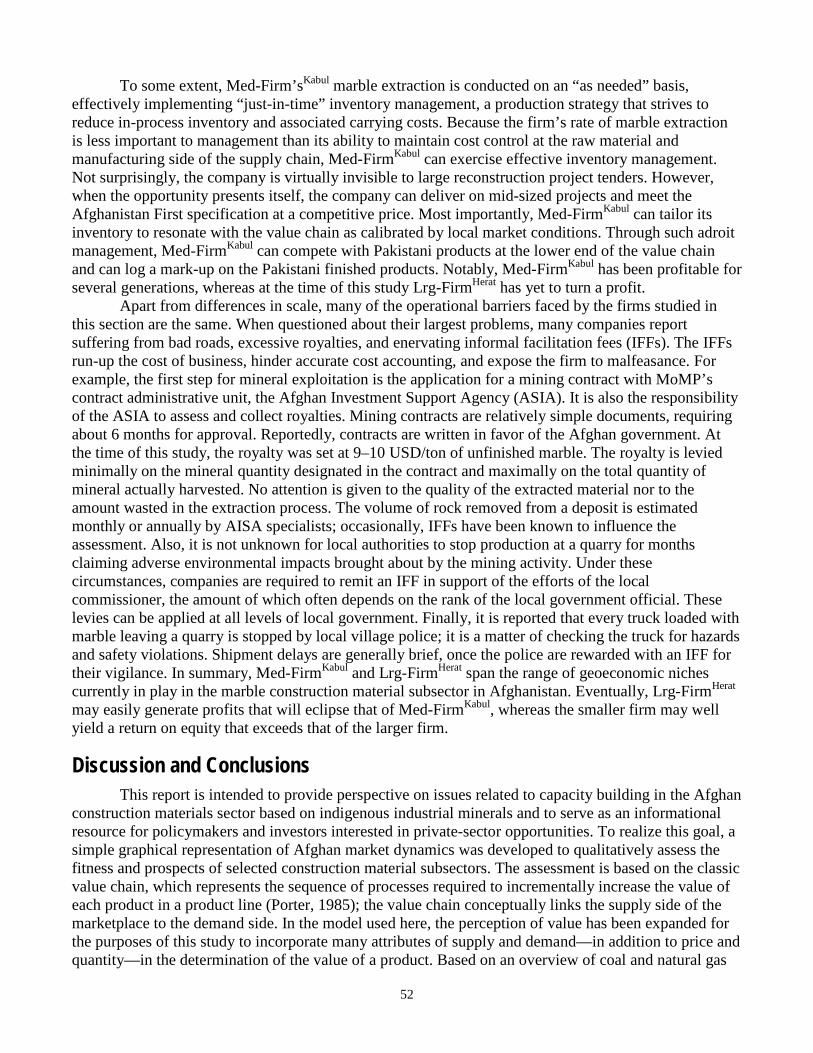
52
To some extent, Med-Firm’sKabul marble extraction is conducted on an “as needed” basis, effectively implementing “just-in-time” inventory management, a production strategy that strives to reduce in-process inventory and associated carrying costs. Because the firm’s rate of marble extraction is less important to management than its ability to maintain cost control at the raw material and manufacturing side of the supply chain, Med-FirmKabul can exercise effective inventory management. Not surprisingly, the company is virtually invisible to large reconstruction project tenders. However, when the opportunity presents itself, the company can deliver on mid-sized projects and meet the Afghanistan First specification at a competitive price. Most importantly, Med-FirmKabul can tailor its inventory to resonate with the value chain as calibrated by local market conditions. Through such adroit management, Med-FirmKabul can compete with Pakistani products at the lower end of the value chain and can log a mark-up on the Pakistani finished products. Notably, Med-FirmKabul has been profitable for several generations, whereas at the time of this study Lrg-FirmHerat has yet to turn a profit.
Apart from differences in scale, many of the operational barriers faced by the firms studied in this section are the same. When questioned about their largest problems, many companies report suffering from bad roads, excessive royalties, and enervating informal facilitation fees (IFFs). The IFFs run-up the cost of business, hinder accurate cost accounting, and expose the firm to malfeasance. For example, the first step for mineral exploitation is the application for a mining contract with MoMP’s contract administrative unit, the Afghan Investment Support Agency (ASIA). It is also the responsibility of the ASIA to assess and collect royalties. Mining contracts are relatively simple documents, requiring about 6 months for approval. Reportedly, contracts are written in favor of the Afghan government. At the time of this study, the royalty was set at 9–10 USD/ton of unfinished marble. The royalty is levied minimally on the mineral quantity designated in the contract and maximally on the total quantity of mineral actually harvested. No attention is given to the quality of the extracted material nor to the amount wasted in the extraction process. The volume of rock removed from a deposit is estimated monthly or annually by AISA specialists; occasionally, IFFs have been known to influence the assessment. Also, it is not unknown for local authorities to stop production at a quarry for months claiming adverse environmental impacts brought about by the mining activity. Under these circumstances, companies are required to remit an IFF in support of the efforts of the local commissioner, the amount of which often depends on the rank of the local government official. These levies can be applied at all levels of local government. Finally, it is reported that every truck loaded with marble leaving a quarry is stopped by local village police; it is a matter of checking the truck for hazards and safety violations. Shipment delays are generally brief, once the police are rewarded with an IFF for their vigilance. In summary, Med-FirmKabul and Lrg-FirmHerat span the range of geoeconomic niches currently in play in the marble construction material subsector in Afghanistan. Eventually, Lrg-FirmHerat may easily generate profits that will eclipse that of Med-FirmKabul, whereas the smaller firm may well yield a return on equity that exceeds that of the larger firm.
Discussion and Conclusions This report is intended to provide perspective on issues related to capacity building in the Afghan
construction materials sector based on indigenous industrial minerals and to serve as an informational resource for policymakers and investors interested in private-sector opportunities. To realize this goal, a simple graphical representation of Afghan market dynamics was developed to qualitatively assess the fitness and prospects of selected construction material subsectors. The assessment is based on the classic value chain, which represents the sequence of processes required to incrementally increase the value of each product in a product line (Porter, 1985); the value chain conceptually links the supply side of the marketplace to the demand side. In the model used here, the perception of value has been expanded for the purposes of this study to incorporate many attributes of supply and demand—in addition to price and quantity—in the determination of the value of a product. Based on an overview of coal and natural gas
53
resources, the question of the feasibility of the use of natural gas as the primary energy source for cement production is morphed into a strategy for energy optimization with diverse energy sources. For success in the marketplace, two conditions need to be satisfied. The first condition, although necessary, but not sufficient for activating commercial transactions, is that a crucial set of demand attributes needs to be mirrored by a corresponding set of supply attributes proffered by the producer. The second condition for commercial success, and perhaps the most enigmatic to address, is that venders need to carve out a viable geoeconomic niche in the marketplace if a particular product line is to be successful. In reality, the geoeconomic niche can be recognized by measures such as market penetration, price-making ability, and brand recognition, as well as by intangible factors such as political influence, strength of relationships, and goodwill.
On the demand side, insight into the general structure of demand patterns was obtained from interviews with and reports by company owners, facility directors, project inspectors and MoMP staff, and by tracking the flow of funding from source to shovel for well-funded ARTF projects. Based on quantitative and qualitative evidence from such sources, it was inferred that the general structure of demand profiles could be correlated with the level of capitalization of the buyer and with the geographic location of the target market for the products. For example, demand profiles associated with highly capitalized and moderately capitalized export and domestic buyers for products made with indigenous Afghan industrial minerals were narrowly focused, usually at the lower end of the value chain.
By comparison, demand profiles associated highly capitalized institutionally funded buyers of products for domestic use tended to resemble a primitive power-law distribution, with relatively few transaction at the high end of the value chain and continually increasing number of transactions toward the lower end. Projects characterized by such demand profiles pursue a wide range of merchandise. At the high end of the value chain, relatively few buyers at the wellspring of funding have the budget to acquire specialized costly products. Procurement continues toward the lower end of the value chain with increasing quantities of less costly products. At the lowest end of the demand profile, broadly disseminated funds are often thinly stretched for expendable supplies, minor equipment, and services, resulting in compromised quality and project incompletion. Because of weak power-law characteristics of the demand pattern, the statistical metrics of the demand side of the market are probably unreliable (Gabaix and others, 2003, p. 269).
Perhaps not surprisingly, the management challenge in large complex projects is that of monitoring the supply chain, the flow of money, construction quality, and project progress. For example, for large WB projects in Afghanistan, the WB entrusted project monitoring to the Control and Audit Office (CAO) of the Afghanistan government. SIGAR reports that less than 15 percent of the funded ARTF projects were audited and that most of the projects that were inspected fell short of quality specifications or of completion. SIGAR also noted that the CAO has conflicting responsibilities with Afghanistan’s Ministry of Finance with respect to project inspection, fund allocation, and procurement protocols (SIGAR, 2010, p. ii). Curiously, current legislation in Afghanistan does not require the CAO to report to the national assembly or to publicly release its audit reports; for the most part, on-site inspection reports seem to be nonexistent (WB, 2011, p.4). The lack of feedback from the job site exacerbates the challenges for management at all levels to control compliance with construction specifications and project completion.
On the supply side, the value-chain diagrams in figures 6, 9, 14, 17, 18, 28, and 29 were designed to render qualitative assessment of supply attributes relative to demand attributes for the various Afghan construction materials subsectors by cursory inspection of the similitude of supply and demand profiles and geoeconomic niches. As measured by return on equity, very small producers generally exercised full control over their supply chains and, in terms of return on capital investment, were generally more profitable than the higher capitalized firms. Medium sized firms, with solid, although geographically limited, geoeconomic niches in the market place were also profitable. Moreover, singularities in the value chains for products produced from indigenous industrial minerals
54
suggest that the markets for such products are more stable and more predictable than the markets for product lines characterized by power-law value chains. Finally, it is difficult to assess the long-term prospects for highly capitalized production operations with more complex, and possibly more obscure, supply chains.
Comments on the Technical Feasibility of NG-to-Thermal and NG-to-Electrical Use in Cement Production
Over the past 50 years, powdered coal and NG have been proven to be excellent fuels for firing kilns at cement plants. Both fuels have their relative advantages energetically and environmentally. Both fuels are also used as energy sources for electrical generation. In recent years, gas-fired turbines for electric power generation have been proved to be especially efficient in converting natural gas into electrical energy, especially in a cogeneration configuration where high-temperature turbine exhaust is used for drying raw materials and for preheating the kiln and kiln feed for pyroprocessing. Although the potential for harvesting rich bounties of coal and NG in Afghanistan might be high, the probability of delivering on the potential in the foreseeable future may be tipped in favor of NG because technical issues related to coal extraction may be more problematic. Likewise, the long-term availability and reliability of public-grid electrical power is somewhat dubious. Because all options are technically feasible, the question for plant design is that of optimization of energy technologies for a given plant at a particular time and place, based on a diverse mix of energy and transport technologies.
Comments on Construction Material Subsectors—Adobe Clay, Limestone, Clay (Limestone Shale), Bauxite, Gypsum, and Aggregate
Evidence indicates that in the Afghanistan construction materials sector, firms that operate at the low end of the value chain are the most likely to comply with AFP. Primary examples include firms providing minimal beneficiation of the massive quantities of indigenous industrial minerals such as adobe clay (sun-dried brick), sand and gravel (concrete), and limestone, clay, and bauxite (for cement). Compliance with AFP most likely has been circumstantial, given that such producers are collocated with the user of these products. In contrast, firms working with large projects probably have a mixed pattern of compliance with AFP. For example, in the irrigation project (fig. 5), a large number of producers and service providers serve the same customer—the administrative unit at the head of the large project. In this case, a complex array of services and products are represented in a demand pattern that spans the entire breath of the value chain, where at the high-end compliance with AFP often is not possible.
Cement production—The potential use of domestic industrial minerals for cement and concrete production (limestone, clay, bauxite, gypsum, sand, and gravel) is very high. Raw material reserves are reliable, and the supply chain for the quarried materials is generally very simple and under full control of production companies. Although the potential for export trade is unfavorable, competition is virtually nonexistent in the local domestic markets for raw materials.
There are numerous reports trumpeting favorable prospects for domestic cement production in Afghanistan. Most of the reports are mutually referential, and many are based on overly optimistic obscure assumptions. The technical facts for the long-term prospects for domestic cement production in Afghanistan are favorable, even in a competitive environment. However, the policies put in place by domestic governance and by neighboring countries, through laws controlling mining, resource beneficiation, and international trade, may be the overriding determinants of long-term prospects for domestic cement production. Capacity building in the cement sector crucially depends of the availability of electrical and thermal energy. As currently engineered, thermal energy for firing kilns is provided by burning coal; electrical energy is typically tapped from the grid. At the time of this writing, unless these energy sources are quickly ramped up, or unless an alternative energy system is adopted, growth in the Afghan cement-manufacturing sector will remain stagnant.
55
Marble production—For Afghan marble producers, the domestic market for finished marble construction materials is price taking. This is because high quality Pakistani-finished and Chinese-finished marble construction materials are readily available across the country at prices that can be as much as 75 percent lower than Afghan-finished marble. Although MoMP has taken steps to curtail the flow of Pakistani-finished marble into Afghanistan, the supply of imported marble persists, and prices remain low.
Closing Comments For many reasons, the nascent network of geoeconomic supply chains has yet to self-organize in
Afghanistan across a wide range of scales and across a broad spectrum of business. Although the long-term prospects for economic growth in Afghanistan are favorable, there are few institutional shock absorbers to dampen sudden imbalances in the system. For example, as a matter of perspective, over the past decade, the Islamic Republic of Afghanistan will have received contributions from donor countries for reconstruction the equivalent of $10,000 (USD) per Afghan citizen (Poole, 2011; Cordesman and Burke, 2012; SIGAR, 2012b, p.4). Apart from the palpable security issues, a shock to the Afghan economy following the drawdown of the coalition military is fairly predictable. When the flood of coalition funding is cut-off, along with money for construction of military resources, the construction materials sector will be highly stressed. Moreover, there is little evidence indicating that the intense competition from imported construction materials will abate. Thus, the current challenge to Afghan governance would seem to be the creation of conditions that are compelling to private investment.
Acknowledgments Many people have assisted in this study. My thanks go to Hendrik G. van Oss (USGS), Henrik
Weissling (Heidelberg Cement), and Michael Clark, (Whitehopleman Consultancy) for sharing their extensive knowledge of cement manufacturing with me; Capt. Scott Bischoff and Maj. Ryan Eyer—both U.S. Marine Corps—for their good judgment, friendship, and for providing access to MoMP; to Esmatullah Hasrat (Haji Abdurahman's Sons Marble Company) for sharing so much of his time; to Mohammad Fahim Zaheer for his excellent work as interpreter and liaison officer; to Abdul Razique Samadi (CEO of Da Afghanistan Breshna Sherkat) and his staff for their cooperation in this study; to Michael Lechner (M&S Energy) and Dirk Van Ulden (Associate Director, University of California Energy and Utilities) for facilitating my NG-to-electric discovery work; to Robert Reid (Associate Director, Stanford University Energy Management) for sharing his extensive knowledge and experience of the use of NG for power generation and storage on a 50-MW footprint; to Gregory A. Baker (Director, School of Agribusiness, Santa Clara University), Stephen G. Peters (USGS), Warren J. Nokleberg (USGS), and, again, to Hendrik G. van Oss (USGS), for reviewing the manuscript; and to U.S. Department of Defense-Task Force for Business and Stability Operations (TFBSO) for supporting this work.
References Cited Abdullah, Sh., and Chmyriov, V.M., eds., 2008, Geology and mineral resources of Afghanistan: British
Geological Survey Occasional Publication No. 15, 2 vol., accessed July 2014, at http://www.bgs.ac.uk/downloads/browse.cfm?sec=7&cat=83.
Abdullah, Sh., Chmyriov, V.M., Stazhilo-Alekseev, K.F., Dronov, V.I., Gannan, P.J., Rossovskiy, L.N., Kafarskiy, A.Kh., and Malyarov, E.P., 1977, Mineral resources of Afghanistan, 2nd ed.: Kabul, Afghanistan, Republic of Afghanistan Geological and Mineral Survey, 419 p.
56
Afghanistan Central Statistics Organization, 2010, Afghanistan Statistical Yearbook, 2009–2010: Afghanistan Central Statistics Organization, accessed July 2014, at http://cso.gov.af/en/page/1500/4722/4723.
Afghanistan Ministry of Mines and Petroleum [MoMP], 2010, Cement quality limestone in the vicinity of Aybak, Samangan Province, Afghanistan, AGS Investor Data Package No. 4: Kabul, Afghanistan, Afghanistan Ministry of Mines and Petroleum, 7 p., accessed July 2014, at http://mom.gov.af/Content/files/Aybak_Limestone.pdf.
Afghanistan Ministry of Mines and Petroleum [MoMP], 2013, Extractive Industries Transparency Initiative: Afghanistan Ministry of Mines and Petroleum Web site, accessed September 22, 2013, at http://mom.gov.af/en/page/11365/1383.
Afghanistan Reconstruction Trust Fund [ARTF], 2012, ARTF Annual Report SY1390: March 21, 2011 to March 19, 2012: Afghanistan Reconstruction Trust Fund, accessed July 2014, at http://documents.worldbank.org/curated/en/2012/03/16541984/afghanistan-reconstruction-trust-fund-artf-annual-report-sy1390-march-21-2011-march-19-2012/.
Afghanistan Research and Evaluation Unit [AREU], 2012, The A to Z guide to Afghanistan assistance, 10th ed.: Kabul, Afghanistan, Afghanistan Research and Evaluation Unit Web site, accessed July 2014, at http://www.areu.org.af/ContentDetails.aspx?ContentId=19&ParentId=19.
Afghan Zariza, 2014, 20 miners killed in a coal mine explosion in Samangan: Afghan Zariza, May 1, 2014, accessed July, 2014, at http://www.afghanzariza.com/2014/05/01/20-miners-killed-in-a-coal-mine-explosion-in-samangan#sthash.BmtoAgdi.pLTs0FFH.dpuf.
Aljazeera, 2013, Afghan miners killed in coal mine collapse [September 15, 2013]: Aljazeera Web site, accessed September 2014, at http://www.aljazeera.com/news/asia/2013/09/201391563752759330.html.
Ames, J.A., Cutcliffe, W.E., and Macfadyen, J.D., 1994, Cement and cement raw materials, in Carr, D.D., senior editor, Industrial Minerals and Rocks: Littleton, Colorado, Society for Mining, Metallurgy and Exploration, Inc., p. 295-316.
Antonides, L.E., 1997, Stone, dimension, in Metals and Minerals: U.S. Geological Survey Minerals Yearbook, v. I, p. 74.1–74.3, accessed July 2014, at http://minerals.usgs.gov/minerals/pubs/commodity/stone_dimension/800497.pdf.
Ashurmatov, D., 2007, Uzbekistan to launch cement enterprise by 2010: Uzbekistan Today, March 30, 2010, accessed July 11, 2011, at http://www.ut.uz/eng/business/uzbekistan_to_launch_cement_enterprises_by_2010.mgr.
ASTM [formerly American Society for Testing and Materials], 2008, ASTM, C18, C119-08—Standard terminology relating to dimension stone: ASTM, p. 8, ISBN 0-8031-4118-1.
ASTM [formerly American Society for Testing and Materials], 2010, ASTM standards for ready-mixed concrete standards, 5th ed.: ASTM, accessed July 2014, at http://www.nxtbook.com/nxtbooks/astm/productscatalog2012/index.php?startid=26.
Barton, W.R., 1968, Dimension Stone: U.S. Bureau of Mines Information Circular 8391, 147 p. Blanchard, D., 2010, Supply-chain management best practices, 2nd ed.: John Wiley & Sons, Inc., 320 p.,
ISBN: 978-0-470-53188-4. Bliss, J.D., and Bolm, K.S., 2001, Statistical analysis of sand and gravel aggregate deposits of late
Pleistocene Lake Bonneville, Utah, in Bon, R.L., Riordan, R.F., and Krukowski, S.T., eds., Proceedings of the 35th forum on the geology of industrial minerals—the intermountain west forum 1999: Utah Geological Survey Miscellaneous Publication 01-2, p. 195–214.
Bliss, J.D., and Bolm, K.S., 2007, Preliminary assessment of sand and gravel resources of Afghanistan, chapter 10.3 of Peters, S.G., Ludington, S.D., Orris, G.J., Sutphin, D.M., Bliss, J.D., and Rytuba, J.J., eds., and the U.S. Geological Survey-Afghanistan Ministry of Mines Joint Mineral Resource Assessment team, Preliminary nonfuel mineral resource assessment of Afghanistan: U.S. Geological Survey Open-File Report 2007–1214, p. 484–676, CD–ROM, http://pubs.usgs.gov/of/2007/1214/.
57
Bliss, J.D., and Page, N.J., 1994, Modeling surficial sand and gravel deposits: Nonrenewable Resources, v. 3, p. 237–249.
Bogue, R.H., 1947, The chemistry of Portland cement: New York, Reinhold Publishing Corp., 572 p. Box, T.D., 2006, Feasibility study for the Afghanistan cement sector—Volume I—Report for the
Ministry of Mines and Industries, the Islamic Republic of Afghanistan: Arlington, Va., Box International Consulting, 298 p.
Caldwell, J.H., Schaller, K.L., Lasher, R.S., Peles, E., and Levinson, S.R., 2000, Sodium channel Nav1.6 is localized at nodes of Ranvier, dendrites, and synapses: Proceedings of the National Academy of Sciences, v. 97, no. 10, p. 5616–5620, accessed July 2014, at http://www.ncbi.nlm.nih.gov/pmc/articles/PMC25877/?tool=pmcentrez.
Central Intelligence Agency, 2014, The World Factbook: Central Intelligence Agency Web site, accessed July 2014, at https://www.cia.gov/library/publications/the-world-factbook/fields/2253.html.
Clarke, J.W., and Kleshchev, K., 1992, Dauletabad-Donmez field—Commonwealth of Independent States (former USSR) Amu-Dar'ya Basin, Turkmenistan/Uzbekistan, in Foster, N.H., and Beaumont, E.A., compilers, Stratigraphic traps III: American Association of Petroleum Geologists, Treatise of Petroleum Geology, Atlas of Oil and Gas Fields, p. 285–300.
Clark, S.H.B., Gallagher, M.J., and Poole, F.G., 1990, World barite resources—A review of recent production patterns and a genetic classification: Institution of Mining and Metallurgy, Transactions of the Institution of Mining and Metallurgy, Section B, Applied Earth Science, v. 94, p. B125–B132.
Coito, F., Powell, F., Worrell, E., Price, L., and Friedmann, R., 2005, Case Study of the California Cement Industry, in Proceedings of the American Council for an Energy Efficient Economy 2005 Summer Study on Energy Efficiency in Industry: American Council for an Energy Efficient Economy, 12 p., accessed September 2014, at http://aceee.org/files/proceedings/2005/data/papers/SS05_Panel04_Paper02.pdf.
Cordesman, A.H., and Burke, A.A., 2012, The U.S. cost of the Afghan war; FY2002–2014—Cost in military operating expenditures, aid, and prospects for “transition”: Center for Strategic and International Studies, May 14, 2012, 13 p., accessed July 2014, at http://csis.org/files/publication/120515_US_Spending_Afghan_War_SIGAR.pdf.
Da Afghanistan Breshna Sherkat [DABS], 2014, Da Afghanistan Breshna Sherkat procurement notices [February–March 2014]: Da Afghanistan Breshna Sherkat Web site, accessed July 2014, at http://www.dabs.af/en/procurement/.
Doebrich, J.L., and Wahl, R.R., 2006, Geologic and mineral resource map of Afghanistan: U.S. Geological Survey Open-File Report 2006–1038, scale 1:850,000, accessed June 9, 2011, at http://pubs.usgs.gov/of/2006/1038/.
Dolley, T.P., 2004, Stone, dimension: U.S. Geological Survey 2004 Minerals Yearbook, Volume I—Metals and Minerals, p. 72.1–72.20, accessed July 2014, at http://minerals.usgs.gov/minerals/pubs/commodity/stone_dimension/dstonmyb04.pdf.
Eriomenko, C.K., Vikhter, B.Ya., Chmyriov, V.M., Khamidi K., 1975, Volcanic Quaternary carbonatite complex in Afghanistan: DAN SSSR, v. 223, 2 p.
Evans, J., 1999, Evaporites—Their evolution and economics: Malden, Maine, Blackwell Science, Ltd., p. 138–140.
Feldman, S.R., 2006, Salt, in Kogel, J.E., Trivedi, N.C., Barker, J.M., and Krukowski, S.T., eds., Industrial minerals and rocks, 7th ed.: Littleton, Colo., Society for Mining, Metallurgy, and Exploration, Inc., p. 793–813.
Foster, J., 2008, A pipeline through a troubled land—Afghanistan, Canada, and the new great energy game: Canadian Center for Policy Alternatives, Foreign Policy Series, June 19, 2008, v. 3, no. 1, p. 17, accessed July 2014, at http://www.policyalternatives.ca/sites/default/files/uploads/publications/National_Office_Pubs/2008/A_Pipeline_Through_a_Troubled_Land.pdf.
58
Gabaix, X., Gopikrishnan, P., Plerou, V., and Stanley, H.E., 2003, A theory of power-law distributions in financial market fluctuations: Nature, v. 423, p. 267–270.
Ghiazza, M., Gazzano, E., Bonelli, B., Fenoglio, I., Polimeni, M., Ghigo, D., Garrone, D., and Fubini, B., 2009, Formation of a vitreous phase at the surface of some commercial diatomaceous earth prevents the onset of oxidative stress effects: Chemical Research in Toxicology, v. 22, no. 1, p. 136–145, doi:10.1021/tx800270g.
Global Cement News, 2013a, Iraq follows Turkmenistan on Iranian imports: Global Cement Web site, June 11, 2013, accessed July 2014, at http://www.globalcement.com/news/item/1711-iraq-follows-turkmenistan-on-iranian-imports.
Global Cement News, 2013b, Pakistan domestic cement sales reach record 25Mt in 2012–2013: Global Cement Global Cement Web site, July 10, 2013, accessed July 2014, at http://www.globalcement.com/news/item/1778-pakistan-domestic-cement-sales-reach-record-25mt-in-2012-2013.
Global Cement News, 2014, Egyptian cement producers cope with gas shortages: Global Cement Web site, June 27, 2014, accessed July 2014, at http://www.globalcement.com/news/item/1759-egyptian-cement-producers-cope-with-gas-shortages.
Haapala, K.V., 1972, Stabilizing and restoring old adobe structures in California: Murphy, Calif., National Association of Restoration Specialists Newsletter, June, 1972.
Harben, P.W., 2002, Celestite and strontium compounds, in The industrial minerals handbook—A guide to markets, specifications and prices, 4th ed.: Worcester Park, United Kingdom, Industrial Minerals Information, Ltd., p. 94–98.
Harben, P.W., and Kuzvart, M., 1996, Industrial minerals—A global geology: London, Industrial Minerals Information, Ltd., 462 p.
Hare, T.M., Davis, P.A., Nigh, D., Skinner, J.A., Jr., SanFilipo, J.R., Bolm, K.S., Fortezzo, C.M., Galuszka, D., Stettner, W.R., Sultani, S, and Billal, N., 2008, Large-scale digital geologic map databases and reports of the North Coal District in Afghanistan: U.S. Geological Survey Data Series 317 (dual-layer DVD-ROM), accessed July 2014, at http://pubs.usgs.gov/ds/317/.
Helmuth, R., 1987, Fly ash in cement and concrete: Skokie, Ill., Portland Cement Association, Research and Development Laboratories, SP040T, p. 91.
Holland, T.C., 2005, Silica fume user’s manual: Silica Fume Association, FHWA-IF-05-016, p. 2, accessed July 2014, at http://www.silicafume.org/pdf/silicafume-users-manual.pdf.
Hora, Z.D., 1996, Dimension stone—Marble, in Lefebure, D.V., and Hõy, T., eds., Selected British Columbia Mineral Deposit Profiles, vol. 2—Metallic deposits: British Columbia Ministry of Employment and Investment, Open File 1996–13, p. 29–30.
Hora, Z.D., 2007, R—Industrial rocks, in British Columbia mineral deposit profiles: British Columbia Ministry of Energy and Mines Web site, accessed July 2014, at http://www.empr.gov.bc.ca/Mining/Geoscience/MineralDepositProfiles/ListbyDepositGroup/Pages/RIndustrialRocks.aspx#r09.
Hussain, D., 2012, Cement prices for Afghanistan jump to $60 per ton: Dawn.com, April 5, 2012, accessed July 2014, at http://www.dawn.com/news/708069/cement-prices-for-afghanistan-jump-to-60-per-ton.
International Energy Agency [IEA], 1999, Greenhouse Gas R&D Programme, 1999, Report no. PH3/7, 112 p.
International Cement Review, 2014, Arabian Cement Company begins preliminary coal usage, Egypt: International Cement Review, June 3, 2014, accessed July 2014, at http://www.cemnet.com/News/story/154612/acc-begins-preliminary-coal-usage-egypt.html.
Jänicke, M., Mönch, H., Ranneberg, T., and Simonis, U.E., 1985, Economic structure and environmental impacts—East-west comparisons: The Environmentalist, v. 9, no. 3, p. 171–183, doi:10.1007/BF02240467.
59
Kafarskiy, A.Kh., Stazhilo-Alekseev, K.F., Pyzhyanov, I.V., Achilov, G.Sh., Gorelov, A.I., Bezulov, G.M., and Gazanfari, S.M., 1972, The geology and minerals of the Western Hindu Kush and the eastern part of the Bande-Turkestan: Kabul, Afghanistan, Department of Geological and Mineral Survey, scale 1:500,000, unpublished data, unpaginated.
Kelly, T.D., Matos, G.R., Buckingham, D.A., DiFrancesco, C.A., and Porter, K.E., 2010, Historical statistics for mineral and material commodities in the United States: U.S. Geological Survey Data Series 140, accessed July 11, 2011, at http://minerals.usgs.gov/ds/2005/140/.
Klett, T.R., Schenk, C.J., Wandrey, C.J., Charpentier, R.R., Brownfield, M.E., Pitman, J.K., Pollastro, R.M., Cook, T.A., and Tennyson, M.E., 2012, Assessment of undiscovered oil and gas resources of the Amu Darya Basin and Afghan—Tajik Basin Provinces, Afghanistan, Iran, Tajikistan, Turkmenistan, and Uzbekistan, 2011: U.S. Geological Survey Fact Sheet 2011–3154, 4 p. (Also available at http://pubs.usgs.gov/fs/2011/3154/.)
Krauss, U.H., Schmitt, H.W., Taylor, H.A., Jr., and Sutphin, D.M., 1988, International strategic minerals inventory summary report—Natural graphite: U.S. Geological Survey, Circular 930–H, 29 p. (Also available at http://pubs.usgs.gov/circ/1989/0930h/report.pdf.)
Lefond, S.J., 1969, Handbook of world salt resources: New York, Plenum Press, 384 p. Locher, F.W., 2006, Cement—Principles of production and use: Düsseldorf, Germany, VerlagBau +
Technik GmbH, ISBN 3-7640-0420-7. Luchnikov, V.S., 1982, Upper Jurassic halogen deposits of southeast Central Asia: Petroleum Geology,
v. 20, no. 7, p. 296–298. Ludington, S., Orris, G.J., Bolm, K.S., Peters, S.G., and the U.S. Geological Survey-Afghanistan
Ministry of Mines and Industry Joint Mineral Resource Assessment Team, 2007, Preliminary mineral resource assessment of selected mineral deposit types in Afghanistan: U.S. Geological Survey Open–File Report 2007-1005, 44 p., available at http://pubs.usgs.gov/of/2007/1005/.
Lycett, S.L., and Chauhan, P.R., eds., 2010, New perspectives on old stones—Analytical approaches to Paleolithic technologies: Springer, 181 p., doi:10.1007/978-1-4419-6861-6.
Madlool, N.A., Saidur, R., Hossain, M.S., and Rahim, N.A., 2011, A critical review on energy use and savings in the cement industries: Renewable and Sustainable Energy Reviews, v. 15, p. 2042–2060.
McCarthy, E.F., Genco, N.A., and Reade, E.H., Jr., 2006, Talc, in Kogel, J.E., Trivedi, N.C., Barker, J.M., and Krukowski, S.T., eds., Industrial minerals and rocks, 7th ed.: Littleton, Colorado, Society for Mining, Metallurgy, and Exploration, Inc., p. 971–986.
McReady, P., ed., 2006, Afghanistan: Mining Communications, Ltd., Mining Journal Special Publication, 12 p., accessed July 2014, at http://www.bgs.ac.uk/afghanminerals/docs/afghan_supp_final.pdf.
Mikhailov, K.Ya., Kulakov, V.V., Kolchanov, V.P., and Pashkov, B.R., 1965, Report on geological survey of coal deposits and occurrences at a scale of 1:200,000 carried out in the Herat Province [parts of map sheets I-41- IX X, XI, XVI]: Unpublished report by V/O Technoexport USSR (contract 640) to the Afghanistan Ministry of Mines and Industries, Kabul, 151 p., 58 figures, 6 plates.
Mikhailov, K.Ya., Kolohanov, V.P., Kulakov, V.V., Pashkov, B.P., Androsov, B.N., and Chalyan, M.A., 1967, Report on geological survey at a scale of 1:200,000 carried out within coal-bearing areas of North-East Afghanistan [map sheets 222-C, 502-D, 503-B; parts of map sheets 221-F, 222-D, 222-F, 502-C, 502-F, 503-A, 503-C, 503-D, 503-I, 504-A]: Unpublished report by V/O Technoexport USSR (contracts 640 and 1378) to the Afghanistan Ministry of Mines and Industries, Kabul, 2 volumes, 31 plates.
Miller, M.M., 2009, Fluorspar [advanced release]: U.S. Geological Survey 2009 Minerals Yearbook, Volume I—Metals and Minerals, p. 26.1–26.13, accessed July 2014, at http://minerals.usgs.gov/minerals/pubs/commodity/fluorspar/myb1-2009-fluor.pdf.
60
Miller, M.M., 2010, Fluorspar [advanced release]: U.S. Geological Survey 2010 Minerals Yearbook, Volume I—Metals and Minerals, p. 26.1–26.12, accessed July 2014, at http://minerals.usgs.gov/minerals/pubs/commodity/fluorspar/myb1-2010-fluor.pdf.
Mitchell, C., and Benham, A., 2008, Afghanistan revival and redevelopment: Industrial Minerals, v. 489, p. 58–63.
Mindat.org, 2014, Gypsum, Afghanistan: Mindat.org Web database, accessed July 2014, at http://www.mindat.org/minlocsearch.php?frm_id=mls&cform_is_valid=1&cf_mls_page=1&minname=gypsum®ion=afghanistan&sort=&submit_mls=Search.
Moore, 2013, Cement plants and kilns in Britain and Ireland: Web site, accessed July 2014, at http://www.cementkilns.co.uk/index.html.
Ministry of Mines and Petroleum, 2014, Cement tenders, 2014, [http://www.afghancementtenders.com/jabal-saraj-tender.html/].
Mokhatab, S., and Poe, W.A., 2012, Handbook of natural gas transmission and processing, 2nd ed.: Waltham, Mass., Gulf Professional Publishing [Elsevier], 800 p., ISBN: 978-0-12-386914-2.
Mossotti, V.G., 2011a, Introduction to industrial minerals, chapter 16A of Peters, S.G., King, T.V.V., Mack, T.J., and Chornack, M.P., eds., and the U.S. Geological Survey Afghanistan Mineral Assessment Team, 2011, Summaries of important areas for mineral investment and production opportunities of nonfuel minerals in Afghanistan: U.S. Geological Survey Open-File Report 2011–1204, p. 1,227–1,242. (Also available at http://pubs.usgs.gov/of/2011/1204/ and on DVD.)
Mossotti, V.G, 2011b, Cement in Afghanistan, chapter 16B of Peters, S.G., King, T.V.V., Mack, T.J., and Chornack, M.P., eds., and the U.S. Geological Survey Afghanistan Mineral Assessment Team, 2011, Summaries of important areas for mineral investment and production opportunities of nonfuel minerals in Afghanistan: U.S. Geological Survey Open-File Report 2011–1204, p. 1,243–1,270. (Also available at http://pubs.usgs.gov/of/2011/1204/ and on DVD.)
Oeppen, C., 2010, The Afghan diaspora and its involvement in the reconstruction of Afghanistan, in Oeppen, C., and Schlenkhoff, A., eds., Beyond “the Wild Tribes”—Understanding modern Afghanistan and its diaspora, London: Hurst, New York, University of Columbia Press, p. 141–156.
Olsen, D., Goli, S., Faulkner, D., and McKane, A., 2010, Opportunities for energy efficiency and demand response in the California cement industry: Ernest Orlando Lawrence Berkeley National Laboratory, report LBNL-4849E, 25 p., accessed July 2014, at http://drrc.lbl.gov/publications/opportunities-energy-efficiency-and-1.
Orris, G.J., and Bliss, J.D., 2002, Mines and mineral occurrences of Afghanistan: U.S. Geological Survey Open-File Report 2002–110, 95 p., accessed July 2014, at http://pubs.usgs.gov/of/2002/0110/.
Patterson, S.H., 1967, Bauxite reserves and potential aluminum resources of the world: U.S. Geological Survey Bulletin 1228, 176 p.
Peters, S.G., King, T.V.V., Mack, T.J., and Chornack, M.P., eds., and the U.S. Geological Survey Afghanistan Mineral Assessment Team, 2011, Summaries of important areas for mineral investment and production opportunities of nonfuel minerals in Afghanistan: U.S. Geological Survey Open-File Report 2011–1204, 1,810 p. plus appendixes on DVD. (Also available at http://pubs.usgs.gov/of/2011/1204/ and on DVD.)
Peters, S.G., Ludington, S.D., Orris, G.J., Sutphin, D.M., Bliss, J.D., and Rytuba, J.J., eds., and the U.S. Geological Survey-Afghanistan Ministry of Mines Joint Mineral Resource Assessment team, 2007, Preliminary nonfuel mineral resource assessment of Afghanistan: U.S. Geological Survey Open-File Report 2007–1214, 810 p., CD–ROM (Also available at http://pubs.usgs.gov/of/2007/1214/).
Pšeničný, M., 2006, Inekon Group to build cement works in Tajikistan worth over CZK 2.3 billion: Czech Business and Trade, v. 05–06, 34 p.
Pohl, W., 1990, Genesis of magnesite deposits—Models and trends: Geologische Rundschau, v. 79, no. 2, p. 291–299.
61
Poole, L., 2011, Afghanistan—Tracking major resource flows 2002–2010: Wells, Somerset, United Kingdom, Global Humanitarian Assistance, ver. 1, 22 p., accessed July 2014, at http://www.globalhumanitarianassistance.org/wp-content/uploads/2011/02/gha-Afghanistan-2011-major-resource-flows.pdf.
Porter, M.E., 1985, Competitive advantage—Creating and sustaining superior performance: New York, Simon and Schuster, 592 p.
Power, W.R., 1994, Stone, dimension, in Carr, D.D., Sr. ed., Industrial Minerals and Rocks, 6th ed.: Society for Mining, Metallurgy, and Exploration, Inc., p. 987–1001.
Rahimzai, A., 2013, Coal mines illegal extraction inflicts losses on national exchequer: Pajhwok: Afghan News Special Mines Page, December 17, 2013, accessed July 2014, at http://www.mines.pajhwok.com/news/coal-mines-illegal-extraction-inflicts-losses-national-exchequer#sthash.jwl8QBjN.dpuf.
Rassin, A.G., 2012, A comprehensive study of marble industry in Afghanistan: , Kabul, Afghanistan Investment Support Agency (AISA), Research and Statistics Department, 44 p., accessed July 2014, at http://www.aisa.org.af/study/Marble-industry-AFG-AISA-2012.pdf.
Raup, O.B., 1991, Descriptive model of bedded salt, in Orris, G.J., and Bliss, J.D., eds., Some industrial mineral deposit models; descriptive deposit models: U.S. Geological Survey Open-File Report OF91–11A, p. 29–30.
Simandl, G.J., and Ogden, D., 1999, Ultramafic-hosted talc-magnesite, in Simandl, G.J., Hora, Z.D., and Lefebure, D.V., eds., Selected British Columbia mineral deposit profiles—Volume. 3, Industrial minerals and gemstones: British Columbia Ministry of Energy and Mines, p. 65-67.
Santoleri, J.J., Reynolds, J., and Theodore, L., 2000, Introduction to hazardous waste incineration, 2nd ed.: Wiley-Interscience, 656 p., ISBN-13: 978-0471017905.
Sanfilippo, J., 2005, Assessing the coal resources of Afghanistan: U.S. Geological Survey Fact Sheet 2005–3073, 3 p. (Also available at http://pubs.usgs.gov/fs/2005/3073/.)
Sanfilippo, J.R., Davis, P.A., Khair, A.W., Hackley, P.C., and Aminy, S., 2006, Coal mining in Afghanistan—A third-world paradigm of problems and opportunities: Geological Society of America Abstracts with Programs, v. 38, no. 7, p. 96, accessed September 2014, at https://gsa.confex.com/gsa/2006AM/finalprogram/abstract_115740.htm.
Schroder, L., and Ogletree, V., 2010, Simple, affordable, and earthquake-resistant natural building techniques: White River Junction, Vermont, Chelsea Green Publishing, 205 p.
Sborshchikov, I.M., Drannikov, V.S., Bilan, I.K., 1974, Geology and minerals of Southern and South-Eastern Afghanistan [parts of sheets 500-III, IV; 700-I, 600-II, IV]: Kabul, Afghanistan, Department of Geological and Mineral Survey, unpaginated.
Schmidt, M., 1992, Cement with interground additives–Capabilities and environmental relief, part 1: Zement-Kalk-Gips, February 1992, v. 45, no. 2, p. 64–69.
Sharpe, R., and Cork, G., 2006, Gypsum and anhydrite, in Kogel, J.E., Trivedi, N.C., Barker, J.M., and Krukowski, S.T., eds., Industrial minerals and rocks, 7th ed.: Littleton, Colo., Society for Mining, Metallurgy, and Exploration, Inc., p. 519–540.
Slavin, V.I., Kononov, O.V., Dyadin, V.I., Atikullah S., 1972, The geology and aragonite‐onyx deposits in the south of Afghanistan: Kabul, Afghanistan, Department of Geological and Mineral Survey, 142 p.
Special Inspector General for Afghanistan Reconstruction [SIGAR], 2009, A better management information system is needed to promote information sharing, effective planning, and coordination of Afghanistan reconstruction activities: Arlington, Va., Special Inspector General for Afghanistan Reconstruction, July 30, 2009, Audit-09-03, p. iii, accessed July 2014, at http://www.sigar.mil/pdf/audits/2009-07-30audit-09-03.pdf.
62
Special Inspector General for Afghanistan Reconstruction [SIGAR], 2010, Afghanistan’s Control and Audit Office requires operational and budgetary independence, enhanced authority, and focused international assistance to effectively prevent and detect corruption: Arlington, Va., Special Inspector General for Afghanistan Reconstruction, April 9, 2010, Audit-10-8, 26 p., accessed July 2014, at http://www.sigar.mil/pdf/audits/2010-04-09audit-10-08.pdf.
Special Inspector General for Afghanistan Reconstruction [SIGAR], 2012a, Quarterly report to The United States Congress: Arlington, Va., Special Inspector General for Afghanistan Reconstruction, July 30, 2012, 182 p., accessed July 2014, at http://www.sigar.mil/pdf/quarterlyreports/2012-07-30qr.pdf.
Special Inspector General for Afghanistan Reconstruction [SIGAR], 2012b, Quarterly report to the United States Congress: Arlington, Va., Special Inspector General for Afghanistan Reconstruction, April 30, 2012, 193 p., accessed July 2014, at http://www.sigar.mil/pdf/quarterlyreports/2012-04-30qr.pdf.
Smith, G.I., 1975, Potash and other evaporite resources of Afghanistan: U.S. Geological Survey Open-File Report 75–89, 63 p.
Sutphin, D.M., Lipin, B.R., Bawiec, W.J., and Orris, G.J., 2007, Deposits related to mafic igneous rocks, in Peters, S.G., Ludington, S.D., Orris, G.J., Sutphin, D.M., Bliss, J.D., and Rytuba, J.J., eds., and the U.S. Geological Survey-Afghanistan Ministry of Mines Joint Mineral Resource Assessment team, 2007, Preliminary nonfuel mineral resource assessment of Afghanistan: U.S. Geological Survey Open-File Report 2007–1214, 810 p., CD–ROM (Also available at http://pubs.usgs.gov/of/2007/1214/).
Tewalt, S.J., Belkin, H.E., SanFilipo, J.R., Merrill, M.D., Palmer, C.A., Warwick, P.D., Karlsen, A.W., Finkelman, R.B., and Park, A.J., compilers, 2010, Chemical analyses in the World Coal Quality Inventory, version 1: U.S. Geological Survey Open-File Report 2010–1196, 4 p., accessed July 2014, at http://pubs.usgs.gov/of/2010/1196/.
The GTZ-Holcim Public Private Partnership, 2006, Guidelines on co-processing of waste material in cement production: Holcim Group Support, Ltd., and Deutsche Gesellschaft für Technische Zusammenarbeit GmbH (GTZ), ver. 6, accessed July 2014, at http://www.coprocem.com/trainingkit/documents/diverse/guideline_coprocem_v06-06.pdf.
The World Bank, 2007, The World Bank in Afghanistan—Country update, April 2007: Herndon, Va., The World Bank, v. 202, p. 473–5105, accessed July 2014, at http://siteresources.worldbank.org/AFGHANISTANEXTN/Resources/305984-1171214014238/AFUpdateApr07.pdf.
The World Bank [WB], 2011, Emergency project paper on a proposed grant in the amount of SDR 61.7 million (US$ 97.8 million equivalent) to the Islamic Republic of Afghanistan for an irrigation restoration and development project: Herndon, Va., The World Bank, April 8, 2011, report no. 58454-AF, accessed July 2014, at http://www-wds.worldbank.org/external/default/WDSContentServer/WDSP/IB/2011/04/15/000386194_20110415002623/Rendered/INDEX/584540PJPR0P121OFFICIAL0USE0ONLY191.txt.
U.S. Department of Transportation [USDT], 1990, Portland cement concrete materials manual: U.S. Department of Transportation, Federal Highway Administration report FHWA-Ed-89-006.
U.S. Agency for International Development [USAID], 2014, Powering up Afghanistan: U.S. Agency for International Development, Frontlines—Energy/Infrastructure, January/February 2014, accessed July 2014, at http://www.usaid.gov/news-information/frontlines/energy-infrastructure/powering-afghanistan.
U.S. Agency for International Development [USAID], On The Frontier [OTF] Group, and Commercial Competitiveness Commission of Afghanistan [CCCA], 2006, Marble cluster strategy: U.S. Agency for International Development [USAID], On The Frontier [OTF] Group, and Commercial Competitiveness Commission of Afghanistan [CCCA], February 2006, 54 p., accessed July 2014, at http://www.trade.gov/static/afghanistan_marble.pdf.
63
U.S. Energy Information Administration [EIA], 2014, International energy statistics—Electricity, generation [Afghanistan, 2008–2012, total net generation (billion kilowatt hours)]: U.S. Energy Information Administration, Web database, accessed July 2014, at http://www.eia.gov/cfapps/ipdbproject/iedindex3.cfm?tid=2&pid=2&aid=12&cid=AF,&syid=2008&eyid=2012&unit=BKWH.
U.S. Geological Survey, 2005, Assessing the Coal Resources of Afghanistan: U.S. Geological Survey Fact Sheet 2005–3073, 3 p., accessed September 2014, at http://pubs.usgs.gov/fs/2005/3073/.
U.S. Geological Survey, 2010, Mineral commodity summaries 2010: U.S. Geological Survey, 193 p., accessed July 2014, at http://minerals.usgs.gov/minerals/pubs/mcs/2010/mcs2010.pdf.
U.S. Geological Survey, 2011, Mineral commodity summaries 2011: U.S. Geological Survey, p. 92, accessed July 2014, at http://minerals.usgs.gov/minerals/pubs/mcs/2011/mcs2011.pdf.
U.S. Geological Survey, 2014, Barite statistics and information [1932–2014]: U.S. Geological Survey Minerals Information Web site, accessed July 2014, at http://minerals.usgs.gov/minerals/pubs/commodity/barite/.
van der Vleuten, F.P., 1994, Cement in development—Energy and environment: Petten, Netherlands, Energy Research Foundation.
van Oss, H.G., 2001, Cement: U.S. Geological Survey Minerals Yearbook [2001], 31 p., accessed July 2014, at http://minerals.usgs.gov/minerals/pubs/commodity/cement/cememyb01.pdf
van Oss, H.G., 2005, Background facts and issues concerning cement and cement data: U.S. Geological Survey Open-File Report 2005–1152, ver. 1.2, 80 p., accessed July 2014, at http://pubs.usgs.gov/of/2005/1152/.
van Oss, H.G., 2011, Mineral commodity summaries, 2011: U.S. Geological Survey, p. 38–39, accessed July 2014, at http://minerals.usgs.gov/minerals/pubs/commodity/cement/mcs-2011-cemen.pdf.
Volin, M.E., 1950, Chromite deposits in Logar Valley, Kabul Province, Afghanistan: Washington, D.C., U.S. Bureau of Mines, 58 p.
Wadsam, 2014, Coal extraction stops in Dara-i-Sauf due to safety issues: Wadsam, Afghan Business News Portal, April 18, 2014, accessed July 2014, at http://www.wadsam.com/coal-extraction-stops-in-dara-i-sauf-due-to-safety-issues-989/.
World Business Council for Sustainable Development, 2012, The WBCSD Global Water Tool, ver. 1: World Business Council for Sustainable Development Web site, accessed July 2014, at http://www.wbcsd.org/work-program/sector-projects/water/global-water-tool.aspx.
World Business Council for Sustainable Development—Cement Sustainability Initiative, 2006, Utilisation of alternative fuels and raw materials in the cement production, in Formation and Release of POPs in the Cement Industry, 2nd ed.: SINTEF, January 23, 2006, p. 63–72, accessed July 2014, at http://www.wbcsdcement.org/pdf/formation_release_pops_second_edition.pdf.
Worrell, E., and Galitsky, C., 2008, Energy efficiency improvement and cost saving opportunities for cement making—An Energy Star® guide for energy and plant managers: Berkeley, California, Ernest Orlando Lawrence Berkeley National Laboratory, report no. LBNL-54036-Revision, 71 p., accessed July 2014, at http://www.energystar.gov/ia/business/industry/LBNL-54036.pdf.
Wrucke, C.T., and Shride, A.F., 1986, Descriptive model of carbonate-hosted asbestos, in Cox, D.P. and Singer, D.A., eds., Mineral deposit models: U.S. Geological Survey Bulletin 1693, p. 98, accessed July 2014, at http://pubs.usgs.gov/bul/b1693/.
64
Appendix 1—Deposit Models [As reproduced with minor modifications from Hora (2007), British Columbia Geological Survey, used with permission]
Limestone [Cement Grade] Synonyms: Limerock, cement rock, calcium carbonate. Commodities: Cement-grade limestone, limestone aggregate. Geological Characteristics: Calcium carbonate sedimentary rock that occurs in beds, usually tens of meters thick, with or without minor dolomite. High-grade limestone can be almost pure (less than 1.4 percent impurities for chemical lime). Lowest grades of limestone (marlstone) can be used for cement with as little as 65 percent calcium carbonate, with contamination by finely disseminated clay and silica. The limestone may be recrystallized by various degrees of metamorphic grade. Marl and chalk are poorly lithified forms of limestone. Tectonic Settings: Recent and ancient continental shelf and subsiding marginal marine basins are the most common settings; island arc environments also important. Depositional Environment/Geological Setting: Subtropical and tropical shallow sea environment. Calcium carbonate, usually slightly magnesian, is the typical primary component; dolomite is rather uncommon. The original mineral is frequently aragonite, later recrystallized into calcite. During lithification and diagenesis, under a variety of geological processes, it may be partially or completely dolomitized. Age of Rock Formation: Late Proterozoic to Holocene, main producers globally are Paleozoic, Mesozoic, and Tertiary. Host/Associated Rock Types: Shelf-deposited limestone beds are often found within thicker sedimentary sequences with associated dolomite, argillite, sandstone, and intermediate sedimentary rocks. Island arc limestone often has a volcanic component, such as tuffaceous rocks, sills, submarine lava, and palagonite breccia. Sometimes found in cherty layers and interbeds. Deposit Form: Lenses, massive beds; folded and unfolded. Thickness of mineable limestone deposits range from ten to several hundreds of meters. The areal extent of some deposits covers hundreds of square kilometers. Texture/Structure: Massive, bedded, fine- to coarse-grained, sometimes with cross-bedding features, sometimes porous, fossiliferous, with stylolites. Interbeds with chert nodules. Ore Mineralogy: Calcium carbonate with minor dolomite, clay, shale and silica. Some limestone may contain finely dispersed bitumen. Gangue Mineralogy: All types of silicate rocks, chert, pyrite. Alteration Mineralogy: Groundwater dissolution results in karst cavities, which are frequently filled with clay. Metamorphism recrystallizes the limestone and mobilizes the dispersed bitumen, which can remain as graphite. With high metamorphic grades, clay and silica will recrystallize into skarn-like groups of silicate minerals and crystalline silica. Weathering: Solution weathering results in a variety of karst landforms in most climatic areas but intensifies with a warmer climate. Most intensive karstification may produce deposits of bauxite. Ore Controls: Favorable limestone units often occur in belts that reflect original depositional environments. Limestone very often forms well-defined stratigraphic and lithological units. Horizontally, limestone will grade gradually into impure limestone and other sedimentary facies, which will reduce the value depending on the end use due to the changes in chemical composition and quantity and type of contaminants. Highly sought white limestone for mineral fillers is usually a product of the contact or regional metamorphic processes. Genetic Model: Most limestone deposits of economic importance were biologically derived from seawater as detrital calcium carbonate and accumulated in a relatively shallow marine environment. The
65
other form is by organic frame builders like coral and algae as local and regional reef structures. The environment of deposition determines the size, shape, and purity of the carbonate rock. Associated Deposit Types: Deposits of dolomitic limestone and dolomite, marble building stone. Comments: A relatively small percentage of limestone contains alumina and other oxides in the right proportions to make cement and are termed “cement rock.” Recrystallization of limestone may have a significant effect on the limestone use. Geochemical Signature: High CaCO3 content Geophysical Signature: Resistivity has been used to identify karst features in covered terrain. Exploration Guides: Regional belts of sedimentary rocks with limestone potential are the primary exploration tool. Karst topography and underground streams indicate carbonate units. Typical Grade and Tonnage: The main global limestone uses are for manufacturing cement, lime, and aggregates. In 2000, the United States produced 15 million ton of lime and 83 million ton of cement. In the same year, the United States imported 25 million ton of cement and 113 thousand ton of lime. A typical cement plant in developed countries has a capacity of approximately 1 million ton annually, whereas a typical lime plant will produce between 100 and 200 thousand ton of lime per year. Because high-grade limestone contains 44 percent carbon dioxide, a plant requires almost 2 ton of limestone for every ton of product. In many regions, where rocks of magmatic origin are absent, fine-grained, unmetamorphosed limestone and dolomite are the most common source of crushed, quarried aggregate. Some of these types of stone products can be a source of extremely undesirable alkali-aggregate reactivity. Such reactivity may result in early deterioration of concrete structures. Economic Factors: Limestone is an extremely versatile industrial rock processed into many end products. Diverse uses have diverse quality requirements, controlled by specifications on chemical composition, physical properties, local availability and consistency. Some specifications deal with the final product and may be controlled during processing (for example, cement). Other end uses require exact limits in composition or physical properties. There are numerous ASTM standards and industry specifications defining a typical grade for each particular application. In filler application, a calcium carbonate and dolomite mix is extremely undesirable due to the difference in hardness. For many applications, paper in particular, the presence of dolomite contamination. Economic Limitations: Limestone used for paper and fillers requires a high brightness (over 90GE), chemical purity, absence of hard minerals like quartz and absence of graphite or other color components. For high-end uses, flotation to remove deleterious components is routine. Lime is produced from limestone with high calcium carbonate (>95 percent) and low MgO (<5 percent) contents. The rock must not decrepitate in the kiln during calcination. Cement normally contains <6 percent MgO and <0.6 percent Na2O + K2O in the final product. Transportation is frequently a major cost of the finished product. Limestone quarries operate near many cities; limestone products often travel longer distances to markets. For example, cement is imported to many coastal points in the United States from overseas. End Uses: Cement, lime, soil conditioner, glass, fillers, fluxing agent, acid neutralization. Some limestone is used for dimension stone and is discussed in profile R04. Importance: This deposit type accounts for nearly all OPC and lime production.
Cement Shale Synonyms: Claystone, mudstone. Commodities: Cement shale. Geological Characteristics: Sedimentary rocks with a high clay mineral content such as claystone, mudstone, and shale. Rock must provide silica and alumina and contain very small amounts of sodium, potassium and magnesium minerals to be used for cement manufacturing. The presence of sulfur in any form is considered detrimental.
66
Tectonic Settings: A variety of sedimentary basins: foreland, forearc or island arc type; also oceanic environments. In a continental setting: rift- and graben-type basins, lacustrine depressions, and continental shelves. Sedimentary rocks with a high clay mineral content such as claystone, mudstone and shale. Rock must provide silica and alumina and contain very small amounts of sodium, potassium and magnesium minerals to be used for cement manufacturing. The presence of sulfur in any form is considered detrimental. Depositional Environment/Geological Setting: Nonmarine and shallow marine basins with low-energy environments. Oxidizing sedimentary environments. Age of Mineralization: Paleozoic to Tertiary. In British Columbia, the best deposits occur in Tertiary lacustrine sedimentary basins. Host/Associated Rock Types: Cement “shales” have a broad compositional range in clay and silt content, from argillite to siltstone. The host sequence typically includes sandstone, conglomerate and sometimes coal seams or tuffaceous sediments. Deposit Form: Stratiform, bedded sediments. May be flat or deformed by folding and faulting. Lacustrine deposits are from several to tens of meters thick with a lateral extent of several hundreds of meters to a few kilometers. Marine deposits are much more extensive. Texture/Structure: Laminated, frequently with thin silty or sandy interbeds in lacustrine deposits. Marine shale is more uniform in composition. Ore Mineralogy: [Principal and subordinate]: Pyrite; gypsum, chlorides, sulfates and Mn minerals. Gangue Mineralogy: [Principal and subordinate]: Waste consists of altered, fractured and unsound rock; stone containing inhomogenities, like blacks knots and aggregates of mafic minerals; and any minerals that upon weathering could produce stains; for example pyrite, chalcopyrite. Metamorphic Mineralogy: Metamorphism can lead to increased sodium and potassium content and recrystallization into harder rocks with a higher melting point. Weathering: Alteration of pyrite improves the acceptability of the weathered shale for the cement industry. A similar effect has a possible decrease in alkali content due to converting illite into kaolinite and the chemical weathering of feldspar in original sediment. Also soluble salts—chlorides and sulfates—can be removed during the weathering process. Ore Controls: No specific ore controls for shale used to make cement. A wide variety of shale can be used. Genetic Models: Clay-rich sediments are generally a product of the chemical weathering of aluminosilicate minerals. These can be accumulated in lacustrine as well as in marine environments. Kaolin is the preferred weathering product. Geochemical Signature: High alumina and silica, very low sodium, potassium and magnesium. Some iron is acceptable. Geophysical Signature: Geophysical methods are not used. Other Exploration Guides: The most readily ascertainable regional attribute is lacustrine sediments associated with coal seams. Marine shale with a thick weathered profile, or deposited in a nonreducing environment. Typical Grade and Tonnage: The main components in cement clinker are 62.5–63.5 percent CaO, 21–22 percent SiO2, 4–6 percent Al2O3, and 2–3 percent Fe2O3. Presence of deleterious minerals containing Na, K and S must be carefully monitored. Depending on the purity of limestone, some of the latter three elements may be part of the carbonate rock. Cement “shale” can add the necessary silica and alumina to obtain roughly the required chemistry for the clinker. Any deficiencies in silica or iron contents can be corrected by adding quartz or iron oxide; in some instances even bauxite may be added to increase the alumina content. Therefore, the industry often uses the nearest acceptable “shale” and adjusts by adding other feedstock. The noncarbonate component in cement mixture is only 22 percent. Typical cements contain between 0.5 percent and 1.5 percent of combined Na2O and K2O. Sometimes only a weathered zone of shale deposit can be used.
67
Economic Limitations: The current standard for making Canadian cement is between 0.6 percent and 1.0 percent combined Na2O + K2O in the final clinker, which usually comes from the shale. As well, the shale should be homogeneous and not very difficult to grind. As a low-value commodity, cement shale is generally restricted to local markets. Cement and clinker, on the contrary, are higher-value commodities; therefore, they can travel longer distances. End Uses: As a source of silica and alumina (and sometimes iron) in cement manufacturing. Importance: A typical North American cement plant has a capacity of 1 million tons of cement annually. Consumption of cement “shale” is tied closely to the capacity of local Portland cement plants and the demand for cement and cement products in general. Deposits are relatively common throughout the continent and the world; however, they may be scarce locally. Shale makes up approximately 30 percent of Portland cement.
Marble [Dimension Stone] Synonyms: Commercial term “marble” includes all carbonate-rich sedimentary and metamorphic rocks that are suitable for dimension stone, such as limestone, crystalline limestone, dolomite, or marble. Commodities (Byproducts): Marble blocks (lime or cement rock, aggregate, rip-rap and white fillers). Examples (British Columbia-Canada/International): Marblehead (082KSE076), Lardeau (082KSE077), Anderson Bay (092F 088), Hisnit Inlet (092F 020); Tyndall stone (Manitoba), Bruce Peninsula (Ontario), Saint-Marc-des-Carrieres (Quebec), Pittsford District (Vermont, USA), Sylacauga (Alabama, USA), Tate District (Georgia, USA), Yule Creek (Colorado, USA), Takaka Hill (New Zealand), Carrara (Italy), Thassos, Attica, Argolis (Greece), Spain, Portugal. Capsule Description: Marble dimension stone deposits occur in recrystallized/metamorphosed limestone or dolomite, where a general lack of joints makes the recovery of large blocks feasible. The marble should take a good polish and have an aesthetically pleasing color and texture. Some metamorphosed limestones are suitable for dimension stone and are referred to as “marble” by the stone industry. Tectonic Settings: Continental shelf and subsiding marginal marine basins and island arc environments. Depositional Environment/Geological Setting: Subtropical and tropical shallow sea environments. Slightly magnesian limestone, is the typical carbonate sediment; dolomite is rather uncommon. Original limestone is frequently aragonite, later recrystallized into calcite. Most of dolomite is secondary, magnesium being introduced during lithification, diagenesis and regional hydrothermal dolomitization. Both rocks become parts of folded, faulted and thrusted, sometimes metamorphosed and recrystallized geological units as parts of orogenic belts and uplifted, exposed platform sediments. Age of Mineralization: Late Proterozoic to Mesozoic; some limestones may be Tertiary. Host/Associated Rocks: Depends on tectonic setting. In an island arc environment, the associated rocks are frequently a variety of volcanic, usually more mafic rocks and tuffaceous sediments, and sedimentary rocks, often greywacke, sandstone and argillite, with or without chert. Where metamorphosed, these rocks become schists, slates, gneisses, and quartzites. Limestone may be contaminated by a tuffaceous component and form very colorful varieties. Higher metamorphic grades may result in skarn mineralogy. In a continental-shelf setting, the volcanic component is usually missing and the associated rocks are argillites, sandstones, greywackes, and the occasional conglomerate. Deposit Form: The metamorphosed carbonate deposits are stratiform, may be folded, and may have gradational contacts. The thicknesses of mineable marble deposits range from 10 meters to several hundred meters. Marble deposits commonly extend more than a hundred meters along strike; often individual deposits are parts of continuous carbonate belts (like in the Appalachian belt from Vermont to Alabama). Texture/Structure: Bedded with compositional and color layers. Some marbles display complexly folded bedding or breccias that can enhance their appearance. In metamorphic marbles, the carbonate is
68
so thoroughly recrystallized that much, or even all of the sedimentary features, are obliterated and replaced with an interlocking, mosaic texture. Highly metamorphosed varieties may exhibit features indicating a plastic flow, where original layering may be stretched or pulled apart and highly deformed. The limestones and weakly metamorphosed varieties may contain fossils and retain biological textures. In some deposits, fractured carbonate has been recemented to form a healed breccia texture. Ore Mineralogy [Principal and Subordinate]: Calcite and dolomite. Gangue Mineralogy [Principal and Subordinate]: A large group of minerals that affect the processing and final appearance—some are harder than calcite or dolomite and result in elevations on a polished surface (chert, other forms of silica, silicate minerals like garnet and spinel, pyrite). Others are softer, or with well-developed cleavage, that results in hollows (graphite, phlogopite, chlorite, talc, tremolite, wollastonite, brucite). Some prevent the stone from taking a good polish (clay, finely disseminated graphite and hematite). Some are easy to oxidize and stain (pyrite). Alteration Mineralogy: Recrystallization due to metamorphism improves the stone’s ability to take a high polish and results in more massive beds, sometimes with enhanced colors and texture features. Soft minerals like clays may recrystallize into harder silicates that take a good polish. Secondary veining may cement the broken and fractured carbonate rock into attractive textured stone breccia. The metamorphic process may also totally remove the dark-colored organic matter disseminated in original limestone or recrystallize it in the form of graphite. Weathering: Solution weathering results in a variety of karst features, but may also produce semiprecious varieties like Mexican onyx, a banded form of aragonite precipitated from hydrothermal waters or from calcium-rich groundwater in karst areas. Mexican onyx and other semiprecious varieties are sometimes included commercially under the term marble. Marbles with a silicate component (tremolite, flogopite, and garnet) might significantly deteriorate in durability and strength. The weathering of pyrite results in unsightly stains and further deterioration by sulfuric acid attacking the surrounding carbonate. Exposure to salty air in coastal areas and smog in the cities frequently results in a rapid loss of luster on exposed polished marbles. Frequently, a weathered surface of the outcrop can indicate presence of impurities and their impact on stone quality. Ore Controls: The basic ore control is rock of suitable composition, attractive color and consistent appearance. The frequency of bedding planes and transversal jointing determines the waste to ore ratio and the economics of production. In some regions, quarries are developed only in thickened beds near fold hinges. Genetic Models: Most limestone of economic importance were partly or wholly biologically derived from seawater and accumulated in a relatively shallow, subtropical and tropical marine environment. Calcium carbonate producing organisms, such as corals, algae and mollusks can build reef structures hundreds of kilometers long and kilometers wide. Limestones that form in a high-energy environment have more probability to be high-purity carbonate rocks. Very fine carbonate muds, sometimes contaminated with clay-sized particles of silica and silicate minerals, accumulate in a low-energy environment of lagoons and deep water. Under some specific conditions, original calcium carbonates may be enriched in magnesium, thus transforming original limestone into dolomite. Under both regional and contact metamorphism, carbonate rocks recrystallize, sometimes reacting with internal contaminants to form a new suite of minerals. Such recrystallization may result in a significant improvement of aesthetic appeal to the end user in resulting color, structure, and texture. Both contact and regional metamorphism may remove black or dark grey organic substances resulting in highly prized pure white carbonate. Associated Deposit Types: Limestone, sandstone, skarns, travertine. Comments: So called “green marble”, or “verde antico,” of Italy and Greece in particular, is a variety of serpentine, classed commercially as a marble. Under low metamorphic conditions, peridotites and related rocks may produce bright green serpentinite, which has been used as a building and ornamental stone since ancient times.
69
Geochemical Signature: High-purity marbles will consist almost exclusively of calcite or dolomite and contain only very minor amounts of other elements. Geophysical Signature: Resistivity methods can outline karst features in covered terrain. Other Exploration Guides: Favorable marble beds are commonly found in belts of regionally metamorphosed sedimentary rocks or adjacent to a specific suite of intrusions, which have thermally metamorphosed carbonate beds. Massive beds exposed along valley slopes and in natural cuts and outcrops. Green “marble” in serpentinite belts, usually parts of accreted ophiolitic oceanic crust. Typical Grade and Tonnage: Canada and United States produce annually close to 500,000 tons of ornamental limestone and marble. Approximately 40 production centers are scattered over the continent, in at least ten states and three provinces. Commercial stone must meet ASTM specifications for its intended use. Economic Limitations: “Marble” may be not attractive economically when dolomite forms thin layers in calcite because of different hardness and usually difference in grain size when dolomite is significantly finer grained than calcite. Waste to commercial size block ratio—depending on the type of quarry, waste should normally not surpass 25 to 30 percent of mined material. This may be higher if there is a market for the rejected material, for example, white limestone, which can be processed into calcium carbonate fillers, landscaping chips, etc. Limestone and marble in particular, are very sensitive to blast shock; therefore, in marble deposits the use of blasting must be avoided entirely. Also the mineral composition—presence of some deleterious minerals may be a limiting factor on the end use and restrictive to potential end uses. Minor components, like pyrite and other easily oxidized minerals, can stain marble when installed in some environments. Hard inclusions like chert nodules, silica veinlets, intrusive sills and dikes can make the marble difficult to process into a quality product and (or) lead to differential weathering. Common types of marble can be produced and processed for a local market only; special varieties (colored, snow-white) can travel globally. Marble deposits have been successfully quarried underground throughout history. Marble deposit production in British Columbia has partly been quarried both from open pit quarries and underground. Modern methods using chainsaws and wire saws have simplified removing blocks from underground quarries. End Uses: Marble tile, facing sheets, monumental stone, statues, fillers for paper and plastics, soil conditioner. Importance: Marble has provided structural, building and ornamental stone for millennia. Many historical landmarks, artworks, buildings, and structures used marble or limestone.
70
Appendix 2—Performance Standards for Cement [From van Oss (2001) and van Oss (written communs.)]
Ordinary Portland cement (OPC) is the binding material in all forms of concrete and most forms
of mortar. Concrete is a composite material made as a blend of cement, water, and a variety of aggregate materials consisting of sand and gravel. Mortars, which are highly workable, but less strong than concrete, are a blend of cement, water, and sand. Although cement is only rarely used in isolation, standards of quality have evolved to be applied at the point in the production cycle at which the product from the kiln, called clinker, is blended and milled with certain additives at the output of the kiln. Many standards have also evolved, driven by the need for improvement in performance quality concrete under a wide variety of applications and conditions.
What is hydraulic cement? For cement production, carbonate rocks and silicate materials are blended and milled to meet certain stoichiometric specifications. The blend is then fired in a kiln in such a way so as to produce the mixture of silicate minerals that constitute cement. The fundamental property of the dry powdery grey cement produced at a cement factory, and the property for which hydraulic cement is named, is that—with the application of water—the cement is hydrated into a solid cementitious mass of silicate minerals. OPC, and some other cement products based on OPC, are overwhelmingly the dominant hydraulic cements produced today.
Hydraulic cements are of two broad types—(1) those that are inherently hydraulic (that is, require only the addition of water to activate) and (2) those that are pozzolanic. Loosely defined, the term pozzolan (or pozzolanic) refers to any siliceous material that develops hydraulic cementitious properties when interacted with hydrated lime [Ca(OH)2], and in this overview includes true pozzolans and latent cements. Pozzolanic additives or extenders may be collectively termed supplementary cementitious materials (SCM).
Portland cements are usually gray, but a more expensive white Portland cement can be obtained by using only raw materials of very low iron and transition-elements content. Both gray and white Portland cement can be the basis of colored Portland cements through the incorporation of pigments. Current standards for OPC and for blended cement based on OPC are covered below.
Ordinary Portland cement—Formal standards are slow to change, while in practice, many newly developed standards are appearing in the market at a rate never seen in the past. Similar varieties of Portland cement are made in many parts of the world but go by different names. In the United States, the different varieties of straight OPC are denoted per ASTM (formerly American Society for Testing and Materials) standard C150, as:
• Type I—General use Portland cement (recognized in most countries as OPC) • Type II—General use Portland cement exhibiting moderate sulfate resistance and moderate heat
of hydration • Type III—High early strength Portland cement • Type IV—Portland cement having a low heat of hydration • Type V—Portland cement having high sulfate resistance
For types I, II, and III, the addition of the suffix A (for example, type IA) indicates the inclusion
of an air-entraining agent. Air-entraining agents impart myriad tiny bubbles to the concrete containing the hydrated cement, which can offer certain advantages to the concrete, especially improved resistance to freeze-thaw cracking. In practice, many companies market hybrid Portland cements; type I/II is a common hybrid and meets the specifications of both types I and II. Another common hybrid is type II/V. Because the uses and mineralogical composition of modern type I and II Portland cements are so similar, many statistical compilations (including those of the USGS) do not distinguish between them.
71
Notwithstanding the ASTM C150 specifications, it is important to note that the common industry practice, and a practice also adopted by USGS, is to include within the Portland cement designation a number of other cements not within ASTM C150 that are composed largely of Portland cement and which are used for similar applications (for example, concrete). These include block cement, expansive cement, oil-well cement, regulated fast-setting cement, waterproof cement, and blended cement. Note that, plastic cements associated with masonry cement applications are not part of the Portland cement category defined by the USGS.
Blended cement based on OPC—Blended cements are now in growing demand for many reasons. Blended cements (called composite cements in some countries) are intimate mixes of a Portland cement base (generally type I) with one or more SCM extenders. The SCM commonly makes up about 5–30 percent by weight of the total blend (but can be higher). In many statistical compendia (including some by the USGS), blended cements are included within the term Portland cement; however, beginning with the January 1998 edition, the USGS monthly Mineral Industry Surveys on cement list blended cements as a separate category. The designations for blended cements vary worldwide, but those currently in use in the United States meet one or the other of the ASTM Standards C595 and C1157.
In blended cements, the SCM (or pozzolans) are activated by the high pH resulting from the lime released during the hydration of Portland cement. The most commonly used SCM are pozzolana, certain types of fly ash (from coal-fired power plants), ground granulated blast furnace slag (GGBFS—now increasingly being referred to as slag cement), burned clays, silica fume, and cement kiln dust (CKD). In general, incorporation of SCM with Portland cement improves the resistance of concrete to chemical attack, reduces the concrete’s porosity, reduces the heat of hydration of the cement (not always an advantage), may improve the flowability of concrete, and produces a concrete having about the same long-term strength as straight Portland cement-based concretes. However, SCM generally reduce the early strength of the concrete, which may be detrimental to certain applications.
The standards for SCM cements are performance based. The designations for blended cements vary worldwide, but those currently in use in the United States meet one or the other of the ASTM Standards C595 and C1157. Note that Portland limestone cement, produced by blending milled limestone with OPC, is gaining popularity in Europe, and is now in use in the United States under standard C595, type IL. The definitions of blended cements given in ASTM Standard C595 are summarized below:
IS (x): Portland blast furnace slag cement (x = percent GGBFS, limit x ≤ 95 percent)
IP (x): Portland pozzolan cement (x = percent pozzolan; limit x ≤ 40 percent)
IL (x): Portland limestone cement (x = percent limestone, limit 5 < x ≤ 55 percent)
IT (Ax)(By): Ternary blended cement (x = percent GGBFS, limit x ≤ 95 percent)
A = 1st addition: S(slag), or P(pozzolan), or L(limestone), x = percent thereof
B = 2nd addition: S(slag), or P(pozzolan), or L(limestone), y = percent thereof
where: If A = S and x ≥ 70, and if B = L, then Y ≤ 15 percent, also: P ≤ 40 percent (x + y) and: L ≤ 15 percent (x + y).
In addition to the cement types reviewed above, there are other cement standards in modern use; among a half dozen or so, the most notable include pozzolan-lime cements, masonry cements, and aluminous cements. These are not reviewed here.
72
Appendix 3—Performance Standards for Ready-Mixed Concrete 9 (from ASTM, 2010) Standard no. Description C31 Practice for making and curing concrete test specimens in the field. C33 Specification for concrete aggregates. C39 Test for compressive strength of cylindrical concrete specimens. C42 Test for obtaining and testing drilled cores and sawed concrete beams. C94 Specification for ready-mixed Concrete. C125 Terminology relating to concrete and concrete aggregates. C127 Test for density, relative density (specific gravity), and absorption of coarse aggregate. C128 Test for density, relative density (specific gravity), and absorption of fine aggregate. C36 Test for sieve analysis of fine and coarse aggregates. C138 Test for unit weight, yield, and air content (gravimetric) of concrete. C143 Test for slump of hydraulic cement concrete. C150 Specification for Portland cement. C172 Practice for sampling freshly mixed concrete. C173 Test for air content of freshly mixed concrete by the volumetric method. C231 Test for air content of freshly mixed concrete by the pressure method. C192 Practice for making and curing concrete test specimens in the laboratory. C260 Specification for air-entraining admixtures for concrete. C330 Specification for lightweight aggregates for structural concrete. C494 Specifications for chemical admixtures for concrete. CS66 Test for total evaporable moisture content of aggregate by drying. C567 Test method for determining density of structural lightweight concrete. C595 Specification for blended hydraulic cement. C618 Specification for coal fly ash and raw or calcined natural pozzolan in concrete. C637 Specification for aggregates for radiation-shielding concrete. C685 Specification for concrete made by volumetric batching and continuous mixing. C989 Specification for ground granulated blast-furnace slag for concrete and mortars. C1064 Test for temperature of freshly mixed Portland cement concrete. C1116 Specification for fiber-reinforced concrete and shotcrete. C1157 Performance specification for hydraulic cement. C1202 Test for electrical indication of concrete's ability to resist chloride ion penetration. C1240 Specification for silica fume for use as in hydraulic-cement concrete, mortar, and grout. C1293 Test for concrete aggregates: length-change of concrete due to alkali-silica reaction. C1567 Accelerated mortar-bar test for potential alkali-silica reactivity. C1602 Specification for mixing water used in the production of hydraulic-cement concrete. C1611 Test for slump flow of self-consolidating concrete.
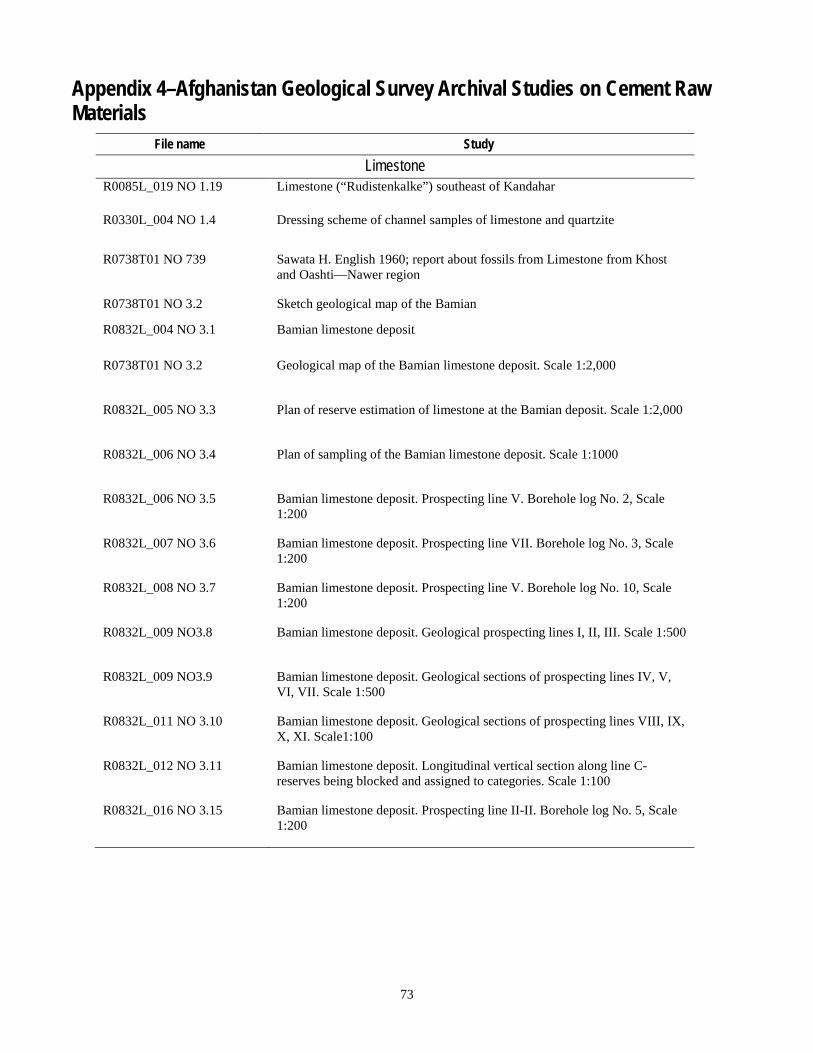
73
Appendix 4–Afghanistan Geological Survey Archival Studies on Cement Raw Materials
File name Study
Limestone R0085L_019 NO 1.19 Limestone (“Rudistenkalke”) southeast of Kandahar
R0330L_004 NO 1.4 Dressing scheme of channel samples of limestone and quartzite
R0738T01 NO 739 Sawata H. English 1960; report about fossils from Limestone from Khost and Oashti—Nawer region
R0738T01 NO 3.2 Sketch geological map of the Bamian
R0832L_004 NO 3.1 Bamian limestone deposit
R0738T01 NO 3.2 Geological map of the Bamian limestone deposit. Scale 1:2,000
R0832L_005 NO 3.3 Plan of reserve estimation of limestone at the Bamian deposit. Scale 1:2,000
R0832L_006 NO 3.4 Plan of sampling of the Bamian limestone deposit. Scale 1:1000
R0832L_006 NO 3.5 Bamian limestone deposit. Prospecting line V. Borehole log No. 2, Scale 1:200
R0832L_007 NO 3.6 Bamian limestone deposit. Prospecting line VII. Borehole log No. 3, Scale 1:200
R0832L_008 NO 3.7 Bamian limestone deposit. Prospecting line V. Borehole log No. 10, Scale 1:200
R0832L_009 NO3.8 Bamian limestone deposit. Geological prospecting lines I, II, III. Scale 1:500
R0832L_009 NO3.9 Bamian limestone deposit. Geological sections of prospecting lines IV, V, VI, VII. Scale 1:500
R0832L_011 NO 3.10 Bamian limestone deposit. Geological sections of prospecting lines VIII, IX, X, XI. Scale1:100
R0832L_012 NO 3.11 Bamian limestone deposit. Longitudinal vertical section along line C-reserves being blocked and assigned to categories. Scale 1:100
R0832L_016 NO 3.15 Bamian limestone deposit. Prospecting line II-II. Borehole log No. 5, Scale 1:200
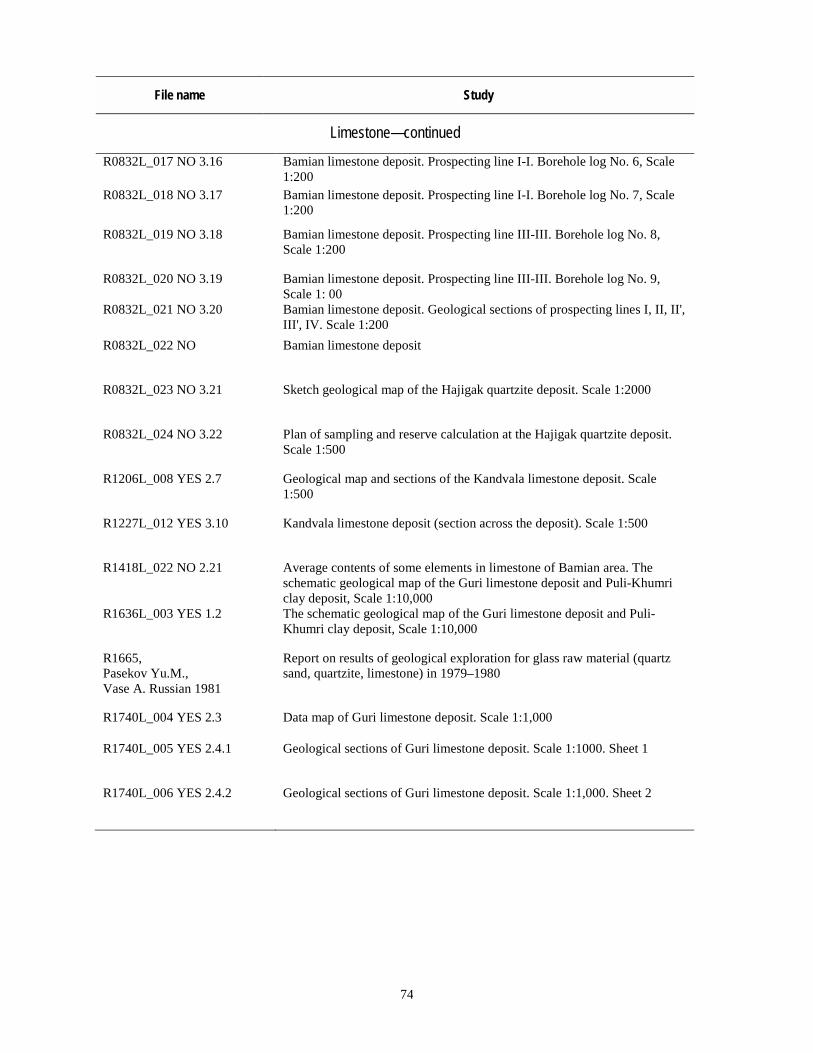
74
File name Study
Limestone—continued R0832L_017 NO 3.16 Bamian limestone deposit. Prospecting line I-I. Borehole log No. 6, Scale
1:200 R0832L_018 NO 3.17 Bamian limestone deposit. Prospecting line I-I. Borehole log No. 7, Scale
1:200
R0832L_019 NO 3.18 Bamian limestone deposit. Prospecting line III-III. Borehole log No. 8, Scale 1:200
R0832L_020 NO 3.19 Bamian limestone deposit. Prospecting line III-III. Borehole log No. 9, Scale 1: 00
R0832L_021 NO 3.20 Bamian limestone deposit. Geological sections of prospecting lines I, II, II', III', IV. Scale 1:200
R0832L_022 NO Bamian limestone deposit
R0832L_023 NO 3.21 Sketch geological map of the Hajigak quartzite deposit. Scale 1:2000
R0832L_024 NO 3.22 Plan of sampling and reserve calculation at the Hajigak quartzite deposit. Scale 1:500
R1206L_008 YES 2.7 Geological map and sections of the Kandvala limestone deposit. Scale 1:500
R1227L_012 YES 3.10 Kandvala limestone deposit (section across the deposit). Scale 1:500
R1418L_022 NO 2.21 Average contents of some elements in limestone of Bamian area. The schematic geological map of the Guri limestone deposit and Puli-Khumri clay deposit, Scale 1:10,000
R1636L_003 YES 1.2 The schematic geological map of the Guri limestone deposit and Puli-Khumri clay deposit, Scale 1:10,000
R1665, Pasekov Yu.M., Vase A. Russian 1981
Report on results of geological exploration for glass raw material (quartz sand, quartzite, limestone) in 1979–1980
R1740L_004 YES 2.3 Data map of Guri limestone deposit. Scale 1:1,000
R1740L_005 YES 2.4.1
Geological sections of Guri limestone deposit. Scale 1:1000. Sheet 1
R1740L_006 YES 2.4.2
Geological sections of Guri limestone deposit. Scale 1:1,000. Sheet 2
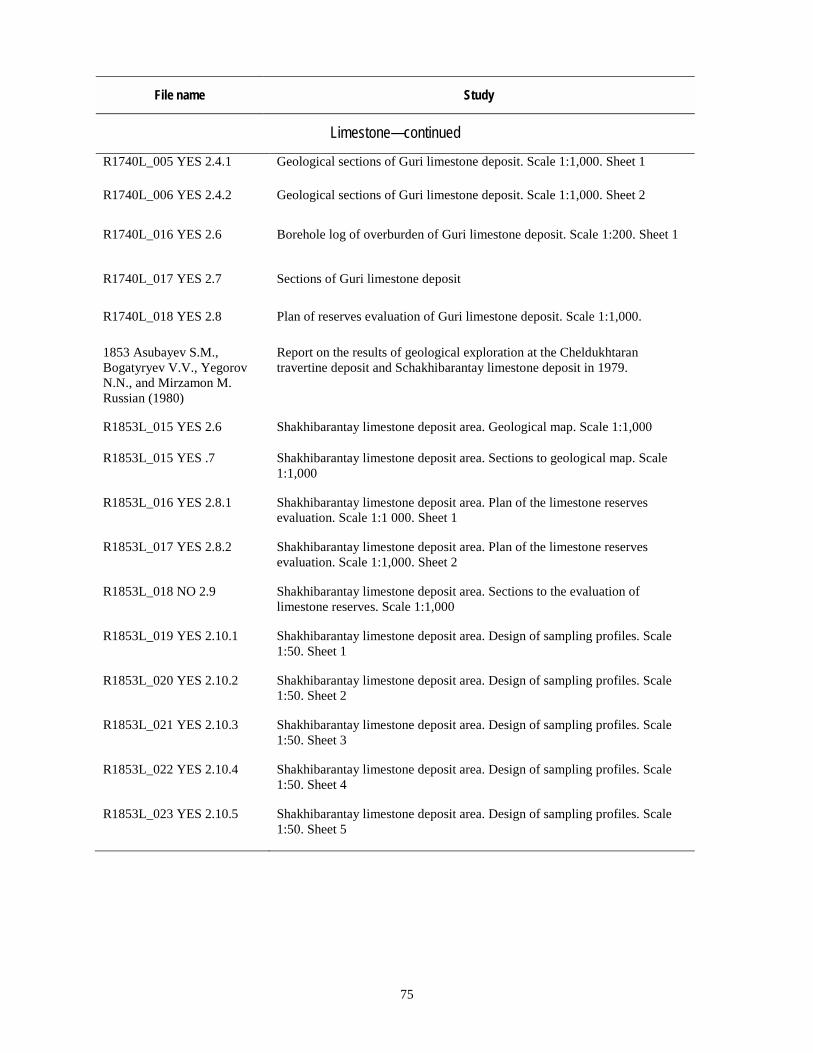
75
File name Study
Limestone—continued R1740L_005 YES 2.4.1 Geological sections of Guri limestone deposit. Scale 1:1,000. Sheet 1
R1740L_006 YES 2.4.2 Geological sections of Guri limestone deposit. Scale 1:1,000. Sheet 2
R1740L_016 YES 2.6 Borehole log of overburden of Guri limestone deposit. Scale 1:200. Sheet 1
R1740L_017 YES 2.7 Sections of Guri limestone deposit
R1740L_018 YES 2.8 Plan of reserves evaluation of Guri limestone deposit. Scale 1:1,000.
1853 Asubayev S.M., Bogatyryev V.V., Yegorov N.N., and Mirzamon M. Russian (1980)
Report on the results of geological exploration at the Cheldukhtaran travertine deposit and Schakhibarantay limestone deposit in 1979.
R1853L_015 YES 2.6 Shakhibarantay limestone deposit area. Geological map. Scale 1:1,000
R1853L_015 YES .7 Shakhibarantay limestone deposit area. Sections to geological map. Scale 1:1,000
R1853L_016 YES 2.8.1 Shakhibarantay limestone deposit area. Plan of the limestone reserves evaluation. Scale 1:1 000. Sheet 1
R1853L_017 YES 2.8.2 Shakhibarantay limestone deposit area. Plan of the limestone reserves evaluation. Scale 1:1,000. Sheet 2
R1853L_018 NO 2.9 Shakhibarantay limestone deposit area. Sections to the evaluation of limestone reserves. Scale 1:1,000
R1853L_019 YES 2.10.1 Shakhibarantay limestone deposit area. Design of sampling profiles. Scale 1:50. Sheet 1
R1853L_020 YES 2.10.2 Shakhibarantay limestone deposit area. Design of sampling profiles. Scale 1:50. Sheet 2
R1853L_021 YES 2.10.3 Shakhibarantay limestone deposit area. Design of sampling profiles. Scale 1:50. Sheet 3
R1853L_022 YES 2.10.4 Shakhibarantay limestone deposit area. Design of sampling profiles. Scale 1:50. Sheet 4
R1853L_023 YES 2.10.5 Shakhibarantay limestone deposit area. Design of sampling profiles. Scale 1:50. Sheet 5
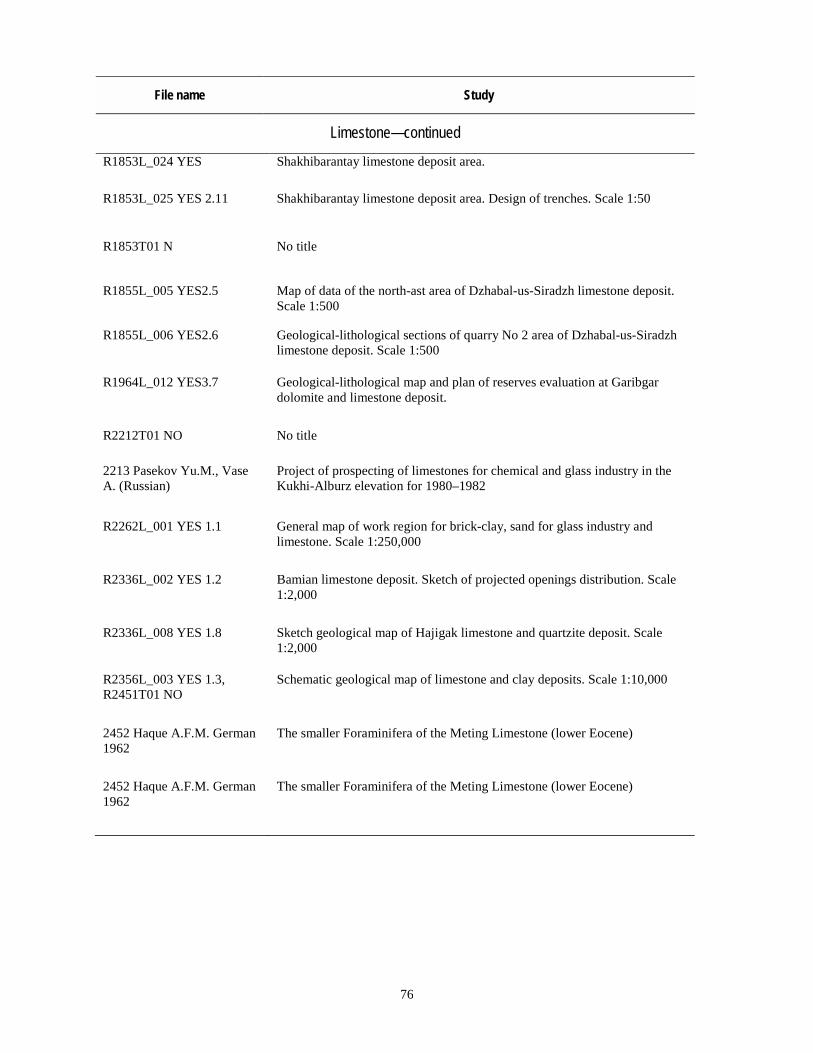
76
File name Study
Limestone—continued R1853L_024 YES Shakhibarantay limestone deposit area.
R1853L_025 YES 2.11 Shakhibarantay limestone deposit area. Design of trenches. Scale 1:50
R1853T01 N No title
R1855L_005 YES2.5 Map of data of the north-ast area of Dzhabal-us-Siradzh limestone deposit. Scale 1:500
R1855L_006 YES2.6 Geological-lithological sections of quarry No 2 area of Dzhabal-us-Siradzh limestone deposit. Scale 1:500
R1964L_012 YES3.7 Geological-lithological map and plan of reserves evaluation at Garibgar dolomite and limestone deposit.
R2212T01 NO No title
2213 Pasekov Yu.M., Vase A. (Russian)
Project of prospecting of limestones for chemical and glass industry in the Kukhi-Alburz elevation for 1980–1982
R2262L_001 YES 1.1 General map of work region for brick-clay, sand for glass industry and limestone. Scale 1:250,000
R2336L_002 YES 1.2 Bamian limestone deposit. Sketch of projected openings distribution. Scale 1:2,000
R2336L_008 YES 1.8 Sketch geological map of Hajigak limestone and quartzite deposit. Scale 1:2,000
R2356L_003 YES 1.3, R2451T01 NO
Schematic geological map of limestone and clay deposits. Scale 1:10,000
2452 Haque A.F.M. German 1962
The smaller Foraminifera of the Meting Limestone (lower Eocene)
2452 Haque A.F.M. German 1962
The smaller Foraminifera of the Meting Limestone (lower Eocene)
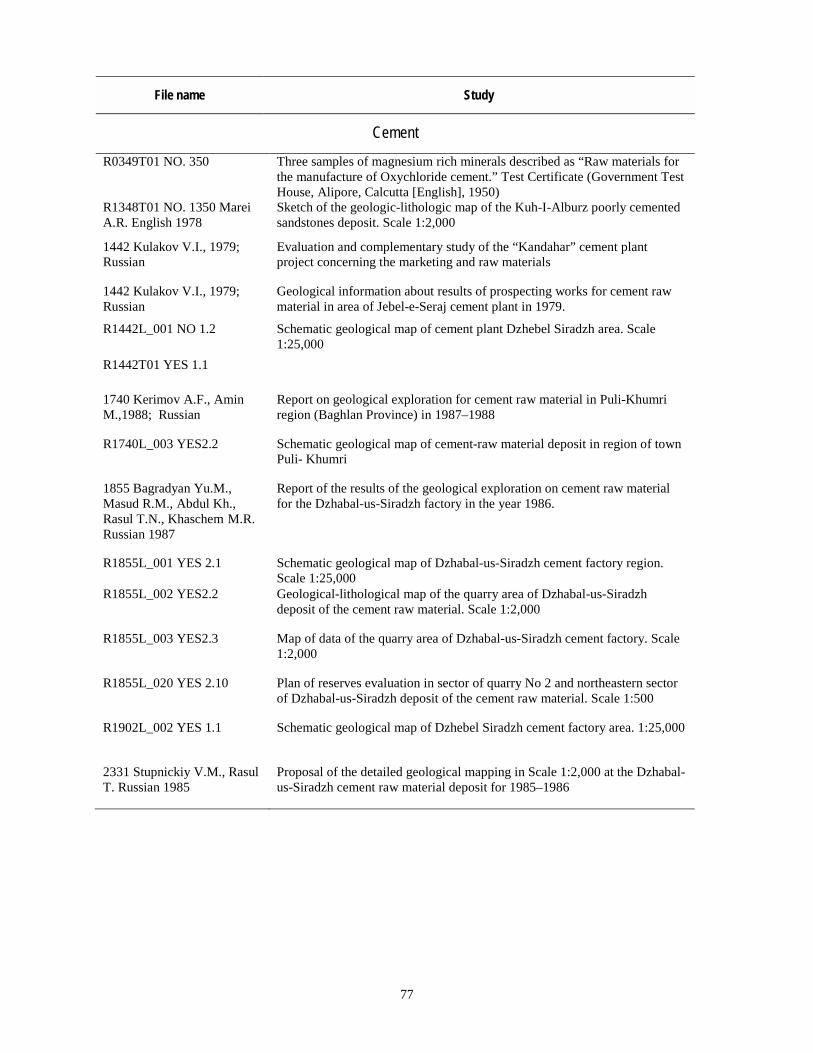
77
File name Study
Cement R0349T01 NO. 350 Three samples of magnesium rich minerals described as “Raw materials for
the manufacture of Oxychloride cement.” Test Certificate (Government Test House, Alipore, Calcutta [English], 1950)
R1348T01 NO. 1350 Marei A.R. English 1978
Sketch of the geologic-lithologic map of the Kuh-I-Alburz poorly cemented sandstones deposit. Scale 1:2,000
1442 Kulakov V.I., 1979; Russian
Evaluation and complementary study of the “Kandahar” cement plant project concerning the marketing and raw materials
1442 Kulakov V.I., 1979; Russian
Geological information about results of prospecting works for cement raw material in area of Jebel-e-Seraj cement plant in 1979.
R1442L_001 NO 1.2 Schematic geological map of cement plant Dzhebel Siradzh area. Scale 1:25,000
R1442T01 YES 1.1
1740 Kerimov A.F., Amin M.,1988; Russian
Report on geological exploration for cement raw material in Puli-Khumri region (Baghlan Province) in 1987–1988
R1740L_003 YES2.2 Schematic geological map of cement-raw material deposit in region of town Puli- Khumri
1855 Bagradyan Yu.M., Masud R.M., Abdul Kh., Rasul T.N., Khaschem M.R. Russian 1987
Report of the results of the geological exploration on cement raw material for the Dzhabal-us-Siradzh factory in the year 1986.
R1855L_001 YES 2.1 Schematic geological map of Dzhabal-us-Siradzh cement factory region. Scale 1:25,000
R1855L_002 YES2.2 Geological-lithological map of the quarry area of Dzhabal-us-Siradzh deposit of the cement raw material. Scale 1:2,000
R1855L_003 YES2.3 Map of data of the quarry area of Dzhabal-us-Siradzh cement factory. Scale 1:2,000
R1855L_020 YES 2.10 Plan of reserves evaluation in sector of quarry No 2 and northeastern sector of Dzhabal-us-Siradzh deposit of the cement raw material. Scale 1:500
R1902L_002 YES 1.1 Schematic geological map of Dzhebel Siradzh cement factory area. 1:25,000
2331 Stupnickiy V.M., Rasul T. Russian 1985
Proposal of the detailed geological mapping in Scale 1:2,000 at the Dzhabal-us-Siradzh cement raw material deposit for 1985–1986
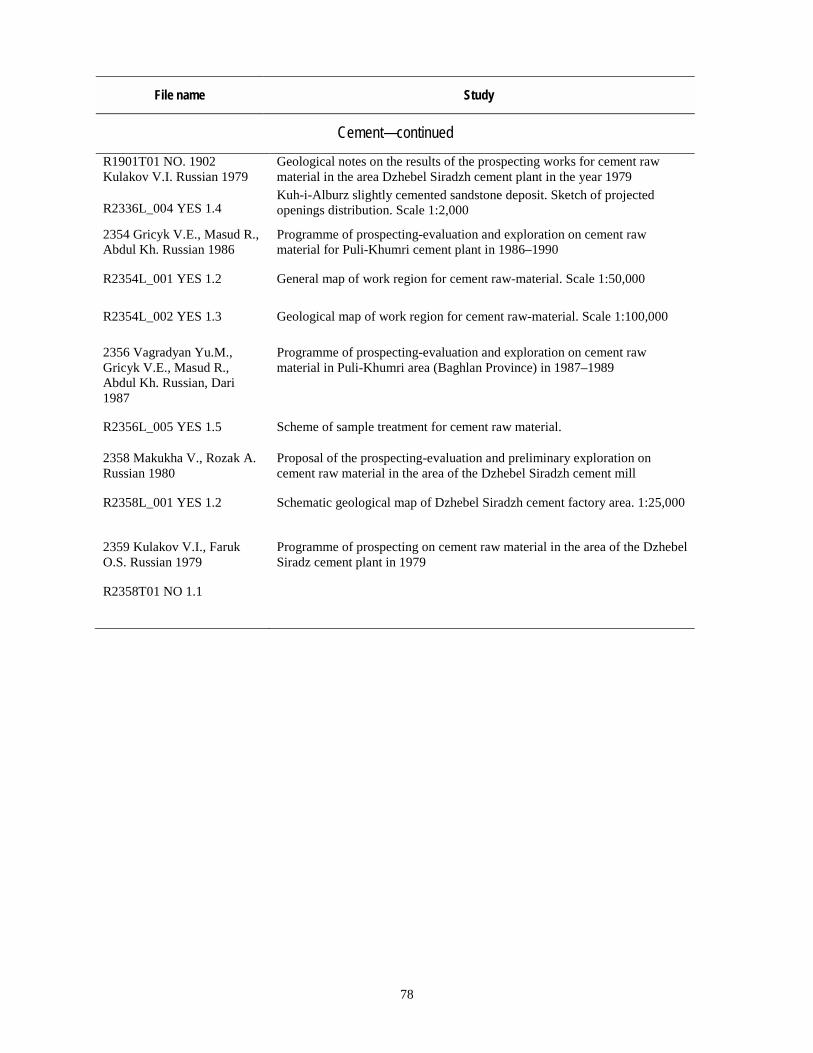
78
File name Study
Cement—continued R1901T01 NO. 1902 Kulakov V.I. Russian 1979
Geological notes on the results of the prospecting works for cement raw material in the area Dzhebel Siradzh cement plant in the year 1979
R2336L_004 YES 1.4 Kuh-i-Alburz slightly cemented sandstone deposit. Sketch of projected openings distribution. Scale 1:2,000
2354 Gricyk V.E., Masud R., Abdul Kh. Russian 1986
Programme of prospecting-evaluation and exploration on cement raw material for Puli-Khumri cement plant in 1986–1990
R2354L_001 YES 1.2
General map of work region for cement raw-material. Scale 1:50,000
R2354L_002 YES 1.3
Geological map of work region for cement raw-material. Scale 1:100,000
2356 Vagradyan Yu.M., Gricyk V.E., Masud R., Abdul Kh. Russian, Dari 1987
Programme of prospecting-evaluation and exploration on cement raw material in Puli-Khumri area (Baghlan Province) in 1987–1989
R2356L_005 YES 1.5 Scheme of sample treatment for cement raw material.
2358 Makukha V., Rozak A. Russian 1980
Proposal of the prospecting-evaluation and preliminary exploration on cement raw material in the area of the Dzhebel Siradzh cement mill
R2358L_001 YES 1.2 Schematic geological map of Dzhebel Siradzh cement factory area. 1:25,000
2359 Kulakov V.I., Faruk O.S. Russian 1979
Programme of prospecting on cement raw material in the area of the Dzhebel Siradz cement plant in 1979
R2358T01 NO 1.1
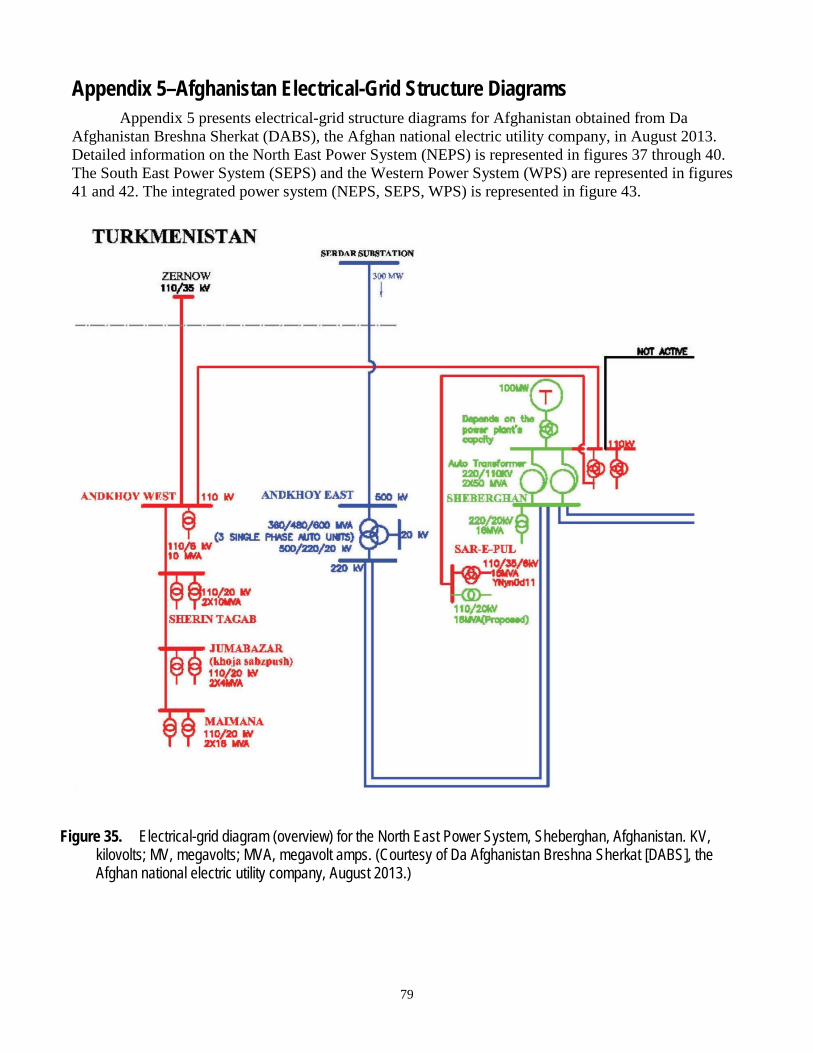
79
Appendix 5–Afghanistan Electrical-Grid Structure Diagrams Appendix 5 presents electrical-grid structure diagrams for Afghanistan obtained from Da
Afghanistan Breshna Sherkat (DABS), the Afghan national electric utility company, in August 2013. Detailed information on the North East Power System (NEPS) is represented in figures 37 through 40. The South East Power System (SEPS) and the Western Power System (WPS) are represented in figures 41 and 42. The integrated power system (NEPS, SEPS, WPS) is represented in figure 43.
Figure 35. Electrical-grid diagram (overview) for the North East Power System, Sheberghan, Afghanistan. KV, kilovolts; MV, megavolts; MVA, megavolt amps. (Courtesy of Da Afghanistan Breshna Sherkat [DABS], the Afghan national electric utility company, August 2013.)
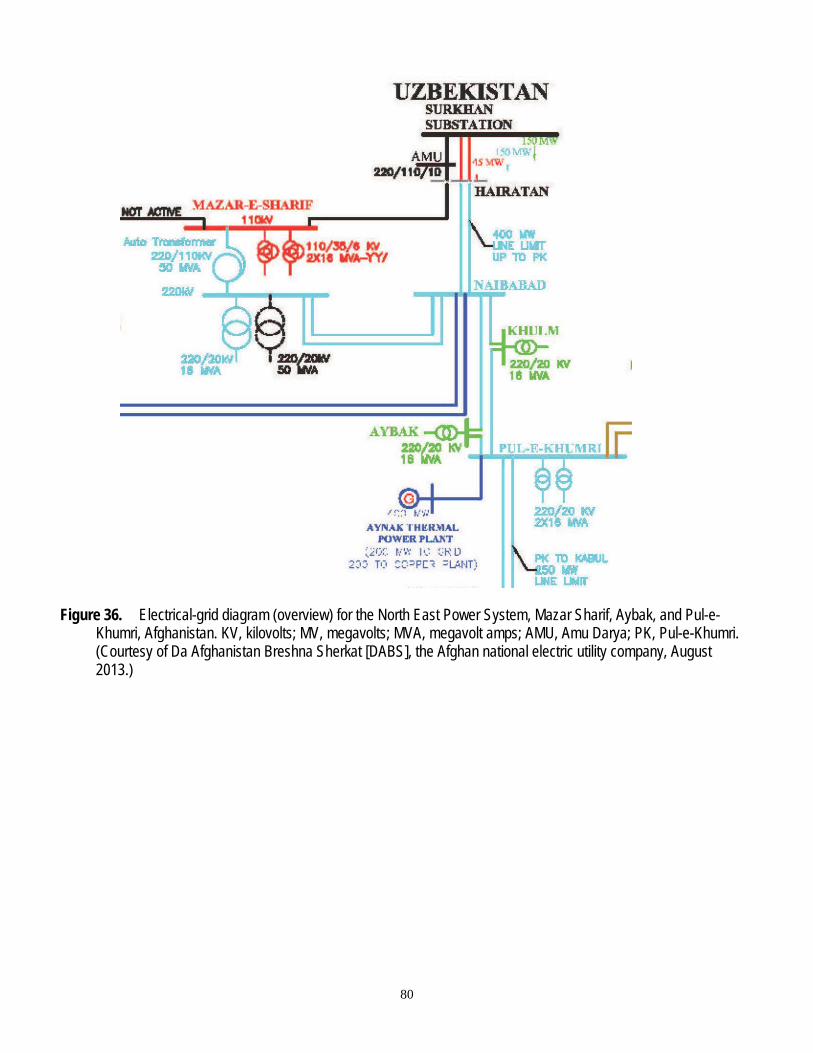
80
Figure 36. Electrical-grid diagram (overview) for the North East Power System, Mazar Sharif, Aybak, and Pul-e-Khumri, Afghanistan. KV, kilovolts; MV, megavolts; MVA, megavolt amps; AMU, Amu Darya; PK, Pul-e-Khumri. (Courtesy of Da Afghanistan Breshna Sherkat [DABS], the Afghan national electric utility company, August 2013.)
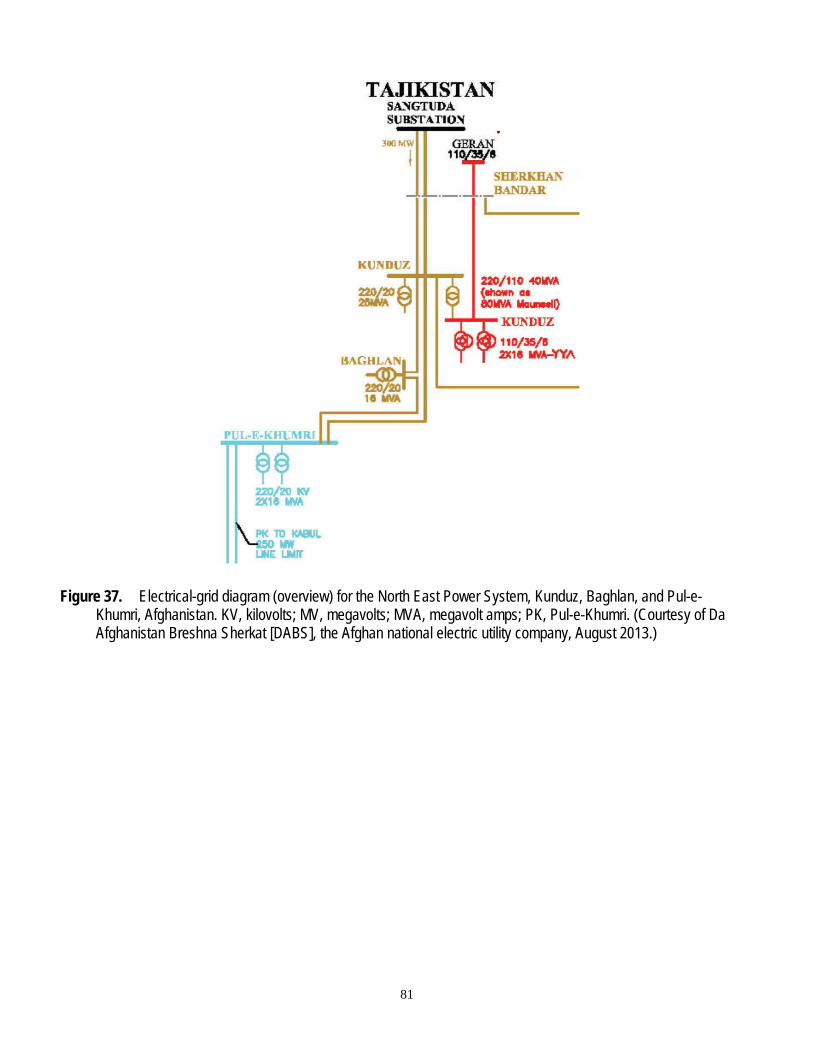
81
Figure 37. Electrical-grid diagram (overview) for the North East Power System, Kunduz, Baghlan, and Pul-e-Khumri, Afghanistan. KV, kilovolts; MV, megavolts; MVA, megavolt amps; PK, Pul-e-Khumri. (Courtesy of Da Afghanistan Breshna Sherkat [DABS], the Afghan national electric utility company, August 2013.)
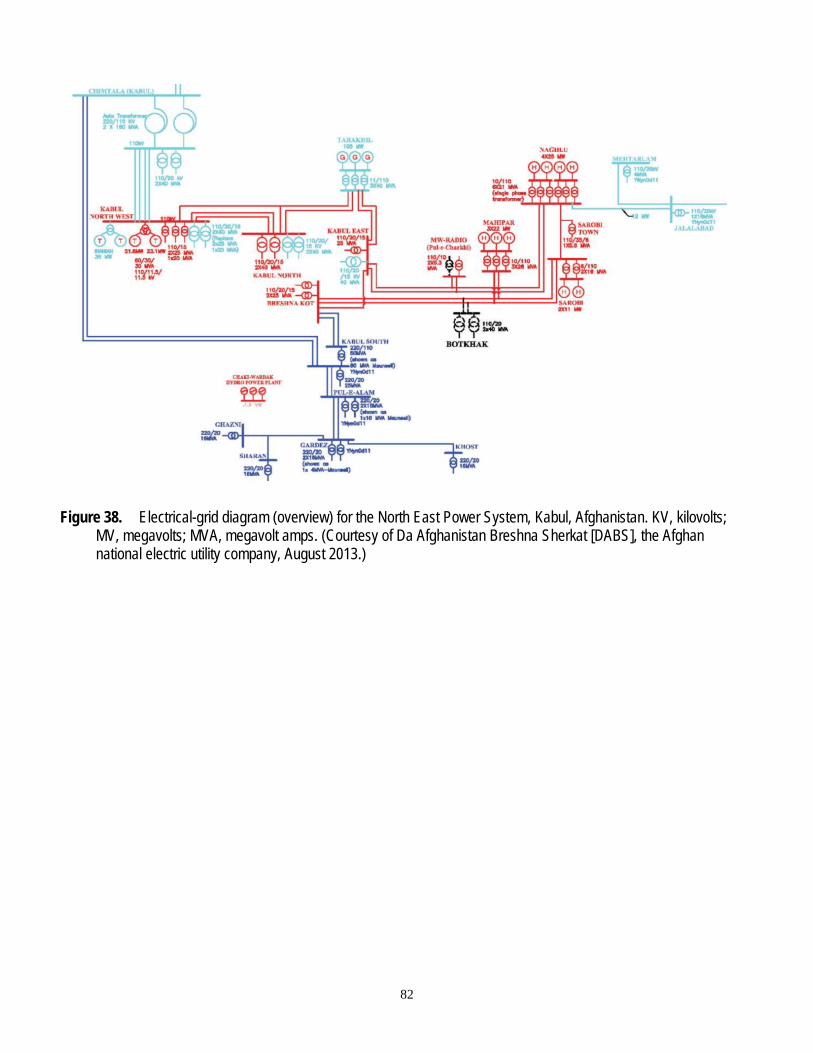
82
Figure 38. Electrical-grid diagram (overview) for the North East Power System, Kabul, Afghanistan. KV, kilovolts; MV, megavolts; MVA, megavolt amps. (Courtesy of Da Afghanistan Breshna Sherkat [DABS], the Afghan national electric utility company, August 2013.)
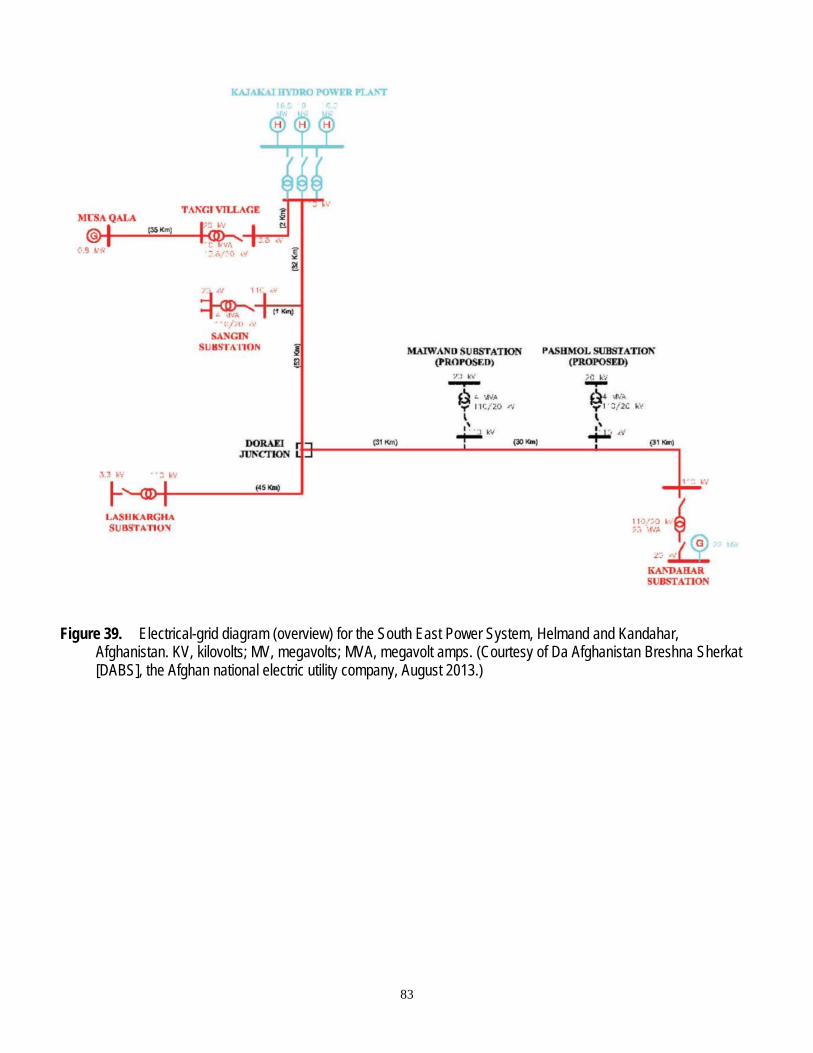
83
Figure 39. Electrical-grid diagram (overview) for the South East Power System, Helmand and Kandahar, Afghanistan. KV, kilovolts; MV, megavolts; MVA, megavolt amps. (Courtesy of Da Afghanistan Breshna Sherkat [DABS], the Afghan national electric utility company, August 2013.)
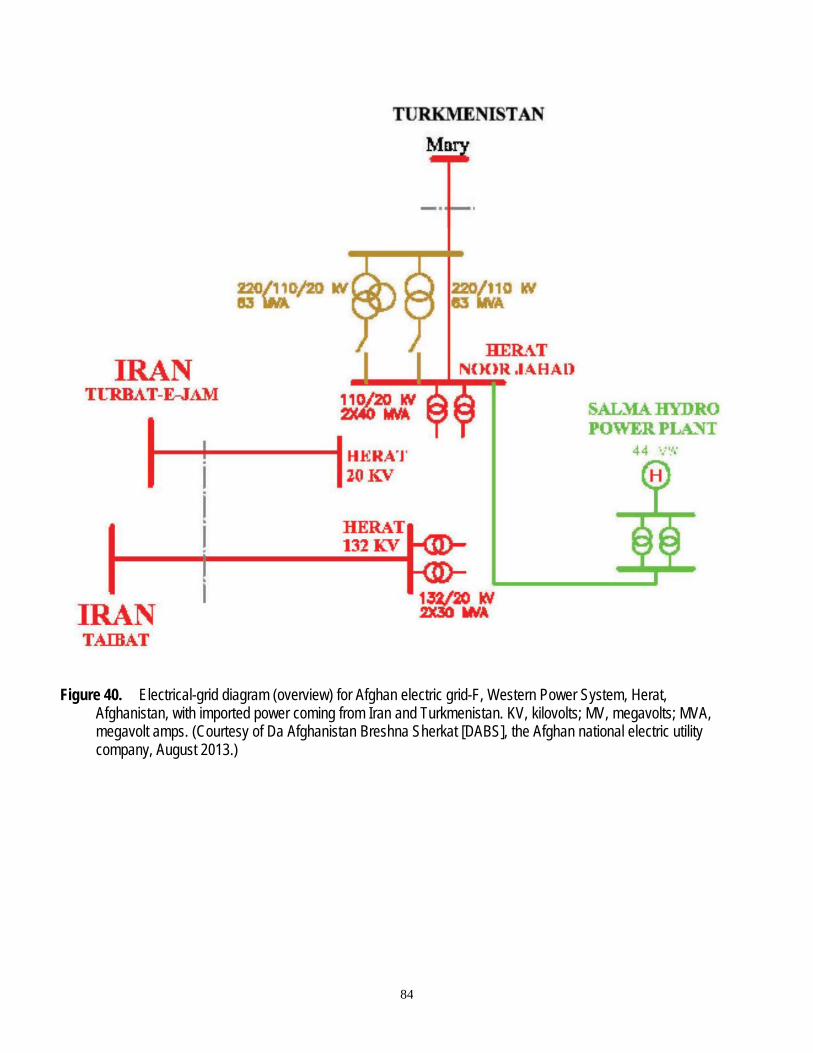
84
Figure 40. Electrical-grid diagram (overview) for Afghan electric grid-F, Western Power System, Herat, Afghanistan, with imported power coming from Iran and Turkmenistan. KV, kilovolts; MV, megavolts; MVA, megavolt amps. (Courtesy of Da Afghanistan Breshna Sherkat [DABS], the Afghan national electric utility company, August 2013.)
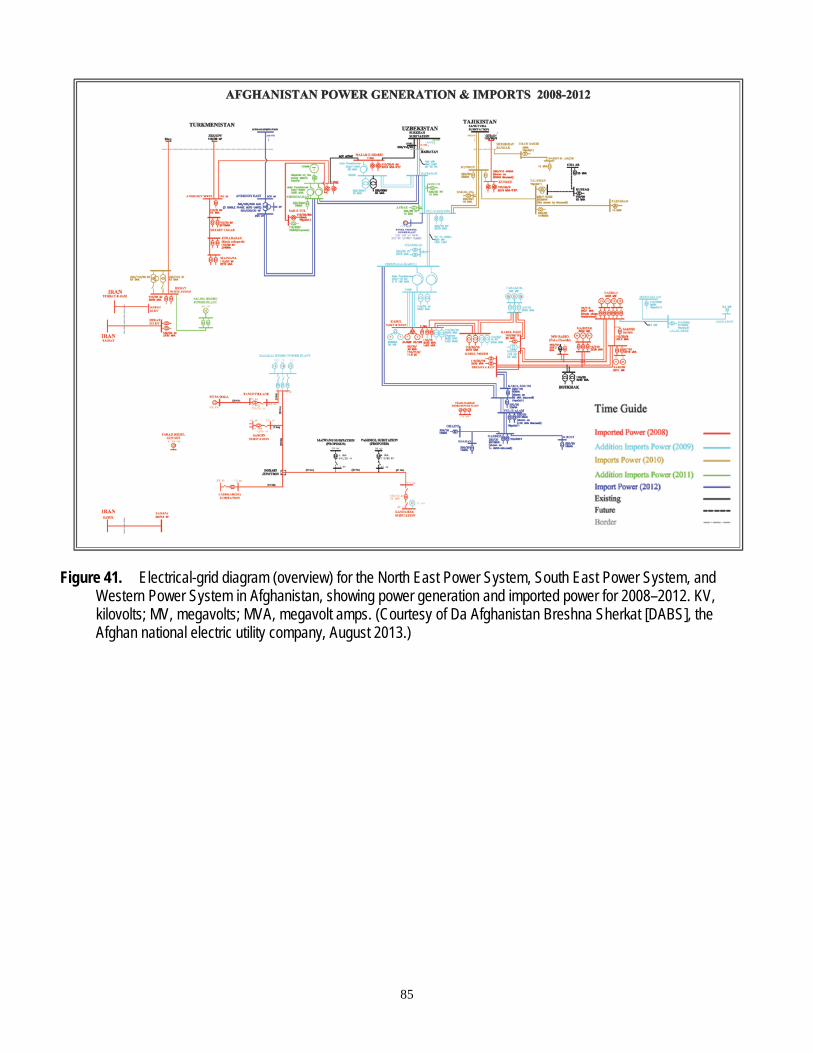
85
Figure 41. Electrical-grid diagram (overview) for the North East Power System, South East Power System, and Western Power System in Afghanistan, showing power generation and imported power for 2008–2012. KV, kilovolts; MV, megavolts; MVA, megavolt amps. (Courtesy of Da Afghanistan Breshna Sherkat [DABS], the Afghan national electric utility company, August 2013.)
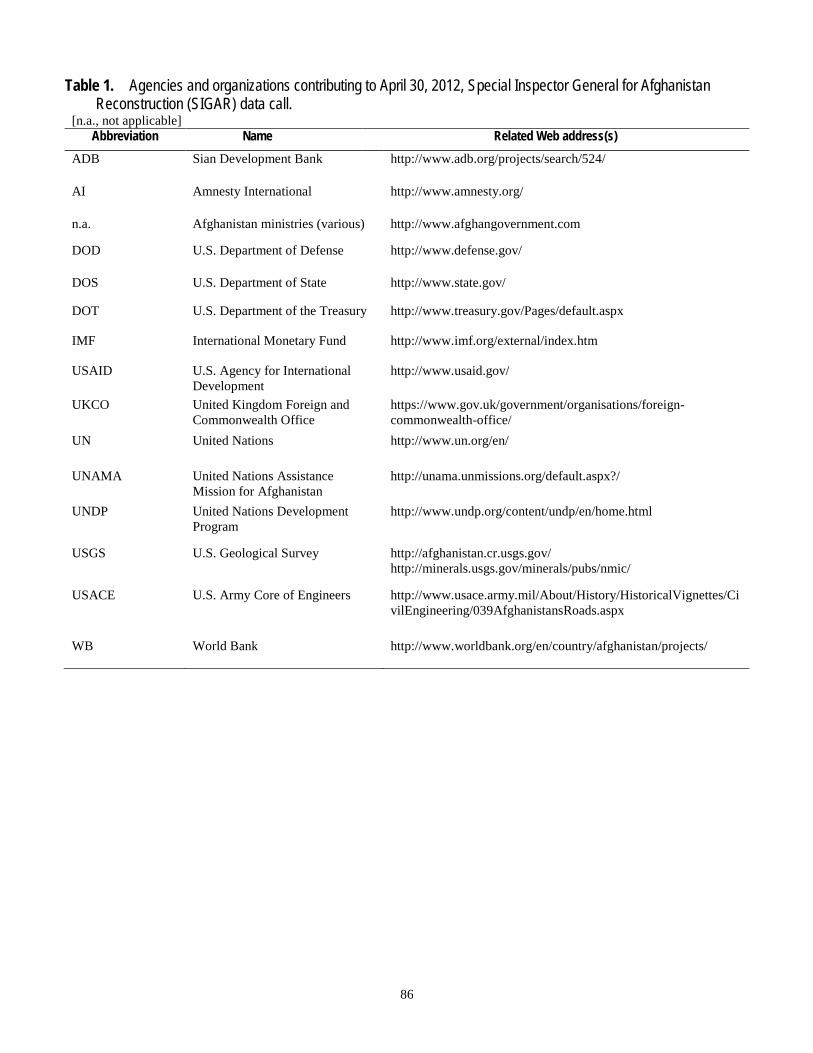
86
Table 1. Agencies and organizations contributing to April 30, 2012, Special Inspector General for Afghanistan Reconstruction (SIGAR) data call.
[n.a., not applicable] Abbreviation Name Related Web address(s)
ADB Sian Development Bank http://www.adb.org/projects/search/524/
AI Amnesty International http://www.amnesty.org/
n.a. Afghanistan ministries (various) http://www.afghangovernment.com
DOD U.S. Department of Defense http://www.defense.gov/
DOS U.S. Department of State http://www.state.gov/
DOT U.S. Department of the Treasury http://www.treasury.gov/Pages/default.aspx
IMF International Monetary Fund http://www.imf.org/external/index.htm
USAID U.S. Agency for International Development
http://www.usaid.gov/
UKCO United Kingdom Foreign and Commonwealth Office
https://www.gov.uk/government/organisations/foreign-commonwealth-office/
UN United Nations http://www.un.org/en/
UNAMA United Nations Assistance Mission for Afghanistan
http://unama.unmissions.org/default.aspx?/
UNDP United Nations Development Program
http://www.undp.org/content/undp/en/home.html
USGS U.S. Geological Survey http://afghanistan.cr.usgs.gov/ http://minerals.usgs.gov/minerals/pubs/nmic/
USACE U.S. Army Core of Engineers http://www.usace.army.mil/About/History/HistoricalVignettes/CivilEngineering/039AfghanistansRoads.aspx
WB World Bank http://www.worldbank.org/en/country/afghanistan/projects/
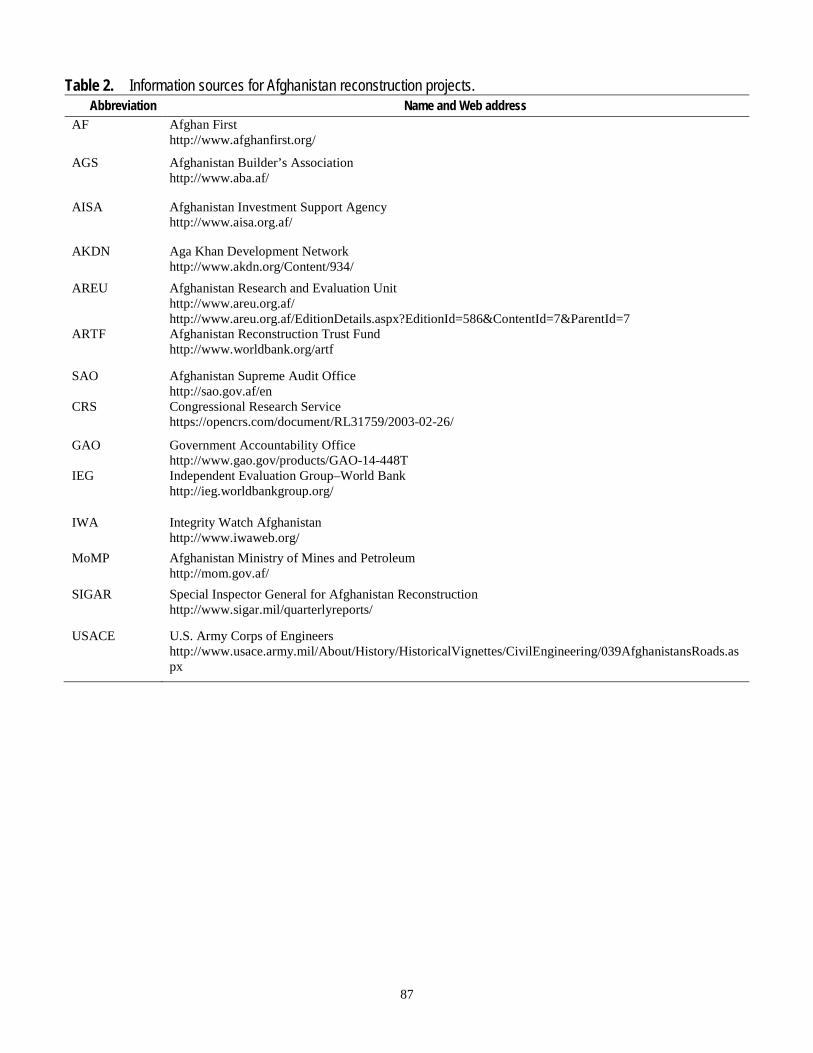
87
Table 2. Information sources for Afghanistan reconstruction projects. Abbreviation Name and Web address
AF Afghan First http://www.afghanfirst.org/
AGS Afghanistan Builder’s Association http://www.aba.af/
AISA Afghanistan Investment Support Agency http://www.aisa.org.af/
AKDN Aga Khan Development Network http://www.akdn.org/Content/934/
AREU Afghanistan Research and Evaluation Unit http://www.areu.org.af/ http://www.areu.org.af/EditionDetails.aspx?EditionId=586&ContentId=7&ParentId=7
ARTF Afghanistan Reconstruction Trust Fund http://www.worldbank.org/artf
SAO Afghanistan Supreme Audit Office http://sao.gov.af/en
CRS Congressional Research Service https://opencrs.com/document/RL31759/2003-02-26/
GAO Government Accountability Office http://www.gao.gov/products/GAO-14-448T
IEG Independent Evaluation Group–World Bank http://ieg.worldbankgroup.org/
IWA Integrity Watch Afghanistan http://www.iwaweb.org/
MoMP Afghanistan Ministry of Mines and Petroleum http://mom.gov.af/
SIGAR Special Inspector General for Afghanistan Reconstruction http://www.sigar.mil/quarterlyreports/
USACE U.S. Army Corps of Engineers http://www.usace.army.mil/About/History/HistoricalVignettes/CivilEngineering/039AfghanistansRoads.aspx
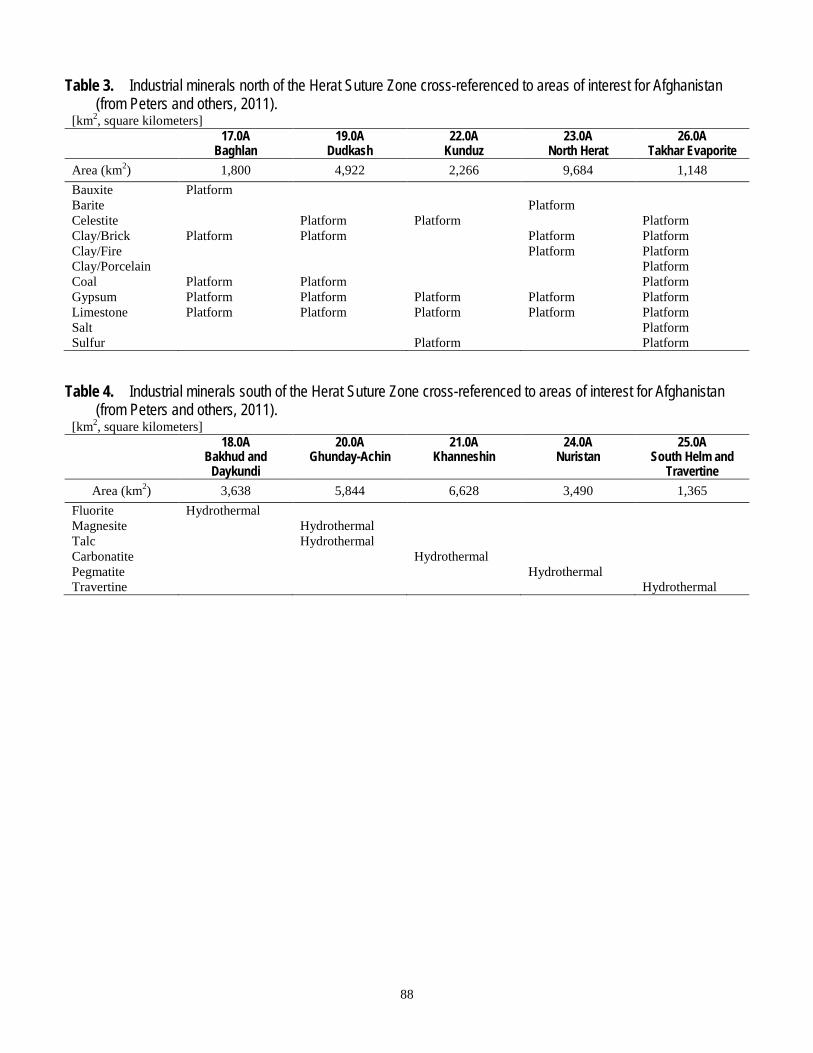
88
Table 3. Industrial minerals north of the Herat Suture Zone cross-referenced to areas of interest for Afghanistan (from Peters and others, 2011).
[km2, square kilometers] 17.0A
Baghlan 19.0A
Dudkash 22.0A
Kunduz 23.0A
North Herat 26.0A
Takhar Evaporite Area (km2) 1,800 4,922 2,266 9,684 1,148 Bauxite Platform Barite Platform Celestite Platform Platform Platform Clay/Brick Platform Platform Platform Platform Clay/Fire Platform Platform Clay/Porcelain Platform Coal Platform Platform Platform Gypsum Platform Platform Platform Platform Platform Limestone Platform Platform Platform Platform Platform Salt Platform Sulfur Platform Platform
Table 4. Industrial minerals south of the Herat Suture Zone cross-referenced to areas of interest for Afghanistan (from Peters and others, 2011).
[km2, square kilometers] 18.0A
Bakhud and Daykundi
20.0A Ghunday-Achin
21.0A Khanneshin
24.0A Nuristan
25.0A South Helm and
Travertine Area (km2) 3,638 5,844 6,628 3,490 1,365
Fluorite Hydrothermal Magnesite Hydrothermal Talc Hydrothermal Carbonatite Hydrothermal Pegmatite Hydrothermal Travertine Hydrothermal
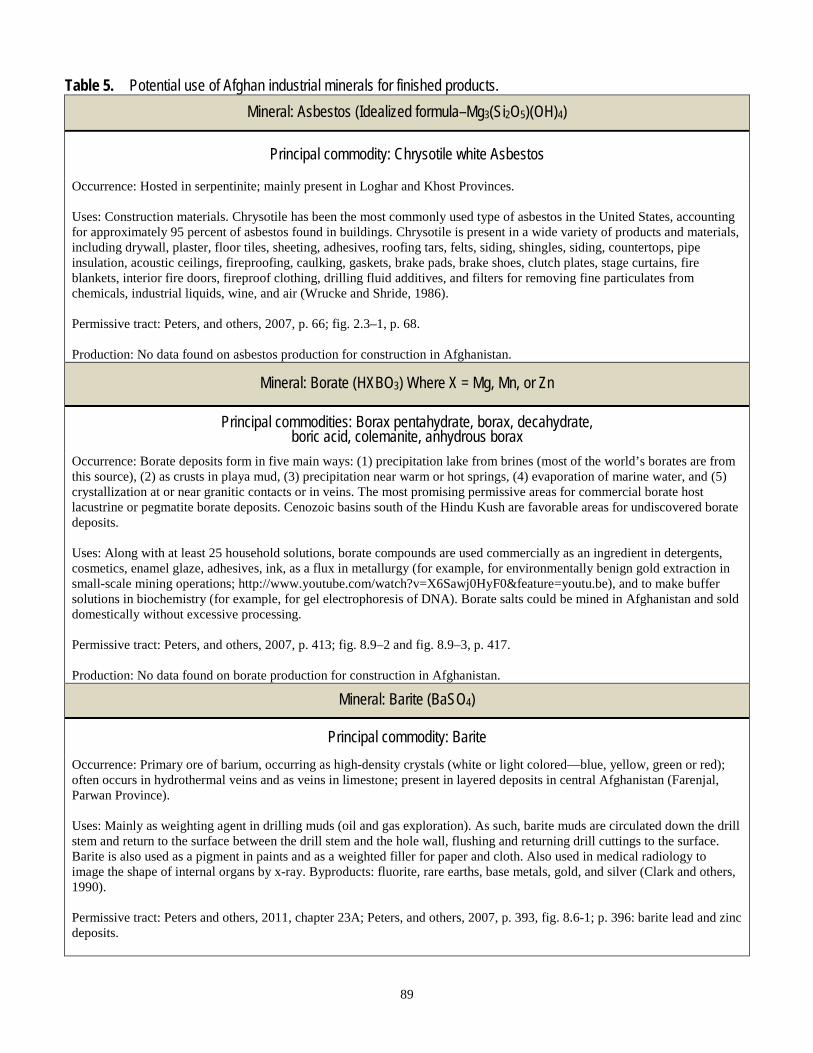
89
Table 5. Potential use of Afghan industrial minerals for finished products. Mineral: Asbestos (Idealized formula–Mg3(Si2O5)(OH)4)
Principal commodity: Chrysotile white Asbestos
Occurrence: Hosted in serpentinite; mainly present in Loghar and Khost Provinces. Uses: Construction materials. Chrysotile has been the most commonly used type of asbestos in the United States, accounting for approximately 95 percent of asbestos found in buildings. Chrysotile is present in a wide variety of products and materials, including drywall, plaster, floor tiles, sheeting, adhesives, roofing tars, felts, siding, shingles, siding, countertops, pipe insulation, acoustic ceilings, fireproofing, caulking, gaskets, brake pads, brake shoes, clutch plates, stage curtains, fire blankets, interior fire doors, fireproof clothing, drilling fluid additives, and filters for removing fine particulates from chemicals, industrial liquids, wine, and air (Wrucke and Shride, 1986). Permissive tract: Peters, and others, 2007, p. 66; fig. 2.3–1, p. 68. Production: No data found on asbestos production for construction in Afghanistan.
Mineral: Borate (HXBO3) Where X = Mg, Mn, or Zn
Principal commodities: Borax pentahydrate, borax, decahydrate, boric acid, colemanite, anhydrous borax
Occurrence: Borate deposits form in five main ways: (1) precipitation lake from brines (most of the world’s borates are from this source), (2) as crusts in playa mud, (3) precipitation near warm or hot springs, (4) evaporation of marine water, and (5) crystallization at or near granitic contacts or in veins. The most promising permissive areas for commercial borate host lacustrine or pegmatite borate deposits. Cenozoic basins south of the Hindu Kush are favorable areas for undiscovered borate deposits. Uses: Along with at least 25 household solutions, borate compounds are used commercially as an ingredient in detergents, cosmetics, enamel glaze, adhesives, ink, as a flux in metallurgy (for example, for environmentally benign gold extraction in small-scale mining operations; http://www.youtube.com/watch?v=X6Sawj0HyF0&feature=youtu.be), and to make buffer solutions in biochemistry (for example, for gel electrophoresis of DNA). Borate salts could be mined in Afghanistan and sold domestically without excessive processing. Permissive tract: Peters, and others, 2007, p. 413; fig. 8.9–2 and fig. 8.9–3, p. 417. Production: No data found on borate production for construction in Afghanistan.
Mineral: Barite (BaSO4)
Principal commodity: Barite Occurrence: Primary ore of barium, occurring as high-density crystals (white or light colored—blue, yellow, green or red); often occurs in hydrothermal veins and as veins in limestone; present in layered deposits in central Afghanistan (Farenjal, Parwan Province). Uses: Mainly as weighting agent in drilling muds (oil and gas exploration). As such, barite muds are circulated down the drill stem and return to the surface between the drill stem and the hole wall, flushing and returning drill cuttings to the surface. Barite is also used as a pigment in paints and as a weighted filler for paper and cloth. Also used in medical radiology to image the shape of internal organs by x-ray. Byproducts: fluorite, rare earths, base metals, gold, and silver (Clark and others, 1990). Permissive tract: Peters and others, 2011, chapter 23A; Peters, and others, 2007, p. 393, fig. 8.6-1; p. 396: barite lead and zinc deposits.
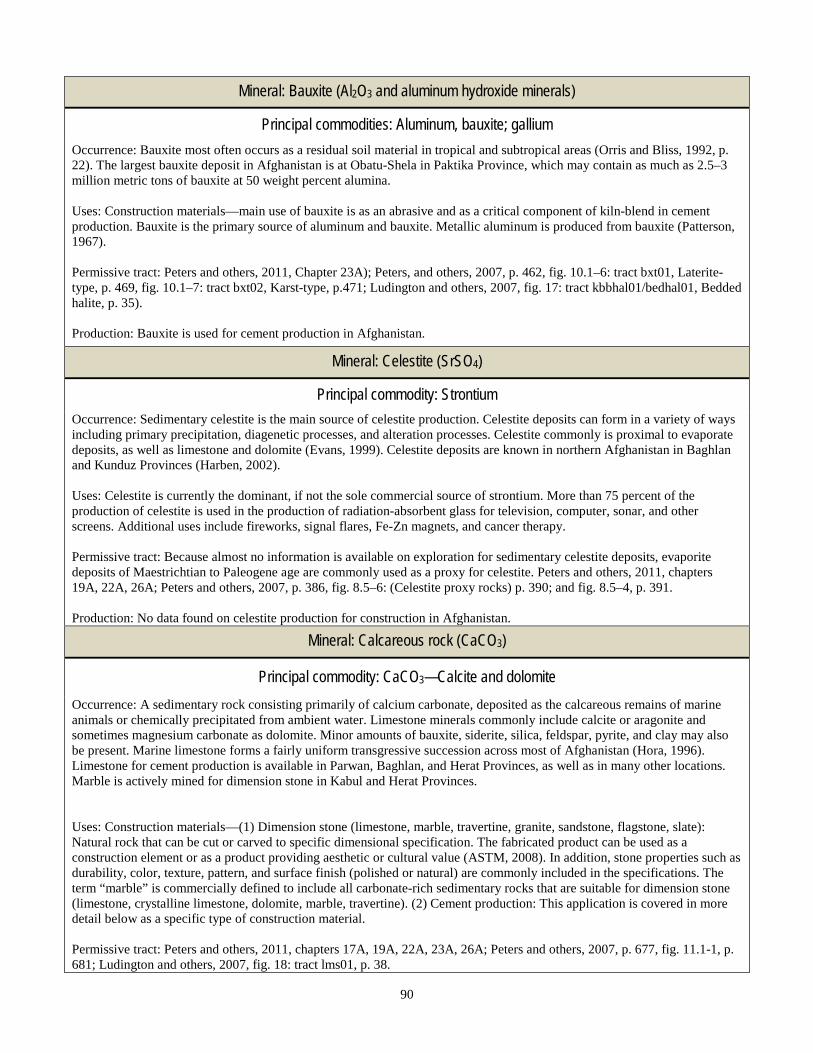
90
Mineral: Bauxite (Al2O3 and aluminum hydroxide minerals)
Principal commodities: Aluminum, bauxite; gallium Occurrence: Bauxite most often occurs as a residual soil material in tropical and subtropical areas (Orris and Bliss, 1992, p. 22). The largest bauxite deposit in Afghanistan is at Obatu-Shela in Paktika Province, which may contain as much as 2.5–3 million metric tons of bauxite at 50 weight percent alumina. Uses: Construction materials—main use of bauxite is as an abrasive and as a critical component of kiln-blend in cement production. Bauxite is the primary source of aluminum and bauxite. Metallic aluminum is produced from bauxite (Patterson, 1967). Permissive tract: Peters and others, 2011, Chapter 23A); Peters, and others, 2007, p. 462, fig. 10.1–6: tract bxt01, Laterite-type, p. 469, fig. 10.1–7: tract bxt02, Karst-type, p.471; Ludington and others, 2007, fig. 17: tract kbbhal01/bedhal01, Bedded halite, p. 35). Production: Bauxite is used for cement production in Afghanistan.
Mineral: Celestite (SrSO4)
Principal commodity: Strontium Occurrence: Sedimentary celestite is the main source of celestite production. Celestite deposits can form in a variety of ways including primary precipitation, diagenetic processes, and alteration processes. Celestite commonly is proximal to evaporate deposits, as well as limestone and dolomite (Evans, 1999). Celestite deposits are known in northern Afghanistan in Baghlan and Kunduz Provinces (Harben, 2002). Uses: Celestite is currently the dominant, if not the sole commercial source of strontium. More than 75 percent of the production of celestite is used in the production of radiation-absorbent glass for television, computer, sonar, and other screens. Additional uses include fireworks, signal flares, Fe-Zn magnets, and cancer therapy. Permissive tract: Because almost no information is available on exploration for sedimentary celestite deposits, evaporite deposits of Maestrichtian to Paleogene age are commonly used as a proxy for celestite. Peters and others, 2011, chapters 19A, 22A, 26A; Peters and others, 2007, p. 386, fig. 8.5–6: (Celestite proxy rocks) p. 390; and fig. 8.5–4, p. 391. Production: No data found on celestite production for construction in Afghanistan.
Mineral: Calcareous rock (CaCO3)
Principal commodity: CaCO3—Calcite and dolomite Occurrence: A sedimentary rock consisting primarily of calcium carbonate, deposited as the calcareous remains of marine animals or chemically precipitated from ambient water. Limestone minerals commonly include calcite or aragonite and sometimes magnesium carbonate as dolomite. Minor amounts of bauxite, siderite, silica, feldspar, pyrite, and clay may also be present. Marine limestone forms a fairly uniform transgressive succession across most of Afghanistan (Hora, 1996). Limestone for cement production is available in Parwan, Baghlan, and Herat Provinces, as well as in many other locations. Marble is actively mined for dimension stone in Kabul and Herat Provinces. Uses: Construction materials—(1) Dimension stone (limestone, marble, travertine, granite, sandstone, flagstone, slate): Natural rock that can be cut or carved to specific dimensional specification. The fabricated product can be used as a construction element or as a product providing aesthetic or cultural value (ASTM, 2008). In addition, stone properties such as durability, color, texture, pattern, and surface finish (polished or natural) are commonly included in the specifications. The term “marble” is commercially defined to include all carbonate-rich sedimentary rocks that are suitable for dimension stone (limestone, crystalline limestone, dolomite, marble, travertine). (2) Cement production: This application is covered in more detail below as a specific type of construction material. Permissive tract: Peters and others, 2011, chapters 17A, 19A, 22A, 23A, 26A; Peters and others, 2007, p. 677, fig. 11.1-1, p. 681; Ludington and others, 2007, fig. 18: tract lms01, p. 38.
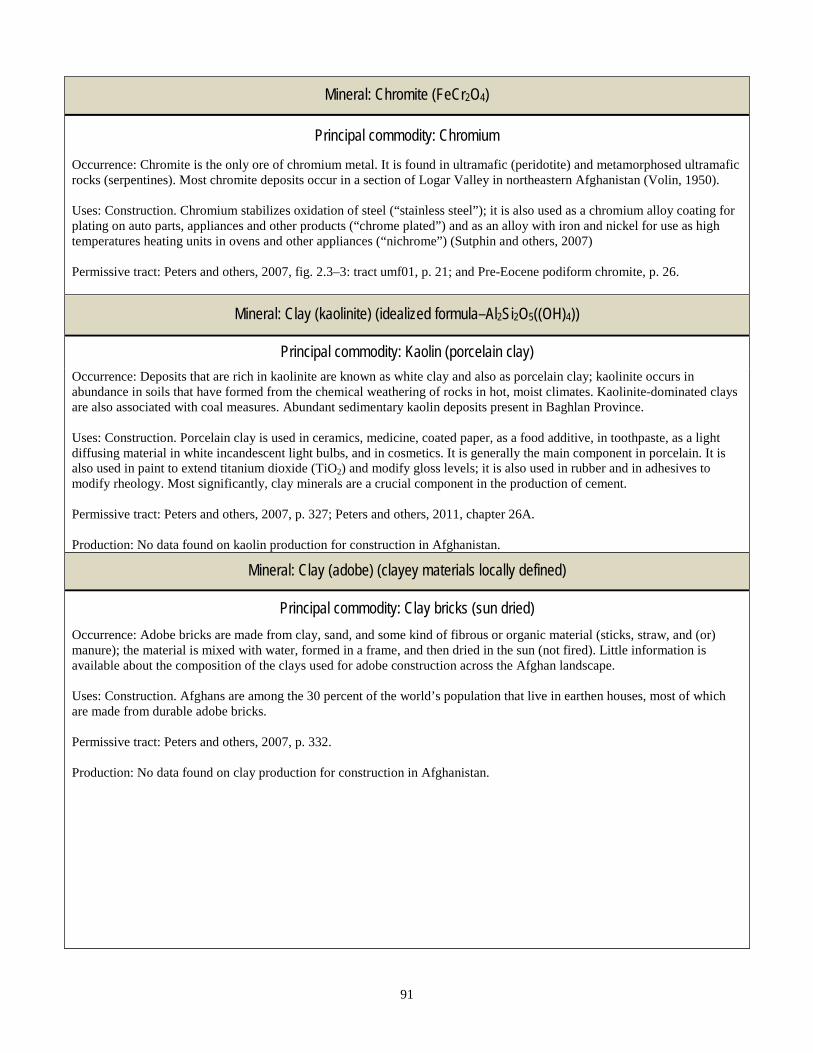
91
Mineral: Chromite (FeCr2O4)
Principal commodity: Chromium
Occurrence: Chromite is the only ore of chromium metal. It is found in ultramafic (peridotite) and metamorphosed ultramafic rocks (serpentines). Most chromite deposits occur in a section of Logar Valley in northeastern Afghanistan (Volin, 1950). Uses: Construction. Chromium stabilizes oxidation of steel (“stainless steel”); it is also used as a chromium alloy coating for plating on auto parts, appliances and other products (“chrome plated”) and as an alloy with iron and nickel for use as high temperatures heating units in ovens and other appliances (“nichrome”) (Sutphin and others, 2007) Permissive tract: Peters and others, 2007, fig. 2.3–3: tract umf01, p. 21; and Pre-Eocene podiform chromite, p. 26.
Mineral: Clay (kaolinite) (idealized formula–Al2Si2O5((OH)4))
Principal commodity: Kaolin (porcelain clay) Occurrence: Deposits that are rich in kaolinite are known as white clay and also as porcelain clay; kaolinite occurs in abundance in soils that have formed from the chemical weathering of rocks in hot, moist climates. Kaolinite-dominated clays are also associated with coal measures. Abundant sedimentary kaolin deposits present in Baghlan Province. Uses: Construction. Porcelain clay is used in ceramics, medicine, coated paper, as a food additive, in toothpaste, as a light diffusing material in white incandescent light bulbs, and in cosmetics. It is generally the main component in porcelain. It is also used in paint to extend titanium dioxide (TiO2) and modify gloss levels; it is also used in rubber and in adhesives to modify rheology. Most significantly, clay minerals are a crucial component in the production of cement. Permissive tract: Peters and others, 2007, p. 327; Peters and others, 2011, chapter 26A. Production: No data found on kaolin production for construction in Afghanistan.
Mineral: Clay (adobe) (clayey materials locally defined)
Principal commodity: Clay bricks (sun dried) Occurrence: Adobe bricks are made from clay, sand, and some kind of fibrous or organic material (sticks, straw, and (or) manure); the material is mixed with water, formed in a frame, and then dried in the sun (not fired). Little information is available about the composition of the clays used for adobe construction across the Afghan landscape. Uses: Construction. Afghans are among the 30 percent of the world’s population that live in earthen houses, most of which are made from durable adobe bricks. Permissive tract: Peters and others, 2007, p. 332. Production: No data found on clay production for construction in Afghanistan.
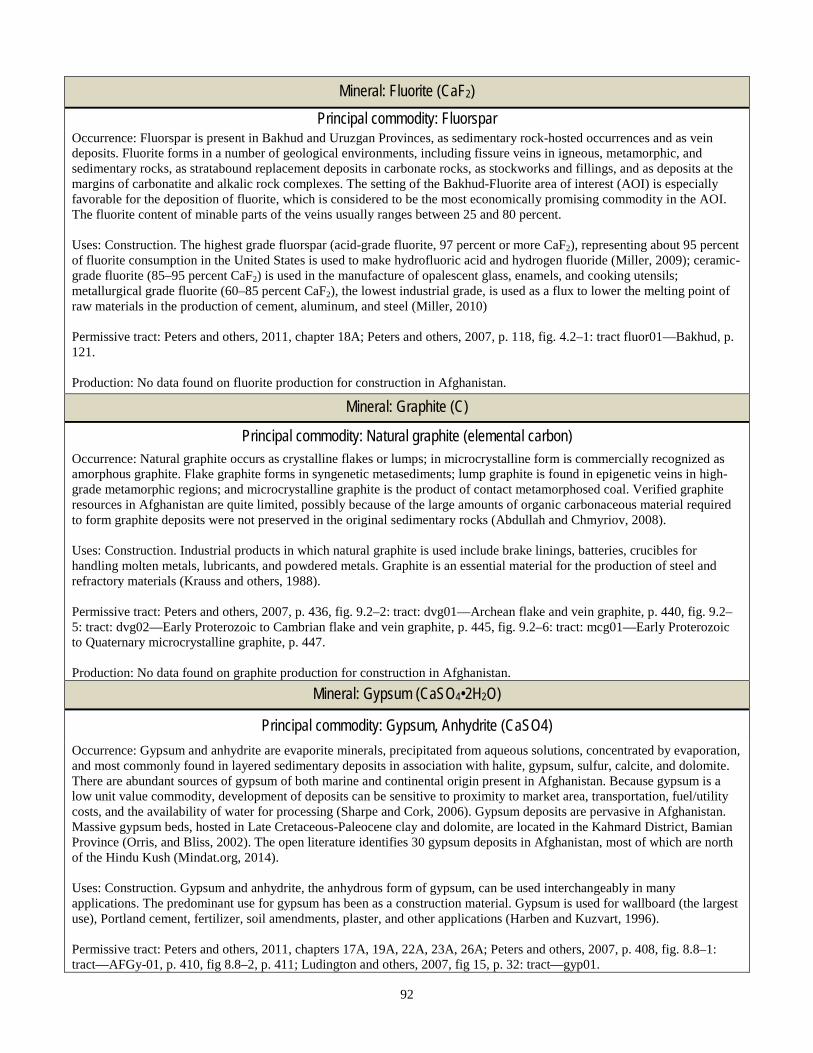
92
Mineral: Fluorite (CaF2) Principal commodity: Fluorspar
Occurrence: Fluorspar is present in Bakhud and Uruzgan Provinces, as sedimentary rock-hosted occurrences and as vein deposits. Fluorite forms in a number of geological environments, including fissure veins in igneous, metamorphic, and sedimentary rocks, as stratabound replacement deposits in carbonate rocks, as stockworks and fillings, and as deposits at the margins of carbonatite and alkalic rock complexes. The setting of the Bakhud-Fluorite area of interest (AOI) is especially favorable for the deposition of fluorite, which is considered to be the most economically promising commodity in the AOI. The fluorite content of minable parts of the veins usually ranges between 25 and 80 percent. Uses: Construction. The highest grade fluorspar (acid-grade fluorite, 97 percent or more CaF2), representing about 95 percent of fluorite consumption in the United States is used to make hydrofluoric acid and hydrogen fluoride (Miller, 2009); ceramic-grade fluorite (85–95 percent CaF2) is used in the manufacture of opalescent glass, enamels, and cooking utensils; metallurgical grade fluorite (60–85 percent CaF2), the lowest industrial grade, is used as a flux to lower the melting point of raw materials in the production of cement, aluminum, and steel (Miller, 2010) Permissive tract: Peters and others, 2011, chapter 18A; Peters and others, 2007, p. 118, fig. 4.2–1: tract fluor01—Bakhud, p. 121. Production: No data found on fluorite production for construction in Afghanistan.
Mineral: Graphite (C)
Principal commodity: Natural graphite (elemental carbon) Occurrence: Natural graphite occurs as crystalline flakes or lumps; in microcrystalline form is commercially recognized as amorphous graphite. Flake graphite forms in syngenetic metasediments; lump graphite is found in epigenetic veins in high-grade metamorphic regions; and microcrystalline graphite is the product of contact metamorphosed coal. Verified graphite resources in Afghanistan are quite limited, possibly because of the large amounts of organic carbonaceous material required to form graphite deposits were not preserved in the original sedimentary rocks (Abdullah and Chmyriov, 2008). Uses: Construction. Industrial products in which natural graphite is used include brake linings, batteries, crucibles for handling molten metals, lubricants, and powdered metals. Graphite is an essential material for the production of steel and refractory materials (Krauss and others, 1988). Permissive tract: Peters and others, 2007, p. 436, fig. 9.2–2: tract: dvg01—Archean flake and vein graphite, p. 440, fig. 9.2–5: tract: dvg02—Early Proterozoic to Cambrian flake and vein graphite, p. 445, fig. 9.2–6: tract: mcg01—Early Proterozoic to Quaternary microcrystalline graphite, p. 447. Production: No data found on graphite production for construction in Afghanistan.
Mineral: Gypsum (CaSO4•2H2O)
Principal commodity: Gypsum, Anhydrite (CaSO4) Occurrence: Gypsum and anhydrite are evaporite minerals, precipitated from aqueous solutions, concentrated by evaporation, and most commonly found in layered sedimentary deposits in association with halite, gypsum, sulfur, calcite, and dolomite. There are abundant sources of gypsum of both marine and continental origin present in Afghanistan. Because gypsum is a low unit value commodity, development of deposits can be sensitive to proximity to market area, transportation, fuel/utility costs, and the availability of water for processing (Sharpe and Cork, 2006). Gypsum deposits are pervasive in Afghanistan. Massive gypsum beds, hosted in Late Cretaceous-Paleocene clay and dolomite, are located in the Kahmard District, Bamian Province (Orris, and Bliss, 2002). The open literature identifies 30 gypsum deposits in Afghanistan, most of which are north of the Hindu Kush (Mindat.org, 2014). Uses: Construction. Gypsum and anhydrite, the anhydrous form of gypsum, can be used interchangeably in many applications. The predominant use for gypsum has been as a construction material. Gypsum is used for wallboard (the largest use), Portland cement, fertilizer, soil amendments, plaster, and other applications (Harben and Kuzvart, 1996). Permissive tract: Peters and others, 2011, chapters 17A, 19A, 22A, 23A, 26A; Peters and others, 2007, p. 408, fig. 8.8–1: tract—AFGy-01, p. 410, fig 8.8–2, p. 411; Ludington and others, 2007, fig 15, p. 32: tract—gyp01.
93
Mineral: Halite (NaCl) Principal commodity: Salt
Occurrence: The three types of salt deposits known in Afghanistan are bedded salt deposits, related salt dome deposits, and young playa deposits (Lefond, 1969; Smith, 1975; Abdullah and others, 1977; Luchnikov, 1982). Bedded Salt—Thick accumulations of chloride evaporite deposits occur in basins where evaporation exceeds the inflow of water. Common features include restricted inflow relative to evaporation, basin subsidence during evaporite deposition, a relatively arid climate, and restricted supply of clastic materials (Raup, 1991; Harben and Kuzvart, 1996, p. 91–97; Feldman, 2006). Salt Domes—These deposits most commonly originate from thick-bedded salt deposits. Playa Salt and Brines—Playas are basically dry or nearly dry lakebeds or the floor of a desert basin. In these deposits, salts may form surface crusts that may be up to several meters thick. Evaporite deposits in the Afghanistan province of Takhar are part of the Afghan-Tajik Basin fill, which, in part, is composed of the eastern parts of the Central Asia Jurassic Salt Basin. Uses: Construction. Crystalline sodium chloride, generally known as table salt or rock salt, is required for the production of many thousands of products; the list of industrial uses for salt is essentially endless (Caldwell and others, 2000). The largest use of salt is in its application as feedstock for the chlor-alkali chemical industry. Salt is found in the manufacturing of textiles, glass, rubber, leather, textiles, dyeing, rubber, polyvinyl chloride (PVC) pipes, pigments, pharmaceuticals, leather, ceramics, soap, detergents, lenses, prisms, high-power laser systems, digital cameras, flat panel televisions, electron microscopes, and solar panels; molten salt reactors are used to produce and separate transuranic elements; molten salt is also used to incinerate high explosives, propellants, and pyrotechnics; salt-bath furnaces are used for heat treatments in steel production. Permissive tract: Peters and others, 2011, chapter 26A; Ludington and others, 2007, p. 34, fig. 17: tract ID—kbbhal01).
Mineral: Magnesite (MgCO3) and Talc (Mg3Si4O10(OH)2) Principal commodity: Magnesite, talc, soapstone
Occurrence: Mixed talc-magnesite deposits occur in serpentinized zones within ultramafic rocks (Simandl and Ogden, 1999, p.65-68). Deposits are commonly associated with large faults or shear zones. Serpentinites that contain these deposits have undergone additional carbonation and alteration by hydrothermal fluids containing a significant amount of CO2 (Pohl, 1990; McCarthy and others, 2006). At this time, there are no known magnesite deposits in Afghanistan. Uses: Construction. Magnesite—Used as a slag former in steelmaking furnaces, a catalyst and filler in the production of synthetic rubber, and in the preparation of magnesium chemicals and fertilizers. Talc—Soapstone, is used for stoves, sinks, crayons, soap, lubricants, electrical cables, electrical switchboards, and laboratory counter tops. Talc is used in the production of products for the home, medical treatment, and industry; such products include food additives, paper, coatings, paint filler, plastic, rubber, cosmetics, and in pharmaceuticals. Permissive tract: Peters and others, 2011, chapter 20A; Peters and others, 2007, p. 408, p. 460 fig. 9.3–2. Production: No data found on magnesite and talc production for construction in Afghanistan.
Mineral: Sand and Gravel Principal commodity: Concrete
Occurrence: Gravel deposits are sedimentary materials associated with glacial actions, marine and freshwater processes, and catastrophic flood discharges (Bliss and Bolm, 2001). Sand is detrital material composed of finely divided rock particles, the composition depending on the local rock sources. The most common constituent of sand in inland continental settings is quartz. The second most common form of sand is calcium carbonate, created by breakdown of various forms sea life such as coral and shellfish. While many deposits in Afghanistan may not be accessible due to isolation or lack of infrastructure, sand, gravel, and aggregate material adequate for local industry are generally present within or adjacent to most existing population centers. Uses: Construction. Sand and gravel, collectively called aggregate, are crucial resources for infrastructure development in projects requiring concrete, such as road construction, dam construction, and home and commercial building construction. Permissive tract: Peters and others, 2007, p. 408; fig. 8.8–1: tract—AFGy-01; p. 410; fig 8.8–2, p. 411). Peters and others, 2007, p. 484; Ludington and others, 2007, p. 41; fig. 20. Production: No data found on sand and gravel production for construction in Afghanistan.
94
Mineral: Pegmatites Principal commodities: Lithium, beryllium, quartz, feldspars,
micas, gemstones, tantalum, niobium, and cesium Occurrence: Pegmatite is a light-colored, extremely coarse-grained intrusive igneous rock with interlocking crystals of diverse mineralogy, variable texture, and locally complex geochemistry. Pegmatites form near the margins of a magma chamber during the final phases of magma chamber crystallization. They usually are of granitic composition and may be enriched in rare minerals that are not found in other parts of the magma chamber. Pegmatites are probably best known for their gem and mineral specimens and for rare or rare-earth elements, including sources of beryllium, cesium, gallium, lithium, niobium, rubidium, tantalum, and tin (Peters and others, 2007, p. 711). There are 23 pegmatite fields located within Laghman, Wardak, Nangarhar, Kapisa, Badakhshan, and Parwan Provinces as delineated by permissive tract afpegs (Peters and others, 2011, p. 126, table 4.3–1). Uses Construction. In Afghanistan, pegmatites could be used for local glass, chemical, or artisanal industries. Permissive tract: Peters and others, 2011, chapter 24A; tract—afpegs; Peters and others, 2007, p. 123, fig. 4.3–1, (affiliated with Oligocene plutons), p. 125. Production: No data found on pegmatite production for construction in Afghanistan.
Mineral: Rare-Earth Elements (REE) and Uranium (U) Principal commodities: Cerium, dysprosium, erbium, europium, gadolinium, holmium,
lanthanum, lutetium, neodymium, praseodymium, samarium, terbium, thulium, ytterbium, yttrium, ferrocerium, monazite, bastnasite, mischmetal
Occurrence: Present in a poorly explored carbonatite volcano at Khanneshin in southern Afghanistan. Other volcanic centers like that at Khanneshin may exist. Uses: Construction. Demand varies for each rare-earth element, including rechargeable batteries (portable devices, electric and hybrid-electric vehicles—lanthanum; catalysts, phosphors and polishing compounds—cerium; electronics, and solar panels—praseodymium, neodymium, dysprosium, promethium, terbium, and tellurium; video screens—europium, gadolinium, terbium, and dysprosium; fluorescent bulbs—scandium, praseodymium, and terbium; iron-boron magnets used in wind turbines—neodymium; high-grade optical glass and for lasers—cerium, holmium, thulium; metal alloys—erbium, ytterbium, lutetium, tellurium, and yttrium; nuclear fission power plants—uranium. Permissive tract: Peters and others, 2011, Chapter 21A; Peters and others, 2007, p. 95; fig 3.0–2: Khanneshin carbonatite area, tract- cb01, p. 100. Production: No data found on REE production for construction in Afghanistan.
95
Table 6. Examples of physical reconstruction projects in Afghanistan.
Project World Bank number
Cost, in million
U.S. dollars
Period Web address
Water irrigation P122235 149 2011–2017
http://www.worldbank.org/projects/P122235/irrigation-restoration-development-project?lang=en
P112873 33.5 2009 http://www.worldbank.org/projects/P112873/additional-financing-emergency-irrigation-rehabilitation-project?lang=en
P105492 25 2007 http://www.worldbank.org/projects/P105492/emergency-irrigation-rehabilitation-supplemental?lang=en
P078936 40 2003–2011
http://www.worldbank.org/projects/P078936/af-emergency-irrigation-rehabilitation-project?lang=en
Objectives: To increase agriculture productivity and production in the project areas.
Electrical power P111943 35 2008–2013
http://www.worldbank.org/projects/P111943/afghanistan-power-system-development-project?lang=en
P106654 57 2007–2013
http://www.worldbank.org/projects/P106654/artf-kabul-aybakmazar-e-sharif-power-project?lang=en
P091060 7.5 2003–2009
http://www.worldbank.org/projects/P091060/improvement-power-supply-kabul?lang=en
P083908 220 2004–2013
http://www.worldbank.org/projects/P083908/emergency-power-rehabilitation-project?lang=en
Objectives: To (1) support capacity building for ministry and utility staff, (2) support commercialization of the operations of the power utility in Kabul, (3) support increasing access to grid power and the quantity of available power to the consumers in the target areas of Pul-e-Khumri, Charikar, Gulbahar, Jabul-Seraj, Doshi, Khenjan, Kabul, Aybak, and Mazar-e-Sharif, (4) rehabilitate one 10 kilovolt transmission line, Naghlu-Kabul East-Kabul North, and (5) provide technical assistance for the Ministry of Water and Power (MWP) and Da Afghanistan Breshna Sherkat (DABS), the Afghan national electric utility company).
Buildings P111825 5.5 2008–2012
http://www.worldbank.org/projects/P111825/artf-kabul-urban-reconstruction-project?lang=en
P083919 25 2004–2011
http://www.worldbank.org/projects/P083919/kabul-urban-reconstruction-project?lang=en
Objectives: Improve urban management and the delivery of urban services in Kabul by integration of selected neighborhoods into the urban fabric of the capital city; the plan includes reconstruction and rehabilitation of urban infrastructure and enhancing the managerial capacity of the Ministry of Urban Development and Housing (MUDH) and the Kabul Municipality (KM).
Highways P009318 17.6 1979 (“Third Highway Project”)
http://www.worldbank.org/projects/P009318/highway-project-03?lang=en
Objective: Strengthen the capacity of the Road Construction and Maintenance Department (RCMD) to execute its responsibilities for maintaining and upgrading the highway network in Afghanistan, including primary, secondary and tertiary roads.
Rural access P125961 325 2012–2018
http://www.worldbank.org/projects/P125961/afghanistan-rural-access-project?lang=en
96
Project World Bank number
Cost, in million
U.S. dollars
Period Web address
P103343 112 2007–2013
http://www.worldbank.org/projects/P103343/national-emergency-rural-access-project?lang=en
P090390 45 2005 http://www.worldbank.org/projects/P090390/emergency-transport-rehabilitation-project-supplemental-grant?lang=en
Objectives: To enable rural communities to benefit from all-season road access to basic services and facilities. Virtually all rural roads are finished with either a gravel or asphalt surface. Required construction materials—bitumen and aggregate.
Kabul roads P107101 18 2008–2011
http://www.worldbank.org/projects/P107101/kabul-urban-roads-improvement-project?lang=en
Objective: Improvement of traffic flow on priority corridors or segments of the main urban roads in Kabul.
Water sanitation
P091038 5 2005–2009
http://www.worldbank.org/projects/P091038/artf-rural-water-supply-sanitation-project?lang=en
P092162
41 2005–2010
http://www.worldbank.org/projects/P092162/artf-afganistan-short-term-urban-water-supply-sanitation-project?lang=en
P087860 40 2006–2014
http://www.worldbank.org/projects/P087860/afghanistan-urban-water-sector-project?lang=en
Objectives: Initiate actions to (1) transform the Central Authority for Water Supply and Sewerage (CAWSS) into a technically viable operation; (2) establish the financial sustainability of the Afghan Urban Water Supply and Sanitation Company (AUWSSC, successor to CAWSS); (3) increase access to and reliability of the water supply service in Kabul; and (4) prepare a follow-up project under which more substantial institutional and financial objectives could be achieved and water-supply and sanitation coverage could be further expanded in Kabul and provincial towns.
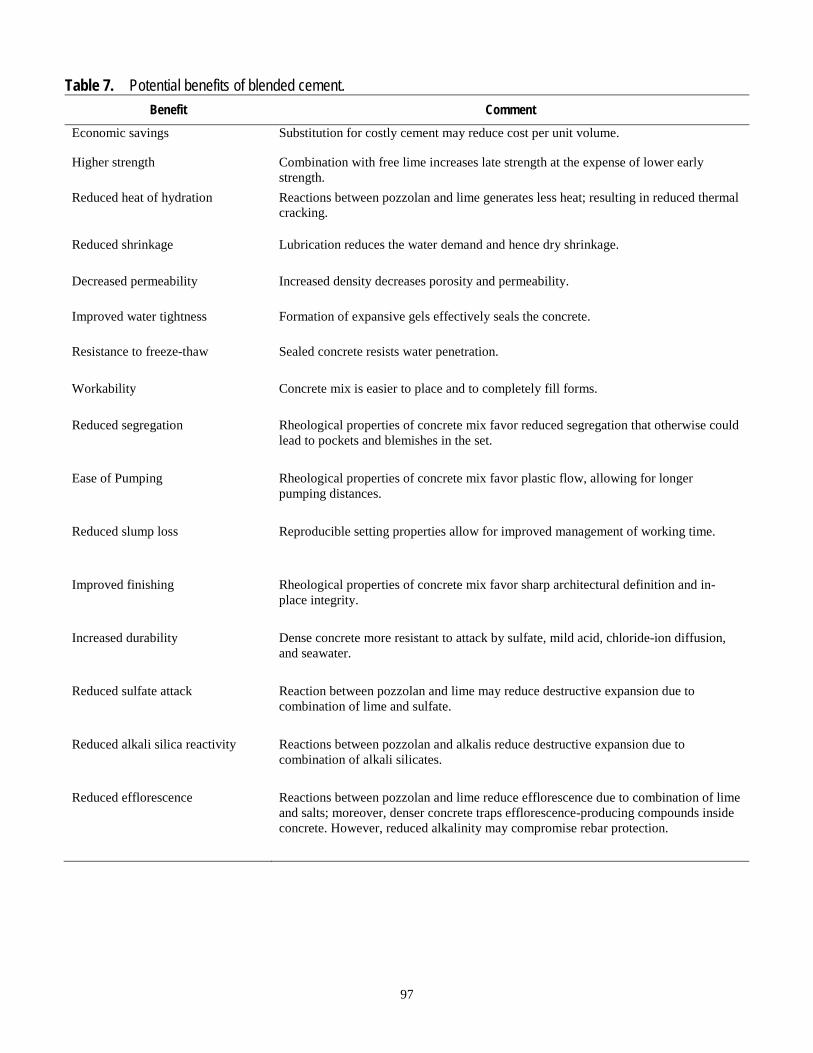
97
Table 7. Potential benefits of blended cement. Benefit Comment
Economic savings Substitution for costly cement may reduce cost per unit volume.
Higher strength Combination with free lime increases late strength at the expense of lower early strength.
Reduced heat of hydration Reactions between pozzolan and lime generates less heat; resulting in reduced thermal cracking.
Reduced shrinkage Lubrication reduces the water demand and hence dry shrinkage.
Decreased permeability Increased density decreases porosity and permeability.
Improved water tightness Formation of expansive gels effectively seals the concrete.
Resistance to freeze-thaw Sealed concrete resists water penetration.
Workability Concrete mix is easier to place and to completely fill forms.
Reduced segregation Rheological properties of concrete mix favor reduced segregation that otherwise could lead to pockets and blemishes in the set.
Ease of Pumping Rheological properties of concrete mix favor plastic flow, allowing for longer pumping distances.
Reduced slump loss Reproducible setting properties allow for improved management of working time.
Improved finishing Rheological properties of concrete mix favor sharp architectural definition and in-place integrity.
Increased durability Dense concrete more resistant to attack by sulfate, mild acid, chloride-ion diffusion, and seawater.
Reduced sulfate attack Reaction between pozzolan and lime may reduce destructive expansion due to combination of lime and sulfate.
Reduced alkali silica reactivity Reactions between pozzolan and alkalis reduce destructive expansion due to combination of alkali silicates.
Reduced efflorescence Reactions between pozzolan and lime reduce efflorescence due to combination of lime and salts; moreover, denser concrete traps efflorescence-producing compounds inside concrete. However, reduced alkalinity may compromise rebar protection.
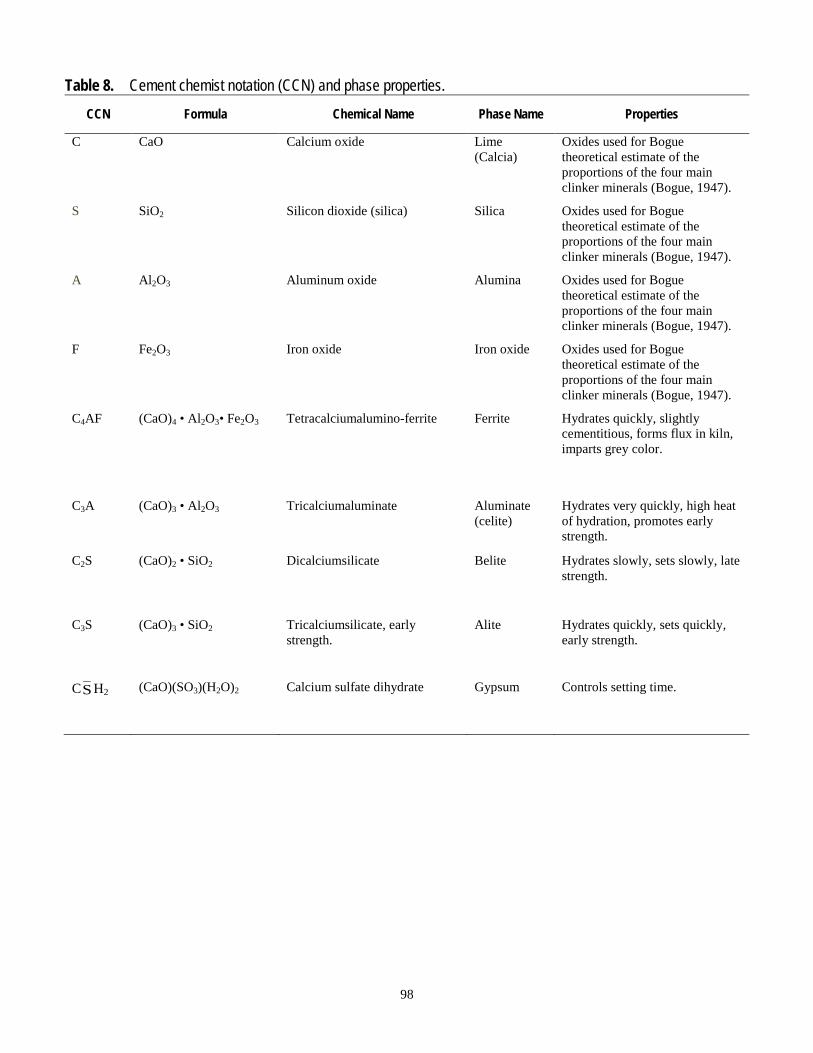
98
Table 8. Cement chemist notation (CCN) and phase properties. CCN Formula Chemical Name Phase Name Properties
C CaO Calcium oxide Lime (Calcia)
Oxides used for Bogue theoretical estimate of the proportions of the four main clinker minerals (Bogue, 1947).
S SiO2 Silicon dioxide (silica) Silica Oxides used for Bogue theoretical estimate of the proportions of the four main clinker minerals (Bogue, 1947).
A Al2O3 Aluminum oxide Alumina Oxides used for Bogue theoretical estimate of the proportions of the four main clinker minerals (Bogue, 1947).
F Fe2O3 Iron oxide Iron oxide Oxides used for Bogue theoretical estimate of the proportions of the four main clinker minerals (Bogue, 1947).
C4AF (CaO)4 • Al2O3• Fe2O3 Tetracalciumalumino-ferrite Ferrite Hydrates quickly, slightly cementitious, forms flux in kiln, imparts grey color.
C3A (CaO)3 • Al2O3 Tricalciumaluminate Aluminate (celite)
Hydrates very quickly, high heat of hydration, promotes early strength.
C2S (CaO)2 • SiO2 Dicalciumsilicate Belite Hydrates slowly, sets slowly, late strength.
C3S (CaO)3 • SiO2 Tricalciumsilicate, early strength.
Alite Hydrates quickly, sets quickly, early strength.
CSH2 (CaO)(SO3)(H2O)2 Calcium sulfate dihydrate Gypsum Controls setting time.
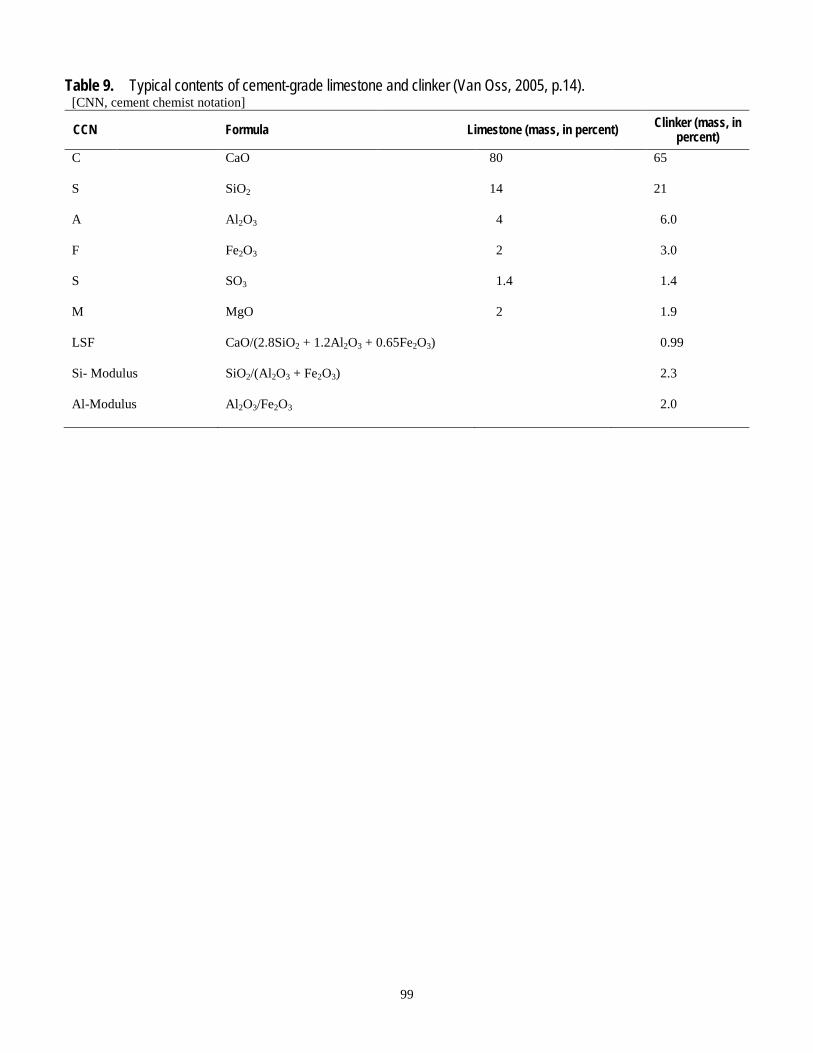
99
Table 9. Typical contents of cement-grade limestone and clinker (Van Oss, 2005, p.14). [CNN, cement chemist notation]
CCN Formula Limestone (mass, in percent) Clinker (mass, in percent)
C CaO 80 65
S SiO2 14 21
A Al2O3 4 6.0
F Fe2O3 2 3.0
S SO3 1.4 1.4
M MgO 2 1.9
LSF CaO/(2.8SiO2 + 1.2Al2O3 + 0.65Fe2O3) 0.99
Si- Modulus SiO2/(Al2O3 + Fe2O3) 2.3
Al-Modulus Al2O3/Fe2O3 2.0
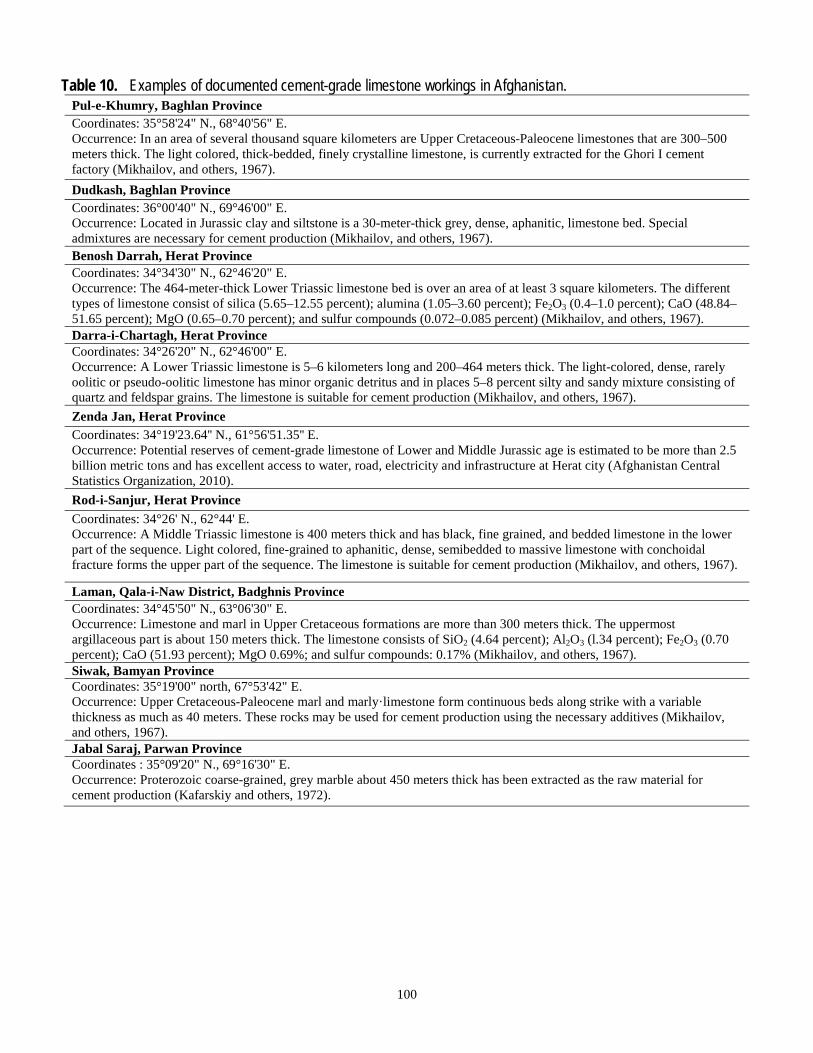
100
Table 10. Examples of documented cement-grade limestone workings in Afghanistan. Pul-e-Khumry, Baghlan Province Coordinates: 35°58'24" N., 68°40'56" E. Occurrence: In an area of several thousand square kilometers are Upper Cretaceous-Paleocene limestones that are 300–500 meters thick. The light colored, thick-bedded, finely crystalline limestone, is currently extracted for the Ghori I cement factory (Mikhailov, and others, 1967). Dudkash, Baghlan Province Coordinates: 36°00'40" N., 69°46'00" E. Occurrence: Located in Jurassic clay and siltstone is a 30-meter-thick grey, dense, aphanitic, limestone bed. Special admixtures are necessary for cement production (Mikhailov, and others, 1967). Benosh Darrah, Herat Province Coordinates: 34°34'30" N., 62°46'20" E. Occurrence: The 464-meter-thick Lower Triassic limestone bed is over an area of at least 3 square kilometers. The different types of limestone consist of silica (5.65–12.55 percent); alumina (1.05–3.60 percent); Fe2O3 (0.4–1.0 percent); CaO (48.84–51.65 percent); MgO (0.65–0.70 percent); and sulfur compounds (0.072–0.085 percent) (Mikhailov, and others, 1967). Darra-i-Chartagh, Herat Province Coordinates: 34°26'20" N., 62°46'00" E. Occurrence: A Lower Triassic limestone is 5–6 kilometers long and 200–464 meters thick. The light-colored, dense, rarely oolitic or pseudo-oolitic limestone has minor organic detritus and in places 5–8 percent silty and sandy mixture consisting of quartz and feldspar grains. The limestone is suitable for cement production (Mikhailov, and others, 1967). Zenda Jan, Herat Province Coordinates: 34°19'23.64'' N., 61°56'51.35'' E. Occurrence: Potential reserves of cement-grade limestone of Lower and Middle Jurassic age is estimated to be more than 2.5 billion metric tons and has excellent access to water, road, electricity and infrastructure at Herat city (Afghanistan Central Statistics Organization, 2010). Rod-i-Sanjur, Herat Province Coordinates: 34°26' N., 62°44' E. Occurrence: A Middle Triassic limestone is 400 meters thick and has black, fine grained, and bedded limestone in the lower part of the sequence. Light colored, fine-grained to aphanitic, dense, semibedded to massive limestone with conchoidal fracture forms the upper part of the sequence. The limestone is suitable for cement production (Mikhailov, and others, 1967).
Laman, Qala-i-Naw District, Badghnis Province Coordinates: 34°45'50" N., 63°06'30" E. Occurrence: Limestone and marl in Upper Cretaceous formations are more than 300 meters thick. The uppermost argillaceous part is about 150 meters thick. The limestone consists of SiO2 (4.64 percent); Al2O3 (l.34 percent); Fe2O3 (0.70 percent); CaO (51.93 percent); MgO 0.69%; and sulfur compounds: 0.17% (Mikhailov, and others, 1967). Siwak, Bamyan Province Coordinates: 35°19'00" north, 67°53'42" E. Occurrence: Upper Cretaceous-Paleocene marl and marly·limestone form continuous beds along strike with a variable thickness as much as 40 meters. These rocks may be used for cement production using the necessary additives (Mikhailov, and others, 1967). Jabal Saraj, Parwan Province Coordinates : 35°09'20" N., 69°16'30" E. Occurrence: Proterozoic coarse-grained, grey marble about 450 meters thick has been extracted as the raw material for cement production (Kafarskiy and others, 1972).
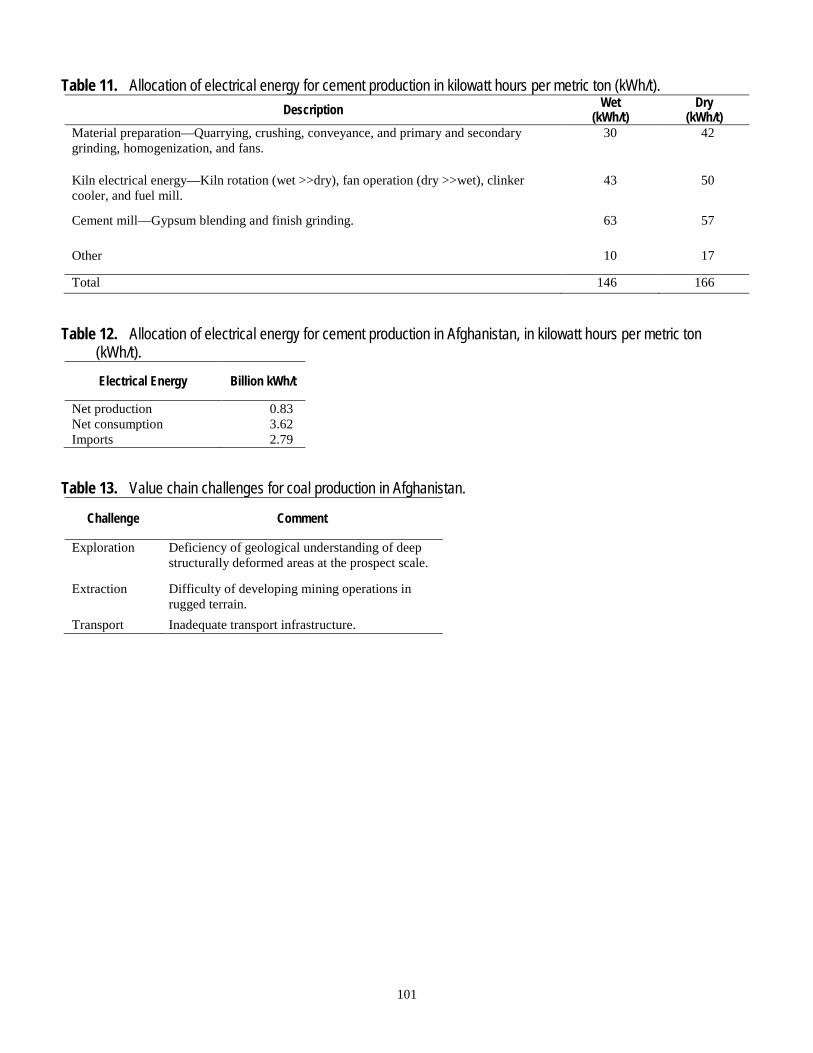
101
Table 11. Allocation of electrical energy for cement production in kilowatt hours per metric ton (kWh/t). Description Wet
(kWh/t) Dry
(kWh/t) Material preparation—Quarrying, crushing, conveyance, and primary and secondary grinding, homogenization, and fans.
30 42
Kiln electrical energy—Kiln rotation (wet >>dry), fan operation (dry >>wet), clinker cooler, and fuel mill.
43 50
Cement mill—Gypsum blending and finish grinding. 63 57
Other 10 17
Total 146 166
Table 12. Allocation of electrical energy for cement production in Afghanistan, in kilowatt hours per metric ton (kWh/t).
Electrical Energy Billion kWh/t
Net production 0.83 Net consumption 3.62 Imports 2.79
Table 13. Value chain challenges for coal production in Afghanistan.
Challenge Comment
Exploration Deficiency of geological understanding of deep structurally deformed areas at the prospect scale.
Extraction Difficulty of developing mining operations in rugged terrain.
Transport Inadequate transport infrastructure.
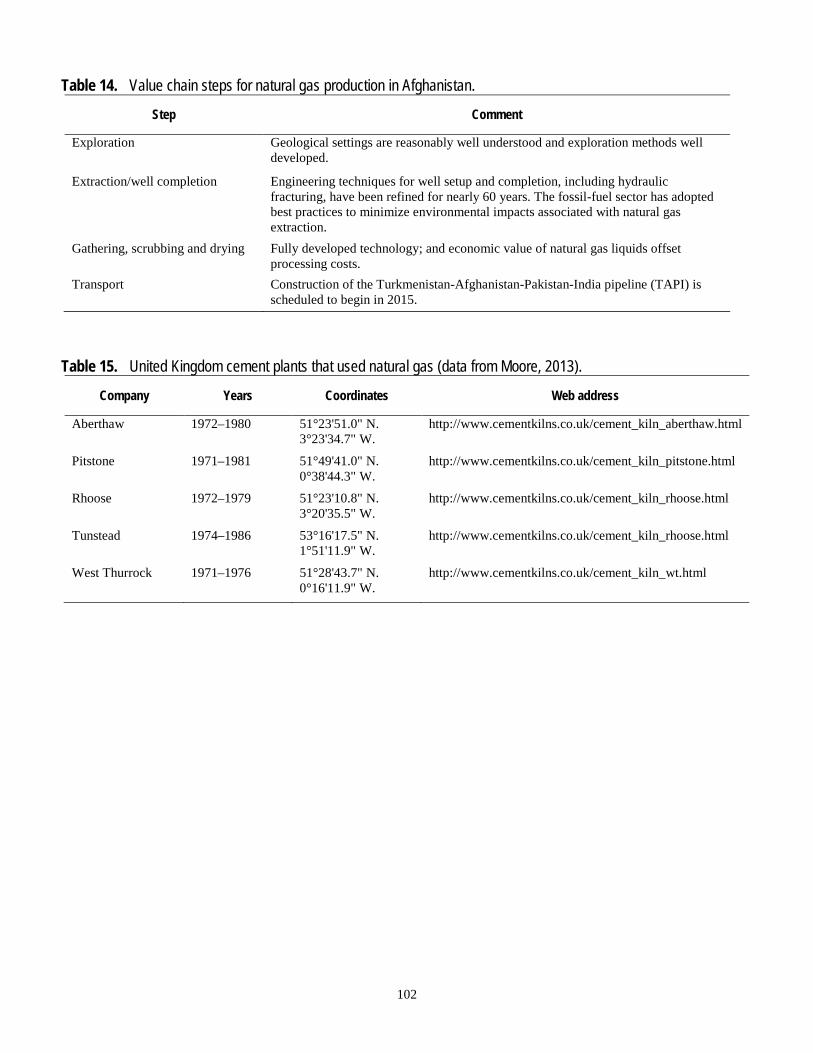
102
Table 14. Value chain steps for natural gas production in Afghanistan.
Step Comment
Exploration Geological settings are reasonably well understood and exploration methods well developed.
Extraction/well completion Engineering techniques for well setup and completion, including hydraulic fracturing, have been refined for nearly 60 years. The fossil-fuel sector has adopted best practices to minimize environmental impacts associated with natural gas extraction.
Gathering, scrubbing and drying Fully developed technology; and economic value of natural gas liquids offset processing costs.
Transport Construction of the Turkmenistan-Afghanistan-Pakistan-India pipeline (TAPI) is scheduled to begin in 2015.
Table 15. United Kingdom cement plants that used natural gas (data from Moore, 2013).
Company Years Coordinates Web address
Aberthaw 1972–1980 51°23'51.0" N. 3°23'34.7" W.
http://www.cementkilns.co.uk/cement_kiln_aberthaw.html
Pitstone 1971–1981 51°49'41.0" N. 0°38'44.3" W.
http://www.cementkilns.co.uk/cement_kiln_pitstone.html
Rhoose 1972–1979 51°23'10.8" N. 3°20'35.5" W.
http://www.cementkilns.co.uk/cement_kiln_rhoose.html
Tunstead 1974–1986 53°16'17.5" N. 1°51'11.9" W.
http://www.cementkilns.co.uk/cement_kiln_rhoose.html
West Thurrock 1971–1976 51°28'43.7" N. 0°16'11.9" W.
http://www.cementkilns.co.uk/cement_kiln_wt.html
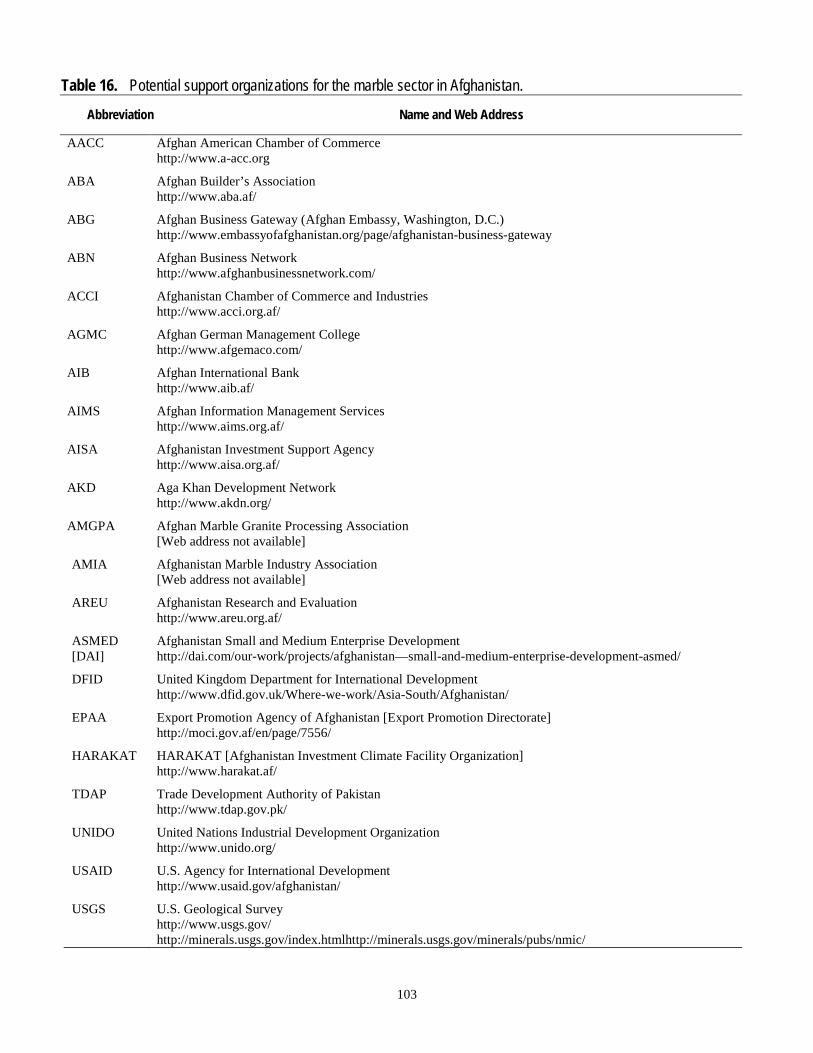
103
Table 16. Potential support organizations for the marble sector in Afghanistan.
Abbreviation Name and Web Address
AACC Afghan American Chamber of Commerce http://www.a-acc.org
ABA Afghan Builder’s Association http://www.aba.af/
ABG Afghan Business Gateway (Afghan Embassy, Washington, D.C.) http://www.embassyofafghanistan.org/page/afghanistan-business-gateway
ABN Afghan Business Network http://www.afghanbusinessnetwork.com/
ACCI Afghanistan Chamber of Commerce and Industries http://www.acci.org.af/
AGMC Afghan German Management College http://www.afgemaco.com/
AIB Afghan International Bank http://www.aib.af/
AIMS Afghan Information Management Services http://www.aims.org.af/
AISA Afghanistan Investment Support Agency http://www.aisa.org.af/
AKD Aga Khan Development Network http://www.akdn.org/
AMGPA Afghan Marble Granite Processing Association [Web address not available]
AMIA Afghanistan Marble Industry Association [Web address not available]
AREU Afghanistan Research and Evaluation http://www.areu.org.af/
ASMED [DAI]
Afghanistan Small and Medium Enterprise Development http://dai.com/our-work/projects/afghanistan—small-and-medium-enterprise-development-asmed/
DFID United Kingdom Department for International Development http://www.dfid.gov.uk/Where-we-work/Asia-South/Afghanistan/
EPAA Export Promotion Agency of Afghanistan [Export Promotion Directorate] http://moci.gov.af/en/page/7556/
HARAKAT HARAKAT [Afghanistan Investment Climate Facility Organization] http://www.harakat.af/
TDAP Trade Development Authority of Pakistan http://www.tdap.gov.pk/
UNIDO United Nations Industrial Development Organization http://www.unido.org/
USAID U.S. Agency for International Development http://www.usaid.gov/afghanistan/
USGS U.S. Geological Survey http://www.usgs.gov/ http://minerals.usgs.gov/index.htmlhttp://minerals.usgs.gov/minerals/pubs/nmic/
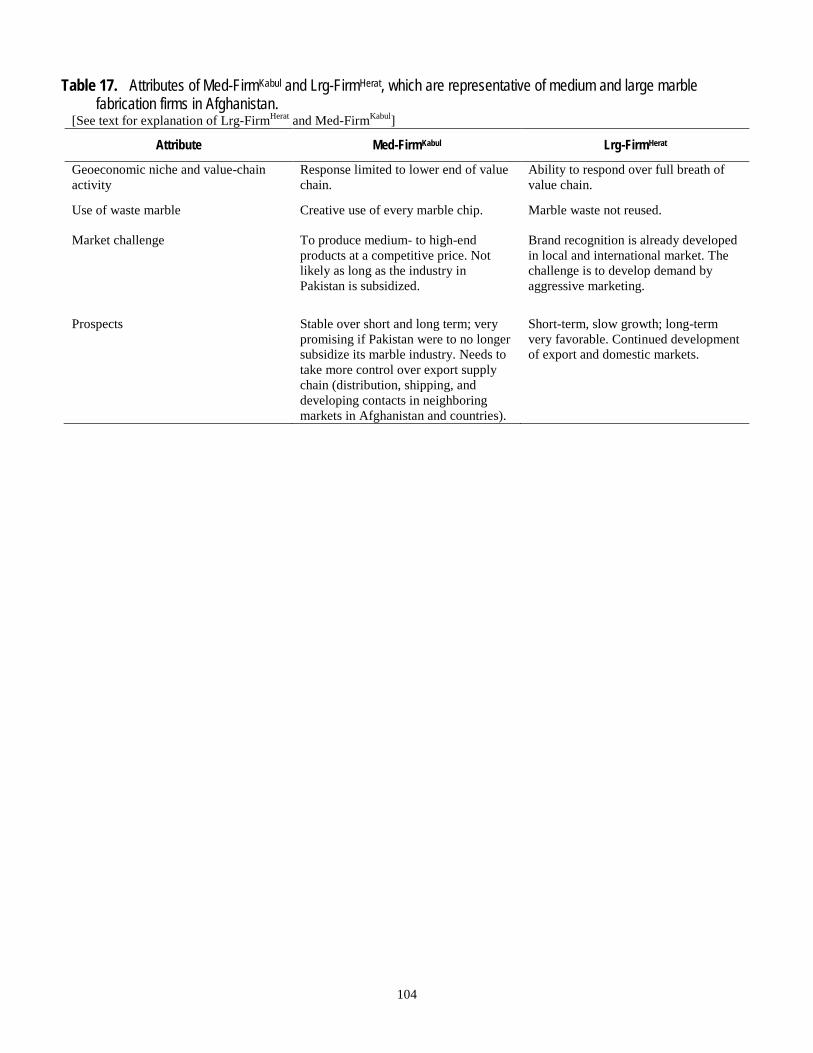
104
Table 17. Attributes of Med-FirmKabul and Lrg-FirmHerat, which are representative of medium and large marble fabrication firms in Afghanistan.
[See text for explanation of Lrg-FirmHerat and Med-FirmKabul]
Attribute Med-FirmKabul Lrg-FirmHerat
Geoeconomic niche and value-chain activity
Response limited to lower end of value chain.
Ability to respond over full breath of value chain.
Use of waste marble Creative use of every marble chip. Marble waste not reused.
Market challenge To produce medium- to high-end products at a competitive price. Not likely as long as the industry in Pakistan is subsidized.
Brand recognition is already developed in local and international market. The challenge is to develop demand by aggressive marketing.
Prospects Stable over short and long term; very promising if Pakistan were to no longer subsidize its marble industry. Needs to take more control over export supply chain (distribution, shipping, and developing contacts in neighboring markets in Afghanistan and countries).
Short-term, slow growth; long-term very favorable. Continued development of export and domestic markets.
105
Table 18. Marble quarries in Afghanistan.
Haji Nabi Company, Bamyam Province
Owner: Mr. Haji Nabi Address: Yakawlang District +93 (0) 777 300 777 Haji Nabi Company was established in 2006.
Equity Capital Mining, Herat Province
Owner: Mr. Nasim Doost Address: Chest-e-Sharif + 93 (0) 774 464 584 [email protected] Equity Capital Mining Company (ECM), established in 2005, operates in Chest-e-Sharif. ECM produces different sizes of marble blocks. ECM currently has 70 high skilled employees working at the quarry. Their main customers are local processing plants. ECM also supplies marble blocks to buyers in Middle East and Central Asian markets.
Mir Group Marble Company, Herat Province
Owner: Mr. Sayed Mirwais Mir Address: Asfarz District + 93 (0) 773 030 525 The Mir Group Mining Company, established in 2006, operates in Chest-e-Sharif. Mir Group currently produces different size of marble blocks from Chest-e-Sharif white marble. Mir Group has about 20 employees working at the quarry; their main customers are local marble processors.
Oqabe-Asia Quarries, Herat Province Owner: Mr. Ahmad Zia Address: Chest-e-Sharif +93 (0) 772 518 318 Oqabe-Asia Quarries was established in 2007 and has 15 employees. The company produces shaped blocks of white marble for local construction and retail markets.
Ensaf Company, Panjeer Province Owner: Mr. Fawat Ahmad Address: Samangan Province +93 (0) 777 319 061
Takht Rustam Mining Company, Panjeer Province
Owner: Mr. Haji Abdul Boqi Address: Aybak +93 (0) 700 503 464
Aeraye Koshan Marble Company, Kabul Province Owner: Haji Aziz Faqire Address: Kabul Industrial Park + 93 (0) 777 202 744 Established in 2007, the Aeraye Koshan Marble Company currently produces different types and sizes of marble blocks and slabs. The company has 20 employees working in the factory, and their main customers are local retail stores and construction companies.
106
Haji Abdurahman's Sons Marble Company, Kabul Province Owner: Mr. Hayatullah Hasrat Address: District 1 0 +93 (0) 700 216 011 [email protected] Established in 1998, the company has 30 employees and produces shaped-block white marble and supplies local retail and construction markets.
lnsafzada Marble Company, Kabul Province
Owner: Mr. Ahmad Fawad Address: Jangalak Factory, Kabul + 93 (0) 0777 319 061 lnsafzada Marble Company was established in 2004 and produces different sizes of marble slabs and tiles. The company currently has 18 employees working at its processing plant, and their main customers are retails stores and construction companies.
Kabul Housing Factory (state-owned entity), Kabul Province
Owner: Eng. Yaqub Address: Kabul Municipality +93 (O) 708 716 1 05, (0) 752 004 7 49 [email protected]
Kabul Marble Processing Company, Kabul Province
Owner: Mr. Besmillah Address: Kabul Industrial Park + 93 (0) 700 213 134 Kabul Marble Processing Company was established in 2006 and produces high-quality marble slabs and tiles. The company has a total of 12 employees working at the factory. Their main customers are local stores and construction companies.
Khalid Omid Company Kabul Province
Owner: Mr. Hewad Ahmad Address: Gazak Khalid Omid Company was established in 2003 and has 12 employees. The company produces shaped block from Gazak Black marble. The company also has a processing plant.
Marmar Bakhter Company, Kabul Province
Owner: Dr. Mohammad Salim Address: Gazak +93 (0) 786 247 082, (0) 799 320 421 [email protected] The company was established in 2003 and has 24 employees. The company produces shaped block from Gazak Black marble. The company also has a processing plant.
107
Nekqadam Marble Company, Kabul Province Owner: Haji Hussain Khan Address: Kabul Industrial Park + 93 (0) 077 345 5732 Established in 2008, the Nekqadam Marble Company produces different sizes of marble slabs and tiles. The company has 12 employees working at its processing plant, and their main customers are retails stores and construction companies.
Table 19. Marble carvers, Kabul Province, Afghanistan. Carver and location Phone number(s) Experience and staff
Mr. Jawed Afshar Scia Sang
+93 (0) 774 710 436, (0) 799 384 772
Experience: 7 years Employees: 3
Mr. Mehdi Afshar Koht-e-Sang
+93 (0) 799 337 795, (0) 799 384 772
Experience: 10 years Employees: 4
Mr. Abbas Ali Allahdad Sharake Arya
+93 (0) 799 095 735 Experience: 19 years Employees: 9
Mr. Mohammad Dawood Allahdad Sharake Arya
+93 (0) 774 417 905, (0) 786 226 040
Experience: 16 years Employees: 7
Mr. Mohammad Beag Sharake Arya
+93 (0) 700 278 246 Experience: 27 years Employees: 4
Mr. Mohammad Ali Ghiacee Sharake Arya
+93 (0) 774 004 738 Experience: 23 years Employees: 3
Haji Abdul Habib Sharake Arya
+93 (0) 700 258 125 Experience: 12 years Employees: 2
Mr. Mirza Hossein Haidary Koht-e-Sangi
+93 (0) 799 301 630, (0) 706 718 114
Experience: 14 years Employees: 6
Mr. Mohammad Mehdi Mourady Sharake Arya
+93 (0) 700 293 939 Experience: 27 years Employees: 6
108
Table 20. Marble processing plants in Afghanistan. Ahadi Brothers Marble Company, Kabul Province
Owner: Haji Rahmatullah Address: Kabul Industrial Park [email protected] + 93 (0) 77 286 587 Established in 1999, Ahadi Brothers Marble Company currently produces different sizes of marble slabs and tiles. The company has 35 employees working at the processing factory, and their main customers are local retails stores and construction companies.
Bakhter Marble Mining Company, Kabul Province Owner: Dr. Mohammad Salim Sawez Address: Kabul Industrial Park [email protected] + 93 (0) 799 320 421 Bakhter Marble Mining Company was established in 1999 and produces quarry blocks, slabs, and small tiles. The company has 21 employees, and their main customers are local retails stores and construction companies.
Estiqlall Marble Processing Company, Kabul Province Owner Mr. Hashmatullah Azizi Address: Kabul Industrial Park [email protected] + 93 (0) 798 172 244, (0) 799 330 094 Estiqlal Marble Processing Company was established in 1999 and currently produces different sizes of marble slabs and tiles. Estiqlal has 27 employees working at the processing factory, and their main customers are retail shops and construction companies.
Haji Abdurahman's Sons Marble Mining Company, Kabul Province Owner: Mr. Hayatullah Hasrat Address: Kabul Industrial Park [email protected] + 93 (0) 700 216 011 Established in 1998, Haji Abdurrahman Sons Marble Mining Company currently produces different size of marble slabs and tiles. Has 30 employees working at the processing plants, and their main customers are retails marble shops and construction companies.
Haqyar Marble Processing Company, Kabul Province
Owner: Mr. Sarajudeen Kamali Address: Kabul Industrial Park [email protected] + 93 (0) 799 30 41 51 Established in 2002, Haqyar Marble Processing Company currently produces different types and sizes of marble slabs and tiles. Haqyar has 30 employees working at the processing plant, and their main customers are retails shops and construction companies.
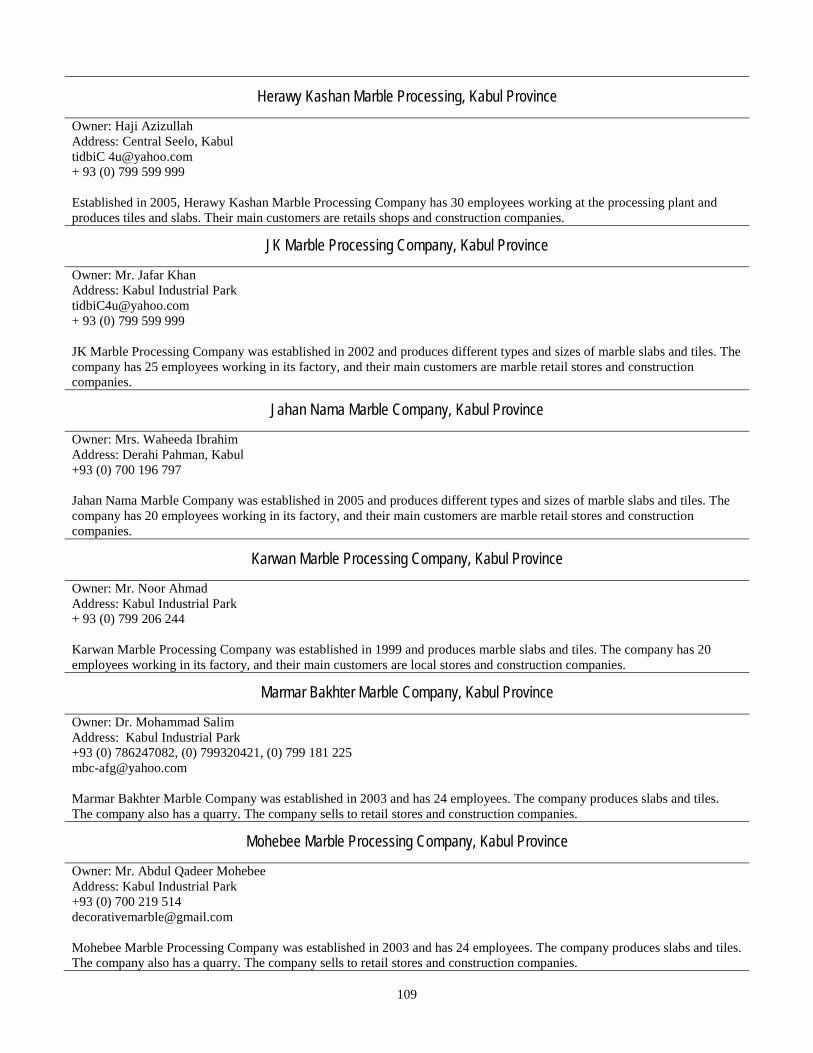
109
Herawy Kashan Marble Processing, Kabul Province
Owner: Haji Azizullah Address: Central Seelo, Kabul tidbiC [email protected] + 93 (0) 799 599 999 Established in 2005, Herawy Kashan Marble Processing Company has 30 employees working at the processing plant and produces tiles and slabs. Their main customers are retails shops and construction companies.
JK Marble Processing Company, Kabul Province
Owner: Mr. Jafar Khan Address: Kabul Industrial Park [email protected] + 93 (0) 799 599 999 JK Marble Processing Company was established in 2002 and produces different types and sizes of marble slabs and tiles. The company has 25 employees working in its factory, and their main customers are marble retail stores and construction companies.
Jahan Nama Marble Company, Kabul Province
Owner: Mrs. Waheeda Ibrahim Address: Derahi Pahman, Kabul +93 (0) 700 196 797 Jahan Nama Marble Company was established in 2005 and produces different types and sizes of marble slabs and tiles. The company has 20 employees working in its factory, and their main customers are marble retail stores and construction companies.
Karwan Marble Processing Company, Kabul Province
Owner: Mr. Noor Ahmad Address: Kabul Industrial Park + 93 (0) 799 206 244 Karwan Marble Processing Company was established in 1999 and produces marble slabs and tiles. The company has 20 employees working in its factory, and their main customers are local stores and construction companies.
Marmar Bakhter Marble Company, Kabul Province
Owner: Dr. Mohammad Salim Address: Kabul Industrial Park +93 (0) 786247082, (0) 799320421, (0) 799 181 225 [email protected] Marmar Bakhter Marble Company was established in 2003 and has 24 employees. The company produces slabs and tiles. The company also has a quarry. The company sells to retail stores and construction companies.
Mohebee Marble Processing Company, Kabul Province
Owner: Mr. Abdul Qadeer Mohebee Address: Kabul Industrial Park +93 (0) 700 219 514 [email protected] Mohebee Marble Processing Company was established in 2003 and has 24 employees. The company produces slabs and tiles. The company also has a quarry. The company sells to retail stores and construction companies.
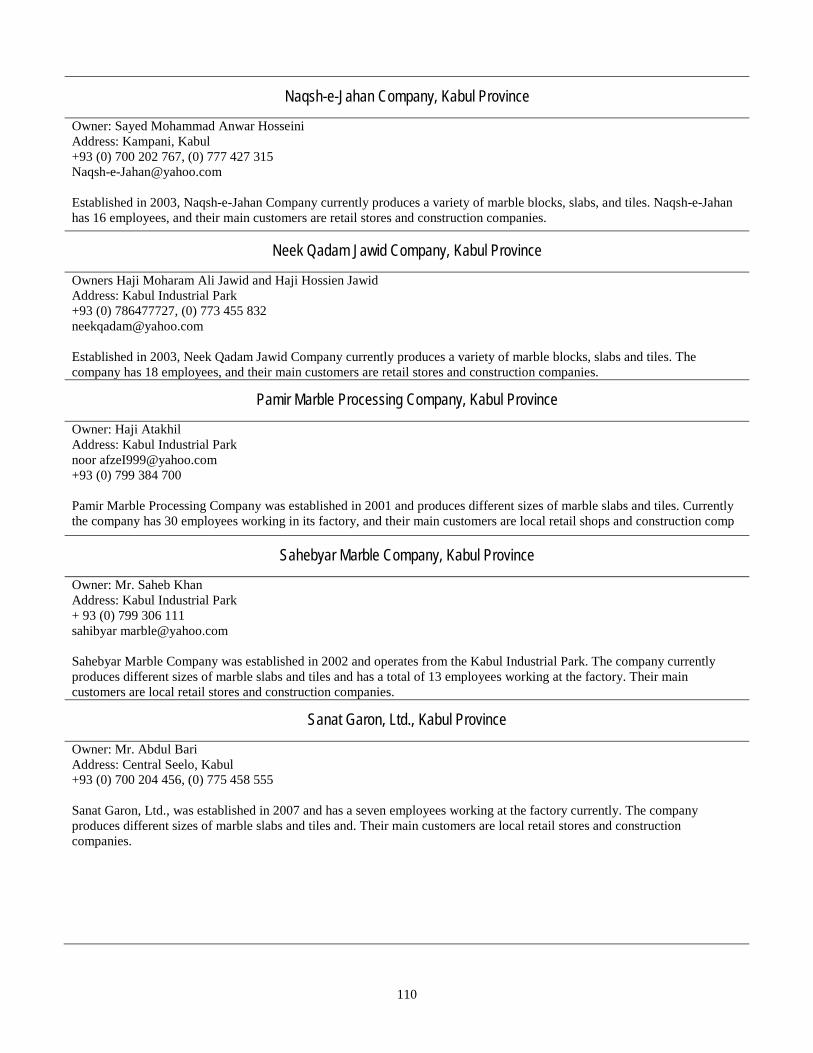
110
Naqsh-e-Jahan Company, Kabul Province
Owner: Sayed Mohammad Anwar Hosseini Address: Kampani, Kabul +93 (0) 700 202 767, (0) 777 427 315 [email protected] Established in 2003, Naqsh-e-Jahan Company currently produces a variety of marble blocks, slabs, and tiles. Naqsh-e-Jahan has 16 employees, and their main customers are retail stores and construction companies.
Neek Qadam Jawid Company, Kabul Province
Owners Haji Moharam Ali Jawid and Haji Hossien Jawid Address: Kabul Industrial Park +93 (0) 786477727, (0) 773 455 832 [email protected] Established in 2003, Neek Qadam Jawid Company currently produces a variety of marble blocks, slabs and tiles. The company has 18 employees, and their main customers are retail stores and construction companies.
Pamir Marble Processing Company, Kabul Province
Owner: Haji Atakhil Address: Kabul Industrial Park noor [email protected] +93 (0) 799 384 700 Pamir Marble Processing Company was established in 2001 and produces different sizes of marble slabs and tiles. Currently the company has 30 employees working in its factory, and their main customers are local retail shops and construction comp
Sahebyar Marble Company, Kabul Province
Owner: Mr. Saheb Khan Address: Kabul Industrial Park + 93 (0) 799 306 111 sahibyar [email protected] Sahebyar Marble Company was established in 2002 and operates from the Kabul Industrial Park. The company currently produces different sizes of marble slabs and tiles and has a total of 13 employees working at the factory. Their main customers are local retail stores and construction companies.
Sanat Garon, Ltd., Kabul Province
Owner: Mr. Abdul Bari Address: Central Seelo, Kabul +93 (0) 700 204 456, (0) 775 458 555 Sanat Garon, Ltd., was established in 2007 and has a seven employees working at the factory currently. The company produces different sizes of marble slabs and tiles and. Their main customers are local retail stores and construction companies.
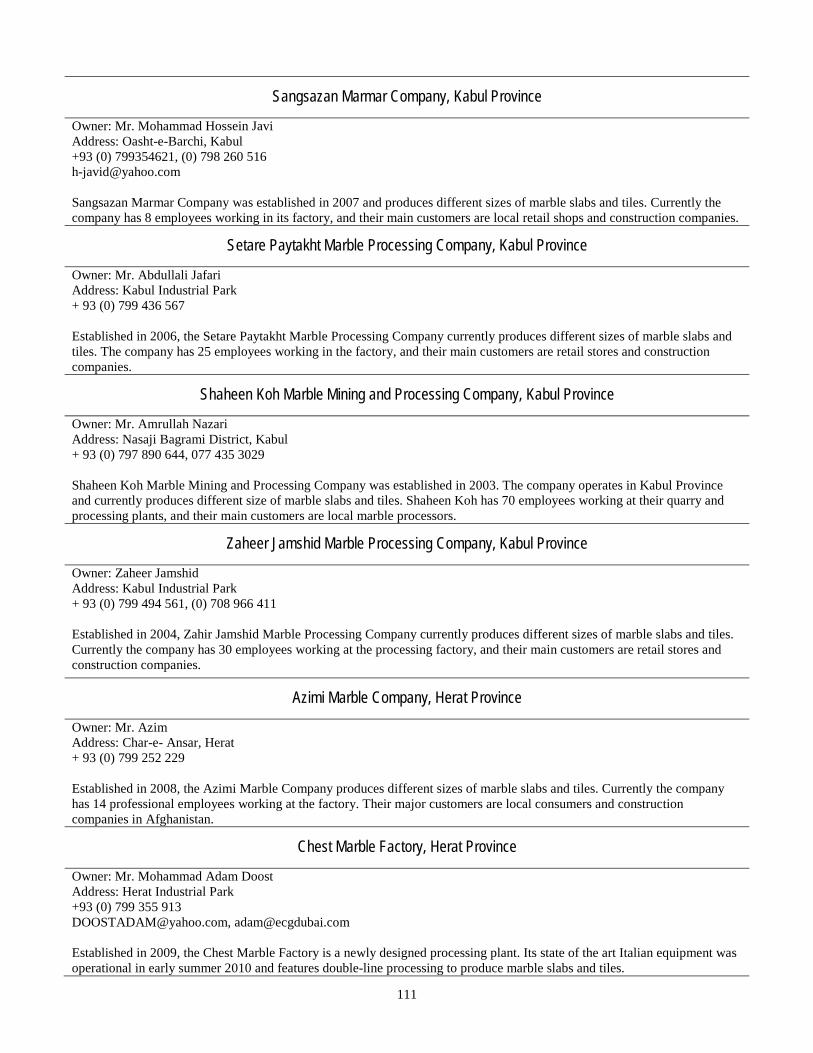
111
Sangsazan Marmar Company, Kabul Province
Owner: Mr. Mohammad Hossein Javi Address: Oasht-e-Barchi, Kabul +93 (0) 799354621, (0) 798 260 516 [email protected] Sangsazan Marmar Company was established in 2007 and produces different sizes of marble slabs and tiles. Currently the company has 8 employees working in its factory, and their main customers are local retail shops and construction companies.
Setare Paytakht Marble Processing Company, Kabul Province
Owner: Mr. Abdullali Jafari Address: Kabul Industrial Park + 93 (0) 799 436 567 Established in 2006, the Setare Paytakht Marble Processing Company currently produces different sizes of marble slabs and tiles. The company has 25 employees working in the factory, and their main customers are retail stores and construction companies.
Shaheen Koh Marble Mining and Processing Company, Kabul Province
Owner: Mr. Amrullah Nazari Address: Nasaji Bagrami District, Kabul + 93 (0) 797 890 644, 077 435 3029 Shaheen Koh Marble Mining and Processing Company was established in 2003. The company operates in Kabul Province and currently produces different size of marble slabs and tiles. Shaheen Koh has 70 employees working at their quarry and processing plants, and their main customers are local marble processors.
Zaheer Jamshid Marble Processing Company, Kabul Province
Owner: Zaheer Jamshid Address: Kabul Industrial Park + 93 (0) 799 494 561, (0) 708 966 411 Established in 2004, Zahir Jamshid Marble Processing Company currently produces different sizes of marble slabs and tiles. Currently the company has 30 employees working at the processing factory, and their main customers are retail stores and construction companies.
Azimi Marble Company, Herat Province
Owner: Mr. Azim Address: Char-e- Ansar, Herat + 93 (0) 799 252 229 Established in 2008, the Azimi Marble Company produces different sizes of marble slabs and tiles. Currently the company has 14 professional employees working at the factory. Their major customers are local consumers and construction companies in Afghanistan.
Chest Marble Factory, Herat Province
Owner: Mr. Mohammad Adam Doost Address: Herat Industrial Park +93 (0) 799 355 913 [email protected], [email protected] Established in 2009, the Chest Marble Factory is a newly designed processing plant. Its state of the art Italian equipment was operational in early summer 2010 and features double-line processing to produce marble slabs and tiles.
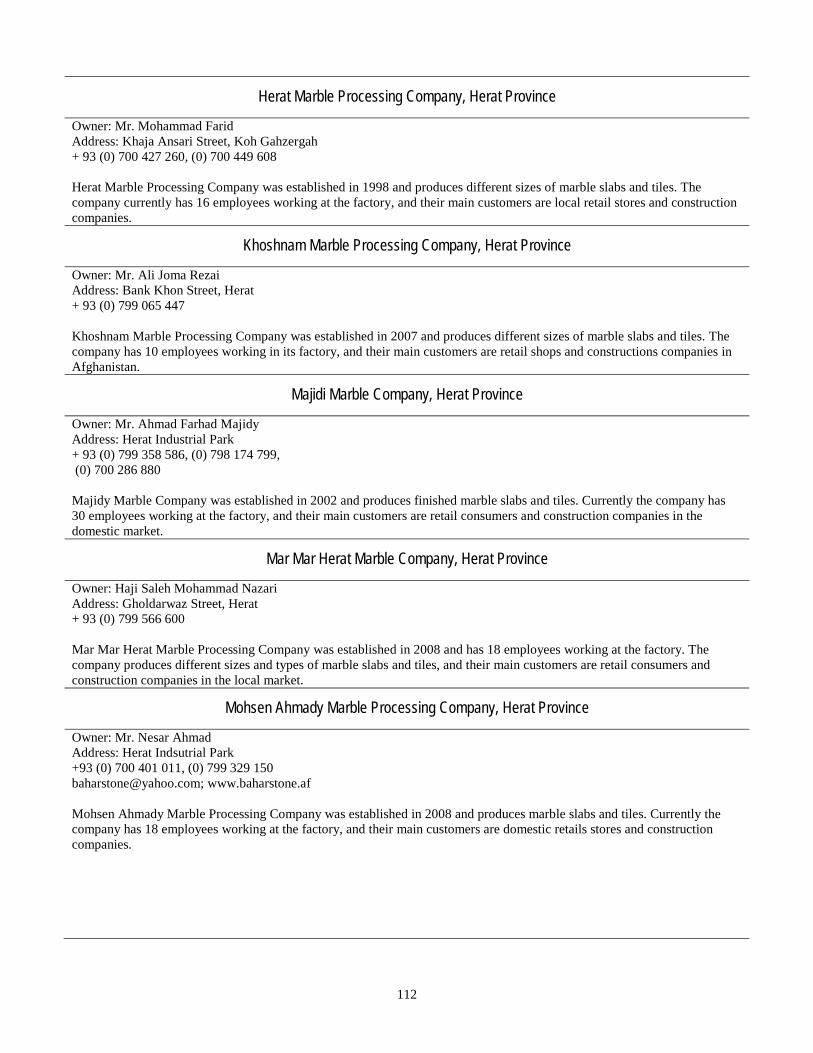
112
Herat Marble Processing Company, Herat Province
Owner: Mr. Mohammad Farid Address: Khaja Ansari Street, Koh Gahzergah + 93 (0) 700 427 260, (0) 700 449 608 Herat Marble Processing Company was established in 1998 and produces different sizes of marble slabs and tiles. The company currently has 16 employees working at the factory, and their main customers are local retail stores and construction companies.
Khoshnam Marble Processing Company, Herat Province
Owner: Mr. Ali Joma Rezai Address: Bank Khon Street, Herat + 93 (0) 799 065 447 Khoshnam Marble Processing Company was established in 2007 and produces different sizes of marble slabs and tiles. The company has 10 employees working in its factory, and their main customers are retail shops and constructions companies in Afghanistan.
Majidi Marble Company, Herat Province
Owner: Mr. Ahmad Farhad Majidy Address: Herat Industrial Park + 93 (0) 799 358 586, (0) 798 174 799, (0) 700 286 880 Majidy Marble Company was established in 2002 and produces finished marble slabs and tiles. Currently the company has 30 employees working at the factory, and their main customers are retail consumers and construction companies in the domestic market.
Mar Mar Herat Marble Company, Herat Province
Owner: Haji Saleh Mohammad Nazari Address: Gholdarwaz Street, Herat + 93 (0) 799 566 600 Mar Mar Herat Marble Processing Company was established in 2008 and has 18 employees working at the factory. The company produces different sizes and types of marble slabs and tiles, and their main customers are retail consumers and construction companies in the local market.
Mohsen Ahmady Marble Processing Company, Herat Province
Owner: Mr. Nesar Ahmad Address: Herat Indsutrial Park +93 (0) 700 401 011, (0) 799 329 150 [email protected]; www.baharstone.af Mohsen Ahmady Marble Processing Company was established in 2008 and produces marble slabs and tiles. Currently the company has 18 employees working at the factory, and their main customers are domestic retails stores and construction companies.
113
Sadaf Negin Marble Processing Company, Herat Province
Owner: Mr. Habib Reza Atar Por Address: Jadah-e-Bank-e-Khon, Herat +93 (0) 799 329 207, +93 (0) 700 400 747 Established in 2005, the Sadaf Nagen Marble Processing Company produces different types and sizes of marble slabs and tiles. Currently the company has 20 skilled employees working at the factory. Their main customers are retail stores and construction companies.
Tazniat Marble Company, Herat Province
Owner: Mr. Abdul Qader Address: Qulordo Street, Herat +93 (0) 700 717 276, (0) 708 409 983 Tazniat Marble Company established in 2003 and produces high quality finished marble slabs and tiles as well as carved decorative marble. The company has 10 skilled employees working at the factory, and their main customers are retail stores and construction companies.
Waliasar Malistan Marble Processing Company, Herat Province
Owner: Mr. Mohammad Nairn Sharfi Address: Herat Industrial Park +93 (0) 799 071 744, (0) 799 481 519 Waliasar Marble Processing Company was established in 2008 and produces quality marble slabs and tiles. Currently the company has 28 employees working at the factory, and their main customers are local stores and construction companies.
Zangergah Ansary Marble Processing Company, Herat Province
Owner: Haji Gholam Ashraf Popal Address: Herat Industrial Park +93 (0) 799 401 970, (0) 700 402 900 Zangergah Ansary Marble Processing Company was established in 2003 and produces marble slabs and tiles. Currently the company has 12 employees working at the factory, and their main customers are local retail stores and construction companies.
Takht Rustam Marble Processing Company, Balkh Province
Owner: Haji Abdul Boqi Address: Mazar-e-Sharif, Balkh +93 (0) 700 503 464 Established in 2001, the Takht Rustam Marble Processing Company's processing operations are located in Mazar-e-Sharif in Balkh Province and produce 1,800 square meters of marble tiles monthly. Currently the company has 30 employees working in the factory, and their main customers are retail shops and construction companies.
Arian Marble Processing Company, Nangahar Province
Owner: Mr. Fazil Mula Address: Surkhrud Dosaraka, Kabul-Jalalabad Rd, Jalalabad +93 (0) 799 337 778, (0) 707 272 114 [email protected] Established in 2000, the Arian Marble Processing Company operates in Jalalabad City in Nangarhar Province. Arian Marble currently produces 10,000 square feet of slab and 18,000 square feet of tiles monthly. Arian has 40 employees working in the factory, and their main customers are retail stores and construction companies.
114
National Marble Processing Company, Nangahar Province
Owner: Haji Gholam Ashraf Popal Address: Herat Industrial Park +93 (0) 774 708 826, (0) 799 022 681, [email protected]; [email protected]; www.afghan-marble.com Established in 2004, the National Marble Processing Company operates in Jalalabad City and produces about 1,000 square feet of small tiles monthly. Currently, the company has 20 factory employees, and their main customers are local retail stores and construction companies.
Sahil Marble Processing and Mining Company, Nangahar Province
Owner: Mr. Ezatullah Sahil Address: Surkhrud Dosaraka, Kabul-Jalalabad Highway, + 93 (0) 799 424 466, (0) 700 600 095 www.afghanimarble.com; www.sahil.afghanimarble.com Established in 2005, the Sahil Marble Processing and Mining Company operates in Jalalabad City in Nangarhar Province. The company produces quarrying blocks at the rate of 1,000 metric tons per month, slabs at 1,000 square feet per month and tiles at 19,000 square feet per month, and 8,000 square feet of other product monthly. Currently, the company has 80 factory employees working to supply its main customers in Afghanistan, China, Pakistan, and Kuwait.
Afghan Marble Company, Wardak Province
Owner: Eng. Ramatullah Address: Tangui Dsitrict +93 (0) 777 333 689 Afghan Marble Company was established in 2005 and has 30 employees working at the factory. The company produces marble blocks and medium-sized slabs. Their main customers are retail consumers and construction companies in the local market.