Embed Size (px)
Citation preview

ORIGINAL ARTICLE
doi:10.1111/evo.13678
Heterozygosity and asymmetry:Ectodysplasin as a form of genetic stressin marine threespine sticklebackMatthew R. J. Morris,1,2,3 Rebecca Kaufman,1 and Sean M. Rogers1
1Biological Sciences, University of Calgary, 2500 University Dr NW, Calgary, AB T2N 1N4, Canada2Current Address: Biological Sciences, Ambrose University, 150 Ambrose Cir SW, Calgary, AB T3H 0L5, Canada
3E-mail: [email protected]
Received June 29, 2018
Accepted December 14, 2018
Genome-wide heterozygosity has long been hypothesized to play a role in buffering organisms against developmental perturba-
tions, potentially resulting in increased symmetry. If true, this could in part explain the maintenance of standing genetic variation
in wild populations. Marine threespine sticklebacks (Gasterosteus aculeatus) were sampled across their eastern Pacific coastal dis-
tribution from Alaska to California and variations in asymmetry for both structural and nonstructural armor traits (lateral plates)
were assessed. Structural plates consistently showed less asymmetry than nonstructural plates, but standardized measures of
heterozygosity were not correlated with the extent of asymmetry expressed by a fish. Fish that were heterozygous for the major-
effect gene controlling lateral plate variation (Ectodysplasin) had higher occurrences of asymmetry, even when the individuals
were phenotypically fully plated. Collectively, this suggests that heterozygosity at a major-effect locus can have a greater impact
on asymmetry than heterozygosity sampled across the genome.
KEY WORDS: Adaptation, canalization, developmental instability, phenotypic plasticity.
The ability of populations to adapt rapidly to new environmental
conditions depends in part on the amount of genetic variation al-
ready present in the population. Such standing genetic variation
(SGV) may be maintained in a population by balancing selection.
For instance, alternative alleles may provide fitness advantages
within a heterogeneous landscape (e.g. Delph and Kelly 2014),
under different developmental contexts as organisms mature (e.g.
Barrett et al. 2008) or under different genetic backgrounds (e.g.
Ujvari et al. 2018). An example of the latter is the hypothesis that
genome-wide levels of heterozygosity may promote developmen-
tal stability by buffering against environmental disturbances or
mutations (“developmental noise”) during development (Lerner
1954; Clarke 1993). That is, the location of heterozygous alleles
in the genome may not be as important as the number of het-
erozygous loci in the genome. If true, SGV could be maintained
genome-wide if developmental stability enhances fitness (Roldan
et al. 1998; Brambilla et al. 2014).
One possible phenotypic expression of developmental noise
is fluctuating asymmetry (FA: Van Valen 1962; Palmer and
Strobeck 1986), which has widely been used as a measure of
developmental stability in wild populations (Beasley et al. 2013).
In bilaterally symmetrical organisms, FA is typically defined as
stochastic right-left asymmetry around a mean of zero. FA can
increase under stress (Leung et al. 2000; Allenbach 2011), di-
rectional selection (De Coster et al. 2013), or in association with
developmentally disruptive genetic backgrounds (mutational, ge-
nomic, or genetic stress, e.g. Parsons 1990).
Lerner (1954) proposed that heterozygosity could reduce
asymmetry. Although there is a debate over what Lerner origi-
nally meant (Møller and Swaddle 1997), some researchers have
interpreted this to mean that as heterozygosity increases across
the genome so does protein and regulatory diversity within the in-
dividual, permitting greater flexibility to compensate for develop-
mental perturbations resulting therefore, in increased symmetry
(e.g. Clarke 1993). Negative correlations between heterozygos-
ity and asymmetry have been found in some (e.g. Leary et al.
1983, 1984) but not in all studies (e.g. Kark et al. 2001; Trokovic
et al. 2012), with meta-analyses producing equivocal and perhaps
3 7 8C© 2018 The Author(s). Evolution C© 2018 The Society for the Study of Evolution.Evolution 73-2: 378–389

HETEROZYGOSITY AND ASYMMETRY
taxon-specific results (Vøllestad et al. 1999). Next Generation
Sequencing permits more robust testing of this hypothesis than
had been previously possible.
Threespine sticklebacks (Gasterosteus aculeatus) are a use-
ful subject for studying SGV and developmental instability. Ma-
rine sticklebacks continually invade and rapidly adapt to freshwa-
ter conditions, often through selection on SGV (McGuigan et al.
2011; Jones et al. 2012)—yet the factors maintaining this SGV in
marine populations remain poorly understood. A series of bony
plates extend laterally along their bodies, with reduced plate count
often evolving from SGV in numerous freshwater populations
(Colosimo et al. 2005; Schluter and Conte 2009). Each plate has
a position determined by the myomere in which it develops, with
each myomere acting as an independent trait that can be scored
for the presence or absence of a plate and compared between body
sides (Reimchen 1983). Plates on myomeres four through seven
are “structural plates,” as they abut the dorsal basal plates (DBPs)
for the first two dorsal spines and the ascending process (AP)
of the pelvic armature. Removal of structural plates impairs the
deflection of dorsal and pelvic spines, reducing defensive capabil-
ities (Reimchen 1983). Structural plates exhibit less asymmetry
than nonstructural plates (Bergstrom and Reimchen 2000), sug-
gesting that selection has canalized the development of structural
plates. The fitness consequences of FA in nonstructural plates
are partially understood (Reimchen and Nosil 2001; Bergstrom
and Reimchen 2003, but see Loehr et al. 2013). To date, such
work has focused on freshwater populations, with limited infor-
mation regarding the ancestral asymmetry condition. A negative
correlation between the number of myomeres exhibiting FA and
genome-wide heterozygosity has been predicted (e.g. Reimchen
et al. 2008; Reimchen and Bergstrom 2009; Loehr et al. 2012,
2013, but see Van Dongen et al. 2009), but not tested in threespine
stickleback—such a correlation in marine stickleback could po-
tentially explain the maintenance of SGV in oceanic populations.
Complicating this hypothesis is the observation that approxi-
mately 80% of phenotypic variation in plate number is attributable
to the presence of a regulatory mutation at the Ectodysplasin (Eda)
gene (Colosimo et al. 2005). Heterozygosity at Eda can have a
profound effect on plate number, inhibiting the development of
nonstructural plates anterior to the caudal keel to produce a “par-
tially plated” stickleback (e.g. Lucek et al. 2012)—unless modi-
fier alleles restore plate development (Colosimo et al. 2005). It is
possible that heterozygosity at this locus acts as a form of genetic
stress, enhancing FA; that is, while genome-wide heterozygosity
may reduce FA, heterozygosity at a major-effect locus may in-
crease FA. If true, genetic stress does not imply that variation at
Eda affects fitness, but rather that it perturbs development away
from bilateral symmetry. A recent study suggested that Eda is
under directional selection in oceanic populations (Morris et al.
2018), but its relationship to asymmetry has not been tested.
In this study, we indirectly test the hypothesis that SGV is
maintained in marine stickleback through selection on symmetric
individuals, by testing the prediction that symmetry is associated
with high levels of genome-wide heterozygosity. We specifically
assessed (1) to what extent Eda genotype results in the predicted
plate phenotype, and the impact genotype-phenotype mismatch
has on plate number and plate asymmetry; (2) whether plate
presence/absence asymmetry based on myomere position was
fluctuating or directional; (3) whether plates four through seven
of marine stickleback serve structural roles, as reported from
freshwater populations, and whether other plates fulfill similar
functions; (4) whether structural plates exhibit less asymmetry
in plate position than nonstructural plates; and (5) whether
asymmetry varies with genome-wide heterozygosity or with
major-effect loci such as Eda.
Materials and MethodsFISH COLLECTION
Marine threespine sticklebacks were collected using minnow traps
or seines, in the summers of 2012 and 2013, as per Morris et al.
(2017, 2018). A total of 283 sticklebacks were collected from
seven locations extending along the Pacific coast (Table 1). All
sticklebacks were >30 mm standard length. Sticklebacks were eu-
thanized using Eugenol or buffered tricaine methanesulfonate. Fin
clips were immediately preserved in 95% ethanol and whole bod-
ies in 70% ethanol. All collections were conducted in accordance
with Canadian Council on Animal Care guidelines (AUP AC13-
0040) and state/provincial/federal collection and import permits.
SEX AND EDA GENOTYPE DETERMINATION
DNA was extracted from partial fin clips using the phenol-
chloroform method (Chomczynski and Sacchi 1987). Sex was
determined by amplifying the sex-specific alleles at the idh lo-
cus, as per Peichel et al. (2004). Individuals were also geno-
typed at the Stn382 locus (Colosimo et al. 2005), yielding a
218-bp allele associated with full platedness (the C allele) or
a 158-bp allele associated with low platedness (the L allele)
(Lucek et al. 2012). Genotypes were visualized in 2% agarose
gels, scoring individuals as LL (predicted to be low plated), CL
(predicted to be partially plated), and CC (predicted to be fully
plated). All but five individuals were successfully genotyped
for both idh and Eda. Sex and Eda genotype were previously
published in Morris et al. (2018).
MEASURING ASYMMETRY
Preserved sticklebacks were transferred to the University of Cal-
gary. Fish were sequentially transferred to 50% ethanol, 20%
ethanol, distilled water, 10% formalin, and distilled water, spend-
ing 24 h in each fluid. Fish were then stained in KOH-buffered
EVOLUTION FEBRUARY 2019 3 7 9

M. R. J. MORRIS ET AL.
Table 1. The numbers of males and females for which plate counts, Eda genotypes, and standardized multilocus heterozygosity (sMLH)
measures were assessed.
Females MalesPopulation Location Latitude/longitude Plate count Eda sMLH Plate count Eda sMLH
CA01 Elkhorn Slough,California
36°49′45N/121°44′07W 9 9 6 26 25 23
CA02 Doran Park, Bodega Bay,California
38°18′52N/123°01′55W 30 30 20 20 20 8
CA03 Arcata Marsh, ArcataBay, California
40°51′23N/124°05′24W 18 18 11 31 31 17
OR01 South Slough, Coos Bay,Oregon
43°17′35N/124°19′26W 12 12 11 8 8 8
OR02 Tillamook Bay, Oregon 45°28′52N/123°53′49W 37 37 23 13 13 7BC01 Bamfield Inlet,
Vancouver Island,British Columbia
48°49′55N/125°08′17W 1 1 1 47 47 28
AK01 Swikshak Lagoon,Alaska
58°37′14N/153°44′44W 23 21 18 8 6 6
Alizarin red for 48 h and rinsed in distilled water for 24 h. They
were finally preserved in 40% isopropyl alcohol.
To determine plate morph, defined as per Lucek et al. (2012),
plate number was counted on the left and right sides of each fish
and was averaged. Briefly, Fully Plated with Keel (FPK) fish had
an average of �30 plates including a caudal keel, Low Plated with
No Keel fish had an average anterior plate count of �10 plates
and lacked a caudal keel, Partially Plated with Keel fish had >10
but <30 plates, including a caudal keel, Low Plated with Keel
fish had <10 anterior plates but one or more caudal keel plates,
and Partially Plated with No Keel fish had >10 anterior plates but
lacked a caudal keel.
Eda genotype was used to determine genotype-phenotype
mismatches, defined as occurring when LL fish had >10 plates,
CL fish had �10 or �30 plates, or CC fish had <30 plates,
regardless of the presence or absence of the keel. Welch’s two-
sample t-test was used to compare average plate counts for CL
and CC fish belonging to the FPK category.
To identify “structural” and “nonstructural” plates, P3
through P9 were scored for their contact or lack thereof with
the first (DBP1) or second (DBP2) dorsal basal plate, and P7
and P8 were scored for their associations with the AP. Histori-
cally, P4–P7 are considered “structural”, and P1–P3 and P8–P30
“nonstructural” (Reimchen 1983) (Fig. 1). Asymmetry in the rela-
tionship between structural plates and these supporting structures
was noted but not investigated here (Supporting Information S2).
All plates were counted on both the left (L) and right (R)
sides of each fish by a single investigator. Plate asymmetry was
recorded in two ways after Bergstrom and Reimchen (2000).
First, total plate number asymmetry was defined as the difference
in plate count between the left and right side of the fish, without
taking the position of the plate into account (plate number asym-
metry = RT − LT). Both the signed and absolute values of this
difference were recorded. Second, asymmetry that accounted for
plate position was measured, for which myomeres were scored
as plated (1) or plateless (0) from myomere 1 (P1) to myomere
30 (P30), for both sides of the fish. Keel (K) plates were simply
counted and summed. Positional asymmetry was, therefore,
measured for each plate as [(RP1 − LP1), (RP2 −LP2), . . . , (RP30
− LP30), (RKT − LKT)] with KT indicating total keel plate count.
Signed and absolute values for each position were recorded and
summed. The sum of absolute values indicated the overall extent
of asymmetry. Plate position based on myomere number has been
shown to be replicable among sticklebacks (Reimchen 1983).
To assess measurement error, counts were conducted twice
for all individuals, with replication conducted several months
apart. The effect of measurement error on the ability to de-
tect asymmetry was estimated using a two-factor mixed effects
ANOVA using the lme4 package (Bates et al. 2015) in R (R Core
Team 2016), with plate number as the dependent variable, individ-
ual fish as a random factor, and side as a fixed factor. Models with
and without the side × individual interaction term were compared
and a test of significance between the two models was assessed
using ANOVA. A significant side-by-individual interaction term
would indicate detectable asymmetry despite measurement er-
ror (Palmer and Strobeck 1986; Bergstrom and Reimchen 2003).
To reduce measurement error, all fish for which discrepancies in
plate position were noted were rescored and corrected, with the
corrected data used in all subsequent analyses.
The effects of population and sex on positional asymmetry
were tested using a two-factor ANOVA and Type II SS using the
car package in R. The expectation that asymmetry was equal on
3 8 0 EVOLUTION FEBRUARY 2019

HETEROZYGOSITY AND ASYMMETRY
Figure 1. Plate phenotypes in threespine sticklebacks. Plates are color coded as follows: blue = structural plates 4 through 7, green =anterior nonstructural plates 1 through 3, red = posterior nonstructural plates 8 through 30, pink = a series of fused plates comprising
the keel, yellow = bony elements that interact with the structural plates (Cl, cleithrum; AP, ascending process; DBP1, first dorsal basal
plate; DBP2, second dorsal basal plate). (A) Plate morphotypes, showing a typical low-plated fish (top), partially-plated fish (middle), and
fully-plated fish (bottom). The first ten plates are numbered on the fully plated fish; note that some fish as shown are missing some
combination of their first two plates; for instance, the plate to first appear on the low plated fish is plate 3. (B) Asymmetry phenotypes,
showing the left (top) and right (bottom) sides of a single fully plated fish. This fish symmetrically has retained most of its plates and its
keel, but is symmetrically missing plate 2, and is asymmetrically missing plate 10 from its left side and plate 15 from its right. Total plate
count asymmetry would equal to 0 for this fish, as the total number of plates on each side of the fish is the same. The total positional
asymmetry of this fish would be 2, as asymmetry is noted at two myomere positions. Note that for this fish, plate 7 abuts the ascending
process on both sides of the fish; there is no relational asymmetry shown in this figure.
each side of the fish was tested for signed plate number asymmetry
and signed positional asymmetry using a two-tailed t-test with a
corrected α of 0.05/17 = 0.003. The Kolmogrov–Smirnov test
was used to test for normality for signed positional asymmetry.
Kurtosis for signed positional asymmetry was measured using the
moments package in R, using an unbiased (kurtosis2) estimator.
Antisymmetry was visually assessed by looking for bimodality
within each histogram.
The null hypothesis that the incidence of positional asym-
metry did not vary across myomeres was tested using χ2
tests for all plates, structural plates only, nonstructural (an-
terior, posterior) plates only, and within each Eda genotype.
Welch’s t-test was used to determine whether mean posi-
tional asymmetry differed between structural and nonstructural
plates, and between CL and CC genotypes within the FPK
morph. Pearson correlations tested for an association between
plate number and the extent of positional asymmetry for all
pooled samples. The symmetrical absence of plates was also
noted.
MEASURING GENOME-WIDE HETEROZYGOSITY
DNA was extracted and sequenced using the Genotype-by-
Sequencing (Elshire et al. 2011) dataset from Morris et al. (2018),
using a subset of all fish (n = 187, Table 1). Briefly, DNA from
partial fin clips was extracted using Qiagen DNeasy Blood and
Tissue kits and digested with EcoRI and MseI restriction en-
zymes. After the digestion-ligation process, samples were right-
and left-side cleaned using Solid Phase Reversible Immobiliza-
tion (SPRI) beads, recovering DNA fragments between 205 bp to
600 bp in length. Samples were amplified using PCR and left-side
cleaned using SPRI beads. Sequencing was conducted on an Il-
lumina NextSeq 500 with a 20% PhiX spike-in. Sequenced reads
were cleaned and processed using Stacks (Catchen et al. 2011,
2013) and aligned to the stickleback genome using GSnap (Wu
and Watanabe 2005). Filtering criteria included a minimum of
4× coverage (mean within-individual coverage: 11.7 ± 3.7 SD,
range: 6.1–36.8×), with a log-likelihood threshold >−60, se-
quenced in more than 75% of individuals, sequenced in at least
six populations, with a minimum minor allele frequency of 2%,
and FIS >−0.3.
From these sequences, 6655 polymorphic loci were recov-
ered. Heterozygosity per individual fish was calculated using the
InbreedR package (Stoffel et al. 2016) in R. We estimated both
multilocus heterozygosity (MLH—the number of heterozygous
loci divided by the total number of loci sequenced for an individ-
ual) and standardized MLH (sMLH—the number of heterozygous
loci divided by the sum of the population average heterozygosity
for those loci that were sequenced in the individual of interest)
(Stoffel et al. 2016). The relations of MLH and sMLH with lat-
itude were assessed using Pearson correlations. The relation of
EVOLUTION FEBRUARY 2019 3 8 1

M. R. J. MORRIS ET AL.
sMLH to Eda genotype was determined using two-way ANOVA
with population as a factor.
To determine whether asymmetry was related to heterozygos-
ity, Pearson correlations were measured between MLH or sMLH
and the extent of positional asymmetry per fish. To determine if
the number of nonasymmetric individuals swamped out the signal
for an asymmetry-heterozygosity relation, a Pearson correlation
was measured using sMLH and only individuals with some de-
gree of asymmetry. To test whether symmetric and asymmetric
individuals varied for sMLH, ANOVA was run on sMLH with
the symmetrical state of an individual (symmetric or asymmetric)
and population as factors.
DETECTING MAJOR-EFFECT LOCI
To determine whether any of the sequenced loci used in this study
were associated with asymmetry, PLINK (version 1.07-dos, Pur-
cell et al. 2007) was used (Supporting Information S3). To deter-
mine whether Eda genotype at the Stn382 locus was associated
with asymmetry, ANOVA was performed using the sum of asym-
metric plate positions apart from the keel, with population as a
factor. Post-hoc Tukey HSD tests were used to determine which
Eda contrasts were significant, with adjusted α of 0.017. To ac-
count for the possible lack of independence caused by different
degrees of genetic relatedness among individuals within and be-
tween populations (Stone et al. 2011), the Eda data alone were
run through PLINK. Population substructure was accounted for by
using Identity-by-State clustering (Supporting Information S3).
ResultsGENOTYPE, PLATE MORPH, AND PLATE COUNTS
Many sticklebacks, primarily from California and Tillamook Bay,
Oregon, had LL genotypes (48%). Plate number varied with Eda
genotype (Fig. 2, Table 2), with a number of phenotype-genotype
mismatches (Table S1). When mismatches occurred, individuals
tended to have fewer plates than genotype-phenotype “matched”
individuals (Table S2). Within the FPK class, CL fish had sig-
nificantly fewer plates (mean: 31.7) than CC fish (mean: 33.4)
(Welch two-sample t-test: t = 6.5, df = 30, P < 0.001) (Fig. 2,
Table S2).
STRUCTURAL AND NONSTRUCTURAL PLATES
P4 through P7 are generally considered to be structural plates
(Reimchen 1983), in part defined by contact with DBPs and/or
the AP. A total of 566 measures were made for each structural
plate association (283 fish × 2 sides). More than 98% of P4, P5,
and P7 and 78% of P6 contacted at least one DBP; 96% of P7
also contacted the AP. In contrast, only 17% of P3, 62% of P8,
and 9% of P9 contacted a DBP (Table S3).
ASYMMETRY
Right-left asymmetry was evident despite measurement error (for
positional asymmetry, model without individual × side interac-
tion: df = 4, Akaike Information Criterion (AIC) = 4244, log-
likelihood = −2118; model with interaction term: df = 5, AIC =3136, log-likelihood = −1563; ANOVA comparing two models,
df = 1, P < 0.001). Directional asymmetry was not evident (Tables
S4 and S5). Positional asymmetry was not normally distributed,
due to high occurrence of symmetric individuals (Table S5). All
distributions had positive kurtosis and showed no evidence of
antisymmetry (Table S5).
A total of 41% of sampled stickleback had plate number
asymmetry. Given 8773 possible asymmetric positions (30 my-
omere pairs × 283 sticklebacks + 283 keel pairs), positional
asymmetry occurred in 2.8% of all positions but 69% of all fish
(Fig. 3). Most fish were asymmetric at only a single plate position
(n = 75), and numbers declined as the number of asymmetric
plate positions increased, to a maximum of eight asymmetric
plates on a single fish from Tillamook Bay, Oregon. Positional
asymmetry varied among populations (ANOVA: F6,276 = 10.9,
P < 0.001). From Coos Bay, Oregon south, 45% to 49% of col-
lected individuals exhibited positional asymmetry compared to
78% of individuals from Tillamook Bay, Oregon and only 15%
from Bamfield Inlet, British Columbia.
Excluding the keel, plate positions differed in the incidence
of asymmetry (χ2 = 147, df = 29, P < 0.001) (Fig. 3, Figs. S1
and S2). Structural plates were less likely to be asymmetric
than nonstructural plates (mean structural positional asymme-
try: 0.0009, mean nonstructural positional asymmetry: 0.027, t =12.4, df = 8317, P < 0.0001); in fact, only a single structural plate
in a single fish exhibited asymmetry (P6 from Tillamook Bay,
Oregon, or 0.35% of all fish). P8 had the maximum incidence
of asymmetry at 8.8%. The frequency of positional asymmetry,
therefore, varied among nonstructural plates (χ2 = 104.2, df =25, P < 0.001), even when considering only anterior plates (χ2
= 17.4, df = 2, P < 0.001) or only posterior plates (χ2 = 50.4, df
= 22, P < 0.001). Sixteen percent of individuals expressed some
keel asymmetry.
Patterns were particularly noticeable with respect to Stn382
genotype (Figs. S2 and S3, Table 2); although asymmetry did not
vary with plate position in CC individuals (χ2 = 28, df = 29,
P = 0.5), it did for LL (χ2 = 281, df = 29, P < 0.001) and CL
individuals (χ2 = 75, df = 29, P < 0.001) (Fig. S2). Of FPK
fish, CL heterozygotes (mean: 1.2) had greater asymmetry than
CC homozygotes (mean: 0.2) (Welch two-sample t-test: t = -3.8,
df = 24, P = 0.0019). Plate count and positional asymmetry were
not correlated (Pearson correlation: r = 0.018, t = 0.3, df = 281,
P = 0.8).
The symmetrical absence of plates also showed interesting
patterns (Figs. S1 and S2), particularly in CL individuals. A total
3 8 2 EVOLUTION FEBRUARY 2019

HETEROZYGOSITY AND ASYMMETRY
Figure 2. Distributions of average plate number (A) per population and (B) per Eda genotype. CA = California, OR = Oregon, BC =British Columbia, AK = Alaska. LL = Eda homozygote for the low plated allele, CL = Eda heterozygote, CC = Eda homozygote for the
fully plated allele, where Eda is sampled at the Stn382 locus.
Table 2. Asymmetry and Eda genotype. Sum of asymmetric positions is the total number of asymmetric plates summed across all
genotyped fish.
Edagenotype
Mean platecount
Range platecount
Mean number ofasymmetric platesper fish
MeansMLH
Numbergenotyped
Number genotypedwith positionalasymmetry
Sumasymmetricpositions
LL 7.0 4–19.5 0.56 0.987 133 59 75CL 25.7 6.5–34 2.59 0.973 54 44 140CC 33.3 23–35.5 0.30 1.000 91 21 27
LL = Eda homozygote for the low-plated allele, CL = Eda heterozygote, CC = Eda homozygote for the fully plated allele, sMLH = standardized multilocus
heterozygosity.
of 18% of CL individuals symmetrically lacked P1, no individuals
symmetrically lacked P2–P8, and symmetrical absence increased
gradually from nearly 2% at P9 to 46% at P22, and then declined
to nearly 2% for P28–P30 and 7% for the keel.
ASYMMETRY AND HETEROZYGOSITY
Heterozygosity was estimated from sequences of 187 individ-
uals randomly selected from within each population, of which
80 expressed some degree of positional asymmetry (Table 2,
Table S6). Observed heterozygosity (MLH) varied positively with
latitude (Pearson correlation: r = 0.43, t = −6.4, df = 185,
P < 0.001), with Tillamook Bay, Oregon having the highest aver-
age heterozygosity. This relation was not evident when heterozy-
gosity was standardized (sMLH) within each population (Pearson
correlation: r = 0.006, t = 0.08, df = 185, P = 0.9) (Fig. S3,
Table S6).
Standardized multilocus heterozygosity was not correlated
with the extent of asymmetry (Pearson correlation: r = −0.005,
t = −0.07, df = 185, P = 0.9) (Fig. S4), even when excluding
symmetric individuals (Pearson correlation: r = 0.03, t = 0.3,
df = 78, P = 0.8). Mean sMLH did not differ for asymmetric
and symmetric individuals (Table 3, mean asymmetric sMLH =0.9857, mean symmetric = 0.9919). sMLH did not vary signifi-
cantly among Eda genotypes (Table 2, Table S4).
MAJOR-EFFECT LOCI
The Genome-Wide Association Study recovered no loci associ-
ated with asymmetry.
The extent of positional asymmetry varied significantly
among Eda genotypes, even when accounting for population dif-
ferences (Table 3). A total of 81% of CL genotypes were asymmet-
ric compared to 23% of CC genotypes and 44% of LL genotypes
EVOLUTION FEBRUARY 2019 3 8 3

M. R. J. MORRIS ET AL.
Figure 3. Proportion of fish displaying asymmetry per plate position. Note that 4–7 represent structural plates.
Table 3. Results of two-way ANOVA, testing (top) the effects of Eda and population of origin on asymmetry, and (bottom) the effects
of asymmetry and population of origin on standardized multilocus heterozygosity (sMLH).
Factor Type II SS df F P
Unsigned positional asymmetry, excluding keel, for Eda and populationEda 81.7 2 48.0 <0.001Population 41.0 6 8.0 <0.001Eda × Pop 11.7 6 2.3 0.04Residuals 223.9 263sMLH, for symmetry (symmetrical or asymmetrical) and populationSymmetry 0.001 1 0.04 0.8Population 0.01 6 0.1 1.0Symm × Pop 0.2 6 2.0 0.07Residuals 2.9 173
(Fig. 4, Table 2). Eighty-three percent of all positional asymme-
try occurrences were found in CL heterozygotes, even though
this genotype comprised only 19% of all collected fish. The CL
genotype had significantly higher asymmetry than either the CC
(mean CL–CC = 2.29, P = 0) or LL (mean CL–LL = 2.03,
P = 0) genotypes (mean LL–CC = 0.26, P = 0.2) (Fig. 4). Eda
was still significantly associated with asymmetry after accounting
for population stratification in PLINK (χ2 = 10.5, P = 0.001).
DiscussionSUMMARY
Lerner (1954) predicted that genome-wide heterozygosity
should limit developmental noise, as individuals with more
heterozygous loci should have greater plasticity to buffer
perturbations. If true, this could explain genome-wide patterns
of heterozygosity in nature. In this study, we examined marine
threespine sticklebacks, the contemporary forms of the ancestors
3 8 4 EVOLUTION FEBRUARY 2019

HETEROZYGOSITY AND ASYMMETRY
Figure 4. Distribution of signed positional plate asymmetry values for each Eda genotype. (L) CC homozygotes; (middle) CL heterozy-
gotes; (R) LL homozygotes. Note that 81% of all CL fish, 44% of all LL fish, and 23% of all CC fish exhibited some degree of asymmetry.
of freshwater sticklebacks, from Alaska to California. Here, we
report that (1) there was extensive variation in the major-effect
Eda genotype, with phenotypes not always matching genotypes
but such mismatches having phenotypic consequences. (2)
Asymmetry was fluctuating rather than directional. (3) Plates
4 through 7 seem to serve structural functions akin to those
reported for freshwater stickleback. (4) Plate position asymmetry
differed between structural and nonstructural plates. In contrast
to observations made in freshwater populations (Bergstrom and
Reimchen 2000; Loehr et al. 2013), only a single individual
exhibited structural asymmetry among all marine individuals. (5)
Finally, asymmetry did not vary significantly with standardized
genome-wide heterozygosity, but was clearly associated with
Eda genotype, even in genotype-phenotype mismatched indi-
viduals. Collectively, these results suggest that structural plate
canalization is an ancestral condition that is reduced in freshwater
populations, and that the freshwater allele at Eda constitutes a
genetic stressor that elevates asymmetry in marine threespine
sticklebacks.
GENOTYPE-PHENOTYPE MISMATCH
Plate morph did not match Eda-linked Stn382 genotype for over
10% of sticklebacks (also see Barrett et al. 2009; Le Rouzic et al.
2011; Lucek et al. 2012). Colosimo et al. (2005) suggested that
genotype-phenotype mismatch in Eda represents cryptic genetic
variation (Gibson and Dworkin 2004), wherein the low plated al-
lele persists at low frequencies in the marine environment through
the influence of modifier alleles that restore the marine-adaptive
fully plated phenotype. This genetic variation could then be
available for selection during colonization of freshwater. Our re-
sults suggest that Eda heterozygosity in fully plated stickleback is
not entirely cryptic, reducing the number of plates and increasing
the number of asymmetric plate positions relative to homozy-
gous fully plated individuals. The fitness consequences of these
phenotypes are unknown and warrant further exploration.
CANALIZATION OF STRUCTURAL PLATES
Fully plated sticklebacks produce lateral plates systematically
throughout early development, beginning with P5 and P6 (Bell
1981). Plates anterior to and posterior to P6 develop in turn (P7,
P4, P8, P3, etc.), with additional plates developing in the caudal
region. The gap between the structural plates and the keel fills
progressively from both directions (Bell 1981; Banbura 1989;
Bergstrom and Reimchen 2000). The structural plates are hypoth-
esized to develop early due to their defensive role, particularly
in spine deflection (Reimchen 1983). Consistent with this ex-
pectation, symmetric and asymmetric loss of structural plates is
less common than loss of nonstructural plates in Haida Gwaii
and Scandinavian sticklebacks (Reimchen 1983; Bergstrom and
Reimchen 2000; Loehr et al. 2013), presumably due to selection.
Our results confirmed this association. Although marine stick-
leback varied genetically and morphologically from Alaska to
California (Morris et al. 2017, 2018), and displayed substantial
variation in plate count and Eda genotype, only one individual
was asymmetric for a structural plate. That is an occurrence of
0.35%, as opposed to freshwater reports varying from 1.1% to
4.8% (Bergstrom and Reimchen 2000; Loehr et al. 2013). This
contrast suggests that canalization of structural plates may be
EVOLUTION FEBRUARY 2019 3 8 5
M. R. J. MORRIS ET AL.
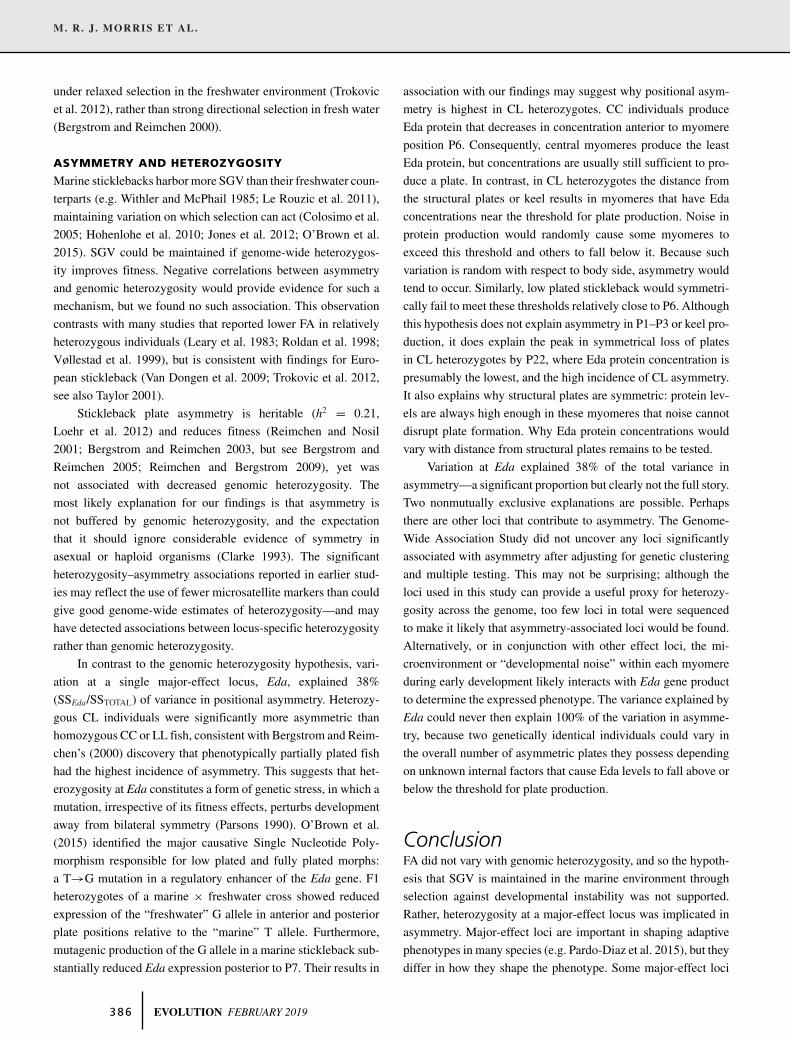
under relaxed selection in the freshwater environment (Trokovic
et al. 2012), rather than strong directional selection in fresh water
(Bergstrom and Reimchen 2000).
ASYMMETRY AND HETEROZYGOSITY
Marine sticklebacks harbor more SGV than their freshwater coun-
terparts (e.g. Withler and McPhail 1985; Le Rouzic et al. 2011),
maintaining variation on which selection can act (Colosimo et al.
2005; Hohenlohe et al. 2010; Jones et al. 2012; O’Brown et al.
2015). SGV could be maintained if genome-wide heterozygos-
ity improves fitness. Negative correlations between asymmetry
and genomic heterozygosity would provide evidence for such a
mechanism, but we found no such association. This observation
contrasts with many studies that reported lower FA in relatively
heterozygous individuals (Leary et al. 1983; Roldan et al. 1998;
Vøllestad et al. 1999), but is consistent with findings for Euro-
pean stickleback (Van Dongen et al. 2009; Trokovic et al. 2012,
see also Taylor 2001).
Stickleback plate asymmetry is heritable (h2 = 0.21,
Loehr et al. 2012) and reduces fitness (Reimchen and Nosil
2001; Bergstrom and Reimchen 2003, but see Bergstrom and
Reimchen 2005; Reimchen and Bergstrom 2009), yet was
not associated with decreased genomic heterozygosity. The
most likely explanation for our findings is that asymmetry is
not buffered by genomic heterozygosity, and the expectation
that it should ignore considerable evidence of symmetry in
asexual or haploid organisms (Clarke 1993). The significant
heterozygosity–asymmetry associations reported in earlier stud-
ies may reflect the use of fewer microsatellite markers than could
give good genome-wide estimates of heterozygosity—and may
have detected associations between locus-specific heterozygosity
rather than genomic heterozygosity.
In contrast to the genomic heterozygosity hypothesis, vari-
ation at a single major-effect locus, Eda, explained 38%
(SSEda/SSTOTAL) of variance in positional asymmetry. Heterozy-
gous CL individuals were significantly more asymmetric than
homozygous CC or LL fish, consistent with Bergstrom and Reim-
chen’s (2000) discovery that phenotypically partially plated fish
had the highest incidence of asymmetry. This suggests that het-
erozygosity at Eda constitutes a form of genetic stress, in which a
mutation, irrespective of its fitness effects, perturbs development
away from bilateral symmetry (Parsons 1990). O’Brown et al.
(2015) identified the major causative Single Nucleotide Poly-
morphism responsible for low plated and fully plated morphs:
a T→G mutation in a regulatory enhancer of the Eda gene. F1
heterozygotes of a marine × freshwater cross showed reduced
expression of the “freshwater” G allele in anterior and posterior
plate positions relative to the “marine” T allele. Furthermore,
mutagenic production of the G allele in a marine stickleback sub-
stantially reduced Eda expression posterior to P7. Their results in
association with our findings may suggest why positional asym-
metry is highest in CL heterozygotes. CC individuals produce
Eda protein that decreases in concentration anterior to myomere
position P6. Consequently, central myomeres produce the least
Eda protein, but concentrations are usually still sufficient to pro-
duce a plate. In contrast, in CL heterozygotes the distance from
the structural plates or keel results in myomeres that have Eda
concentrations near the threshold for plate production. Noise in
protein production would randomly cause some myomeres to
exceed this threshold and others to fall below it. Because such
variation is random with respect to body side, asymmetry would
tend to occur. Similarly, low plated stickleback would symmetri-
cally fail to meet these thresholds relatively close to P6. Although
this hypothesis does not explain asymmetry in P1–P3 or keel pro-
duction, it does explain the peak in symmetrical loss of plates
in CL heterozygotes by P22, where Eda protein concentration is
presumably the lowest, and the high incidence of CL asymmetry.
It also explains why structural plates are symmetric: protein lev-
els are always high enough in these myomeres that noise cannot
disrupt plate formation. Why Eda protein concentrations would
vary with distance from structural plates remains to be tested.
Variation at Eda explained 38% of the total variance in
asymmetry—a significant proportion but clearly not the full story.
Two nonmutually exclusive explanations are possible. Perhaps
there are other loci that contribute to asymmetry. The Genome-
Wide Association Study did not uncover any loci significantly
associated with asymmetry after adjusting for genetic clustering
and multiple testing. This may not be surprising; although the
loci used in this study can provide a useful proxy for heterozy-
gosity across the genome, too few loci in total were sequenced
to make it likely that asymmetry-associated loci would be found.
Alternatively, or in conjunction with other effect loci, the mi-
croenvironment or “developmental noise” within each myomere
during early development likely interacts with Eda gene product
to determine the expressed phenotype. The variance explained by
Eda could never then explain 100% of the variation in asymme-
try, because two genetically identical individuals could vary in
the overall number of asymmetric plates they possess depending
on unknown internal factors that cause Eda levels to fall above or
below the threshold for plate production.
ConclusionFA did not vary with genomic heterozygosity, and so the hypoth-
esis that SGV is maintained in the marine environment through
selection against developmental instability was not supported.
Rather, heterozygosity at a major-effect locus was implicated in
asymmetry. Major-effect loci are important in shaping adaptive
phenotypes in many species (e.g. Pardo-Diaz et al. 2015), but they
differ in how they shape the phenotype. Some major-effect loci
3 8 6 EVOLUTION FEBRUARY 2019

HETEROZYGOSITY AND ASYMMETRY
affect protein function; heterozygotes would therefore contain
two related protein forms. Some affect protein abundance by
altering regulation or producing nonfunctioning proteins; het-
erozygotes would express intermediate protein levels of a single
protein type. These different types of major-effect loci could
have different impacts on asymmetry, explaining other studies
that have found evidence that heterozygosity in certain proteins
buffers against asymmetry (Leary et al. 1983, 1984). Further-
more, the threshold of protein concentration required to develop
a phenotype could also impact asymmetry. To our knowledge,
such comparisons have not been done. Because the Eda mutation
underlies a regulatory region as opposed to a functional protein
domain, it may affect asymmetry by producing protein concen-
trations in certain myomeres that hover around a haplosufficient
threshold. The consequence of this genetic stress in heterozygotes
could be to enhance selection for homozygotes in marine habitats,
if not in freshwater environments. Plate asymmetry may be an im-
portant factor in the rapid evolution of stickleback to fresh water
(Reimchen and Nosil 2001; Bergstrom and Reimchen 2003,
2005), or the maintenance of fully plated stickleback in many
marine habitats (Colosimo et al. 2005). Disentangling the
fitness effects of plate number from asymmetry from the other
pleiotropic effects of Eda or linked loci, in marine and freshwater
environments, remains a complicated but exciting research
focus; indeed, Morris et al. (2018) found evidence that Eda and
plate number were under directional selection in the marine
environment.
FA has been associated with health problems in human and
nonhuman animals (Sefcek and King 2007; Van Dongen and
Gangestad 2011). If our results extend to other species, then
reduced genome-wide heterozygosity should not be associated
with asymmetry-related disorders. This study highlights the need
to focus on more mechanistic-based hypotheses (e.g. Aparicio
and Bonal 2002.) for addressing the origin and maintenance of
asymmetry in nature.
AUTHOR CONTRIBUTIONSM. R. J. M carried out Genotype-by-Sequencing, plate counts, statisti-cal analyses, and main writing of the article. R. K. assisted with platecounts, idh and Eda genotyping. S. M. R. coordinated and financed thestudy and helped draft the manuscript. All authors give final approval forpublication.
ACKNOWLEDGMENTSThe authors wish to thank: Friends of the Arcata Marsh, Elkhorn SloughFoundation, South Slough National Estuarine Research Reserve, Bam-field Marine Sciences Centre, and the National Park Service in KingSalmon, Alaska for their assistance in locating and capturing marinestickleback; T. Gaskill, L. Basch, K. Wasson, D. Homer, D. Morris, S.Vanderzwan, T. Barry, A. Pistore, E. Ellefson, V. Heather, H. Jamniczky,E. Bowles, and B. Allen. This research was enabled in part by supportprovided by WestGrid (www.westgrid.ca) and Compute Canada Calcul
Canada (www.computecanada.ca). Funding was provided by NSERCDiscovery Grant awarded to SMR (RT735287) and Vanier, Killam, andAlberta Innovates Technology Futures awarded to MRJM.
DATA ARCHIVINGSupplied as a supplementary Excel file. Genomic data from Morris et al.(2018) can be found at https://doi.org/10.5061/dryad.450c2v7.
CONFLICTS OF INTERESTThe authors declare no conflicts of interest.
LITERATURE CITEDAllenbach, D. M. 2011. Fluctuating asymmetry and exogenous stress in fishes:
a review. Rev. Fish Biol. Fish. 21:355–376.Aparicio, J. M., and R. Bonal. 2002. Why do some traits show higher fluctu-
ating asymmetry than others? A test of hypotheses with tail feathers ofbirds. Heredity 89:139–144.
Banbura, J. 1989. Lateral plate number development in the complete morphof the three-spined stickleback, Gasterosteus aculeatus L. Zool. Scripta.18:157–159.
Barrett, R. D. H., S. M. Rogers, and D. Schluter. 2008. Natural selection on amajor armor gene in threespine stickleback. Science 322:255–257.
———. 2009. Environment specific pleiotropy facilitates divergence at theEctodysplasin locus in threespine stickleback. Evolution 63-11:2831–2837.
Bates, D., M. Maechler, B. Bolker, and S. Walker. 2015. Fitting linear mixed-effect models using lme4. J. Stat. Softw. 67:1–48.
Beasley, D. A. E., A. Bonisoli-Alquati, and T. A. Mousseau. 2013. The use offluctuating asymmetry as a measure of environmentally induced devel-opmental instability: a meta-analysis. Ecol. Indic. 30:218–226.
Bell, M. A. 1981. Lateral plate polymorphism and ontogeny of the com-plete plate morph of threespine sticklebacks (Gasterosteus aculeatus).Evolution 35:67–74.
Bergstrom, C. A., and T. E. Reimchen. 2000. Functional implications of fluctu-ating asymmetry among endemic populations of Gasterosteus aculeatus.Behaviour 137:1097–1112.
———. 2003. Asymmetry in structural defenses: insights into selective pre-dation in the wild. Evolution 57:2128–2138.
———. 2005. Habitat dependent associations between parasitism and fluctu-ating asymmetry among endemic stickleback populations. J. Evol. Biol.18:939–948.
Brambilla, A., I. Biebatch, B. Bassano, G. Bogliani, and A. von Hardenberg.2014. Direct and indirect causal effects of heterozygosity on fitness-related traits in Alpine ibex. Proc. R. Soc. B 282:20141873.
Catchen, J., A. Amores, P. Hohenlohe, W. Cresko, and J. H. Postlethwait.2011. Stacks: building and genotyping loci de novo from short-readsequences. G3 (Bethesda). 1:171–182.
Catchen, J., P. A. Hohenlohe, S. Bassham, A. Amores, and W. A. Cresko.2013. Stacks: an analysis tool set for population genomics. Mol. Ecol.22:3124–3140.
Chomczynski, P., and N. Sacchi. 1987. Single-step method of RNA isolationby acid guanidinium thiocyanate-phenol-chloroform extraction. Anal.Biochem. 162:156–159.
Clarke, G. M. 1993. The genetic basis of developmental stability. I. Rela-tionships between stability, heterozygosity and genomic coadaptation.Genetica. 89:15–23.
Colosimo, P. F., K. E. Hosemann, S. Balabhadra, G. Villarreal Jr., M. Dickson,J. Grimwood, J. Schmutz, R. M. Myers, D. Schluter, and D. M. Kingsley.
EVOLUTION FEBRUARY 2019 3 8 7

M. R. J. MORRIS ET AL.
2005. Widespread parallel evolution in sticklebacks by repeated fixationof ectodysplasin alleles. Science 307:1928–1933.
De Coster, G., S. Van Dongen, P. Malaki, M. Muchane, A. Alcantara-Exposito, H. Matheve, and L. Lens. 2013. Fluctuating asymmetry andenvironmental stress: understanding the role of trait history. PLoS One8:e57966.
Delph, L. F., and J. K. Kelly. 2014. On the importance of balancing selectionin plants. New Phytol. 201:45–56.
Elshire, R. J., J. C. Glaubitz, Q. Sun, J. A. Poland, K. Kawamoto, E. S. Buckler,and S. E. Mitchell. 2011. A robust, simple Genotyping-by-Sequencing(GBS) approach for high diversity species. PLoS One 6:e19379.
Gibson, G., and I. Dworkin. 2004. Uncovering cryptic genetic variation. Na-ture Rev. Genet. 5:681–690.
Hohenlohe, P. A., S. Bassham, P. D. Etter, N. Stiffler, E. A. Johnson, and W. A.Cresko. 2010. Population genomics of parallel adaptation in threespinestickleback using sequenced RAD tags. PLoS Genet 6:e1000862.
Jones, F. C., M. G. Grabherr, Y. F. Chan, P. Russell, E. Mauceli, J. Johnson,R. Swofford, M. Pirun, M. C. Zody, S. White, et al. 2012. The ge-nomic basis of adaptive evolution in threespine stickleback. Nature 484:55–61.
Kark, S., U. N. Safriel, C. Tabarroni, and E. Randi. 2001. Relationship be-tween heterozygosity and asymmetry: a test across the distribution range.Heredity 86:119–127.
Le Rouzic, A., K. Østbye, T. O. Klepaker, T. F. Hansen, L. Bernatchez,D. Schluter, and L. A. Vøllestad. 2011. Strong and consistent naturalselection associated with armour reduction in sticklebacks. Mol. Ecol.20:2483–2493.
Leary, R. F., F. W. Allendorf, and R. L. Knudson. 1983. Developmentalstability and enzyme heterozygosity in rainbow trout. Nature 301:71–72.
———. 1984. Superior developmental stability of heterozygotes of enzymeloci in salmonid fishes. Am. Nat. 124:540–551.
Lerner, I. M. 1954. Genetic homeostasis. John Wiley & Sons, Inc, New York,NY.
Leung, B., M. R. Forbes, and D. Houle. 2000. Fluctuating asymmetry as abioindicator of stress: comparing efficacy of analyses involving multipletraits. Am. Nat. 155:101–115.
Loehr, J., G. Herczeg, T. Leinonen, A. Gonda, S. Van Dongen, and J.Merila. 2013. Asymmetry in threespine stickleback lateral plates.J. Zool. 289:279–284.
Loehr, J., T. Leinonen, G. Herczeg, R. B. O’Hara, and J. Merila. 2012. Heri-tability of asymmetry and lateral plate number in the threespine stickle-back. PLoS One 8:e39843.
Lucek, K., M. P. Haesler, and A. Sivasundar. 2012. When phenotypes donot match genotypes—unexpected phenotypic diversity and potentialenvironmental constraints in Icelandic stickleback. J. Hered. 103:579–584.
McGuigan, K., N. Nishimura, M. Currey, D. Hurwit, and W. A. Cresko.2011. Cryptic genetic variation and body size evolution in threespinestickleback. Evolution 65:1203–1211.
Møller, A. P., and J. P. Swaddle. 1997. Asymmetry, developmental stability,and evolution. Oxford Univ. Press, New York, NY.
Morris, M. R. J., Petrovitch, E., Bowles, E., Jamniczky, H. A., and S. M.Rogers. 2017. Exploring Jordan’s rule in Pacific three-spined sticklebackGasterosteus aculeatus. F. Fish Biol. 91:645–663.
Morris, M. R. J., Bowles, E., Allen, B. E., Jamniczky, H. A., and S. M. Rogers.2018. Contemporary ancestor? Adaptive divergence from standing ge-netic variation in Pacific marine threespine stickleback. BMC Evol. Biol.18:113.
O’Brown, N. M., B. R. Summers, F. C. Jones, S. D. Brady, and D. M. Kings-ley. 2015. A recurrent regulatory change underlying altered expression
and Wnt response of the stickleback armor plates gene EDA. eLife4:e05290.
Palmer, A. R., and C. Strobeck. 1986. Fluctuating asymmetry: measurement,analysis, patterns. Ann. Rev. Ecol. Syst. 17:391–421.
Pardo-Diaz, C., C. Salazar, and C. D. Jiggins. 2015. Towards the identificationof the loci of adaptive evolution. Methods Ecol. Evol. 6:445–464.
Parsons, P. A. 1990. Fluctuating asymmetry: an epigenetic measure of stress.Biol. Rev. Camb. Philos. Soc. 65:131–145.
Peichel, C. L., J. A. Ross, C. K. Matson, M. Dickson, J. Grimwood, J. Schmutz,R. M. Myers, S. Mori, D. Schluter, and D. M. Kingsley. 2004. The mastersex-determination locus in threespine sticklebacks is on a nascent Ychromosome. Curr. Biol. 14:1416–1424.
Purcell, S., B. Neale, K. Todd-Brown, L. Thomas, M. A. R. Ferreira, D.Bender, J. Maller, P. Sklar, P. I. W. de Bakker, M. J. Daly, et al. 2007.PLINK: a toolset for whole-genome association and population-basedlinkage analysis. Am. J. Hum. Genet. 81:559-575
R Core Team. 2016. R: A language and environment for statistical com-puting. R Foundation for Statistical Computing, Vienna, Austria.https://www.R-projects.org
Reimchen, T. E. 1983. Structural relationships between spines and lateralplates in threespine stickleback (Gasterosteus aculeatus). Evolution37:931–946.
Reimchen, T. E., and C. A. Bergstrom. 2009. The ecology of asymmetry instickleback defense structures. Evolution 63:115–126.
Reimchen, T. E., T. Ingram, and S. C. Hansen. 2008. Assessing niche differ-ences of sex, armour and asymmetry phenotypes using stable isotopeanalyses in Haida Gwaii sticklebacks. Behaviour 145:561–577.
Reimchen, T. E., and P. Nosil. 2001. Lateral plate asymmetry, diet, and para-sitism in threespine stickleback. J. Evol. Biol. 14:632–645.
Roldan, E. R. S., J. Cassinello, T. Abaigar, and M. Gomendio. 1998. In-breeding, fluctuating asymmetry, and ejaculate quality in an endangeredungulate. Proc. R. Soc. Lond. B 265:243–248.
Schluter, D., and G. L. Conte. 2009. Genetics and ecological speciation. Proc.Natl. Acad. Sci. 106:9955–9962.
Sefcek, J. A., and J. E. King. 2007. Chimpanzee facial symmetry: a biometricmeasure of chimpanzee health. Am. J. Primatol. 69:1257–1263.
Stoffel, M. A., M. Esser, M. Kardos, E. Humble, H. Nichols, P. David,and J. I. Hoffman. 2016. inbreedR: an R package for the analysis ofinbreeding based on genetic markers. Methods Ecol. Evol. 7:1331–1339.
Stone, G. N., S. Nee, and J. Felsenstein. 2011. Controlling for nonindepen-dence in comparative analysis of patterns across populations withinspecies. Philos. Trans. R Soc. Lond. B Biol. Sci. 336: 1410–1424.
Taylor, D. S. 2001. Physical variability and fluctuating asymmetry in het-erozygous and homozygous populations of Rivulus marmoratus. Can. J.Zool. 79:766–778.
Trokovic, N., G. Herczeg, N. I. Ab Ghani, T. Shikano, and J. Merila. 2012.High levels of fluctuating asymmetry in isolated stickleback populations.BMC Evol. Biol. 12:115.
Ujvari, B., M. Klaassen, N. Raven, T. Russell, M. Vittecoq, R. Hamede, F.Thomas, and T. Madsen. 2018. Genetic diversity, inbreeding, and cancer.Proc. R Soc. Lond. B 285:20172589.
Van Dongen, S., and S. W. Gangestad. 2011. Human fluctuating asymmetryin relation to health and quality: a meta-analysis. Evol. Hum. Behav.32:380–398.
Van Dongen, S., L. Lens, E. Pape, F. A. M. Volckaert, and J. A. M. Raeymaek-ers. 2009. Evolutionary history shapes the association between develop-mental instability and population-level genetic variation in three-spinedsticklebacks. J. Evol. Biol. 22:1695–1707.
Van Valen, L. 1962. A study of fluctuating asymmmetry. Evolution 16:125–142.
3 8 8 EVOLUTION FEBRUARY 2019

HETEROZYGOSITY AND ASYMMETRY
Vøllestad, L. A., K. Hindar, and A. P. Møller. 1999. A meta-analysis offluctuating asymmetry in relation to heterozygosity. Heredity 83:206–218.
Withler, R. E., and J. D. McPhail. 1985. Genetic variability in freshwater andanadromous sticklebacks (Gasterosteus aculeatus) of southern BritishColumbia. Can. J. Zool. 63:528–533.
Wu, T. D., and C. K. Watanabe. 2005. GMAP: a genomic mapping and align-ment program for mRNA and EST sequences. Bioinformatics 21:1859–1875.
Associate Editor: J. JensenHandling Editor: M. Servedio
Supporting InformationAdditional supporting information may be found online in the Supporting Information section at the end of the article.
Table S1. Average numbers of plates, and the number of fish with each possible genotype-phenotype combination per population.Table S2. Number of stickleback with a given Eda genotype for different ranges of plate counts (presented as average of left and right counts).Table S3. Proportion of plates three through nine that contacted a dorsal basal plate (DBP1 or DBP2) and/or the ascending process (AP).Table S4. Results of two-way ANOVA, testing (top) the effects of sex and population on asymmetry, and (bottom) the effects of Eda genotype andpopulation of origin on standardized multilocus heterozygosity.Table S5. Results of Welch’s t-tests for significant deviations from means of 0 for signed positional asymmetry for all samples, individual populations,Eda genotypes, sexes, and plate type (anterior P1–P3 or posterior P8–P30 nonstructural plates, or structural plates P4–P7), or signed total plate countasymmetry for all samples. Significance was set at α = 0.003.Table S6. Population averages for number of asymmetric positions per individual, loci sequenced per individual, and standardized multi-locus heterozy-gosity (sMLH).Figure S1. Frequencies of stickleback that exhibited symmetrical presence (blue), symmetrical absence (green), or asymmetrical absence (red) of platesper plate position.Figure S2. Proportion of fish from each Eda genotype displaying symmetric loss (dashed line) or asymmetric loss (solid line) of plates, for each plateposition.Figure S3. Mean (+SE) for (A) observed heterozygosity and (B) standardized multilocus heterozygosity (sMLH), per population.Figure S4. The relationship between standardized multilocus heterozygosity (sMLH) and positional asymmetry, for each population. See text for meaningsof abbreviations.Table 1. Number of phenotypic variants for plates P1 to P9, including positional asymmetry and relational asymmetry.Figure 1. The number of individuals exhibiting different degrees of relational asymmetry per population.Figure 2. The proportion of fish exhibiting relational asymmetry for each plate position.Figure 3. (A) Structural relational asymmetry and sMLH; (B) nonstructural relational asymmetry and sMLH.
EVOLUTION FEBRUARY 2019 3 8 9