Embed Size (px)
Citation preview
HETA 91-257-2184 NIOSH INVESTIGATORS:MARCH 1992 Alan Echt, MPH, CIHOHIO CIVIL RIGHTS COMMISSION Thomas G. Wilcox, MD, MS200 GOODALL COMPLEX Michael S. Crandall, MS, CIHCINCINNATI, OHIO Kenneth F. Martinez, MS
I. SUMMARY
On June 13 and 24, and September 25, 1991, the National Institute for OccupationalSafety and Health (NIOSH) conducted a health hazard evaluation at the Ohio CivilRights Commission (OCRC) office in the Goodall Complex, Cincinnati, Ohio. Thishealth hazard evaluation was conducted in response to an employer request toinvestigate the cause of employee complaints of poor indoor air quality.
An investigation, conducted on June 13, 1991, included a physical inspection of the airhandling units located above the ceiling in the second floor west, third floor east, andthird floor west; a walkthrough of the second, third, and fourth floors; and a review ofdrawings and specifications for the air handling system. One bulk sample of insulativeliner was collected from the inside of the air handling unit on third floor west formicrobiological analysis. During that visit, five of the eight OCRC investigatorspresent on the day of the visit, two management, and two clerical personnel wereinterviewed. Questionnaires inquiring about health and comfort symptomsexperienced while in the building were distributed during the follow up visit on June24, 1991.
During the June 24, 1991 investigation, carbon dioxide concentrations, temperature,and relative humidity were measured in six locations inside the building. Measurements of outdoor conditions were made as well. Six rounds of sampling wereconducted. Carbon dioxide concentrations rose from a mean of 366 ppm prior to theemployees' arrival to a mean of 638 ppm in the afternoon. Temperatures ranged from69.9 °F to 75.3 °F, with a mean of 73.0 °F. Relative humidity measurements rangedfrom 51.5% to 75.5%. Mean relative humidity was 66.3%. Sterile gauze pads wereused to collect surface wipe samples for analysis of fungi. Sampling for bioaerosolswas conducted at various locations in the OCRC offices using an Andersen two-stageviable cascade impactor. On September 25, 1991, a second round of sampling forbioaerosols was conducted as described above.
The results of interviews and questionnaires revealed that over half the employeeshave experienced symptoms such as nasal congestion, headaches, or eye irritationwhile in the building. These symptoms were more frequent for employees on the thirdfloor and on fourth floor west. These symptoms had improved since changes to theventilation system increased the outside air flow, but were still considered a problemby some employees. A major concern of many employees was the high humiditychronically present in the building during the late spring, summer and early fall. Manyworkers reported that they would set the thermostat control at as low a temperature aspossible in an attempt to decrease the humidity.
This evaluation found excessive humidity in the office space, water- damaged carpet,signs of water incursion through walls and around windows, and deficiencies in theventilation system. The filters for the outside air supply fit poorly and could allowdust from the outside to go around the filters and thus permit entrance of organicmaterial into the air handling system. Significant moisture blowby of the cooling coilswas also observed. Evidence of prior flooding was noted in one of the air handlingunits. Thus the system had moisture and nutrients within it that could allow microbialgrowth on the porous insulation or other surfaces within the ventilation system. In
This Health Hazard Evaluation (HHE) report and any recommendations made herein are for the specific facility evaluated and may not be universally applicable. Any recommendations made are not to be considered as final statements of NIOSH policy or of any agency or individual involved. Additional HHE reports are available at http://www.cdc.gov/niosh/hhe/reports
This Health Hazard Evaluation (HHE) report and any recommendations made herein are for the specific facility evaluated and may not be universally applicable. Any recommendations made are not to be considered as final statements of NIOSH policy or of any agency or individual involved. Additional HHE reports are available at http://www.cdc.gov/niosh/hhe/reports
This Health Hazard Evaluation (HHE) report and any recommendations made herein are for the specific facility evaluated and may not be universally applicable. Any recommendations made are not to be considered as final statements of NIOSH policy or of any agency or individual involved. Additional HHE reports are available at http://www.cdc.gov/niosh/hhe/reports
This Health Hazard Evaluation (HHE) report and any recommendations made herein are for the specific facility evaluated and may not be universally applicable. Any recommendations made are not to be considered as final statements of NIOSH policy or of any agency or individual involved.
This Health Hazard Evaluation (HHE) report and any recommendations made herein are for the specific facility evaluated and may not be universally applicable. Any recommendations made are not to be considered as final statements of NIOSH policy or of any agency or individual involved. Additional HHE reports are available at http://www.cdc.gov/niosh/hhe/reports
applicable. Any recommendations made are not to be considered as final statements of NIOSH policy or of any agency or individual involved. Additional HHE reports are available at http://www.cdc.gov/niosh/hhe/reports
On the basis of the data obtained during thisinvestigation, the NIOSH investigators did not findclear evidence that employee respiratory symptoms werecaused by building contaminants. However, conditionsin the air handling system and building interior whichfavor microbial growth, such as high humidity, shouldbe corrected. Recommendations are contained in SectionVIII.
addition, signs of exuberant microbial growth (yeast, etc.) were found on portions ofthe airhandler insulation. Microbial air sampling did not detect large amounts ofviable airborne organisms within the building at the time of sampling, but did detectoccasional colonies of thermophylic actinomycetes, a type of organism welldocumented to be capable of producing allergic respiratory disease when present insufficient concentrations. There was no clear evidence that the employees' respiratorysymptoms were caused by building contaminants. However, the presence of thethermophilic actinomycetes within this building raise concern that these organismscould have been present in higher amounts at other times.
Keywords: SIC 9441 (Administration of Social, Manpower, and Income MaintenancePrograms), indoor air quality, bioaerosols, thermophilic actinomycetes
Page 3 - Health Hazard Evaluation Report No. 91-257
II. INTRODUCTION
On June 13 and 24, and September 25, 1991, the National Institute for OccupationalSafety and Health (NIOSH) conducted a health hazard evaluation at the Ohio CivilRights Commission (OCRC) office in the Goodall Complex, Cincinnati, Ohio. Thishealth hazard evaluation was conducted in response to an employer request toinvestigate the cause of employee complaints of poor indoor air quality. An interimletter dated September 4, 1991, reported the results of the June 13 and 24 visits. Theresults of air, surface wipe, and bulk sampling for microorganisms, which were notavailable at that time, are presented in this report.
III. BACKGROUND
The OCRC moved to its present location in 1985. The Commission leases three floorsof an office building which was newly renovated when occupied. The OCRCinvestigates complaints of civil rights violations. Conduct of these investigationsrequires investigators to spend a portion of their time out of the office. There are 25employees, six male and 19 female. The heating, ventilating and air-conditioning(HVAC) system is maintained by the building management and serviced by acontractor. Smoking is not permitted in the Commission's office space pending thecompletion of a smoking lounge.
Complaints began following water leaks from condensate pans in the air handling unitson third floor east and third floor west beginning in August, 1990. These leaksresulted in damp carpeting in these areas. The carpeting remained damp for aboutthree weeks prior to being cleaned and treated. Prior to this investigation, indoor airquality surveys had been performed by a private consultant on February 21 and March11, 1991, and on two occasions by the Ohio Industrial Commission, the most recent ofwhich was on March 14, 1991. The private consultant found,"...a slightly elevatedlevel of carbon dioxide (1000 ppm) in the building," and concluded that employeecomplaints were most likely the result of, "...the intake of kitchen grill and deep-fryingfumes, vapors and gases" from the exhaust of a restaurant located on the ground floorof the building. On his second visit, the Ohio Industrial Commission industrialhygienist found that switching the operation of fans in the air handling units fromthermostat-based cyclical operation to constant operation resulted in carbon dioxideconcentrations from 300 to 800 parts per million, a reduction from the concentration of1000 ppm found by the private consultant.
A physician with the Occupational Health Clinic at the University of CincinnatiMedical Center evaluated three employees after the leak. As a result of thisevaluation, the physician stated that, "It is my opinion that there is no question but thatthere are problems with indoor air pollution in the facility." The physicianrecommended that, "...further air testing be done and also that cultures be done for totalfungal counts, colony counts, and bacteria."
IV. MATERIALS AND METHODS
A. INDUSTRIAL HYGIENE EVALUATION
Page 4 - Health Hazard Evaluation Report No. 91-257
† Aggressive sampling means collecting samples while twoNIOSH investigators stomped around on the water-stainedcarpeting attempting to aerosolize viable particulates.
The environmental portion of the indoor air quality investigation conducted onJune 13, 1991 included a physical inspection of the air handling units locatedabove the ceiling on second floor west, third floor east, and third floor west, awalkthrough of the second, third, and fourth floors, and a review of drawings andspecifications for the air handling system. In addition, one bulk sample ofinsulation discolored by a white powdery substance was collected from theinsulation lining the inside of the air handling unit on third floor west.
On June 24, 1991, carbon dioxide concentrations, temperature, and relativehumidity were measured in 6 locations inside the building. Measurements weremade outside the building as well. Six rounds of sampling were conducted, thefirst beginning at 6:30 a.m., followed by subsequent sampling rounds beginning at8:27 a.m., 9:38 a.m., 11:27 a.m., 1:33 p.m., and 2:42 p.m. Carbon dioxide wasmeasured using a Gastech RI 411 carbon dioxide monitor (Gastech, Inc., Newark,CA) calibrated before and after the day's samples were collected using 800 partsper million (ppm) carbon dioxide in nitrogen (Alphagaz, Division of Liquid AirCorporation, Cambridge, MD) as a calibrant. Temperature and relative humiditywere measured using a Vaisala HM 34 humidity and temperature meter (VaisalaOy, Helsinki, Finland). Sterile gauze pads were used to collect surface wipesamples for analysis of surface fungi. Samples were collected from the followinglocations: return air grilles on third floor west, a return air grille on third flooreast, and a supply diffuser on third floor east.
On June 24, 1991, sampling for bioaerosols was conducted at various locations inthe OCRC offices using an Andersen two-stage viable cascade impactor at a flowrate of 28.3 liters per minute (lpm). The 50 percent effective cutoff diameter forthe Andersen sampler is eight micrometers (µm); hence, larger, nonrespirableparticles are collected on the top stage and smaller, respirable particles arecollected on the bottom stage. Standard Plate Count and Malt Extract agars wereused for the enumeration of bacteria and fungi, respectively. The sample platesfor bacteria and fungi were incubated at 28 °C. A sampling time of ten minuteswas used at each sample location. At one sample location, the office on thirdfloor east with the water-stained carpeting, aggressive sampling was performed inan attempt to aerosolize and collect viable particles from water stained areas.† Sampling locations included:
Second floor east (on file cabinets by copier)Third floor west (in office with water stained carpet)Third floor east (in office with water stained carpet)Fourth floor east (conference room center)Fourth floor west (conference room center)Third floor east (aggressive sampling in office with water stained carpet)Second floor west (center of hall formed by partitions)Outside (Fourth floor fire escape landing, as a control)
Page 5 - Health Hazard Evaluation Report No. 91-257
* When referring to sampling for bioaerosols, the word sample denotestwo plates, one top, and one bottom. Thus, one sample equals twoplates, two samples equals four plates, and so on.
At each location, two samples were collected for bacteria and two samples werecollected for fungi with the exception of second floor east, where one sample wascollected for bacteria, and one sample was collected for fungi. Outside, threesamples were collected for each bioaerosol.* Temperature and relative humiditywere also recorded for each sample collection period.
On September 25, 1991, a second round of sampling for bioaerosols wasconducted as described above. The sample plates for bacteria were incubated at55 °C to promote the growth of thermotolerant bacteria (specifically, thermophilicactinomycetes). The sample plates for fungi were incubated at 28 °C. A sampletime of ten minutes was used at all sample locations. Sampling locations includedthe following:
Fourth floor west (conference table)Fourth floor east (conference table)Third floor west (center of round table in empty office)Third floor east (on table in office with water stained carpet)Outside (on the fourth floor fire escape landing, used as a control)Second floor west (center of room)Second floor east (on top of file cabinets by copier)
For each location, four samples were collected for thermophilic bacteria and twosamples were collected for fungi with the exception of second floor east, whereonly two thermophilic bacteria samples, and no fungal samples were collected. No aggressive sampling was performed. Temperature and relative humidity wererecorded for each sample collection period.
B. MEDICAL EVALUATION
At the time of the initial site visit on June 13, 1991, there were ten investigators,three supervisors, two managers, and seven clerical personnel employed in theoffice which occupied the second, third, and fourth floors of the building. Duringthat visit, five of the eight investigators present on the day of the visit, twomanagement and two clerical personnel were interviewed. Questionnairesinquiring about symptoms experienced while in the building were distributedduring the follow up visit on June 24, 1991.
V. EVALUATION CRITERIA
As a guide to the evaluation of the hazards posed by workplace exposures, NIOSHfield staff employ environmental evaluation criteria for the assessment of a number ofchemical and physical agents. These criteria are intended to suggest levels of exposureto which most workers may be exposed from eight to ten hours a day, forty hours aweek, for a working lifetime without experiencing adverse health effects. However, itis important to note that not all workers will be protected from adverse health effects iftheir exposures are maintained below these levels. A small percentage may experience
Page 6 - Health Hazard Evaluation Report No. 91-257
adverse health effects because of individual susceptibility, a pre-existing medicalcondition, and/or a hypersensitivity (allergy). In addition, some hazardous substancemay act in combination with other workplace exposures, the general environment, orwith medications or personal habits of the worker to produce health effects even if theoccupational exposures are controlled to the level set by the evaluation criteria. Also,some substances are absorbed by direct contact with the skin and mucous membranes,thus potentially increasing the overall exposure. Finally, evaluation criteria maychange over the years as new information on the toxic effects of an agent becomeavailable.
The primary sources of environmental evaluation criteria for the work place are: 1)NIOSH Criteria Documents and Recommended Exposure Limits (RELs), 2) theAmerican Conference of Governmental Industrial Hygienists' (ACGIH) ThresholdLimit Values (TLVs), and 3) the US Department of Labor, Occupational Safety andHealth Administration (OSHA) Permissible Exposure Limits (PELs).1-3 The OSHAPELs may be required to take into account the feasibility of controlling exposures invarious industries where the agents are used; in contrast, the NIOSH-recommendedexposure limits are primarily based upon the prevention of occupational disease. Inevaluating the exposure levels and the recommendations for reducing those levelsfound in this report, it should be noted that industry is legally required to meet thoselevels specified by an OSHA PEL.
A time-weighted average exposure level (TWA) refers to the average airborneconcentration of a substance during a normal eight to ten hour workday. Somesubstances have recommended short-term exposure limits or ceiling values which areintended to supplement the TWA where there are recognized toxic effects from briefhigh exposures.
A. Indoor Air Quality
A number of published studies have reported high prevalences of symptomsamong occupants of office buildings.4-8 NIOSH investigators have completedover 700 investigations of the indoor environment in a wide variety of settings. The majority of these investigations have been conducted since 1979.
The symptoms and health complaints reported by building occupants have beendiverse and usually not suggestive of any particular medical diagnosis or readilyassociated with a causative agent. A typical spectrum of symptoms has includedheadaches, unusual fatigue, varying degrees of itching or burning eyes, irritationsof the skin, nasal congestion, dry or irritated throats and other respiratoryirritations. Typically, the workplace environment has been implicated becauseworkers report that their symptoms lessen or resolve when they leave thebuilding.
Scientists investigating indoor environmental problems believe that there aremultiple factors contributing to building-related occupant complaints.9,10 Amongthese factors are imprecisely defined characteristics of heating, ventilating, andair-conditioning (HVAC) systems, cumulative effects of exposure to lowconcentrations of multiple chemical pollutants, odors, elevated concentrations ofparticulate matter, microbiological contamination, and physical factors such asthermal comfort, lighting, and noise.11-16 Reports are not conclusive as to whether
Page 7 - Health Hazard Evaluation Report No. 91-257
increases of outdoor air above currently recommended amounts ($15 cubic feetper minute per person) are beneficial.17,18 However, rates lower than theseamounts appear to increase the rates of complaints and symptoms in somestudies.19,20 Design, maintenance, and operation of HVAC systems are critical totheir proper functioning and provision of healthy and thermally comfortableindoor environments. Indoor environmental pollutants can arise from eitheroutdoor sources or indoor sources.21
There are also reports describing results which show that occupant perceptions ofthe indoor environment are more closely related to the occurrence of symptomsthan the measurement of any indoor contaminant or condition.22-24 Some studieshave shown relationships between psychological, social, and organizationalfactors in the workplace and the occurrence of symptoms and comfortcomplaints.24-27
Less often, an illness may be found to be specifically related to something in thebuilding environment. Some examples of potentially building-related illnessesare allergic rhinitis, allergic asthma, hypersensitivity pneumonitis, Legionnaires'disease, Pontiac fever, carbon monoxide poisoning, and reaction to boilercorrosion inhibitors. The first three conditions can be caused by variousmicroorganisms or other organic material. Legionnaires' disease and Pontiacfever are caused by Legionella bacteria. Sources of carbon monoxide includevehicle exhaust and inadequately ventilated kerosene heaters or other fuel-burning appliances. Exposure to boiler additives can occur if boiler steam is usedfor humidification or is released by accident.
Problems NIOSH investigators have found in the non-industrial indoorenvironment have included poor air quality due to ventilation system deficiencies,overcrowding, volatile organic chemicals from office furnishings, machines,structural components of the building and contents, tobacco smoke,microbiological contamination, and outside air pollutants; comfort problems dueto improper temperature and relative humidity conditions, poor lighting, andunacceptable noise levels; adverse ergonomic conditions; and job-relatedpsychosocial stressors. In most cases, however, no cause of the reported healtheffects could be determined.
Standards specifically for the non-industrial indoor environment do not exist. NIOSH, the Occupational Safety and Health Administration (OSHA) and theAmerican Conference of Governmental Industrial Hygienists (ACGIH) havepublished regulatory standards or recommended limits for occupationalexposures.1-3 With few exceptions, pollutant concentrations observed in the officework environment fall well below these published occupational standards orrecommended exposure limits. The American Society of Heating, Refrigerating,and Air-Conditioning Engineers (ASHRAE) has published recommendedbuilding ventilation design criteria and thermal comfort guidelines.28-29 TheACGIH has also developed a manual of guidelines for approaching investigationsof building-related complaints that might be caused by airborne living organismsor their effluents.30
Measurement of indoor environmental contaminants has rarely proved to behelpful, in the general case, in determining the cause of symptoms and complaints
Page 8 - Health Hazard Evaluation Report No. 91-257
except where there are strong or unusual sources, or a proved relationshipbetween a contaminant and a building-related illness. However, measuringventilation and comfort indicators such as carbon dioxide (CO2), and temperatureand relative humidity, is useful in the early stages of an investigation in providinginformation relative to the proper functioning and control of HVAC systems. Thebasis for the measurements made in this investigation are presented below.
1. Carbon Dioxide (CO2)
CO2 is a normal constituent of exhaled breath and, if monitored, may beuseful as a screening technique to evaluate whether adequate quantities offresh air are being introduced into an occupied space. The ASHRAEStandard 62-1989, Ventilation for Acceptable Indoor Air Quality,recommends outdoor air supply rates of 20 cubic feet per minute per person(cfm/person) for office spaces and conference rooms, 15 cfm/person forreception areas, and 60 CFM/person for smoking lounges, and providesestimated maximum occupancy figures for each area.28
Indoor CO2 concentrations are normally higher than the generally constantambient CO2 concentration (range 300-350 ppm). When indoor CO2concentrations exceed 1000 ppm in areas where the only known source isexhaled breath, inadequate ventilation is suspected. Elevated CO2concentrations suggest that other indoor contaminants may also be increased.
2. Temperature and Relative Humidity
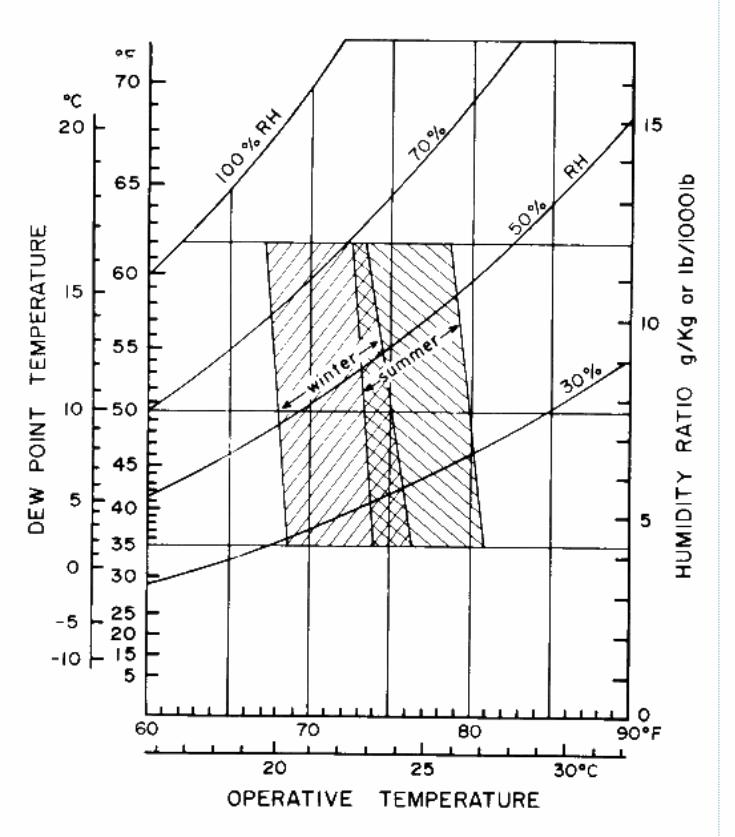
The perception of comfort is related to one's metabolic heat production, thetransfer of heat to the environment, physiological adjustments, and bodytemperatures. Heat transfer from the body to the environment is influencedby factors such as temperature, humidity, air movement, personal activities,and clothing. ANSI/ASHRAE Standard 55-1981 specifies conditions inwhich 80% or more of the occupants would be expected to find theenvironment thermally comfortable.29
B. Microbial Aerosols
Neither NIOSH nor OSHA has developed recommendations or standards forairborne microbial contamination. NIOSH investigators have in the past, throughwork addressing airborne microbial contamination in office buildings, suggestedthat a level of viable microorganisms in excess of 1000 colony forming units percubic meter of sampled air (CFU/m3) indicates that the indoor environment maybe in need of further investigation and possible improvement. This level does notdifferentiate between the different classes of microorganisms (i.e., bacteria orfungi). However, levels above this do not indicate that the air is unsafe orhazardous. The presence of work-related illness can only be determined byepidemiological or medical studies.31
Even though microbiological contamination is not thought to be a common causeof health complaints, it can result in a potentially severe health condition knownas hypersensitivity pneumonitis. This respiratory problem can be caused by
Page 9 - Health Hazard Evaluation Report No. 91-257
**Saprophytic organisms live on dead or decaying organic matter.
bacteria, fungi, protozoa, or microbial products that may originate incontaminated ventilation system components. A similar condition known ashumidifier fever is also the result of microbiological contamination of ventilationsystems.
The Committee on Bioaerosols of the ACGIH has developed guidelines for theassessment and sampling of saprophytic bioaerosols in the indoor environment.30** These guidelines indicate that straightforward remedial action can resolve mostproblems where visible microbial contamination is evident. Because mostmicrobial contamination problems in office environments have been associatedwith moisture incursion problems in heating, ventilating, and air conditioning(HVAC) systems, remedial actions have focused on elimination or control ofthese moisture problems. In previous NIOSH investigations, microbiologicalcontamination has been found to have resulted from water damage to carpets orfurnishings, or from standing water in ventilation system components.
The question of significant risk is difficult to assess for any bioaerosol. Whereinfectious agents are involved (e.g. Legionella), some information is available onbacterial levels in reservoirs that have been associated with outbreaks of disease.30 However, for the majority of organisms likely to be recovered during routine airand source sampling, very little is known about potential health effects. Usuallyit is possible only to establish whether or not an unusual exposure situation existswith respect to other environments.30 Therefore, in cases where air sampling formicroorganisms is warranted, NIOSH investigators typically utilize a samplingstrategy based upon comparison of complaint to non-complaint and/or outdoor airenvironments.
VI. RESULTS
A. ENVIRONMENTAL
The heating, ventilating, and air-conditioning (HVAC) system for the second,third, and fourth floor of the Goodall Complex consisted of six constant airvolume (CAV) air handlers, supply and return duct work, and thermostat controls(one thermostat per unit). The air handlers are made up of fan and condenser-coilunits located above the suspended ceiling.
There are two air handlers per floor, one located above and serving the easternhalf of the floor, the other located above and serving the western half of the floor. Design specifications noted on architectural drawings call for units in the easternportion of the building to provide 200 cubic feet per minute (cfm) of outside air,and units in the western portion of the building to provide 150 cfm of outside air. Based on the CO2 sampling results of a previous indoor air quality investigation,which indicated a need to increase the amount of outdoor air, fans in the units runconstantly. Each of the air handlers is designed to have the outside air and returnair filtered. Filters are scheduled to be changed every three months. Buildingmanagement had recently installed charcoal-impregnated filters in the airhandlers. These did not fit properly on the units inspected. The outside air intake
Page 10 - Health Hazard Evaluation Report No. 91-257
for the second floor, west, is ten feet from the exhaust outlet of a restaurant,resulting in a "greasy" odor in that portion of the building. This intake wasrelocated during the course of this investigation.
Physical inspections were performed on three units: second floor east, and thirdfloor, east and west. A muddy sediment was present in the condensate trough inthe unit on second floor east. A flashlight beam shone through the air downstream from the cooling coil showed that a fog of water droplets was beingcarried over from the coil. Patchy white and brown areas were present on theinsulative liner of the fan box, possibly indicating the presence of microbialgrowth. The unit on third floor west had a water line on the outside of the fanhousing, showing that the unit had flooded in the past, and a white, powderysubstance on the insulation lining the fan box. The unit on the third floor eastalso showed some evidence of microbial growth in the form of discoloredinsulation.
During the walk through, areas where the sub-floor had buckled (perhaps due tomoisture) were noted, as was evidence of water leaks around some of thewindows and on the carpeting underneath both of the air handling units on thethird floor.
The results of CO2 monitoring performed on June 24, 1991, are presented in table1. Carbon dioxide concentrations rose from a mean of 366 ppm prior to theemployees' arrival to a mean of 638 ppm for the round of sampling beginning at1:33 p.m. These results indicate that carbon dioxide levels remained below theASHRAE recommended limit of 1000 ppm.28 However, the number of occupantspresent during each round of sampling should be noted. If the HVAC system isperforming to design specifications (200 cfm of outdoor air for the eastern portionof the building and 150 cfm of outdoor air for the western portion), compliancewith ASHRAE guidelines of 20 cfm of outdoor air per person would limit thenumber of occupants in the eastern portion of each floor of the building to ten,and the western portion of each floor to seven.28 These results also demonstratethat in situations where occupant density is low, the concentration of CO2 may notbe an accurate index of overall indoor air quality.
Temperature and relative humidity levels are presented in table 2. Temperaturesranged from 69.9 °F to 75.3 °F, with a mean of 73.0 °F. The low temperature onthe fourth floor west in the late afternoon was the result of employees loweringthe thermostat setting in order to decrease the relative humidity. Relativehumidity measurements ranged from 51.5% to 75.5%. The mean relativehumidity was 66.3%. Again, the low relative humidity on fourth floor west in theafternoon was the result of the employees' action. In the afternoon, the relativehumidity outside of the building was as much as 37 percent lower than it wasinside. The mean temperature and relative humidity measurements indicate thatthese values (which result in a dewpoint temperature, estimated from apsychrometric chart, of approximately 61 °F) are within the limits of theASHRAE thermal comfort chart (figure 1).29 However, relative humidity inexcess of 70% is beyond the summer boundaries of the chart, as well as theboundaries recommended by ASHRAE 62-1989 of 30 - 60%.28,29 Thereforerelative humidity should be reduced.
Page 11 - Health Hazard Evaluation Report No. 91-257
The levels of fungi in the wipe samples were low or undetectable. Based uponthese results, there is no evidence of any significant fungal colonization on thesesurfaces. The insulation sample from the lining of the air handler on third floorwest, on the other hand, had a significant microbial load (1,000,000 CFU/gram). The predominant microbial species were yeasts rather than molds. These resultssuggest that a level of moisture sufficient to support microbial growth was presentat this site. Whether there is any particular risk associated with this situation isdifficult to determine from these results; although, compared to mold spores, theyeast would tend to be less able to become airborne in large numbers.32
The results of air sampling for microorganisms performed on June 24, 1991showed no evidence of any significant indoor reservoirs of bacteria or fungi. Noevidence of any microbes that might constitute a significant health risk weredetected. Outdoor air samples, collected at three different times, resulted in amean total fungal count of 273 CFU/m3. Cladosporium is generally the mostcommon fungal species found in outdoor air, and was also the most prominentfungal species identified in these outdoor samples. Also common were Alterneriaand Epicoccum, as well as smaller numbers of Penicillium and Chrysosporium. Asignificant concentration of yeasts were detected on the bacterial media at two ofthe sites. In general, the mold species identified were quite typical of outdoor air. The mean outdoor bacterial count was 77 CFU/m3. The presence of Grampositive cocci (i.e. Staphylococcus and Micrococcus species) is typical of airbornebacteria. Gram- negative rods (i.e. Pantoea agglomerans), generally observed aswater-borne organisms, were present as well.33
The indoor fungal counts were low when compared to the outdoor concentrations(less than one third of the outdoor levels). The highest fungal counts wereobserved for the aggressive samples taken in the third floor east office with thewater stained carpet; however, the species were qualitatively similar to outdoorair. For the majority of the indoor sites, Cladosporium was the most commonfungi found. However, Chrysosporium, Epicoccum, Chaetomium, andPenicillium were the prominent species on a select few of the sample plates. These select sample plates do not qualitatively conform to the results from theoutdoor samples. Nevertheless, the numbers were still very low and not indicativeof any significant indoor reservoirs.33
The indoor bacterial concentrations did not appear significantly different from theoutdoor concentrations. In indoor environments, considerable intra-day and inter-day variation in concentrations of airborne bacteria is common and generallyreflects the influence of human activity in the area that could contribute humansource bacteria (usually Gram-positive cocci) from skin and other body sites,rather than a building-related reservoir. The prominence of Gram negative rods(i.e. Pantoea, Enterobacter and Klebsiella) in some of these samples is somewhatatypical, but not totally unexpected considering the presence of Gram negativerods in the outdoor air samples.33
The sample results for thermophilic bacteria from September 25, 1991, indicatedlow concentrations of Thermoactinomyces present in all of the sampled locationswith the exception of the third floor east, second floor east, and outside. Theselow concentrations, ranging from 4 to 7 CFU/m3 were the result of one or twocolonies observed on a sampling plate. While Thermoactinomyces were found
Page 12 - Health Hazard Evaluation Report No. 91-257
only on indoor samples, the appearance of only one colony on an agar plate arenot typical of levels which have been implicated in cases of hypersensitivitypneumonitis. However, actinomycetes (both mesophilic and thermophilic) areunusual in a nonfarm, indoor environment, and their presence indicates the needfor remedial action.30 Bacillus species (normal soil-borne, spore-formingbacteria) were detected in very low amounts in most of the outdoor samples and afew of the indoor samples, probably as a result of airborne dust containingbacterial spores.34
Outdoor fungal samples showed relatively low total counts of only 136 and 114CFU/m3. Cladosporium, generally the most common fungal species found inoutdoor air, was also the most prominent fungal species identified in theseoutdoor samples. Also detected were smaller numbers of Penicillium,Chrysosporium, Aspergillus, and a few unidentified fungi and yeasts. In general,the fungal species identified were typical of outdoor air.34 Indoor fungal countswere qualitatively similar to the outdoor counts, with a predominance ofCladosporium. However, quantitatively, two of the sample sites (fourth floor eastand third floor west) had concentrations higher than those found outdoors (189and 193 CFU/m3, respectively), while three samples collected on fourth floorwest, and one sample collected on fourth floor east approximated outdoorconcentrations. The results of sampling at the remaining sampling sites were lessthan one third of the outdoor concentrations. The significance of the elevatedfungal levels is difficult to determine. While they were greater than one third ofthe outdoor concentrations, the numbers were low in absolute terms. Consideringthe temporal and spatial variations inherent in indoor air sampling, along with theabsence of any additional data suggesting a contaminated source, these elevatedconcentrations may have resulted from inefficient filtering of outside air by the airhandling units.34
B. MEDICAL
The interviews done during the first visit revealed that high humidity within theoffice space is a significant employee concern. The humidity was reported to behigh during the cooling season, especially following a heavy rain or when theoutside humidity is elevated. Several employees pointed out areas on the southwalls of the west wings of the third and fourth floors that showed signs of chronicwater leaks. Employees also described a three week period during August, 1990in which water constantly dripped out of diffusers in the east and west wings ofthe third floor causing the carpets under the two diffusers to remain wet for theduration of the episode. The water leak was reportedly the result of problemswith the condensate drain lines from the air handlers in both wings of the thirdfloor.
Odors were reported to episodically appear in the west wing of the fourth floor. The odor is most commonly described as a "locker room smell" and seems toappear during times of high humidity. Employees reported that the carpeting nearthe door to the fire escape on the fourth floor west occasionally became wetduring rainy weather due to water leaks under the door.
Three interviewed employees (and reportedly one other former employee) haveexperienced severe asthma-like symptoms associated with their presence in the
Page 13 - Health Hazard Evaluation Report No. 91-257
building. An occupational physician who evaluated three of these employees feltthat there were unidentified exposures within the building that exacerbated thesymptoms of these employees and that they should be transferred to anotheroffice. This physician also recommended that the OCRC offices be evaluated forthe presence of airborne fungi and bacteria. At the time of the survey, thesymptoms of the three had improved after the provision of additional fresh air or achange in work station location had been implemented.
Ten OCRC investigators, two supervisors, two management, and two clericalemployees participated during the initial visit interviews and/or completed thequestionnaires distributed during the second visit. These 16 workers reportedexperiencing the following symptoms when in the building: Seven with nasalcongestion or irritation, six with headaches, six with eye irritation, four withepisodic shortness of breath, three with lightheadedness, three with throatirritation, two with severe fatigue, two with impaired ability to concentrate, andtwo with nausea. The symptoms were most severe and frequent for occupants offour west and both wings of the third floor.
VII. CONCLUSIONS
The request was prompted by chronic complaints of many workers regarding concernsabout the indoor environmental quality and specific severe respiratory symptomsexperienced by four employees. Over half the employees reported experiencingsymptoms such as nasal congestion, headaches, or eye irritation. These symptomswere more frequent for employees on the third floor and on four west. Thesesymptoms had improved since the outside air flow in the ventilation system wasincreased, but they were still considered a problem by some employees. A majorconcern of many employees was the high humidity chronically present in the buildingduring the late spring, summer and early fall. Many workers reported that they wouldset the thermostat control at as low a temperature as possible to attempt to decrease thehumidity.
The occupational physician treating three of the individuals with respiratory symptomsfelt that their symptoms could be caused by contaminants within the Civil RightsCommission offices and advised a thorough environmental evaluation including anassessment of the possible presence of microorganisms. NIOSH interviewed threeemployees with a history of specific respiratory symptoms that were compatible withallergic reactions. All three reported their symptoms were exacerbated by presencewithin the Goodall building offices. A comprehensive environmental evaluation of theoffices by NIOSH found excessive humidity in the office space, water damaged carpet,signs of water incursion through walls and around windows and significantdeficiencies in the ventilation system. The filters for the outside air supply fit poorlyand could allow organic dust from the outside to go around the filters and thus allowentrance of organic nutrients into the air handling system. Significant moistureblowby of the cooling coils was also observed. Thus the system had moisture andnutrients within it that could allow microbial growth on the porous insulation or othersurfaces within the ventilation system. In addition, evidence of past flooding wasfound in one air handling unit and signs of exuberant microbial growth (yeast, etc.)were found on a portion of the insulation. Microbial air sampling did not detect largeamounts of viable airborne organisms within the building at the time of sampling, butdid detect occasional colonies of thermophylic actinomycetes, a type of organism well
Page 14 - Health Hazard Evaluation Report No. 91-257
documented to be capable of producing allergic respiratory disease when present insufficient concentrations. There was no clear evidence that the employee respiratorysymptoms were caused by building contaminants. However, the presence of thethermophilic actinomycetes within this building, which had demonstrated conditionsfavorable for microbial growth in the air handling system and in the offices (highhumidity and water damaged carpet), raise concern that these organisms could havebeen present in higher amounts at other times. It is not uncommon that organisms suchas actinomycetes bloom only intermittently in an indoor environment and low airborneconcentrations over only a two day period do not suggest that they are never present inharmful concentrations.
In situations where moisture incursions have occurred, it is generally advised thatmoisture-damaged furnishings be replaced and the conditions that allow moistureincursion be corrected. Therefore, it would be advisable for the water-damaged rugson the third and fourth floors to be replaced and the leaks in the walls repaired. Inaddition, the deficiencies in the ventilation system that caused high office humidityand conditions favorable for microbial proliferation in the air handling system shouldbe addressed.
VIII. RECOMMENDATIONS
The following recommendations may help to reduce complaints related to indoorenvironmental conditions:
1. Replace the charcoal-impregnated filters with the filters recommended by the airhandling units' manufacturer. Change the filters according to the manufacturer'srecommendations.
2. Replace porous insulation lining the fan boxes of the air handling units with non-porous insulation. Porous insulation, moisture, and a carbon source, such asorganic dust from outside air, are good conditions for the proliferation ofmicrobes. Consult the manufacturer for recommendations regarding selection ofa non-porous insulating material.
3. Clean the coils and condensate troughs/pans on a regular basis, according to themanufacturer's recommendations. The cleaning should be conducted on a yearlybasis at a minimum.
4. High relative humidity and water carryover from the coils may be the result ofexcess cooling capacity in the system. Although the fans run constantly, thecompressor does not, and it may not cycle with enough frequency to dehumidifythe air. Carryover of water from the coils may be the result of excessive fanspeeds. Persistent high relative humidity contributes to the growth ofmicroorganisms on damp surfaces. Consult the air handling units' manufacturerregarding the cause and solution of the high humidity.
5. Remove and replace water-damaged carpeting. This is generally recommended insituations where water damage has occurred. Water-damaged materials oftensupport microbial growth long after they appear dry, and dead materials (antigens,spores, toxins, and irritants) may remain in such materials for years. Carpet
Page 15 - Health Hazard Evaluation Report No. 91-257
cleaning is rarely effective in removing microbial contamination. Overuse ofdisinfectants can cause additional problems for occupants.30
6. Determine the cause of water incursions around windows and make necessaryrepairs to prevent it from recurring.
IX. REFERENCES
1. CDC (1988). NIOSH recommendations for occupational safety and healthstandards 1988. Atlanta, GA: U.S. Department of Health and Human Services,Public Health Service, Centers for Disease Control; National Institute forOccupational Safety and Health. MMWR 37 (supp. S-7).
2. ACGIH (1990). Threshold limit values and biological exposure indices for1990-1991. Cincinnati, OH: American Conference of Governmental IndustrialHygienists.
3. Code of Federal Regulations (1989). 29 CFR 1910.1000. Washington, DC: U.S. Government Printing Office, Federal Register.
4. Kreiss KK, Hodgson MJ [1984]. Building associated epidemics. In: Walsh PJ,Dudney CS, Copenhaver ED, eds. Indoor air quality. Boca Raton, FL: CRCPress, pp 87-108.
5. Gammage RR, Kaye SV, eds. [1985]. Indoor air and human health: Proceedings of the Seventh Life Sciences Symposium. Chelsea, MI: LewisPublishers, Inc.
6. Woods JE, Drewry GM, Morey PR [1987]. Office worker perceptions of indoorair quality effects on discomfort and performance. In: Seifert B, Esdorn H,Fischer M, et al, eds. Indoor air '87, Proceedings of the 4th InternationalConference on Indoor Air Quality and Climate. Berlin Institute for Water, Soiland Air Hygiene.
7. Skov P, Valbjorn O [1987]. Danish indoor climate study group. The "sick"building syndrome in the office environment: The Danish town hall study. Environ Int 13:399-349.
8. Burge S, Hedge A, Wilson S, Bass JH, Robertson A [1987]. Sick buildingsyndrome: a study of 4373 office workers. Ann Occup Hyg 31:493-504.
9. Kreiss K [1989]. The epidemiology of building-related complaints and illness. Occupational Medicine: State of the Art Reviews. 4(4):575-592.
10. Norbäck D, Michel I, Widstrom J [1990]. Indoor air quality and personal factorsrelated to the sick building syndrome. Scan J Work Environ Health. 16:121-128.
11. Morey PR, Shattuck DE [1989]. Role of ventilation in the causation of building-associated illnesses. Occupational Medicine: State of the Art Reviews. 4(4):625-642.
Page 16 - Health Hazard Evaluation Report No. 91-257
12. Mendell MJ, Smith AH [1990]. Consistent pattern of elevated symptoms in air-conditioned office buildings: A reanalysis of epidemiologic studies. Am J PublicHealth. 80(10):1193-1199.
13. Molhave L, Bachn B, Pedersen OF [1986]. Human reactions to low concentrations ofvolatile organic compounds. Environ Int 12:167-176.
14. Fanger PO [1989]. The new comfort equation for indoor air quality. ASHRAE J31(10):33-38.
15. Burge HA [1989]. Indoor air and infectious disease. Occupational Medicine: Stateof the Art Reviews. 4(4):713-722.
16. Robertson AS, McInnes M, Glass D, Dalton G, Burge PS [1989]. Buildingsickness, are symptoms related to the office lighting? Ann Occup Hyg 33(1):47-59.
17. Nagda NI, Koontz MD, Albrecht RJ [1991]. Effect of ventilation rate in a healthbuilding. In: Geshwiler M, Montgomery L, and Moran M, eds. Healthy buildings. Proceedings of the ASHRAE/ICBRSD conference IAQ'91. Atlanta, GA. TheAmerican Society of Heating, Refrigerating, and Air-Conditioning Engineers, Inc.
18. Menzies R, et al. [1991]. The effect of varying levels of outdoor ventilation onsymptoms of sick building syndrome. In: Geshwiler M, Montgomery L, and MoranM, eds. Healthy buildings. Proceedings of the ASHRAE/ICBRSD conferenceIAQ'91. Atlanta, GA. The American Society of Heating, Refrigerating, and Air-Conditioning Engineers, Inc.
19. Jaakkola JJK, Heinonen OP, Seppänen O [1991]. Mechanical ventilation in officebuildings and the sick building syndrome. An experimental and epidemiologicalstudy. Indoor Air 1(2):111-121.
Page 17 - Health Hazard Evaluation Report No. 91-257
20. Sundell J, Lindvall T, and Stenberg B [1991]. Influence of type of ventilation andoutdoor airflow rate on the prevalence of SBS symptoms. In: Geshwiler M,Montgomery L, and Moran M, eds. Healthy buildings. Proceedings of theASHRAE/ICBRSD conference IAQ'91. Atlanta, GA. The American Society ofHeating, Refrigerating, and Air-Conditioning Engineers, Inc.
21. Levin H [1989]. Building materials and indoor air quality. Occupational Medicine: State of the Art Reviews. 4(4):667-694.
22. Wallace LA, Nelson CJ, Dunteman G [1991]. Workplace characteristics associatedwith health and comfort concerns in three office buildings in Washington, D.C. In: Geshwiler M, Montgomery L, and Moran M, eds. Healthy buildings. Proceedings ofthe ASHRAE/ICBRSD conference IAQ'91. Atlanta, GA. The American Society ofHeating, Refrigerating, and Air-Conditioning Engineers, Inc.
23. Haghighat F, Donnini G, D'Addario R [1992]. Relationship between occupantdiscomfort as perceived and as measured objectively. Indoor Environ 1:112-118.
24. NIOSH [1991]. Hazard evaluation and technical assistance report: Library ofCongress Madison Building, Washington, D.C. Cincinnati, OH: U.S. Department ofHealth and Human Services, Public Health Service, Centers for Disease Control,National Institute for Occupational Safety and Health, NIOSH Report No. HETA 88-364-2104 - Vol. III.
25. Skov P, Valbjørn O, Pedersen BV [1989]. Influence of personal characteristics, job-related factors, and psychosocial factors on the sick building syndrome. Scand JWork Environ Health 15:286-295.
26. Boxer PA [1990]. Indoor air quality: A psychosocial perspective. J Occup Med 32(5):425-428.
27. Baker DB [1989]. Social and organizational factors in office building-associatedillness. Occupational Medicine: State of the Art Reviews. 4(4):607-624.
28. ASHRAE [1990]. Ventilation for acceptable indoor air quality. Atlanta, GA: American Society of Heating, Refrigerating, and Air-conditioning Engineers. ANSI/ASHRAE Standard 62-1989.
29. ASHRAE [1981]. Thermal environmental conditions for human occupancy. Atlanta,GA: American Society for Heating, Refrigerating, and Air-conditioning Engineers. ANSI/ASHRAE Standard 55-1981.
30. ACGIH [1989]. Guidelines for the assessment of bioaerosols in the indoorenvironment. Cincinnati, OH: American Conference of Governmental IndustrialHygienists.
31. Morey PR, Hodgson MJ, Sorenson WG, et al (1984). Environmental studies inmoldy office buildings: biological agents, sources and preventive measures. Ann.ACGIH 10:21-35.
Page 18 - Health Hazard Evaluation Report No. 91-257
32. Miller RD (1991). Report of December 19, 1991, to Alan Echt, NIOSH, regardinganalysis of surface fungi at the Ohio Civil Rights Commission offices, Goodallbuilding. Louisville, KY: University Microbiological Associates, Inc.
33. Miller RD (1991). Microbiological laboratory report dated August 13, 1991, forNIOSH, regarding analysis of airborne bacteria and fungi samples collected atthe Ohio Civil Rights Commission offices, Goodall building. Louisville, KY: University of Louisville, School of Medicine, Department of Microbiology andImmunology.
34. Miller RD (1991). Microbiology laboratory report dated November 15, 1991, forNIOSH, regarding analysis of samples for airborne thermotolerant bacteria andairborne fungi collected at the Ohio Civil Rights Commission offices, Goodallbuilding. Louisville, KY: University Microbiological Associates, Inc.
X. AUTHORSHIP AND ACKNOWLEDGEMENTS
Report Prepared by: Alan Echt, MPH, CIHIndustrial HygienistIndustrial Hygiene Section
Kenneth F. Martinez, MSIndustrial Hygiene EngineerIndustrial Hygiene Section
Thomas G. Wilcox, MD, MSMedical OfficerMedical Section
Michael S. Crandall, MS, CIHSupervisory Industrial HygienistIndustrial Hygiene Section
Field Assistance: Lori AbramsIndustrial HygienistIndustrial Hygiene Section
Page 19 - Health Hazard Evaluation Report No. 91-257
Analytical Support: Richard D. Miller, PhDUniversity Microbiological Associates, Inc.Louisville, Kentucky
Originating Office: Hazard Evaluation and Technical Assistance Branch
Division of Surveillance, Hazard Evaluations and Field Studies
XI. DISTRIBUTION AND AVAILABILITY OF REPORT
Copies of this report may be freely reproduced and are not copyrighted. Single copiesof this report will be available for a period of 90 days from the date of this report fromthe NIOSH Publications Office, 4676 Columbia Parkway, Cincinnati, Ohio 45226. Toexpedite your request, include a self-addressed mailing label along with your writtenrequest. After this time, copies may be purchased from the National TechnicalInformation Service, 5285 Port Royal Rd., Springfield, Virginia 22161. Informationregarding the NTIS stock number may be obtained from the NIOSH PublicationsOffice at the Cincinnati address.
Copies of this report have been sent to:
1. Cincinnati Regional Director, Ohio Civil Rights Commission2. Union Steward, Local 11, OCSEA3. Building Services Manager4. Department of Administrative Services, State of Ohio5. OSHA, Region V6. NIOSH
For the purpose of informing affected employees, copies of this report shall be postedby the employer in a prominent place accessible to the employees for a period of 30calendar days.
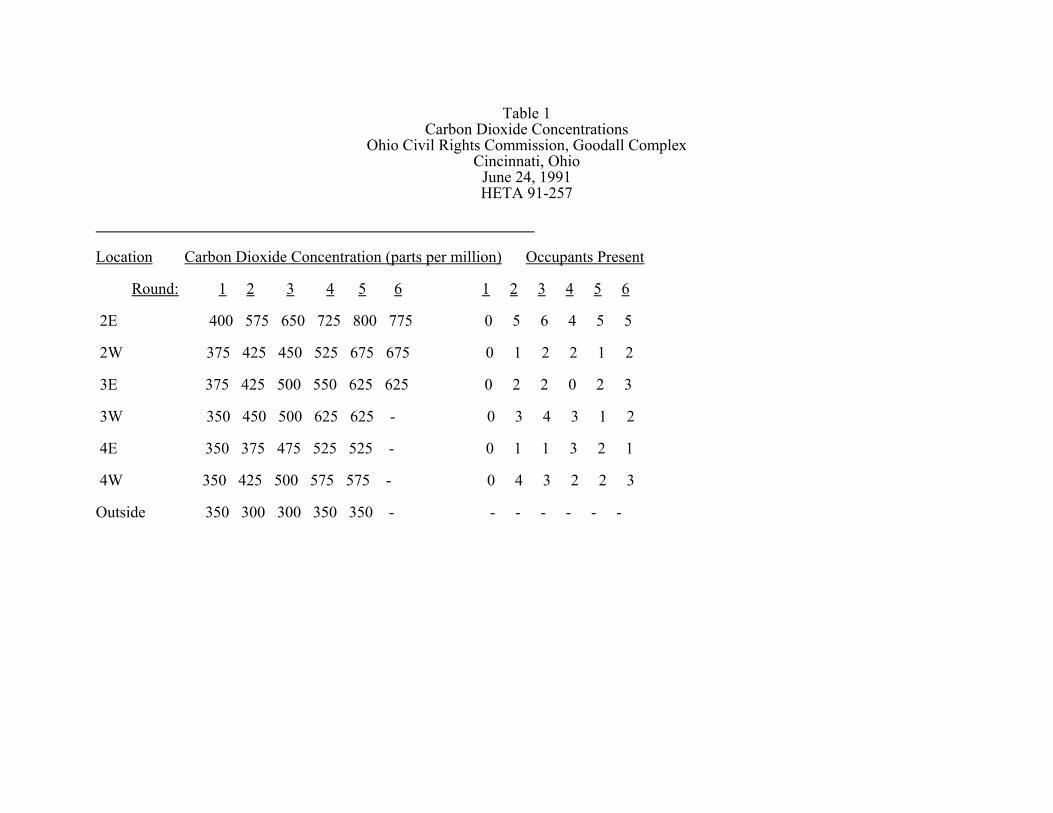
Table 1Carbon Dioxide Concentrations
Ohio Civil Rights Commission, Goodall ComplexCincinnati, Ohio
June 24, 1991HETA 91-257
Location Carbon Dioxide Concentration (parts per million) Occupants Present Round: 1 2 3 4 5 6 1 2 3 4 5 6 2E 400 575 650 725 800 775 0 5 6 4 5 5
2W 375 425 450 525 675 675 0 1 2 2 1 2
3E 375 425 500 550 625 625 0 2 2 0 2 3
3W 350 450 500 625 625 - 0 3 4 3 1 2 4E 350 375 475 525 525 - 0 1 1 3 2 1 4W 350 425 500 575 575 - 0 4 3 2 2 3
Outside 350 300 300 350 350 - - - - - - -
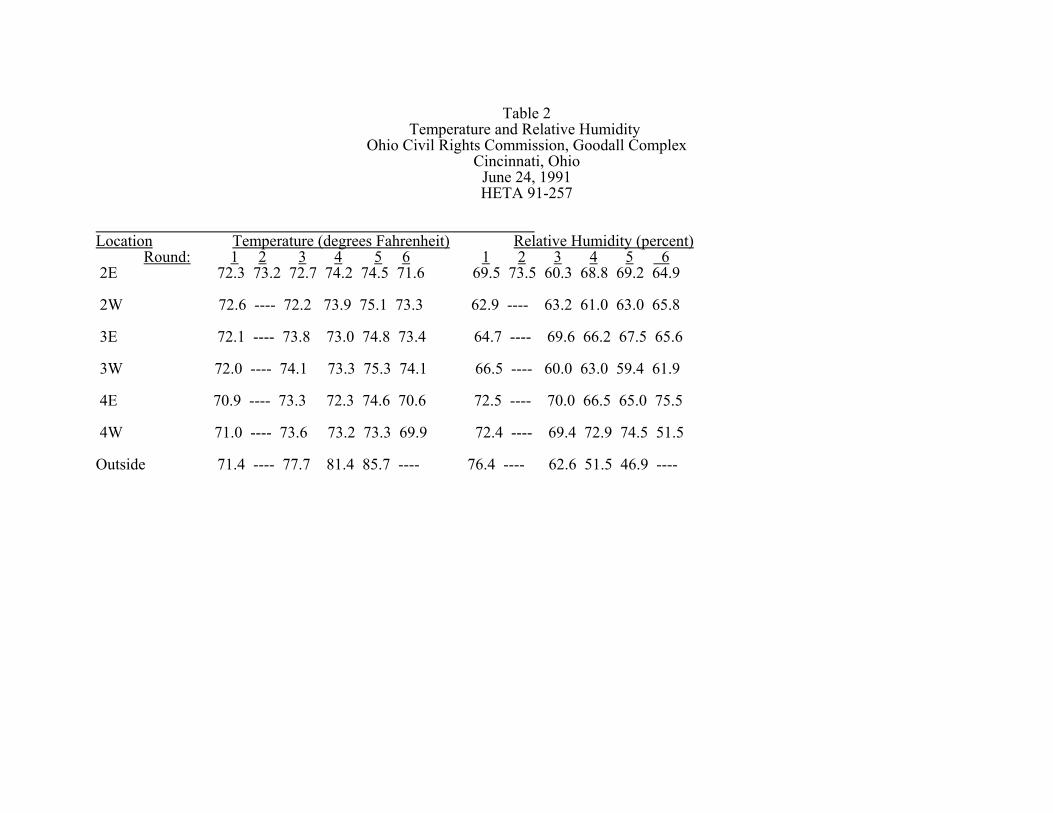
Table 2Temperature and Relative Humidity
Ohio Civil Rights Commission, Goodall ComplexCincinnati, Ohio
June 24, 1991HETA 91-257
Location Temperature (degrees Fahrenheit) Relative Humidity (percent) Round: 1 2 3 4 5 6 1 2 3 4 5 6 2E 72.3 73.2 72.7 74.2 74.5 71.6 69.5 73.5 60.3 68.8 69.2 64.9
2W 72.6 ---- 72.2 73.9 75.1 73.3 62.9 ---- 63.2 61.0 63.0 65.8
3E 72.1 ---- 73.8 73.0 74.8 73.4 64.7 ---- 69.6 66.2 67.5 65.6
3W 72.0 ---- 74.1 73.3 75.3 74.1 66.5 ---- 60.0 63.0 59.4 61.9
4E 70.9 ---- 73.3 72.3 74.6 70.6 72.5 ---- 70.0 66.5 65.0 75.5
4W 71.0 ---- 73.6 73.2 73.3 69.9 72.4 ---- 69.4 72.9 74.5 51.5 Outside 71.4 ---- 77.7 81.4 85.7 ---- 76.4 ---- 62.6 51.5 46.9 ----