Embed Size (px)
Citation preview

Herschel observations of cold water vapor and ammonia in
protoplanetary disks
• Michiel Hogerheijde (Leiden Observatory)
• Edwin A. Bergin, Christian Brinch, L. Ilsedore Cleeves, Jeffrey K. Fogel, Geoffrey A. Blake, José Cernicharo, Carsten Dominik, Dariusz C. Lis, Gary Melnick, David Neufeld, Olja Panić, John C. Pearson, Lars Kristensen, Umut A. Yıldız, Ewine F. van Dishoeck
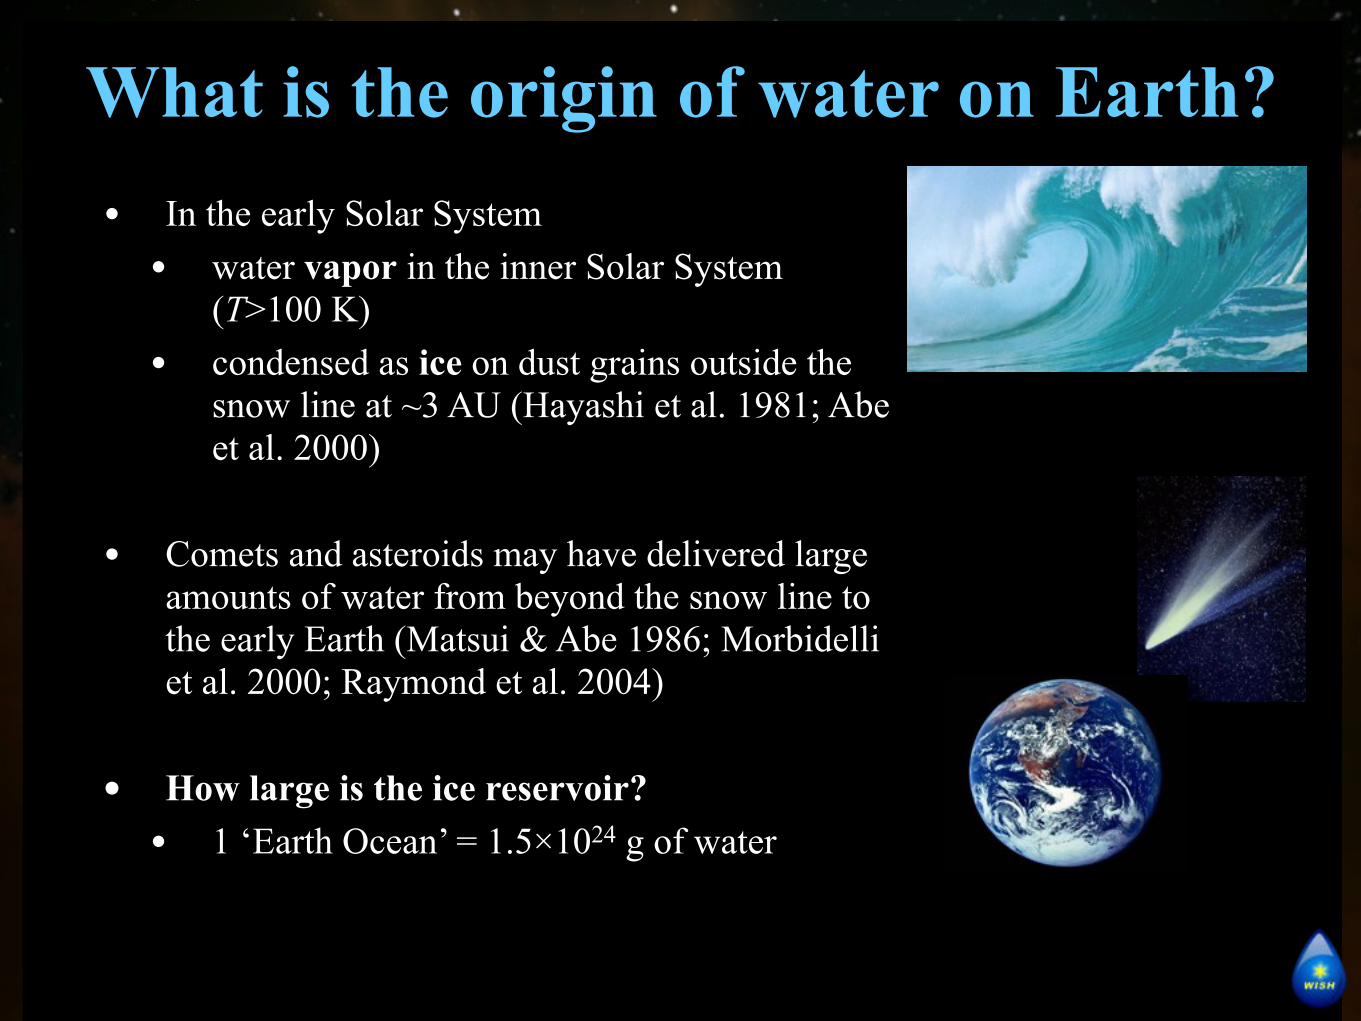
What is the origin of water on Earth?• In the early Solar System• water vapor in the inner Solar System
(T>100 K)• condensed as ice on dust grains outside the
snow line at ~3 AU (Hayashi et al. 1981; Abe et al. 2000)
• Comets and asteroids may have delivered large amounts of water from beyond the snow line to the early Earth (Matsui & Abe 1986; Morbidelli et al. 2000; Raymond et al. 2004)
• How large is the ice reservoir?• 1 ‘Earth Ocean’ = 1.5×1024 g of water
H2Ogas/H2Oice
≫ 1H2Ogas/H
2Oice ≪1
1 AU
0.1 AU
H2Ogas/H2Oice
≫ 1
H2Ogas/H2Oice
≪1 1 AU
H2Ogas ~fraction×H2Oice
H2Oga
s ~fra
ction×H
2Oice
H2Ogas ~fraction×H2Oice
H2Oga
s ~fra
ction×H
2Oice
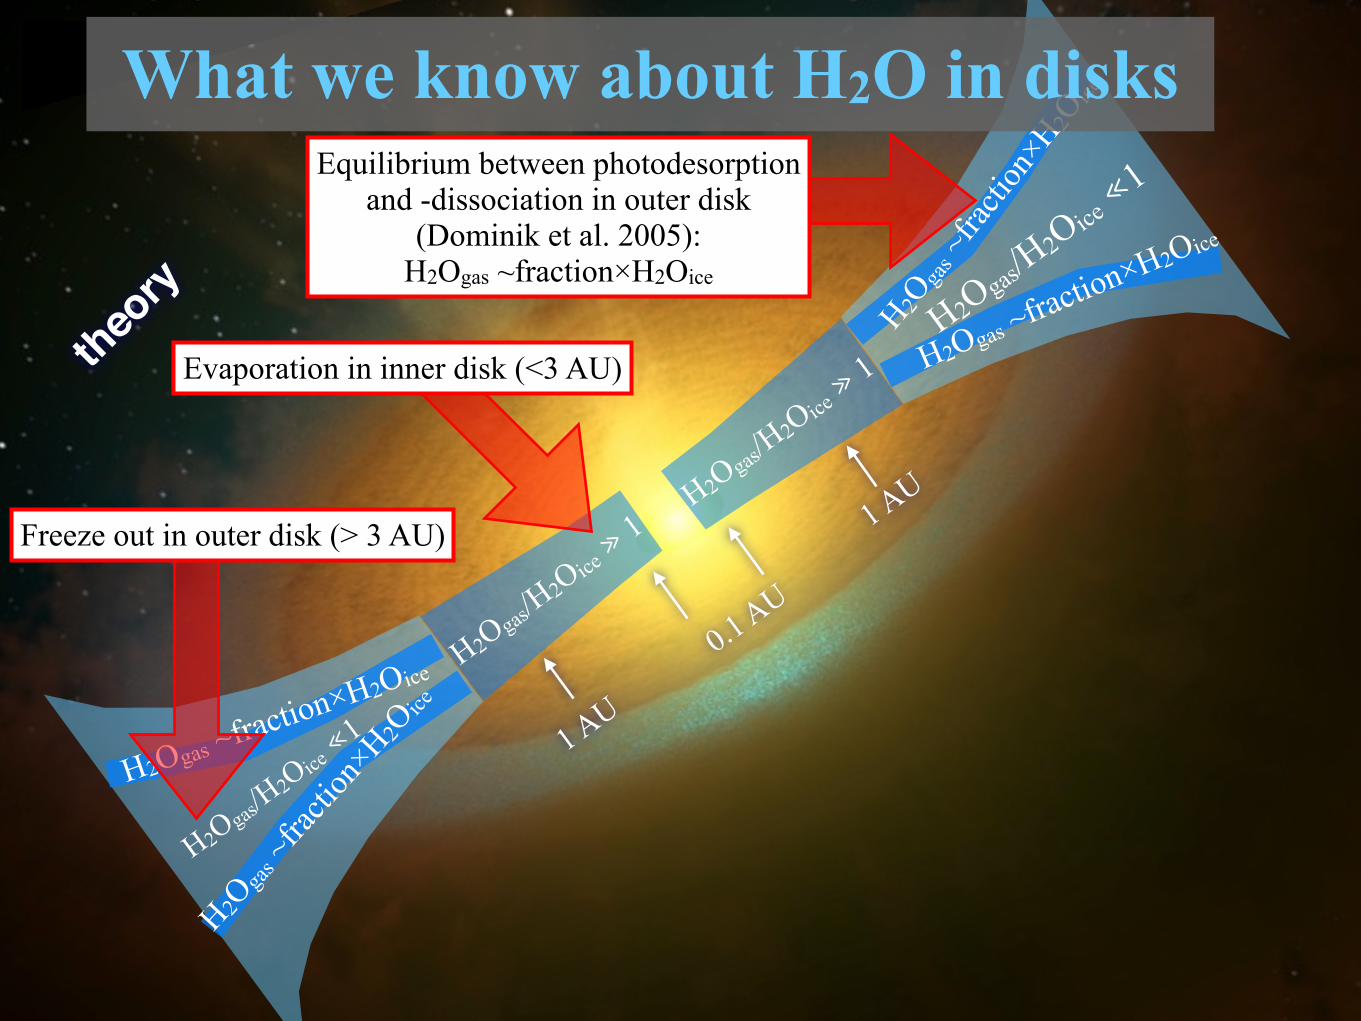
Evaporation in inner disk (<3 AU)
Equilibrium between photodesorption and -dissociation in outer disk
(Dominik et al. 2005):H2Ogas ~fraction×H2Oice
Freeze out in outer disk (> 3 AU)
theory
What we know about H2O in disks

H2Ogas/H2Oice
≫ 1H2Ogas/H
2Oice ≪1
1 AU
0.1 AU
H2Ogas/H2Oice
≫ 1
H2Ogas/H2Oice
≪1 1 AU
H2Ogas ~fraction×H2Oice
H2Oga
s ~fra
ction×H
2Oice
H2Ogas ~fraction×H2Oice
H2Oga
s ~fra
ction×H
2Oice
Evaporation in inner disk (<3 AU)
Equilibrium between photodesorption and -dissociation in outer disk
(Dominik et al. 2005):H2Ogas ~fraction×H2Oice
Subaru detection of 3µm water ice absorption (Terada et al. 2007)
See also Honda et al. (2009)
was conducted using 9 point dithering with aminimum separationof each position of 1.500. Spectroscopy was made with an ABBAsequence with 3.000 nodding along to the slit. The slit orientationwas set to be orthogonal to the disk with a slit position angle of130.5! for HK Tau B and 20.0! for HV Tau C. The dithering andnodding were achieved by moving the tip-tilt mirror inside theadaptive optics system. The flat fields for imaging atH and K andspectroscopy in the K and L bands were produced by combiningimages of an integrating sphere illuminated by a halogen lamp.The sky flat was used for imaging at L0.
Standard data reduction was applied for flat-fielding, sky sub-traction, and telluric correction using the IRAF packages. Thestandard stars for telluric correction are listed in Table 1. HD22686,HD 44612, and FS 122 were used as photometric standards. TheH, K, and L0 magnitudes of HD 22686 and HD 44612 are 7.190,7.185, 7.199, and 7.041, 7.041, 7.05 (Elias et al. 1982; Leggettet al. 2003), respectively. The K magnitude of FS 122 is 11.347(Leggett et al. 2006). For spectroscopy the A0 type standard starsHR 1590 (A0 V; V " 5:789) and HR 1152 (A0 Vn; V " 6:430)were observed to correct for telluric absorption. The hydrogen
TABLE 1
Observing Log
Object
Observing Date
(UT) Mode Band Standard Star
Exposure Time
(s)
Slit Width
(arcsec)
Spectral Resolution
(k/!k)
HK Tau B .................. 2001 Dec 25 Spectroscopy L HR 1590 1900 0.3 390
2002 Sep 24 Spectroscopy K HR 1590 720 0.15 1300
2002 Sep 24 Imaging H HD 22686 135 . . . . . .2002 Sep 24 Imaging K HD 22686 67.5 . . . . . .2002 Sep 24 Imaging L0 HD 22686 225 . . . . . .
HV Tau C .................. 2002 Sep 25 Spectroscopy K HR 1590 720 0.3 6502002 Sep 25 Spectroscopy L HR 1590 1900 0.3 390
2002 Sep 25 Imaging H HD 44612 135 . . . . . .2002 Sep 25 Imaging K HD 44612 67.5 . . . . . .2002 Sep 25 Imaging L0 HD 44612 225 . . . . . .2005 Jan 18 Spectroscopy K HR 1152 480 0.3 650
2005 Jan 18 Spectroscopy L HR 1152 7680 0.3 390
2005 Jan 18 Imaging K FS 122 40 . . . . . .2005 Jan 18 Imaging L0 HD 44612 150 . . . . . .
Fig. 1.—Left:H,K, and L0 color-composite images in logarithmic scale for HKTau andHVTau systems. The field of view is 6:7700 ; 6:7700.Right: Surface brightnessmap of HK Tau B (top) and HV Tau C (bottom). The contour levels in mag arcsec#2 correspond to 14.0–10.25 in H, 13.55–9.3 in K, and 12.7–8.45 in L0 for HK Tau Band 14.75–11.75 in H, 14.0–10.75 in K, and 12.6–9.6 in L0 for HV Tau C with a contour interval of 0.25. The circle at the lower left corner indicates FWHM size foreach observation. A 50 AU circular orbit with an inclination angle of 85! for HK Tau B and 84! for HV Tau C is shown.
TERADA ET AL.304 Vol. 667
absorptions of theA0 starswere removedwith amethod developedbyVacca et al. (2003). The wavelength calibration was performedusing the telluric absorption lines in the spectrum.
3. RESULTS
Figure 1 shows adaptive optics images of HK Tau B on UT2002 September 24 and HV Tau C on UT 2002 September 25 atH,K, and L0. HKTauB andHVTauC exhibited scattered light inan edge-on disk, and two components of the scattered light fromHVTauC are clearly resolved in all the bands. The FWHM imagesizes of both objects are found to be 0.1300 at H, 0.1000 at K, and
0.1200 at L0 after wavefront correctionwith the adaptive optics sys-tem. Only the L0 images reached the diffraction limit.
Aperture photometry was performed on HK Tau B and HVTau C with a radius of 1.000 and 1.200, respectively. The photo-metric results are shown inTable 2.While our results forHVTauCshow no significant time variation at the two epochs at K and L0,both objects exhibit variability of up to 1 mag in all the bandscompared to previous photometry (Koresko 1998; Woitas &Leinert 1998;Monin&Bouvier 2000;White &Ghez 2001). Thepossible causes of the variability are magnetic activity on the stel-lar surface, variablemass accretion rate onto the central star, bright-ness change of scattered light due to geometry change of thematerials, and extinction change toward the scattered light source.Thewidth of the dark lane of HVTauCwas estimated to be 0.26900
at H, 0.25800 at K, and 0.24600 at L0 as measured by the distancebetween the peak of the two components of the scattered light fromHV Tau C. The width is wider at the shorter wavelengths as ex-pected by the greater extinction at the shorter wavelengths.
We present 1.93–4.13 !m spectra of HK Tau B and HV Tau Cin the left panel of Figure 2. The spectra is scaled to the photo-metric points atK and L0. All of the spectra show a deepwater iceabsorption at 3 !m. In addition, many emission and absorptionlines can be seen in the spectra of HV Tau C. Since HV Tau C is
TABLE 2
Magnitudes of HK Tau B and HV Tau C
Object
Date
(UT) H K L0
HK Tau B .................... 2002 Sep 24 12.25 11.54 11.02
HV Tau C .................... 2002 Sep 25 13.19 12.32 11.37
2005 Jan 18 . . . 12.31 11.40
Note.—The typical 1 " uncertainties are 0.02, 0.02, and 0.1 mag for H, K,and L0, respectively.
Fig. 2.—Left: The 1.9–4.2!mspectra of HKTauB andHVTauC.A deepwater ice absorption at 3!m is seen in these spectra. The dotted lines indicate the continua of thespectra. The optical depth of the water ice absorption is shown in the right panel. In HV Tau C, the prominent H2 emission lines can be seen at 1.9–2.5, 3.004, and 3.235!m.
WATER ICE IN PROTOPLANETARY DISKS 305No. 1, 2007
Spitzer detection of hot water vapor from inner disks (Carr & Najita 2008; Salyk et al. 2008;
Pontoppidan et al. 2010).
(several hundred degrees kelvin) regions of mo-lecular gas that surround luminous protostars.The abundances of HCN and C2H2 in AATauri,relative to H2O, are also substantially higher thanmeasurements for cometary volatiles (fig. S1),whereas the abundance of CO2 is consistentwith or possibly less than its abundances in bothcomets and interstellar ices.
If molecular cores are representative of thecomposition of material that is incorporated intodisks, then the higher abundances for AA Tauri
suggest that substantial molecular synthesis takesplace within the disk. The observed region of thedisk lies well inside the radius where ices wouldsublimate, based on the gas temperatures and in-ferred radii. This situation is similar to that of hotmolecular cores, where a warm gas phase followsthe sublimation of molecules from icy grain man-tles. The subsequent gas-phase chemistry (19) mayproduce the complex organic molecules observedwith millimeter-wave spectroscopy in both mas-sive hot cores and the corresponding regions
surrounding low-mass protostars (20). Analogous-ly, the indication of molecular synthesis in AATauri suggests that more complex organic mol-ecules, including those of pre-biotic interest,might be produced within disks.
Similarly high abundances of C2H2, HCN,and CO2 have also been observed (7) in ab-sorption toward the low-mass protostar IRS 46,where the molecules potentially reside in a diskviewed at a favorable edge-on inclination or inan outflowing disk wind. Such gas absorption israre toward low-mass protostars (7). In contrast,emission from a disk, such as the ubiquitous COfundamental emission from CTTSs, does not re-quire a special orientation to be observable. Thefact that the molecular features in the mid-infraredspectrum of AA Tauri are detected in emission,combined with the fact that it is a typical CTTS,suggests the potential to study organic moleculesand water in a large number of CTTS disks.
The high abundances in the AATauri disk aregenerally consistentwith the predicted abundancesat approximately 1-AU radii in a disk chemicalmodel (21) for the inner 5 AU of protoplanetarydisks (Fig. 3). However, the model results are ver-tically integrated abundances for the disk, whereasthe molecular emission lines we observed arelikely to probe only the upper disk atmosphere.The high abundances we derived are not expectedin recentmodels that calculate the vertical thermal-chemical structure of the gas in disk atmospheres(16), which predict low abundances for moleculessuch asH2O in the temperature inversion region ofthe atmosphere where emission lines form. Ifthese models are correct, our measurements maybe a sign of vertical mixing that carries molecularspecies from deep in the disk, where they areabundant, up to the surface where they are ob-served. Such turbulent mixing is predicted (22) bythe magnetorotational instability (23), the processthat is hypothesized to power disk accretion.
Our results for AA Tauri demonstrate the po-tential to measure the distribution of water vaporthroughout the terrestrial planet region of disks,information that was previously restricted tohot H2O inside of 0.3 AU (6, 13). The abun-dance of water vapor in the inner disk is im-portant in setting the oxidation state of the gas,which influences the chemistry and mineralogy.Knowledge of the distribution of water (gas andice) is also central to understanding the origin ofwater in inner solar system bodies and the forma-tion of giant planets via the core accretion mech-anism. The high abundance of H2O for AATauri,if typical, would rule out simple models whereoutward diffusion rapidly depletes water vapor inthe inner disk (24), leading to large ice densityenhancements at larger radii and the rapid growthof giant planet cores. More detailed models (25)that include a variety of physical processes predicta more complicated evolution of water vapor inthe inner disk, with both enhancements and deple-tions that vary with time and radius, indicating theimportance of measuring the abundance and dis-tribution of water with evolutionary age.
Fig. 2. Comparison ofthe observed spectrum ofAA Tauri to the combinedmodel spectrum (11).The observed continuum-subtracted spectrum from13 to 16 mm (above) isoffset from the modelspectrum (below). The er-ror bar indicates the av-erage uncertainty in theobserved spectrum. Themodel is a slab in localthermodynamic equilibri-um, with an independenttemperature, column den-sity, and disk area derivedfor each molecular species(Table 1). All the unla-beled features are rotational transitions of H2O.
Table 1. Molecular gas parameters and abundances derived for AA Tauri.
Molecule T (K) N (1016 cm!2) R* (AU) Abundance to COH2O 575 ± 50 65 ± 24 2.1 ± 0.1 1.3OH 525 ± 50 8.1 ± 5.2 2.2 ± 0.1 0.18HCN 650 ± 100 6.5 ± 3.3 0.60 ± 0.05 0.13C2H2 650 ± 150 0.81 ± 0.32 0.60† 0.016CO2 350 ± 100 0.2 –13 1.2 ± 0.2 0.004 – 0.26CO 900 ± 100 49 ± 16 0.7 ± 0.1 1.0*The equivalent radius for the emitting area A (R = [A/p]1/2). †Area was set to that derived for HCN.
Fig. 3. Comparison of abun-dances relative toCO.Theabun-dances for each molecule Xrelative to CO [N(X)/N(CO)]derived for AA Tauri (squares)are compared to the abun-dances for hot molecular cores(triangles) and to disk chem-ical models (21) at radii of1 and 5 AU (open circles withradius labeled). The abun-dances for hot cores are basedon observations of absorptionbands made with the InfraredSpace Observatory (26–28).The organic molecules werestudied using the same mid-infrared bands that were ana-lyzed for AA Tauri.
5
5
5
5
1
1
1
1
www.sciencemag.org SCIENCE VOL 319 14 MARCH 2008 1505
REPORTS
on
May
26,
201
1w
ww
.sci
ence
mag
.org
Dow
nloa
ded
from
?Freeze out in outer disk (> 3 AU)
theory
observations
What we know about H2O in disks

Herschel/HIFI:Cold water vapor in TW Hya
Hogerheijde et al. (2011)
Total observing time: 17 hrs (!)

The disk around TW Hya• Closest gas-rich disk to Earth• Distance 53.7±6.2 pc (van Leeuwen et al. 2010)
• Mstar=0.6 M⊙
• spectral type K7V• Lstar=0.23 L⊙ (Webb et al. 1999)• age ~10 Myr
• Rdisk=196 AU; i=7˚: nearly face-on
• Mdisk=2–6×10⁻⁴ M⊙ in dust• 5×10⁻⁴...5×10-2 M⊙ in gas • (Calvet et al. 2002; Qi et al. 2004; Thi et al. 2010)
CO 3–2(Qi et al. 2004, Hughes et al. 2011)
(Thi et al. 2004)
The Astrophysical Journal, 727:85 (17pp), 2011 February 1 Hughes et al.
Figure 2. Same as Figure 1 but for TW Hya. The channel maps were imaged with a 1.!!2 Gaussian taper to emphasize the emission on larger scales, and the contoursare [4,8,12,...]"0.55 Jy beam#1 (the rms noise). For the full set of channel maps, see the Appendix.(A color version of this figure is available in the online journal.)
results of the study presented here, although caution should beexercised when applying the best-fit model parameters to otherlines.
The primary reason for using the two types of models,however, is that they differ substantially in their treatment ofthe disk temperature structures. For the D’Alessio et al. models,the temperature structure is fixed by the dust continuum. Thesimilarity solution models, by contrast, allow the temperatureto vary to best match the data. There are a few independentconstraints on temperature: it should increase with height abovethe midplane, due to surface heating by the star and low viscousheating in the midplane, and the dust will generally not behotter than the gas, since the gas is subject to additional heatingprocesses beyond the stellar irradiation that determines dusttemperature. The temperature structure in the disk is the singlefactor most closely tied to the derived value of the turbulentlinewidth (see discussion in Section 4.4), which will be model-dependent. We therefore fit both classes of models to the data,in order to compare the model-dependent conclusions aboutturbulent linewidth for two distinct types of models with verydifferent treatments of gas temperature. The spatial dynamicrange of the data is insufficient to investigate radial variationsin turbulent linewidth. We therefore assume a global value, ! ,that will apply to size scales commensurate with the spatialresolution of the data.
4.1. Description of Models
4.1.1. D’Alessio et al. Models
The D’Alessio et al. models are described in detail inD’Alessio et al. (1998, 1999, 2001, 2006). Here we provide ageneral outline of the model properties and discuss the particularmodels used in this paper.
The D’Alessio et al. models were developed to reproduce theunresolved SEDs arising from warm dust orbiting young stars,although they have also been demonstrated to be successful atreproducing spatially resolved dust continuum emission at mil-limeter wavelengths (see, e.g., Calvet et al. 2002; Hughes et al.2007, 2009b) as well as spatially resolved molecular line emis-
sion (see, e.g., Qi et al. 2004, 2006). The models include heatingfrom the central star and viscous dissipation within the disk, al-though they tend to be dominated by stellar irradiation. Thestructure is solved iteratively to provide consistency betweenthe irradiation heating and the vertical structure. The mass ac-cretion rate is assumed to be constant throughout the disk. Theassumed dust properties are described by Calvet et al. (2002),and the model includes provisions for changing dust proper-ties, dust growth, and settling. We allow the outer radius of themodel to vary to best reproduce the extent of the molecular lineobservations.
We use the structure model for TW Hya that was developedby Calvet et al. (2002) and successfully compared to molecularline emission by Qi et al. (2004, 2006). For HD 163296, we usea comparable model that reproduces the spatially unresolvedSED and is designed to reproduce the integrated line strengthsof several CO transitions as well as other molecules (C. Qi et al.2011, in preparation).
Since the D’Alessio et al. models were developed primarilyto reproduce the dust emission from the SED, we are required tofit several parameters to match the observed CO(3–2) emissionusing the SED-based models. We fit the structural parameters{RD, XCO} (the disk outer radius and CO abundance, respec-tively), the geometrical parameters {i, P.A.} (the disk inclinationand position angle), and the turbulent linewidth, {!}.
4.1.2. Viscous Disk Similarity Solutions
We also fit the observations using a power-law temperaturedistribution and surface density profile that follows the classof similarity solutions for evolving viscous accretion disks de-scribed by Lynden-Bell & Pringle (1974) and Hartmann et al.(1998). This particular method of parameterizing circumstel-lar disk structure has a long history of success in reproducingobservational diagnostics, although with limitations. Theoreti-cal predictions of the power-law dependence of temperature foraccretion disks around young stars were first made by Adams& Shu (1986), and power-law parameterizations of tempera-ture and surface density have been used by many studiessince then (e.g., Beckwith et al. 1990; Beckwith & Sargent
4

Disk origin of the H2O emission• Herschel observations are spatially unresolved• but HIFI resolves the spectral line
• Narrow line width confirms H2O emission extends out to ~115 A• consistent with recent indications that dust disk extends to similar
distances from the star (Andrews et al. 2011)
(Thi et al. 2004)CO 3–2(Qi et al. 2004, Hughes et al. 2011)
The Astrophysical Journal, 727:85 (17pp), 2011 February 1 Hughes et al.
Figure 2. Same as Figure 1 but for TW Hya. The channel maps were imaged with a 1.!!2 Gaussian taper to emphasize the emission on larger scales, and the contoursare [4,8,12,...]"0.55 Jy beam#1 (the rms noise). For the full set of channel maps, see the Appendix.(A color version of this figure is available in the online journal.)
results of the study presented here, although caution should beexercised when applying the best-fit model parameters to otherlines.
The primary reason for using the two types of models,however, is that they differ substantially in their treatment ofthe disk temperature structures. For the D’Alessio et al. models,the temperature structure is fixed by the dust continuum. Thesimilarity solution models, by contrast, allow the temperatureto vary to best match the data. There are a few independentconstraints on temperature: it should increase with height abovethe midplane, due to surface heating by the star and low viscousheating in the midplane, and the dust will generally not behotter than the gas, since the gas is subject to additional heatingprocesses beyond the stellar irradiation that determines dusttemperature. The temperature structure in the disk is the singlefactor most closely tied to the derived value of the turbulentlinewidth (see discussion in Section 4.4), which will be model-dependent. We therefore fit both classes of models to the data,in order to compare the model-dependent conclusions aboutturbulent linewidth for two distinct types of models with verydifferent treatments of gas temperature. The spatial dynamicrange of the data is insufficient to investigate radial variationsin turbulent linewidth. We therefore assume a global value, ! ,that will apply to size scales commensurate with the spatialresolution of the data.
4.1. Description of Models
4.1.1. D’Alessio et al. Models
The D’Alessio et al. models are described in detail inD’Alessio et al. (1998, 1999, 2001, 2006). Here we provide ageneral outline of the model properties and discuss the particularmodels used in this paper.
The D’Alessio et al. models were developed to reproduce theunresolved SEDs arising from warm dust orbiting young stars,although they have also been demonstrated to be successful atreproducing spatially resolved dust continuum emission at mil-limeter wavelengths (see, e.g., Calvet et al. 2002; Hughes et al.2007, 2009b) as well as spatially resolved molecular line emis-
sion (see, e.g., Qi et al. 2004, 2006). The models include heatingfrom the central star and viscous dissipation within the disk, al-though they tend to be dominated by stellar irradiation. Thestructure is solved iteratively to provide consistency betweenthe irradiation heating and the vertical structure. The mass ac-cretion rate is assumed to be constant throughout the disk. Theassumed dust properties are described by Calvet et al. (2002),and the model includes provisions for changing dust proper-ties, dust growth, and settling. We allow the outer radius of themodel to vary to best reproduce the extent of the molecular lineobservations.
We use the structure model for TW Hya that was developedby Calvet et al. (2002) and successfully compared to molecularline emission by Qi et al. (2004, 2006). For HD 163296, we usea comparable model that reproduces the spatially unresolvedSED and is designed to reproduce the integrated line strengthsof several CO transitions as well as other molecules (C. Qi et al.2011, in preparation).
Since the D’Alessio et al. models were developed primarilyto reproduce the dust emission from the SED, we are required tofit several parameters to match the observed CO(3–2) emissionusing the SED-based models. We fit the structural parameters{RD, XCO} (the disk outer radius and CO abundance, respec-tively), the geometrical parameters {i, P.A.} (the disk inclinationand position angle), and the turbulent linewidth, {!}.
4.1.2. Viscous Disk Similarity Solutions
We also fit the observations using a power-law temperaturedistribution and surface density profile that follows the classof similarity solutions for evolving viscous accretion disks de-scribed by Lynden-Bell & Pringle (1974) and Hartmann et al.(1998). This particular method of parameterizing circumstel-lar disk structure has a long history of success in reproducingobservational diagnostics, although with limitations. Theoreti-cal predictions of the power-law dependence of temperature foraccretion disks around young stars were first made by Adams& Shu (1986), and power-law parameterizations of tempera-ture and surface density have been used by many studiessince then (e.g., Beckwith et al. 1990; Beckwith & Sargent
4

How much water?• Fiducial disk structure model: Thi et al. (2010)• Mdust = 1.9×10⁻⁴ M⊙➞ Mgas = 1.9×10⁻² M⊙
• Temperature from stellar irradiation (RADMC; Dullemond & Dominik 2004)
• UV radiative transfer into disk and resulting chemistry (Fogel et al. 2010)• Water excitation and line formation (LIME; Brinch & Hogerheijde 2010)

Predicted lines too strong• This model overestimates the line intensities by factors 3.3–5.3.
• Lowering gas mass does not reduce the line intensity• Water vapor derives from icy grains• Grains are suspended by the gas, stay at same ambient pressure
• Varying collision rates or changing o/p-H2 ratio also does not decrease line strengths
• used rates from Faure et al. (2007) and Dubernet et al. (2009)

• Remove 90% of orignal ice from UV-affected layers• Settling of larger, icy grains relative to the small grains which dominate the
UV absorption• Only 10% of original ice remains in upper disk• Gives rise to 0.005 Earth Oceans of water vapor
• Underlying ice reservoir of at least several thousands of Earth Oceans• key assumption: elemental oxygen efficiently forms water on grains
Differential settling of icy grains
Photodesorption
Large grain with ice cover Small grain
Water vapor layer
UV photons
Photodesorption
Large grain with ice cover Small grain
Water vapor layer
UV photonsLarge & small grains well mixed Large grains settle w.r.t. to small grains

• Andrews et al. (2011) show that the the TW Hya disk• in gas extends to 215 AU• in (mm-sized) dust has a sharp drop at 60 AU
• This suggests water ice, and therefore water vapor, also limited to 60 AU• consistent with width of line seen by HIFI• reduces intensity by factor ~4–6
• Requires a model of radial migration of bigger dust grains• as opposed to vertical settling of bigger dust dust grains as in previous scenario
• In either case: H2O traces dynamics of the dust population
Alternative explanation– 7 –
Fig. 1.— (a) Naturally weighted composite image of the 870µm continuum emission from the TW
Hya disk. Contours start at 10mJy beam!1 (5!) and increase in 30mJy beam!1 (15 !) increments.
The synthesized beam dimensions are shown in the lower left. (b) Azimuthally averaged 870µm
continuum visibility profile as a function of the deprojected baseline length (real part only; the
imaginary terms are e!ectively zero on all baselines). The uncertainties are typically smaller than
the symbol sizes. Note the low-amplitude oscillations beyond !150 k". (c) Complete SED for
the TW Hya star+disk system (references are in the text; see §2). The Spitzer IRS spectrum is
shown as a thick gray curve. Our adopted stellar photosphere model is overlaid as a thin gray
curve (see §4.1). (d) CO J=3"2 channel maps from the TW Hya disk, on the same angular scale
as the continuum map in panel a. Contours are drawn at 0.4 Jy beam!1 intervals (!3!) in each
0.2 km s!1-wide channel. The 1"" synthesized beam is shown in the lower left. The central channel
represents the TW Hya systemic velocity, at VLSR = +2.86 km s!1.
The Astrophysical Journal, 727:85 (17pp), 2011 February 1 Hughes et al.
Figure 2. Same as Figure 1 but for TW Hya. The channel maps were imaged with a 1.!!2 Gaussian taper to emphasize the emission on larger scales, and the contoursare [4,8,12,...]"0.55 Jy beam#1 (the rms noise). For the full set of channel maps, see the Appendix.(A color version of this figure is available in the online journal.)
results of the study presented here, although caution should beexercised when applying the best-fit model parameters to otherlines.
The primary reason for using the two types of models,however, is that they differ substantially in their treatment ofthe disk temperature structures. For the D’Alessio et al. models,the temperature structure is fixed by the dust continuum. Thesimilarity solution models, by contrast, allow the temperatureto vary to best match the data. There are a few independentconstraints on temperature: it should increase with height abovethe midplane, due to surface heating by the star and low viscousheating in the midplane, and the dust will generally not behotter than the gas, since the gas is subject to additional heatingprocesses beyond the stellar irradiation that determines dusttemperature. The temperature structure in the disk is the singlefactor most closely tied to the derived value of the turbulentlinewidth (see discussion in Section 4.4), which will be model-dependent. We therefore fit both classes of models to the data,in order to compare the model-dependent conclusions aboutturbulent linewidth for two distinct types of models with verydifferent treatments of gas temperature. The spatial dynamicrange of the data is insufficient to investigate radial variationsin turbulent linewidth. We therefore assume a global value, ! ,that will apply to size scales commensurate with the spatialresolution of the data.
4.1. Description of Models
4.1.1. D’Alessio et al. Models
The D’Alessio et al. models are described in detail inD’Alessio et al. (1998, 1999, 2001, 2006). Here we provide ageneral outline of the model properties and discuss the particularmodels used in this paper.
The D’Alessio et al. models were developed to reproduce theunresolved SEDs arising from warm dust orbiting young stars,although they have also been demonstrated to be successful atreproducing spatially resolved dust continuum emission at mil-limeter wavelengths (see, e.g., Calvet et al. 2002; Hughes et al.2007, 2009b) as well as spatially resolved molecular line emis-
sion (see, e.g., Qi et al. 2004, 2006). The models include heatingfrom the central star and viscous dissipation within the disk, al-though they tend to be dominated by stellar irradiation. Thestructure is solved iteratively to provide consistency betweenthe irradiation heating and the vertical structure. The mass ac-cretion rate is assumed to be constant throughout the disk. Theassumed dust properties are described by Calvet et al. (2002),and the model includes provisions for changing dust proper-ties, dust growth, and settling. We allow the outer radius of themodel to vary to best reproduce the extent of the molecular lineobservations.
We use the structure model for TW Hya that was developedby Calvet et al. (2002) and successfully compared to molecularline emission by Qi et al. (2004, 2006). For HD 163296, we usea comparable model that reproduces the spatially unresolvedSED and is designed to reproduce the integrated line strengthsof several CO transitions as well as other molecules (C. Qi et al.2011, in preparation).
Since the D’Alessio et al. models were developed primarilyto reproduce the dust emission from the SED, we are required tofit several parameters to match the observed CO(3–2) emissionusing the SED-based models. We fit the structural parameters{RD, XCO} (the disk outer radius and CO abundance, respec-tively), the geometrical parameters {i, P.A.} (the disk inclinationand position angle), and the turbulent linewidth, {!}.
4.1.2. Viscous Disk Similarity Solutions
We also fit the observations using a power-law temperaturedistribution and surface density profile that follows the classof similarity solutions for evolving viscous accretion disks de-scribed by Lynden-Bell & Pringle (1974) and Hartmann et al.(1998). This particular method of parameterizing circumstel-lar disk structure has a long history of success in reproducingobservational diagnostics, although with limitations. Theoreti-cal predictions of the power-law dependence of temperature foraccretion disks around young stars were first made by Adams& Shu (1986), and power-law parameterizations of tempera-ture and surface density have been used by many studiessince then (e.g., Beckwith et al. 1990; Beckwith & Sargent
4
dust gas
Also see poster by Inga Kamp for other models for TW Hya.

• Lines are optically thin• ...because only 10% of water vapor remains compared to standard
model• ...because sub-thermal excitation leads to resonant scattering rather
than absorption of line photons
• Ratio of H2O 110-101/111-000 ∝ ortho-to-para ratio (OPR)• Observations yield OPR=0.77±0.07
A low H2O ortho/para in TW Hya
• H2O OPR in TW Hya’s disk ≪ Solar System comets (1.5–3)
Figure 10. Ortho-para ratios and nuclear spin temperatures for H2O and NH3 in comets A. (upper left) OPR for H2O (122Bonev et al. 2007, 108Dello Russo et al. 2007; 123Woodward et al. 2007; 386Bonev et al. 2008). The measured values are placed on a theoretical curve that connects them to the corresponding nuclear spin temperature (120Mumma et al. 1987). B. (upper right) The 6.5 !m H2O band in C/2003 K4, both fully resolved and also convolved to the resolution of Spitzer (123Woodward et al. 2007). Ortho and para lines are indicated. C. (lower left) Ortho-para ratios and spin temperatures for NH3 and H2O in eight comets (H2O from references cited in panel ‘A’, NH3 measurements from 128Shinnaka et al. 2011). D. (lower right) A comparison of Tspin for NH3 and H2O in the eight comets of Fig. 9C. The spin temperatures for these primary volatiles agree within a given comet. Six Oort Cloud comets show relaxed spin temperatures near 29K. However, ortho-para ratios in two fragments of a Jupiter family comet (73P/SW-3) are consistent with statistical equilibrium (left). The lower bounds to their spin temperatures are shown as 95% confidence limits (right). Similar measurements are beginning to emerge for methane. The spin temperature measured for CH4 in C/2001 Q4 (33K +2/-1) agrees with that found for NH3 and H2O in that comet (121Kawakita et al. 2006).
TW Hya
Mumma & Charnley (2011)

• TW Hya OPR=0.77 ⇔ Tspin=13.5 K• Comets OPR>1.5 ⇔ Tspin>20 K
• No radiative conversion of OPR in gas phase
• Thermal evaporation preserves OPR (➞ comets)• Equate Tspin with Tgrain at ice formation (?)
• Effect of photodesorption on OPR unknown; may drive OPR to unity(e.g., Andersson et al. 2008; Arasa et al. 2010)
• Range of cometary OPR: heterogeneous mixture of ices from small (>50 K) and large (<15 K) radii (just like refractory component; Sandford et al. 2006)• Long-range mixing of volatiles in the Solar Nebula
Long-range mixing of volatiles

Ammonia in the disk of TW Hya• Ortho-NH3 10-00 is detected in the same spectrum as the H2O
110-101 line toward TW Hya• Initial calculations show that a NH3/H2O mixing ratio of ~3%
reproduces the observation• Ammonia intermixed with water ice, photodesorbing in same
fashion?
Hogerheijde et al., in prep.

Is TW Hya the only disk with cold water vapor?
• Approved Herschel OT1 and OT2 programs• HD100546, AA Tau, DM Tau• o-H2O 110-101 and p-H2O 111-000
o-H2O 110-101 in HD100546.
First detection in a Herbig disk!
Hogerheijde et al., in prep.
CO 3-2ALMA test data

• We have detected emission from cold water vapor from the full extent of the planet-forming disk around TW Hya.
• The line intensities hint at a ‘hidden’ reservoir of at least several thousands of Earth Oceans of ice in the disk.
• The low ortho-to-para ratio of the water vapor in TW Hya compared to Solar System comets suggest long-range mixing of volatiles in the Solar Nebula.
• TW Hya also contains NH3, at ~3% of water.
• HD100546 also contains cold water vapor.
Summary
HD100546


![Subject: IMAGING METHODS OF COLD ATOMS - BGU · Subject: Imaging methods of cold atoms ... Fol02]. Almost all experimental data for ultracold atoms are obtained from optical observations](https://img.pdfslide.us/doc/110x75/5bdee43809d3f2647f8b63e1/subject-imaging-methods-of-cold-atoms-subject-imaging-methods-of-cold-atoms.jpg)