Embed Size (px)
Citation preview
�
�
�
�������������������� ���������� �������������
������� ������������� ������������������
������������� ����������� �
��
�
���
�������������������
�
������������ ��� �����������������������������
�������������
���������������������
���
����������
�
�� � ����������������������
�������� ��������������
�
�� !�
�
�
�
�
�
�
�

�

� ��
�
���������
Contents......................................................................................................... iii
List of tables.................................................................................................. ix
List of figures ............................................................................................... xiii
Acknowledgement........................................................................................ xv

� ���
� ����
���������
������� ���
Motivation and aims of the thesis……………........…………………... 1
Outline of the thesis .........……………………………………………... 2
�� � ������ ����������������������� ��� ������ � � �
1.1 Economic reform in Vietnam………………………………………. 10
1.1.1 Context of economic reform in Vietnam…………………… 10
1.1.2 Economic reform in Vietnam under the �������………….... 13
1.2 Corporate reform in Vietnam……………………………………….. 21
1.2.1 Corporate setor reform……………………………………… 21
1.2.2 The formation and development of stock markets………….. 24
1.2.5 Banking sector reform………………………………………. 25
1.3 Equitization of state+owned companies in Vietnam………………… 26
1.3.1 Definition and objectives of equitization…………………... 26
1.3.2 Forms of equitization……………………………………..... 26
1.3.3 Stages of equitization ..…………………………………….. 27
1.3.4 Results of equitization…………………………………….... 37
1.3.5 Characteristics of equitization of state+owned companies in
Vietnam………………………………………………....... 38
1.4 Stock markets in Vietnam…………………………........………….. 39
1.4.1 Establishment of stock markets…………………………….. 39
� ���
1.4.2 Listed companies, trading volume and trading value............. 40
1.4.3 Foreign investor participation………………………………. 40
1.4.4 Characteristics of stock markets in Vietnam………………... 41
1.5 Banking system in Vietnam……………………………………........ 41
1.5.1 Types of banks in Vietnam…………………………………. 41
1.5.2 Interest rate regime…………………………………….......... 45
1.5.3 Characteristics of banking system in Vietnam……………… 45
1.6 Remarks…………………………………….. ……………………... 46
�
�� � �������� � ������ ��� �������� ���������� ��� � ���� ������ ��� ��
� ������ � �
2.1 Listed companies in Vietnam and features of their corporate finance 51
2.1.1 Listed companies in Vietnam and the characteristics of
ownership structure…………………………………….. … 51
2.1.2 Funds procurement issues of listed companies in Vietnam ....... 53
2.2 Corporate governance of listed companies in Vietnam……………… 54
2.2.1 Corporate governance of listed companies in Vietnam............. 54
2.2.2 Corporate governance of listed companies with a state
shareholder…………………………………….. …........................ 61
2.2.3 Corporate governance of listed companies with foreign
shareholders........................................................................ 63
2.2.4 Impacts of corporate governance on the capital structure,
investment and profitability of listed companies in Vietnam........ 64
2.3 Remark .................................................................…………............... 65
� ��
�
�� � � ��������� ������������������������ �
3.1� Literatures on corporate reform of transition economies…………. 68
3.1.1� Literatures on Central and East Europe countries................. 68
3.1.2� Literatures on Asia countries................................................. 68
3.2� Fundraising behaviors and capital structure………………………. 69
3.2.1 Theory...................................................................................... 69
3.2.2 Empirical analysis.................................................................... 71
3.3� Impacts of capital structure on the investment decisions…………. 72
3.3.1 Theory...................................................................................... 72
3.3.2 Empirical analysis.................................................................... 73
3.4� Impact of capital structure on profitability………………………... 74
3.4.1 Theory...................................................................................... 74
3.4.2 Empirical analysis.................................................................... 74
3.5� Relation of capital structure, investment and growth opportunities.. 75
3.5.1 Theory...................................................................................... 75
3.6�Empirical analyses on capital structure of Vietnam companies
under the �������…………………………………………….......... 80
3.7� Hypotheses on corporate finance of listed companies in Vietnam.... 84
3.7.1 Hypotheses on general............................................................ 84
3.7.2 Hypotheses on state ownership................................................ 86
3.7.3 Hypotheses on foreign ownership............................................ 88
3.8� Models, empirical methods and data set............................................ 88
3.8.1 Estimation of capital structure of listed companies in Vietnam 89
� ���
3.8.2 Estimation of investment of listed companies in Vietnam........ 92
3.8.3 Estimation of profitability of listed companies in Vietnam....... 94
3.8.4 Estimation of growth opportunities of listed companies in
Vietnam.................................................................................. 96
3.8.5 Empirical methods........................................................................ 98
3.8.6 Data set........................................................................................ 99
3.9� Remarks ............................................................................................. 101
�� ��� ��������������� ���������� ���� ������ ���������� ��� ��� ������
4.1 Correlation coefficients of explanatory variables ………………...... 103
4.2 Estimation results of OLS method...................………………........... 104
4.3 Tests for weak instrument variables and endogeneity………………. 105
4.4�Estimation results of 2SLS method........…………………………… 106
4.5�Estimation results of 3SLS method.................................................... 107
4.6�Discussion on estimation results.......……………………………...... 108
4.7�Conclusion .......…………………………….......………………….... 110
!� �������� ��� ���� � ��������� ���������"�� ��� ��� ����� ������ ��� ������ ��"�
��� ������������������ �� � ��#� ����������������������������$�
5.1 Correlation coefficients of explanatory variables ………………....... 114
5.2 Estimation results of OLS method...................………………....... 114
5.3 Tests for weak instrument variables and endogeneity………………. 116
5.4 Estimation results of 2SLS method........…………………………… 118
5.5 Estimation results of 3SLS method................................................... 121

� ����
5.6 Discussion on estimation results.......……………………………...... 122
5.7 Conclusion .......…………………………….......…………………... 127
%� &��� �������������������� ���������������������������'��������������� ���
��� ������
6.1 Correlation coefficients of explanatory variables ………………......... 129
6.2 Estimation results of OLS method...................……………….............. 130
6.3 Tests for weak instrument variables and endogeneity………………... 132
6.4 Estimation results of 2SLS method........…………………………….. 132
6.5 Estimation results of 3SLS method..................................................... 132
6.6 Discussion on estimation results.......……………………………........ 135
6.7 Conclusion .......…………………………….......…………………….. 136
(� � ������� ��� �
7.1� Introduction…………………………………….. ………………....... 137
7.2� Summary of the chapters……………………………………………. 137
7.3� Overall picture of corporate finance of listed companies in Vietnam 146
7.4� Implications …………………………………….. ………………… 146
7.5� Suggestion for further researches…………………………………… 147
)��������…………………………………….. …………………………….. 148

� �����
� ���
� �������� ����
Table 1.1: Summary of important events of economic reform process in
Vietnam............................................................................................... 16
Table 1.2: Main indicators of Vietnamese economy (1985+2013)................ 20
Table 1.3: Summary of regulations on equitization of State+owned
companies in Vietnam.......................................................................... 29
Table 1.4: Summary of Decision No.14/2011/QD............................................. 33
Table 1.5: Summary of Decision 37/2014/QĐ+TTg........................................... 35
Table 1.6: Number of equitized SOCs ............................................................... 37
Table 1.7: Number of SOCs................................................................................ 37
Table 1.8: Ownership structure of privatized firms in Vietnam and other
transition countries (per cent)............................................................... 38
Table 1.9: Level of state ownership of equitized SOCs in the period of
2001+2011............................................................................................. 38
Table 1.10: Listing conditions for the Hanoi and Ho Chi Minh stock
Exchanges............................................................................................. 40
Table 1.11: The Major Indices of Stock Exchange Markets............................... 41
Table 1.12: Number of banks in Vietnam by ownership (as of the end of 2012) 43
Table 1.13 Ownership of banking sectorin some transition economies (per cent)44
Table 1.14: Share of credit to the economy by type of institutions................... 44
Table 1.15: Liberalization of interest rate in Vietnam....................................... 45
Table 2.1: Numbers and proportions of listed companies by industry............... 53
Table 3.1 List of literatures on corporate reform of transition economies......... 69
� ��
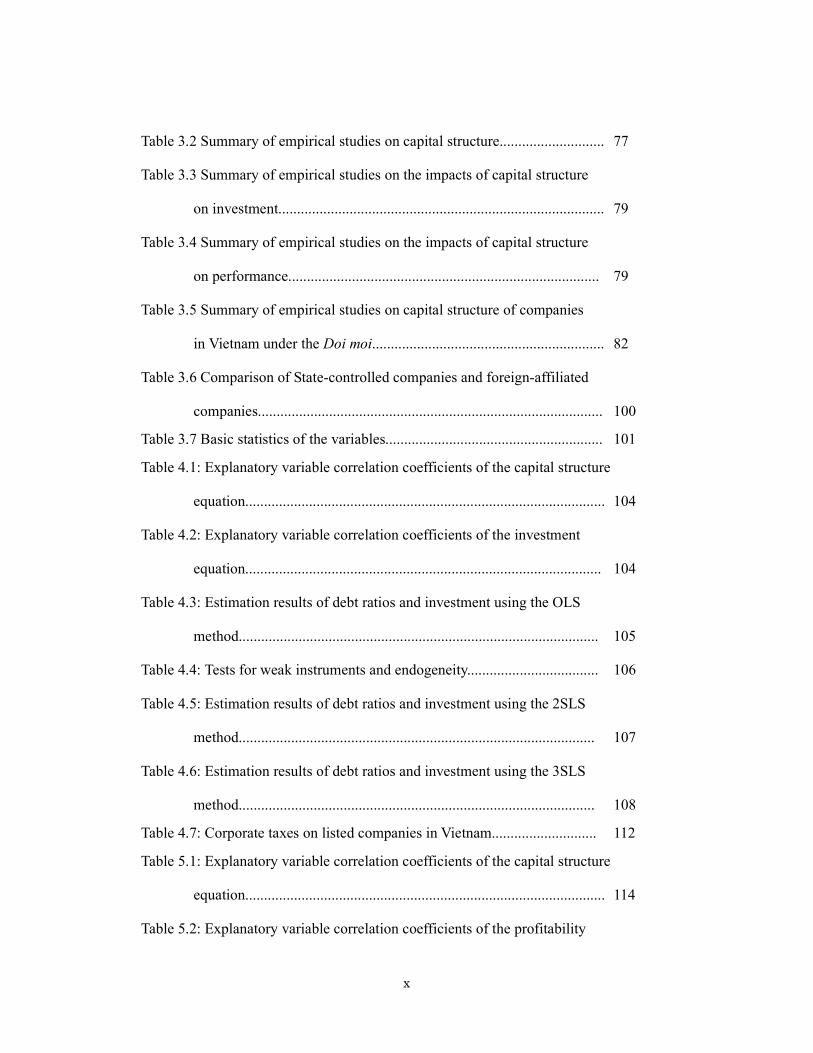
Table 3.2 Summary of empirical studies on capital structure............................ 77
Table 3.3 Summary of empirical studies on the impacts of capital structure
on investment....................................................................................... 79
Table 3.4 Summary of empirical studies on the impacts of capital structure
on performance................................................................................... 79
Table 3.5 Summary of empirical studies on capital structure of companies
in Vietnam under the �������.............................................................. 82
Table 3.6 Comparison of State+controlled companies and foreign+affiliated
companies............................................................................................ 100
Table 3.7 Basic statistics of the variables.......................................................... 101
Table 4.1: Explanatory variable correlation coefficients of the capital structure
equation................................................................................................ 104
Table 4.2: Explanatory variable correlation coefficients of the investment
equation............................................................................................... 104
Table 4.3: Estimation results of debt ratios and investment using the OLS
method................................................................................................ 105
Table 4.4: Tests for weak instruments and endogeneity................................... 106
Table 4.5: Estimation results of debt ratios and investment using the 2SLS
method............................................................................................... 107
Table 4.6: Estimation results of debt ratios and investment using the 3SLS
method............................................................................................... 108
Table 4.7: Corporate taxes on listed companies in Vietnam............................ 112
Table 5.1: Explanatory variable correlation coefficients of the capital structure
equation................................................................................................ 114
Table 5.2: Explanatory variable correlation coefficients of the profitability
� ���
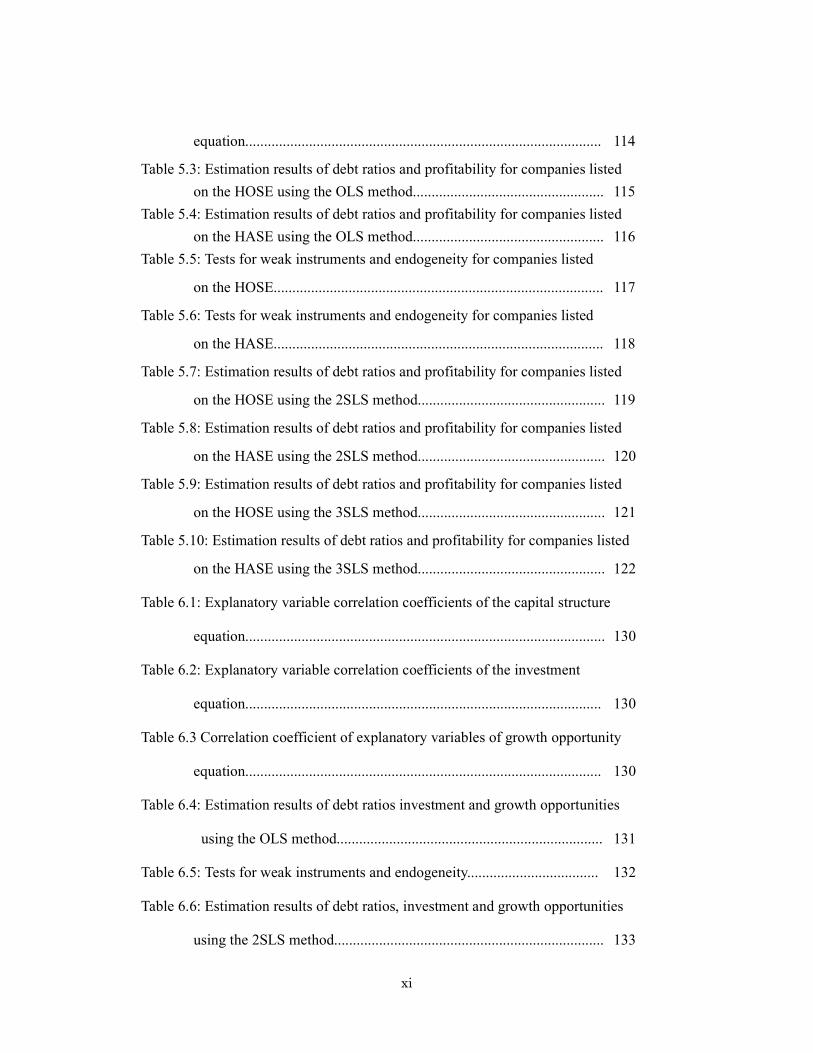
equation............................................................................................... 114
Table 5.3: Estimation results of debt ratios and profitability for companies listed
on the HOSE using the OLS method................................................... 115
Table 5.4: Estimation results of debt ratios and profitability for companies listed
on the HASE using the OLS method................................................... 116
Table 5.5: Tests for weak instruments and endogeneity for companies listed
on the HOSE........................................................................................ 117
Table 5.6: Tests for weak instruments and endogeneity for companies listed
on the HASE........................................................................................ 118
Table 5.7: Estimation results of debt ratios and profitability for companies listed
on the HOSE using the 2SLS method.................................................. 119
Table 5.8: Estimation results of debt ratios and profitability for companies listed
on the HASE using the 2SLS method.................................................. 120
Table 5.9: Estimation results of debt ratios and profitability for companies listed
on the HOSE using the 3SLS method.................................................. 121
Table 5.10: Estimation results of debt ratios and profitability for companies listed
on the HASE using the 3SLS method.................................................. 122
Table 6.1: Explanatory variable correlation coefficients of the capital structure
equation................................................................................................ 130
Table 6.2: Explanatory variable correlation coefficients of the investment
equation............................................................................................... 130
Table 6.3 Correlation coefficient of explanatory variables of growth opportunity
equation............................................................................................... 130
Table 6.4: Estimation results of debt ratios investment and growth opportunities
using the OLS method....................................................................... 131
Table 6.5: Tests for weak instruments and endogeneity................................... 132
Table 6.6: Estimation results of debt ratios, investment and growth opportunities
using the 2SLS method........................................................................ 133

� ����
Table 6.7: Estimation results of debt ratios, investment and growth opportunities
using the 3SLS method........................................................................ 134
� �����
� ������� ����� �
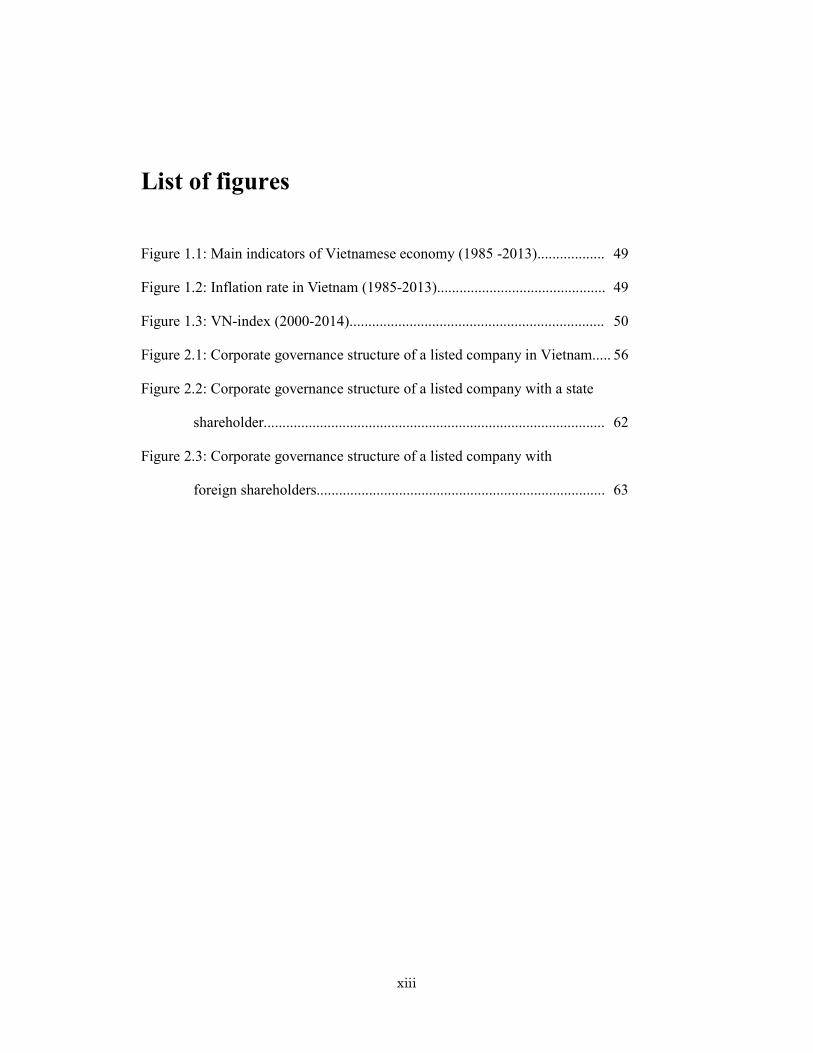
Figure 1.1: Main indicators of Vietnamese economy (1985 +2013).................. 49
Figure 1.2: Inflation rate in Vietnam (1985+2013)............................................. 49
Figure 1.3: VN+index (2000+2014).................................................................... 50
Figure 2.1: Corporate governance structure of a listed company in Vietnam..... 56
Figure 2.2: Corporate governance structure of a listed company with a state
shareholder........................................................................................... 62
Figure 2.3: Corporate governance structure of a listed company with
foreign shareholders............................................................................. 63

� ����
� ���
*�$������������
This dissertation is compiled from research papers that I wrote at the Graduate
School of Economics of Hitotsubashi University.
I am deeply grateful to my supervisor, Prof. Dr. Hidenobu Okuda, for his valuable
and helpful comments and instruction. Without his continuing support and
encouragement, I would never have completed this dissertation. I appreciate Prof. Dr.
Yukinobu Kitamura, Prof. Dr. Masaharu Hanazaki, Prof. Dr. Hiroshi Sato, Prof. Dr.
Fumiharu Mieno for their constructive comments and instruction. Their suggestions
reflect the improvement of this dissertation. I acknowledge Prof. Dr. Tran Van Tho,
Prof. Dr. Nishitani Mari for their support and encouragement. I also thank my uncle Lai
Van Khiet and Mr. Nguyen Duc Hoe who gave me the chance to study in Japan. I also
would like to thank Sojitz International Exchange Foundation, Epson International
Scholarship Foundation and Tokio Marine Kagami Memorial Foundation for their
financial supports during my study in Japan. I deeply thank my family, especially my
parents, my husband and my daughter, for their enduring supports.
Finally, my researches have been supported by Hitotsubashi University Global COE
Program “Research Unit for Statistical and Empirical Analysis in Social Sciences”.
June 2015
Lai Thi Phuong Nhung
� ��
�����������
���� ��� �� ������������
In 1986, Vietnam started the Doi moi which is a comprehensive reform programme of
the Vietnamese economy along with many other fields such as culture, society, foreign
affairs, etc. It marked the end to the central planning economic mechanism, and opened up
a new era for the Vietnamese economy – an era of socialist oriented market economy,
including diverse forms of ownership, industrialization and an opening up of the economy.
An important component of the economy reform was the reform of state owned companies
(SOCs). The aim of these reforms is to improve performance and competitive capability
and to reduce the number of SOCs. Among other measures, equitization has been one of
main instruments for reforming the SOCs effectively and quickly. During the 22 years of
implementation, a total of 3,875 SOCs has been equitized. The Ho Chi Minh Stock Trading
Centre (HoSTC) was opened in July 2000 and renamed the Ho Chi Minh Stock Exchange
(HOSE) in 2007. The Hanoi Stock Exchange (HASE) was opened in 2005. The stock
market has grown rapidly though not stably. By the end of 2011, there were 393 firms listed
on the HOSE and 301 firms listed on the HASE. Total market capitalization reached its
peak at the end of 2007 and equal to nearly 44 per cent of GDP.
This dissertation investigates the capital structure and its impacts on investment
behaviors and profitability of listed companies in Vietnam, with an emphasis on identifying
the characteristics of the state controlled companies in order to assess the effects of the
economic and corporate reforms in Vietnam since the Doi moi. Whether the corporate
sector, as a major domestic investor, can mobilize funds efficiently or not is a critical factor
in facilitating the transition to a market economy. In particular, because listed companies
are surrounded by a more developed institutional environment in comparison with other
companies, studying these companies helps to evaluate the effectiveness of the reforms in
Vietnam. Moreover, a feature of equitization in Vietnam is that the state still holds decisive
voting rights in many equitized SOCs. As such, finding out the characteristics of corporate
finance of such state controlled companies is also an interesting topic in order to assess the
reforms inVietnam.
� ��
����������������
The thesis is organized into seven chapters. Chapter 1 overviews the reform of state
owned companies (SOCs) as well as the stock markets, listed companies and the banking
sector in the context of the economic reform under the Doi moi policy in Vietnam, which
comprise the context for the objectives to be analyzed in the rest of the thesis. Chapter 2
introduces the characteristics of the ownership structure, corporate finance and corporate
governance of listed companies in Vietnam, which relate to the analyses in the following
chapters. Chapter 3 reviews both the theoretical and empirical literature on capital structure
and its impacts on investment, performance and growth opportunities for companies in the
context of corporate reform, which provides the background for the empirical study of
these issues, to be conducted in chapter 4, 5 and 6. It also sets up the hypotheses and
models for the empirical analyses conducted in these following three chapters. Chapter 4, 5
and 6 investigate on the basis of three models: (1) Capital structure and investment; (2)
Capital structure and profitability; and (3) Capital structure, growth opportunities and
investment, respectively, by using three estimation methods of OLS, 2SLS and 3SLS for
panel data covering the six year period of 2006 2011 to find out the characteristics of the
capital structure of listed companies in Vietnam and its impacts on investment, profitability
and growth opportunity. Chapter 7 summarizes the main contents of the prior chapters,
discusses the findings of the study as well as their implications and indicates some
limitations of the thesis which suggest some topics for future researches.
���������� �����
Chapter 1 overviews the reforms to economic and state owned companies (SOCs), as
well as the stock markets, listed companies and the banking sector in the context of the Doi
moi policy in Vietnam.
The equitization programme in Vietnam, which started in 1992, can be divided into three
stages, namely the pilot stage (from 1992 to 1996), the expansion stage (from 1996 to
2010) and the speed up stage (from 2011 to present). By the end of 2011 about 4,000 SOCs
had been equitized. Ho Chi Minh Stock Exchange (HOSE) and Hanoi Stock Exchange
(HASE) were established in 2000 and 2005 respectively, with the listing norms of the
� ��
HOSE being stricter than those of the HASE.
The main characteristics of the economic reform and SOC reform in Vietnam are (1)
most of the equitized SOCs are small in size, while the remaining 1,300 (which are also the
largest on the exchange) are fully state owned companies; (2) the development of stock
markets in Vietnam is linked with the equitization process; (3) institutional investors are
under represented in the stock markets in Vietnam; (4) the proportion of loans by state
owned commercial banks (SOCBs) in the economy has been falling year by year, to 51.7
per cent in 2011, while the proportion of total outstanding loans to SOCs has also been
declining steadily, to 16.7 per cent in September 2012; (5) The participation of foreign
investors both in term of foreign direct investment (FDI) and in stock market plays an
important part in the reform process in Vietnam.
���������� �����
Chapter 2 introduces the characteristics of the ownership structure, corporate finance and
corporate governance of listed companies in Vietnam, which sets the basis for the empirical
analyses in Chapters 4, 5 and 6.
One of the significant feature of the ownership structure of listed companies in Vietnam
is that the state continues to be a dominant shareholder, which has affects on the corporate
activities and corporate governance of these companies. Such companies may be in a
privileged position compared to other companies in raising funds, due to the fact that the
four big state owned or state controlled commercial banks still provide most of the loans to
the whole economy, but they may be less active in investment or less effective in operation.
Information asymmetry may be significant among listed companies, especially among
state controlled companies due to the lack of corporate information disclosure.
The policy of opening the economy is encouraging foreign investors to invest in Vietnam,
not only in the form of FDI but also in the stock markets, and foreign investors are now
allowed to own up to 50 per cent of a listed company. Along with the high contributions to
development of the Vietnamese economy, the penetration of foreign investors into the
stock markets is another characteristic of the ownership structure of listed companies in
Vietnam, which also has affects on these companies’ activities.
� ��
���������� �����
Chapter 3 reviews both the theoretical and empirical literature on capital structure and its
impacts on investment, performance and growth opportunities of companies in the context
of corporate reform. It also describes hypotheses, models and data set for empirical
analyses to be conducted in the following three chapters.
Corporate finance is a hot topic among developing and transitional countries as a means
to assess the effectiveness of economic reforms and corporate reforms of these countries.
Most of the empirical studies on the issue of transitional countries concentrate on Eastern
Europe countries and China, though there are still few empirical studies on Vietnam. The
modern corporate finance theories which well explain the capital structures of companies in
developed countries, including trade off theory, pecking order theory and agency cost
theory, are frequently used in these studies.
This chapter also formulates hypotheses to assess the results of economic reforms and
corporate reforms in Vietnam based on these modern corporate finance theories. As for the
determinants of capital structure, according to the trade off approach, corporate tax is
expected to have a positive relation, non debt tax shields are expected to have a negative
relation and bankruptcy risk is expected to have a positive relation to companies’ debt
ratios. According to the agency cost approach, collateral can reduce the agency cost of
procuring debt funds, thus a positive relation to corporations’ debt ratios is expected, while
internal funds have lower agency cost than other sources of funds and thus a negative
relation to the debt ratios is expected. Regarding the relation between capital structure and
investment, listed companies in Vietnam may cope with overinvestment because of the
easy lending of banks in the boom period or underinvestment because of the cautious
lending of banks in the after boom period. As for the relation between leverage and
profitability, there are two possiblities. In Vietnam, the creditor’s monitoring of a
company’s business operations is not sufficient and the corporate governance of the
borrowing company is inadequate. Thus, the company may use the loans ineffectively, and
an increase in debt may worsen the profitability of the company. Regarding the impacts of
leverage on investment and growth opportunities, there are possiblitites of underinvestment,
overinvestment or soft budget constraints among listed companies in Vietnam.
This chapter also introduces other hypotheses about the impacts of state ownership and
� ��
foreign ownership on capital structure, investment, profitability and growth opportunities.
State controlled companies may have weaker incentives to adjust their debt ratios to attain
tax savings, lower bankruptcy risk due to implicit guarantees of the state and easier access
to state owned bank loans regardless of their collateral due to their closer relationships with
state owned banks. State controlled companies may be more active in investing than other
companies due to their function as tools for implementing government policies or they
make less use of good investment opportunities due to their less profit oriented
characteristic. They also may have higher profitability due to their advantages in raising
funds from state owned or state controlled banks or less profitability due to their lower
level of independence from the state in terms of business management. These companies
may have a more severe problem of soft budget constraint, which is often observed among
companies in transitional countries. Foreign affiliated companies are assumed to have less
debt ratios, higher invesment ratio and better performance due to the strict requirement of
information disclosure and strict monitoring of business operations.
This thesis use 3 models: (1) Capital structure and investment; (2) Capital structure and
profitability; (3) Capital structure, growth opportunities and investment, which are formed
from four equations related to capital structure, investment, profitability and growth
opportunities. The three estimation methods of OLS, 2SLS and 3SLS are used to estimate
these three models. Cragg Donald statistic and Durbin Wu Hausman Test are conducted to
check the weak instrument variables and endogeneity for using 2SLS and 3SLS method.
���������� �����
Chapter 4 investigates the capital structure and investment activities of listed companies
in Vietnam, using panel data covering the six year period 2006 2011 of 435 companies
listed on the HOSE and on the HASE.
The empirical analysis identifies some key features of fundraising structure and their
effects on investment behaviors of listed companies in Vietnam. In terms of fund
mobilization and corporate financing, the economic reform regime (Doi moi) implemented
by the Vietnamese government, which aims to create an economic system based on market
mechanisms, have achieved some of their goals. However, the economic reforms still have
several limitations, such as the opaque relationship between state controlled companies and
� ��
government banks and inactive investment on the part of state controlled companies.
���������� �����
Chapter 5 conducts an empirical analysis on the capital structure and its impacts on
profitability of 435 listed companies in Vietnam, using panel data for the two periods of
2006–2008 and 2009 2011.
The estimation results show that, first, compared to Vietnamese small and medium
sized enterprises, the capital structures of listed companies better matched the features of
standardized corporate financing theories. Second, on the other hand, weak corporate
governance and insufficient monitoring by creditors influenced the listed companies to
excessively borrow in both periods, before and after the Lehman shock. Third, the state
controlled companies listed on HOSE are likely to have an advantage over other companies
in accessing loans and earning profits even after the boom period. Forth, while foreign
affiliated companies were not conspicuous in terms of profitability during the boom period,
they showed their superiority through better production technology and management in the
period after the boom.
These findings suggest that reforming the Vietnamese market requires the development
of a system that ensures information transparency and independent corporate governance,
enhances financial opening and increases privatization of state owned companies,
including those in the banking sector.
���������� �����
Chapter 6 examines the influence of capital structure on investment activities and
growth opportunities of listed companies in Vietnam, using panel data covering the six year
period of 2006–2011 for the companies listed on the HOSE.
The estimation analysis revealed two major findings. First, in general, there is an over
investment problem among listed companies in Vietnam and debt financing plays a role in
minimizing this problem. Second, the state controlled companies face a soft budget
constraint problem, which is common in transition economies.
These results imply that state owned banks in Vietnam seem to impose fewer
restrictions or lower levels of monitoring on loans to state controlled companies. Therefore,
� ��
further reform in the banking sector and in state controlled companies and further
disclosure of corporate information are needed to resolve the opaque collusion between
state controlled companies and state owned banks and to protect outside creditors.
���������� �����
Chapter 7 summarizes the main contents of the previous chapters, discusses the
findings of the study as well as their implications and indicates some limitations of the
thesis which suggest some topics for future researches.
According to the empirical analyses, the overall picture of corporate finance for these
companies seems obvious. First, financing structures of non state controlled listed
companies in Vietnam have features that conform well to economic theory and a market
economy. Second, the state still remains a controlling shareholder in many former state
owned companies and has controlling rights in these firms’ activities, which enables these
companies to make use of their close relationship with the government to access loans with
preferable conditions, although their fund using activities remain inefficient. Third, the five
big state owned or state controlled commercial banks are still supplying loans to most of
the domestic demand, and still impose preferable conditions and less strict monitoring of
loans to state controlled companies. Fourth, fund raising through the stock market is still
underdeveloped, and the fund raising activities of listed firms in Vietnam still relies on debt
financing such as bank loans.
These empirical analyses have some notable implications. Contrary to what is
suggested by the analysis on Vietnamese small and medium sized enterprises (SMEs) in
Nguyen (2006) and Biger et al. (2008), the capital structures of listed companies in
Vietnam are relatively well matched to the features of standardized corporate financing
theory. However, the market environment surrounding Vietnamese listed companies still
has many problems which need to be improved, such as information asymmetry, need for
institutional reforms including the development of a system that ensures independent
corporate governance and transparency of information and the accelation of privatization of
state owned companies and banks.
The thesis still has several limitations relating to the data set which suggest need for
further researches in the future. The data set of the empirical study was unbalanced panel
� �
data for the period of 2006 2011 of companies listed before 2009. Companies listed after
that and data for the period after 2011 should be added to the data set in order to investigate
the effectiveness of the economic reform and corporate reform over a longer period.
�
�
�
�
�
�
�
�
�
�
�
�
�
�
�
�
�
�
�
�
�
�
�
�
�
�
�
�
�
�
�
�
�
�
�
�
�
�
�
�
�
�
�
�

� �
�� �����
������������� �������� ������������� �
This chapter provides an overview of the reform of state owned companies (SOCs) in
the context of the economic reform in Vietnam. In 1986, Vietnam officially started the Doi
moi policy, which is a reform program of not only economic but also of many other fields
such as culture, society, foreign affairs, etc. The general objectives of the economic reform
under the Doi moi are to eliminate the central planning mechanism, to apply a socialist
oriented market economy mechanism, to allow multiple forms of possession, and to
industrialize and open the economy. The specific objectives are decided in each period
under five year plans. Under the Doi moi, the economic structure has changed greatly.
Goods subsidization has reduced rapidly. Trade has been liberalized gradually. Vietnam has
become an exporter of many goods, and has joined several free trade agreements. Apart
from SOCs, private owned companies and companies of other possession forms are
accepted and encouraged. Many laws have been created or revised to support domestic and
foreign investment.
The development of companies is a decisive factor for the sucess of economic transition.
Thus, corporate reform is put as a central issue of the economic reform. In a transition
economy like Vietnam, there are many SOCs which are inefficient and have been obstacle
to the development of the economy. Therefore, restructuring these companies has been
considered as a main component of the economic reform and corporate reform programme.
Some comprehensive measures which focused on enhancing the performance, competitive
capability and reducing the number of SOCs have been launched. Among these measures,
equitization has been a main instrument to reform the SOCs effectively and quickly.
Accordingly, many joint stock companies have been born, which accelerated the
establishment and development of stock markets. Besides, the banking sector is also
reformed to support the development of the economy, such as the equitization of state
� ���
owned commercial banks, the liberalization of interest rate, the openning of the banking
sector to the foreign investment.
Chapter 1 is structured as follows. Section 1 summarizes the contents of the economic
reform under the Doi moi policy in Vietnam. Section 2 briefs the corporate reforms in
Vietnam, including reforms of SOCs, formation and development of stock markets, and
reforms of banking sector. Section 3 describes the reform of SOCs in detail, with an
emphasis on the equitization of these companies. Section 4 introduces the stock markets in
Vietnam with a focus on the listed companies. Section 5 provides an overview of the
banking sector and the reform of this sector. Section 6 concludes the chapter.
1.1�Economic reform in Vietnam
1.1.1� Context of economic reform in Vietnam
After the unification of the country in 1975, Vietnam countinued the central planning
mechanism1 in a nation wide scale and started a five year plan2 for the 1976 1980 period
under the Fourth National Congress of the Vietnam Communist Party 3. The targets of this
plan were to achieve annual growth rates of 13 14 per cent for GDP, 8 10 per cent for
agricultural production, 16 18 per cent for industrial production, 7.5 8 per cent for social
productivity. However, by 1979 this five year plan clearly failed to solve the serious
���������������������������������������������������1 Central planning mechanism is an economic mechanism in which decisions regarding production, distribution, pricing and investment are embodied in a plan formulated by a central authority, usually by a public body such as a government agency, upon a macro economic plan. 2 Five year plans are a series of economic development initiatives, which start after each National Congress of the Vietnam Communist Party. A five year plan decides the objectives, orientation and methods for the development of Vietnam economy in that five year period. The first five year plan was for the 1961 1965 period and applied for the North Vietnam only. Since unification of the country in 1975, the five year plan was for the entire country for every five year period afterward. The recent five year plan is for the period of 2011 2015. 3 The National Congress is the supreme organ of the Communist Party of Vietnam. Since the Foundation Conference of the Communist Party of Vietnam in 1930, the first three congresses were not fixed to a common time schedule during the time of wars against France and the United States. It has been held every five years since the 4th National Congresses in 1976. The latest one is the 11th National Congresses which have been held in January 2011. The National Congress elects the Central Committee which is the highest authority within the Communist Party of Vietnam. The Central Committee usually meets twice a year.

� ���
problems facing the newly unified economy. Vietnamese economy remained facing with
small scale production, low labor productivity, unemployment, shortage of materials and
technology, and insufficiency of foods and consumer goods. Vietnamese government
started to reconsider the recent economic model. The decree 25/CP which was issued on
January 21, 1981 partly gave the factories the autonomy in establishing and implementing
their production plans by the so called Three Plan System4. However, the economy as a
whole was still in the central planning mechanism. In general, the targets of this five year
plan were too high to reach. Besides, the political and economic isolation and the bad
agricultural harvest5 in Vietnam also affected. Thus, none of the targets of the plan were
met. The average growth rates of GDP, agricuture and industry were only 0.4 per cent, 1.9
per cent and 0.6 per cent, respectively which were much lower than the targeted rates. The
economy was in a serious strain during the late of 1970s.
In the context of big failures of the prior five year plan which led the economy to face
with the threat of economic crisis, the fifth National Congress of the Communist Party of
Vietnam was held in March 1982 and a five year plan was started for the 1981 1985 period
with an attempt to address those problems. The plan's highest priority was to develop
agriculture by integrating the collective and individual sectors into an overall system which
emphasizes intensive cultivation and crop specialization and by employing science and
technology. Economic policy encouraged the development of the "family economy" which
is the peasants' personal use of economic resources, including land, not being used by the
���������������������������������������������������4 This system requires a state owned factory to have three plans which are different in the ability of the factory in acquiring inputs, caculating costs, deciding and disposing outputs, and using profits. The first plan is mandatory. Under this plan, the factory has to use inputs provided by the state to produce and supply low price outputs to the state, while the profits have to be transferred to the state budget. When the factory has surplus capacity, it could use a second plan under which the factory freely mobilizes inputs by itself to produce the products specified in the first plan. Outputs of this plan are regularly sold to trading SOEs, and also are disposed in the free market. Third plan is non compulsory and is established by the factory. Under this plan, inputs are freely acquired and outputs are freely disposed in the free market. Outputs usually concerned minor products that are made through the factory’s own attempts at diversification. Profits under the second and third plan could be retained by the factory with a predetermined proportion. 5 Aids from other countries which included such important goods as rices, sugar, milk, clothes, medicines, etc reduced, while expenditures for defense increased rapidly since the conflicts with Cambodia in the Southern border and with China in the North border, and Mekong delta which was an important agricutural area suffered big flood.
� ���
cooperative. The plan also stressed the development of small scale industry to meet needs
of materials of Vietnam, create goods for exporting, and lay the foundation for the
development of heavy industry. The industrial sector received a larger share of state
investment during this period6. Production autonomy was granted at the factory and farm
levels. Government expenditures was tried to reduce by ending state subsidies on foods and
certain consumer goods for state employees. All relevant costs to the national government
were included in production costs and the state stoped compensating for losses of state
owned companies. As a result, there were some considerable achievements such as the
average growth rates of GDP, agricuture and industry were 6.4 per cent, 4.9 per cent and
9.5 per cent respectively, which were much higher than those of the prior period. However,
they were not able to rescue the economy thoroughly because these measures were a mix of
old and new models, and the economy was still stagnating with high state budget deficit
and high inflation.
In order to revive the economy and control inflation, a policy package of price, wage
and monetary reform was launched in September 1985. This reform required to caculate all
rational costs to the production, apply the single price machanism in price system, assure
that employees can live by the salary and give the financial autonomy right to every
industry and economy entity. However, this policy package was a failure because the prices
of inputs were decided to reduce to 70 per cent of the planed prices, while salary were
decided to increase 100 per cent of the planned level, which resulted in a substantial state
budget deficit. The deficit could only be financed by printing money, which strongly
contributed to the pre existing inflationary tendency. The consumer price index was 453.54
per cent in 1986. Employees had no salary. Inputs and goods were scarced. Agricultural
production and investment in industry declined.
The unexpected macroeconomic impacts of the policy package urged the Goverment to
take more drastic economic reform measures. The Sixth National Party Congress in
December 1986 marked an important shift in the economic reforms when the government
decided to make changes thoroughly. The central planning mechanism was decided to be
���������������������������������������������������6 For example, in 1982, the approximate proportion was for industry and agriculture was 53 per cent and 18 per cent, respectively.
� ���
removed completely and replaced by a socialist oriented market economy mechanism. This
economic reform is often referred to as Doi moi in Vietnamese.
Doi moi is a comprehensive reform program, in which economic reform is basic. The
general objectives of the economic reform under the Doi moi are to eliminate the central
planning mechanism, apply a socialist oriented market economy mechanism, multiply
forms of possession, industrialize and open the economy. The specific objectives are
decided in each period under five year plans.
1.1.2� Economic reform in Vietnam under the Doi moi
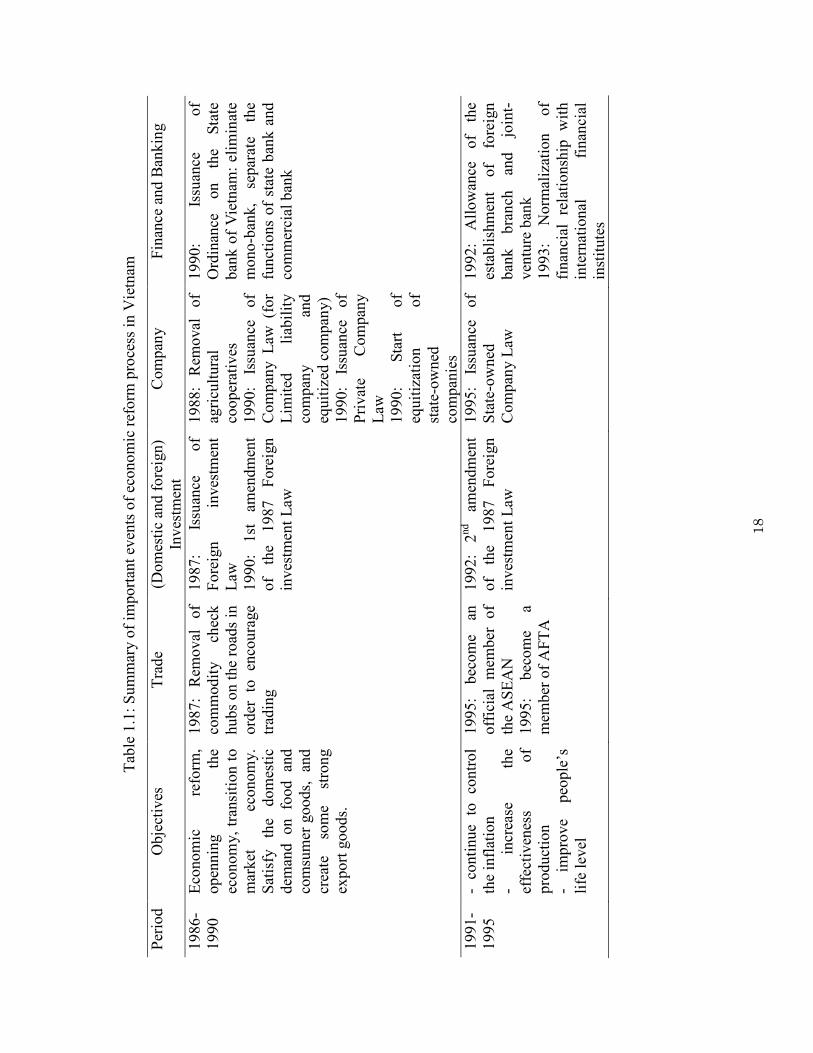
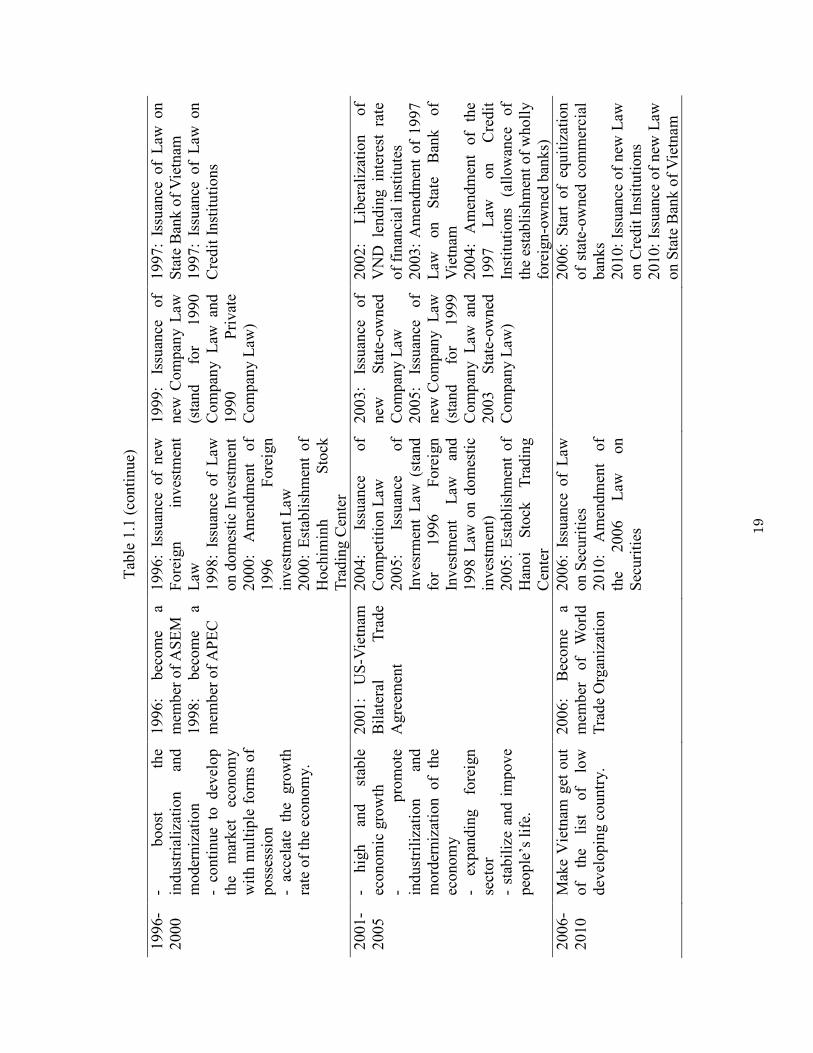
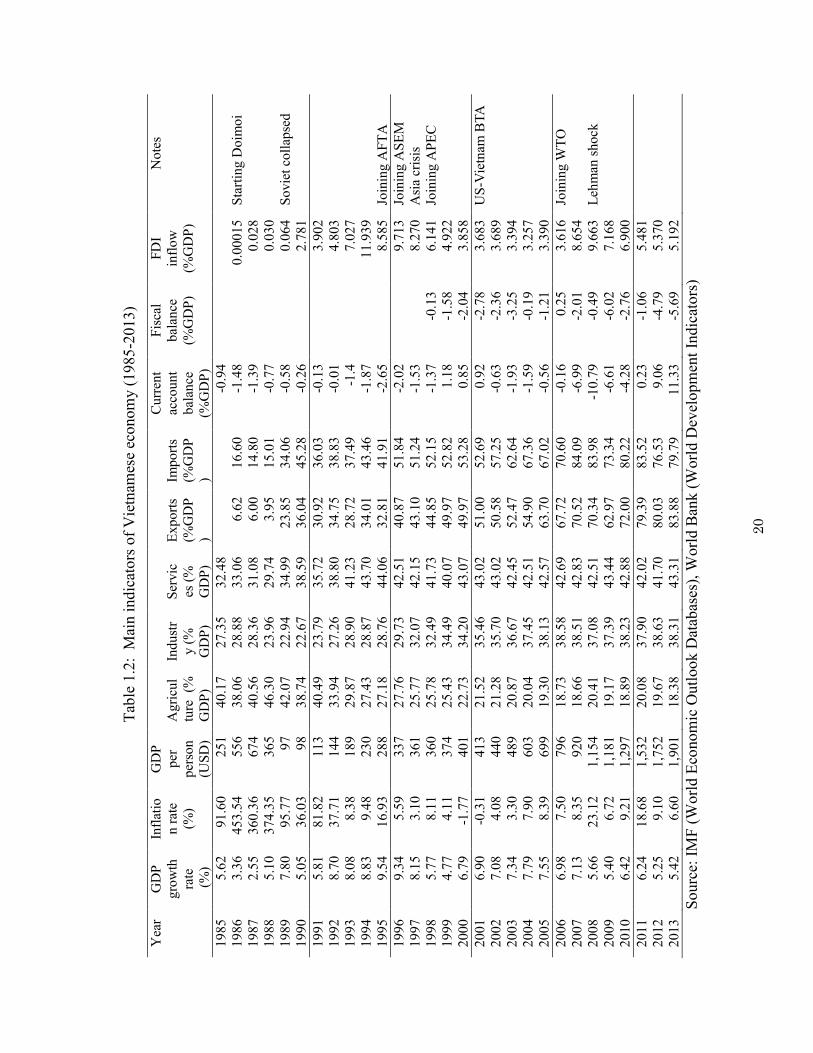
The economic reform in Vietnam under the Doi moi has been implemented in many
fields. Table 1.1 summarizes important events of economic reform in Vietnam, and Table
1.2 shows some main indicators of Vietnamese economy in the period of 1985 2013.
(a) Agricultural development
Before the Doi moi, Vietnam was an agricultural and underdeveloped country.
Although approximately 75 per cent of the labor force was engaged in agricultural
production, the country still faced a serious shortage of foods. Under the Doi moi,
agricultural and rural development was prioritized as it was crucial to poverty reduction
and a sound agriculture sector could be a driving force for economic growth. Various
measures were implemented, such as erasing collective farming by Land Law in 1987 and
resolution 10 in 1988; maintaining a fairly egalitarian system of land holding which
ensured the access to farm land by rural households; applying new technology in
agriculture; diversifying from rice to other higher value agricultural production; making
agricultural input and output markets more competitive and efficient, etc.��
As a result, agricultural productivity was boosted and labor was shifted from the
traditional agricultural sector to industrial, construction, and service sectors7. From a food
imported country, Vietnam became a major exporter of rice in 1989 and a strong exporter
of many other agricultural products, such as coffee, cashew nuts, rubber, pepper, etc.
���������������������������������������������������7 The share of employment in non agriculture sectors was 45 per cent in 2008, compared with 25 per cent in 1985.
� ���
(b) Liberalization of trade
Before the Doi moi, goods was not traded freely inside Vietnam. Foreign trade
transactions were almost with other socialist countries and not under the market mechanism.
Under the Doi moi, commodity check hubs were removed since 1987 in order to encourage
domestic trading. Vietnam also integrated actively into the world economy. In 1995,
Vietnam became an official member of the Association of South East Asia Nations
(ASEAN) and the ASEAN Free Trade Area (AFTA) which requires Vietnam to liberalize
trade step by step. Especially, Vietnam signed US Vietnam Bilateral Trade Agreement in
2001 and joined the World Trade Organization (WTO) in 2006.
As a result, the exports as a ratio of gross domestic product (GDP) rose from 24 per
cent in 1989 to nearly 84 per cent in 2013, while the ratio of imports to GDP also increase
to about 80 per cent in 2013 from 34 per cent in 1989.
(c) Encouragement of domestic and foreign investment
Before 1988, there were no private enterprises operating in Vietnam. Law on Domestic
Investment was first issued in 1998 to encourage the investment of domestic investors.
Foreign investment was encouraged through the first issuance of the Law on Foreign
Investment in 1987 and its amendment in 1990. A new Law on Foreign Investment was
issued in 1996, stand for the 1987 Law on Foreign Investment and it then was amended in
2000 in oder to create a more open investment environment to the foreign investors. The
new issuance of Competition Law in 2004 and Investment Law in 2005 standing for the
1996 Law on Foreign Investment and the 1998 Law on Domestic Investment also created
an environment where domestic and foreign entities are equally treated.
FDI has played an important role in the development of Vietnamese economy. Its ratio
to GDP was high during the period of 1993 1997, about 8 12 per cent, and during 2007
2010 period of 7 10 per cent. FDI sector helped creating jobs and boosted the development
of the manufacturing sector in Vietnam which linked with the increase of exports as well as
the structural changes of exports. In the late 1980s, about 80 per cent of exports were
accounted for by primary commodities, such as rice, coffee, crude oil, and coal, but by
2005, along with the expansion of manufactured exports, that share had declined to about
50 per cent.

� ���
Especially, the Ho Chi Minh Stock Exchange Center was established in 2000 for the
companies to raise medium long term funds. The Ha Noi Stock Trading Center was
established in 2005, with less strict listing conditions than the Ho Chi Minh Stock
Exchange for more companies being able to raise funds on the stock markets. Law on
Securities was newly issued in 2006 and then amended in 2010 in order to make a good
environment for the development of stock markets in Vietnam.
(d) Corporate sector reform
By 1986, Vietnam applied a central planning mechanism to the economy under which
private owned companies were prohibited while state owned companies made big losses
and were not efficient. Under the Doi moi, various forms of ownership were allowed. The
start of equitization process of state owned companies in 1990, the issuance of Company
Law for limited liability company and equitized company as well as the issuance of Private
Company Law in 1990 were very first steps of recognizing non state possession forms in
the economy. In 1995, State owned Company Law was issued. In 1999, a new Company
Law was issued to stand for the 1990 Company Law and the 1990 Private Company Law,
which regulated on non state owned companies. In 2003, State owned Company Law was
issued to stand for the 1995 State owned Company Law. After that, the issuance of a new
Company Law in 2005 standing for the 1999 Company Law, the 2003 State owned
Company Law and the regulations on foreign affiliated companies of the 1996 Foreign
Investment Law showed that companies of every possession forms in the economy are
treated equally under the same law. Companies of every forms of possession were
encouraged to develop regardless of scales. Administration reforms were also promoted in
order to simplize administrative procedures.
Before the Doi moi, the state decided both inputs, outputs and prices of the production
of SOCs. Under the Doi moi, SOCs were given the autonomy to formulate and implement
their own long term, medium term and short term operating plans based on socio
economic development guidelines set by the Government. SOCs could directly sell their
products to other trading companies or even to final consumers. Profits computed on the
basis of real costs were retained by the SOC and used at their own discretion, except for
compulsory transfers to the state budget. However, SOCs were still not efficient. Since
� ���
1991, the restructuring of SOCs has started in order to improve the performance of these
companies. Among forms of restructuring and reforming SOCs, equitization has been the
main instrument. A pilot plan of equitization for several SOCs started in 1990, and then an
equitization programme was officially launched from mid 1992.
(e) Reform in banking sector
Before the Doi moi, the banking system in Vietnam was mono bank where the State
Bank of Vietnam (SBV) functioned as both a central bank and a commercial bank. Since
the 1990 Ordinance on the State Bank of Vietnam, the SBV acted as a central bank. Beside
the two existing state owned commercial banks (SOCBs), other two state owned
commercial banks, were newly created and Joint stock commercial banks (JSCBs), joint
venture banks (JVBs) and foreign bank branches were permitted. Wholly foreign owned
banks (FFOBs) was permitted since 2007. In 2006, the government announced the
equitization or partial privatization of SOCBs and the reduction of government ownership
to 51 per cent by 2010.
Under the centrally planned economy, interest rate was imposed by subsidized policy
and independent from the international interest rate. Since the economic reform, interest
rate has been liberalized gradually.
(f) General achievements of economic reform under the Doi moi
After nearly 30 years implementing the Doi moi, Vietnam had made some remarkable
achievements.
First, Vietnam experienced high and stable economic growth rate of around 8 9 per
cent during the period of 1992 1997. Affected by the Asia crisis, the GDP growth rate
reduced to 4 5 per cent in 1998 1999, but increased again to 7 8 per cent during the 2000
2007 period.
Second, inflation has been controlled and turned from three digit to two digit levels in
1989, and declined further to one digit levels since 1996 (it increased again to two digit
levels only in 2008 due to the affects of the Lehman shock).
Third, the ratio of poverty population has declined rapidly, from about 70 per cent at
the end of the 1980s to about 10 per cent since 2004. According to the World Bank’s

� ���
classification, Vietnam has been able to escape the poverty trap and emerge as a lower
middle income economy in 2008, when the country’s per capita gross national income
surpassed the threshold of US$1,000.
���
Tab
le 1
.1:
Sum
mar
y o
f im
port
ant
even
ts o
f ec
ono
mic
ref
orm
pro
cess
in V
ietn
am
Per
iod
Obje
ctiv
es
Tra
de
(Dom
esti
c an
d f
ore
ign)
Inv
estm
ent
Com
pan
y
Fin
ance
and B
ankin
g
1986
1990
Eco
nom
ic
refo
rm,
open
nin
g
the
econom
y,
tran
siti
on t
o
mar
ket
ec
onom
y.
Sat
isfy
th
e dom
esti
c dem
and
on
food
and
com
sum
er g
oods,
an
d
crea
te
som
e st
ron
g
export
goods.
1987:
Rem
oval
of
com
modit
y
chec
k
hubs
on t
he
road
s in
ord
er
to
enco
ura
ge
trad
ing
1987:
Issu
ance
of
Fore
ign
inves
tmen
t L
aw
1990:
1st
am
endm
ent
of
the
1987
Fore
ign
in
ves
tmen
t L
aw
1988:
Rem
oval
of
agri
cult
ura
l co
oper
ativ
es
1990:
Issu
ance
of
Com
pan
y L
aw (f
or
Lim
ited
li
abil
ity
com
pan
y
and
eq
uit
ized
com
pan
y)
1990:
Issu
ance
of
Pri
vat
e C
om
pan
y
Law
1990:
Sta
rt
of
equit
izat
ion
of
stat
e ow
ned
co
mpan
ies
1990:
Issu
ance
of
Ord
inan
ce
on
the
Sta
te
ban
k o
f V
ietn
am:
elim
inat
e m
ono b
ank,
separ
ate
the
funct
ions
of
stat
e b
ank a
nd
com
mer
cial
ban
k
1991
1995
co
nti
nue
to
contr
ol
the
infl
atio
n
in
crea
se
the
effe
ctiv
enes
s of
pro
duct
ion
im
pro
ve
peo
ple
’s
life
lev
el
1995:
bec
om
e an
off
icia
l m
ember
of
the
AS
EA
N
1995:
bec
om
e a
mem
ber
of
AF
TA
1992:
2nd
amen
dm
ent
of
the
1987
Fore
ign
in
ves
tmen
t L
aw
1995:
Issu
ance
of
Sta
te o
wned
C
om
pan
y L
aw
1992:
All
ow
ance
o
f th
e es
tabli
shm
ent
of
fore
ign
ban
k
bra
nch
an
d
join
t ven
ture
ban
k
1993:
Norm
aliz
atio
n
of
finan
cial
re
lati
onsh
ip
wit
h
inte
rnat
ional
fi
nan
cial
in
stit
ute
s
���
Tab
le 1
.1 (
conti
nue)
1996
2000
boost
th
e in
dust
rial
izat
ion
and
moder
niz
atio
n
co
nti
nue
to dev
elop
the
mar
ket
ec
onom
y
wit
h m
ult
iple
form
s of
poss
essi
on
ac
cela
te
the
gro
wth
ra
te o
f th
e ec
onom
y.
1996:
bec
om
e a
mem
ber
of
AS
EM
1998:
bec
om
e a
mem
ber
of
AP
EC
1996:
Issu
ance
of
new
F
ore
ign
inves
tmen
t L
aw
1998:
Issu
ance
of
Law
on d
om
esti
c In
ves
tmen
t 2000:
Am
endm
ent
of
1996
Fore
ign
in
ves
tmen
t L
aw
2000:
Est
abli
shm
ent
of
Hoch
imin
h
Sto
ck
Tra
din
g C
ente
r
1999:
Issu
ance
of
new
Com
pan
y L
aw
(sta
nd
for
1990
Com
pan
y
Law
an
d
1990
Pri
vat
e C
om
pan
y L
aw)
1997:
Issu
ance
of
Law
on
Sta
te B
ank o
f V
ietn
am
1997:
Issu
ance
of
Law
on
Cre
dit
Inst
ituti
ons
2001
2005
hig
h
and
stab
le
econom
ic g
row
th
pro
mote
in
dust
rili
zati
on
and
mord
erniz
atio
n
of
the
econom
y
ex
pan
din
g
fore
ign
se
ctor
st
abil
ize
and i
mpove
peo
ple
’s l
ife.
2001:
US
Vie
tnam
B
ilat
eral
T
rade
Agre
emen
t
2004:
Issu
ance
of
Com
pet
itio
n L
aw
2005:
Issu
ance
of
Inv
esrm
ent
Law
(st
and
fo
r 1996
Fore
ign
In
ves
tmen
t L
aw
and
1998 L
aw o
n d
om
esti
c in
ves
tmen
t)
2005:
Est
abli
shm
ent
of
Han
oi
Sto
ck
Tra
din
g
Cen
ter
2003:
Issu
ance
of
new
S
tate
ow
ned
C
om
pan
y L
aw
2005:
Issu
ance
of
new
Com
pan
y
Law
(s
tand
for
1999
Com
pan
y
Law
an
d
2003
Sta
te o
wned
C
om
pan
y L
aw)
2002:
Lib
eral
izat
ion
of
VN
D le
ndin
g in
tere
st ra
te
of
finan
cial
inst
itute
s 2003:
Am
endm
ent
of
19
97
Law
on
Sta
te
Ban
k
of
Vie
tnam
2004:
Am
endm
ent
of
the
1997
Law
on
Cre
dit
In
stit
uti
ons
(all
ow
ance
of
the
esta
bli
shm
ent
of
wholl
y
fore
ign o
wn
ed b
anks)
2006
2010
Mak
e V
ietn
am g
et o
ut
of
the
list
of
low
dev
elopin
g c
ountr
y.
2006:
Bec
om
e a
mem
ber
of
Worl
d
Tra
de
Org
aniz
atio
n
2006:
Issu
ance
of
Law
on S
ecuri
ties
2010:
Am
endm
ent
of
the
2006
Law
on
S
ecuri
ties
2006:
Sta
rt of
equit
izat
ion
of
stat
e ow
ned
com
mer
cial
ban
ks
2010:
Issu
ance
of
new
Law
on C
redit
Inst
ituti
ons
2010:
Issu
ance
of
new
Law
on S
tate
Ban
k o
f V
ietn
am
����
Tab
le 1
.2:
Mai
n i
ndic
ato
rs o
f V
ietn
ames
e ec
onom
y (
1985
2013)
Yea
r G
DP
gro
wth
ra
te
(%
)
Infl
atio
n r
ate
(%)
GD
P
per
per
son
(US
D)
Agri
cul
ture
(%
G
DP
)
Indust
ry (
%
GD
P)
Ser
vic
es (
%
GD
P)
Export
s (%
GD
P)
Import
s (%
GD
P)
Curr
ent
acco
unt
bal
ance
(%
GD
P)
Fis
cal
bal
ance
(%
GD
P)
FD
I in
flow
(%
GD
P)
Note
s
1985
5.6
2
91.6
0
251
40.1
7
27.3
5
32.4
8
0.9
4
1986
3.3
6
453.5
4
556
38.0
6
28.8
8
33.0
6
6.6
2
16.6
0
1.4
8
0.0
0015
Sta
rtin
g D
oim
oi
1987
2.5
5
360.3
6
674
40.5
6
28.3
6
31.0
8
6.0
0
14.8
0
1.3
9
0.0
28
1988
5.1
0
374.3
5
365
46.3
0
23.9
6
29.7
4
3.9
5
15.0
1
0.7
7
0.0
30
1989
7.8
0
95.7
7
97
42.0
7
22.9
4
34.9
9
23.8
5
34.0
6
0.5
8
0.0
64
Sovie
t co
llap
sed
1990
5.0
5
36.0
3
98
38.7
4
22.6
7
38.5
9
36.0
4
45.2
8
0.2
6
2.7
81
1991
5.8
1
81.8
2
113
40.4
9
23.7
9
35.7
2
30.9
2
36.0
3
0.1
3
3.9
02
1992
8.7
0
37.7
1
144
33.9
4
27.2
6
38.8
0
34.7
5
38.8
3
0.0
1
4.8
03
1993
8.0
8
8.3
8
189
29.8
7
28.9
0
41.2
3
28.7
2
37.4
9
1.4
7.0
27
1994
8.8
3
9.4
8
230
27.4
3
28.8
7
43.7
0
34.0
1
43.4
6
1.8
7
11.9
39
1995
9.5
4
16.9
3
288
27.1
8
28.7
6
44.0
6
32.8
1
41.9
1
2.6
5
8.5
85
Join
ing A
FT
A
1996
9.3
4
5.5
9
337
27.7
6
29.7
3
42.5
1
40.8
7
51.8
4
2.0
2
9.7
13
Join
ing A
SE
M
1997
8.1
5
3.1
0
361
25.7
7
32.0
7
42.1
5
43.1
0
51.2
4
1.5
3
8.2
70
Asi
a cr
isis
1998
5.7
7
8.1
1
360
25.7
8
32.4
9
41.7
3
44.8
5
52.1
5
1.3
7
0.1
3
6.1
41
Join
ing A
PE
C
1999
4.7
7
4.1
1
374
25.4
3
34.4
9
40.0
7
49.9
7
52.8
2
1.1
8
1.5
8
4.9
22
2000
6.7
9
1.7
7
401
22.7
3
34.2
0
43.0
7
49.9
7
53.2
8
0.8
5
2.0
4
3.8
58
2001
6.9
0
0.3
1
413
21.5
2
35.4
6
43.0
2
51.0
0
52.6
9
0.9
2
2.7
8
3.6
83
US
Vie
tnam
BT
A
2002
7.0
8
4.0
8
440
21.2
8
35.7
0
43.0
2
50.5
8
57.2
5
0.6
3
2.3
6
3.6
89
2003
7.3
4
3.3
0
489
20.8
7
36.6
7
42.4
5
52.4
7
62.6
4
1.9
3
3.2
5
3.3
94
2004
7.7
9
7.9
0
603
20.0
4
37.4
5
42.5
1
54.9
0
67.3
6
1.5
9
0.1
9
3.2
57
2005
7.5
5
8.3
9
699
19.3
0
38.1
3
42.5
7
63.7
0
67.0
2
0.5
6
1.2
1
3.3
90
2006
6.9
8
7.5
0
796
18.7
3
38.5
8
42.6
9
67.7
2
70.6
0
0.1
6
0.2
5
3.6
16
Join
ing W
TO
2007
7.1
3
8.3
5
920
18.6
6
38.5
1
42.8
3
70.5
2
84.0
9
6.9
9
2.0
1
8.6
54
2008
5.6
6
23.1
2
1,1
54
20.4
1
37.0
8
42.5
1
70.3
4
83.9
8
10.7
9
0.4
9
9.6
63
Leh
man
shock
2009
5.4
0
6.7
2
1,1
81
19.1
7
37.3
9
43.4
4
62.9
7
73.3
4
6.6
1
6.0
2
7.1
68
2010
6.4
2
9.2
1
1,2
97
18.8
9
38.2
3
42.8
8
72.0
0
80.2
2
4.2
8
2.7
6
6.9
00
2011
6.2
4
18.6
8
1,5
32
20.0
8
37.9
0
42.0
2
79.3
9
83.5
2
0.2
3
1.0
6
5.4
81
2012
5.2
5
9.1
0
1,7
52
19.6
7
38.6
3
41.7
0
80.0
3
76.5
3
9.0
6
4.7
9
5.3
70
2013
5.4
2
6.6
0
1,9
01
18.3
8
38.3
1
43.3
1
83.8
8
79.7
9
11.3
3
5.6
9
5.1
92
Sourc
e: I
MF
(W
orl
d E
conom
ic O
utl
ook D
atab
ases
), W
orl
d B
ank (
Worl
d D
evel
opm
ent
Indic
ators
)
� ���
1.2�Corporate reform in Vietnam
1.2.1� Corporate sector reform
(a) Corporate reform before Doi moi
After the defeat of the French in 1954, Vietnam was temporarily divided into two parts,
the North and the South. In the North the government adopted a Soviet style central
planning model to complete the tasks of economic reconstruction and social development.
The main elements of the model are quick industrialisation, collectivization of agriculture
and strong central control of the economy. In order to achieve these objectives the
Vietnamese leaders at that time claimed that SOCs should play a leading role in the
economy. Consequently, the SOC sector was rapidly established through both a
comprehensive nationalisation programme of existing privately owned companies and
creating new ones. Under the central planning, the SOCs were directly controlled and
managed by corresponding ministries of the central government or departments of the local
governments. They were seen as pure production units and could not decide freely either
what they produced or for whom they produced. Indeed, their tasks are simply to receive
inputs and implement production plans formulated by the various related ministries and
departments. Regardless of their quality, finished products are directly transferred to the
ministries and departments. Operating profits, which were also pre determined in the plan,
were transferred to the government budget, and losses were compensated for from the
government’s budget.
After the unification of the country in 1975, many private and public companies under
the former government in the South were quickly and forcefully transformed into northern
style SOCs through a nationalisation programme. In the beginning of 1978, 1,500 private
enterprises, which employed 130,000 workers or 70 per cent of the workforce in this sector,
were nationalised and converted into 650 SOEs (Nguyen, 1980). The state’s investment in
heavy and light industry accounted for 21.4 and 10.5 per cent of the total state’s investment
in 1976 respectively (Vu, 2002).
In the period of 1980 1985, Decree 25/CP of January 21, 1981 required a so called
Three Plan System, under which a state owned factory must have three plans. Under the
first plan, which is mandatory, the factory has to produce and supply output at low prices to
the state, using inputs provided by the state. Pofits obtained from this plan have to be
� ���
transferred to the state budget. If the factory has surplus capacity, it could use the second
plan, under which the factory could freely acquire inputs by itself, but it could only
produce the products specified in the first plan. Output of this plan is regularly sold to
trading SOCs, and the factory could also dispose of its products in the free market. The
third plan is non compulsory and to be established by the factory. Under this plan, output
usually concerned minor products that are made through the factory’s own attempts at
diversification. This production is absolutely free in both acquiring inputs and disposing of
outputs in the free market. Profits under the second and third plan could be retained by the
factory with a predetermined proportion.
(b) Corporate reform policy in Doi moi
The Sixth National Party Congress in December 1986 marked an important shift in the
economic reforms. Decision 217/HDBT of November 1987 virtually eradicated all
elements of the old planning mechanism on the SOCs. SOCs were now given the autonomy
to formulate and implement their own long term, medium term and short term operating
plans based on socio economic development guidelines set by the Government. SOCs
could directly sell their products to other trading companies or even to final consumers.
Profits computed on the basis of real costs were retained by the SOC and used at their own
discretion, except for compulsory transfers to the state budget. Prices of products were
determined on the basis of supply and demand conditions in the market in the case of non
price controlled products. For the case of price controlled products, the SOCs had to refer
to price tables (floor and ceiling prices) before setting prices for their products. However,
the number of price controlled products was rapidly reduced.
The changes in management mechanism of the SOCs under Decision 217/HDBT,
combined with other policies, for instance the issuance of the Law on Foreign Direct
Investment in 1987, resulted in a large number of SOCs facing difficulties and incurring
losses. To deal with this problem, the government issued Decree 388/HDBT on 20
November 1991, which provides a legal framework for restructuring the SOCs. Under this
Decree, conditions for establishing new SOCs and closing existing SOCs are clearly
defined. Specifically, an SOC could be forced to be dissolved or to merge with another if

� ���
they are in one of the following categories: (1) poor performance (continuous loss making),
(2) lack of capital or technology, (3) insufficient market demand for its products.
Since then, there have been many forms for restructuring and reforming the SOCs, as
below:
� SOCs that suffer from losses and ineffectiveness are classified, merged,
consolidated, dissolved, bankrupted, and transferred to another authorized agency.
� Several SOCs are equitized
� Some losses making, ineffective and non core SOCs are sold
� Some SOCs are transformed into one member limited liability companies
� Some SOCs are transformed to the model of holding branch companies, and sever
economic corporation are established
� Financial restructure are carried out in SOCs in form of restructuring debts, assets,
chartered capital, equity, and working capital
Among these forms for restructuring and reforming the SOCs, equitization has been the
main instrument. According to the Cabinet Decision No. 143/HDBT in May 1990, the
government decided to undertake a pilot plan of equitization for several SOCs, and based
on a resolution of the tenth session of the Eighth National Assembly, the Prime Minister
issued Decision No. 202/HDBT in June 1992 to launch an equitization programme from
mid 1992.
The SOCs were further restructured following the issuance of Decision 90 and 91 in
1994 on the establishment of General Corporations, namely General Corporation 90 and 91.
Specifically, Decision 90 called for the establishment of state corporations with at least five
voluntary SOC members and minimum legal capital of VND 100 billion while Decision 91
called for formation of much larger corporations with at least seven SOC members
appointed by the state and minimum legal capital of VND 1,000 billion. With respect to
management, the General Corporation 90 belongs to corresponding ministries or provincial
governments while the General Corporation 91 is directly under the control of the Prime
Minister. The reason behind the establishment of state corporations is to enhance the
competitive capacity of the Vietnamese SOCs in the context of globalisation of the
economy.
� ���
The SOCs have been significantly reorganized after the enactment of the Law on SOCs
in 1995. According to the Law, SOCs are classified into two groups. The first group refers
to profit seeking SOCs, the primary objective of which is making profit while the second
group is defined as non profit SOCs, which produce and distribute public services or take
responsibilities on national defence or security activities. Moreover, the roles of ministries
and provincial governments in controlling the SOCs (controlling agencies) are clearly
defined in the Law. Specifically, the controlling agencies have the authority to restructure
or dissolve SOCs as well as appoint senior positions in the SOCs (the Chairman and other
members of the board of directors, the manager and chief accountant). Furthermore, the
responsibilities of the Ministry of Finance (MOF) in managing the state’s capital in the
SOCs, the relationship between MOF and other controlling agencies of the SOCs are
determined in the Law. Importantly, the SOCs are allowed to decide what, how and for
whom to produce. Additionally, they are free to do business with each other and with non
SOCs, including foreign companies in the form of joint ventures or business contracts.
Also, the SOCs are almost independent in using their capital and assets received from the
government, borrowing and investing, except for big projects or important equipment that
requires the approval of the finance authority. Finally, net income fully belongs to the
SOCs and is distributed into three funds, namely a welfare, reward, and business
development fund.
1.2.2� The formation and development of stock markets
The formation and development of the stock markets in Vietnam was closely linked to
the equitization process of state owned companies. In 1998, stock exchanges were decided
to be established in Hanoi City and Ho Chi Minh City for joint stock companies to raise
mid and long term funds. The Ho Chi Minh Securities Trading Center (HoSTC) was
opened in 2000 and then renamed as Ho Chi Minh Stock Exchange (HOSE) in 2007. The
Hanoi Stock Exchange (HASE) was opened in 2005. The listing conditions of the HOSE
are stricter than those of the HASE with a higher level of capital, better business
performance, and a more dispersed stockholding structure. By the end of 2011, there were
393 firms listed on the HOSE and 306 firms listed on the HASE.
� ���
The stock markets in Vietnam had a peak development in 2007 when the aggregate
market value acounted for nearly 44 per cent of the GDP. The development of the stock
markets in turn accelarated the equitization process of state owned companies. The
participation of foreign investors (institutions and individuals) in a listed firm was limited
to 30 per cent of a firm’s equity at first and then increased to 50 per cent since 2007.
1.2.3� Banking sector reform
Before the Doi moi, the banking system in Vietnam was mono bank where the State
Bank of Vietnam (SBV) functioned as both a central bank and a commercial bank. Since
the 1990 Ordinance on the State Bank of Vietnam, the SBV acted as a central bank. Beside
the two existing state owned commercial banks (SOCBs), namely the Bank for Investment
and Development of Vietnam (BIDV) and the Bank for foreign trade of Vietnam
(Vietcombank), other two state owned commercial banks, namely Vietnam Industrial and
Commercial Bank (formerly Incombank, now Vietinbank), Vietnam Bank for Agriculture
and Rural Development (Agribank) were newly created. Moreover, the establishment of
Joint stock commercial banks (JSCBs), joint venture banks (JVBs) and foreign bank
branches was permitted. The share of foreign investment in a JVB was limited to 30 per
cent at first and then increased to 49 per cent since 2005. From 2007, the establishment of
wholly foreign owned banks (FFOBs) was permitted. From 2010, foreign banks and
domestic banks were treated equally. In 2006, the government announced the equitization
or partial privatization of SOCBs and reduction of government ownership to 51 per cent by
2010. In fact, Vietcombank, Vietinbank and BIDV had successfully sold their shares to
private investors in 2008, 2009, and 2012 respectively. Recently, the banking sector in
Vietnam is divided into five types of institutions in term of ownership. As of the end of
2012, there are three SOCBs, three partially equitized SOCBs, thirty seven JSCBs, six
JVBs, five FFOBs and nine foreign bank branches in Viet Nam. SOCBs accounted for the
largest share of lending, with 79.0 per cent of total loans in 2001 and 51.7 per cent in 2011.
Under the centrally planned economy, interest rate was imposed by subsidized policy
and independent from the international interest rate. Since the economic reform, interest
rate has been liberalized step by step. From 1989 to May 1992, fixed interest rate policy
was implemented. Interest rate was adjusted according to the change of price index. From
� ���
June 1992 to 1995, State Bank of Vietnam (SBV) used interest rate frame policy.
Commercial banks decided their interest rate based on the floor interest rate of deposit and
the ceiling interest rate of loan which were fixed by the SBV. From 1996 to 2000, SBV
managed by ceiling interest rate policy. And from 2000 until now, SBV has been using
basic interest rate policy. Basic interest rate is decided based on the interest rate of
interbank market, the interest rates of open market operations of the SBV, the interest rate
of deposit of credit institutions and trends of supply and demand of capital.
1.3�Equitization of state owned companies in Vietnam
1.3.1� Definition and objectives of equitization
“Equitization (co phan hoa in Vietnamese) Programme” in Vietnam started in 1992 as
a part of the State Owned Company Reform Programme, in the context of overall
economic reforms. Equitization is defined as a process of selling part of the equity of an
SOE or SOCB to the public or strategic investors. In recent years, equitization in Vietnam
has mostly taken place through an Initial Public Offering (IPO) followed by listing of the
company in the stock exchange (World Bank, 2012).
“Equitization” differs from “privatization”. “Equitization” does not necessarily mean
that the government looses its ultimate control over the company. In the case of
“equitization” of Vietnamese SOCs, the government still holds decisive voting rights in
many cases. Besides, in equitization process of Vietnamese SOCs, employees and
managers of the SOCs acquire a substantial portion of the shares in the equitized
companies.
The following issues are defined as objectives of the SOC equitization programme in
Vietnam:
improving the performance and competitiveness of companies by ownership
diversification;
mobilising capital from employees and outside investors, including domestic and foreign
investors, for renewing technologies and developing companies’ business;
balancing interests of the state, employees and shareholders in the equitized companies.
1.3.2� Forms of equitization
� ���
According to Decree 64/2002/ND CP, in order to convert the SOCs into equitized
companies, the companies can choose one of the following forms of equitization depending
on their characteristics:
maintaining the existing capital of the SOC and issuing shares to mobilise more capital
for developing their business;
selling a part of the existing state capital of the SOC;
selling the entire existing state capital of the SOC;
partially or entirely selling the existing state capital of the SOC and concurrently issuing
shares to mobilise more capital.
The process of “privatization” in Vietnam is defined as “divestment”, which is a
process by which the government sells a part of or all of its equity to the public or to the
private sector after the initial equitization. In Vietnam, most SOCs are first equitized and
then gradually divested by the State Capital Investment Corporation (SCIC) (World Bank,
2012).
1.3.3� Stages of equitization
Equitization process in Vietnam has experienced a pilot stage, an expansion stage and a
speed up stage. Table 1.3 summerizes regulations on equitization of state owned
companies.
(a) The pilot stage of the equitization programme (1992 1996)
In May 1990, under the Cabinet Decision No. 143/HDBT, the Vietnamese government
decided to select some of small and medium SOCs to try to convert into joint stock
companies. And then, an equitization programme was launched from mid 1992 under the
Decision No. 202/HDBT. According to this Decision, each central ministry and each
province were required to select 1 2 SOCs, which are small or medium sized and profitable
or at least potentially profitable companies, but should not be in industries that the state
needs to hold 100 per cent ownership, to undertake pilot equitization. After the pilot
programme of equitizing SOCs, many SOCs were successfully equitized. The state could
raised much capital through equitizing and equitized SOCs did better after being equitized.
� ��
(b) The expansion stage of the equitization programme (1996 –2010)
In 1996, the goverment issued Decree 28/ND CP to end the pilot stage and start the
expansion stage of the equitization process by extending the scope of equitization to all
small and medium sized SOCs that the state does not need to remain 100 per cent
ownership. The government required SOCs’ controlling agencies (ministries, People's
Committees of provinces and state corporations) to select companies for equitization by
1997. Once again, the expansion stage of the equitization gained significant achievement
and the govement decided to accelerate the equitization process by providing a fairly clear
and comprehensive framework for transforming SOCs into equitized companies in the
Decree 44/1998/ND CP in 1998. After 10 years of implementing, 588 SOCs was equitized.
However, the objectives of the equitization were only small and medium sized SOCs.
Decission No.58/2002/QD Ttg in 2002 listed 41 fields that the state would remain 100 per
cent ownership (including 27 for business enterprises and 14 for public welfare enterprises),
and 30 fields that the state would remain more than 50 per cent ownership (including 24 for
business enterprises and 6 for public welfare enterprises).
Regulations in firm valuation methods, initial public offering requirements, founders’
obligation, etc were changed according to Decree 64/2002/ND CP in 2002 and created a
new period of equitization. This had helped speeding up the pace of the equitization
process. The number of SOCs were equitized in 2003 and 2004 rapidly increased, reached
621 SOCs in 2003 and 856 SOCs in 2004.
In 2004, Decission 155/2004/QĐ Ttg revised fields that the state would remain 100 per
cent ownership and fields that the state would remain more than 50 per cent ownership.
According that, The state would remain 100 per cent ownership in 28 fields and more than
50 per cent ownership in 17 fields.
The scope of equitization was extended according to Decree 187/2004/ND CP to all the
member companies of the state owned general companies and even the state owned
general companies that the state does not need to dominate. This decree also renewed
regulation on the sale of IPO shares and strategic investors. The sale of IPO shares must be
made through auction at Stock Exchanges if the company has a capital of more than 10
billion dong, at the intermediary finance organizations if the company has a capital of more
than 1 billion and not more than 10 billion, and at the company if the company has a capital
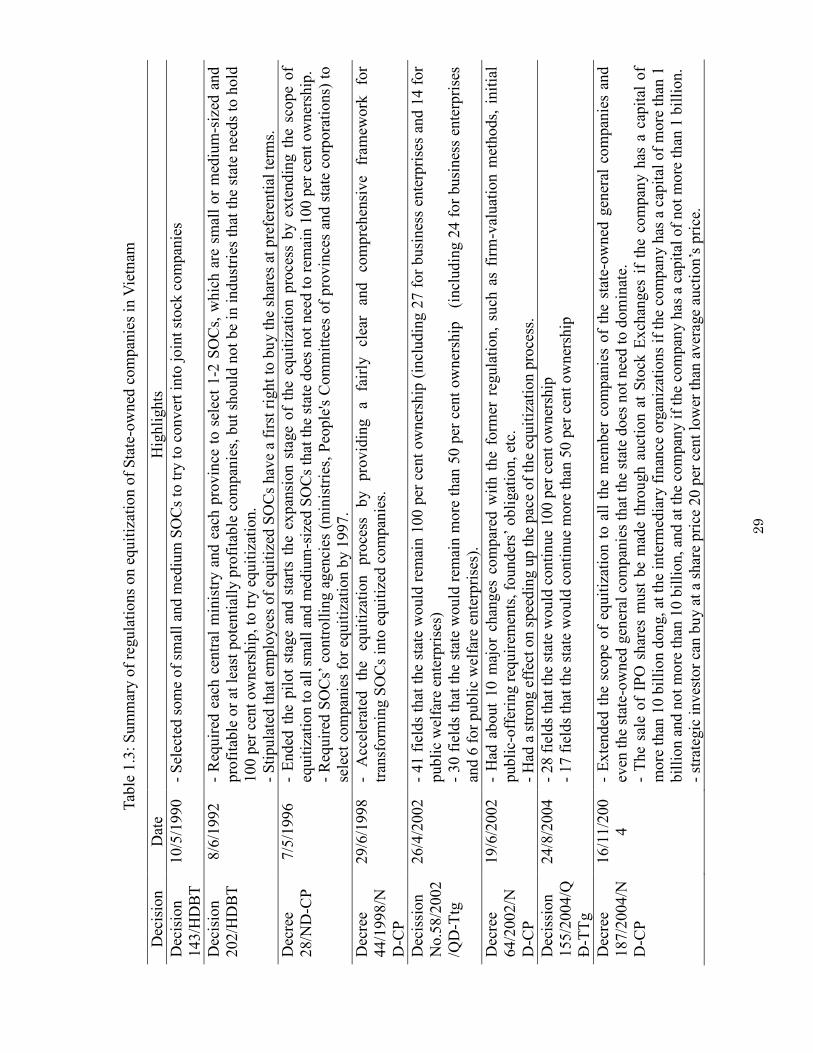
���
Tab
le 1
.3:
Sum
mar
y o
f re
gula
tions
on e
quit
izat
ion o
f S
tate
ow
ned
com
pan
ies
in V
ietn
am
Dec
isio
n
Dat
e H
ighli
ghts
Dec
isio
n
143/H
DB
T
10/5
/1990
S
elec
ted s
om
e of
smal
l an
d m
ediu
m S
OC
s to
try
to c
onver
t in
to j
oin
t st
ock
com
pan
ies
Dec
isio
n
202/H
DB
T
8/6
/1992
R
equir
ed e
ach c
entr
al m
inis
try a
nd e
ach p
rovin
ce t
o s
elec
t 1 2
SO
Cs,
whic
h a
re s
mal
l or
med
ium
siz
ed a
nd
pro
fita
ble
or
at l
east
pote
nti
ally
pro
fita
ble
com
pan
ies,
but
should
not
be
in i
ndust
ries
that
the
stat
e nee
ds
to h
old
100 p
er c
ent
ow
ner
ship
, to
try
equit
izat
ion.
S
tipula
ted t
hat
em
plo
yee
s of
equit
ized
SO
Cs
hav
e a
firs
t ri
ght
to b
uy t
he
shar
es a
t pre
fere
nti
al t
erm
s.
Dec
ree
28/N
D C
P
7/5
/1996
E
nded
the
pil
ot
stag
e an
d s
tart
s th
e ex
pan
sion s
tage
of
the
equit
izat
ion p
roce
ss b
y e
xte
ndin
g t
he
scope
of
equit
izat
ion t
o a
ll s
mal
l an
d m
ediu
m s
ized
SO
Cs
that
the
stat
e does
not
nee
d t
o r
emai
n 1
00 p
er c
ent
ow
ner
ship
.
R
equir
ed S
OC
s’ c
ontr
oll
ing a
gen
cies
(m
inis
trie
s, P
eople
's C
om
mit
tees
of
pro
vin
ces
and s
tate
corp
ora
tions)
to
sele
ct c
om
pan
ies
for
equit
izat
ion b
y 1
997.
Dec
ree
44/1
998/N
D C
P
29/6
/1998
A
ccel
erat
ed
the
equit
izat
ion
pro
cess
b
y
pro
vid
ing
a fa
irly
cl
ear
and
com
pre
hen
sive
fram
ework
fo
r tr
ansf
orm
ing S
OC
s in
to e
quit
ized
com
pan
ies.
Dec
issi
on
No.5
8/2
002
/QD
Ttg
26/4
/2002
41 f
ield
s th
at t
he
stat
e w
ould
rem
ain 1
00 p
er c
ent
ow
ner
ship
(in
cludin
g 2
7 f
or
busi
nes
s en
terp
rise
s an
d 1
4 f
or
publi
c w
elfa
re e
nte
rpri
ses)
30 f
ield
s th
at t
he
stat
e w
ould
rem
ain m
ore
than
50 p
er c
ent
ow
ner
ship
(
incl
udin
g 2
4 f
or
busi
nes
s en
terp
rise
s an
d 6
for
publi
c w
elfa
re e
nte
rpri
ses)
.
Dec
ree
64/2
002/N
D C
P
19/6
/2002
H
ad a
bout
10 m
ajor
chan
ges
com
par
ed w
ith t
he
form
er r
egula
tion,
such
as
firm
val
uat
ion m
ethods,
init
ial
publi
c off
erin
g r
equir
emen
ts, fo
under
s’ o
bli
gat
ion, et
c.
H
ad a
str
on
g e
ffec
t on s
pee
din
g u
p t
he
pac
e of
the
equit
izat
ion p
roce
ss.
Dec
issi
on
155/2
004/Q
Đ T
Tg
24/8
/2004
28 f
ield
s th
at t
he
stat
e w
ould
conti
nue
100 p
er c
ent
ow
ner
ship
17 f
ield
s th
at t
he
stat
e w
ould
conti
nue
more
than
50 p
er c
ent
ow
ner
ship
Dec
ree
187/2
004/N
D C
P
16/1
1/2
00
4
E
xte
nded
the
scope
of
equit
izat
ion t
o a
ll t
he
mem
ber
com
pan
ies
of
the
stat
e ow
ned
gen
eral
com
pan
ies
and
even
the
stat
e ow
ned
gen
eral
com
pan
ies
that
the
stat
e does
not
nee
d t
o d
om
inat
e.
T
he
sale
of
IPO
sh
ares
must
be
mad
e th
rou
gh a
uct
ion a
t S
tock
Ex
chan
ges
if
the
com
pan
y h
as a
cap
ital
of
more
than
10 b
illi
on d
on
g,
at t
he
inte
rmed
iary
fin
ance
org
aniz
atio
ns
if t
he
com
pan
y h
as a
cap
ital
of
more
than
1
bil
lion a
nd n
ot
more
than
10 b
illi
on, an
d a
t th
e co
mpan
y i
f th
e co
mpan
y h
as a
cap
ital
of
not
more
th
an 1
bil
lion.
stra
tegic
inves
tor
can b
uy a
t a
shar
e pri
ce 2
0 p
er c
ent
low
er t
han
aver
age
auct
ion’s
pri
ce.
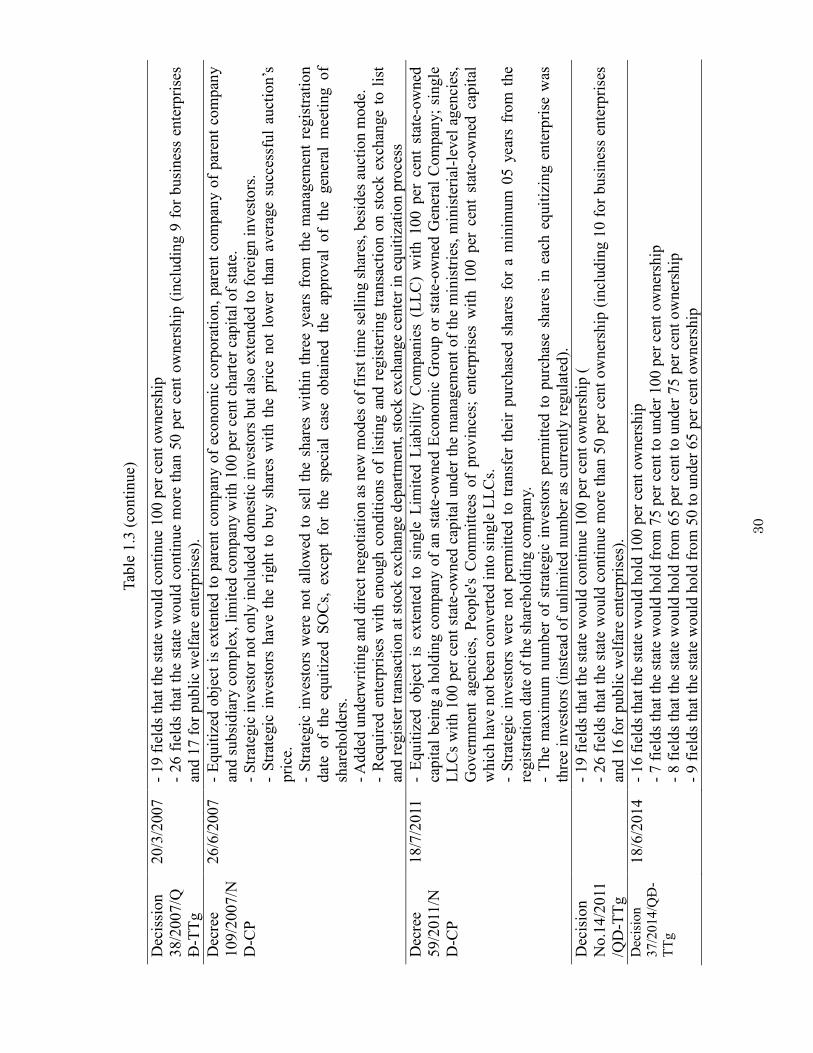
����
Tab
le 1
.3 (
conti
nue)
Dec
issi
on
38/2
007/Q
Đ T
Tg
20/3
/2007
19 f
ield
s th
at t
he
stat
e w
ould
conti
nue
100 p
er c
ent
ow
ner
ship
26 f
ield
s th
at t
he
stat
e w
ould
conti
nue
more
than
50 p
er c
ent
ow
ner
ship
(in
cludin
g 9
for
busi
nes
s en
terp
rise
s an
d 1
7 f
or
publi
c w
elfa
re e
nte
rpri
ses)
.
Dec
ree
109/2
007/N
D C
P
26/6
/2007
E
quit
ized
obje
ct i
s ex
tente
d t
o p
aren
t co
mp
any o
f ec
onom
ic c
orp
ora
tion,
par
ent
com
pan
y o
f par
ent
com
pan
y
and s
ubsi
dia
ry c
om
ple
x, li
mit
ed c
om
pan
y w
ith 1
00 p
er c
ent
char
ter
capit
al o
f st
ate.
Str
ateg
ic i
nves
tor
not
only
incl
uded
dom
esti
c in
ves
tors
but
also
ex
tended
to f
ore
ign i
nves
tors
.
S
trat
egic
inv
esto
rs h
ave
the
right
to b
uy s
har
es w
ith t
he
pri
ce n
ot
low
er t
han
aver
age
succ
essf
ul
auct
ion’s
pri
ce.
S
trat
egic
inves
tors
wer
e not
allo
wed
to s
ell
the
shar
es w
ithin
thre
e yea
rs f
rom
the
man
agem
ent
regis
trat
ion
dat
e of
the
equit
ized
S
OC
s, ex
cept
for
the
spec
ial
case
obta
ined
th
e ap
pro
val
of
the
gen
eral
m
eeti
ng o
f sh
areh
old
ers.
Added
und
erw
riti
ng a
nd d
irec
t neg
oti
atio
n a
s new
modes
of
firs
t ti
me
sell
ing s
har
es, bes
ides
auct
ion m
ode.
Req
uir
ed e
nte
rpri
ses
wit
h e
nough
condit
ions
of
list
ing a
nd
reg
iste
rin
g t
ransa
ctio
n o
n s
tock
ex
chan
ge
to l
ist
and r
egis
ter
tran
sact
ion a
t st
ock
ex
chan
ge
dep
artm
ent,
sto
ck e
xch
ange
cente
r in
equit
izat
ion p
roce
ss
Dec
ree
59/2
011
/ND
CP
18/7
/2011
Equit
ized
obje
ct i
s ex
tente
d t
o s
ingle
Lim
ited
Lia
bil
ity C
om
pan
ies
(LL
C)
wit
h 1
00 p
er c
ent
stat
e ow
ned
ca
pit
al b
ein
g a
hold
ing c
om
pan
y o
f an
sta
te o
wned
Eco
nom
ic G
roup o
r st
ate
ow
ned
Gen
eral
Com
pan
y;
sin
gle
L
LC
s w
ith 1
00 p
er c
ent
stat
e ow
ned
cap
ital
under
the
man
agem
ent
of
the
min
istr
ies,
min
iste
rial
lev
el a
gen
cies
, G
over
nm
ent
agen
cies
, P
eople
's C
om
mit
tees
of
pro
vin
ces;
ente
rpri
ses
wit
h 1
00 p
er c
ent
stat
e ow
ned
cap
ital
w
hic
h h
ave
not
bee
n c
on
ver
ted i
nto
sin
gle
LL
Cs.
Str
ateg
ic i
nv
esto
rs w
ere
not
per
mit
ted t
o t
ransf
er t
hei
r pu
rchas
ed s
har
es f
or
a m
inim
um
05 y
ears
fro
m t
he
regis
trat
ion d
ate
of
the
shar
ehold
ing c
om
pan
y.
T
he
max
imum
num
ber
of
stra
tegic
inves
tors
per
mit
ted t
o p
urc
has
e sh
ares
in e
ach e
quit
izin
g e
nte
rpri
se w
as
thre
e in
ves
tors
(in
stea
d o
f unli
mit
ed n
um
ber
as
curr
entl
y r
egula
ted).
Dec
isio
n
No.1
4/2
011
/QD
TT
g
19 f
ield
s th
at t
he
stat
e w
ould
conti
nue
100 p
er c
ent
ow
ner
ship
(
26 f
ield
s th
at t
he
stat
e w
ould
conti
nue
more
than
50 p
er c
ent
ow
ner
ship
(in
cludin
g 1
0 f
or
busi
nes
s en
terp
rise
s an
d 1
6 f
or
publi
c w
elfa
re e
nte
rpri
ses)
. D
ecis
ion
37/2
014/Q
Đ
TT
g
18/6
/2014
16 f
ield
s th
at t
he
stat
e w
ould
hold
100 p
er c
ent
ow
ner
ship
7 f
ield
s th
at t
he
stat
e w
ould
hold
fro
m 7
5 p
er c
ent
to u
nder
100 p
er c
ent
ow
ner
ship
8 f
ield
s th
at t
he
stat
e w
ould
hold
fro
m 6
5 p
er c
ent
to u
nder
75 p
er c
ent
ow
ner
ship
9 f
ield
s th
at t
he
stat
e w
ould
hold
fro
m 5
0 t
o u
nder
65 p
er c
ent
ow
ner
ship

� ���
of not more than 1 billion. Strategic investors from now can buy at a share price 20 per cent
lower than average auction’s price. In this period, the development of the stock markets in
Vietnam also stimulated the equitization of SOCs in Vietnam. In 2005, 813 SOCs was
equitized. But from 2006, the speed of equitization became slower with only 359 and 116
SOCs being equitized in 2006 and 2007, respectively.
In 2007, Decission 38/2007/QĐ TTg reduced the number of fields that the state would
continue to hold 100 per cent ownership to 19, and number of fields that the state would
continue to hold more than 50 per cent ownership to 26 (including 9 for business
enterprises and 17 for public welfare enterprises). The equitized objectives were extensed
to parent company of economic corporation, parent company of parent company and
subsidiary complex, limited company with 100 per cent charter capital of state according to
Decree 109/2007/ND CP. Regulation on strategic investors also changed. Strategic
investors not only included domestic investors but also extended to foreign investors.
Strategic investors have the right to buy shares with the price not lower than average
successful auction’s price. And they were not allowed to sell the shares within three years
from the management registration date of the equitized SOCs, except for the special case
obtained the approval of the general meeting of shareholders. Besides, according to this
decree, underwriting and direct negotiation were added as new modes of first time selling
shares, besides auction mode. Moreover, enterprises with enough conditions of listing and
registering transaction on stock exchange were required to list and register transaction at
stock exchange department, stock exchange center in equitization process. However, only
117 SOCs were equitized in the period of 2008 2010.
After 20 years of implementing equitization of SOCs, nearly 4,000 SOCs were
equitized. However, most of them were small and medium SOCs. Large scale SOCs
remained unequitized.
(c) The speed up stage of the equitization programme (2011 – present)
The Prime Minister issued a proposal of restructuring SOCs in the period of 2011 2015
which are focus on economic groups and general companies. Decree 59/2011/ND CP
extensed the equitized objects to single Limited Liability Companies (LLC) with 100 per
cent state owned capital being a holding company of an state owned Economic Group or

� ���
state owned General Company; single LLCs with 100 per cent state owned capital under
the management of the ministries, ministerial level agencies, Government agencies,
People's Committees of provinces; enterprises with 100 per cent state owned capital which
have not been converted into single LLCs. This decision also stated that strategic investors
were not permitted to transfer their purchased shares for a minimum 05 years from the
registration date of the shareholding company. The maximum number of strategic investors
permitted to purchase shares in each equitizing enterprise was three investors (instead of
unlimited number as currently regulated).
Decision No.14/2011/QD Ttg was issued to regulate fields that the state would continue
100 per cent ownership or retain dominant shares. According to this decision, number of
fields that the state would continue 100 per cent ownership reduced to 19, and number of
fields that the state would retain dominant shares reduced to 26 (including 10 for business
enterprises and 16 for public welfare enterprises).
The latest regulations on fields that the state would remain ownership is Decision
37/2014/QĐ TTg. This decision regulates 16 fields that the state would hold 100 per cent
ownership, 7 fields that the state would hold from 75 per cent to under 100 per cent
ownership, 8 fields that the state would hold from 65 per cent to under 75 per cent
ownership and 9 fields that the state would hold from 50 per cent to 65 per cent ownership.
Table 1.4 and Table 1.5 summarize these two decisions.
In the period of 2011 2013, 99 SOCs were equitized and 81 SOCs were restructured by
other forms.
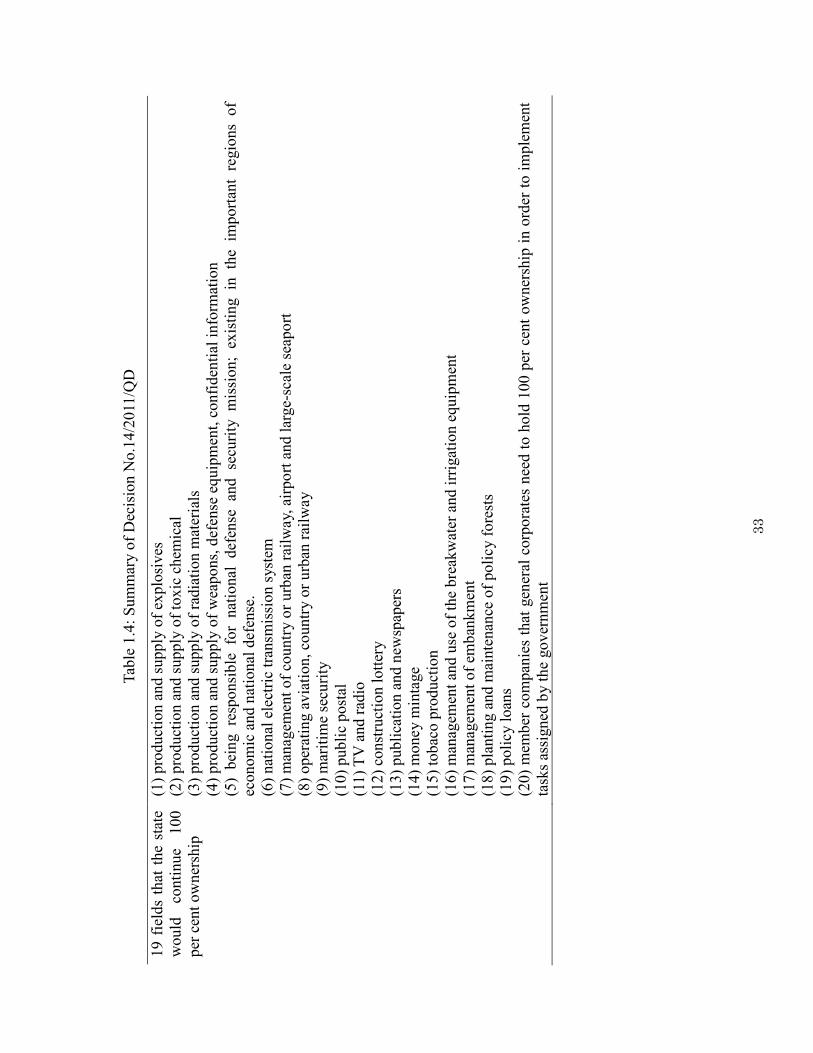
����
Tab
le 1
.4:
Sum
mar
y o
f D
ecis
ion N
o.1
4/2
011
/QD
19 f
ield
s th
at t
he
stat
e w
ould
co
nti
nue
100
per
cen
t ow
ner
ship
(1)
pro
duct
ion a
nd s
upply
of
explo
sives
(2
) pro
duct
ion a
nd s
upply
of
tox
ic c
hem
ical
(3
) pro
duct
ion a
nd s
upply
of
radia
tion m
ater
ials
(4
) pro
duct
ion a
nd s
upply
of
wea
pons,
def
ense
eq
uip
men
t, c
onfi
den
tial
info
rmat
ion
(5)
bei
ng
resp
onsi
ble
fo
r nat
ional
def
ense
an
d
secu
rity
m
issi
on;
exis
ting
in
the
import
ant
regio
ns
of
econom
ic a
nd n
atio
nal
def
ense
. (6
) nat
ional
ele
ctri
c tr
ansm
issi
on s
yst
em
(7)
man
agem
ent
of
countr
y o
r urb
an r
ailw
ay, ai
rpo
rt a
nd l
arge
scal
e se
apo
rt
(8)
oper
atin
g a
via
tion, co
untr
y o
r u
rban
rai
lway
(9
) m
arit
ime
secu
rity
(1
0)
publi
c post
al
(11)
TV
and r
adio
(1
2)
const
ruct
ion l
ott
ery
(13)
publi
cati
on a
nd n
ewsp
aper
s
(14)
money
min
tage
(15)
tobac
o p
roduct
ion
(16)
man
agem
ent
and u
se o
f th
e bre
akw
ater
and i
rrig
atio
n e
quip
men
t (1
7)
man
agem
ent
of
emb
ankm
ent
(18)
pla
nti
ng a
nd m
ainte
nan
ce o
f poli
cy f
ore
sts
(1
9)
poli
cy l
oan
s (2
0)
mem
ber
com
pan
ies
that
gen
eral
corp
ora
tes
nee
d t
o h
old
100 p
er c
ent
ow
ner
ship
in o
rder
to i
mple
men
t ta
sks
assi
gned
by t
he
gov
ernm
ent
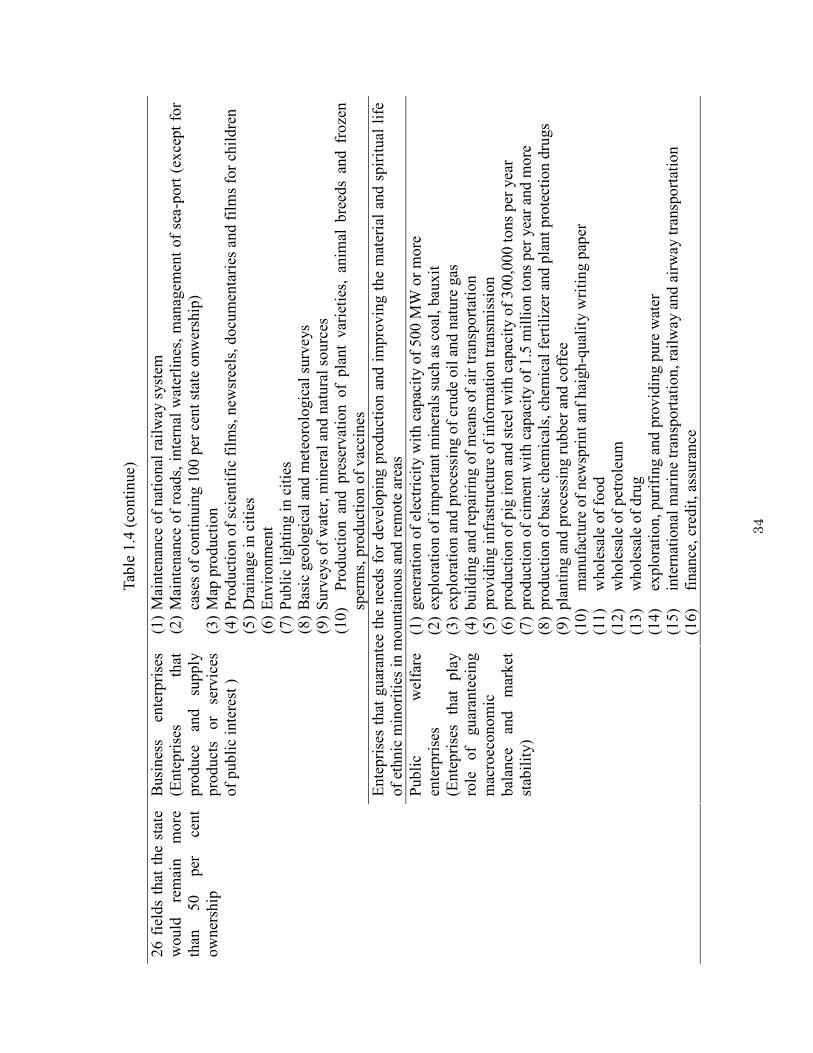
����
Tab
le 1
.4 (
conti
nue)
Busi
nes
s en
terp
rise
s (E
nte
pri
ses
that
pro
duce
an
d
supply
pro
duct
s or
serv
ices
of
publi
c in
tere
st )
(1)�
Mai
nte
nan
ce o
f nat
ional
rai
lway
syst
em
(2)�
Mai
nte
nan
ce o
f ro
ads,
inte
rnal
wat
erli
nes
, m
anag
emen
t of
sea
port
(ex
cept
for
case
s of
conti
nuin
g 1
00 p
er c
ent
stat
e onw
ersh
ip)
(3)�
Map
pro
duct
ion
(4)�
Pro
duct
ion o
f sc
ienti
fic
film
s, n
ewsr
eels
, docu
men
tari
es a
nd f
ilm
s fo
r ch
ildre
n
(5)�
Dra
inag
e in
cit
ies
(6)�
Envir
onm
ent
(7
)�P
ubli
c li
ghti
ng i
n c
itie
s
(8)�
Bas
ic g
eolo
gic
al a
nd m
eteo
rolo
gic
al s
urv
eys
(9)�
Surv
eys
of
wat
er, m
iner
al a
nd n
atura
l so
urc
es
(10)�
Pro
duct
ion a
nd p
rese
rvat
ion o
f pla
nt
var
ieti
es,
anim
al b
reed
s an
d f
roze
n
sper
ms,
pro
duct
ion o
f vac
cines
Ente
pri
ses
that
gu
aran
tee
the
nee
ds
for
dev
elopin
g p
rodu
ctio
n a
nd i
mpro
vin
g t
he
mat
eria
l an
d s
pir
itual
lif
e of
ethnic
min
ori
ties
in m
ounta
inous
and r
emote
are
as
26 f
ield
s th
at t
he
stat
e w
ould
re
mai
n
more
th
an
50
per
ce
nt
ow
ner
ship
Publi
c w
elfa
re
ente
rpri
ses
(Ente
pri
ses
that
pla
y
role
of
gu
aran
teei
ng
mac
roec
onom
ic
bal
ance
an
d
mar
ket
st
abil
ity)
(1)�
gen
erat
ion o
f el
ectr
icit
y w
ith c
apac
ity o
f 500 M
W o
r m
ore
(2
)�ex
plo
rati
on o
f im
port
ant
min
eral
s su
ch a
s co
al, bau
xit
(3
)�ex
plo
rati
on a
nd p
roce
ssin
g o
f cr
ude
oil
and n
ature
gas
(4
)�buil
din
g a
nd r
epai
rin
g o
f m
eans
of
air
tran
sport
atio
n
(5)�
pro
vid
ing i
nfr
astr
uct
ure
of
info
rmat
ion t
ransm
issi
on
(6)�
pro
duct
ion o
f pig
iro
n a
nd s
teel
wit
h c
apac
ity o
f 3
00,0
00 t
ons
per
yea
r (7
)�pro
duct
ion o
f ci
men
t w
ith c
apac
ity o
f 1.5
mil
lion t
ons
per
yea
r an
d m
ore
(8)�
pro
duct
ion o
f bas
ic c
hem
ical
s, c
hem
ical
fer
tili
zer
and p
lant
pro
tect
ion d
rugs
(9)�
pla
nti
ng a
nd p
roce
ssin
g r
ubber
and c
off
ee
(10)�
man
ufa
cture
of
new
spri
nt
anf
hai
gh q
ual
ity w
riti
ng p
aper
(1
1)�
whole
sale
of
food
(12)�
whole
sale
of
pet
role
um
(1
3)�
whole
sale
of
dru
g
(14)�
explo
rati
on, puri
fing a
nd p
rovid
ing p
ure
wat
er
(15)�
inte
rnat
ional
mar
ine
tran
sport
atio
n, ra
ilw
ay a
nd a
irw
ay t
ransp
ort
atio
n
(16)�
finan
ce,
cred
it, as
sura
nce
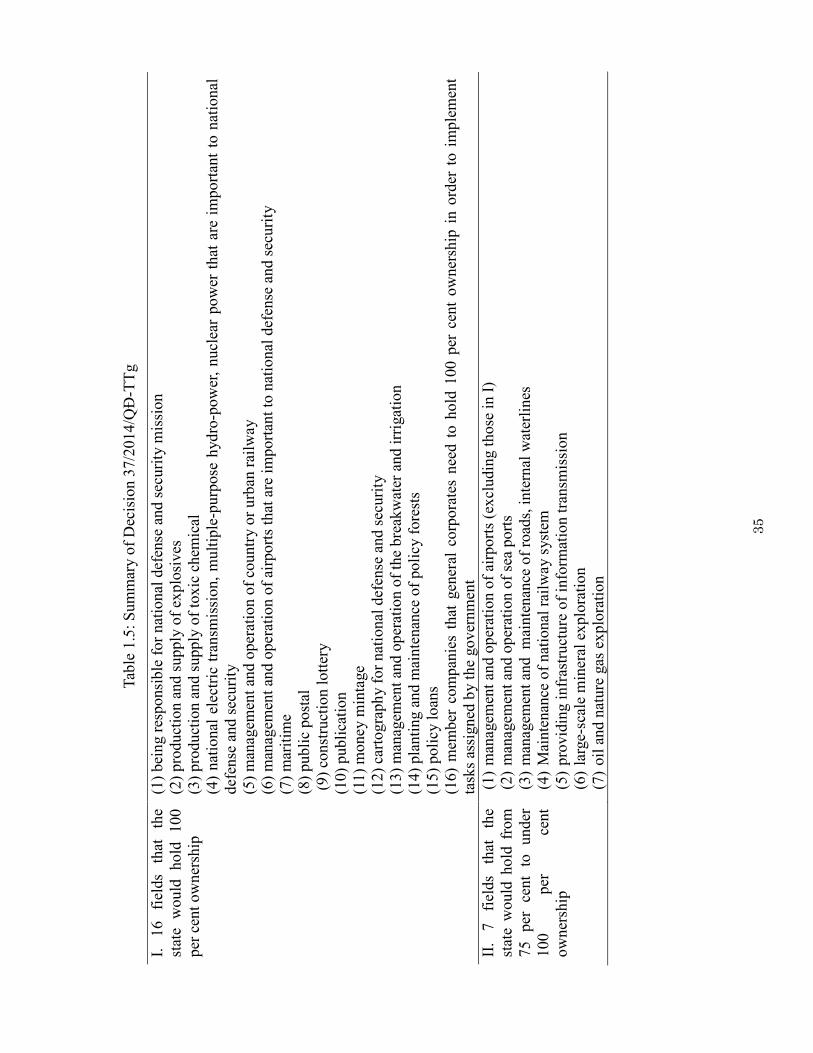
����
Tab
le 1
.5:
Sum
mar
y o
f D
ecis
ion 3
7/2
014/Q
Đ T
Tg
I.
16
fiel
ds
that
th
e st
ate
would
hold
100
per
cen
t ow
ner
ship
(1)
bei
ng r
esponsi
ble
for
nat
ional
def
ense
and s
ecuri
ty m
issi
on
(2)
pro
duct
ion a
nd s
upply
of
explo
sives
(3
) pro
duct
ion a
nd s
upply
of
tox
ic c
hem
ical
(4
) nat
ional
ele
ctri
c tr
ansm
issi
on,
mult
iple
purp
ose
hyd
ro p
ow
er,
nucl
ear
pow
er t
hat
are
im
port
ant
to n
atio
nal
def
ense
and s
ecu
rity
(5
) m
anag
emen
t an
d o
per
atio
n o
f co
untr
y o
r u
rban
rai
lway
(6
) m
anag
emen
t an
d o
per
atio
n o
f ai
rport
s th
at a
re i
mport
ant
to n
atio
nal
def
ense
and s
ecuri
ty
(7)
mar
itim
e
(8)
publi
c post
al
(9)
const
ruct
ion l
ott
ery
(10)
publi
cati
on
(11)
money
min
tage
(12)
cart
ogra
ph
y f
or
nat
ional
def
ense
and s
ecuri
ty
(13)
man
agem
ent
and o
per
atio
n o
f th
e bre
akw
ater
and i
rrig
atio
n
(14)
pla
nti
ng a
nd m
ainte
nan
ce o
f poli
cy f
ore
sts
(1
5)
poli
cy l
oan
s (1
6)
mem
ber
com
pan
ies
that
gen
eral
corp
ora
tes
nee
d t
o h
old
100 p
er c
ent
ow
ner
ship
in o
rder
to i
mple
men
t ta
sks
assi
gned
by t
he
gov
ernm
ent
II.
7
fiel
ds
that
th
e st
ate
would
hold
fro
m
75
per
ce
nt
to
under
100
per
ce
nt
ow
ner
ship
(1)�
man
agem
ent
and o
per
atio
n o
f ai
rport
s (e
xcl
udin
g t
hose
in I
) (2
)�m
anag
emen
t an
d o
per
atio
n o
f se
a port
s (3
)�m
anag
emen
t an
d m
ainte
nan
ce o
f ro
ads,
inte
rnal
wat
erli
nes
(4
)�M
ainte
nan
ce o
f nat
ional
rai
lway
syst
em
(5)�
pro
vid
ing i
nfr
astr
uct
ure
of
info
rmat
ion t
ransm
issi
on
(6)�
larg
e sc
ale
min
eral
ex
plo
rati
on
(7)�
oil
and n
ature
gas
ex
plo
rati
on
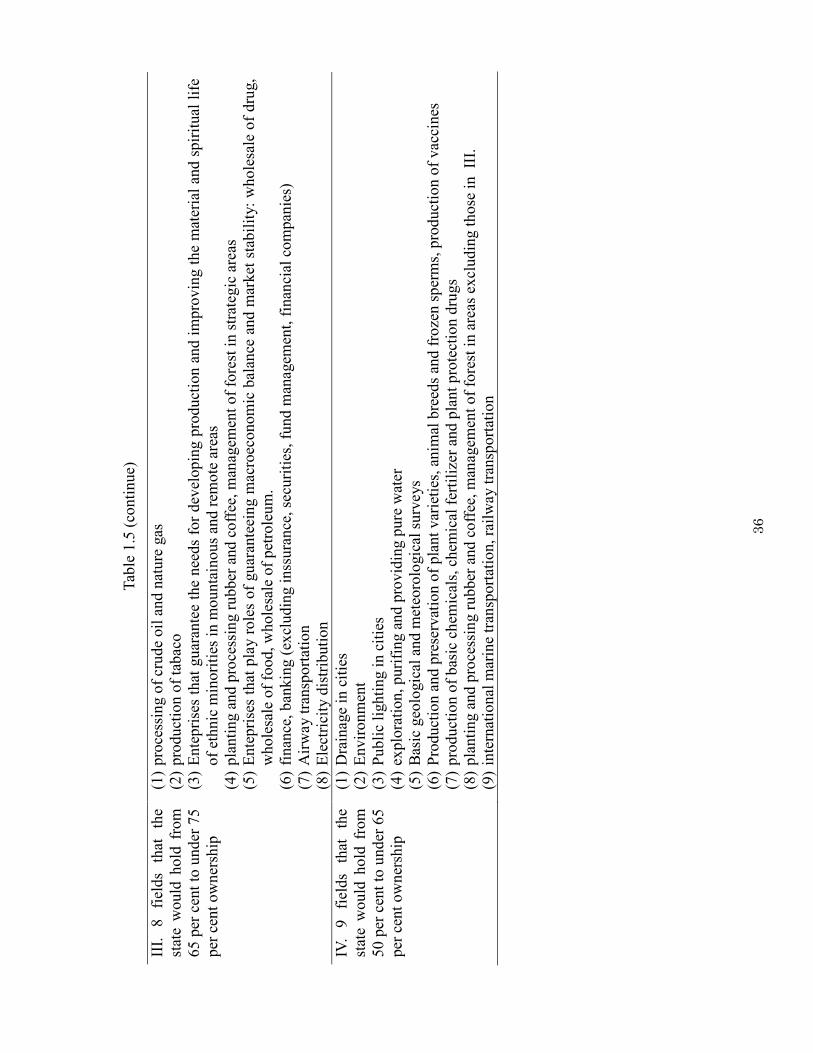
����
Tab
le 1
.5 (
conti
nue)
III.
8
fiel
ds
that
th
e st
ate
would
hold
fro
m
65 p
er c
ent
to u
nder
75
per
cen
t ow
ner
ship
(1)�
pro
cess
ing o
f cr
ude
oil
and n
ature
gas
(2
)�pro
duct
ion o
f ta
bac
o
(3)�
Ente
pri
ses
that
gu
aran
tee
the
nee
ds
for
dev
elopin
g p
roduct
ion a
nd i
mpro
vin
g t
he
mat
eria
l an
d s
pir
itual
lif
e of
ethnic
min
ori
ties
in m
ounta
inous
and r
emote
are
as
(4)�
pla
nti
ng a
nd p
roce
ssin
g r
ubber
and c
off
ee, m
anag
emen
t of
fore
st i
n s
trat
egic
are
as
(5)�
Ente
pri
ses
that
pla
y r
ole
s of
gu
aran
teei
ng m
acro
econom
ic b
alan
ce a
nd m
arket
sta
bil
ity:
whole
sale
of
dru
g,
whole
sale
of
food, w
hole
sale
of
pet
role
um
. (6
)�fi
nan
ce, b
ankin
g (
excl
udin
g i
nss
ura
nce
, se
curi
ties
, fu
nd m
anag
emen
t, f
inan
cial
com
pan
ies)
(7
)�A
irw
ay t
ransp
ort
atio
n
(8)�
Ele
ctri
city
dis
trib
uti
on
IV.
9
fiel
ds
that
th
e st
ate
would
hold
fro
m
50 p
er c
ent
to u
nder
65
per
cen
t ow
ner
ship
(1)�
Dra
inag
e in
cit
ies
(2)�
Envir
onm
ent
(3)�
Publi
c li
ghti
ng i
n c
itie
s
(4)�
explo
rati
on, puri
fing a
nd p
rovid
ing p
ure
wat
er
(5)�
Bas
ic g
eolo
gic
al a
nd m
eteo
rolo
gic
al s
urv
eys
(6)�
Pro
duct
ion a
nd p
rese
rvat
ion o
f pla
nt
var
ieti
es, an
imal
bre
eds
and f
roze
n s
per
ms,
pro
duct
ion o
f vac
cines
(7
)�pro
duct
ion o
f bas
ic c
hem
ical
s, c
hem
ical
fer
tili
zer
and p
lant
pro
tect
ion d
rugs
(8)�
pla
nti
ng a
nd p
roce
ssin
g r
ubber
and c
off
ee, m
anag
emen
t of
fore
st i
n a
reas
ex
cludin
g t
hose
in
III.
(9
)�in
tern
atio
nal
mar
ine
tran
sport
atio
n, ra
ilw
ay t
ransp
ort
atio
n
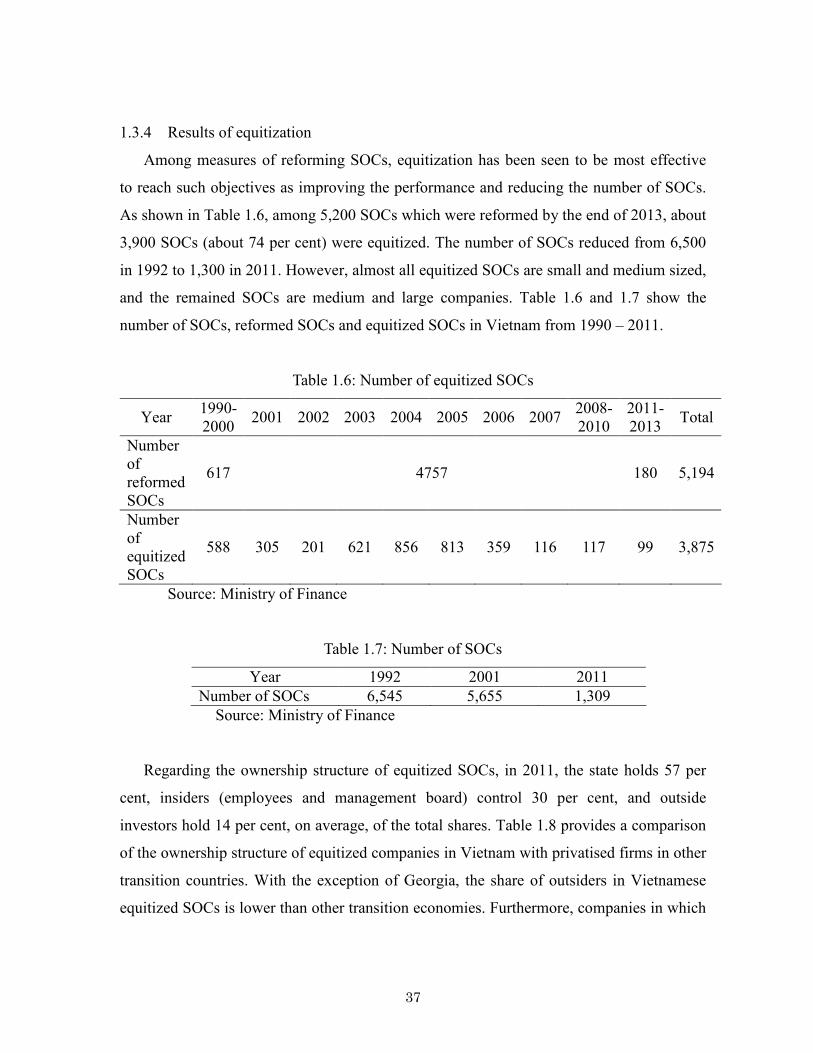
� ���
1.3.4� Results of equitization
Among measures of reforming SOCs, equitization has been seen to be most effective
to reach such objectives as improving the performance and reducing the number of SOCs.
As shown in Table 1.6, among 5,200 SOCs which were reformed by the end of 2013, about
3,900 SOCs (about 74 per cent) were equitized. The number of SOCs reduced from 6,500
in 1992 to 1,300 in 2011. However, almost all equitized SOCs are small and medium sized,
and the remained SOCs are medium and large companies. Table 1.6 and 1.7 show the
number of SOCs, reformed SOCs and equitized SOCs in Vietnam from 1990 – 2011.
Table 1.6: Number of equitized SOCs
Year 1990 2000
2001 2002 2003 2004 2005 2006 2007 2008 2010
2011 2013
Total
Number of reformed SOCs
617 4757 180 5,194
Number of equitized SOCs
588 305 201 621 856 813 359 116 117 99 3,875
Source: Ministry of Finance
Table 1.7: Number of SOCs
Year 1992 2001 2011
Number of SOCs 6,545 5,655 1,309
Source: Ministry of Finance
Regarding the ownership structure of equitized SOCs, in 2011, the state holds 57 per
cent, insiders (employees and management board) control 30 per cent, and outside
investors hold 14 per cent, on average, of the total shares. Table 1.8 provides a comparison
of the ownership structure of equitized companies in Vietnam with privatised firms in other
transition countries. With the exception of Georgia, the share of outsiders in Vietnamese
equitized SOCs is lower than other transition economies. Furthermore, companies in which
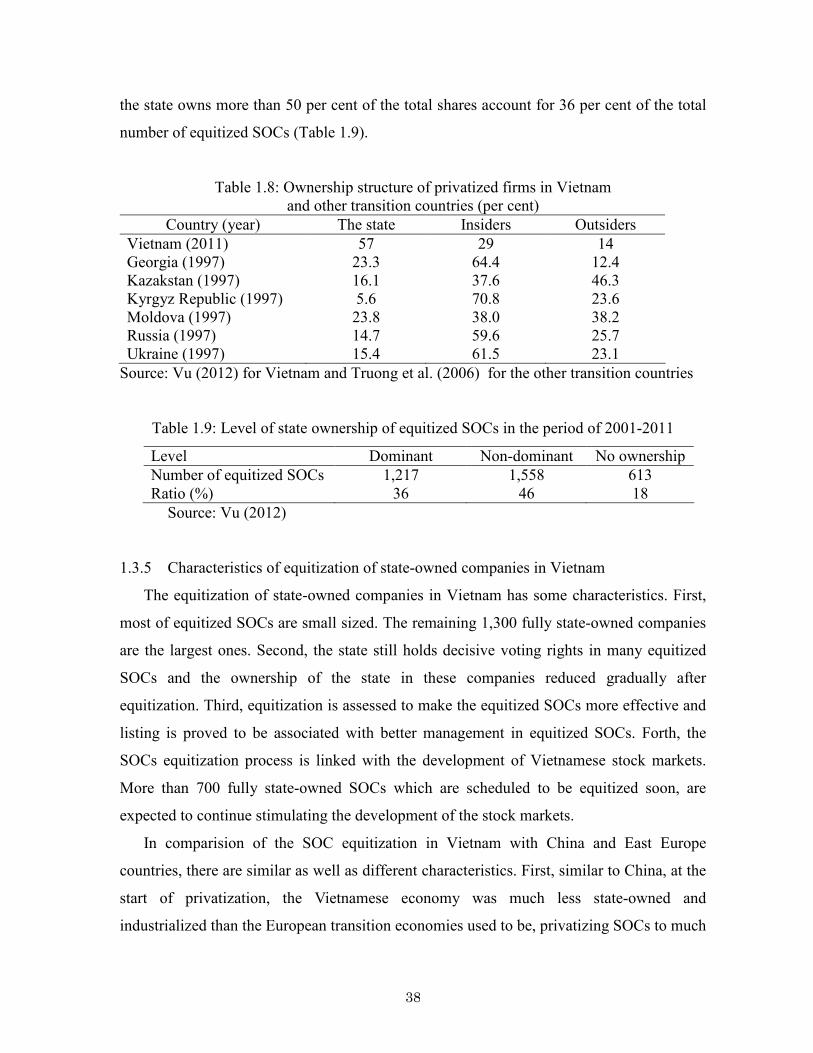
� ��
the state owns more than 50 per cent of the total shares account for 36 per cent of the total
number of equitized SOCs (Table 1.9).
Table 1.8: Ownership structure of privatized firms in Vietnam and other transition countries (per cent)
Country (year) The state Insiders Outsiders
Vietnam (2011) 57 29 14 Georgia (1997) 23.3 64.4 12.4 Kazakstan (1997) 16.1 37.6 46.3 Kyrgyz Republic (1997) 5.6 70.8 23.6 Moldova (1997) 23.8 38.0 38.2 Russia (1997) 14.7 59.6 25.7 Ukraine (1997) 15.4 61.5 23.1
Source: Vu (2012) for Vietnam and Truong et al. (2006) for the other transition countries
Table 1.9: Level of state ownership of equitized SOCs in the period of 2001 2011
Level Dominant Non dominant No ownership
Number of equitized SOCs 1,217 1,558 613 Ratio (%) 36 46 18
Source: Vu (2012)
1.3.5� Characteristics of equitization of state owned companies in Vietnam
The equitization of state owned companies in Vietnam has some characteristics. First,
most of equitized SOCs are small sized. The remaining 1,300 fully state owned companies
are the largest ones. Second, the state still holds decisive voting rights in many equitized
SOCs and the ownership of the state in these companies reduced gradually after
equitization. Third, equitization is assessed to make the equitized SOCs more effective and
listing is proved to be associated with better management in equitized SOCs. Forth, the
SOCs equitization process is linked with the development of Vietnamese stock markets.
More than 700 fully state owned SOCs which are scheduled to be equitized soon, are
expected to continue stimulating the development of the stock markets.
In comparision of the SOC equitization in Vietnam with China and East Europe
countries, there are similar as well as different characteristics. First, similar to China, at the
start of privatization, the Vietnamese economy was much less state owned and
industrialized than the European transition economies used to be, privatizing SOCs to much
� ��
less degree than in Europe countries (World Bank 2006). In Vietnam and China, the state
sector’s share of GDP in Vietnam has remained approximately 40 per cent at least from
1995 to 2002, while the share of the state sector in Hungary decreased sharply from 70 per
cent in 1991 to 20 per cent in 2003. Second, similar to China, in Vietnam, the state is
playing an important role as a shareholder or investor in the economy and many joint stock
companies (World Bank, 2006). Third, a difference between Vietnam and China is that the
decrease of number of SOCs in Vietnam was due to equitization, divestment, mergers,
acquisitions, and liquidation, while in China many SOCs were reorganized as subsidiaries
of large SOCs rather than “equitized” or “divested.” (World Bank, 2006).
1.4�Stock markets in Vietnam
1.4.1� Establishment of stock markets
Under the economic reform in Vietnam, state owned companies were restructured.
Equitization has been a main instrument to reform the SOCs effectively and quickly, which
resulted in the appearance of many equitized companies. Besides, according to the policy
of multiplying possession forms and encouraging domestic investment, many companies
have been newly established in the form of joint stock companies. This accelerated the
establishment and development of stock markets where joint stock companies can raise
medium and long term funds. Thus, in this section, I introduce an overview of the stock
markets in Vietnam with an emphasizing in listed companies, which are the objectives of
empirical analysis of my thesis.
The initial development of the stock market was closely linked to the equitization
process. Stock exchanges were decided to be established in Hanoi City and Ho Chi Minh
City for joint stock companies to raise mid and long term funds according to the Decision
127/1998/QD TTg of 11 July 1998. The Ho Chi Minh Securities Trading Center (HSTC)
was opened in 2000 and was renamed as Ho Chi Minh Stock Exchange (HOSE) in 2007.
The Hanoi Stock Exchange (HASE) was opened in 2005. The listing conditions of the
HOSE are stricter than are those of the HASE (Table 1.10). The listing norms for the HOSE
specify a higher level of capital, better business performance, and a more dispersed
stockholding structure than the norms for the HASE.
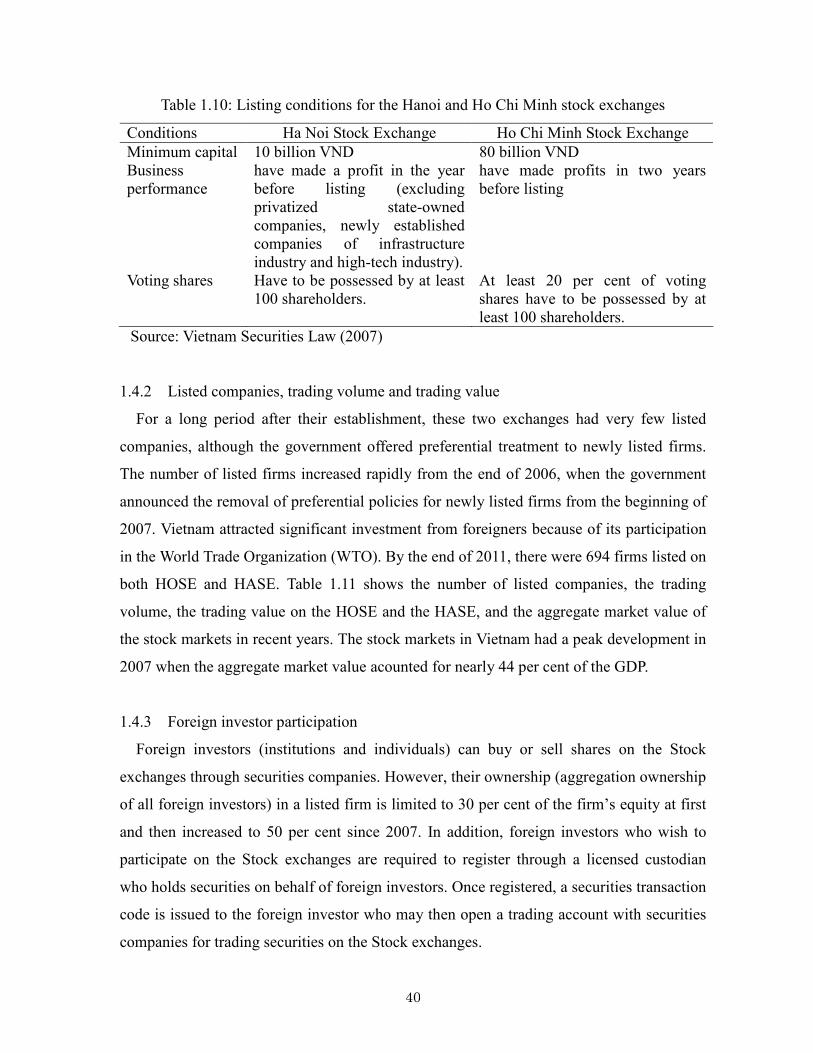
� ���
Table 1.10: Listing conditions for the Hanoi and Ho Chi Minh stock exchanges
Conditions Ha Noi Stock Exchange Ho Chi Minh Stock Exchange
Minimum capital 10 billion VND 80 billion VND Business performance
have made a profit in the year before listing (excluding privatized state owned companies, newly established companies of infrastructure industry and high tech industry).
have made profits in two years before listing
Voting shares Have to be possessed by at least 100 shareholders.
At least 20 per cent of voting shares have to be possessed by at least 100 shareholders.
Source: Vietnam Securities Law (2007)
1.4.2� Listed companies, trading volume and trading value
For a long period after their establishment, these two exchanges had very few listed
companies, although the government offered preferential treatment to newly listed firms.
The number of listed firms increased rapidly from the end of 2006, when the government
announced the removal of preferential policies for newly listed firms from the beginning of
2007. Vietnam attracted significant investment from foreigners because of its participation
in the World Trade Organization (WTO). By the end of 2011, there were 694 firms listed on
both HOSE and HASE. Table 1.11 shows the number of listed companies, the trading
volume, the trading value on the HOSE and the HASE, and the aggregate market value of
the stock markets in recent years. The stock markets in Vietnam had a peak development in
2007 when the aggregate market value acounted for nearly 44 per cent of the GDP.
1.4.3� Foreign investor participation
Foreign investors (institutions and individuals) can buy or sell shares on the Stock
exchanges through securities companies. However, their ownership (aggregation ownership
of all foreign investors) in a listed firm is limited to 30 per cent of the firm’s equity at first
and then increased to 50 per cent since 2007. In addition, foreign investors who wish to
participate on the Stock exchanges are required to register through a licensed custodian
who holds securities on behalf of foreign investors. Once registered, a securities transaction
code is issued to the foreign investor who may then open a trading account with securities
companies for trading securities on the Stock exchanges.
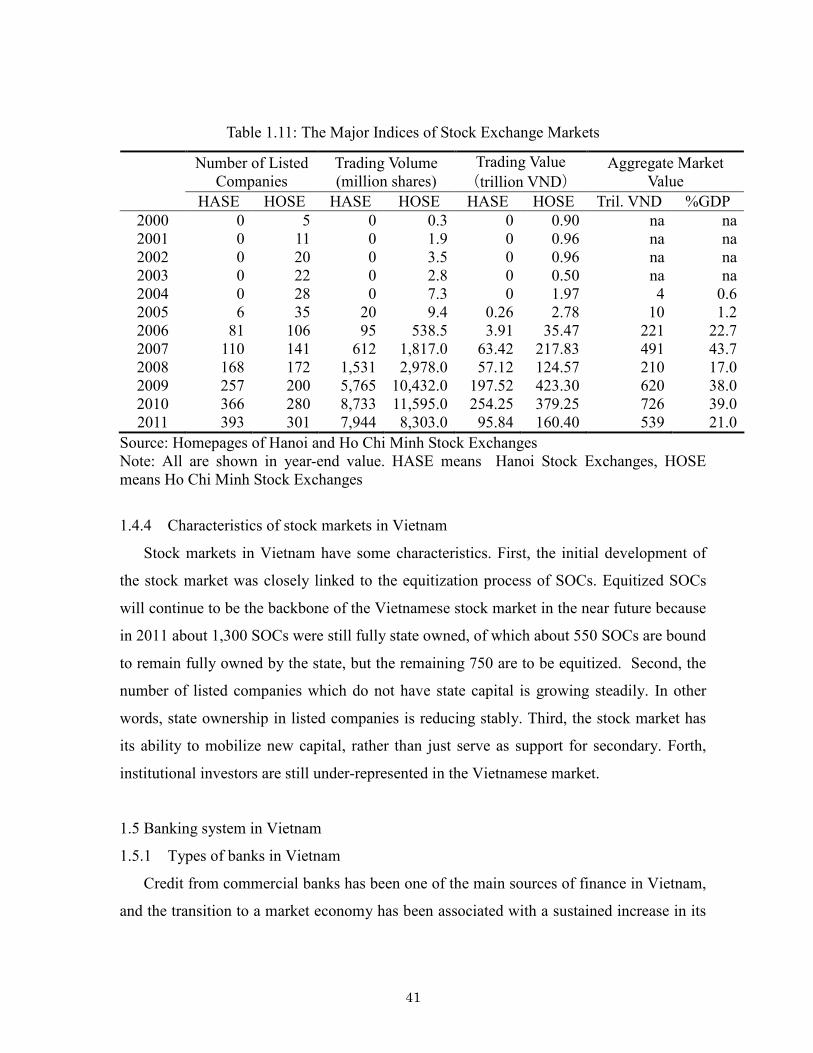
� ���
Table 1.11: The Major Indices of Stock Exchange Markets
Number of Listed Companies
Trading Volume (million shares)
Trading Value
(trillion VND)
Aggregate Market Value
HASE HOSE HASE HOSE HASE HOSE Tril. VND %GDP
2000 0 5 0 0.3 0 0.90 na na 2001 0 11 0 1.9 0 0.96 na na 2002 0 20 0 3.5 0 0.96 na na 2003 0 22 0 2.8 0 0.50 na na 2004 0 28 0 7.3 0 1.97 4 0.6 2005 6 35 20 9.4 0.26 2.78 10 1.2 2006 81 106 95 538.5 3.91 35.47 221 22.7 2007 110 141 612 1,817.0 63.42 217.83 491 43.7 2008 168 172 1,531 2,978.0 57.12 124.57 210 17.0 2009 257 200 5,765 10,432.0 197.52 423.30 620 38.0 2010 366 280 8,733 11,595.0 254.25 379.25 726 39.0 2011 393 301 7,944 8,303.0 95.84 160.40 539 21.0
Source: Homepages of Hanoi and Ho Chi Minh Stock Exchanges Note: All are shown in year end value. HASE means Hanoi Stock Exchanges, HOSE means Ho Chi Minh Stock Exchanges
1.4.4� Characteristics of stock markets in Vietnam
Stock markets in Vietnam have some characteristics. First, the initial development of
the stock market was closely linked to the equitization process of SOCs. Equitized SOCs
will continue to be the backbone of the Vietnamese stock market in the near future because
in 2011 about 1,300 SOCs were still fully state owned, of which about 550 SOCs are bound
to remain fully owned by the state, but the remaining 750 are to be equitized. Second, the
number of listed companies which do not have state capital is growing steadily. In other
words, state ownership in listed companies is reducing stably. Third, the stock market has
its ability to mobilize new capital, rather than just serve as support for secondary. Forth,
institutional investors are still under represented in the Vietnamese market.
1.5�Banking system in Vietnam
1.5.1� Types of banks in Vietnam
Credit from commercial banks has been one of the main sources of finance in Vietnam,
and the transition to a market economy has been associated with a sustained increase in its
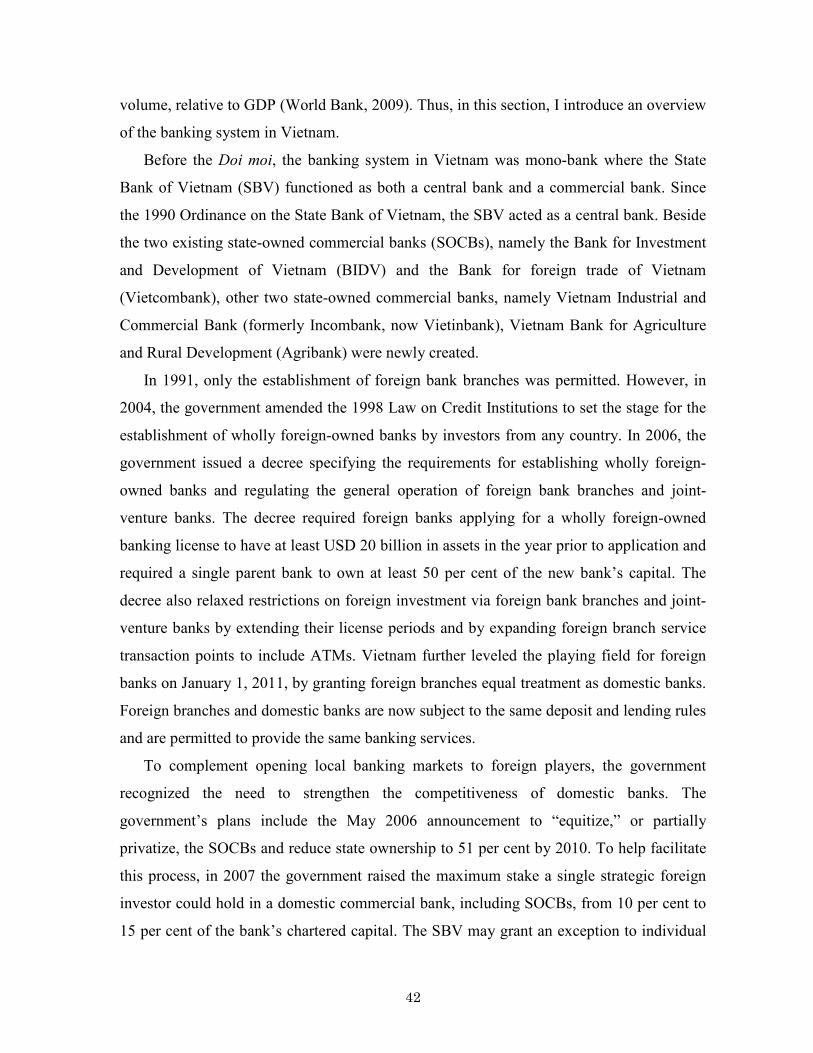
� ���
volume, relative to GDP (World Bank, 2009). Thus, in this section, I introduce an overview
of the banking system in Vietnam.
Before the Doi moi, the banking system in Vietnam was mono bank where the State
Bank of Vietnam (SBV) functioned as both a central bank and a commercial bank. Since
the 1990 Ordinance on the State Bank of Vietnam, the SBV acted as a central bank. Beside
the two existing state owned commercial banks (SOCBs), namely the Bank for Investment
and Development of Vietnam (BIDV) and the Bank for foreign trade of Vietnam
(Vietcombank), other two state owned commercial banks, namely Vietnam Industrial and
Commercial Bank (formerly Incombank, now Vietinbank), Vietnam Bank for Agriculture
and Rural Development (Agribank) were newly created.
In 1991, only the establishment of foreign bank branches was permitted. However, in
2004, the government amended the 1998 Law on Credit Institutions to set the stage for the
establishment of wholly foreign owned banks by investors from any country. In 2006, the
government issued a decree specifying the requirements for establishing wholly foreign
owned banks and regulating the general operation of foreign bank branches and joint
venture banks. The decree required foreign banks applying for a wholly foreign owned
banking license to have at least USD 20 billion in assets in the year prior to application and
required a single parent bank to own at least 50 per cent of the new bank’s capital. The
decree also relaxed restrictions on foreign investment via foreign bank branches and joint
venture banks by extending their license periods and by expanding foreign branch service
transaction points to include ATMs. Vietnam further leveled the playing field for foreign
banks on January 1, 2011, by granting foreign branches equal treatment as domestic banks.
Foreign branches and domestic banks are now subject to the same deposit and lending rules
and are permitted to provide the same banking services.
To complement opening local banking markets to foreign players, the government
recognized the need to strengthen the competitiveness of domestic banks. The
government’s plans include the May 2006 announcement to “equitize,” or partially
privatize, the SOCBs and reduce state ownership to 51 per cent by 2010. To help facilitate
this process, in 2007 the government raised the maximum stake a single strategic foreign
investor could hold in a domestic commercial bank, including SOCBs, from 10 per cent to
15 per cent of the bank’s chartered capital. The SBV may grant an exception to individual
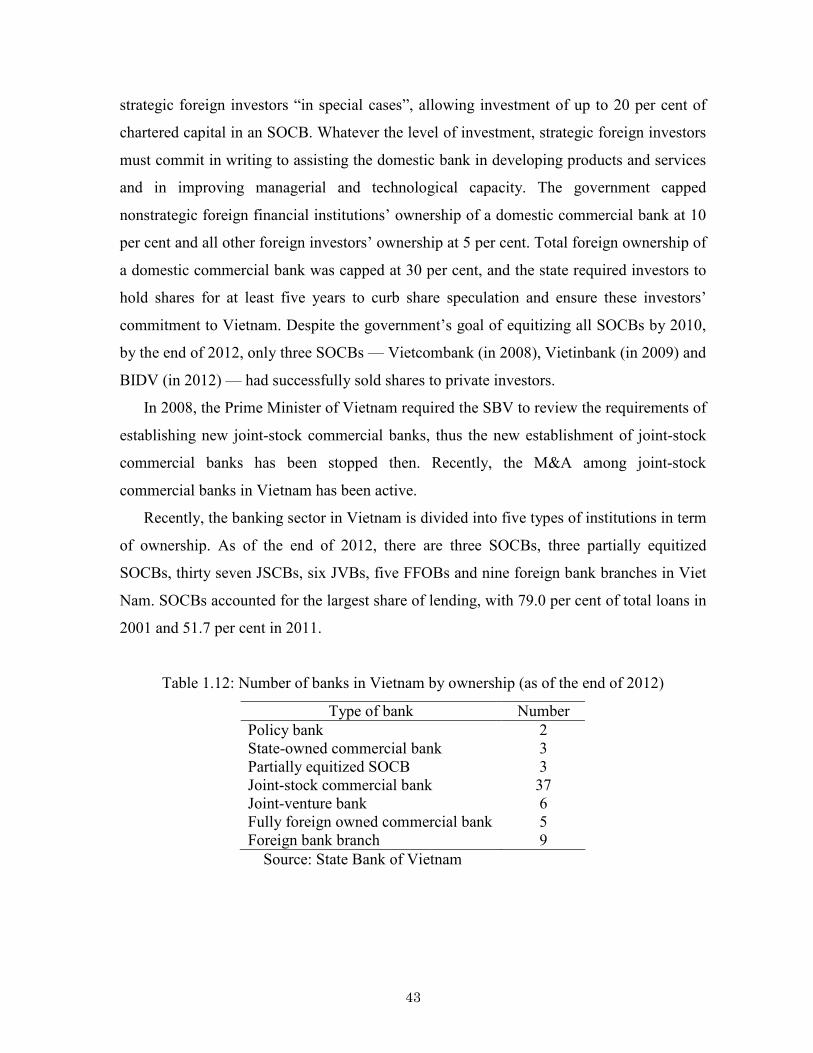
� ���
strategic foreign investors “in special cases”, allowing investment of up to 20 per cent of
chartered capital in an SOCB. Whatever the level of investment, strategic foreign investors
must commit in writing to assisting the domestic bank in developing products and services
and in improving managerial and technological capacity. The government capped
nonstrategic foreign financial institutions’ ownership of a domestic commercial bank at 10
per cent and all other foreign investors’ ownership at 5 per cent. Total foreign ownership of
a domestic commercial bank was capped at 30 per cent, and the state required investors to
hold shares for at least five years to curb share speculation and ensure these investors’
commitment to Vietnam. Despite the government’s goal of equitizing all SOCBs by 2010,
by the end of 2012, only three SOCBs — Vietcombank (in 2008), Vietinbank (in 2009) and
BIDV (in 2012) — had successfully sold shares to private investors.
In 2008, the Prime Minister of Vietnam required the SBV to review the requirements of
establishing new joint stock commercial banks, thus the new establishment of joint stock
commercial banks has been stopped then. Recently, the M&A among joint stock
commercial banks in Vietnam has been active.
Recently, the banking sector in Vietnam is divided into five types of institutions in term
of ownership. As of the end of 2012, there are three SOCBs, three partially equitized
SOCBs, thirty seven JSCBs, six JVBs, five FFOBs and nine foreign bank branches in Viet
Nam. SOCBs accounted for the largest share of lending, with 79.0 per cent of total loans in
2001 and 51.7 per cent in 2011.
Table 1.12: Number of banks in Vietnam by ownership (as of the end of 2012)
Type of bank Number
Policy bank 2 State owned commercial bank 3 Partially equitized SOCB 3 Joint stock commercial bank 37 Joint venture bank 6 Fully foreign owned commercial bank 5 Foreign bank branch 9
Source: State Bank of Vietnam

� ���
Table 1.13 expresses the ownership of banking sector in some transition economies.
According this, the privatization of banking sector in Vietnam is slowest, and even slower
than China, with the state ownership still remained 71 per cent in 2003.
Table 1.13 Ownership of banking sectorin some transition economies (per cent)
1993 2003
State Non state State Non state
Poland 86,2 13,8 25,2 74,8 Hungary 74,9 25,1 7,0 93,0 Czech 11,9 88,1 3,0 97,0 Slovakia 70,7 29,3 19,0 81,0 China 83,8 16,2 67,6 32,4 Vietnam >90,0 <10,0 71,0 29,0
Source: State Bank of Vietnam
SOCBs are majority state owned institutions that the government initially established to
fulfill a specialized policy lending function. SOCBs’ traditional customer base has been
state owned companies (SOCs), although they are increasingly expanding into more
traditional commercial banking activities and are no longer considered formal policy
institutions. SOCBs accounted for the largest share of lending, with 51.7 per cent of total
loans as of year end 2011, down from 79.0 per cent in 2001 (Table 1.14). JSCBs specialize
in lending to small and medium sized enterprise clients and in retail finance. JSCBs’
market share has grown in recent years, due mainly to market share captured from the
SOCBs. Together with joint venture and wholly foreign owned banks, they account for
slightly 44 per cent of total domestic lending as of end 2011. The share of loans to SOCs
in total outstanding loans has been declining steadily, from nearly 40 per cent in 2002 to
31.1 per cent in March 2008 and to 16.7 per cent in September 2012.
Table 1.14: Share of credit to the economy by type of institutions
2001 2002 2003 2004 2005 2006 2007 2008 2009 2010 2011
SOCB 79.0 79.0 78.0 76.0 70.8 65.0 55.0 52.0 54.1 51.3 51.7
JSCB 9.0 10.0 11.0 12.0 15.0 21.0 29.0 32.0 32.0 35.3 35.1
JV&FFCB 10.0 9.0 9.0 10.0 10.0 9.0 9.0 10.0 9.2 8.9 8.6
Others 2.0 2.0 2.0 2.0 2.0 5.0 7.0 6.0 4.7 4.5 4.7
Source: State Bank of Vietnam
� ���
1.5.2� Interest rate regime
Interest rate was imposed by subsidized policy under the centrally planned economy
independently from the international interest rate. The inflation was higher than the
norminal interest rate. As a result the real interest rate became negative. Since the
economic reform, monobank model was eliminated, central bank’s functions were
separated, and interest rate has been liberalized step by step. From 1989 to May 1992,
fixed interest rate policy was implemented. Interest rate was adjusted according to the
change of price index. Interest rate of foreign currency was that of international market. As
a result, real interest rate was turned to positive. From June 1992 to 1995, State Bank of
Vietnam (SBV) used interest rate frame policy. Commercial banks decided their interest
rate based on the floor interest rate of deposit and the ceiling interest rate of loan which
were fixed by the SBV. From 1996 to 2000, SBV managed by ceiling interest rate policy.
And from 2000 until now, SBV has been using basic interest rate policy. Basic interest rate
is decided based on the interest rate of interbank market, the interest rates of open market
operations of the SBV, the interest rate of deposit of credit institutions and trends of supply
and demand of capital. Under the Civil Law, the credit institution may not provide loans
with interest rates higher than 150 per cent of the basic interest rate. Table 1.15 summarizes
the liberalization of interest rate in Vietnam.
Table 1.15: Liberalization of interest rate in Vietnam
Period Interest rate mechanism
Before 1988 Subsidized interest rate policy 1989 – May 1992 Fixed interest rate policy June 1992 1995 Interest rate frame policy 1996 – 2000/7 Ceiling interest rate policy 2000/8 – 2002/5 Basic interest rate policy 2002/6 2008/4 Negotiation interest rate policy 2008/5 nay Basic interest rate policy
Source: State bank of Vietnam
1.5.3� Characteristics of banking system in Vietnam
One of the main characteristic of the banking system in Vietnam is the domination of
state owned and state controlled commercial banks and the piority ability to access to the

� ���
loans of SOCs. However, according to the reforms of this sector, the portion of SOCBs
loans to the economy has been falling year by year, to 51.7 per cent in 2011, and the
portion of total outstanding loans to SOCs also has been declining steadily, to 16.7 per cent
in September 2012. Another feature is that foreigners are allowed to invest in banking
sector, up to 30 per cent of the chartered capital of the listed banks. The interest rate in
Vietnam has been liberalized step by step and now under the basic interest rate policy.
1.6�Remarks
This chapter provided an overview of the reform of state owned companies (SOCs) as
well as a summary of stock markets, listing companies and banking sector in the context of
the economic reform under the Doi moi policy in Vietnam, which relate to the analyses in
the next chapters of the thesis.
The Vietnamese government initiated remarkable economic reforms (Doi moi) in 1986,
which ended the central planning era and adopted the market economy. Subsequently, the
country’s economy showed impressive results in such terms as economic growth and
inflation, especially since 1989. Over more than 20 years of economic reform, the average
growth rate of Vietnamese economy was 7.2 per cent, GDP increased 4 times, poverty
popullation ratio deceased from ¾ to about ¼8. Vietnam actively integrated to the world
economy, with an emphase of becoming an offical member of WTO since 2007. These
achievements resulted from continuous and timely reforms which created stimulating
factors for the economy development. First, reforms in argriculture in the late 1980s made
Vietnam became a world second rice exporter and a world top exporter of coffee, tea, etc.
Second, reforms in trade led to the strong development of foreign trade of Vietnam, with
annual growth rate was 23 per cent, export value increased sharply from 500 million dollars
in 1986 to nearly 40 billion dollars in 2006. This is an important source of foreign
currency for importing consuming goods and investing goods. Third, Vietnam succeed in
luring foreign capital such as FDI, ODA, remittance with a total amount of 70 billion
dollars, equaled to 13 per cent of GDP, and accounted for 50 per cent of total investment
capital. Forth, the development of private sector since the implementation of Corporate
Law since 2000 also contributed to these achievement, in the context that the state sector
���������������������������������������������������8 According to UNDP Vietnam
� ���
was in difficulty and needed to be reformed. These were as the same as the reform process
of China, which also started from the reforms in argriculture sector, then promotion of
foreign trade and attraction of FDI.
Along with the economic reforms, some comprehensive measures to restructure SOCs
have been launched since 1986. Among other measures, equitization has been seen as the
best way to restructure the SOCs effectively and quickly. Over 20 years of implementation
of state owned company equitization, by the end of 2011 about 4,000 SOCs have been
equitized. Most of equitized SOCs are small sized. The remaining 1,300 fully state owned
companies are the largest ones. Another feature of equitized SOCs is that the government
still holds decisive voting rights in many cases and the ownership of the state in these
companies reduced gradually after being equitized. Equitization is assessed to make the
equitized SOCs more effective and listing is proved to be associated with better
management in equitized SOCs.
There are two stock markets in Vietnam, Hochiminh Securities Exchange (HOSE) and
Hanoi Securities Exchange (HASE), which were established in 2000 and 2005 respectively,
with the listing norms of the HOSE being stricter than those of the HASE. The
development of Vietnamese stock markets is linked with the equitization process. There
remains more than 700 SOCs scheduled to be equitized soon, which will continue to be the
backbone of the Vietnamese stock market in the near future. One of the main strengths of
the stock market is its ability to mobilize new capital, rather than just serve as support for
secondary. Another characteristic of the stock markets in Vietnam is the under
representation of institutional investors in the markets.
Banking sector was also reformed to support the corporate sector in providing credit
for investment. Although, the state still remained a large ownership in the banking sector,
the portion of loans from SOCBs in total loans to the economy fell from 79 per cent of as
of year end 2001 to 51.7 per cent in 2011. Most banking credit still went to SOCs, but their
share in total outstanding loans has been declining steadily, from nearly 40 per cent in 2002
to 16.7 per cent in September 2012.
The participation of foreign investors plays an important part in the reform process in
Vietnam. In term of FDI, FDI sector has been distributting to the development of the
Vietnamese economy through creating jobs, encourging exporting, penetration of mordern
� ��
technical and management skill. In stock market, both individual and institutional foreign
invetors also have been acting actively.
Despite above mentioned achievements of the economic reform, there remains some
issues that need to be addressed. First, the equitization of SOCs has been slow down since
2007 while the remaning fully state owned comapanies that need to be equitized are large
and important ones. Second, equitized SOCs seem to have privileged access to credit from
state owned commercial banks due to their historical relationship with the SOCBs since
before equitizing as well as their implicit support from the state as a dominant stockholder.
In order to address these problems, Vietnamese government should accelate the
equitization process as well as the reform of banking sector. Third, although interest rate
was liberalized, banks still can choose the borrowers according to the policies of the state.
These implies that more reforms are needed, both in corporate sector and in banking sector,
in order to make Vietnamese economy access nearer to the market economy.

� ��
Figure 1.1: Main indicators of Vietnamese economy (1985 2013)
���������������� ������������������������
���
���
��
�
�
��
������
����
����
����
����
����
�
��� �� ��� �������
�� ��������������������
����
��������������������
� ���! ��� ������
Source: IMF (World Economic Outlook Databases)
Figure 1.2: Inflation rate in Vietnam (1985 2013)
�! ������� �������
����
�
���
���
"��
#��
���
����
����
����
����
����
����
�! ������� �������
Source: IMF (World Economic Outlook Databases)
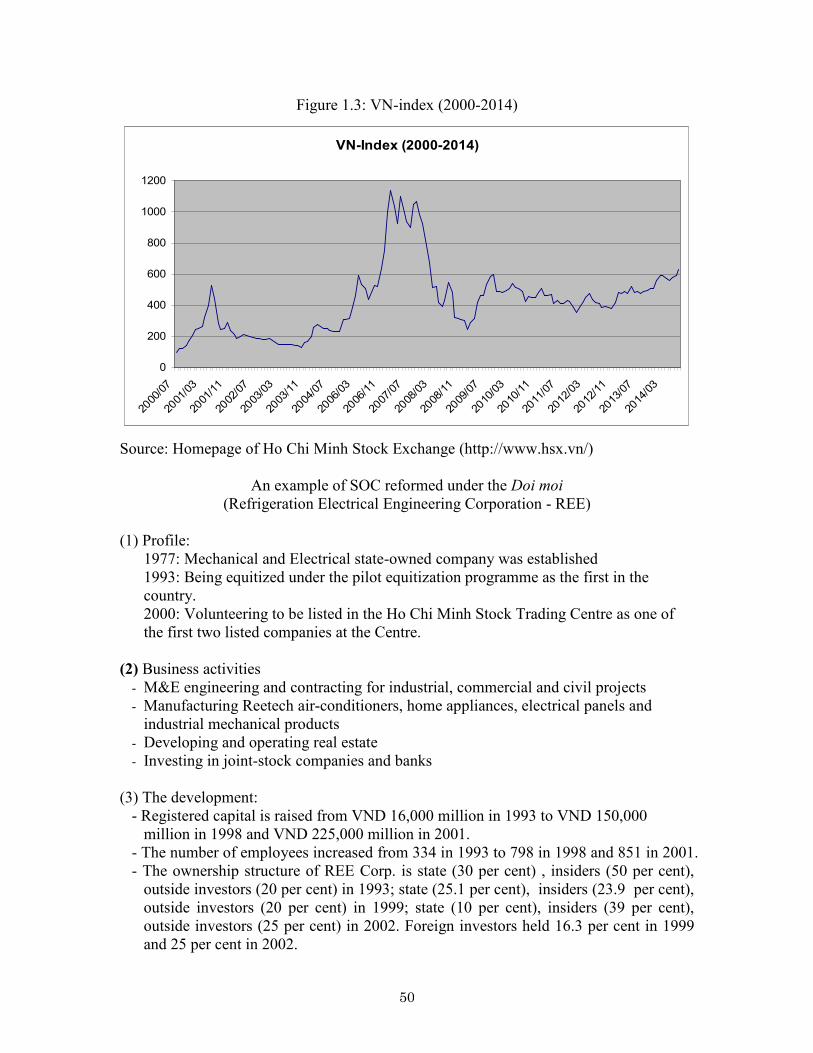
� ���
Figure 1.3: VN index (2000 2014)
�������������������
�
���
#��
$��
���
����
����
����
%�&
����
%�"
����
%��
����
%�&
���"
%�"
���"
%��
���#
%�&
���$
%�"
���$
%��
���&
%�&
����
%�"
����
%��
����
%�&
����
%�"
����
%��
����
%�&
����
%�"
����
%��
���"
%�&
���#
%�"
Source: Homepage of Ho Chi Minh Stock Exchange (http://www.hsx.vn/)
An example of SOC reformed under the Doi moi (Refrigeration Electrical Engineering Corporation REE)
(1) Profile:
1977: Mechanical and Electrical state owned company was established 1993: Being equitized under the pilot equitization programme as the first in the country. 2000: Volunteering to be listed in the Ho Chi Minh Stock Trading Centre as one of the first two listed companies at the Centre.
�!Business activities � M&E engineering and contracting for industrial, commercial and civil projects � Manufacturing Reetech air conditioners, home appliances, electrical panels and
industrial mechanical products � Developing and operating real estate � Investing in joint stock companies and banks
(3) The development:
Registered capital is raised from VND 16,000 million in 1993 to VND 150,000 million in 1998 and VND 225,000 million in 2001.
The number of employees increased from 334 in 1993 to 798 in 1998 and 851 in 2001. The ownership structure of REE Corp. is state (30 per cent) , insiders (50 per cent),
outside investors (20 per cent) in 1993; state (25.1 per cent), insiders (23.9 per cent), outside investors (20 per cent) in 1999; state (10 per cent), insiders (39 per cent), outside investors (25 per cent) in 2002. Foreign investors held 16.3 per cent in 1999 and 25 per cent in 2002.�
� ���
�� �����
������ �� �� ��� �� ������ �� "����� ��� ��
��������� �������� �
Chapter 1 overviews the Vietnamese stock markets and listed companies in Vietnam,
which are the results of economic reform and corporate reform according to the Doi moi.
This chapter describes the characteristics of the ownership structure, corporate finance,
and corporate governance of the listed companies in Vietnam, which relate to the
objectives of the empirical analysis in Chapters 4, 5, and 6 of this thesis.
Chapter 2 is organized as follows. Section 1 introduces the ownership structure and the
corporate finance of listed companies in Vietnam. Section 2 overviews the corporate
governance of listed companies in Vietnam and Section 3 summarizes the chapter.
2.1 Listed companies in Vietnam and features of their corporate finance
2.1.1 Listed companies in Vietnam and the characteristics of ownership structure
Before the Doi moi policy in 1986, the Vietnamese economy followed a central
planning mechanism with all private economy disallowed. Since the Doi moi policy came
into effect, the Vietnamese government has eliminated the central planning mechanism,
applied a socialist oriented market economy mechanism, multiplied forms of possession,
industrialized and opened the economy. In particular, private economy was legally
allowed and encouraged by the issuance of the 1990 Company Law for limited liability
companies and joint stock companies and the 1990 Private Company Law for private
companies9. Joint stock companies were allowed through the equitization of existing
state owned companies or new establishment. The equitization of state owned companies
began in June 1992 and subsequently was promoted by the “Government Ordinance on
���������������������������������������������������9 By the 31st December 1996, there were 17,535 private companies, 6,883 limited liabilities companies, 153 joint stock companies in Vietnam (General Statistics Office of Vietnam http://www.gso.gov.vn) . �
� ���
the Equitization of State owned Companies” promulgated on November 16, 2004. The
equitization occurred sequentially, starting with relatively small sized state owned
companies that achieved a reasonable level of management efficiency, but excluded
specific industrial sectors that require state control.
There are two stock markets in Vietnam, the HOSE and the HASE, which were
founded in Ho Chi Minh city in 2000 and in Ha Noi in 2005, respectively, and these
allow listed companies to procure medium and long term funds. Listing conditions for
the HOSE are stricter than those for the HASE; the former asks companies for higher
minimum capital, higher standards of sales excellence, and a stock ownership structure in
which stocks must be dispersed among many more shareholders. 694 companies were
listed on the two markets by the end of 2011.
Most of listed companies in Vietnam are in manufacturing and construction,
accounting for approximately 39 per cent and 25 per cent of the total, respectively (Table
2.1). The remainder is in industries such as agriculture, forestry and fisheries, mining,
electric power, service, transportation, finance, communications, real estate, and
commerce. In the HOSE, there is a high proportion of manufacturing companies (42.5 per
cent), with construction and transportation also having a significant presence (13 per cent
and 11.5 per cent, respectively). In the HASE, the largest proportions belong to the
manufacture sector (36.17 per cent) and the construction sector (35.74 per cent), leaving
other sectors far behind.
The Vietnamese government still has a strong influence on the corporate sector.
Despite the conversion of many state owned companies to joint stock companies, the
state remains the dominant shareholder and controls corporate activities. My sample
includes 435 companies listed on the HOSE or the HASE. Among these, 111 are state
controlled companies10, which accounts for about 25.5 per cent of the sample.
The foreign institutional investor is underdeveloped in stock markets in Vietnam,
where individual investors represent around 70 per cent of the total trading volume.
Foreign institutional investors invest with a long term perspective while individual
Vietnamese investors make comparatively small and short term investments.
���������������������������������������������������10 A state controlled company is defined as a company where the state holds more than 50 per cent of the ownership of the company. �
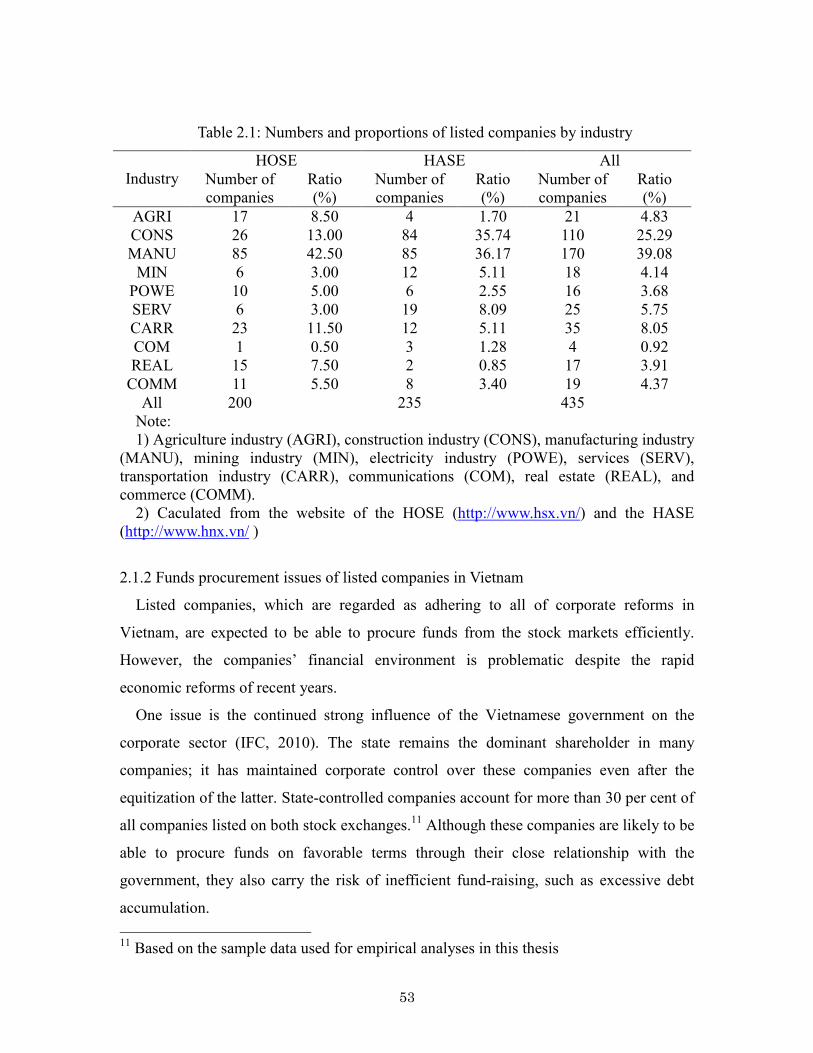
� ���
Table 2.1: Numbers and proportions of listed companies by industry
HOSE HASE All Industry Number of
companies Ratio (%)
Number of companies
Ratio (%)
Number of companies
Ratio (%)
AGRI 17 8.50 4 1.70 21 4.83
CONS 26 13.00 84 35.74 110 25.29 MANU 85 42.50 85 36.17 170 39.08
MIN 6 3.00 12 5.11 18 4.14
POWE 10 5.00 6 2.55 16 3.68 SERV 6 3.00 19 8.09 25 5.75
CARR 23 11.50 12 5.11 35 8.05
COM 1 0.50 3 1.28 4 0.92 REAL 15 7.50 2 0.85 17 3.91
COMM 11 5.50 8 3.40 19 4.37
All 200 235 435 Note: 1) Agriculture industry (AGRI), construction industry (CONS), manufacturing industry
(MANU), mining industry (MIN), electricity industry (POWE), services (SERV), transportation industry (CARR), communications (COM), real estate (REAL), and commerce (COMM).
2) Caculated from the website of the HOSE (http://www.hsx.vn/) and the HASE (http://www.hnx.vn/ )
2.1.2 Funds procurement issues of listed companies in Vietnam
Listed companies, which are regarded as adhering to all of corporate reforms in
Vietnam, are expected to be able to procure funds from the stock markets efficiently.
However, the companies’ financial environment is problematic despite the rapid
economic reforms of recent years.
One issue is the continued strong influence of the Vietnamese government on the
corporate sector (IFC, 2010). The state remains the dominant shareholder in many
companies; it has maintained corporate control over these companies even after the
equitization of the latter. State controlled companies account for more than 30 per cent of
all companies listed on both stock exchanges.11 Although these companies are likely to be
able to procure funds on favorable terms through their close relationship with the
government, they also carry the risk of inefficient fund raising, such as excessive debt
accumulation.
���������������������������������������������������11 Based on the sample data used for empirical analyses in this thesis �
� ���
The second problem is incomplete banking reform (Akiba, 2010). In Vietnam, banking
reform has proceeded in tandem with corporate reform through the steady segregation of
functions of state banks and commercial banks and the liberalization of interest rates. As
a result, the implementation of the market economy in the banking sector has advanced,
and the selection of loan customers and financing terms and conditions are becoming
more reasonable, with loans reflecting the loan companies’ profitability and risks.
However, four major state owned or state controlled commercial and development banks
dominate the banking sector, which accounts for most of the domestic funds supply; also,
the close relationship between state controlled companies and state owned banks
continues. In other words, state controlled companies may be in a better position
compared to other companies due to the former’s preferential procurement of funds,
irrespective of economic rationality.
The third issue is the insufficient information disclosure of companies, which instills
fear and affects the financing of the listed companies (World Bank, 2006). Stock markets
in Vietnam were established to facilitate the procurement of medium and long term
funds of the blue chip companies. However, appropriate allocation of funds in the
markets requires the sufficient disclosure of corporate information to the investors.
Nguyen (ibid.) and Biger et al. (ibid.) argue that a significant information asymmetry may
result due to this lack of corporate information disclosure. Listed companies may be
affected by the same problem (World Bank, 2012).
The fourth issue is the underdevelopment of institutional investors in stock markets in
Vietnam. If the markets are to supply medium and long term funds, they require
institutional investors with a long term perspective (IFC, 2007). In stock exchanges in
Vietnam, significant liberalization has led to increasing foreign investor participation.
However, institutional investors such as life insurance companies and pension funds are
still lacking. As a result, funding through the stock markets is underdeveloped, which in
turn forces companies to procure funds through debt financing methods such as bank
loans.
2.2 Corporate governance of listed companies in Vietnam
2.2.1 Corporate governance of listed companies in Vietnam
� ���
OECD (2004) defines that “Corporate governance involves a set of relationships
between a company’s management, its board, its shareholders and other stakeholders.
Corporate governance also provides the structure through which the objectives of the
company are set, and the means of attaining those objectives and monitoring performance
are determined.”
According to IFC (2011), better corporate governance may (1) enhance market
stability, (2) increase investor confidence and trust, (3) lead to the transparency of
company activities and operations, (4) encourage investment into Vietnamese markets
from local and foreign sources, and (5) reduce the cost of capital for companies. However,
the concept of corporate governance is still new to companies in Vietnam. Since 2010,
the IFC has employed the corporate governance scorecard as one mechanism to
encourage corporate governance improvements.
The recent legal framework for corporate governance of listed companies in Vietnam
consists of the Enterprise Law 200512, the Securities Law 2006 and its amendment in
2010, the Code of Corporate Governance of Listed Companies 200713 and its amendment
in 2012, and the listing rules of the Ho Chi Minh and Hanoi Stock Exchanges.
The corporate governance structure of a listed company in Vietnam includes a
General Meeting of Shareholders (GMS), a Board of Management (BOM), a Director or
General Director (CEO) and a Control Board. Figure 2.1 outlines this structure.
(a) Shareholders and rights of shareholders
The 2005 Enterprise Law in Vietnam divides shares into two classes: ordinary shares
and preference shares. Preference shares are further divided into sub groups, such as
voting preference shares. Each share class has its own characteristics and rights, and
owners of shares of the same class have the same rights.
Ordinary shareholders have the right to attend the General Meeting of Shareholders
(GMS), the shareholding company’s highest decision making authority under
Vietnamese laws. At the GMS, shareholders express their opinions about company
matters and vote on resolutions. Each ordinary share carries one vote. Ordinary
shareholders have the right to freely assign their shares, though certain restrictions may
���������������������������������������������������12 The latest is the Enterprise Law 2014 that will come into effect on 1 July 2015. �13 Issued by the MOF under the Decision 12/2007/QD BTC dated 13 March 2007. �

� ���
apply to founding shareholders following a company’s incorporation. Generally, ordinary
shareholders do not have the right to bind the company vis à vis third parties, unless a
shareholder also acts as the company’s legal representative. Importantly, shareholders
bear personal liability for committing certain acts in the name of the company, such as
conducting personal business or breaching the law. In other words, even if the
shareholder has the authority to bind the company (such as a legal representative), if the
act is in furtherance of a personal business transaction, or is in breach of the law, the
shareholder, and not the company, bears the liability.
Figure 2.1: Corporate governance structure of a listed company in Vietnam
Notes: Appointment and removal, supervision
Preference shareholders have a variety of rights depending on the type of share.
Voting shares, for example, carry more votes than ordinary shares. The ownership of
voting shares is limited, however, to organizations authorized by the Vietnamese
government and founding shareholders. Voting preference shareholders have the same
rights as ordinary shareholders, except that they may not assign their shares to other
Shareholders�
General Meeting of
Shareholders (GMS)�
Board of Management
(BOM)�Control Board�
Director or
General Director (CEO)
� ���
persons. The rights attached to preference shares belonging to a listed company must be
approved by the GMS.
(b) General Meeting of Shareholders (GMS)
According to the 2005 Enterprise Law, the GMS must include all shareholders
holding voting shares (including ordinary shareholders and voting preference
shareholders) and it is the highest management body of a shareholding company that is
responsible for macro level company decisions, including the company’s overall
development direction, hiring and dismissing members of the Board of Management
(BOM) and Control Board, and major investment decisions. If a shareholder is a
corporate entity, it must appoint one or more authorized representative(s) to participate in
the GMS.
The GMS is required to hold a meeting at least once a year, within the territory of
Vietnam14 and no later than four months since the end of the financial year. Shareholders
with more than 10 per cent of the total ordinary shares (or a smaller percentage if
stipulated in the charter) for at least six consecutive months (called the “Shareholder
Block”) have the right to request the BOM to call an additional meeting (referred to as an
“extraordinary meeting”) of the GMS. If the BOM fails to call the extraordinary GMS
meeting, the Supervision Board is required to do so. If the Control Board does not call
the meeting, the shareholders themselves may convene the meeting and ask the relevant
government authorities to supervise.
A regular meeting of the GMS considers the following matters: (a) annual financial
statements; (b) the report of the BOM assessing the efficiency of the company’s business
management; (c) the report of the Control Board regarding company management by the
BOM and the CEO; (d) the amount of dividends payable on each class of share; and (e)
���������������������������������������������������14 The GMS is conducted when the number of attending shareholders represents at least 65 per cent of the voting shares (Enterprise Law 2014 reduces this to 51 per cent). If the first meeting cannot take place because this condition is not satisfied, the meeting may be convened for a second time within 30 days of the intended opening of the first meeting. When the second meeting is conducted, the number of attending shareholders must represent at least 51 per cent of the voting shares (Enterprise Law 2014 reduces this to 33 per cent). The specific percentage in the first and second meetings is stipulated in the charter of the company.�
� ��
other matters within its authority. The issues covered at the GMS are set out in an agenda.
Generally, the GMS’s agenda is prepared by the meeting’s convener. However,
shareholders exercise some authority over the agenda’s contents in the form of
recommendations. A Shareholder Block may recommend items to be included in the
agenda. The recommendations can be refused, but only on limited grounds, such as
being untimely or outside the GMS’s authority. If the recommendations are not refused,
they must be agreed by the entire GMS and added to the agenda. The GMS may pass
resolutions that fall within its power by way of voting in the meeting or collecting written
opinions. A resolution of the GMS is passed in a meeting when it is approved by a
number of shareholders representing at least 65 per cent (the Enterprise Law 2014
reduces this to 51 per cent) of the total voting shares of all attending shareholders; the
specific percentage shall be stipulated in the charter of the company. The minutes of the
GMS meeting must be written in Vietnamese and other foreign languages.
(c) Board of Management (BOM)
According to the Enterprise Law 2005, the BOM is the body managing the company
and has full authority to make decisions in the name of the company and to exercise the
rights and discharge the obligations of the company that do not belong to the GMS. The
BOM comprises 3 to 11 members that are appointed and dismissed by the GSM 15 and
one third of the members of the BOM must be non‐executive independent members.
The members of the BOM of a shareholding company must be individual shareholders or
representatives of institutional shareholders owning at least 5 per cent of the total
ordinary shares; or others (including non shareholders and shareholders holding less than
5 per cent of the total ordinary shares) who have expert qualifications or actual
experience in business management; or as stipulated in the company charter. BOM
members are appointed for a maximum five year term, but may be re appointed for
���������������������������������������������������15 Shareholders or a group of shareholders holding less than 10 per cent of the voting shares for a consecutive period of at least six months are entitled to nominate one member; shareholders holding from 10 per cent to less than 30 per cent are entitled to nominate two members; shareholders holding from 30 per cent to less than 50 per cent are entitled to nominate three members; shareholders holding from 50 per cent to less than 65 per cent are entitled to nominate four members; and shareholders holding from 65 per cent upwards shall be entitled to nominate all members.�
� ��
additional terms. The remuneration, salary, and bonus of members of the BOM are
decided by the GMS based on the business results of the company. A member of the
BOM must not concurrently be a member of the BOM of more than five other companies.
The head of the BOM is a chairperson who is appointed by the GMS or the BOM in
accordance with the charter16. The chairperson of the BOM can concurrently hold the
position of the CEO. In a survey at the end of 2007 by the Central Institute for Economic
Management (CIEM), 85 per cent of the total surveyed companies have their chairman of
the BOM concurrently as their (general) director.
(d) Director or General Director (CEO)
Vietnamese laws in general as well as the Enterprise Law 2005 in particular does not
differentiate between the terms “director” and “manager”, the terms “managing director”,
“executive director”, “non‐executive director” and “independent directors”. The term
“independent directors” was first introduced in the Amendments in 2012 of the Code of
Corporate Governance of Listed Companies 2007.
According to the Enterprise Law 2005, the director or general director of a
shareholding company must be a shareholder owning at least 5 per cent of the ordinary
shares; or a non shareholder having expert qualifications or actual experience in business
management; or being stipulated in the company charter. State officials and employees;
leading officers and managers of SOEs (except for those who are appointed as
representatives of state capital in companies) cannot be appointed as a company
director/manager. The CEO of a shareholding company must not concurrently be the
CEO of another company. The office term of the CEO of a shareholding company is no
more than five years. The CEO of a shareholding company must have a service contract
with a company that is subject to the Enterprise Law 2005 and the Labor Code 1994.
Accordingly, there are very few opportunities for the company to dismiss the CEO before
the expiration of the service contract.
Under the Enterprise Law 2005, the remuneration, salary, and bonus of company
managers/directors are decided by the BOM based on the business results of the company.
���������������������������������������������������16 The Enterprise Law 2014 abrogated the right of the GMS to appoint the head of the BOM.�
� ���
The Enterprise Law 2005 necessitates that directors/managers act in the best interests
of the company and for proper purposes, and they must disclose personal interests to
avoid conflicts of interests. However, there are some shortcomings in the provisions
regarding the directors/managers’ duties under the law such as not prescribing a duty to
prevent insolvent trading; not requiring directors/managers to notify creditors when the
company cannot pay debts due and payable in full; lack of necessary penalties to force
directors to fulfill their duties.
The Enterprises Law 2005 stipulates that the legal representative of a shareholding
company is either the chairperson of the BOM or the CEO. Although these provisions
appear to be flexible, they are inappropriate because the powers of the CEO are restricted
by the chairperson and the CEO may have no authority to approve contracts and sign
documents on behalf of the company.
(e) Control Board
The Enterprises Law 2005 requires that a Control Board must be established in a
joint stock company with more than 11 individual shareholders or having organizations
owning more than 50 per cent of the total shares of the company. A Control Board has
from 3 to 5 members, which are elected by the GMS and distinct from the BOM. The
term of the Control Board can be no more than five years. Members of the Control Board
may be re appointed for additional terms. The members of the Control Board elect one
member to be the head of the Control Board. The rights and duties of the head of the
Control Board are stipulated in the company Charter. More than half of the members of
the Control Board must permanently reside in Vietnam and at least one member must be
an accountant or auditor. Company managers and their relatives cannot become a
member of the Control Board. Members of the Control Board do not need to be
shareholders or employees of the company.
The Control Board has rights and duties (1) to supervise the BOM and the CEO in
managing and running the company; (2) to inspect the reasonableness, legality,
truthfulness and prudence in the management and administration of business activities, in
the organization of statistical and accounting work and the preparation of financial
statements; (3) to evaluate reports on the business, including semi annual or annual
� ���
financial statements and reports on evaluation of the management of the Board of
Management; (4) to review books of accounts and other documents of the company, the
management and administration of the activities of the company at any time deemed
necessary or pursuant to a resolution of the GMS or as requested by the Shareholder
Block; (5) to recommend to the BOM or the GMS regarding changes and improvements
of the organizational structure, management and administration of the business operations
of the company. The Control Board may use an independent consultant to perform the
assigned rights and duties.
(f) Conflict of interest between BOM and CEO
The current structure of corporate governance of shareholding companies in Vietnam
has led to authority concentration in few persons who are often majority shareholders and
concurrently senior managers as members of the board of management and/or directors.
Supervision within the company is relatively weak and formalistic, especially in equitized
state owned companies. These weaknesses may create a large space for majority
shareholders and managers to make use of the company assets and opportunities to serve
their own benefits.
2.2.2 Corporate governance of listed companies with a state shareholder
As discussed in Chapter 1, there are many equitized state owned companies in
Vietnam, and state ownership is still high even after listing on the stock markets. The
corporate governance structure of these companies is different to other companies. Figure
2.2 outlines these differences.
If the state is a shareholder of a joint stock company, the state body that is authorized
to exercise state ownership rights at the company will appoint one or more specific
individuals to be representatives of the state shareholder. Such state bodies are numerous,
ranging from ministry, provincial people’s committee and relevant department, state
owned general corporation, state holding company and state owned enterprise. The rights
of the state shareholder are exercised by specific individuals who are representatives of
the state shareholder. The representatives of the state shareholder can be members of the
BOM, and the number of representatives of the state shareholder in the BOM depends on
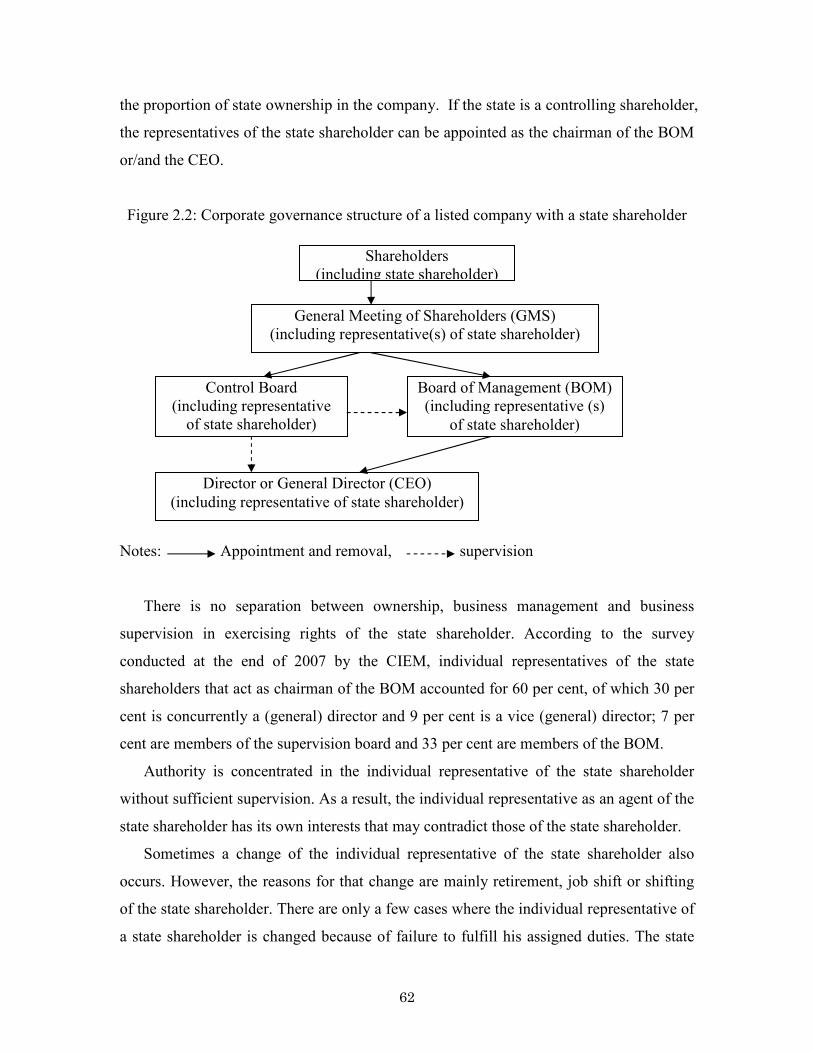
� ���
the proportion of state ownership in the company. If the state is a controlling shareholder,
the representatives of the state shareholder can be appointed as the chairman of the BOM
or/and the CEO.
Figure 2.2: Corporate governance structure of a listed company with a state shareholder
Notes: Appointment and removal, supervision
There is no separation between ownership, business management and business
supervision in exercising rights of the state shareholder. According to the survey
conducted at the end of 2007 by the CIEM, individual representatives of the state
shareholders that act as chairman of the BOM accounted for 60 per cent, of which 30 per
cent is concurrently a (general) director and 9 per cent is a vice (general) director; 7 per
cent are members of the supervision board and 33 per cent are members of the BOM.
Authority is concentrated in the individual representative of the state shareholder
without sufficient supervision. As a result, the individual representative as an agent of the
state shareholder has its own interests that may contradict those of the state shareholder.
Sometimes a change of the individual representative of the state shareholder also
occurs. However, the reasons for that change are mainly retirement, job shift or shifting
of the state shareholder. There are only a few cases where the individual representative of
a state shareholder is changed because of failure to fulfill his assigned duties. The state
Shareholders (including state shareholder)�
General Meeting of Shareholders (GMS) (including representative(s) of state shareholder)�
�
Board of Management (BOM) (including representative (s)
of state shareholder)�
Control Board (including representative
of state shareholder)��
Director or General Director (CEO)
(including representative of state shareholder)

� ���
body that is assigned as the state shareholder measures the performance of its individual
representative mostly by financial performance of the enterprise.
2.2.3 Corporate governance of listed companies with foreign shareholders
Figure 2.3 outlines the corporate governance of listed companies with foreign
shareholders.
Figure 2.3: Corporate governance structure of a listed company with foreign shareholders
Notes: Appointment and removal, supervision
If an individual or organizational foreign shareholder holds more than 5 per cent of
the ownership of a joint stock company, it can be a member or appoint a representative to
act as a member of the BOM. The number of representatives of the organizational foreign
shareholder in the BOM depends on the proportion of its ownership in the company. The
individual foreign shareholder or the representatives of the organizational foreign
shareholder can also be appointed as the chairman of the BOM or/and the CEO.
According to the scorecard by the IFC in 2012, foreign ownership indicates a better
chance of better corporate governance relative to other companies. This may reflect the
influence of foreign ownership demanding better corporate governance practices or
Shareholders
(including foreign shareholder)�
General Meeting of Shareholders (GMS) (including individual foreign shareholders or
representative of organizational foreign shareholders)�
Board of Management (BOM) (including individual foreign
shareholders or representative of
organizational foreign shareholders)�
Control Board (including individual foreign
shareholders or representative of organizational foreign shareholders)�
�
Director or General Director (CEO) (individual foreign shareholder or representative
of organizational foreign shareholder)
� ���
indeed it may reflect the fact that foreign investors target their investment at companies
that already demonstrate better corporate governance.
2.2.4 Impacts of corporate governance on the capital structure, investment and
profitability of listed companies in Vietnam
From the above stated characteristics of the corporate governance structure of the
listed companies in Vietnam, such corporate governance structure may affect capital
structure, investment and profitability of listed companies in Vietnam as follows.
First, the state still retains controlling rights in many listed companies that may affect
the fund raising activities of these companies. Four major state owned or state controlled
commercial and development banks dominate the banking sector, accounting for most of
the domestic fund supply. Companies with a state shareholder may have a close
relationship with these banks because they both serve the policy of the Vietnamese
government, or the individual representative of the state shareholder of the company has
a good relationship with the individual representative of the state shareholder of the bank.
Thus they may be in a better position compared to other companies due to their
preferential procurement of funds, irrespective of economic rationality.
Second, the state still retains the controlling rights in many listed companies that may
affect the investment and profitability of these companies. State controlled companies are
under the strong influence of the government and in some cases function as tools for
implementing government policies. Therefore, state controlled companies are expected to
be more active in investing than companies that are not state controlled. On the other
hand, since state owned companies are under the strong influence of the government,
they are less profit oriented than private companies. Therefore, state controlled
companies are less likely to make use of good investment opportunities and to be inactive
in investing.
Third, the state still retains controlling rights in many listed companies that affects the
monitoring activities of banks towards these companies. State controlled companies seem
to access bank loans more easily than other companies because the former implement
policy projects of the government and state owned commercial banks are forced to lend
to them with priority and preference. Therefore, state owned commercial banks may not

� ���
be normal external creditors of state controlled companies, and their monitoring activities
may be less stringent toward state controlled companies.
2.3 Remarks
This chapter reviewed the characteristics of the ownership structure, corporate finance,
and corporate governance of the listed companies in Vietnam. The development of listed
companies in Vietnam is concurrent with the equitization of SOCs. Thus, one of the
significant features of the ownership structure of listed companies in Vietnam is that the
state remains a dominant shareholder, which has effects on corporate activities and
corporate governance of these companies. Such companies may have greater privilege
over other companies in raising funds in the context that the four major state owned or
state controlled commercial banks still provide most of the loan to the entire economy,
but may be less inactive in investment or less effective in operation. Information
asymmetry may be significant among listed companies, especially among state controlled
companies due to the lack of corporate information disclosure.
Moreover, with the policy of opening the economy, foreign investors are encouraged to
invest in Vietnam, not only in the form of FDI but also in the stock markets, with space
for foreign investors of up to 50 per cent of the ownership of a listed company. In tandem
with the high development of the Vietnamese economy, the penetration of foreign
investors into the stock markets is another characteristic of the ownership structure of
listed companies in Vietnam, which also has effects on these companies’ activities.
�
�
�
�
�
�
�
�
�
�
�
�
�
�
�
�

� ���
�
�
�
�
�
�
�
�
�
�
�
�
�
�
�
�
�
�
�
�
�
�
�
�
�
�
�
�
�
�
�
�
�
�
�
�
�
�
�
�
�
�
�
�
�
�
�
�
�
�
�
� ���
�� �����
#��� ��������$%�&�������� ��������
In developing and transition countries, reforms in corporate sector which includes
privatizating state owned companies, opening the economy to the foreign investors and
reforming banking sector in order to improve microeconomic efficiency, boost economic
growth and reduce public debt through the elimination of unnecessary subsidies
(Sheshinski and López Calva, 2003) are key components of economic reform. In the
period of transition, companies are no longer subsided as in the planned economy, but
have to make financial and investment decisions by themselves. Thus, such issues as the
impacts of the state ownership, foreign ownership and banks on corporate’s fund raising,
investment and performance after the reforms are much concerned. This chapter aims at
reviewing both the theoretical and empirical literatures on capital structure and its
impacts on investment and performance of companies in the context of corporate reform,
which is a background for the empirical study on this issue to be conducted in Chapter 4,
5, 6 as well as building the hypotheses and models for these analyses.
This chapter is organized as follows. Section 1 summerizes studies on corporate
reform of transition economies. Section 2 presents theorical framework in analysing
capital structure of companies in modern corporate finance as well as related empirical
studies. Section 3 reviews theorical and empirical literatures on the impacts of capital
structure on investment decisions of the companies. Section 4 states theories and
empirical analyses on the impacts of companies’ capital structure on their performances.
Section 5 states theories and empirical analyses on the relation of companies’ capital
structure, investment and growth opportunities. Section 6 introduces empirical analyses
on capital structure issues of companies in Vietnam under the context of corporate reform.
Section 7 states the hypotheses on corporate finance of listed companies in Vietnam
based on modern corporate finance theories which are introduced in section 2, 3, 4, 5 as
well as the case of Vietnam which are explained in Chapter 1, 2. Section 8 describes the
� ��
models as well as methods and data set for empirical analyses which will be conducted in
Chapter 4,5,6. Section 9 is the summary of the chapter.
3.1�Literatures on corporate reform of transition economies
Although reforms in corporate sector have been actively implemented in developing
and transition countries in last decades, there are numerous empirical studies on corporate
reform in developed countries, while few for developing countries and transition
economies. For transition economies, empirical studies focus much on Eastern Europe
countries and China, while there are few studies on Vietnam. This section summerizes
empirical studies on corporate reform of transition economies, including Central and East
Europe countries, China and Vietnam. Empirical studies focus on find out the
determinants of capital structure of companies in transition economies by using advanced
corporate finance theories which are well applied to developed countries. Some studies
also investigate the relation between leverage and investment behavior, leverage and
profitability of companies in transition countries. Table 3.1 lists up studies on corporate
reform of transition economies.
3.1.1� Literatures on Central and East Europe countries
Since the first study on capital structure of companies in transition economies (Cornelli,
Portes, and Schaffer (1996)), there have been many studies on this issue in these
countries, for example Hussain and Nivorozhkin (1997) examined the capital structure of
listed companies in Poland during the 1991 1994 period; Nivorozhkin (2002)
investigated the determinants of the capital structure of listed companies in Hungary;
Bauer (2004) analyzed listed companies of the Czech Republic; Delcoure (2007)
analyzed listed companies in the Czech Republic, Poland, Russia, and Slovakia; Ebaid, I.
E. (2009) investigated the impacts of capital structure on performance of non financial
Egyptian listed firms from 1997 to 2005.
3.1.2� Literatures on Asia countries
Studies on Asian corporate finance issues have focused on China, for example Chen
(2004) and Huang and Song (2006) analyzed the determinants of the financing structures
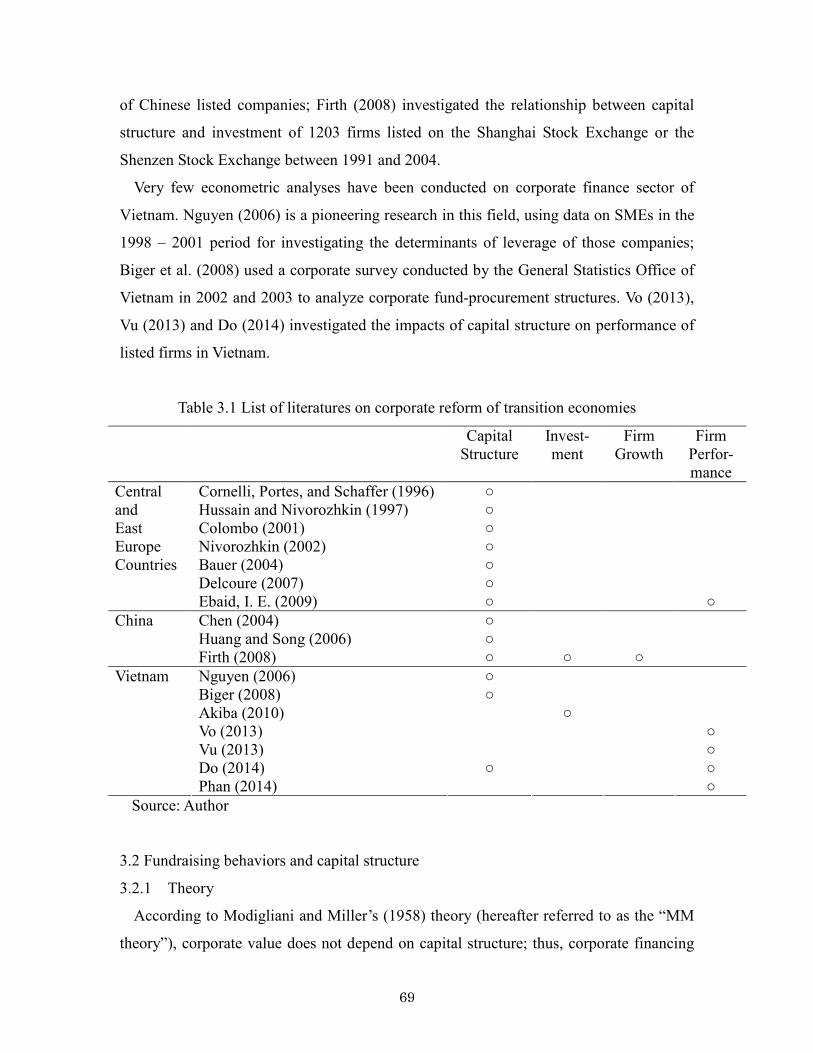
� ��
of Chinese listed companies; Firth (2008) investigated the relationship between capital
structure and investment of 1203 firms listed on the Shanghai Stock Exchange or the
Shenzen Stock Exchange between 1991 and 2004.
Very few econometric analyses have been conducted on corporate finance sector of
Vietnam. Nguyen (2006) is a pioneering research in this field, using data on SMEs in the
1998 – 2001 period for investigating the determinants of leverage of those companies;
Biger et al. (2008) used a corporate survey conducted by the General Statistics Office of
Vietnam in 2002 and 2003 to analyze corporate fund procurement structures. Vo (2013),
Vu (2013) and Do (2014) investigated the impacts of capital structure on performance of
listed firms in Vietnam.
Table 3.1 List of literatures on corporate reform of transition economies
Capital Structure
Invest ment
Firm Growth
Firm Perfor mance
Cornelli, Portes, and Schaffer (1996) ○ Hussain and Nivorozhkin (1997) ○ Colombo (2001) ○ Nivorozhkin (2002) ○ Bauer (2004) ○ Delcoure (2007) ○
Central and East Europe Countries
Ebaid, I. E. (2009) ○ ○
Chen (2004) ○ Huang and Song (2006) ○
China
Firth (2008) ○ ○ ○
Nguyen (2006) ○ Biger (2008) ○ Akiba (2010) ○ Vo (2013) ○ Vu (2013) ○ Do (2014) ○ ○
Vietnam
Phan (2014) ○
Source: Author
3.2�Fundraising behaviors and capital structure
3.2.1� Theory
According to Modigliani and Miller’s (1958) theory (hereafter referred to as the “MM
theory”), corporate value does not depend on capital structure; thus, corporate financing
� ���
has no impact on corporate value when the following conditions exist together: a
complete capital market, perfect information, no corporate taxes, no transaction costs,
and no economic externalities.
However, the full set of preconditions of the MM theory is not likely to exist in the real
world; therefore, an adjusted MM theory (also called the trade off theory) is required.
According to the trade off approach, companies choose the optimal capital structure that
minimizes the cost of capital so as to maximize the value of the company, while
considering the impact of corporate tax and the risk of bankruptcy.
Corporation tax: In the real world, there is a corporate tax. If a company procures
funds by issuing corporate bonds or by availing of bank loans, instead of raising funds
through equity, corporate value can be enhanced by saving on corporate taxes. However,
using tax credits and non tax incentives such as depreciation and investment tax
incentives (“non debt tax reductions”) weakens the tax saving effect. Therefore, it is
expected that companies whose corporate taxes are higher will have their debt ratios
raised and that companies that can use non debt tax reductions will have their debt ratios
lowered.
Bankruptcy risk: The higher a company’s debt ratio, the lower its average capital cost.
However, when the debt ratio is high, the risk of bankruptcy is also high, resulting in a
higher risk premium. The optimal debt ratio is the one that is associated with maximum
corporate value. The higher a company’s bankruptcy risk, the more expensive is its
procurement of debt funds; it is therefore expected that companies’ debt ratios will be
lowered. Generally, the larger a company is, the smaller its exogenous shocks and thus
the lower its bankruptcy risk. Therefore, the larger a company is and the smaller its risk
of bankruptcy, the higher its debt ratio is expected to be.
Besides corporate taxes and business risk, when an information asymmetry exists,
agency cost has an important influence on the determination of corporate value, namely
the decision of the most suitable capital structure for a company. Since Jensen and
Meckling (1976), Myers (1977), and Myers and Majluf (1984), the problem of the
conflict among the benefits of related parties such as stockholders, managers, and
creditors, which are factors of the agency cost, have attracted much attention. The agency
cost approach helps determine the optimal capital structure of a company.
� ���
Internal funds: When the agency problem between large shareholders (or corporate
owners) and external creditors is serious, the risk premium for the procurement of
external debt funds will be larger, and the agency cost of procuring debt funds will be
higher. It is therefore expected that companies with abundant internal funds will tend to
maintain lower debt ratios to prevent a dependence on debt.
Collateral: The agency cost for procuring debt funds can be reduced by providing
collateral to creditors. Thus, companies that can provide more collateral can reduce the
agency cost of procuring debt funds, and their corporate debt ratios are expected to be
higher.
3.2.2� Empirical analysis
Several empirical studies on corporate financial structures in transitional economies
have been conducted on East European countries and China (Table 3.2). They examine
corporate behaviors using the modified MM, agency costs, and pecking order approaches,
with a focus on government influence on the markets and companies peculiar to
transitional economies. In the Eastern European context, the first study on capital
structure of companies in transition economies was Cornelli, Portes, and Schaffer (1996).
They estimate a simple static leverage regression, where the explanatory variables are
tangibility, size, profitability and a dummy for state ownership by using data of Czech,
Hungarian and Polish companies in the early 1990s. They find that the level of leverage
of these transition economies is lower than that of Western economies and that the
fraction of short term debts is higher than long term debts. They also find that in contrast
to studies on Western data, collateral is negatively related to leverage in the case of these
transition countries. They offer two explanations for this: first, that pre transition firms
financed their fixed assets with equity and therefore the relationship to debt is negative;
second, that the book value of fixed assets might differ from the market values. The
authors thus report that Eastern European companies behave differently from Western
European companies.
Hussain and Nivorozhkin (1997) examines the capital structure of listed companies in
Poland during the early years of the establishment of the Warsaw Stock Exchange (1991
1994). As the same as Cornelli, Portes, and Schaffer (1996), they also find a extremely

� ���
low leverage level of listed companies in Poland. Besides, they find that shareholder
concentration, where banks, investment companies and the state are dominant
shareholders, has a neutral of even a beneficial influence on leverage of listed companies.
Moreover, they find that leverage level of large, newly established, foreign owned
companies and companies with strong cash positions tend to be higher.
Nivorozhkin (2002) investigates the determinants of the capital structure of companies
listed on the Budapest Stock Exchange by using data of 1992 1995 period, and confirms
the very low leverage ratios of Hungarian listed companies. He also finds a negative
relationship between leverage and collateral, and he explains this cause by the lack of
long term debt financing. Besides, he finds that manufacturing companies and companies
with the state among their major shareholders have higher levels of debt financing
relative to other companies.
Bauer (2004) analyzed listed companies in the Czech Republic and concluded that the
determinants of their asset structures could be explained by using the economic factors of
advanced countries, as applied to the G7 industrialized countries.
Delcoure (2007) analyzed listed companies in the Czech Republic, Poland, Russia, and
Slovakia to show that their financing structures can be explained by using the modified
pecking order trade off theory, with priority placed on internal reserves, the issuance of
common stock, bank loans, and the issuance of corporate bonds, in that order.
Studies on Asian corporate finance have focused on China. Chen (2004) analyzed the
determinants of the financing structures of Chinese listed companies, showing that the
pecking order theory was applicable to them, with priority placed on internal reserve
funds, the issuance of common stocks, and long term debt, in that order.
Huang and Song (2006) showed that the determinants of corporate funding in advanced
and developing countries were equally applicable to listed companies in China, while
also finding that government ownership did not affect corporate financing structures in
China and that the tax system could have a strong impact on the long term debt of
Chinese companies.
3.3�Impacts of capital structure on the investment decisions
3.3.1� Theory
� ���
The impact of leverage on the investment decisions and growth opportunities of a
company is a central issue in corporate finance. Modigliani and Miller (1958) argue that
in a complete market, leverage is irrelevant to the investment decision and value of a
company. However, in a world with an incomplete market and a significant agency
problem, leverage may affect the investment decisions of a company.
Underinvestment problem: Myers (1977) discusses how firms with large debts are
discouraged from investing in opportunities with positive net present value (NPV) when
there are conflicts between shareholders, managers, and creditors, because the benefits
from investment may partially or fully accrue to the debt holders; this gives rise to an
underinvestment problem (i.e., a debt overhang problem). Reducing debt ratio may
facilitate such underinvestment problem, which suggests a negative relationship between
leverage and investment.
Overinvestment problem: Jensen (1986) argues that when conflicts between managers
and shareholders exist, managers are encouraged to undertake even negative NPV
investments to enlarge the scale of the firm, which leads to an overinvestment problem.
Constraining the availability of free cash flow, including increasing debt financing, may
constrain managers’ ability to undertake such policies, which also suggests a negative
relationship between leverage and investment.
3.3.2� Empirical analysis
There are many empirical studies considering the relevance of leverage on investment
of firms for developed economies but still few for transitional economies (Table 3.3).
Firth et al. (2008) used a sample of 1203 firms listed on the Shanghai Stock Exchange or
the Shenzen Stock Exchange between 1991 and 2004 to investigate the relationship
between leverage and investment of listed firms in China, a state owned bank lending
environment. Their empirical analysis suggested that there is a negative relationship
between leverage and investment among listed firms in China and that this negative
relationship is weaker in firms with high growth opportunities and good operating
performance. They also argue that in such a transitional economy characterized by its
nascent stock market, the absence of public debt markets, and the Chinese economy’s
reliance on bank borrowing, the negative relationship between leverage and investment is
� ���
weaker in firms with higher levels of state shareholding than in firms with lower levels of
state shareholding. They concluded that the state owned banks in China impose fewer
restrictions on the capital expenditures of low growth and poorly performing firms, as
well as on firms with greater state ownership. This creates an overinvestment bias in
these firms.
3.4�Impact of capital structure on profitability
3.4.1� Theory
Regarding debt ratios’ impact on profitability, the operation of information asymmetry
presents two possibilities (Myer, 1977).
The first possibility relates to the mornitoring of the creditors and the corporate
governance of the company. If the creditors’ monitoring towards a company’s business
operations is sufficiently good, an increase in debt will inhibit wasteful investment and
improve corporate profitability. In this case, the relation between leverage and the return
on assets (ROA) is positive. However, if neither the creditors’ monitoring nor the
corporate governance of the borrowing company is good, the company may use loans
ineffectively. In this case, an increase in debt may worsen the profitability of the
company, causing a negative relation between leverage and ROA.
The second possibility relates to excessive debt problem. Even if an investment project
to enhance a company’s discounted present value is ongoing, the company may not
execute an investment for fear that procuring funds through debts will send investment
profits to creditors, thus reducing corporate value. If such an excessive debt problem
occurs, reducing the debt ratio is expected to promote investments, thereby increasing
corporate profits, which leads to a negative relation between leverage and ROA.
3.4.2� Empirical analysis
There are few studies on the relationship between leverage and firms’ performance
using data sets of transitional countries (Table 3.5). Ebaid, I. E. (2009) uses a data set of
non financial Egyptian listed firms from 1997 to 2005 to investigate the effect of capital
structure on various measures of firm performance and finds that capital structure has a
weak to no impact on firm's performance.

� ���
3.5�Relation of capital structure, investment and growth opportunities
3.5.1� Theory
There are four possibilities of the relation of capital structure, investment and growth
opportunities of a company.
Underinvestment problem: In a world where the market is incomplete, information is
asymmetric, and agency costs exist, capital structure may induce an underinvestment or
over investment problem. Myers (1977) discusses how conflicts between shareholders,
managers, and creditors discourage firms with large debts from investing in opportunities
with positive NPV, because the benefits from investment may partially or fully accrue to
the debt holders; this creates an under investment problem (i.e., a debt overhang
problem). In this case, reducing the debt ratio may encourage firms to invest more, and
thus, increase the value of the firms. Therefore, if debt financing facilitates
underinvestment (i.e., a debt overhang problem), then the relationship between leverage
and investment is negative, and the relationship between the debt ratio and a firm’s
growth opportunities is negative.
Overinvestment problem: Jensen (1986) argues that when conflicts between managers
and shareholders exist, managers are encouraged to undertake even negative NPV
investments to enlarge the scale of the firm. Constraining the availability of free cash
flow, including the increase of debt financing, may constrain the managers’ ability to
undertake such policies, and thus, improve the value of firms. Thus, if debt financing
restrains overinvestment, then the relationship between leverage and investment is
negative, and the relationship between debt ratio and the firm’s growth opportunities is
positive.
Financial constraints problem: In order to finance their investment projects,
companies can use either internal funds (e.g., retained earnings) or external funds (e.g.,
debt and issuance of new shares). The financial constraints problem arises when the
company faces a shortage of funding sources to finance their investment projects. In this
case, increasing debt may provide a company more chances to invest and more
opportunities for growth. Thus, both of the relationships between the debt ratio and
investment, as well as the relationship between debt ratio and growth opportunities,
� ���
become positive.
Soft budget constraints problem: The term “soft budget constraint” was introduced by
Kornai (1979, 1980). He argues that although state owned firms were vested with a moral
and financial interest in maximizing their profits, the chronic loss makers among them
were not allowed to fail. They were always bailed out with financial subsidies or other
instruments, and hence, these firms could survive even after chronic losses. For example,
some sort of constraint on liquidity, solvency, or debt may set the upper limit on the
sustainability of the financial deficit of state owned firms. A soft budget constraint is
suggested to be especially pervasive in socialist economies, particularly in those
economies intent on “reform.”
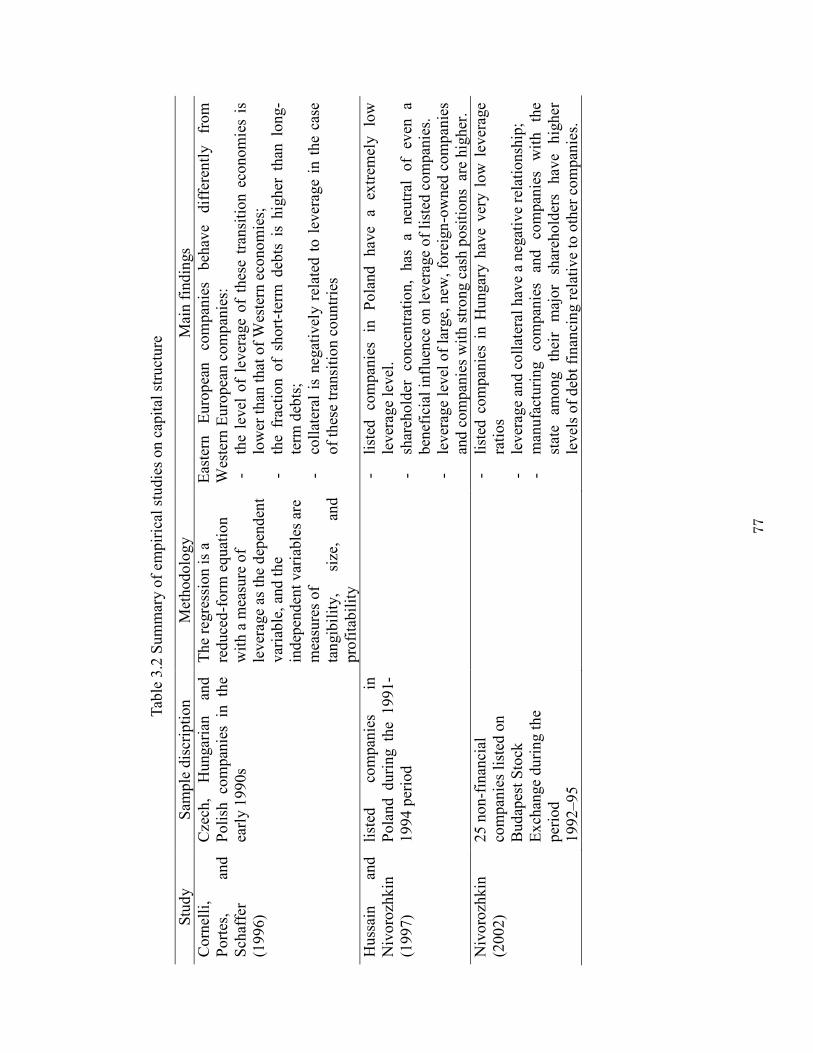
����
Tab
le 3
.2 S
um
mar
y o
f em
pir
ical
stu
die
s on c
apit
al s
truct
ure
Stu
dy
Sam
ple
dis
crip
tion
Met
hodolo
gy
Mai
n f
indin
gs
Corn
elli
, P
ort
es,
and
Sch
affe
r (1
996)
Cze
ch,
Hungar
ian
and
Poli
sh
com
pan
ies
in
the
earl
y 1
990s
The
regre
ssio
n i
s a
reduce
d f
orm
equat
ion
wit
h a
mea
sure
of
lever
age
as t
he
dep
enden
t var
iable
, an
d t
he
indep
enden
t var
iable
s ar
e m
easu
res
of
tangib
ilit
y,
size
, an
d
pro
fita
bil
ity
Eas
tern
E
uro
pea
n
com
pan
ies
beh
ave
dif
fere
ntl
y
from
W
este
rn E
uro
pea
n c
om
pan
ies:
�
the
level
of
lever
age
of
thes
e tr
ansi
tion e
conom
ies
is
low
er t
han
that
of
Wes
tern
eco
nom
ies;
�
the
frac
tion o
f sh
ort
ter
m d
ebts
is
hig
her
than
long
term
deb
ts;
�
coll
ater
al i
s neg
ativ
ely r
elat
ed t
o l
ever
age
in t
he
case
of
thes
e tr
ansi
tion c
ountr
ies
Huss
ain
and
N
ivoro
zhkin
(1
997)
list
ed
com
pan
ies
in
Pola
nd duri
ng th
e 1991
1994 p
erio
d
�
list
ed
com
pan
ies
in
Po
land
hav
e a
extr
emel
y
low
le
ver
age
level
.
�sh
areh
old
er
conce
ntr
atio
n,
has
a
neu
tral
of
even
a
ben
efic
ial
infl
uen
ce o
n l
ever
age
of
list
ed c
om
pan
ies.
�
lever
age
level
of
larg
e, n
ew,
fore
ign
ow
ned
com
pan
ies
and c
om
pan
ies
wit
h s
tro
ng c
ash p
osi
tions
are
hig
her
.
Niv
oro
zhkin
(2
002)
25 n
on f
inan
cial
co
mpan
ies
list
ed o
n
Budap
est
Sto
ck
Ex
chan
ge
du
ring t
he
per
iod
1992–95
�
list
ed c
om
pan
ies
in H
ungar
y h
ave
ver
y l
ow
lev
erag
e ra
tios
�
lever
age
and c
oll
ater
al h
ave
a n
egat
ive
rela
tionsh
ip;
�
man
ufa
cturi
ng
com
pan
ies
and
co
mpan
ies
wit
h
the
stat
e am
ong
thei
r m
ajor
shar
ehold
ers
hav
e h
igher
le
vel
s of
deb
t fi
nan
cing r
elat
ive
to o
ther
com
pan
ies.

���
Tab
le 3
.2 (
conti
nue)
Stu
dy
Sam
ple
dis
crip
tion
Met
hodolo
gy
Mai
n f
indin
gs
Bau
er (
2004)
list
ed
com
pan
ies
of
the
Cze
ch R
epubli
c
det
erm
inan
ts o
f th
eir
capit
al s
truct
ure
s co
uld
be
expla
ined
b
y u
sin
g t
he
econom
ic f
acto
rs o
f ad
van
ced c
ountr
ies
Del
coure
(2
007)
list
ed
com
pan
ies
in
the
Cze
ch R
epubli
c, P
ola
nd,
Russ
ia, an
d S
lovak
ia
fi
nan
cin
g
stru
cture
s ca
n
be
expla
ined
b
y
usi
ng
the
modif
ied
pec
kin
g o
rder
tr
ade
off
th
eory
, w
ith
pri
ori
ty
pla
ced o
n i
nte
rnal
res
erv
es,
the
issu
ance
of
com
mon s
tock
, ban
k l
oan
s, a
nd t
he
issu
ance
of
corp
ora
te b
onds.
Chen
(2004)
Chin
ese
list
ed c
om
pan
ies
pec
kin
g o
rder
theo
ry w
as a
ppli
cable
to t
hee
se c
om
pan
ies,
w
ith p
riori
ty p
lace
d o
n i
nte
rnal
res
erv
e fu
nds,
the
issu
ance
of
com
mon s
tock
s, a
nd l
ong t
erm
deb
t.
Huan
g
and
S
ong (
2006)
Chin
ese
list
ed c
om
pan
ies
�
det
erm
inan
ts
of
corp
ora
te
fundin
g
in
advan
ced
an
d
dev
elopin
g c
ountr
ies
wer
e eq
ual
ly a
ppli
cable
to l
iste
d
com
pan
ies
in C
hin
a,
�gover
nm
ent
ow
ner
ship
did
not
affe
ct
corp
ora
te
finan
cin
g s
truct
ure
s in
Chin
a �
tax
syst
em c
ould
hav
e a
stro
ng i
mpac
t on t
he
long
term
deb
t of
Chin
ese
com
pan
ies.

���
Tab
le 3
.3 S
um
mar
y o
f em
pir
ical
stu
die
s on t
he
impac
ts o
f ca
pit
al s
tru
cture
on i
nves
tmen
t
Stu
dy
Sam
ple
dis
crip
tion
Met
hodolo
gy
Mai
n f
indin
gs
Fir
th (
2008)
1203 f
irm
s li
sted
on t
he
Shan
ghai
S
tock
E
xch
ange
or
the
Shen
zen
Sto
ck E
xch
ange
bet
wee
n
1991 a
nd 2
004
�
ther
e is
a n
egat
ive
rela
tionsh
ip b
etw
een l
ever
age
and
inves
tmen
t am
ong l
iste
d f
irm
s in
Chin
a �
this
neg
ativ
e re
lati
onsh
ip i
s w
eak
er i
n f
irm
s w
ith h
igh
gro
wth
opport
unit
ies
and g
ood o
per
atin
g p
erfo
rman
ce.
�neg
ativ
e re
lati
onsh
ip b
etw
een l
ever
age
and i
nves
tmen
t is
w
eak
er
in
firm
s w
ith
hig
her
le
vel
s of
stat
e sh
areh
old
ing t
han
in f
irm
s w
ith l
ow
er l
evel
s of
stat
e sh
areh
old
ing.
�st
ate
ow
ned
ban
ks
in C
hin
a im
pose
few
er r
estr
icti
ons
on t
he
capit
al e
xpen
dit
ure
s of
low
gro
wth
and p
oorl
y
per
form
ing f
irm
s, a
s w
ell
as o
n f
irm
s w
ith g
reat
er s
tate
ow
ner
ship
. T
his
cr
eate
s an
over
inves
tmen
t bia
s in
th
ese
firm
s.
Tab
le 3
.4 S
um
mar
y o
f em
pir
ical
stu
die
s on t
he
impac
ts o
f ca
pit
al s
tru
cture
on p
erfo
rman
ce
Stu
dy
Sam
ple
dis
crip
tion
Met
hodolo
gy
Mai
n f
indin
gs
Ebai
d,
I.
E.
(2009)
non f
inan
cial
E
gypti
an
list
ed f
irm
s fr
om
1997 t
o
2005
D
epen
den
t var
iable
s:
RO
E,
RO
A,
gro
ss pro
fit
mar
gin
Est
imat
ion
met
hod:
Mult
iple
re
gre
ssio
n
anal
ysi
s
Cap
ital
st
ruct
ure
has
a
wea
k t
o n
o
impac
t on
firm
's
per
form
ance
.

� ��
3.6�Empirical analyses on capital structure of companies in Vietnam under the Doi moi
Vietnam started the economic reform since 1986 under the Doi moi policy. Since then,
the state owned companies have been equitized, the stock exchanges have been
established, foreign investors have been encouraged, banking sector has been reformed,
etc. Only a few emperical analyses have been conducted on corporate finance of Vietnam.
Nguyen (ibid.), a pioneering researcher in this field, used data on 558 SMEs (with 300
employees or fewer and capital of 10 billion Dong or less) covering the period from 1998
to 2001, to estimate the determinants of corporate debt ratios, short term debt ratios, and
short term debt ratios (excluding bank loans). He found that government owned
companies had higher debt ratios than other companies. He also found that there was a
positve correlation between the size of a company, as well as its growth rate and
management risk on the one hand and its debt ratio on the other, whereas there was a
negative correlation between fixed assets and debt ratio. Further, he discovered that
corporate profitability did not influence the debt ratio, and that corporate owners’
stronger ties with banks and networks facilitated the procurement of funds.
Biger et al. (ibid.) used a corporate survey on 3,778 companies with ten employees or
more collected by the General Statistics Office of Vietnam in 2002 and 2003 to analyze
corporate fund procurement structures. The authors found that the long term debt ratios
of Vietnamese companies were low and their long term investments were small, that their
debt ratios were positively correlated with business size, growth opportunities, and the
owners’ corporate occupancy ratios but negatively correlated with profitability rates,
depreciation amortization ratios, fixed assets, and corporate tax rates.
Vo (2013), Vu (2013) and Do (2014) investigated the impacts of capital structure on
performance of listed firms in Vietnam. Vo (2013) conducted questionaires of 790 state
owned companies and privatized state owned companies which are located in Ho Chi
Minh city and used Ordinary Least Square method to estimate the profitablity of these
companies. They used productivity, sales, profits, ROA, ROE as the proxies for firms’
performance. Their empirical results revealed that only organizationalintegration
significantly affects the performance of privatized firms. Besides, employee and customer
satisfactions are among the most important drivers of corporate performance. Moreover,
� ��
privatized firms with less state ownership perform better than those with more state
ownership. In particular, privatized firms with a state ownership proportion less than 30
per cent perform better than privatized firms with the proportion ranging from 30 to 50
per cent.
Vu (2013) used a data base of 465 non financial companies on HOSE and HASE for
the period of 2007 2010 to investigate the relationship between capital structure and
profitability by fix effect method. The emperical results suggest that the more number of
bank relationships firms increase, the more firm performance decrease. Besiges, if a firm
establishes strongly short term credit financing relationship with banks, the firm’s
performance reduces. On the contrary, if a firm has strongly long term credit financing
relationship with banks, its performance increases. Moreovere, the effectiveness of using
total assets is worse as a firm has strongly overall credit financing relationship with
banks.Asset tangibility structure has negative relationship with firm’s ROE, while assets
have negative association with ROA. Turnover has positive association with firm
performance. Firms with higher state shares (more than 35 per cent state ownership) have
less effective.
Do (2014) used a data base of 134 non financial companies of HOSE for the period of
2009 2012 to investigate the effect of capital structure on firs’ performance by random
effect method. The emperical analysis reveals that capital structure has a negative impact
with statistical significance on financial performance. Besides, the higher level of state
ownership in ownership structure of a firm is, the better financial performance it has.
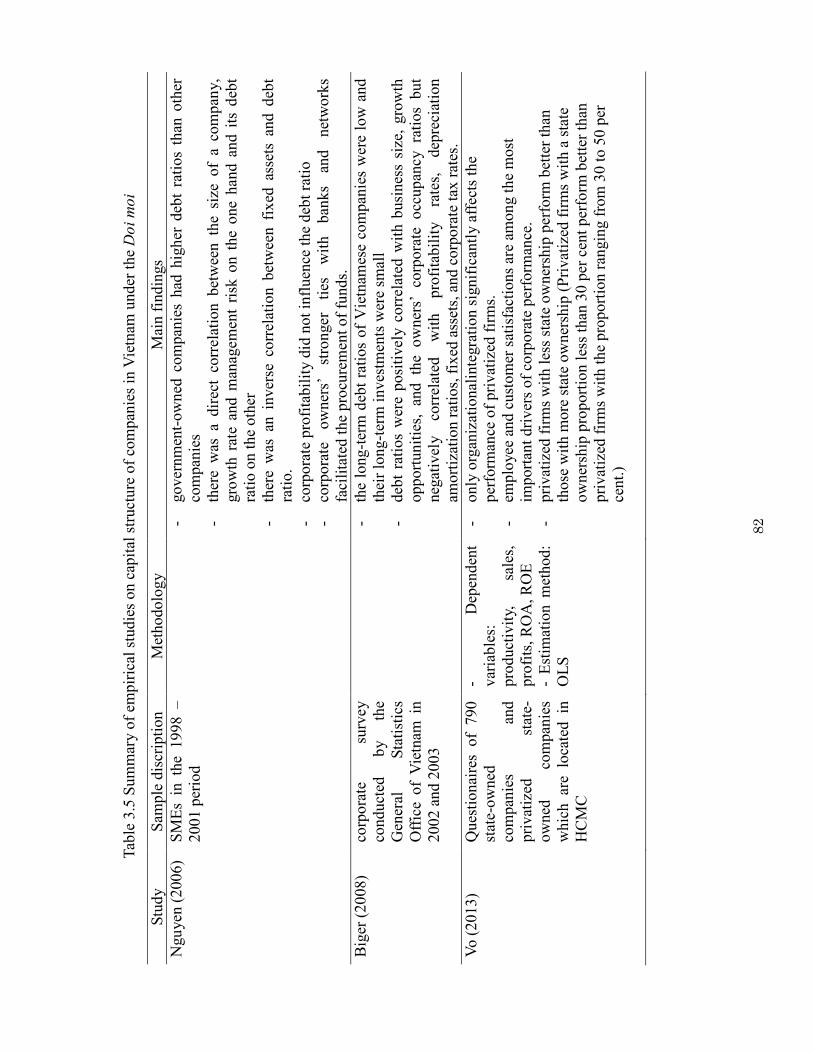
���
Tab
le 3
.5 S
um
mar
y o
f em
pir
ical
stu
die
s on c
apit
al s
truct
ure
of
com
pan
ies
in V
ietn
am u
nder
the
Do
i m
oi
Stu
dy
Sam
ple
dis
crip
tion
Met
hodolo
gy
Mai
n f
indin
gs
Ngu
yen
(2006)
SM
Es
in th
e 1998 –
2001 p
erio
d
�
gover
nm
ent
ow
ned
com
pan
ies
had
hig
her
deb
t ra
tios
than
oth
er
com
pan
ies
�th
ere
was
a
dir
ect
corr
elat
ion b
etw
een
the
size
of
a co
mp
any,
gro
wth
rat
e an
d m
anag
emen
t ri
sk o
n t
he
one
han
d a
nd i
ts d
ebt
rati
o o
n t
he
oth
er
�th
ere
was
an i
nver
se c
orr
elat
ion b
etw
een f
ixed
ass
ets
and d
ebt
rati
o.
�co
rpora
te p
rofi
tabil
ity d
id n
ot
infl
uen
ce t
he
deb
t ra
tio
�co
rpora
te
ow
ner
s’
stro
nger
ti
es
wit
h
ban
ks
and
net
work
s fa
cili
tate
d t
he
pro
cure
men
t of
funds.
Big
er (
20
08)
corp
ora
te
surv
ey
conduct
ed
by
the
Gen
eral
S
tati
stic
s O
ffic
e of
Vie
tnam
in
2002 a
nd 2
003
�
the
long t
erm
deb
t ra
tios
of
Vie
tnam
ese
com
pan
ies
wer
e lo
w a
nd
thei
r lo
ng t
erm
inves
tmen
ts w
ere
smal
l
�deb
t ra
tios
wer
e posi
tivel
y c
orr
elat
ed w
ith b
usi
nes
s si
ze,
gro
wth
opport
unit
ies,
an
d
the
ow
ner
s’
corp
ora
te
occ
up
ancy
ra
tios
but
neg
ativ
ely
corr
elat
ed
wit
h
pro
fita
bil
ity
rate
s,
dep
reci
atio
n
amort
izat
ion r
atio
s, f
ixed
ass
ets,
and c
orp
ora
te t
ax r
ates
.
Vo (
2013)
Ques
tionai
res
of
790
st
ate
ow
ned
co
mpan
ies
and
pri
vat
ized
st
ate
ow
ned
co
mpan
ies
whic
h
are
loca
ted
in
HC
MC
D
epen
den
t var
iable
s:
pro
duct
ivit
y,
sale
s,
pro
fits
, R
OA
, R
OE
Est
imat
ion m
ethod:
OL
S
�only
org
aniz
atio
nal
inte
gra
tion s
ignif
ican
tly a
ffec
ts t
he
per
form
ance
of
pri
vat
ized
fir
ms.
�
emplo
yee
and c
ust
om
er s
atis
fact
ions
are
amon
g t
he
most
im
port
ant
dri
ver
s of
corp
ora
te p
erfo
rman
ce.
�pri
vat
ized
fir
ms
wit
h l
ess
stat
e ow
ner
ship
per
form
bet
ter
than
th
ose
wit
h m
ore
sta
te o
wner
ship
(P
rivat
ized
fir
ms
wit
h a
sta
te
ow
ner
ship
pro
port
ion l
ess
than
30 p
er c
ent
per
form
bet
ter
than
pri
vat
ized
fir
ms
wit
h t
he
pro
port
ion r
angin
g f
rom
30 t
o 5
0 p
er
cent.
)
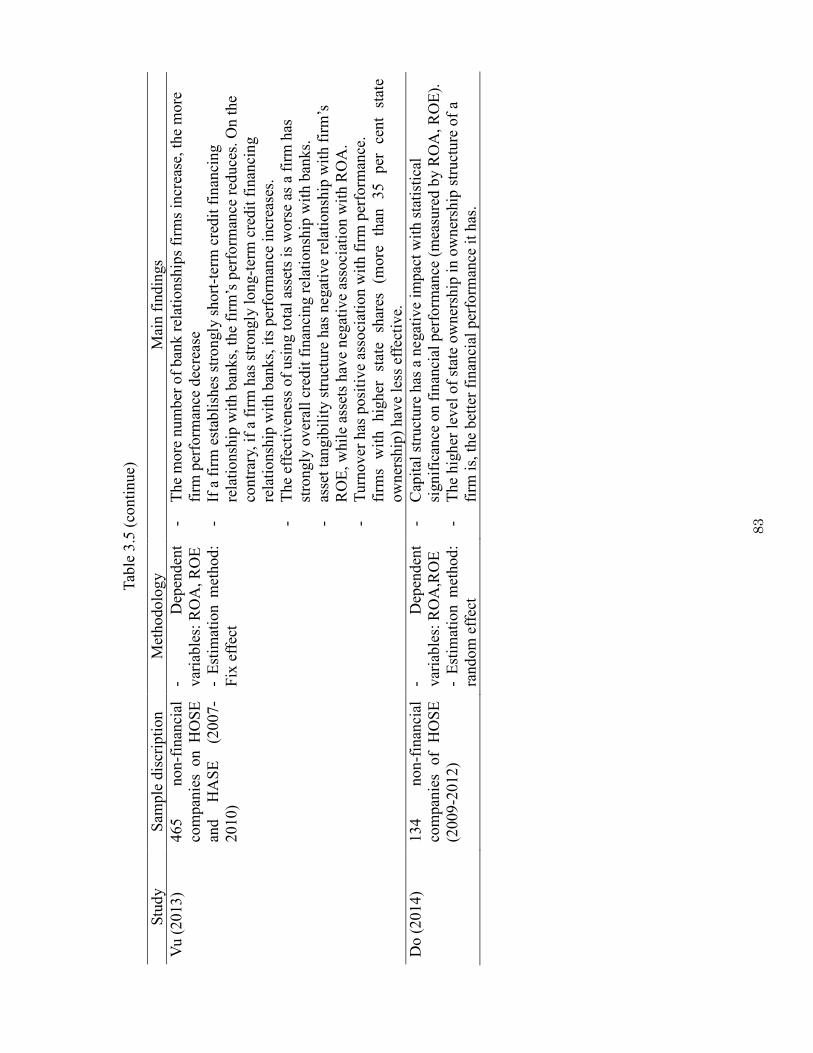
���
Tab
le 3
.5 (
conti
nue)
Stu
dy
Sam
ple
dis
crip
tion
Met
hodolo
gy
Mai
n f
indin
gs
Vu (
2013)
465
non f
inan
cial
co
mpan
ies
on H
OS
E
and
HA
SE
(2
007
2010)
D
epen
den
t var
iable
s: R
OA
, R
OE
Est
imat
ion m
ethod:
Fix
eff
ect
�T
he
more
num
ber
of
ban
k r
elat
ionsh
ips
firm
s in
crea
se, th
e m
ore
fi
rm p
erfo
rman
ce d
ecre
ase
�If
a f
irm
est
abli
shes
str
ongly
short
ter
m c
redit
fin
anci
ng
rela
tionsh
ip w
ith b
anks,
the
firm
’s p
erfo
rman
ce r
educe
s. O
n t
he
contr
ary,
if
a fi
rm h
as s
trongly
lon
g t
erm
cre
dit
fin
anci
ng
rela
tionsh
ip w
ith b
anks,
its
per
form
ance
incr
ease
s.
�T
he
effe
ctiv
enes
s of
usi
ng t
ota
l as
sets
is
wors
e as
a f
irm
has
st
rongly
over
all
cred
it f
inan
cin
g r
elat
ionsh
ip w
ith b
anks.
�
asse
t ta
ngib
ilit
y s
truct
ure
has
neg
ativ
e re
lati
onsh
ip w
ith f
irm
’s
RO
E, w
hil
e as
sets
hav
e n
egat
ive
asso
ciat
ion w
ith R
OA
.
�T
urn
over
has
posi
tive
asso
ciat
ion w
ith f
irm
per
form
ance
.
firm
s w
ith
hig
her
st
ate
shar
es
(more
th
an
35
per
ce
nt
stat
e ow
ner
ship
) hav
e le
ss e
ffec
tive.
Do (
2014)
134
non f
inan
cial
co
mpan
ies
of
HO
SE
(2
009 2
012)
D
epen
den
t var
iable
s: R
OA
,RO
E
E
stim
atio
n m
ethod:
random
eff
ect
�C
apit
al s
truct
ure
has
a n
egat
ive
impac
t w
ith s
tati
stic
al
signif
ican
ce o
n f
inan
cial
per
form
ance
(m
easu
red b
y R
OA
, R
OE
).
�T
he
hig
her
lev
el o
f st
ate
ow
ner
ship
in o
wner
ship
str
uct
ure
of
a fi
rm i
s, t
he
bet
ter
finan
cial
per
form
ance
it
has
.

� ��
3.7 Hypotheses on corporate finance of listed companies in Vietnam
This section states hypotheses on the capital structure, investment, profitability and
growth opportunity of listed companies in Vietnam, based on the modern corporate
finance theories which are introduced in the previous sections and based on the
environment of economic reform and corporate reform of Vietnam as well as the
characteristics of the ownership, corporate finance, corporate governance of the listed
companies in Vietnam which were explained in Chapter 1 and 2.
3.7.1 Hypotheses on general
(a) Hypotheses on capital struture
� Factors associated with trade off theory
Corporate tax: According to the adjusted MM theory, when a company’s corporate tax
is higher, the company should raise funds by debts such as bank borrowing or bonds
rather than equities in order to avoid the payment of an amount of corporation tax which
allows it to raise the company value by that amount. Vietnam extends preferential
corporate tax treatment to companies that were listed before 2007 and stipulates
additional preferential treatment in the Corporation Tax Law of 2003. 17 Thus, the
corporate tax may be different among listed companies. The higher the corporate tax of
the company is, the higher its debt ratio is.
Non debt tax shields: When the corporate tax is high, company can also save tax
payment by using a non debt tax savings shield, such as depreciation. This effect is
opposite with the effect of saving taxes by using debt. The larger the shield is, the less
necessary to save tax through debt, thus reducing the debt ratio. Companies with large
tax saving effects are expected to have their debt ratios lowered.
Bankruptcy risk: The larger a company is and the smaller its risk of bankruptcy
because of the diversification of its business as well as the reductions of exogenous
shocks, thus the higher its debt ratio would be.
� Factors associated with agency costs
���������������������������������������������������17 See Table 4.7 in Appendix of chapter 4 for detail.
� ��
In Vietnam, ownership concentration is high even in listed companies, which makes
hostile takeovers rare. On the other hand, the rights of small shareholders are
inadequately protected, and the disclosure of corporate information is not thorough.
Under these circumstances, an agency problem is deemed to occur among the
shareholders and external creditors of the listed companies in Vietnam.
Profitability: When an agency problem between large shareholders and external
creditors is serious, the risk premium for the procurement of external debt funds will be
larger, and the agency cost of procuring debt funds will be higher. Therefore, it is
expected that companies with abundant internal funds will tend to maintain lower debt
ratios to avoid dependence on debt.
Tangibility: The agency cost of procuring debt funds can be reduced by providing
collateral to creditors. Thus, companies that can provide more collateral can reduce the
agency cost of procuring debt funds and can expect their corporate debt ratios to be
higher.
(b) Hypotheses on the impacts of capital struture on investment
Overinvestment problem: In Vietnam, in the boom period (2006 2008), companies
borrowed and invested much because every investment seemed to be profitable (World
Bank, 2009), while banks also lent easily. Such easy lending and borrowing may cause
overinvestment problem among listed companies.
Underinvestment: In the period after the boom, banks were more cautious in lending
and started recovering debts, while companies had to pay both interest and principle of
the debts borrowed in the previous period but found it difficult in borrowing more to
invest more. The underinvestment problem may be occur.
(c) Hypotheses on the impacts of capital struture on profitability
In the boom period (2006 2008) of Vietnamese economy, companies borrowed and
invested much because every investment seemed to be profitable (World Bank, 2009),
while banks also lent easily. Such easy lending and borrowing without strict monitoring
caused companies to invest wastefully and decreased their profitability. Besides, the
corporate governance of listed companies in Vietnam is not good, thus affects the
� ��
performance of the companies (IFC, 2012).
(d) Hypotheses on the relation of capital struture, investment and growth opportunities
Listed companies in Vietnam may be cope with problem of underinvestment or
overinvestment as discussed in section 3.7.1(b). If debt financing facilitates
underinvestment, the relationship between leverage and investment is negative, and the
relationship between the debt ratio and a firm’s growth opportunities is negative. If debt
financing restrains overinvestment, then the relationship between leverage and
investment is negative, and the relationship between debt ratio and the firm’s growth
opportunities is positive.
Vietnam is a transitional economy, and thus, the soft budget constraint problem may
be observed among firms in Vietnam. If firms are in a soft budget constraint problem, the
relationship between the debt ratio and investment is positive, whereas the relationship
between the debt ratio and a firm’s growth opportunities is negative.
3.7.2 Hypotheses on state ownership
(a) Hypotheses of the impact of state ownership on Capital struture
Many of the listed companies in Vietnam remain state controlled, with a state
ownership ratio of more than 50 per cent, and have different fund procurement structures
from other companies.
� State controlled companies may have weaker incentives to adjust their debt ratios to
attain tax savings because, unlike non state investors, the state can earn tax revenues
from companies as income, and thus the corporate value evaluated by the state (i.e., the
discounted present value of future corporate income) does not change, regardless of
whether there is corporate tax. 18 Therefore, compared with non state controlled
companies, state controlled companies probably have less influence on tax savings and
non debt tax saving effects. In addition, state controlled companies are the government’s
source of revenue, and avoiding taxes is difficult for such companies. On the other hand,
non state controlled companies have a strong incentive to avoid taxes; a delay in
���������������������������������������������������18 If a company is 100% government owned, corporate tax has no effect on corporate value.
� ��
corporate information disclosure, which deprives the state of the ability to collect taxes,
may lead to tax evasion. When taxes are easily evaded, the non debt tax saving effect
will be smaller for non state controlled companies.
� State controlled companies may have higher debt ratios than those of other
companies because they have lower bankruptcy risk due to implicitly guarantees of the
state.
� State controlled companies may have higher debt ratios than those of other
companies because of their easier access to state owned bank loans, regardless of their
collateral due to their closer relationships with state owned banks than other companies.
In fact, the loans made by Vietnam’s four major state owned banks accounted for about
80 per cent of all bank loans, the majority of which was supplied to state owned
companies (Nguyen, 2006). Therefore, the effect of the collateral magnitude on their debt
ratios should be smaller than that on the ratios of the other companies.
(b) Hypotheses of the impact of state ownership on investment
� State controlled companies are under the strong influence of the government and in
some cases function as tools for implementing government policies. Therefore, state
controlled companies are expected to be more active in investing than companies that are
not state controlled.
� On the other hand, since state owned companies are under the strong influence of the
government, they are less profit oriented than private companies. Therefore, state
controlled companies are likely to make less use of good investment opportunities and to
be inactive in investing.
� State controlled companies seem to access bank loans more easily than other
companies because they implement policy projects of the government and state owned
commercial banks are forced to lend to them with priority and preference. Therefore,
state owned commercial banks may not be normal external creditors of state controlled
companies, and their monitoring activities may be less stringent toward state controlled
companies.
(c) Hypotheses of the impact of state ownership on profitability
� �
� State controlled companies have both low management risk and close relationships
with state owned banks; hence, they may enjoy fund mobilization advantages and higher
profitability.
� On the other hand, state controlled companies are less independent from the state in
terms of business management; this leads to the risk of lower profitability because of
state exploitation.
(d) Hypotheses of the impact of state ownership on the relation of capital structure,
investment and growth opportunities
The soft budget constraint problem may be observed among firms in a transitional
economy such as Vietnam. I assume that this problem may be more severe in state
controlled companies than in other companies, because this problem is considered a
characteristic of a socialist economy.
3.7.3 Hypotheses on foreign ownership
� Companies upon which foreign investors with funding abilities and wide investment
experience exert influences are required to disclose more extensive corporate information,
and their business operations are more strictly monitored. This reduces information
asymmetry, which, in turn, is expected to facilitate the procurement of funds through the
issuance of corporate shares, and help the company to invest more.
� Foreign ownership in listed companies has some potential gains in improving the
corporate governance and performance of listed firms through the importation of foreign
management, technology, and business capacities (World Bank, 2006). Thus the
profitability and growth opportunities of foreign affiliated companies is expected to be
higher than that of other companies.
3.8 Models, empirical methods and data set
In order to investigate the characteristics of capital structrure and its impacts on
investment behavior, profitability and growth opportunities of listed companies in
Vietnam, I use 3 models: (1) Capital structure and investment; (2) Capital structure and
profitability; (3) Capital structure, growth opportunities and investment. I use 4 equations

� �
of capital structure, investment, profitability and growth opportunities for these 3 models.
Because there are many common terms among these models, I will not describe the 3
models separately along with their estimation as often done in other academic papers, but
I will explain the 4 equations and the estimation methods of the 3 models in this section
of chapter 3. In chapter 4, 5,6, I only explain the estimation results of the 3 models,
respectively.
Below is the description of 4 estimation equations (1) capital structure, (2) investment,
(3) profitability and (4) growth opportunity as well as the estimation methods that will be
used to conduct empirical anlysis in the following chapters to check the hypotheses stated
in the previous section. The variables and their caculation or proxies as well as their
predicted signs will be explained in detail.
3.8.1 Estimation of capital structure of listed companies in Vietnam
(a) Estimation equation
CSit = αcs + Σβj Xjit + δcsSTATE + Σγj STATE* Xjit + ∂csFOR + εit (1)
CSit is the explained variables
Xjit is the explanatory variables, j = 1, 2, 3, 4
STATE is the state controlled company dummy variable.
FOR is the foreign affiliated company dummy variable.
αCS is a constant
βj are coefficients of the explanatory variables, j = 1, 2, 3, 4
δcs is coefficient of STATE
γj are coefficients of the crossterms of STATE and explanatory variables, j = 1, 2, 3, 4
∂cs is coefficient of FOR
εit is the matrix of the error terms
i denotes the individual company
t denotes time.
This equation will appear in the estimation of all 3 models, which will be conducted in
chapter 4, 5, 6. There are some minor differences in the equation used in each model.
� ��
(b) Variables and predicted signs
� Explained variables
I use 3 debt ratios, debt ratio (DR), long term debt ratio (LDR) and long term bank
loan ratio (LBR), as explained variables to investigate the capital structure of listed
companies in Vietnam.
Debt ratio (DR), which is caculated by dividing the amount of total debts by the
amount of total assets, is the most basic index of capital structure. It indicates the
percentage of a company’s debt over its total assets. Because that the effects of saving tax
payments and bankruptcy risk on capital structure relates to the whole debt, using the
debt ratio is considered appropriate for observing the influences of these factors on
fundraising structure.
Long term debt ratio (LDR), which is caculated by dividing the total amount of long
term debt (for which the maturity period exceeds one year) by the total amount of assets,
is another index of capital structure. Long term debts are often used for long term
investments like equipment, and the information asymmetry between the company and
the creditors of long term debt is larger than the case of short term debt. Thus the impact
of the agency cost caused by that information asymmetry on the capital structure is
stronger for long term than for short term debt.
Banks are considered to have an information production function as well as creditor
protection and debt collection capacities. Therefore, I considered bank loans with a
maturity of more than one year as long term debt, calculated the ratio of long term bank
loans to total assets, and used this long term bank loan ratio (LBR) as a dependent
variable.
� Explanatory variables
The explanatory variables include economic variables such as corporate tax rate (TAX),
non debt tax shields (NDTS), business scale (SIZE) which are based on the adjusted MM
theory (trade off theory), and fixed assets ratio (TANG), operating income ratio (ROA)
which are based on the agency cost approach; variables representing the characteristics of
Vietnamese companies such as state controlled company dummy variable (STATE),
� ��
foreign affiliated companies dummy variable (FOR), the Ho Chi Minh Securities
Exchange listed company dummy variable (HOSE), and other control variables such as
year dummy variables, industry dummy variables.
The effective tax rate (TAX) is calculated by the ratio of the amount of corporation tax
payment to the amount of operating income.19 This variable is used to investigate the tax
savings effect by using debt of listed companies in Vietnam. The predicted sign of TAX is
positive as explained in section 3.7.1(a).
Non debt tax shield (NDTS) is used to investigate the effect of saving taxes by using a
non debt tax savings shield, such as depreciation. This effect is opposite with the effect of
saving taxes by using debt. Depreciation ratio, which is a ratio of depreciation to the
amount of fixxed assets, is used as a proxy for the non debt tax savings shield. The
predicted sign of NDTS is negative as explained in section 3.7.1(a).
I do not use both TAX and NDTS in an equation. I use TAX in the equation of capital
structure in the model with investment, but I use NDTS in the other 2 models.
Business scale (SIZE) is used as a proxy for the a company’s bankcruptcy risk. SIZE is
measured as the natural logarithm of the company’s total assets.20 The predicted sign of
SIZE is positive as explained in section 3.7.1(a).
The operating income ratio (ROA), which is calculated as the ratio of the amount of
operating income (the total amount of profit before interest payments and tax payments)
to the amount of total assets,21 is used as a proxy for the free cash flow or the profitability
of the company. Interest payments was added to the pre tax profits to caculate the
operating profit because there is no operating profit term in the financial report of listed
companies in Vietnam. The predicted sign of ROA is negative as explained in section
3.7.1(a).
The fixed assets ratio (TANG), which is the ratio of total assets to the amount of fixed
assets,22 is used as a proxy variable for collateral ability. Monitoring and screening fixed
���������������������������������������������������19 Guihai and Frank (2006) used the same variables. For information on the tax system in Vietnam, see Table 4.7 in the Appendix of Chapter 4. 20 For example, see Chen (2004). The logarithm of sales is also often used as a proxy for firm size. 21 As in Huang and Song (2006) and Yupana (1999). 22 See Rajan and Zingales (1995) and Yupana (1999). Fixed assets refer to the sum of intangible assets and tangible fixed assets.
� ��
assets is relatively easy; hence, compared to other assets, fixed assets are more
appropriately used as collateral. Using fixed assets as collateral reduces the agency costs
associated with debt financing and allows a company to mobilize debt easily. The
predicted sign of TANG is positive.
The state controlled company dummy (STATE) takes a value of 1 for companies with
state stock holdings exceeding 50 per cent and 0 otherwise.
The foreign affiliated company dummy (FOR) takes a value of 1 if foreign ownership
exceeds 20 per cent.
STATE, FOR, and the cross terms of STATE and the explanatory variables are used to
investigate the effects of state ownership and foreign ownership on companies’ capital
structure. The effects of tax saving by debt or non debt tax savings may be smaller, and
the effects of bankcrutcy and collateral on debt ratios may be higher for the case of state
controlled companies, as discussed in section 3.7.2(a). The predicted sign of FOR is
negative, as discussed in section 3.7.3.
The Ho Chi Minh Securities Exchange listed company dummy (HOSE) takes 1 for
companies listed on the Ho Chi Minh Securities Exchange and 0 for companies listed on
the Hanoi Securities Exchange.
Industry dummy variables include construction industry (CONS), manufacturing
industry (MANU), mining industry (MIN), electricity industry (POWE), services (SERV),
communications (COMM), real estate (REAL), and commerce (COM).
Year dummy variables include YD2007, YD2008, YD2009, YD2010.
3.8.2 Estimation of investment of listed companies in Vietnam
(a) Estimation equation
Iit /Kit = αINV + Σβj Xjit + δINVSTATE + γINV STATE* CSit + ∂INVFOR + εit (2)
Iit /Kit is explained variable;
Xjit is the explanatory variables, j = 1, 2, 3;
STATE is the state controlled company dummy variable;
FOR is the foreign affiliated company dummy variable;
αINV is a constant term;
� ��
βj is coefficients of the explanatory variables, j = 1, 2, 3;
δINV is coefficient of STATE;
γINV is coefficient of the crossterm of STATE and debt ratios;
∂INV is coefficient of FOR;
εit is the matrix of error items;
i denotes individual company;
t denotes time.
This equation will appear in the estimation of the model of capital structure and
investment which will be conducted in chapter 4, and the model of capital structure,
growth opportunity and investment which will be conducted in chapter 6.
(b) Variables and predicted signs
� Explained variables
The investment ratio Iit/Kit was used as the explained variable23. The net investment of
an individual company (Iit) is calculated by Iit = Kit-Kit:1CPIt + depreciationit, where Kit
is the company’s fixed asset at each time t and CPIt is the consumer price index at time t.
� Explanatory variables
Q, cash flow (CF), total debt ratio (TDR), long term debt ratio (LDR) and long term
bank loan ratio (LBR) are used as the control variables, where TDR, LDR and LBR are
taken into the estimation in turn.
Q is calculated as the ratio of the total amount of debt and the present value of stocks
to the book value of total assets and is used as a proxy variable for the business growth
opportunities of a company. The higher the growth opportunity of the company is, the
more the company invests. The predicted sign of Q is positive.
Cash flow (CF) is used as a proxy for the internal reserves of the companies and is
calculated using the ratio of earnings before interest payments and taxes (EBIT) to fixed
assets. If the company has much internal reserves, it may be more ready for investment.
The predicted sign of CF is possitive.
TDR, LDR, and LBR are used as proxies for leverage and are calculated by dividing
���������������������������������������������������23 The same as Aivazian et al. (2005),
� ��
the sums of total debt, long term debt, and long term bank loans (for which the maturity
period exceeds one year), respectively, by the total amount of total assets. If debt
financing plays an active role in restraining overinvestment or facilitating
underinvestment (i.e., a debt overhang problem) among the listed companies in Vietnam,
the signs of the leverage variables will be negative.
The state controlled company dummy (STATE) takes a value of 1 for companies with
state stock holdings exceeding 50 per cent and 0 otherwise.
The foreign affiliated company dummy (FOR) takes a value of 1 if foreign ownership
exceeds 20 per cent.
STATE, FOR, and the cross terms of STATE and the leverage variables are used to
investigate the effects of state ownership and foreign ownership on companies’
investment activities. State controlled companies may invest more or less than other
companies, and debt financing’s role of restraining overinvestment or facilitating
underinvestment may be weaker in state controlled companies, as discussed in section
3.7.2(b). The predicted sign of FOR is positive, as discussed in section 3.7.3.
The Ho Chi Minh Securities Exchange listed company dummy (HOSE) takes 1 for
companies listed on the Ho Chi Minh Securities Exchange and 0 for companies listed on
the Hanoi Securities Exchange.
Industry dummy variables are used to control the characteristics of industries on each
listed company and year dummy variables are used to control the influences of
macroeconomic circumstances.
Industry dummy variables include construction industry (CONS), manufacturing
industry (MANU), mining industry (MIN), electricity industry (POWE), services (SERV),
communications (COMM), real estate (REAL), and commerce (COM).
Year dummy variables include YD2007, YD2008, YD2009, YD2010.
3.8.3 Estimation of profitability of listed companies in Vietnam
(a) Estimation equation
ROAit = αROA + Σβj Xjit + δROASTATE + Σγj STATE* Xjit + ∂ROAFOR + εit (3)
� ��
ROAit is a dependent variable representing the company’s profitability;
Xjit are explanatory variables, j = 1, 2, 3, 4;
STATE is the state controlled company dummy;
FOR is the foreign affiliated company dummy;
αROA is a constant term;
βj is coefficients of the explanatory variables, j = 1, 2, 3, 4;
δROA is coefficient of STATE;
γROA is coefficient of the crossterm of STATE and explanatory variables, j = 1, 2, 3, 4;
∂ROA is coefficient of FOR;
εit is the matrix of error items;
i denotes individual company;
t denotes time.
This equation will appear in the estimation of the models of capital structure and
profitability, which will be conducted in chapter 5.
(b) Variables and predicted signs
� Explained variables
ROA, which is calculated by dividing the operating profit (the total amount of profit
before interest payments and tax payments) to the amount of total assets, is used as the
proxy variable for the profitability of a company. Interest payments was added to the pre
tax profits to caculate the operating profit because there is no operating profit term in the
financial report of listed companies in Vietnam.
� Explanatory variables
Explanatory variables include economic variables such as business scale (SIZE), firm
growth rate (GROWTH), investment ratio (INV), debt ratios; variables representing the
characteristics of Vietnamese companies such as state controlled company dummy
(STATE), foreign affiliated company dummy (FOR), and other controlled variables such
as industry dummies and year dummies.
Business scale (SIZE) is calculated as the natural logarithm of the firm’s total assets.24
���������������������������������������������������24 For example, see Chen (2004). The logarithm of sales is also often used as a proxy for
� ��
The larger the business scale of the company is, the more its ability of influencing the
market and thus the higher its profitability will be. The predicted sign of SIZE is positive.
Firm growth rate (GROWTH) is calculated as the growth of sales year after year. The
higher the growth rate of the company is, the higher its profitability will be. The predicted
sign of GROWTH is positive.
The investment ratio (INV) is calculated by deviding the net investment of the
company It = Kt-Kt:1CPIt + depreciationit by the company’s fixed asset Kt (where CPIt is
the consumer price index at time t). The more the company invests, the more opportunity
its profitability may increase. The predicted sign of INV is positive.
Three debt ratios were used. They are the total debt ratio (TDR), long term debt ratio
(LDR), and long term bank loan ratio (LBR). When debt is excessive, overdebt problems
(i.e., debt overhang) and undesirable effects on business efficiency may occur. The sign
of debt ratios may be negative, as discussed in section 3.7.1(c).
The state controlled company dummy (STATE) takes a value of 1 for companies with
state stock holdings exceeding 50 per cent and 0 otherwise.
The foreign affiliated company dummy (FOR) takes a value of 1 if foreign ownership
exceeds 20 per cent.
STATE, FOR, and the cross terms of STATE and the explanatory variables are used to
investigate the effects of state ownership and foreign ownership on companies’
profitability. State controlled companies may have higher or lower profitability, as
discussed in section 3.3.2(c). Foreign affiliated companies are expected to be highly
profitable because of their high technical capacities and strong management skills, as
discussed in section 3.7.3.
Industry dummy variables include the construction industry (CONS), manufacturing
industry (MANU), mining industry (MIN), electricity industry (POWE), services (SERV),
communications (COMM), real estate (REAL), and commerce (COM).
Year dummy variables include YD2007, YD2008, YD2009, YD2010.
3.8.4 Estimation of growth opportunities of listed companies in Vietnam
(a) Estimation equation
�������������������������������������������������������������������������������������������������������������������������������������������������������
business scale.
� ��
Qit = αQ + ΣβQj Xjit + δQSTATE + ΣγQj STATE* Xjit + ∂QFOR + εit (4)
Xjit represents the explanatory variables, j = 1, 2, 3;
STATE is the state controlled company dummy;
FOR is the foreign affiliated company dummy;
αQ is a constant term;
βQj is coefficients of explanatory variables, j = 1, 2, 3;
δQ is coefficient of STATE;
γQ is coefficient of the crossterm of STATE and explanatory variables, j = 1, 2, 3;
∂Q is coefficient of FOR;
εit is the matrix of error items;
i denotes individual company;
t denotes time.
This equation will appear in the estimation of the models of capital structure, growth
opportunity and investment, which will be conducted in chapter 6.
(b) Variables and predicted signs
� Explained variables
Q is used as the explained variable. Q is calculated as the ratio of the total amount of
debt and the present value of stocks to the book value of total assets and is used as a
proxy variable for the business growth opportunities of a company.
� Explanatory variables
Business scale (SIZE), profitability (ROA) and TDR, LDR, LBR, are used as
controlled variables.
Business scale (SIZE) is calculated by taking the natural logarithm of total assets.
Companies with large business scale have a strong effect on the market, and their growth
opportunities are expected to be higher. Profitability (ROA) is calculated as the ratio of
the operating profit to total assets. If the business scale or the profitability of a company
has grown recently, it is expected to have good growth opportunities. The predicted signs
of both SIZE and ROA are positive.
� �
TDR, LDR and LBR are used as proxies for leverage and are introduced one by one
into the model. If debt financing facilitates underinvestment (i.e., a debt overhang
problem) or the company is in soft budget constraints, then the relationship between the
debt ratio and the growth opportunities of the company will be negative. Otherwise, if
debt financing restrains overinvestment, then the relationship between the debt ratio and a
firm’s growth opportunities will be positive, as discussed in section 3.7.1(d).
The state controlled company dummy (STATE) takes a value of 1 for companies with
state stock holdings exceeding 50 per cent and 0 otherwise.
The foreign affiliated company dummy (FOR) takes a value of 1 if foreign ownership
exceeds 20 per cent.
STATE, FOR, and the cross terms of STATE and the explanatory variables are used to
investigate the effects of state ownership and foreign ownership on companies’
profitability. As discussed in section 3.3.2(b) and (d), the underinvestment problem or
overinvestment problem may be more significant among state controlled companies; or
the soft budget constraint problem may be more severe in state controlled companies than
in other companies. Foreign affiliated companies are expected to have higher growth
opportunity because of their high technical capacities and strong management skills, as
discussed in section 3.7.3.
Industry dummy variables include the construction industry (CONS), manufacturing
industry (MANU), mining industry (MIN), electricity industry (POWE), services (SERV),
communications (COMM), real estate (REAL), and commerce (COM).
Year dummy variables include YD2007, YD2008, YD2009, YD2010.
3.8.5 Empirical methods
In order to investigate the characteristics of the capital structure of listed companies
in Vietnam and its impacts on investment, profitability and growth opportunity, I use
many estimation methods in estimating 3 models: (1) Capital structure and investment;
(2) Capital structure and profitability; (3) Capital structure, growth opportunities and
investment.
First, I apply the Ordinary Least Square (OLS) method for all these 3 models to
estimate the each equation separately. Next, I use the 2 step Least Square (2SLS) method
� �
for all of 3 models to estimate the equations one by one, using instrument variables. If the
instrument variables (IV) are only marginally valid, known as weak instrument variables,
they can lead to biased inferences based on the IV estimates. Thus, testing for the validity
of the instrument variables in an IV regression is important. I check the presence of weak
instrument variables by using Cragg Donald statistic.
Theoretically, there may be endogeneity problem between capital structure and
investment, between capital structure and profitability, as well as among capital structure,
investment, and growth opportunities. I check the endogeneity of these variables by using
Durbin Wu Hausman Test. And because in order to address the endogeneity problem,
simultaneously estimating equations of endogeneity variables as a system is preferred to
estimating them using a single equation (Driffield, 2007), I use the 3 stage Least Squares
(3SLS) method in estimating 3 models by using 3 systems of simultaneous equations: (1) system
of capital structure equation and investment equation, (2) system of capital structure
equation and profitability equation, (3) system of capital structure equation, investment
equation, and growth opportunities equation. The 3SLS method also use instrument
variables, thus I also check the weak instrument variables by using Cragg Donald statistic.
3.8.6 Data set
The samples used in the analysis are the non financial companies listed on the HOSE
or the HASE before 2009 for which we could get the necessary data for at least two
continuous years from 2006 to 2011. Financial institutions were excluded from the
sample because the determinants of their capital structure are different from that of non
financial institutions. The data from 2005 and before were excluded from the sample
because they were too small in comparison with the data from 2006 onward, and thus
made estimation results biased. The necessary data were acquired from the annual
financial reports of listed companies that were disclosed by the HOSE and the HASE.
There were 200 companies listed on the HOSE and 257 companies listed on the HASE
before 2009. 435 non financial companies were included in the sample. Table 3.6 shows
the characteristics of the main variables used in the analysis using the sample of 435
companies.

� ����
Table 3.6 Comparison of State controlled companies and foreign affiliated companies
Ho Chi Minh stock exchange Hanoi stock exchange
All companies
State controlled companies
Foreign affiliated
companies
All companies
State controlled companies
Foreign affiliated
companies
Total debt ratio 0.471 0.472 0.406 0.562 0.613 0.442
Long term debt ratio 0.109 0.167 0.101 0.109 0.127 0.079
Long term bank loan ratio 0.060 0.097 0.053 0.060 0.072 0.047 Investment ratio 0.446 0.300 0.448 0.577 0.464 0.974
Tax ratio 0.151 0.088 0.123 0.123 0.110 0.120
Depreciation rate 0.034 0.049 0.032 0.041 0.051 0.046 Sales 26.94 27.00 27.48 25.97 26.25 26.55 Fix assets ratio 0.307 0.415 0.318 0.296 0.318 0.313 ROA 0.120 0.135 0.148 0.105 0.104 0.158 Cash flow 1.251 1.054 1.287 2.357 1.252 2.497
Q 1.789 1.963 2.076 1.449 1.377 2.029
Source: Homepages of the Hanoi stock exchange (http://www.hnx.vn/) and the Ho Chi Minh stock exchange (http://www.hsx.vnnx.vn) Note 1: Average value from 2006 to 2011 (Q is average value from 2006 to 2010) Note 2: Sales are in natural logarithm values.
First, the HASE had a higher total debt ratio than the HOSE; while long term debt and
long term bank loan ratios of the two markets are about the same. This result suggests
that companies listed on the HASE are more dependent on short term debt. Besides,
companies listed on the HOSE had higher sales, operating profit and fixed assets ratios
than those listed on the HASE. This result indicates the superiority of corporate size,
profitability, and collateral ability of companies listed on the HOSE, where has stricter
listing norms. However, companies listed on the HASE had higher investment ratio,
depreciate ratio and cash flow than those listed on the HOSE.
Second, a comparison of the companies’ capital structures shows that in both markets,
state controlled companies tend to be more highly reliant on debt than foreign affiliated
companies are. In addition, on both stock exchanges, foreign affiliated companies have
higher operating profit ratios, while state controlled companies had higher fixed assets
ratios. Moreover, foreign affiliated companies on both markets have higher investment
rates, which indicate active investment.
Table 3.7 displays the basic statistics of the main variables. The average debt ratio of
listed companies in Vietnam is 51.2 per cent, which is approximately the same as that of
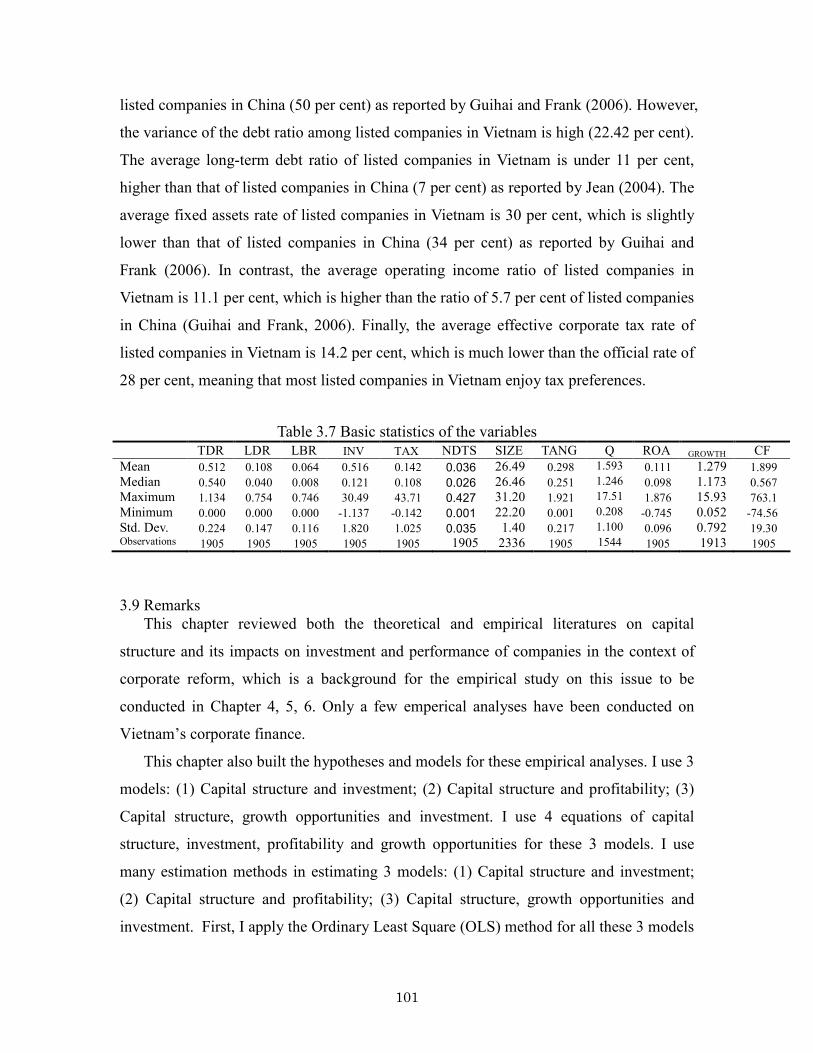
� ����
listed companies in China (50 per cent) as reported by Guihai and Frank (2006). However,
the variance of the debt ratio among listed companies in Vietnam is high (22.42 per cent).
The average long term debt ratio of listed companies in Vietnam is under 11 per cent,
higher than that of listed companies in China (7 per cent) as reported by Jean (2004). The
average fixed assets rate of listed companies in Vietnam is 30 per cent, which is slightly
lower than that of listed companies in China (34 per cent) as reported by Guihai and
Frank (2006). In contrast, the average operating income ratio of listed companies in
Vietnam is 11.1 per cent, which is higher than the ratio of 5.7 per cent of listed companies
in China (Guihai and Frank, 2006). Finally, the average effective corporate tax rate of
listed companies in Vietnam is 14.2 per cent, which is much lower than the official rate of
28 per cent, meaning that most listed companies in Vietnam enjoy tax preferences.
Table 3.7 Basic statistics of the variables
TDR LDR LBR INV TAX NDTS SIZE TANG Q ROA GROWTH CF
Mean 0.512 0.108 0.064 0.516 0.142 ��'�"$� 26.49 0.298 1.593 0.111 1.279 1.899
Median 0.540 0.040 0.008 0.121 0.108 ��'��$� 26.46 0.251 1.246 0.098 1.173 0.567
Maximum 1.134 0.754 0.746 30.49 43.71 ��'#�&� 31.20 1.921 17.51 1.876 15.93 763.1
Minimum 0.000 0.000 0.000 1.137 0.142 ��'���� 22.20 0.001 0.208 0.745 0.052 74.56
Std. Dev. 0.224 0.147 0.116 1.820 1.025 ��'�"�� 1.40 0.217 1.100 0.096 0.792 19.30 Observations 1905 1905 1905 1905 1905 1905 2336 1905 1544 1905 1913 1905
��
3.9 Remarks This chapter reviewed both the theoretical and empirical literatures on capital
structure and its impacts on investment and performance of companies in the context of
corporate reform, which is a background for the empirical study on this issue to be
conducted in Chapter 4, 5, 6. Only a few emperical analyses have been conducted on
Vietnam’s corporate finance.
This chapter also built the hypotheses and models for these empirical analyses. I use 3
models: (1) Capital structure and investment; (2) Capital structure and profitability; (3)
Capital structure, growth opportunities and investment. I use 4 equations of capital
structure, investment, profitability and growth opportunities for these 3 models. I use
many estimation methods in estimating 3 models: (1) Capital structure and investment;
(2) Capital structure and profitability; (3) Capital structure, growth opportunities and
investment. First, I apply the Ordinary Least Square (OLS) method for all these 3 models
� ����
to estimate the each equation separately. Next, I use the 2 step Least Square (2SLS)
method for all of 3 models to estimate the equations one by one, using instrument
variables. After that, I use the 3 stage Least Squares (3SLS) method in estimating 3 models by
using 3 systems of simultaneous equations: (1) system of capital structure equation and
investment equation, (2) system of capital structure equation and profitability equation,
(3) system of capital structure equation, investment equation, and growth opportunities
equation. I check the presence of weak instrument variables by using Cragg Donald
statistic. I also check the endogeneity of these variables by using Durbin Wu Hausman
Test.
�
�
�
�
�
�
�
�
�
�
�
�
�
�
�
�
� ����
�� �����
� �� � ��������� �� ��������� '�� ��� ��
��������� �������� �()����� ��������
������������ ���$��������
This chapter investigates the characteristics of the capital structure and its impact on
the investment behavior of listed companies in the Hanoi Stock Exchange (HASE) and
the Ho Chi Minh Stock Exchange (HOSE) in Vietnam. As explained in Chapter 3, I
conduct three estimation methods for the analysis of capital structure and investment:
ordinary least squares (OLS), two stage least squares (2SLS), and three stage least
squares (3SLS).
The estimation analysis, using panel data covering the six year period from 2006 to
2011, implies that the Doi moi economic reforms implemented by the Vietnamese
government have achieved some of their goals in terms of fund mobilization and
corporate finance. The analysis also illustrates several limitations of the economic
reforms, such as the opaque relationship between state controlled companies and
government banks, and inactive investment by state controlled companies.
4.1 Correlation coefficients of explanatory variables
In this analysis, I use a sample set of all 435 companies listed on the HOSE or the
HASE for the six year period 2006–2011. As the two markets have different listing norms,
I use a HOSE listed company dummy variable (HOSE) to see any differences between
companies listed on the HOSE and those listed on the HASE.
Tables 4.1 and 4.2 display the correlation coefficients of the explanatory variables of
the two estimation equations of capital structure and investment. In both estimation
equations, none of the explanatory variables are highly correlated with each other.
���������������������������������������������������25 This chapter is based on part of my co study with Prof. Hidenobu Okuda, which was published as “Capital Structure and Investment Behavior of Listed Companies in Vietnam: An Estimation of the Influence of Government Ownership” in International
Journal of Business and Information, 7(2), December 2012.
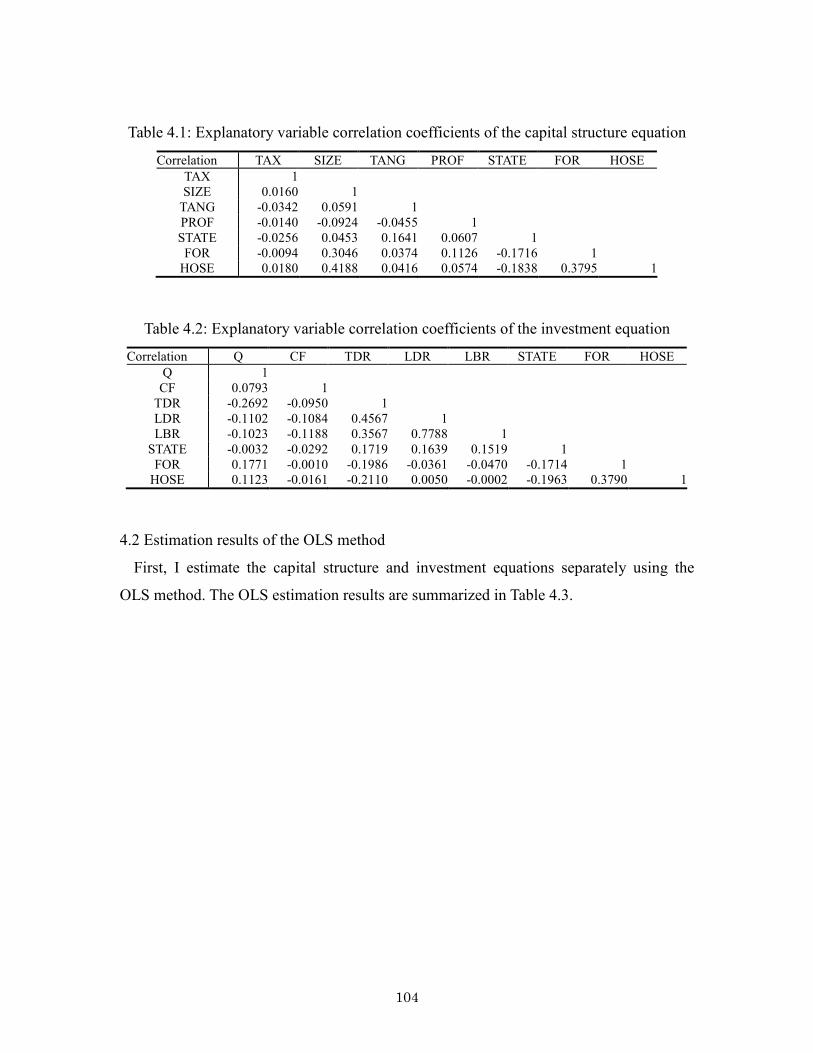
� ����
Table 4.1: Explanatory variable correlation coefficients of the capital structure equation
Correlation TAX SIZE TANG PROF STATE FOR HOSE
TAX 1SIZE 0.0160 1
TANG 0.0342 0.0591 1PROF 0.0140 0.0924 0.0455 1STATE 0.0256 0.0453 0.1641 0.0607 1FOR 0.0094 0.3046 0.0374 0.1126 0.1716 1
HOSE 0.0180 0.4188 0.0416 0.0574 0.1838 0.3795 1
�
Table 4.2: Explanatory variable correlation coefficients of the investment equation
Correlation Q CF TDR LDR LBR STATE FOR HOSE
Q 1CF 0.0793 1
TDR 0.2692 0.0950 1LDR 0.1102 0.1084 0.4567 1LBR 0.1023 0.1188 0.3567 0.7788 1
STATE 0.0032 0.0292 0.1719 0.1639 0.1519 1FOR 0.1771 0.0010 0.1986 0.0361 0.0470 0.1714 1
HOSE 0.1123 0.0161 0.2110 0.0050 0.0002 0.1963 0.3790 1
�
4.2�Estimation results of the OLS method
First, I estimate the capital structure and investment equations separately using the
OLS method. The OLS estimation results are summarized in Table 4.3.
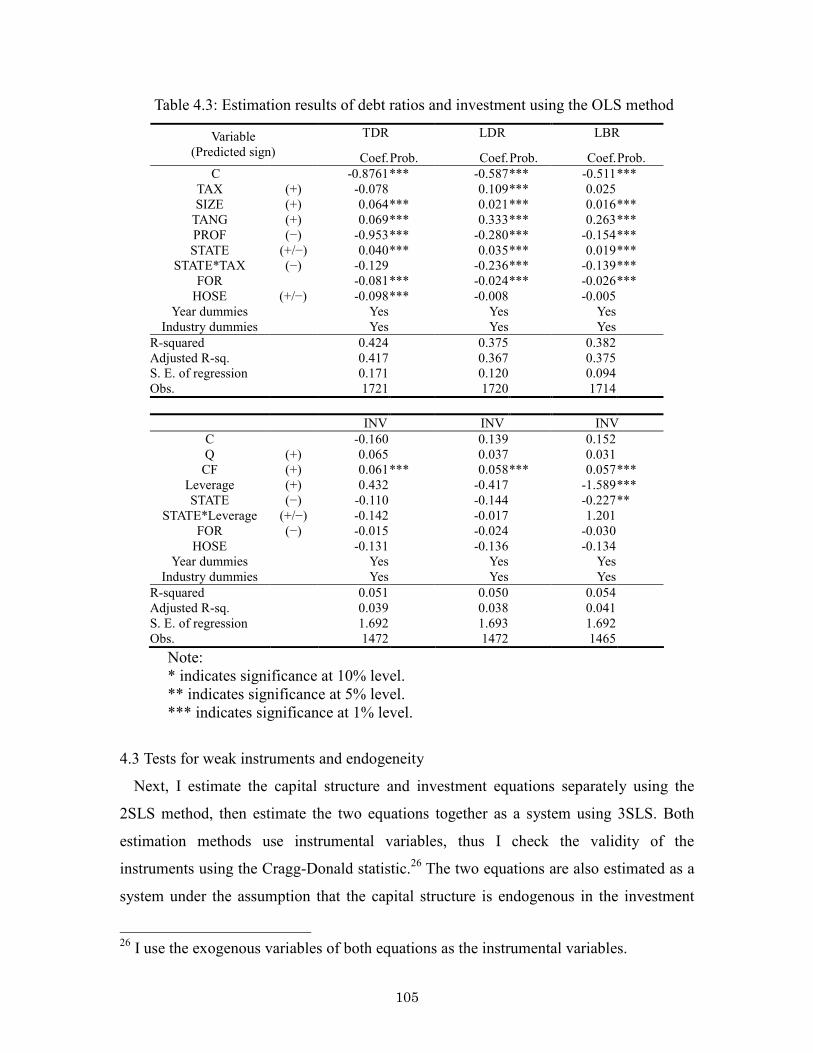
� ����
Table 4.3: Estimation results of debt ratios and investment using the OLS method
TDR LDR LBR Variable (Predicted sign) Coef.Prob. Coef.Prob. Coef.Prob.
C 0.8761 *** 0.587 *** 0.511 *** TAX (+) 0.078 0.109 *** 0.025 SIZE (+) 0.064 *** 0.021 *** 0.016 ***
TANG (+) 0.069 *** 0.333 *** 0.263 *** PROF (−) 0.953 *** 0.280 *** 0.154 *** STATE (+/−) 0.040 *** 0.035 *** 0.019 ***
STATE*TAX (−) 0.129 0.236 *** 0.139 *** FOR 0.081 *** 0.024 *** 0.026 ***
HOSE (+/−) 0.098 *** 0.008 0.005 Year dummies Yes Yes Yes
Industry dummies Yes Yes Yes
R squared 0.424 0.375 0.382 Adjusted R sq. 0.417 0.367 0.375 S. E. of regression 0.171 0.120 0.094 Obs. 1721 1720 1714
INV INV INV
C 0.160 0.139 0.152 Q (+) 0.065 0.037 0.031
CF (+) 0.061 *** 0.058 *** 0.057 *** Leverage (+) 0.432 0.417 1.589 *** STATE (−) 0.110 0.144 0.227 **
STATE*Leverage (+/−) 0.142 0.017 1.201 FOR (−) 0.015 0.024 0.030
HOSE 0.131 0.136 0.134 Year dummies Yes Yes Yes
Industry dummies Yes Yes Yes
R squared 0.051 0.050 0.054 Adjusted R sq. 0.039 0.038 0.041 S. E. of regression 1.692 1.693 1.692 Obs. 1472 1472 1465
Note: * indicates significance at 10% level. ** indicates significance at 5% level. *** indicates significance at 1% level.
4.3�Tests for weak instruments and endogeneity
Next, I estimate the capital structure and investment equations separately using the
2SLS method, then estimate the two equations together as a system using 3SLS. Both
estimation methods use instrumental variables, thus I check the validity of the
instruments using the Cragg Donald statistic.26 The two equations are also estimated as a
system under the assumption that the capital structure is endogenous in the investment
���������������������������������������������������26 I use the exogenous variables of both equations as the instrumental variables.
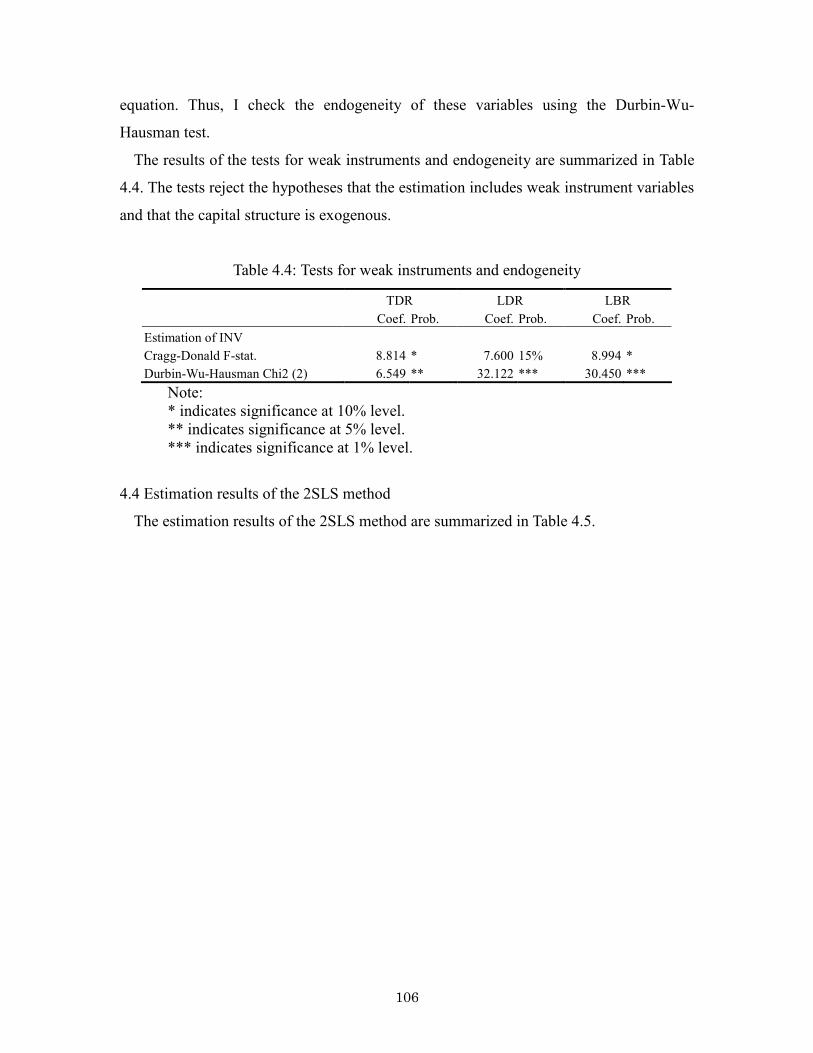
� ����
equation. Thus, I check the endogeneity of these variables using the Durbin Wu
Hausman test.
The results of the tests for weak instruments and endogeneity are summarized in Table
4.4. The tests reject the hypotheses that the estimation includes weak instrument variables
and that the capital structure is exogenous.
Table 4.4: Tests for weak instruments and endogeneity
TDR LDR LBR
Coef. Prob. Coef. Prob. Coef. Prob.
Estimation of INV
Cragg Donald F stat. 8.814 * 7.600 15% 8.994 *
Durbin Wu Hausman Chi2 (2) 6.549 ** 32.122 *** 30.450 ***
Note: * indicates significance at 10% level. ** indicates significance at 5% level. *** indicates significance at 1% level.
4.4�Estimation results of the 2SLS method
The estimation results of the 2SLS method are summarized in Table 4.5.
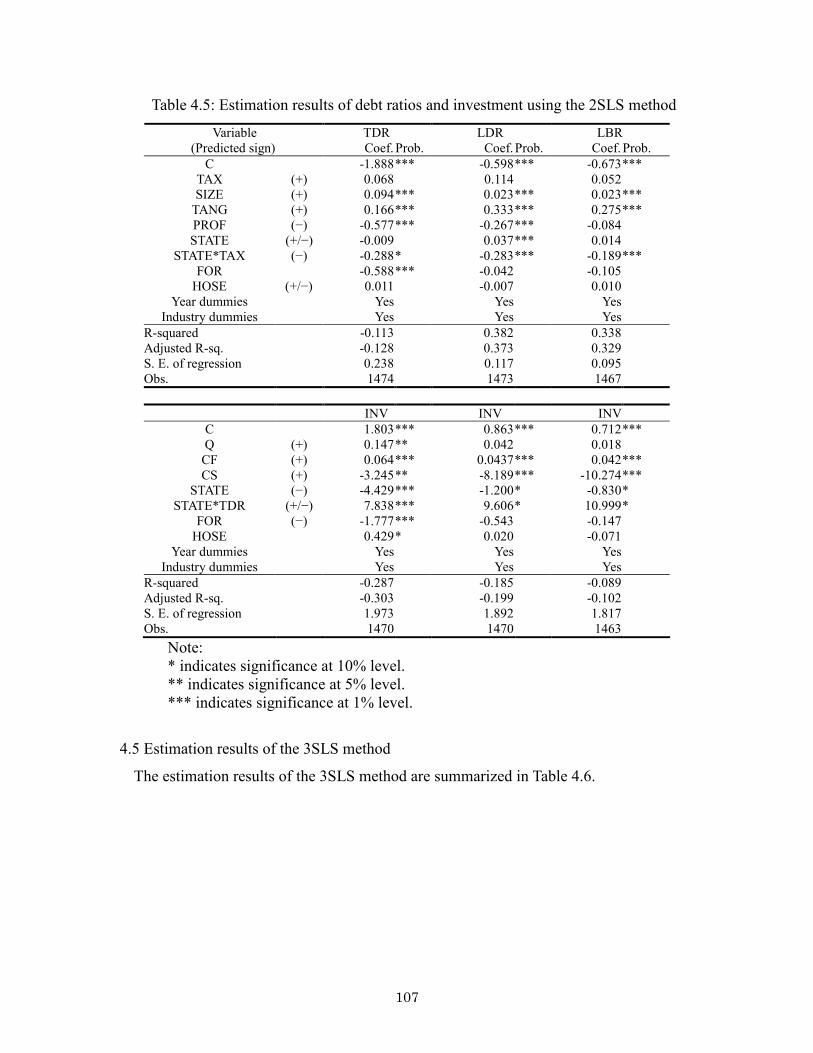
� ����
Table 4.5: Estimation results of debt ratios and investment using the 2SLS method
TDR LDR LBR Variable (Predicted sign) Coef. Prob. Coef. Prob. Coef. Prob.
C 1.888 *** 0.598 *** 0.673 *** TAX (+) 0.068 0.114 0.052 SIZE (+) 0.094 *** 0.023 *** 0.023 ***
TANG (+) 0.166 *** 0.333 *** 0.275 *** PROF (−) 0.577 *** 0.267 *** 0.084 STATE (+/−) 0.009 0.037 *** 0.014
STATE*TAX (−) 0.288 * 0.283 *** 0.189 *** FOR 0.588 *** 0.042 0.105
HOSE (+/−) 0.011 0.007 0.010 Year dummies Yes Yes Yes
Industry dummies Yes Yes Yes
R squared 0.113 0.382 0.338 Adjusted R sq. 0.128 0.373 0.329 S. E. of regression 0.238 0.117 0.095 Obs. 1474 1473 1467
INV INV INV
C 1.803 *** 0.863 *** 0.712 *** Q (+) 0.147 ** 0.042 0.018
CF (+) 0.064 *** 0.0437 *** 0.042 *** CS (+) 3.245 ** 8.189 *** 10.274 ***
STATE (−) 4.429 *** 1.200 * 0.830 * STATE*TDR (+/−) 7.838 *** 9.606 * 10.999 *
FOR (−) 1.777 *** 0.543 0.147 HOSE 0.429 * 0.020 0.071
Year dummies Yes Yes Yes Industry dummies Yes Yes Yes
R squared 0.287 0.185 0.089 Adjusted R sq. 0.303 0.199 0.102 S. E. of regression 1.973 1.892 1.817 Obs. 1470 1470 1463
Note: * indicates significance at 10% level. ** indicates significance at 5% level. *** indicates significance at 1% level.
4.5�Estimation results of the 3SLS method
The estimation results of the 3SLS method are summarized in Table 4.6.
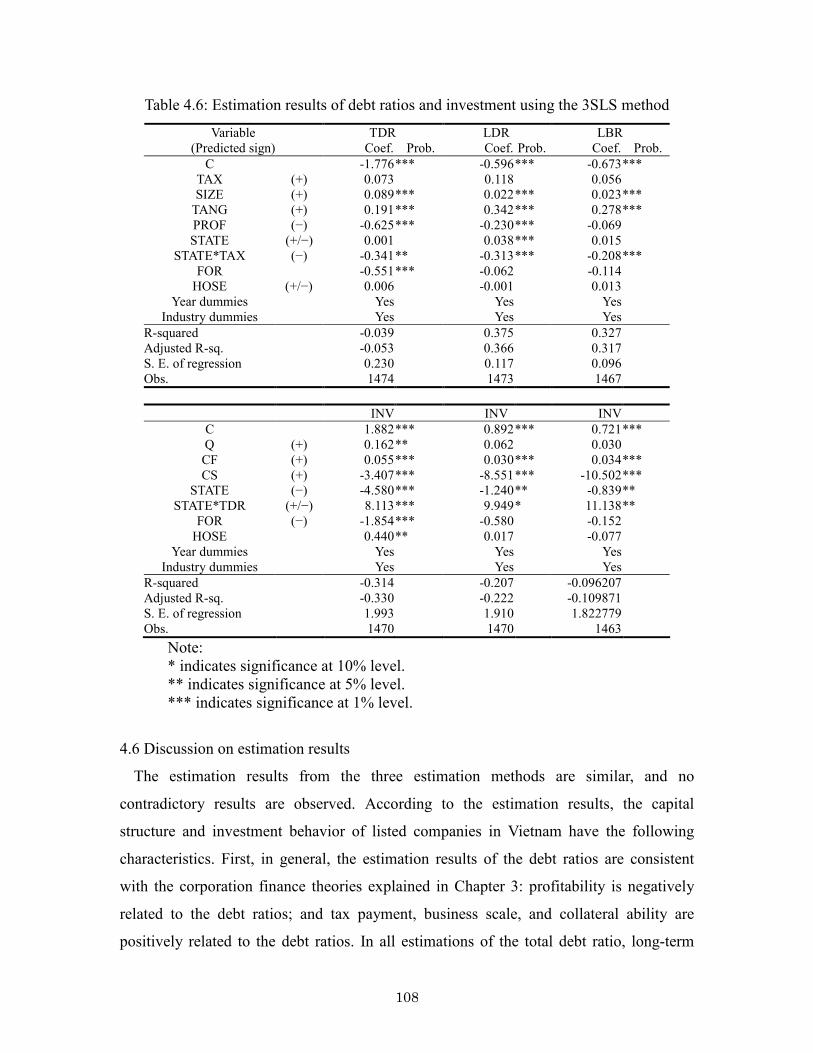
� ���
Table 4.6: Estimation results of debt ratios and investment using the 3SLS method
TDR LDR LBR Variable (Predicted sign) Coef. Prob. Coef. Prob. Coef. Prob.
C 1.776 *** 0.596 *** 0.673 *** TAX (+) 0.073 0.118 0.056 SIZE (+) 0.089 *** 0.022 *** 0.023 ***
TANG (+) 0.191 *** 0.342 *** 0.278 *** PROF (−) 0.625 *** 0.230 *** 0.069 STATE (+/−) 0.001 0.038 *** 0.015
STATE*TAX (−) 0.341 ** 0.313 *** 0.208 *** FOR 0.551 *** 0.062 0.114
HOSE (+/−) 0.006 0.001 0.013 Year dummies Yes Yes Yes
Industry dummies Yes Yes Yes
R squared 0.039 0.375 0.327 Adjusted R sq. 0.053 0.366 0.317 S. E. of regression 0.230 0.117 0.096 Obs. 1474 1473 1467
INV INV INV
C 1.882 *** 0.892 *** 0.721 *** Q (+) 0.162 ** 0.062 0.030 CF (+) 0.055 *** 0.030 *** 0.034 *** CS (+) 3.407 *** 8.551 *** 10.502 ***
STATE (−) 4.580 *** 1.240 ** 0.839 ** STATE*TDR (+/−) 8.113 *** 9.949 * 11.138 **
FOR (−) 1.854 *** 0.580 0.152 HOSE 0.440 ** 0.017 0.077
Year dummies Yes Yes Yes Industry dummies Yes Yes Yes
R squared 0.314 0.207 0.096207 Adjusted R sq. 0.330 0.222 0.109871 S. E. of regression 1.993 1.910 1.822779 Obs. 1470 1470 1463
Note: * indicates significance at 10% level. ** indicates significance at 5% level. *** indicates significance at 1% level.
4.6 Discussion on estimation results
The estimation results from the three estimation methods are similar, and no
contradictory results are observed. According to the estimation results, the capital
structure and investment behavior of listed companies in Vietnam have the following
characteristics. First, in general, the estimation results of the debt ratios are consistent
with the corporation finance theories explained in Chapter 3: profitability is negatively
related to the debt ratios; and tax payment, business scale, and collateral ability are
positively related to the debt ratios. In all estimations of the total debt ratio, long term
� ���
debt ratio, and long term bank loan ratio, none of the explanatory variables have
coefficients with signs that are both contrary to the theoretical expectations and
statistically significant. This suggests that standard corporate finance theories could be
appropriate for explaining the capital structure of listed companies in Vietnam.
Second, we find differences between the fundraising determinants of state controlled
companies and companies that are not state controlled. The coefficient of the state
controlled company dummy (STATE) is significantly positive in the estimation of the
long term debt ratio. This suggests that state controlled companies possess an advantage
in reducing the agency costs accompanied with tapping external borrowed funds. The
coefficient of the cross term of the state controlled company dummy (STATE) and the tax
ratio is significantly negative in all of the estimations. This agrees with the hypothesis
that state controlled companies have less incentive to save tax payments by using debt.
Third, the fundraising structure of the companies listed on the HOSE is the same as for
those listed on the HASE. In the estimations of the total debt ratio, long term debt ratio,
and long term bank loan ratio, the HOSE listed company dummy coefficient (HOSE) is
not significant. This suggests that there was no statistical difference in the capital
structures of the companies listed on the two stock markets.27
Fourth, the relationship between investment and leverage for listed companies in
Vietnam is significantly negative—as it is in developed economies and other transitional
economies, such as China—which implies that debt financing has the role of restraining
overinvestment or facilitating underinvestment.
Fifth, the negative relationship between leverage and investment is weaker for the case
of state controlled companies because the coeffecients of the cross term of the state
controlled company dummy (STATE) and leverage are significantly positive. This implies
that the role of borrowing in restraining overinvestment or facilitating underinvestment is
weaker for state controlled companies. State owned banks and state controlled banks
tend to give priority to state controlled companies in lending funds, and they also monitor
these companies’ use of funds less strictly than they do for other companies because
state controlled companies are guaranteed by the government. ���������������������������������������������������27 Recently, many companies have met the listing conditions of the HOSE but have remained listed on the HASE. It is thought that there is almost no difference between listing on the HOSE and the HASE.

� ����
Sixth, the negative relationship between investment and leverage is much stronger for
long term bank loans than for long term debt. This implies that bank loans play a more
active role in restraining overinvestment or facilitating underinvestment than other forms
of credit.
Finally, the coefficients of the dummy for state controlled companies (STATE) are
significantly negative. This means that state controlled companies are less active in
investing than other companies.
4.7 Conclusion
This analysis used data from 2006 to 2011 of companies listed on the Ho Chi Minh
Stock Exchange and the Hanoi Stock Exchange in order to investigate the fundraising
determinants and effects of capital structure on the investment behavior of companies in
Vietnam. The estimation results revealed some interesting findings.
First, compared with studies by Nguyen (2006) and Biger et al. (2008) on the capital
structure of small and medium sized unlisted companies under an underdeveloped
institutional environment, this analysis showed that the capital structure of listed
companies can be better explained by standard corporate financing theory based on
agency cost theory. In addition, the debt ratios of the listed companies were higher than
those of the small to medium sized companies examined by Nguyen (2006). These
observations suggest that the development of market infrastructure surrounding the listed
companies successfully mitigated the agency cost problems accompanied with tapping
external funds and, at the same time, made their capital structure more consistent with the
theoretically predicted one.
Second, similarly to Nguyen (2006), this study found that state controlled companies
had higher debt ratios than other companies, which implies that state controlled
companies had an advantageous position in reducing the agency costs associated with
tapping borrowed funds. This brings about the suspicion that state controlled, listed
companies maintained the privilege to borrow easily from state controlled banks even
after they were formally privatized and listed on the stock markets.
Third, the analysis found a negative relationship between leverage and investment, as
has been found in other studies of transitional countries. This implies that debt financing
� ����
plays a role in preventing underinvestment and overinvestment. This negative
relationship is weaker for state controlled companies. However, state controlled
companies were less active as investors than companies that were not state controlled.
These findings imply that although state controlled companies borrow more, they are less
strictly monitored by state controlled banks in their use of debt funds, and thus invest less
than other companies.
This study identified the key features of the fundraising structure and the effects on the
investment behavior of listed companies in Vietnam. In terms of fund mobilization and
corporate financing, the Doi moi economic reforms, implemented by the Vietnamese
government with the aim of creating an economic system based on market mechanisms,
have achieved some of their goals. However, the findings illustrate several limitations of
the reforms, such as the opaque relationship between state controlled companies and
state owned and state controlled banks, and inactive investment by state controlled
companies.

� ����
Appendix
Table 4.7: Corporate taxes on listed companies in Vietnam
Corporate tax law (17 June 2003) (1) Tax rate: 28 per cent
(2) Preferential tax rate: (1) Application of tax rates of 20 per cent, 15 per cent, and 10 per cent to companies that have been newly established in preferred industries or areas; (2) Application of tax exemptions (for at most four years) and half reductions (for at most the next nine years) for companies that have moved to preferred areas; (3) Application of tax exemptions (for at most four years) and half reductions (for at most the next seven years) of the increase in profit of companies that apply for a new production line or new technology.
Regulations on tax preferences for listed companies (20 October 2004) (1) Application of tax exemption for the next two years for newly listed companies; (2)
If listing is not done at the beginning of the year, tax exemption can be calculated from the next year; (3) If corporate tax law preferences are being applied, this preference can be applied after applying those preferences.
Nullification of regulations on tax preferences for listed companies (8 September 2006) (1) For companies listed after 1 January 2007, the preferences of the above regulations
are not applied; (2) For companies listed before 1 January 2007, the preferences of the above regulations are applied.
Source: Websites of the Hanoi Stock Exchange (http://www.hnx.vn/) and the Ho Chi Minh Stock Exchange (http://www.hsx.vnnx.vn).
�
�
�
�
�
�
�
�
�
�
�
�
�
�
�
�
�
�
�
�
�
�
�
�
� ����
�
�� �����
���������������� ����"���������*�
�������� �������������� ���*� �� �
��������� ������� '��&('����� �� �������
#��� �����+�,
This chapter investigates the capital structure and profitability of listed companies in
the Ho Chi Minh Stock Exchange (HOSE) and the Hanoi Stock Exchange (HASE) in
Vietnam by estimating their debt ratios and return rates using the samples of 435 listed
companies for 2006 2011 period. As explained in Chapter 3, I use three estimation
methods for the analysis of capital structure and profitability: ordinary least squares
(OLS), two stage least squares (2SLS), and three stage least squares (3SLS).
The estimation results show that, firstly, the capital structures of listed companies
matched the features of standardized corporate financing theories better than those of
Vietnamese small and medium sized enterprises. Secondly, weak corporate governance
and insufficient monitoring by creditors led the listed companies to borrow excessively in
both periods before and after the boom. Thirdly, the state controlled companies listed on
the HOSE are likely to have an advantage over other companies in accessing loans and
earning profits, even after the boom period. Fourthly, while foreign affiliated companies
were not substantially more profitable during the boom period, they were more profitable
in the period after the boom because of better production technology and management.
These findings suggest that reforming the Vietnamese market requires the development
of a system that ensures information transparency and independent corporate governance,
enhances financial openness, and increases the privatization of state owned companies,
including those in the banking sector.
���������������������������������������������������28 This chapter is based on part of my co study with Prof. Hidenobu Okuda which was published as “Effects of the state ownership on companies’ capital structure and profitability: Estimation Analysis Before and After the Lehman Shock” in Journal of
Asia Economics, 38, 2015.

� ����
5.1 Correlation coefficients of explanatory variables
In this model, I divide the sample set into 2 periods of before and after Lehman shock
(2006 2008 and 2009 2011), and estimate separately the companies listed on the HOSE
and the HASE to see the differences between these two periods and among companies
listed on these two markets.
Table 5.1 and Table 5.2 display the correlation coefficients of the explanatory
variables of the two estimation equations of capital structure and profitability. In both
estimation equations, none of the explanatory variables are highly correlated with each
other.
Table 5.1 Correlation coefficients of explanatory variables of capital structure equation
NDTS SIZE TANG ROA STATE FOR GDPGROWTH
NDTS 1 SIZE 0.120 1
TANG 0.446 0.057 1 ROA 0.085 0.090 0.043 1
STATE 0.246 0.046 0.162 0.062 1 FOR 0.025 0.305 0.038 0.112 0.171 1
GDPGROWTH 0.011 0.009 0.039 0.011 0.034 0.045 1
Table 5.2: Correlation coefficients of the explanatory variables of profitability equation
SIZE GROWTH INV TDR LDR LBR STATE FOR
SIZE 1
GROWTH 0.048 1
INV 0.008 0.038 1
TDR 0.274 0.033 0.059 1
LDR 0.368 0.013 0.052 0.446 1
LBR 0.277 0.022 0.016 0.360 0.780 1
STATE 0.039 0.031 0.042 0.156 0.152 0.151 1
FOR 0.310 0.001 0.008 0.194 0.030 0.042 0.175 1
5.2�Estimation results of OLS method
First, I estimate the capital structure equation and profitability equation separately
using OLS method. The OLS estimation results are summarized in Tables 5.3 and Table
5.4 for listed companies on the HOSE and the HASE, respectively.
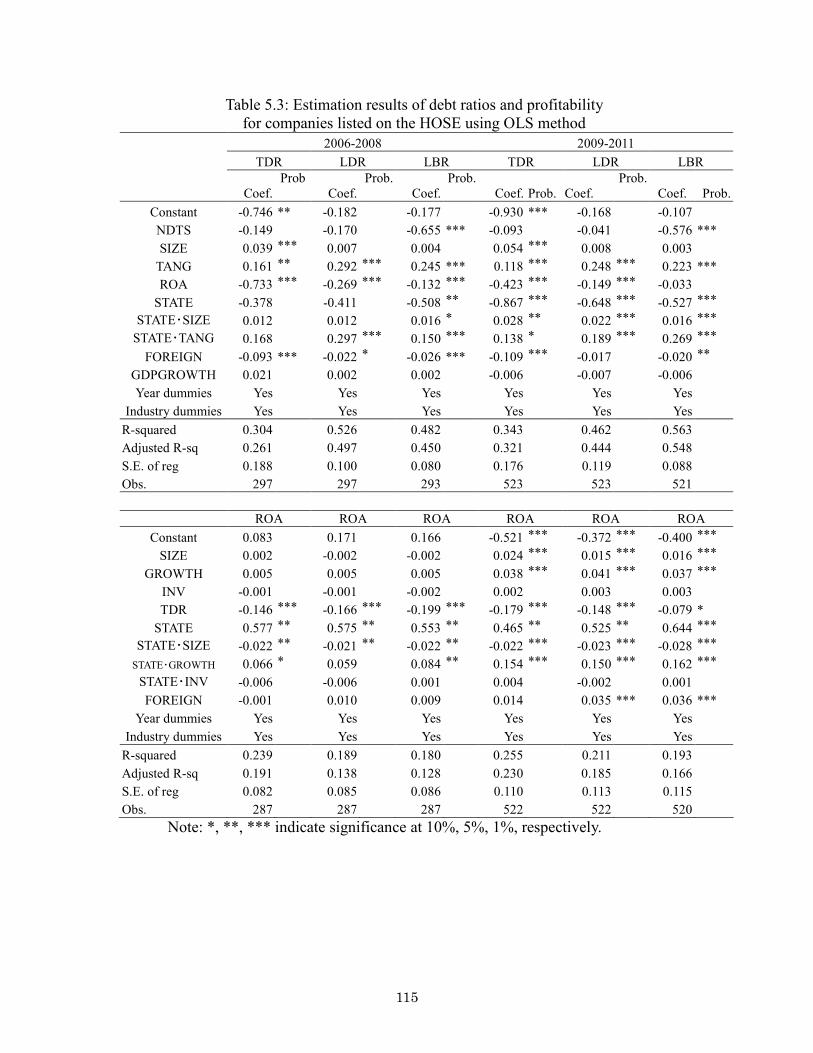
� ����
Table 5.3: Estimation results of debt ratios and profitability for companies listed on the HOSE using OLS method
2006 2008 2009 2011
TDR LDR LBR TDR LDR LBR
Coef. Prob
Coef. Prob.
Coef. Prob.
Coef. Prob. Coef. Prob.
Coef. Prob.
Constant 0.746 ** 0.182 0.177 0.930 *** 0.168 0.107
NDTS 0.149 0.170 0.655 *** 0.093 0.041 0.576 ***
SIZE 0.039 *** 0.007 0.004 0.054 *** 0.008 0.003
TANG 0.161 ** 0.292 *** 0.245 *** 0.118 *** 0.248 *** 0.223 ***
ROA 0.733 *** 0.269 *** 0.132 *** 0.423 *** 0.149 *** 0.033
STATE 0.378 0.411 0.508 ** 0.867 *** 0.648 *** 0.527 ***
STATE・SIZE 0.012 0.012 0.016 * 0.028 ** 0.022 *** 0.016 ***
STATE・TANG 0.168 0.297 *** 0.150 *** 0.138 * 0.189 *** 0.269 ***
FOREIGN 0.093 *** 0.022 * 0.026 *** 0.109 *** 0.017 0.020 **
GDPGROWTH 0.021 0.002 0.002 0.006 0.007 0.006
Year dummies Yes Yes Yes Yes Yes Yes
Industry dummies Yes Yes Yes Yes Yes Yes
R squared 0.304 0.526 0.482 0.343 0.462 0.563
Adjusted R sq 0.261 0.497 0.450 0.321 0.444 0.548
S.E. of reg 0.188 0.100 0.080 0.176 0.119 0.088
Obs. 297 297 293 523 523 521
ROA ROA ROA ROA ROA ROA
Constant 0.083 0.171 0.166 0.521 *** 0.372 *** 0.400 ***
SIZE 0.002 0.002 0.002 0.024 *** 0.015 *** 0.016 ***
GROWTH 0.005 0.005 0.005 0.038 *** 0.041 *** 0.037 ***
INV 0.001 0.001 0.002 0.002 0.003 0.003
TDR 0.146 *** 0.166 *** 0.199 *** 0.179 *** 0.148 *** 0.079 *
STATE 0.577 ** 0.575 ** 0.553 ** 0.465 ** 0.525 ** 0.644 ***
STATE・SIZE 0.022 ** 0.021 ** 0.022 ** 0.022 *** 0.023 *** 0.028 ***
STATE・GROWTH 0.066 * 0.059 0.084 ** 0.154 *** 0.150 *** 0.162 ***
STATE・INV 0.006 0.006 0.001 0.004 0.002 0.001
FOREIGN 0.001 0.010 0.009 0.014 0.035 *** 0.036 ***
Year dummies Yes Yes Yes Yes Yes Yes
Industry dummies Yes Yes Yes Yes Yes Yes
R squared 0.239 0.189 0.180 0.255 0.211 0.193
Adjusted R sq 0.191 0.138 0.128 0.230 0.185 0.166
S.E. of reg 0.082 0.085 0.086 0.110 0.113 0.115
Obs. 287 287 287 522 522 520
Note: *, **, *** indicate significance at 10%, 5%, 1%, respectively.
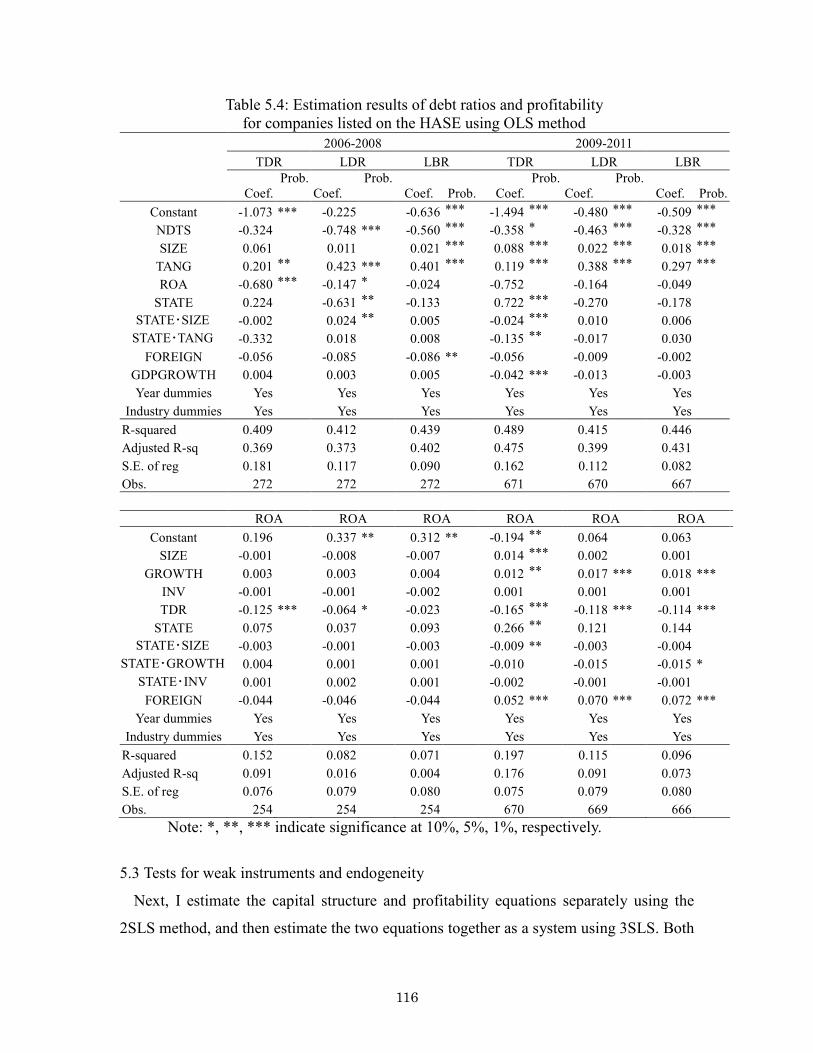
� ����
Table 5.4: Estimation results of debt ratios and profitability for companies listed on the HASE using OLS method
2006 2008 2009 2011
TDR LDR LBR TDR LDR LBR
Coef. Prob.
Coef. Prob.
Coef. Prob. Coef. Prob.
Coef. Prob.
Coef. Prob.
Constant 1.073 *** 0.225 0.636 ***� 1.494 ***� 0.480 ***� 0.509 ***�
NDTS 0.324 0.748 *** 0.560 ***� 0.358 *� 0.463 ***� 0.328 ***�
SIZE 0.061 0.011 0.021 ***� 0.088 ***� 0.022 ***� 0.018 ***�
TANG 0.201 **� 0.423 *** 0.401 ***� 0.119 ***� 0.388 ***� 0.297 ***�
ROA 0.680 ***� 0.147 *� 0.024 0.752 0.164 0.049
STATE 0.224 0.631 **� 0.133 0.722 ***� 0.270 0.178
STATE・SIZE 0.002 0.024 **� 0.005 0.024 ***� 0.010 0.006
STATE・TANG 0.332 0.018 0.008 0.135 **� 0.017 0.030
FOREIGN 0.056 0.085 0.086 ** 0.056 0.009 0.002
GDPGROWTH 0.004 0.003 0.005 0.042 *** 0.013 0.003
Year dummies Yes Yes Yes Yes Yes Yes
Industry dummies Yes Yes Yes Yes Yes Yes
R squared 0.409 0.412 0.439 0.489 0.415 0.446
Adjusted R sq 0.369 0.373 0.402 0.475 0.399 0.431
S.E. of reg 0.181 0.117 0.090 0.162 0.112 0.082
Obs. 272 272 272 671 670 667
ROA ROA ROA ROA ROA ROA
Constant 0.196 0.337 ** 0.312 ** 0.194 **� 0.064 0.063
SIZE 0.001 0.008 0.007 0.014 ***� 0.002 0.001
GROWTH 0.003 0.003 0.004 0.012 **� 0.017 *** 0.018 ***
INV 0.001 0.001 0.002 0.001 0.001 0.001
TDR 0.125 *** 0.064 * 0.023 0.165 ***� 0.118 *** 0.114 ***
STATE 0.075 0.037 0.093 0.266 **� 0.121 0.144
STATE・SIZE 0.003 0.001 0.003 0.009 ** 0.003 0.004
STATE・GROWTH 0.004 0.001 0.001 0.010 0.015 0.015 *
STATE・INV 0.001 0.002 0.001 0.002 0.001 0.001
FOREIGN 0.044 0.046 0.044 0.052 *** 0.070 *** 0.072 ***
Year dummies Yes Yes Yes Yes Yes Yes
Industry dummies Yes Yes Yes Yes Yes Yes
R squared 0.152 0.082 0.071 0.197 0.115 0.096
Adjusted R sq 0.091 0.016 0.004 0.176 0.091 0.073
S.E. of reg 0.076 0.079 0.080 0.075 0.079 0.080
Obs. 254 254 254 670 669 666
Note: *, **, *** indicate significance at 10%, 5%, 1%, respectively.
5.3�Tests for weak instruments and endogeneity
Next, I estimate the capital structure and profitability equations separately using the
2SLS method, and then estimate the two equations together as a system using 3SLS. Both
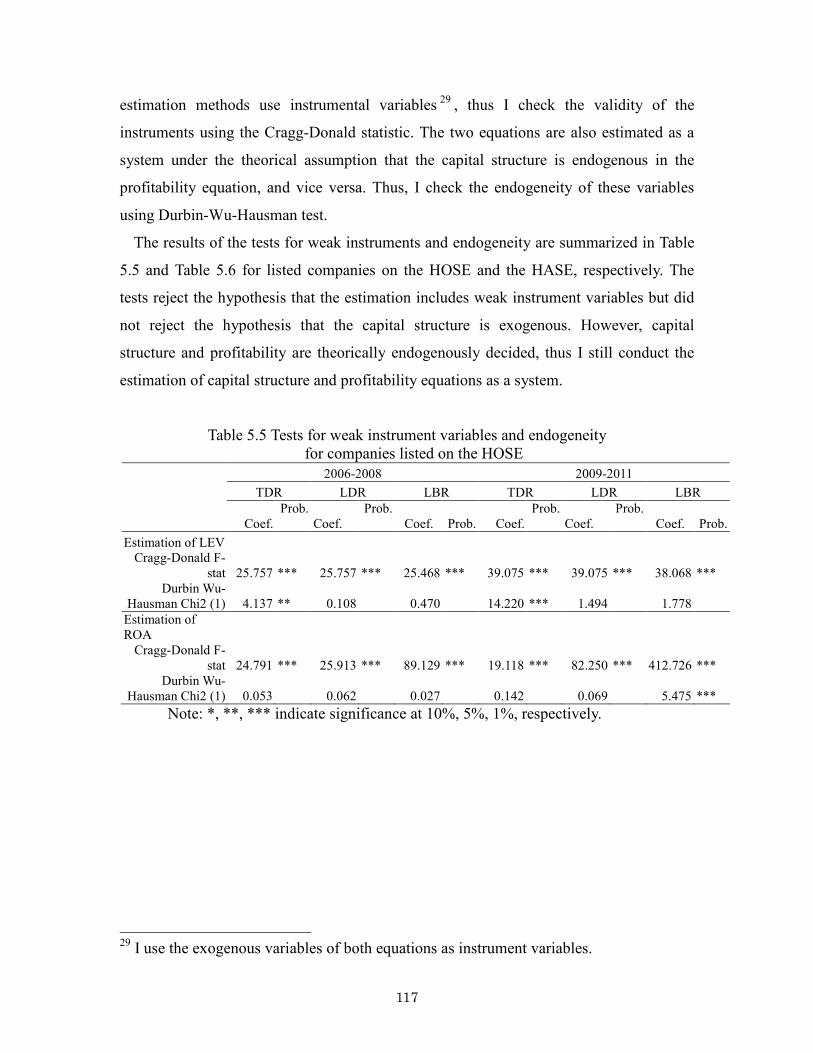
� ����
estimation methods use instrumental variables 29 , thus I check the validity of the
instruments using the Cragg Donald statistic. The two equations are also estimated as a
system under the theorical assumption that the capital structure is endogenous in the
profitability equation, and vice versa. Thus, I check the endogeneity of these variables
using Durbin Wu Hausman test.
The results of the tests for weak instruments and endogeneity are summarized in Table
5.5 and Table 5.6 for listed companies on the HOSE and the HASE, respectively. The
tests reject the hypothesis that the estimation includes weak instrument variables but did
not reject the hypothesis that the capital structure is exogenous. However, capital
structure and profitability are theorically endogenously decided, thus I still conduct the
estimation of capital structure and profitability equations as a system.
Table 5.5 Tests for weak instrument variables and endogeneity for companies listed on the HOSE
2006 2008 2009 2011
TDR LDR LBR TDR LDR LBR
Coef. Prob.
Coef. Prob.
Coef. Prob. Coef. Prob.
Coef. Prob.
Coef. Prob.
Estimation of LEV Cragg Donald F
stat 25.757 *** 25.757 *** 25.468 *** 39.075 *** 39.075 *** 38.068 *** Durbin Wu
Hausman Chi2 (1) 4.137 ** 0.108 0.470 14.220 *** 1.494 1.778
Estimation of ROA
Cragg Donald F stat 24.791 *** 25.913 *** 89.129 *** 19.118 *** 82.250 *** 412.726 ***
Durbin Wu Hausman Chi2 (1) 0.053 0.062 0.027 0.142 0.069 5.475 ***
Note: *, **, *** indicate significance at 10%, 5%, 1%, respectively. �
�
�
�
�
�
�
�
�
�
�
�
�
�
�
���������������������������������������������������29 I use the exogenous variables of both equations as instrument variables.
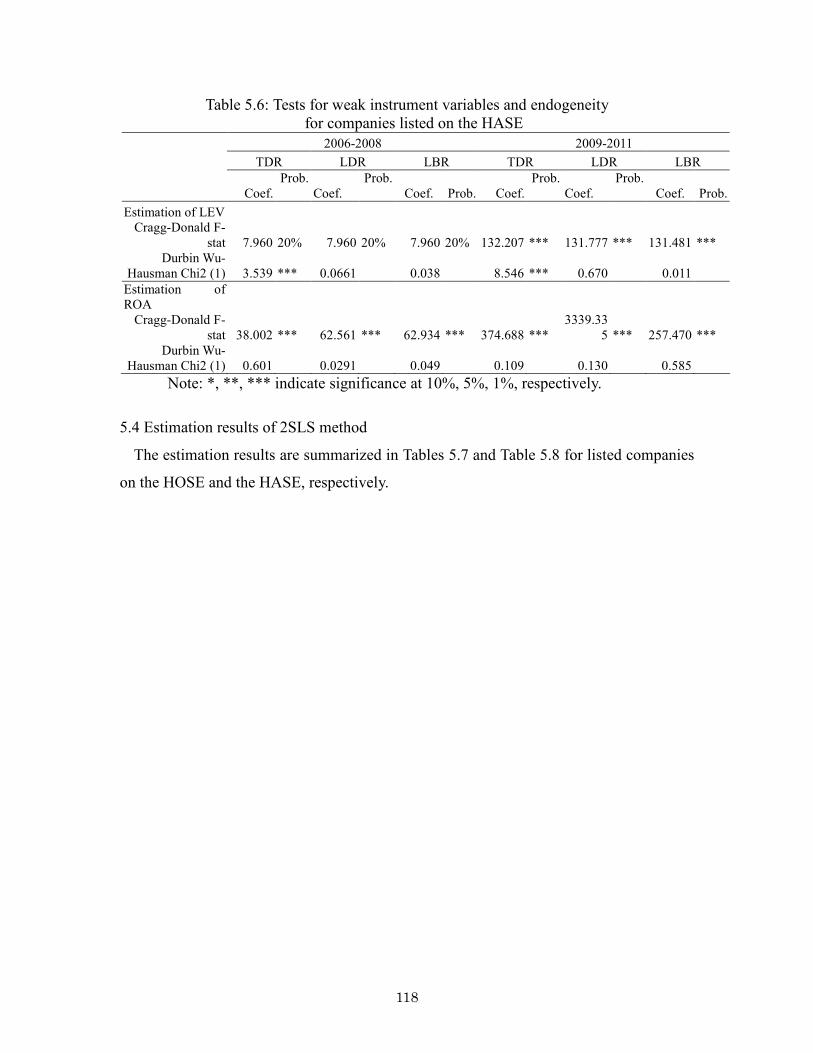
� ���
Table 5.6: Tests for weak instrument variables and endogeneity for companies listed on the HASE
2006 2008 2009 2011
TDR LDR LBR TDR LDR LBR
Coef. Prob.
Coef. Prob.
Coef. Prob. Coef. Prob.
Coef. Prob.
Coef. Prob.
Estimation of LEV Cragg Donald F
stat 7.960 20% 7.960 20% 7.960 20% 132.207 *** 131.777 *** 131.481 *** Durbin Wu
Hausman Chi2 (1) 3.539 *** 0.0661 0.038 8.546 *** 0.670 0.011
Estimation of ROA
Cragg Donald F stat 38.002 *** 62.561 *** 62.934 *** 374.688 ***
3339.335 *** 257.470 ***
Durbin Wu Hausman Chi2 (1) 0.601 0.0291 0.049 0.109 0.130 0.585
Note: *, **, *** indicate significance at 10%, 5%, 1%, respectively. �
�
5.4�Estimation results of 2SLS method
The estimation results are summarized in Tables 5.7 and Table 5.8 for listed companies
on the HOSE and the HASE, respectively.
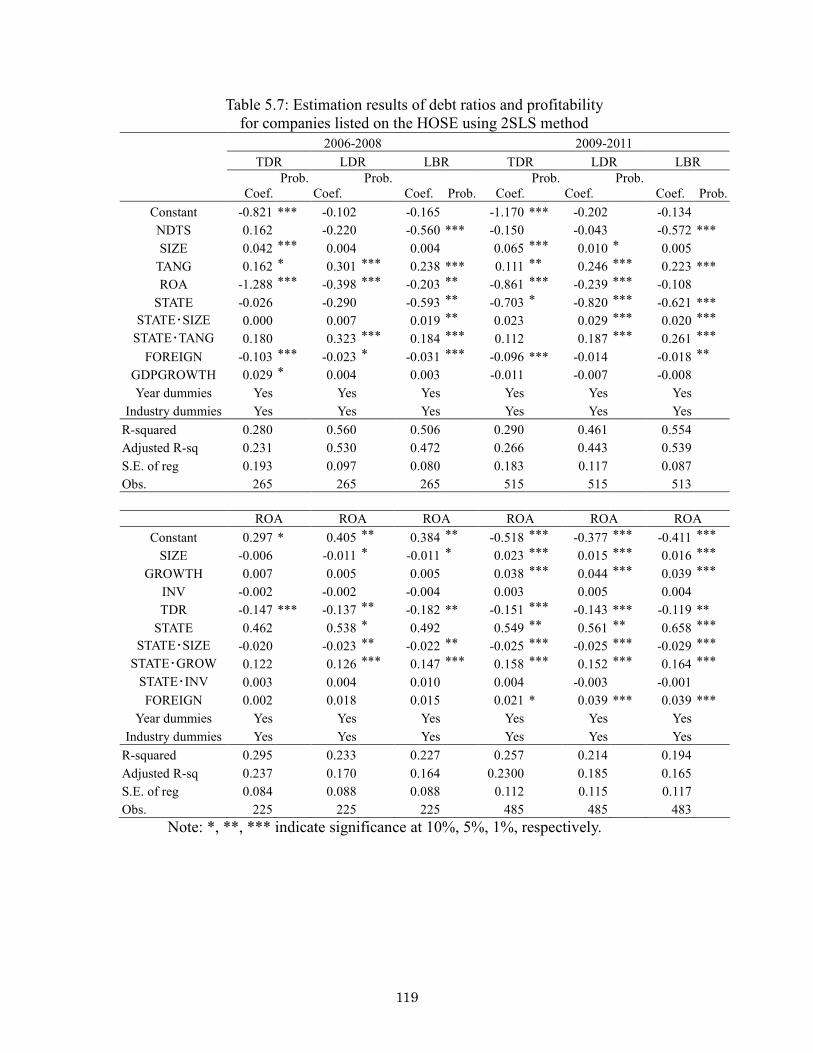
� ���
Table 5.7: Estimation results of debt ratios and profitability for companies listed on the HOSE using 2SLS method
2006 2008 2009 2011
TDR LDR LBR TDR LDR LBR
Coef. Prob.
Coef. Prob.
Coef. Prob. Coef. Prob.
Coef. Prob.
Coef. Prob.
Constant 0.821 *** 0.102 0.165 1.170 *** 0.202 0.134
NDTS 0.162 0.220 0.560 *** 0.150 0.043 0.572 ***
SIZE 0.042 *** 0.004 0.004 0.065 *** 0.010 * 0.005
TANG 0.162 * 0.301 *** 0.238 *** 0.111 ** 0.246 *** 0.223 ***
ROA 1.288 *** 0.398 *** 0.203 ** 0.861 *** 0.239 *** 0.108
STATE 0.026 0.290 0.593 ** 0.703 * 0.820 *** 0.621 ***
STATE・SIZE 0.000 0.007 0.019 ** 0.023 0.029 *** 0.020 ***
STATE・TANG 0.180 0.323 *** 0.184 *** 0.112 0.187 *** 0.261 ***
FOREIGN 0.103 *** 0.023 * 0.031 *** 0.096 *** 0.014 0.018 **
GDPGROWTH 0.029 * 0.004 0.003 0.011 0.007 0.008
Year dummies Yes Yes Yes Yes Yes Yes
Industry dummies Yes Yes Yes Yes Yes Yes
R squared 0.280 0.560 0.506 0.290 0.461 0.554
Adjusted R sq 0.231 0.530 0.472 0.266 0.443 0.539
S.E. of reg 0.193 0.097 0.080 0.183 0.117 0.087
Obs. 265 265 265 515 515 513
ROA ROA ROA ROA ROA ROA
Constant 0.297 * 0.405 ** 0.384 ** 0.518 *** 0.377 *** 0.411 ***
SIZE 0.006 0.011 * 0.011 * 0.023 *** 0.015 *** 0.016 ***
GROWTH 0.007 0.005 0.005 0.038 *** 0.044 *** 0.039 ***
INV 0.002 0.002 0.004 0.003 0.005 0.004
TDR 0.147 *** 0.137 ** 0.182 ** 0.151 *** 0.143 *** 0.119 **
STATE 0.462 0.538 * 0.492 0.549 ** 0.561 ** 0.658 ***
STATE・SIZE 0.020 0.023 ** 0.022 ** 0.025 *** 0.025 *** 0.029 ***
STATE・GROW 0.122 0.126 *** 0.147 *** 0.158 *** 0.152 *** 0.164 ***
STATE・INV 0.003 0.004 0.010 0.004 0.003 0.001
FOREIGN 0.002 0.018 0.015 0.021 * 0.039 *** 0.039 ***
Year dummies Yes Yes Yes Yes Yes Yes
Industry dummies Yes Yes Yes Yes Yes Yes
R squared 0.295 0.233 0.227 0.257 0.214 0.194
Adjusted R sq 0.237 0.170 0.164 0.2300 0.185 0.165
S.E. of reg 0.084 0.088 0.088 0.112 0.115 0.117
Obs. 225 225 225 485 485 483
Note: *, **, *** indicate significance at 10%, 5%, 1%, respectively.
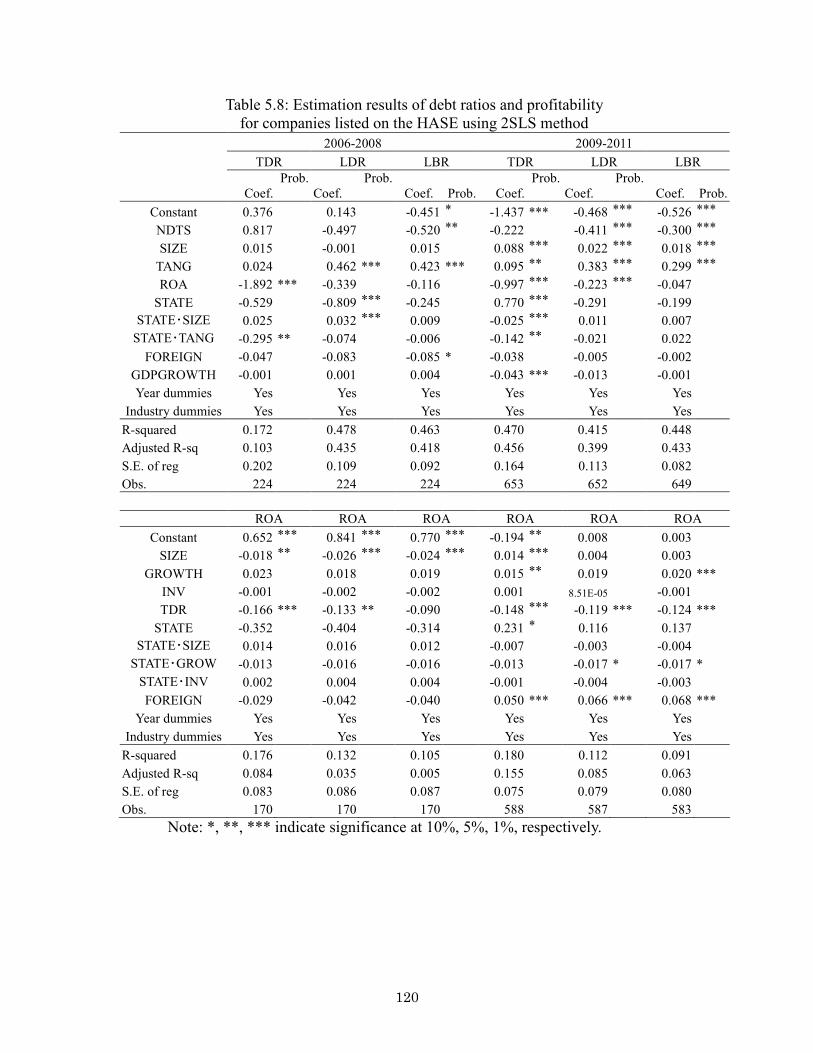
� ����
Table 5.8: Estimation results of debt ratios and profitability for companies listed on the HASE using 2SLS method
2006 2008 2009 2011
TDR LDR LBR TDR LDR LBR
Coef. Prob.
Coef. Prob.
Coef. Prob. Coef. Prob.
Coef. Prob.
Coef. Prob.
Constant 0.376 0.143 0.451 * 1.437 *** 0.468 *** 0.526 ***
NDTS 0.817 0.497 0.520 ** 0.222 0.411 *** 0.300 ***
SIZE 0.015 0.001 0.015 0.088 *** 0.022 *** 0.018 ***
TANG 0.024 0.462 *** 0.423 *** 0.095 ** 0.383 *** 0.299 ***
ROA 1.892 *** 0.339 0.116 0.997 *** 0.223 *** 0.047
STATE 0.529 0.809 *** 0.245 0.770 *** 0.291 0.199
STATE・SIZE 0.025 0.032 *** 0.009 0.025 *** 0.011 0.007
STATE・TANG 0.295 ** 0.074 0.006 0.142 ** 0.021 0.022
FOREIGN 0.047 0.083 0.085 * 0.038 0.005 0.002
GDPGROWTH 0.001 0.001 0.004 0.043 *** 0.013 0.001
Year dummies Yes Yes Yes Yes Yes Yes
Industry dummies Yes Yes Yes Yes Yes Yes
R squared 0.172 0.478 0.463 0.470 0.415 0.448
Adjusted R sq 0.103 0.435 0.418 0.456 0.399 0.433
S.E. of reg 0.202 0.109 0.092 0.164 0.113 0.082
Obs. 224 224 224 653 652 649
ROA ROA ROA ROA ROA ROA
Constant 0.652 *** 0.841 *** 0.770 *** 0.194 ** 0.008 0.003
SIZE 0.018 ** 0.026 *** 0.024 *** 0.014 *** 0.004 0.003
GROWTH 0.023 0.018 0.019 0.015 ** 0.019 0.020 ***
INV 0.001 0.002 0.002 0.001 8.51E 05 0.001
TDR 0.166 *** 0.133 ** 0.090 0.148 *** 0.119 *** 0.124 ***
STATE 0.352 0.404 0.314 0.231 * 0.116 0.137
STATE・SIZE 0.014 0.016 0.012 0.007 0.003 0.004
STATE・GROW 0.013 0.016 0.016 0.013 0.017 * 0.017 *
STATE・INV 0.002 0.004 0.004 0.001 0.004 0.003
FOREIGN 0.029 0.042 0.040 0.050 *** 0.066 *** 0.068 ***
Year dummies Yes Yes Yes Yes Yes Yes
Industry dummies Yes Yes Yes Yes Yes Yes
R squared 0.176 0.132 0.105 0.180 0.112 0.091
Adjusted R sq 0.084 0.035 0.005 0.155 0.085 0.063
S.E. of reg 0.083 0.086 0.087 0.075 0.079 0.080
Obs. 170 170 170 588 587 583
Note: *, **, *** indicate significance at 10%, 5%, 1%, respectively.
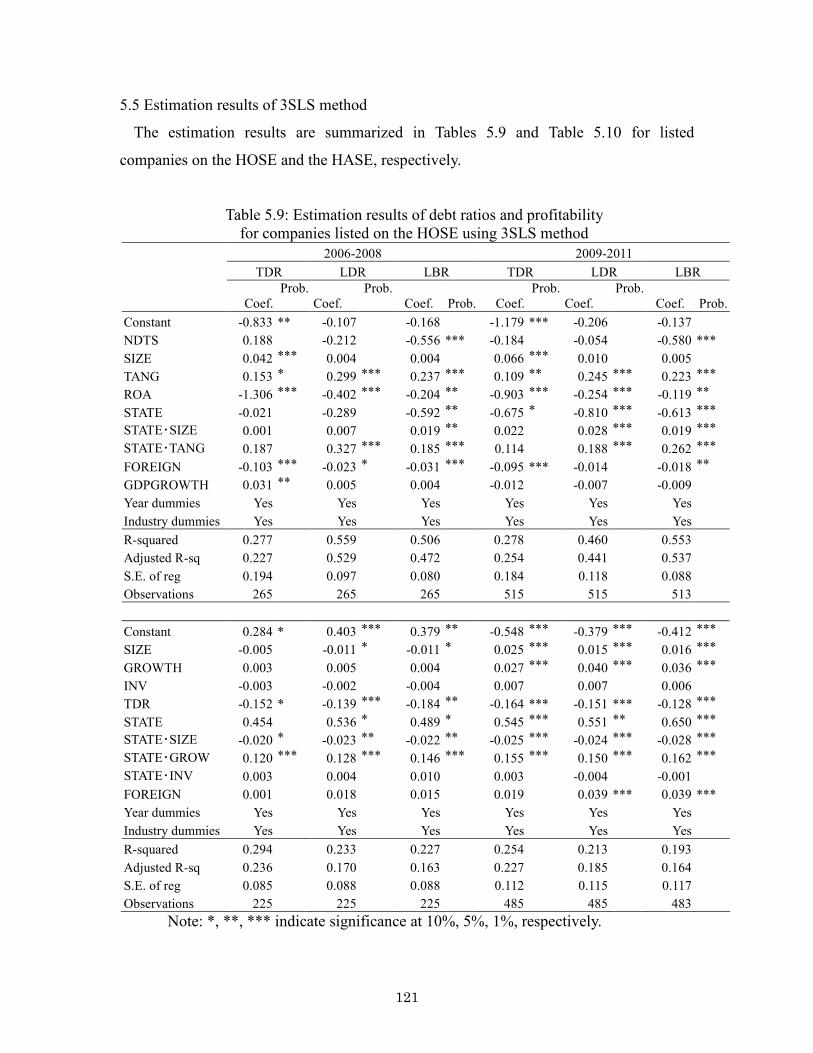
� ����
5.5�Estimation results of 3SLS method
The estimation results are summarized in Tables 5.9 and Table 5.10 for listed
companies on the HOSE and the HASE, respectively.
Table 5.9: Estimation results of debt ratios and profitability for companies listed on the HOSE using 3SLS method
2006 2008 2009 2011
TDR LDR LBR TDR LDR LBR
Coef. Prob.
Coef. Prob.
Coef. Prob. Coef. Prob.
Coef. Prob.
Coef. Prob.
Constant 0.833 ** 0.107 0.168 1.179 *** 0.206 0.137
NDTS 0.188 0.212 0.556 *** 0.184 0.054 0.580 ***
SIZE 0.042 *** 0.004 0.004 0.066 *** 0.010 0.005
TANG 0.153 * 0.299 *** 0.237 *** 0.109 ** 0.245 *** 0.223 ***
ROA 1.306 *** 0.402 *** 0.204 ** 0.903 *** 0.254 *** 0.119 **
STATE 0.021 0.289 0.592 ** 0.675 * 0.810 *** 0.613 ***
STATE・SIZE 0.001 0.007 0.019 ** 0.022 0.028 *** 0.019 ***
STATE・TANG 0.187 0.327 *** 0.185 *** 0.114 0.188 *** 0.262 ***
FOREIGN 0.103 *** 0.023 * 0.031 *** 0.095 *** 0.014 0.018 **
GDPGROWTH 0.031 ** 0.005 0.004 0.012 0.007 0.009
Year dummies Yes Yes Yes Yes Yes Yes
Industry dummies Yes Yes Yes Yes Yes Yes
R squared 0.277 0.559 0.506 0.278 0.460 0.553
Adjusted R sq 0.227 0.529 0.472 0.254 0.441 0.537
S.E. of reg 0.194 0.097 0.080 0.184 0.118 0.088
Observations 265 265 265 515 515 513
Constant 0.284 * 0.403 *** 0.379 ** 0.548 *** 0.379 *** 0.412 ***
SIZE 0.005 0.011 * 0.011 * 0.025 *** 0.015 *** 0.016 ***
GROWTH 0.003 0.005 0.004 0.027 *** 0.040 *** 0.036 ***
INV 0.003 0.002 0.004 0.007 0.007 0.006
TDR 0.152 * 0.139 *** 0.184 ** 0.164 *** 0.151 *** 0.128 ***
STATE 0.454 0.536 * 0.489 * 0.545 *** 0.551 ** 0.650 ***
STATE・SIZE 0.020 * 0.023 ** 0.022 ** 0.025 *** 0.024 *** 0.028 ***
STATE・GROW 0.120 *** 0.128 *** 0.146 *** 0.155 *** 0.150 *** 0.162 ***
STATE・INV 0.003 0.004 0.010 0.003 0.004 0.001
FOREIGN 0.001 0.018 0.015 0.019 0.039 *** 0.039 ***
Year dummies Yes Yes Yes Yes Yes Yes
Industry dummies Yes Yes Yes Yes Yes Yes
R squared 0.294 0.233 0.227 0.254 0.213 0.193
Adjusted R sq 0.236 0.170 0.163 0.227 0.185 0.164
S.E. of reg 0.085 0.088 0.088 0.112 0.115 0.117
Observations 225 225 225 485 485 483
Note: *, **, *** indicate significance at 10%, 5%, 1%, respectively.
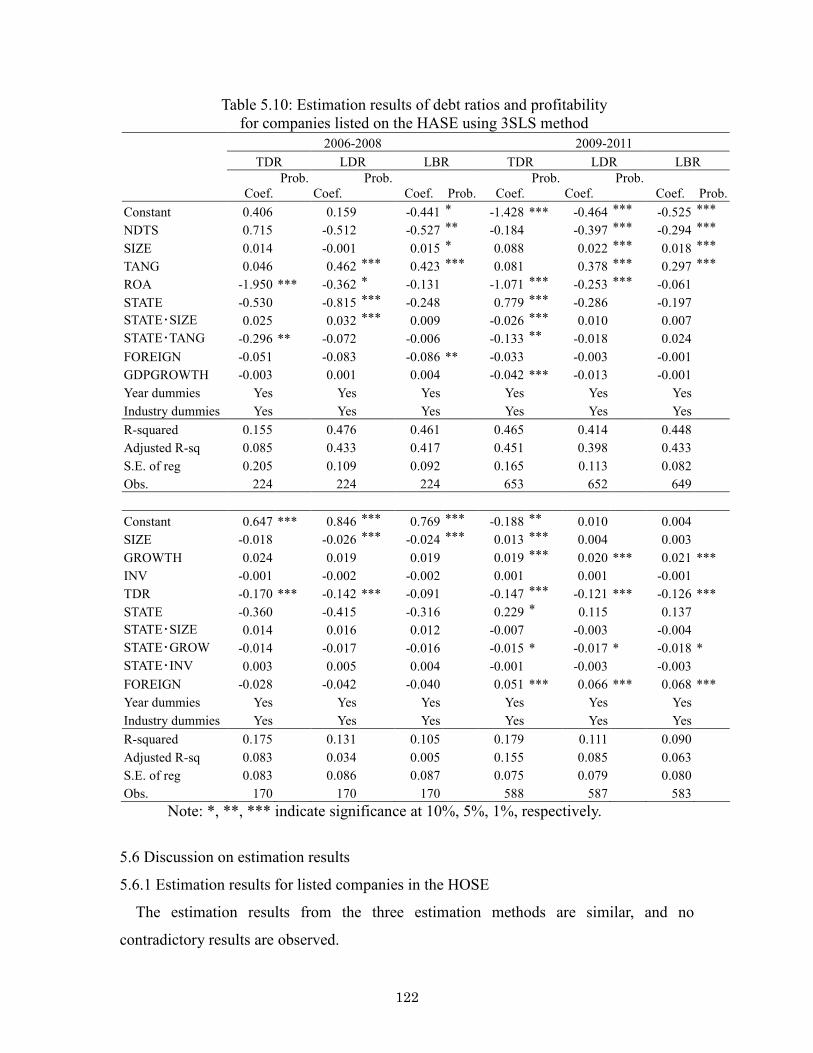
� ����
Table 5.10: Estimation results of debt ratios and profitability for companies listed on the HASE using 3SLS method
2006 2008 2009 2011
TDR LDR LBR TDR LDR LBR
Coef. Prob.
Coef. Prob.
Coef. Prob. Coef. Prob.
Coef. Prob.
Coef. Prob.
Constant 0.406 0.159 0.441 * 1.428 *** 0.464 *** 0.525 ***
NDTS 0.715 0.512 0.527 ** 0.184 0.397 *** 0.294 ***
SIZE 0.014 0.001 0.015 * 0.088 0.022 *** 0.018 ***
TANG 0.046 0.462 *** 0.423 *** 0.081 0.378 *** 0.297 ***
ROA 1.950 *** 0.362 * 0.131 1.071 *** 0.253 *** 0.061
STATE 0.530 0.815 *** 0.248 0.779 *** 0.286 0.197
STATE・SIZE 0.025 0.032 *** 0.009 0.026 *** 0.010 0.007
STATE・TANG 0.296 ** 0.072 0.006 0.133 ** 0.018 0.024
FOREIGN 0.051 0.083 0.086 ** 0.033 0.003 0.001
GDPGROWTH 0.003 0.001 0.004 0.042 *** 0.013 0.001
Year dummies Yes Yes Yes Yes Yes Yes
Industry dummies Yes Yes Yes Yes Yes Yes
R squared 0.155 0.476 0.461 0.465 0.414 0.448
Adjusted R sq 0.085 0.433 0.417 0.451 0.398 0.433
S.E. of reg 0.205 0.109 0.092 0.165 0.113 0.082
Obs. 224 224 224 653 652 649
Constant 0.647 *** 0.846 *** 0.769 *** 0.188 ** 0.010 0.004
SIZE 0.018 0.026 *** 0.024 *** 0.013 *** 0.004 0.003
GROWTH 0.024 0.019 0.019 0.019 *** 0.020 *** 0.021 ***
INV 0.001 0.002 0.002 0.001 0.001 0.001
TDR 0.170 *** 0.142 *** 0.091 0.147 *** 0.121 *** 0.126 ***
STATE 0.360 0.415 0.316 0.229 * 0.115 0.137
STATE・SIZE 0.014 0.016 0.012 0.007 0.003 0.004
STATE・GROW 0.014 0.017 0.016 0.015 * 0.017 * 0.018 *
STATE・INV 0.003 0.005 0.004 0.001 0.003 0.003
FOREIGN 0.028 0.042 0.040 0.051 *** 0.066 *** 0.068 ***
Year dummies Yes Yes Yes Yes Yes Yes
Industry dummies Yes Yes Yes Yes Yes Yes
R squared 0.175 0.131 0.105 0.179 0.111 0.090
Adjusted R sq 0.083 0.034 0.005 0.155 0.085 0.063
S.E. of reg 0.083 0.086 0.087 0.075 0.079 0.080
Obs. 170 170 170 588 587 583
Note: *, **, *** indicate significance at 10%, 5%, 1%, respectively.
5.6�Discussion on estimation results
5.6.1 Estimation results for listed companies in the HOSE
The estimation results from the three estimation methods are similar, and no
contradictory results are observed.
� ����
(a)�The estimation results of capital structure equation
Regarding the determinants of capital structure, there is no coefficient that was
significantly opposite to the hypotheses. The capital structures of companies listed on the
HOSE and HASE are relatively better matched to the features of standardized corporate
financing theories; this explains the capital structure of developed countries well.
In the periods before and after the Lehman shock, the coefficients of firm size and
fixed assets ratio were significantly positive, and the coefficients of non debt tax shield
and return on assets were significantly negative, as theoretically expected. An interesting
finding is that the significance of the coefficients in the period after the boom was slightly
higher than that in the previous period.
Differences between state controlled and other companies were observed in the impact
of state ownership on capital structures. The coefficient of the state controlled dummy is
significantly negative in the periods before and after the Lehman shock. The coefficients
of the cross terms of the state controlled dummy and firm size or fixed assets are
significantly positive in both periods. This indicates that given the same conditions of
business stability and tangibility, state controlled companies can raise external funds
more easily than other companies. This may be because the state implicitly secures these
companies, which have strong ties with state owned banks.
Regarding the impact of foreign ownership, companies with more than 20 per cent
foreign ownership tend to have lower debt ratios than other companies in both the 2006–
2008 period and the 2009–2011 period.
(b)�The estimation results of profitability equation
As for the determinants of profitability, in both periods, an increase in debt ratios lead
to a decrease in profitability in the estimation of all debt ratios. This proves the
hypothesis of the weak mornitoring of banks and the weak corporate governance of listed
companies.
The coefficients of companies’ size are significantly negative during the 2006–2008
period but are significantly positive during the 2009–2011 period. This implies that in the
boom period, small sized companies were more profitable and that during the recession,
� ����
large sized firms were more stable.
State controlled companies had higher profitability than other companies. The
coefficient of the state controlled dummy and the coefficients of the cross terms of the
state controlled dummy and growth rates are significantly positive, while the coefficients
of the cross terms of the state controlled dummy and business scale are significantly
negative. This implies that apart from companies’ size and growth, state controlled
companies have structural superiority in term of profitability. That state controlled
companies can use advantageous loans from state controlled banks is one possible
reason.30 State controlled companies are reputed to enjoy easy access to low interest
loans from state owned banks. My data indicate that the average interest rates of state
controlled companies (i.e., interest payments divided by total debt) is lower than those of
other companies.
A trend of higher profitability for foreign affiliated companies was observed during the
2009–2011 period, while during the 2006–2008 period, the profitability of these
companies was the same as that of other companies. This implies that in the boom period,
other companies performed very well and foreign companies were not conspicuous.
However, during the recession, it became obvious that foreign affiliated companies had
better production technology and management.
5.6.2 Estimation results for listed companies in the HASE
(a) The estimation results of capital structure equation
No difference in the determinants of capital structure was observed between the two
periods. However, the estimation results for the HASE companies conform less closely to
theoretical expectations than those of the HOSE companies. The coefficients of
companies’ business scale are significantly positive only in the period after the shock.
Fixed assets ratio are significantly positive for the estimation of long term debt ratios and
long term bank loan ratios. The coefficients of return on assets are significantly negative
for the estimation of total debt but are not significant for the estimation of long term debt
ratios and long term bank loan ratios. These imply that the procurement of short term
���������������������������������������������������30 This paper considers the differences among industries using industrial dummy variables.
� ����
debt funds depends on cash flow while the procurement of long term debt funds depends
heavily on collateral.
No difference in the impact of state control on debt ratios for the HASE samples
between the two periods was observed.
Companies with more than 20 per cent of foreign ownership had lower debt ratios than
other companies in terms of long term bank borrowing.
(b)�The estimation results of profitability equation
Similiar to the results observed for the HOSE, in the estimations of all debt ratios in
both periods, an increase in debt ratios leads to a decrease in profitability. This proves the
hypothesis of the weak mornitoring of banks and the weak corporate governance of listed
companies.
The coefficients of companies’ size are significantly negative during the boom period
but significantly positive during the recession period. This implies that during the boom
period, small companies were more profitable, but during the recession, large firms were
more stable.
Regarding the profitability of state controlled companies, no difference between the
two periods was observed.
A trend of higher profitability for foreign affiliated companies was observed during the
2009–2011 period, while during the 2006 2008 period, the profitability of foreign
affiliated companies was the same as that of other companies. This implies that during the
boom period, other companies performed very well and that foreign affiliated companies
were not conspicuous. However, during the recession, it is obvious that foreign affiliated
companies had better production technology and management techniques.
5.6.3 Discussion
The estimation results revealed that contrary to what was suggested by the analyses of
Vietnamese small and medium sized enterprises (SMEs) in Nguyen (2006) and Biger et
al. (2008), the capital structures of companies listed on the HOSE and the HASE are
relatively well matched to the features of standardized corporate financing theory. In
addition, in both the boom period of 2006–2008 and the 2009 2011 period after the boom,

� ����
the companies listed in the HOSE, which pioneered many institutional reforms in
Vietnam, conform more closely to theoretical expectations than their counterparts listed
in the HASE. While these companies were influenced by excessive borrowing under
weak corporate governance and weak creditor mornitoring during both the boom period
of 2006–2008 and the 2009–2011 period after the boom, Nguyen (2006) and Biger et al.
(2008) found that small and medium sized companies have low levels of information
disclosure and significant information asymmetry between themselves and their external
creditors and investors, which significantly distort their fund procurement structures. The
listed companies analyzed in this paper could make use of favorable institutional
environments conducive to economically rational fund procurement behaviors.
However, the estimation results show that the market environment surrounding listed
Vietnamese companies still has many problems. First, while the procurement of short
term debt funds depends on cash flow, the procurement of long term debt funds depends
heavily on collateral. In addition, a comparison of the two stock exchanges reveals that
companies listed on the HASE face stronger constraints on their use of internal funds
than those listed on the HOSE. These findings suggest that information asymmetry,
accompanied by the long term funds loaned by external creditors to companies, needs to
be improved. On the other hand, companies listed in both stock exchanges borrowed
excessively for investments that were wasteful because of weak corporate governance
during the boom period; these companies faced excessive debt and underinvestment
problems during the recession periods. Companies with low profitability or with losses
may have higher debt ratios because they have to compensate for their losses.
Second, it has been observed that state controlled companies on the HOSE and the
HASE are less affected by their ability to provide collateral in the procurement of
external funds than other companies are. In addition, state controlled companies listed on
the HOSE have superior profit making ability compared to other companies. It is often
pointed that there are informal links between state controlled companies and state owned
banks and that the lend use rights of state controlled companies are seriously
underestimated (World Bank, 2009). These facts show that, as with other economies in
transition, Vietnam’s state owned companies have corporate governance issues.
On the other hand, the good profitability of foreign affiliated companies was obvious

� ����
during the recession period, while it was inconspicuous in the boom period because the
profitability of other companies was also good. Foreign affiliated companies tend to
excel in management skills and production technology, and they disclose a great deal of
information, which grants them a high degree of market confidence. They therefore have
an advantage in the procurement of funds in terms of capital investment and profitability.
These findings support further reforms to promote foreign participation in the
development of Vietnam’s corporate sector. This should include not only foreign
participation in companies but also foreign penetration in the banking sector.
5.7 Conclusion
As the Vietnamese government promotes the transition to a market economy by
continually implementing institutional reforms under the Doi moi policy, many issues are
yet to be resolved. This chapter investigated the extent to which companies listed on the
HOSE and the HASE, whose listing is regarded as proof of adherence to all of Vietnam’s
corporate reforms, have displayed corporate behaviors that conform to a market economy
by simultaneously estimating the debt ratios and profitability of the listed companies
using 3SLS. The samples used are unbalanced panel data from 435 companies listed on
the two stock exchanges from 2006 to 2011.
The estimation results revealed the following: unlike the analyses of Vietnamese SMEs
in Nguyen (2006) and Biger et al. (2008), the financing structures of non state controlled
companies listed on the HOSE and the HASE have features that conform well to
economic theory and a market economy. While they were influenced by excessive
borrowing under weak corporate governance during the boom period of 2006–2008, they
were normalized and better fitted to rationally expected financing behaviors during the
2009–2011 post boom period. However, while the procurement of short term debt funds
depends on cash flow, the procurement of long term debt funds depends heavily on
collateral. These companies are now facing excessive debts that limit their fundraising
capacities. On the other hand, in both the HOSE and the HASE, state controlled
companies enjoy an advantageous credit rating position and are able to procure funds
with relative ease, while in the HOSE, some state controlled companies enjoy superior
profit making ability to that of other companies. As foreign affiliated companies tend to

� ���
excel in management skill and production technology and disclose information widely,
they have gained the strong confidence of the market and fund procurement advantage in
terms of capital investment and profitability. The study also found that companies listed
on the HASE face stronger constraints on the use of internal funds than those listed on the
HOSE.
Three policy implications can be drawn from these results. First, this chapter showed
that the market environment surrounding Vietnamese companies still has many problems.
The estimation results suggest that even for companies listed on the HOSE, the
magnitude of collateral is still the most important determining factor in the procurement
of long term funds and that the information asymmetry between external creditors and
companies needs to be improved, as does creditor protection. Internal funds are clearly
superior to external funds for companies listed on the HASE; this indicates that there is
further room for institutional improvement.
Second, this chapter showed that, as with other economies in transition, Vietnam’s
state owned companies have corporate governance issues. Even among the most
institutionally advanced firms, state controlled companies have advantages in terms of
external debt fund and profitability, which strongly suggests that there is a need for
further institutional reforms. These reforms should include the development of a system
that ensures independent corporate governance and transparency of information. They
should also include the increased privatization of state controlled companies and the
banking sector and should provide a strong market presence for the state controlled banks.
Third, foreign affiliated companies tend to excel in management skills and production
technology and they disclose a great deal of information, which, in turn, gains them a
high degree of confidence from the market. They therefore have an advantage in
procuring funds in the form of capital investment and profitability. These findings support
further reforms to promote foreign participation in the development of Vietnam’s
corporate sector. This should include not only foreign participation in companies but also
foreign penetration in the banking sector.�
�
�
�
�
�
� ���
�
�� �����
-���� ��������� "������������ ��"��$��
���� ��.�������������� �������� �
This chapter investigates the influence of capital structure on investment activities and
growth opportunities of listed companies in Vietnam where state owned and state
controlled banks lend more than one half of domestic demand, and determines the
variation in influence between state controlled companies and other listed companies.
Estimation analysis uses panel data covering the 6 year period of 2006–2011 by three
estimation methods of OLS, 2SLS and 3SLS to the model of capital structure, investment
and growth opportunities.
The estimation results reveal two major findings. First, in general, there is an over
investment problem among listed companies in Vietnam and debt financing minimizes
this problem. Second, the state controlled companies face a soft budget constraint
problem, which is common in transition economies.
These results imply that state owned banks in Vietnam seem to impose fewer
restrictions or lower levels of monitoring on loans to state controlled companies.
Therefore, further reform in the banking sector and in state controlled companies and
further disclosure of corporate information are needed to resolve the opaque collusion
between state controlled companies and state owned banks and to protect outside
creditors.
6.1 Correlation coefficients of explanatory variables
This model uses a sample of companies listed on the HOSE. Table 6.1, Table 6.2 and
Table 6.3 display the correlation coefficients of the explanatory variables of the three
estimation equations of capital structure, investment and growth opportunities. No
variable is highly correlated with other explanatory variables in each estimation equation.

� ����
Table 6.1 Correlation coefficients of explanatory variables of capital structure equation
NDTS� SIZE TANG ROA STATE FOR
NDTS � SIZE ��'�&# �
TANG �'#&# �'�$$ � ROA �'��� ��'�"� �'��� �
STATE �'�"� �'�"& �'�#" �'�$� � FOR ��'��� �'"�� �'�#� �'��� ��'��& �
Table 6.2 Correlation coefficients of explanatory variables of investment equation
SIZE ROA TDR LDR LBR STATE FOR
SIZE 1
ROA ��'��� �
TDR �'��� ��'"�� �
LDR �'"$& ��'�&$ �'#�� �
LBR �'�&� ��'��# �'"$� �'&�� �
STATE �'�#$ �'�$" �'�$� �'�$� �'��& �
FOR �'"�# �'��# ��'��� ��'�"� ��'�#� ��'�&� 1
Table 6.3 Correlation coefficient of explanatory variables of growth opportunity equation
CF Q TDR LDR LBR STATE STATE
CF 1
Q �'�&� �
TDR ��'��� ��'�$� �
LDR ��'��� ��'��� �'#�& �
LBR ��'��� ��'��� �'"�& �'&&� �
STATE ��'��� ��'��" �'�&� �'�$# �'��� �
FOR20 ��'��� �'�&& ��'��� ��'�"$ ��'�#& ��'�&� 1
6.2�Estimation results of OLS method
First, the capital structure equation, investment equation and growth opportunity
equation are estimated separately by using the OLS method. The estimation results of the
OLS method are summarized in Tables 6.4.
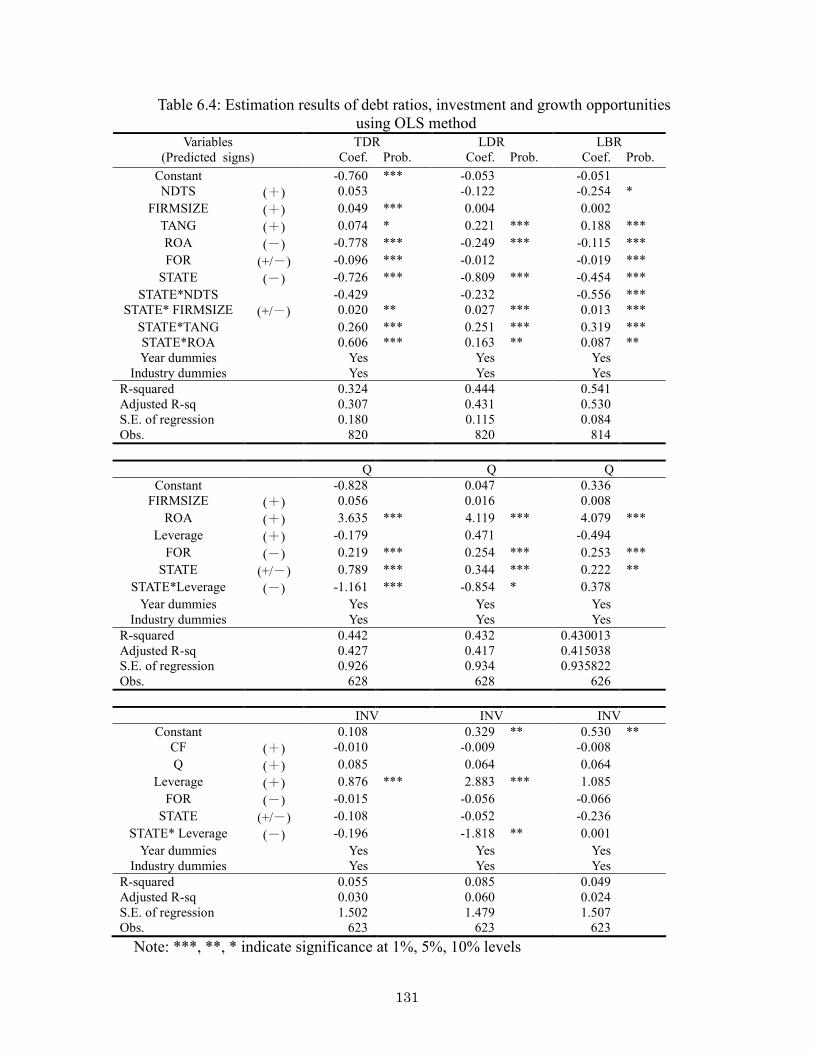
� ����
Table 6.4: Estimation results of debt ratios, investment and growth opportunities using OLS method TDR LDR LBR Variables
(Predicted signs) Coef. Prob. Coef. Prob. Coef. Prob.
Constant 0.760 *** 0.053 0.051 NDTS (+) 0.053 0.122 0.254 *
FIRMSIZE (+) 0.049 *** 0.004 0.002
TANG (+) 0.074 * 0.221 *** 0.188 ***
ROA (-) 0.778 *** 0.249 *** 0.115 ***
FOR (+/-) 0.096 *** 0.012 0.019 ***
STATE (-) 0.726 *** 0.809 *** 0.454 ***
STATE*NDTS 0.429 0.232 0.556 *** STATE* FIRMSIZE (+/-) 0.020 ** 0.027 *** 0.013 ***
STATE*TANG 0.260 *** 0.251 *** 0.319 *** STATE*ROA 0.606 *** 0.163 ** 0.087 ** Year dummies Yes Yes Yes
Industry dummies Yes Yes Yes
R squared 0.324 0.444 0.541 Adjusted R sq 0.307 0.431 0.530 S.E. of regression 0.180 0.115 0.084 Obs. 820 820 814
Q Q Q
Constant 0.828 0.047 0.336 FIRMSIZE (+) 0.056 0.016 0.008
ROA (+) 3.635 *** 4.119 *** 4.079 ***
Leverage (+) 0.179 0.471 0.494
FOR (-) 0.219 *** 0.254 *** 0.253 ***
STATE (+/-) 0.789 *** 0.344 *** 0.222 **
STATE*Leverage (-) 1.161 *** 0.854 * 0.378
Year dummies Yes Yes Yes Industry dummies Yes Yes Yes
R squared 0.442 0.432 0.430013 Adjusted R sq 0.427 0.417 0.415038 S.E. of regression 0.926 0.934 0.935822 Obs. 628 628 626
INV INV INV
Constant 0.108 0.329 ** 0.530 ** CF (+) 0.010 0.009 0.008
Q (+) 0.085 0.064 0.064
Leverage (+) 0.876 *** 2.883 *** 1.085
FOR (-) 0.015 0.056 0.066
STATE (+/-) 0.108 0.052 0.236
STATE* Leverage (-) 0.196 1.818 ** 0.001
Year dummies Yes Yes Yes Industry dummies Yes Yes Yes
R squared 0.055 0.085 0.049 Adjusted R sq 0.030 0.060 0.024 S.E. of regression 1.502 1.479 1.507 Obs. 623 623 623
Note: ***, **, * indicate significance at 1%, 5%, 10% levels
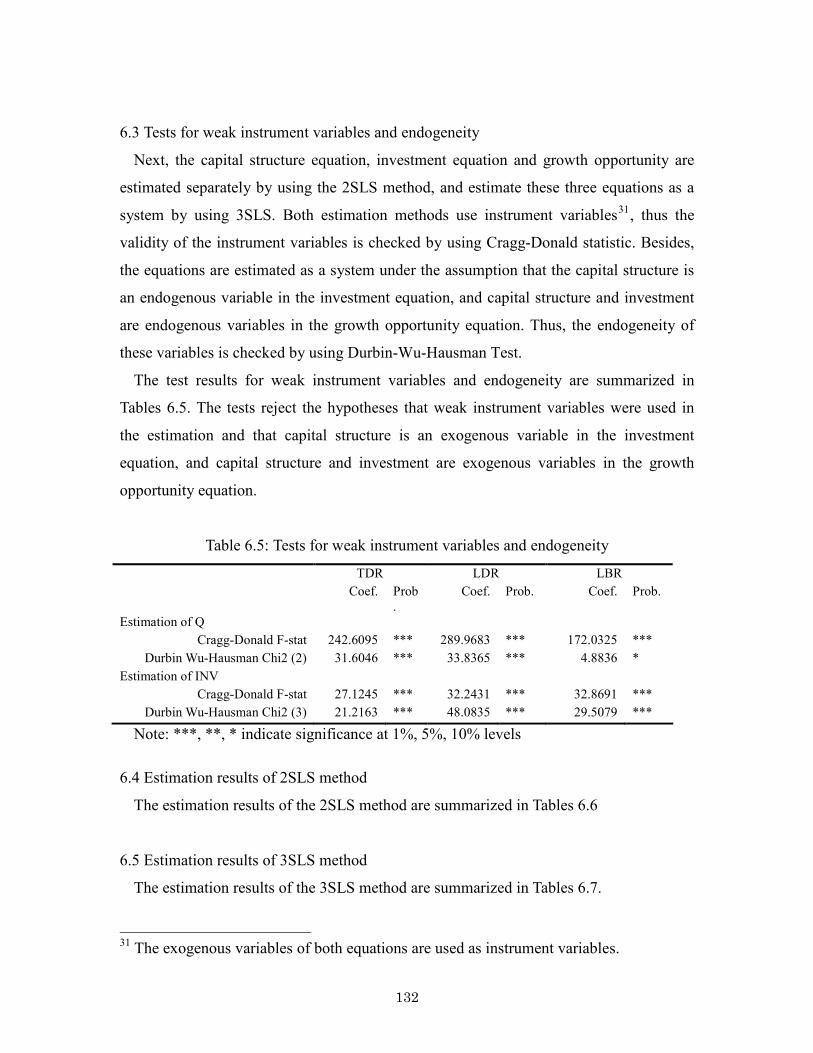
� ����
6.3�Tests for weak instrument variables and endogeneity
Next, the capital structure equation, investment equation and growth opportunity are
estimated separately by using the 2SLS method, and estimate these three equations as a
system by using 3SLS. Both estimation methods use instrument variables31, thus the
validity of the instrument variables is checked by using Cragg Donald statistic. Besides,
the equations are estimated as a system under the assumption that the capital structure is
an endogenous variable in the investment equation, and capital structure and investment
are endogenous variables in the growth opportunity equation. Thus, the endogeneity of
these variables is checked by using Durbin Wu Hausman Test.
The test results for weak instrument variables and endogeneity are summarized in
Tables 6.5. The tests reject the hypotheses that weak instrument variables were used in
the estimation and that capital structure is an exogenous variable in the investment
equation, and capital structure and investment are exogenous variables in the growth
opportunity equation.
Table 6.5: Tests for weak instrument variables and endogeneity
TDR LDR LBR
Coef. Prob.
Coef. Prob.
Coef. Prob.
Estimation of Q
Cragg Donald F stat 242.6095 *** 289.9683 *** 172.0325 ***
Durbin Wu Hausman Chi2 (2) 31.6046 *** 33.8365 *** 4.8836 *
Estimation of INV
Cragg Donald F stat 27.1245 *** 32.2431 *** 32.8691 ***
Durbin Wu Hausman Chi2 (3) 21.2163 *** 48.0835 *** 29.5079 ***
Note: ***, **, * indicate significance at 1%, 5%, 10% levels
6.4�Estimation results of 2SLS method
The estimation results of the 2SLS method are summarized in Tables 6.6
6.5�Estimation results of 3SLS method
The estimation results of the 3SLS method are summarized in Tables 6.7.
���������������������������������������������������31 The exogenous variables of both equations are used as instrument variables. �
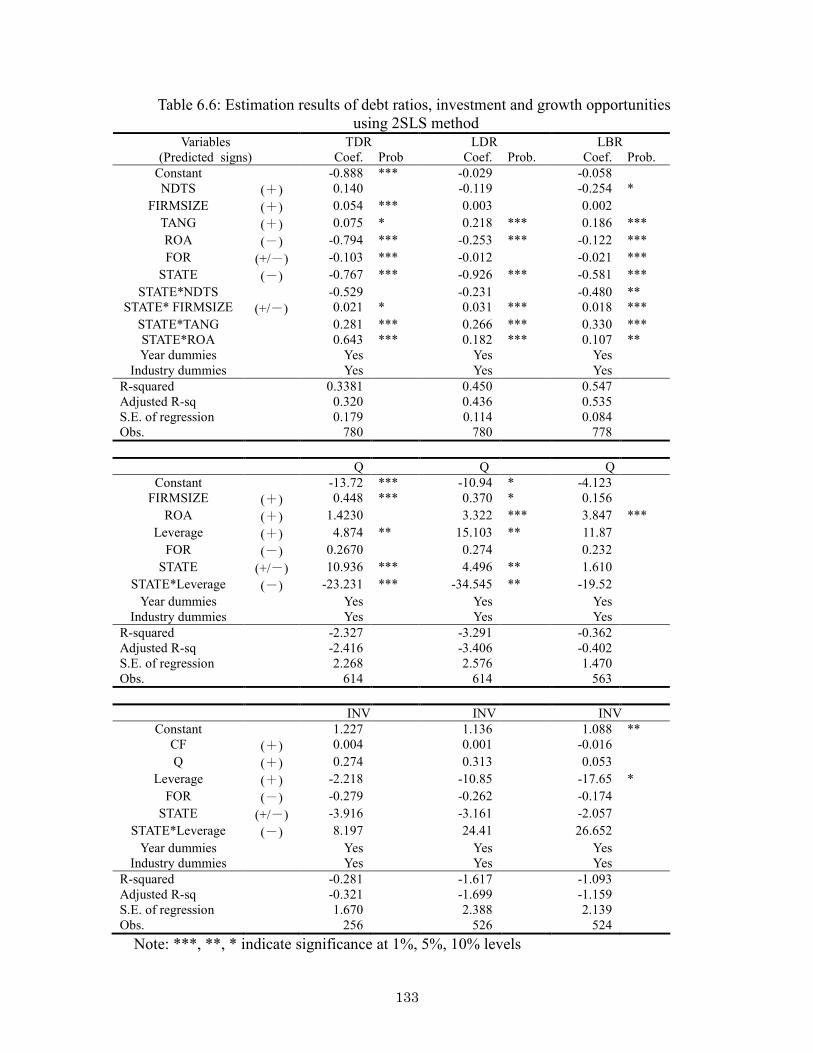
� ����
Table 6.6: Estimation results of debt ratios, investment and growth opportunities using 2SLS method
TDR LDR LBR Variables (Predicted signs) Coef. Prob Coef. Prob. Coef. Prob.
Constant 0.888 *** 0.029 0.058 NDTS (+) 0.140 0.119 0.254 *
FIRMSIZE (+) 0.054 *** 0.003 0.002
TANG (+) 0.075 * 0.218 *** 0.186 ***
ROA (-) 0.794 *** 0.253 *** 0.122 ***
FOR (+/-) 0.103 *** 0.012 0.021 ***
STATE (-) 0.767 *** 0.926 *** 0.581 ***
STATE*NDTS 0.529 0.231 0.480 ** STATE* FIRMSIZE (+/-) 0.021 * 0.031 *** 0.018 ***
STATE*TANG 0.281 *** 0.266 *** 0.330 *** STATE*ROA 0.643 *** 0.182 *** 0.107 ** Year dummies Yes Yes Yes
Industry dummies Yes Yes Yes
R squared 0.3381 0.450 0.547 Adjusted R sq 0.320 0.436 0.535 S.E. of regression 0.179 0.114 0.084 Obs. 780 780 778
Q Q Q
Constant 13.72 *** 10.94 * 4.123 FIRMSIZE (+) 0.448 *** 0.370 * 0.156
ROA (+) 1.4230 3.322 *** 3.847 ***
Leverage (+) 4.874 ** 15.103 ** 11.87
FOR (-) 0.2670 0.274 0.232
STATE (+/-) 10.936 *** 4.496 ** 1.610
STATE*Leverage (-) 23.231 *** 34.545 ** 19.52
Year dummies Yes Yes Yes Industry dummies Yes Yes Yes
R squared 2.327 3.291 0.362 Adjusted R sq 2.416 3.406 0.402 S.E. of regression 2.268 2.576 1.470 Obs. 614 614 563
INV INV INV
Constant 1.227 1.136 1.088 ** CF (+) 0.004 0.001 0.016
Q (+) 0.274 0.313 0.053
Leverage (+) 2.218 10.85 17.65 *
FOR (-) 0.279 0.262 0.174
STATE (+/-) 3.916 3.161 2.057
STATE*Leverage (-) 8.197 24.41 26.652
Year dummies Yes Yes Yes Industry dummies Yes Yes Yes
R squared 0.281 1.617 1.093 Adjusted R sq 0.321 1.699 1.159 S.E. of regression 1.670 2.388 2.139 Obs. 256 526 524
Note: ***, **, * indicate significance at 1%, 5%, 10% levels

� ����
Table 6.7: Estimation results of debt ratios, investment and growth opportunities using 3SLS method TDR LDR LBR Variables
(Predicted signs) Coef. Prob. Coef. Prob. Coef. Prob.
Constant 0.890 *** 0.031 0.060 NDTS (+) 0.143 0.115 0.247 *
FIRMSIZE (+) 0.054 *** 0.003 0.002
TANG (+) 0.076 * 0.219 *** 0.186 ***
ROA (-) 0.792 *** 0.250 *** 0.121 ***
FOR (+/-) 0.103 *** 0.012 0.021 ***
STATE (-) 0.766 *** 0.925 *** 0.579 ***
STATE*NDTS 0.530 0.233 0.486 ** STATE* FIRMSIZE (+/-) 0.021 * 0.031 *** 0.018 ***
STATE*TANG 0.280 *** 0.266 *** 0.330 *** STATE*ROA 0.642 *** 0.181 *** 0.108 ** Year dummies Yes Yes Yes
Industry dummies Yes Yes Yes
R squared 0.338 0.450 0.547 Adjusted R sq 0.320 0.436 0.535 S.E. of regression 0.179 0.114 0.084 Obs. 780 780 778
Q Q Q
Constant 14.03 *** 11.581 ** 4.726 FIRMSIZE (+) 0.459 *** 0.390 ** 0.176
ROA (+) 1.150 3.031 *** 3.749 ***
Leverage (+) 5.012 ** 16.215 ** 13.561
FOR (-) 0.276 0.285 0.230
STATE (+/-) 11.26 *** 4.797 *** 1.807
STATE*Leverage (-) 23.931 *** 36.917 ** 22.285
Year dummies Yes Yes Yes Industry dummies Yes Yes Yes
R squared 2.506 3.836 0.589 Adjusted R sq 2.600 3.966 0.636 S.E. of regression 2.329 2.735 1.588 Obs. 614 614 563
INV INV INV
Constant 1.033 0.739 0.490 CF (+) 1.38E 05 0.008 0.022
Q (+) 0.293 * 0.339 0.347 *
Leverage (+) 1.807 6.287 8.104
FOR (-) 0.269 0.246 0.247
STATE (+/-) 3.266 1.945 1.062
STATE*Leverage (-) 6.745 14.231 11.669
Year dummies Yes Yes Yes Industry dummies Yes Yes Yes
R squared 0.192 0.618 0.265 Adjusted R sq 0.229 0.669 0.305 S.E. of regression 1.611 1.878 1.663 Obs. 526 526 524
Note: ***, **, * indicate significance at 1%, 5%, 10% levels
� ����
6.6 Discussion on estimation results
The estimation results by using the three estimation methods are almost the same. No
contradictory results are observed. According to the estimation results, debt ratios are
significantly and negatively related to investment and positively related to growth
opportunities. As discussed in Chapter 3, this suggests that an over investment problem
exists among companies listed on the HOSE, and that debt financing may be used as a
tool to restrain this overinvestment problem.
However, the impact of leverage on investment and growth opportunities of state
controlled companies is reversed. In the estimation of investment, the coefficients of the
cross terms of the state controlled company dummy STATE and debt ratios are
significantly positive and sufficiently large that the effect of the debt ratios on
investments of state controlled companies becomes positive. In the estimation of growth
opportunities, the coefficients of the cross terms of the state controlled company dummy
STATE and debt ratios are significantly negative and sufficiently large that the total effect
of the debt ratios on growth opportunities of state controlled companies becomes
negative. As stated in Chapter 3, these estimation results imply that the soft budget
constraint problem is especially significant to state controlled companies in the HOSE.
The coefficients of STATE are significantly negative in the estimation of investment,
whereas they are significantly positive in the estimation of growth opportunities. This
suggests that state controlled companies listed in the HOSE seem to invest less, but have
better growth opportunities, than other companies.
No significant effect of foreign ownership was observed in the estimation results of
investment or growth opportunities.
As mentioned in Chapter 2, among the remaining problems of corporate finance in
Vietnam, the five big state owned or state controlled commercial banks lend more than
half of the domestic demand. In addition, the state controlled companies continue to
maintain close relationships with state owned banks and can access bank loans with
preferable conditions regardless of efficiency. These problems may explain the estimation
results stated previously. The state controlled companies listed on the HOSE seem to use
their relationships with state owned banks to get significant funding but invest in
� ����
ineffective projects, leading to the reduction of the growth opportunities of these firms.
By contrast, although there are effective projects, non state controlled companies may
find it difficult to access bank loans to finance these projects. The relevant policy
implication is that further reforms, both in the banking sector and in state controlled
companies, are needed to resolve the opaque collusion between state controlled
companies and state owned banks.
In addition, information asymmetry among listed firms in Vietnam may be significant,
and, thus, managers may freely invest in ineffective projects, creating an overinvestment
problem. This implies that further disclosure of corporate information should be
implemented to protect outside creditors.
6.7 Conclusion
This chapter investigated the influence of capital structure on investment activities and
growth opportunities of listed companies in Vietnam where state owned banks and state
controlled banks lend more than half of the domestic demand. Estimation analysis using
panel data covering the 6 year period of 2006–2011 for companies listed on the HOSE
revealed two major findings. First, in general, there is an overinvestment problem among
listed companies in Vietnam and debt financing plays the role of restraining this
overinvestment problem. Second, state controlled companies face a soft budget constraint
problem, which is common in transition economies.
These results imply that state owned banks in Vietnam seem to impose fewer
restrictions or lower levels of monitoring on loans to state controlled companies. This
suggests that further reforms, both in the banking sector and in state controlled
companies, as well as further disclosure of corporate information, are urgently needed to
resolve the opaque collusion between state controlled companies and state owned banks
and to protect outside creditors.
�
�
�
�
�
�
�
� ����
�
�� �����
���������
7.1�Introduction
This dissertation investigates the capital structure and its impacts on investment
behavior as well as the profitability of listed companies in Vietnam with an emphasis of
identifying the characteristics of state controlled companies in order to assess the effects
of the economic and corporate reforms in Vietnam since the Doi moi. This chapter
summarizes the main contents of the previous chapters, discussing the findings of the
study as well as their implications, and indicating some limitations of the thesis, which
suggest some topics for future research. The rest of this chapter is structured as follows.
Section 2 summarizes the chapters of the dissertation. Sections 3 and 4 discuss the
findings of the study and the implications. Section 5 suggests further researches in the
future based on the limitations of this dissertation.
7.2�Summary of the chapters
7.2.1 Summary of Chapter 1: Economic reform and state owned company reform in
Vietnam
Chapter 1 overviews the reform of state owned companies (SOCs) as well as the
stock markets, listing companies and banking sector in the context of the economic
reform under the Doi moi policy in Vietnam, which relate to the analyses in the following
chapters of the thesis.
The Vietnamese government initiated remarkable economic reforms (Doi moi) in
1986, which ended the era of central planning and adopted a market economy.
Subsequently, the country’s economy showed impressive results in terms of economic
growth and inflation, especially since 1989. Along with the economic reforms some
comprehensive measures to restructure SOCs have been launched since 1986. Among
other measures, equitization has been seen as the best way to restructure the SOCs
� ���
effectively and quickly. The equitization programme in Vietnam, which started in 1992,
can be divided into three stages, namely the pilot stage (from 1992 to 1996) and the
expansion stage (from 1996 to 2010) and the speed up stage (from 2011 to now).
Following 20 years of implementation of state owned company equitization, by the end
of 2011 about 4,000 SOCs had been equitized. Most equitized SOCs are small sized. The
remaining 1,300 fully state owned companies are the largest ones. Another feature of
equitized SOCs is that the state still holds decisive voting rights in many cases and the
ownership of the state in these companies reduced gradually after being equitized.
Equitization is assessed to make the equitized SOCs more effective and listing is proved
to be associated with better management in equitized SOCs.
There are two stock markets in Vietnam, Hochiminh Stock Exchange (HOSE) and
Hanoi Stock Exchange (HASE), which were established in 2000 and 2005 respectively,
with the listing norms of the HOSE being stricter than those of the HASE. The
development of Vietnamese stock markets is linked with the equitization process. There
remains more than 700 SOCs scheduled to be equitized soon, which will continue to be
the backbone of the Vietnamese stock market in the near future. One of the main
strengths of the stock market is its ability to mobilize new capital, rather than just serve
as secondary support. Another characteristic of the stock markets in Vietnam is the
under representation of institutional investors in the markets.
The banking sector was also reformed to support the corporate sector in providing
credit for investment. SOCBs accounted for 79 per cent of total loans to the economy as
of year end 2001, and this portion fell year by year, to 51.7 per cent in 2011. Most
banking credit went to SOCs, but their share in total outstanding loans declined steadily,
from nearly 40 per cent in 2002 to 16.7 per cent in September 2012.
The participation of foreign investors plays an important role in the reform process in
Vietnam. The FDI sector has been contributing to the development of the Vietnamese
economy, creating jobs, and encouraging exports. In stock markets, both individual and
institutional foreign investors have been active.
Despite the above mentioned achievements of the economic reforms, there remain
some issues that need to be addressed. Firstly, the equitization of SOCs has slowed down
since 2007 while the remaining fully state owned companies that need to be equitized are

� ���
large and important ones. Secondly, equitized SOCs seem to have privileged access to
credit from state owned commercial banks due to their historical relationship with the
SOCBs since before equitizing as well as their implicit support from the state as a
dominant stockholder. In order to address these problems, the Vietnamese government
should accelerate the equitization process as well as the reform of the banking sector.
7.2.2 Summary of Chapter 2: Corporate finance and corporate governance of listed
companies in Vietnam
Chapter 2 introduces the characteristics of the ownership structure, corporate finance
and corporate governance of listed companies in Vietnam, which are the objectives of the
empirical analysis in Chapters 4, 5 and 6.
One significant feature of the ownership structure of listed companies in Vietnam is
that the state remains a dominant shareholder, which has affects on the corporate
activities and corporate governance of these companies. Such companies may be in a
privileged position compared to other companies in raising funds in the context that the
four big state owned or state controlled commercial banks still provide most of the loans
to the whole economy, but may be less inactive in investment or less effective in
operation. Information asymmetry may be significant among listed companies, especially
among state controlled companies due to the lack of corporate information disclosure.
The policy of opening the economy is encouraging foreign investors to invest in
Vietnam, not only in the form of FDI but also in the stock markets, and foreign investors
are now allowed to own up to 50 per cent of a listed company. Along with the high
development of the Vietnamese economy, the penetration of foreign investors into the
stock markets is another characteristic of the ownership structure of listed companies in
Vietnam, which also has effects on these companies’ activities.
7.2.3 Summary of Chapter 3: Literature review, hypotheses and models
Chapter 3 reviews both the theoretical and empirical literature on capital structure and
its impacts on investment and performance of companies in the context of corporate
reform as well as describes hypotheses, models and data set for empirical analyses which
will be conducted in Chapters 4, 5 and 6.
� ����
Corporate finance is a hot topic among developing countries and transitional countries
in order to assess the effectiveness of economic reforms and corporate reforms of these
countries. According to Modigliani and Miller’s (1958) theory (“MM theory”), corporate
value does not depend on capital structure; thus, corporate financing has no impact on
corporate value when the following conditions exist together: a complete capital market,
perfect information, no corporate taxes, no transaction costs, and no economic
externalities. However, the full set of preconditions of the MM theory is not likely to
exist in the real world. Modern corporate finance theories that explain the capital
structure of companies in developed countries include trade off theory, pecking order
theory and agency cost theory. Several empirical studies on corporate financial structures
in transitional economies have been conducted on East European countries and China.
They examine corporate behavior using the modified MM, agency costs, and pecking
order approaches, with a focus on government influence on the markets and companies
peculiar to transitional economies. These studies found evidence that the level of leverage
of companies in transition economies is low (Cornelli, Portes, and Schaffer (1996),
Hussain and Nivorozhkin (1997), Nivorozhkin (2002)). While some studies concluded
that the determinants of the asset structures of transition economies could be explained by
using the economic factors of advanced countries (Bauer (2004), Delcoure (2007), Chen
(2004), Huang and Song (2006)), some provided different evidence with modern
corporate finance theories, for example Cornelli, Portes, and Schaffer (1996) and
Nivorozhkin (2002) found that collateral is negatively related to leverage. Some found
that government ownership did not affect corporate financing structures (Huang and Song
(2006)).
Regarding the impact of debt ratios on profitability, there are two possible relations
between leverage and ROA. If the creditors’ monitoring of a company’s business
operations is strict and adequate, an increase in debt will inhibit wasteful investment, and
improve corporate profitability. In this case, the relation between leverage and ROA is
positive. However, if the creditors’ monitoring is inadequate, and the corporate
governance of the borrowing company is also inadequate, the company may use the loans
ineffectively. In this case, an increase in debt may worsen the profitability of the
company, which causes a negative relation between leverage and ROA. There is another
� ����
possibility of a negative relation between leverage and ROA. A company may not
execute an investment for fear that procuring funds through debts will send investment
profits to creditors, even if the investment project may enhance the company’s discounted
present value. If such debt overhang problem has occurred, reducing the debt ratio is
expected to promote investments, thereby increasing corporate profits. (Myer, 1977).
There are few studies on the relationship between leverage and firms’ performance
using data sets of transitional countries. Ebaid, I. E. (2009) found that capital structure
has a weak to no impact on the performance of Egyptian listed firms.
The impact of leverage on the investment decisions and growth opportunities of a
company is also a central issue in corporate finance. Modigliani and Miller (1958) argue
that in a complete market, leverage is irrelevant to the investment decision and the value
of a company. However, with an incomplete market and a significant agency problem,
leverage may affect the investment decisions and growth opportunities of a company.
There are four possible impacts of leverage on investment and growth opportunities:
underinvestment, overinvestment, financing restraints and soft budget constraints. Myers
(1977) discusses how conflicts between shareholders, managers, and creditors discourage
firms with large debts from investing in opportunities with positive NPV because the
benefits from investment may partially or fully accrue to the debt holders; this creates an
underinvestment problem (i.e., a debt overhang problem). In this case, the relationship
between leverage and investment is negative, and the relationship between the debt ratio
and a firm’s growth opportunities is negative. Jensen (1986) argues that when conflicts
between managers and shareholders exist, managers are encouraged to undertake even
negative NPV investments to enlarge the scale of the firm. Constraining the availability
of free cash flow, including the increase of debt financing, may constrain the managers’
ability to undertake such policies, and thus, improve the value of firms. Thus, if debt
financing restrains overinvestment, then the relationship between leverage and
investment is negative, and the relationship between the debt ratio and the firm’s growth
opportunities is positive. In order to finance their investment projects, companies can use
either internal funds (e.g., retained earnings) or external funds (e.g., debt and issuance of
new shares). The financial constraints problem arises when the company faces a shortage
of funding sources to finance their investment projects. In this case, increasing debt may

� ����
provide a company more chances to invest and more opportunities for growth. Thus, both
of the relationships between the debt ratio and investment, as well as the relationship
between debt ratio and growth opportunities become positive. Kornai (1979, 1980)
suggested that soft budget constraints are especially pervasive in socialist economies,
particularly in those economies intent on “reform.” If firms have a soft budget constraint
problem, the relationship between the debt ratio and investment is positive, whereas the
relationship between the debt ratio and a firm’s growth opportunities is negative.
There are many empirical studies on the relevance of leverage on the investment of
firms in developed economies but few on that in transitional economies. Firth et al.
(2008) suggested that there is a negative relationship between leverage and investment
among listed firms in China and that this negative relationship is weaker in firms with
high growth opportunities and good operating performance as well as in firms with
higher levels of state shareholding.
As for Vietnam, only a few empirical analyses have been conducted on Vietnam’s
corporate finance. Nguyen (ibid.), who is a pioneering researcher in this field,
investigated the determinants of capital structure of SMEs in Vietnam. This study found
some evidence of differences from other transitional economies, for example
government owned companies had higher debt ratios than other companies; fixed assets
has a negative correlation with debt ratio; corporate profitability did not influence the
debt ratio; corporate owners’ stronger ties with banks and networks facilitated the
procurement of funds. Biger et al. (ibid.) investigated the fund procurement structure of
companies in a census of the General Statistics Office of Vietnam in 2002 and 2003 and
also found some differences with modern corporate finance such as a negative correlation
between debt ratio and fixed assets. Okuda and Lai (2012) present an empirical study on
the determinants of capital structure and its impact on investment of listed companies in
Vietnam. The paper also found that government owned companies had higher debt ratios
than other companies and that debt financing plays a role in preventing under investment
and over investment; although government controlled companies borrow more, they are
less strictly monitored by the government controlled banks in their use of debt funds than
other companies, and the problem of under investment may be crucial among these
companies.
� ����
This chapter also builds hypotheses to assess the results of economic reforms and
corporate reforms in Vietnam based on these modern corporate finance theories. As for
the determinants of capital structure, according to the trade off approach, corporate tax is
expected to have a positive relation, non debt tax shields is expected to have a negative
relation, and bankruptcy risk is expected to have a positive relation with companies’ debt
ratios. According to the agency cost approach, collateral can reduce the agency cost of
procuring debt funds, thus a positive relation with corporate’ debt ratios is expected,
while internal fund has lower agency cost than other sources of funds thus a negative
relation to the debt ratios is expected. Regarding the relation between capital structure
and investment, listed companies in Vietnam may cope with overinvestment because of
the easy lending of banks in a boom period or underinvestment because of the cautious
lending of banks in the post boom period. As for the relation between leverage and
profitability, there are two possibilities. In Vietnam, the creditors’ monitoring on a
company’s business operations is not sufficient and the corporate governance of the
borrowing company is inadequate, thus the company may use the loans ineffectively, and
an increase in debt may worsen the profitability of the company. Regarding the impacts
of leverage on investment and growth opportunities, there are possibilities of
underinvestment, overinvestment, or soft budget constraints among listed companies in
Vietnam.
This chapter also presents other hypotheses about the impacts of state ownership and
foreign ownership on capital structure, investment, profitability and growth opportunities.
State controlled companies may have weaker incentives to adjust their debt ratios to
attain tax savings, lower bankruptcy risk due to implicit guarantees of the state, and easier
ability to access state owned bank loans regardless of their collateral due to their closer
relationships with state owned banks. State controlled companies may be more active in
investing than other companies due to their function as a tool for implementing
government policies, or make less use of good investment opportunities due to their less
profit oriented characteristic. They also may have higher profitability due to their
advantages in raising funds from state owned or state controlled banks, or less
profitability due to being less independent from the state in terms of business
management. These companies may have a more severe problem of soft budget
� ����
constraints, which is often seen among companies in transitional countries. Foreign
affiliated companies are assumed to have lower debt ratios, higher investment ratios and
better performance due to their high requirement of information disclose and strict
monitoring over business operations.
This thesis uses 3 models: (1) Capital structure and investment; (2) Capital structure
and profitability; (3) Capital structure, growth opportunities and investment, which are
formed from 4 equations of capital structure, investment, profitability and growth
opportunities. Three estimation methods of OLS, 2SLS and 3SLS are used to estimate
these three models. Cragg Donald statistic and Durbin Wu Hausman Test are conducted
to check the weak instruments and endogeneity for using the 2SLS and 3SLS method.
7.2.4 Summary of Chapter 4: Capital structure and investment behavior of listed
companies in Vietnam
Chapter 4 investigates the capital structure and investment activities of listed
companies in Vietnam, using panel data covering the six year period 2006 2011 of 435
companies listed on the HOSE and on the HASE.
This study identified some key features of fundraising structures and their effects on
investment behavior of listed companies in Vietnam. In terms of fund mobilization and
corporate financing, the economic reforms (Doi moi) implemented by the Vietnamese
government, which aims to create an economic system based on market mechanisms,
have achieved some of their goals. The capital structure of listed companies could be better
explained by the standard corporate financing theory based on trade off theory and agency cost theory.
However, the economic reforms still have several limitations, such as the opaque
relationship between state controlled companies and government banks, financial
restrictions on investment activities, and inactive investment of state controlled
companies.
7.2.5 Summary of Chapter 5: Capital structure and investment behavior of listed
companies in Vietnam
� ����
This chapter presents an empirical analysis on the capital structure and its impacts on
the profitability of 435 listed companies in Vietnam, using panel data of two periods of
2006–2008 and 2009 2011.
The estimation results show that, firstly, compared to Vietnamese small and medium
sized enterprises, the capital structures of listed companies matched better the features of
standardized corporate financing theories. Secondly, however, weak corporate
governance and insufficient creditors’ monitoring influenced the listed companies to
excessively borrow in both periods before and after the boom. Thirdly, the state
controlled companies listed on HOSE are likely to have an advantage over other
companies in accessing loans and earning profits even after the boom period. Fourthly,
while foreign affiliated companies were not conspicuous in terms of profitability during
the boom period, they showed their superiority through better production technology and
management in the period after the boom.
These findings suggest that reforming the Vietnamese market requires the development
of a system that ensures information transparency and independent corporate governance,
enhances financial openings, and increases privatization of state owned companies,
including those in the banking sector.
7.2.6 Summary of Chapter 6: The impact of leverage on investment and growth of state
controlled companies in Vietnam
This chapter examines the influence of capital structure on investment activities and
growth opportunities of listed companies in Vietnam where state owned and state
controlled banks lend more than one half of the domestic demand, and determines the
variation in influence between state controlled companies and other listed companies,
using panel data covering the six year period of 2006–2011 of companies listed on the
HOSE.
Estimation analysis revealed two major findings. Firstly, in general, there is an over
investment problem among listed companies in Vietnam and debt financing minimizes
this problem. Secondly, the state controlled companies face a soft budget constraint
problem, which is common in transitional economies. These results imply that state
owned banks in Vietnam impose fewer restrictions or lower levels of monitoring on loans
� ����
to state controlled companies. Therefore, further reform in the banking sector and in
state controlled companies and further disclosure of corporate information are needed to
resolve the opaque collusion between state controlled companies and state owned banks
and to protect outside creditors.
7.3�Overall picture of corporate finance of listed companies in Vietnam
According to the empirical analyses on the capital structure and its impacts on
investment, growth opportunities and profitabilities of listed firms in Vietnam, the overall
picture of corporate finance of these companies has become clearer.
Firstly, financing structures of non state controlled listed companies in Vietnam have
features that conform well to economic theory and the market economy.
Secondly, the state remains the controlling shareholder in many former state owned
companies and has controlling rights over these firms’ activities, which helps these
companies to make use of their close relationship with the government to access loans
under preferable conditions, although their fund using activities remain inefficient.
Thirdly, the five big state owned or state controlled commercial banks are still lending
to most of the domestic demand, and they still impose preferable conditions and less
strict monitoring on loans to the state controlled companies.
Fourthly, fund raising through the stock market is still undeveloped, and the fund
raising activities of listed firms in Vietnam still rely on debt financing such as bank loans.
7.4�Implications
Contrary to what is suggested by the analysis of Vietnamese small and medium
enterprises (SMEs) in Nguyen (2006) and Biger et al. (2008), the capital structures of
listed companies in Vietnam are relatively well matched to the features of standardized
corporate financing theory. Nguyen (ibid.) and Biger et al. (ibid.) analyzed small and
medium sized companies and concluded that these companies have a low level of
information disclosure and a wide information asymmetry between them and their
external creditors and investors, thereby significantly distorting their fund procurement
structures. The listed companies analyzed in this paper enjoy favorable institutional
environments that are conducive to achieving economically rational funds procurement
� ����
behavior.
However, Vietnamese listed companies still face a problematic market environment.
Firstly, information asymmetry needs to be improved as the procurement of debt funds
depended heavily on collateral. Secondly, further institutional reforms are needed
including the development of a system that ensures independent corporate governance
and transparency of information, the acceleration of privatization of government owned
companies and the banking sector, given the strong market presence of government
controlled banks because government controlled companies were observed to be less
affected by their ability to provide collateral in the procurement of external funds than are
other companies.
7.5�Suggestion for further research
The contribution of this dissertation is that it investigated the capital structure,
investment behavior, growth opportunity and profitability of listed companies in Vietnam.
The empirical analyses revealed many interesting findings on corporate finance of a
transitional economy such as Vietnam. However, the dissertation itself has limitations,
which suggests areas for further research in the future. The data set of the empirical study
was unbalanced panel data of companies listed before 2009. After that, many companies
listed on both the HOSE and the HASE should be added to the data set. The data used in
the dissertation was for the period of 2006 2011, which also should be extended to
include more recent data in order to investigate the effectiveness of the economic reforms
and corporate reforms over a longer period.
�
�
�
�
�
�
�
�
�
�
�
�
�
� ���
/��������
(1)�Aivazian, V.A., Y. Ge, and J. Qiu (2005) “The impact of leverage on firm investment:
Canadian evidence,” Journal of Corporate Finance, Vol. 11, pp. 277–291.
(2)�Akiba, M. (2010), “The enterprise financial system and its impact on investment
decision in Vietnam,” Vietnam Economic Review, Vol. 10, No. 194, pp. 13 25.
(3)�Anne Ho and R. Ashle Baxter (2011), “Banking Reform in Vietnam”, Asia Focus
(4)�Bauer, P. (2004), “Determinants of capital structure: Empirical evidence from the
Czech Republic,” Czech Journal of Economics and Finance, Vol. 54, pp. 2 21.
(5)�Biger, N., N.V., Nguyen and N.V., Hoang. (2008) “The determinants of capital
structure: Evidence from Vietnam,” International Finance Review, 8, 307 326.
(6)�Booth, L., V. Aivazian, A. Kunt Demirguc, and V. Maksimovic. (2001) “Capital
structure in developing countries,” Journal of Finance, 56, 87 130.
(7)�Chen, J. (2004), “Determinants of capital structure of Chinese listed companies,”
Journal of Business research, Vol. 57, No. 12, pp. 1341 1351.
(8)�Colombo, E. (2001), “Determinants of corporate capital structure: Evidence from
Hungarian Firms,” Applied Economics, Vol. 33, 1689 1701.
(9)�Cornelli, F., R. Portes, and M. E. Schaffer (1998), “Financial structure of firms in the
CEECs,” Olivier Bouin, Fabrizio Coricelli, and Françoise Lemoine (ed.), Different
Paths to a Market Economy: China and European Economies in Transition . chap. 7,
CEPR/CEPII/OECD
(10)� Delcoure, N. (2007), “The determinants of capital structure in transitional
economies,” International Review of Economics and Finance, Vol. 16, 400 415.
(11)� Do X.Q. and Z.X. Wu (2014), The Impact of Ownership Structure and Capital
Structure on Financial Performance of Vietnamese Firms, International Business
Research
(12)� Driffield N., V. Mahambare, and S. Pal (2007), “How does ownership structure
affect capital structure and firm value?” Economics of Transition, Vol. 15, No. 3, pp.
535 573.
(13)� Ebaid, I.E. (2009), "The impact of capital structure choice on firm performance:
empirical evidence from Egypt", Journal of Risk Finance, Vol. 10, Iss: 5, pp. 477–

� ���
487
(14)� Evidence from Vietnam,” International Finance Review, Vol. 8, pp. 307 326.
(15)� Firth, M., C. Lin, and S.M.L. Wong (2008), “Leverage and investment under a
state owned bank lending environment: Evidence from China”, Journal of Corporate
Finance, Vol. 14, pp. 642–653.
(16)� Huang, S.G. and F.M. Song. (2006), “The determinants of capital structure:
Evidence from China,” The China Economic Review, Vol. 17, No. 1, pp. 14 36.
(17)� Hussain, Q. and E. Nivorozhkin (1997), “The capital structure of listed companies
in Poland,” IMF Working Paper.
(18)� International Finance Corporation (2007), Vietnam Capital Market Diagnostic
Review.
(19)� International Finance Corporation (2010), Corporate Governance Scorecard:
Baseline Report 2010.
(20)� Jean, J. Chen. (2004) “Determinants of capital structure of Chinese listed
companies,” Journal of Business research, 57, 1341 1351
(21)� Jensen, M. and W.H. Meckling (1976), “Theory of the firm: Managerial behavior,
agency costs and ownership structure,” Journal of Financial Economics, Vol. 3, No. 4,
pp. 305 360.
(22)� Jensen M.C. (1986), “Agency Cost Of Free Cash Flow, Corporate Finance, and
Takeovers,” American Economic Review, Vol. 76, No. 2, pp. 323 329.
(23)� Lang, L., E. Ofek, and R.M. Stulz (1996), “Leverage, investment and firm
growth”, Journal of Financial Economics, Vol. 40, pp. 3–29.
(24)� Lee, J.W., Y.S., Lee and B.S., Lee (2000) “The determination of Corporate Debt
in Korea,” Asian Economic Journal, 1, 333 356
(25)� Mieno, F. (2006) “Fund Mobilization and Investment Behavior in Thai
Manufacturing Firms in the Early 1990s,” Asian Economic Journal, 20, 95 122.
(26)� Modigliani, F. and M.H. Miller (1958), “The cost of capital, corporate finance,
and the theory of investment,” American Economic Review, Vol. 48, pp. 261 297.
(27)� Modigliani, F. and M.H. Miller (1963), “Corporate income taxes and the cost of
capital—A Correction,” American Economic Review, Vol. 53, pp. 433 443.
(28)� Myers, S.C. (1977), “Determinants of Corporate Borrowing,” Journal of
� ����
Financial Economics, Vol. 5, pp. 147 175.
(29)� Myers S.C. and N.S. Majluf (1984), "Corporate Financing and Investment
Decisions When Firms Have Information That Investors Do Not Have," Journal of
Financial Economics, Vol. 13, No. 2, pp. 187 221.
(30)� Nivorozhkin E. (2002), “Capital structure in emerging stock markets: the case of
Hungary”, The Developing Economies, XL 2, pp. 166–87.
(31)� Nguyen, T.D.K. (2006), “Capital structure in small and medium sized companies:
The case of Vietnam,” ASEAN Economic Bulletin, Vol. 23, No. 2, pp. 192 211.
(32)� Nguyen K.V (1980), “Vietnam Five Years After”, Hanoi: Foreign Language
Publishing House.
(33)� OECD (2013), “Structure policy country notes: Viet Nam”
(34)� Rajan, R.G. and L., Zingales (1995) “What Do We Know about Capital Structure?
Some Evidence from International Data,” The Journal of Finance, Vol. 50 (5), pp.
1421 1460.
(35)� Ramsey and Schmidt (1976) “Some further results in the use of OLS and BLUS
Residuals in error specification tests,” Journal of the American Statistical Association,
Vol.71, pp. 389 390.
(36)� Ryozo Hattori (2007), “Emerging markets newsletter”, Daiwa Research Institute
(37)� Suto, M. (2003) “Capital Structure and Investment Behavior of Malaysia Firms in
the 1990s: a study of corporate governance before the crisis,” Corporate Governance
and International Review, 11, 25 39.
(38)� Tran, V.T. (2010), “Development and Transition in the Vietnam economy”, Keiso
Shobo
(39)� Tran, V.T. (2013), “Vietnamese Economy at the Crossroads: New Doi moi for
Sustained Growth”, Asian Economic Policy Review, 8, pp. 122–143
(40)� Truong, D.L., Lanjouw, G. & Lensink, R. (2006), “Impact of Privatization on
Firm Performance in a Transition Economy: the Case of Vietnam”, Economy of
Transition, 14 (2), pp. 349 389.
(41)� Vo T.Q. and D.K. Nguyen (2013), Corporate Performance Of Privatized Firms In
Vietnam, The Journal of Applied Business Research
(42)� Vu H.T. and M.H. Nguyen (2013), The Effect of Banking Relationship on Firm

� ����
Performance in Vietnam, International Journal of Economics and Finance
(43)� Vu Q.N (2002), “The State Owned Enterprise Reform in Vietnam: Process and
Achievements”, Visiting Researchers Series No. 4, Institute of Southeast Asian
Studies, Singapore.
(44)� Vu, T.T.A (2012), “Restructuring of SOEs in Viet Nam”, Fulbright Economics
Teaching Program, Vietnam Program, Harvard Kennedy School, Hanoi, 14 March
2012
(45)� World Bank (2006), “Corporate Government Country Assessment”
(46)� World Bank (2006), “Overview of the capital markets in Vietnam and directions
for development”
(47)� World Bank (2006), “Taking stock: An update on Vietnam’s economic
developments and reforms”
(48)� World Bank (2007), “Vietnam Development Report: Aiming High”
(49)� World Bank (2009), “Vietnam Development Report: Capital”
(50)� World Bank (2012), “Vietnam Development Report: Market economy for a
middle income Vietnam”
(51)� Yuan, Y. and K. Motohashi. (2008) “Impact of debt ratio on firm investment: A
case of listed companies in China,” RIETI Discussion Paper, Series 08 E 011.
(52)� Yupana, W. (1999), “An empirical study on the determinants of the capital
structure of Thai firms,” Pacific:Basin Finance Journal, Vol. 7(3 4), pp. 371 403.
�
�
�
�
�
�
�
�