Embed Size (px)
Citation preview


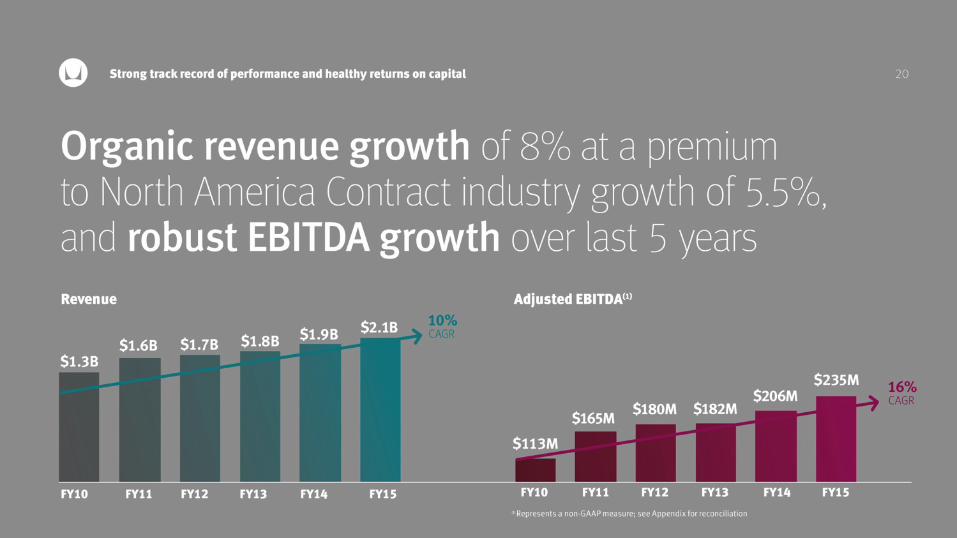

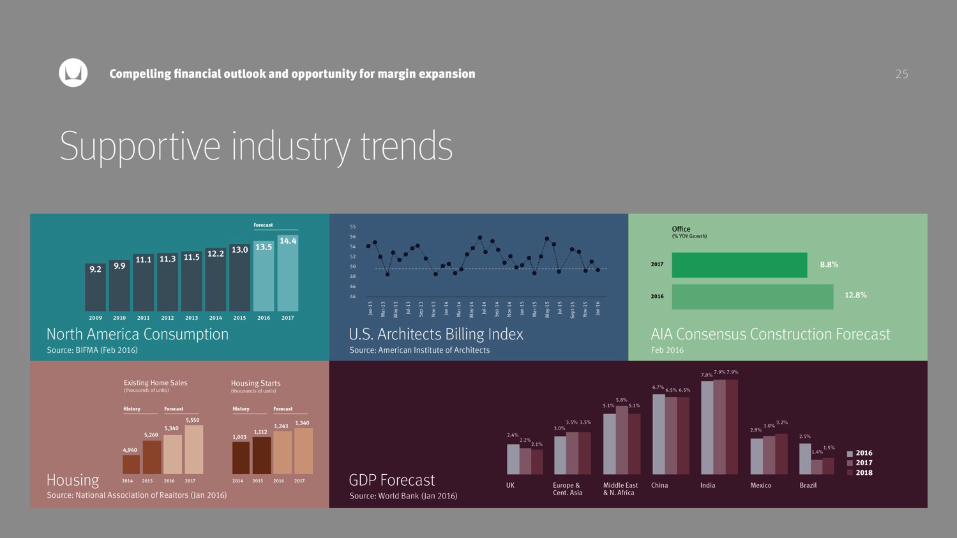


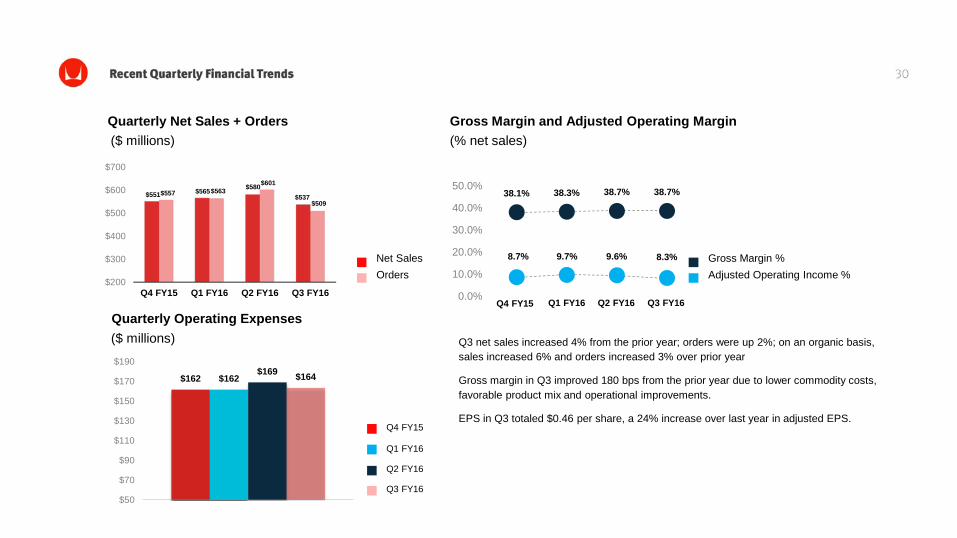
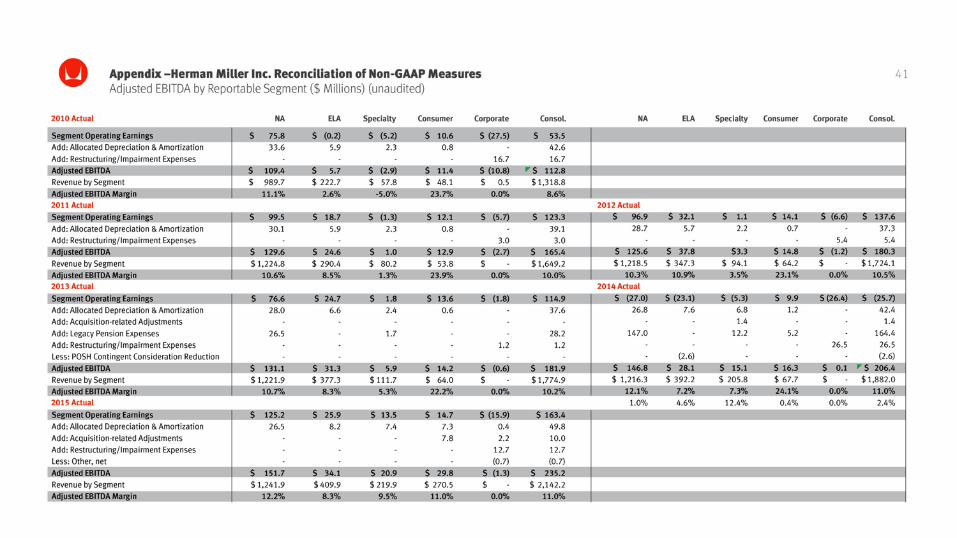
Q3 net sales increased 4% from the prior year; orders were up 2%; on an organic basis, sales increased 6% and orders increased 3% over prior year
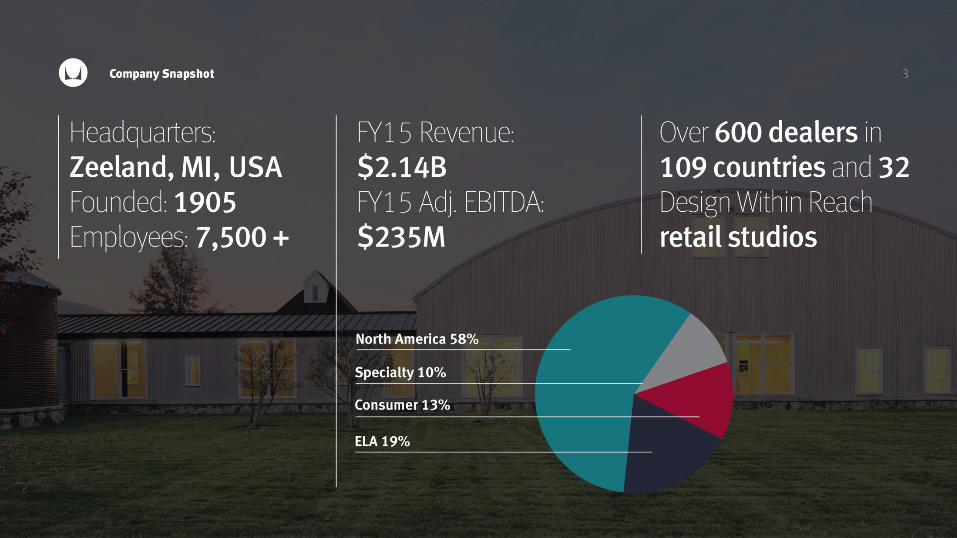
Gross margin in Q3 improved 180 bps from the prior year due to lower commodity costs, favorable product mix and operational improvements.
EPS in Q3 totaled $0.46 per share, a 24% increase over last year in adjusted EPS.
$162 $162$169 $164
$50
$70
$90
$110
$130
$150
$170
$190
Q4 FY15
Q1 FY16
Q2 FY16
Q3 FY16
$200
$300
$400
$500
$600
$700
Q4 FY15 Q1 FY16 Q2 FY16 Q3 FY16
$551 $565 $580$537$557 $563
$601
$509
Quarterly Net Sales + Orders($ millions)
Quarterly Operating Expenses($ millions)
Net Sales Orders
38.1% 38.3% 38.7% 38.7%
0.0%
10.0%
20.0%
30.0%
40.0%
50.0%
Gross Margin %Adjusted Operating Income %
Gross Margin and Adjusted Operating Margin(% net sales)
8.7% 9.7% 9.6% 8.3%
Q4 FY15 Q3 FY16Q2 FY16Q1 FY16
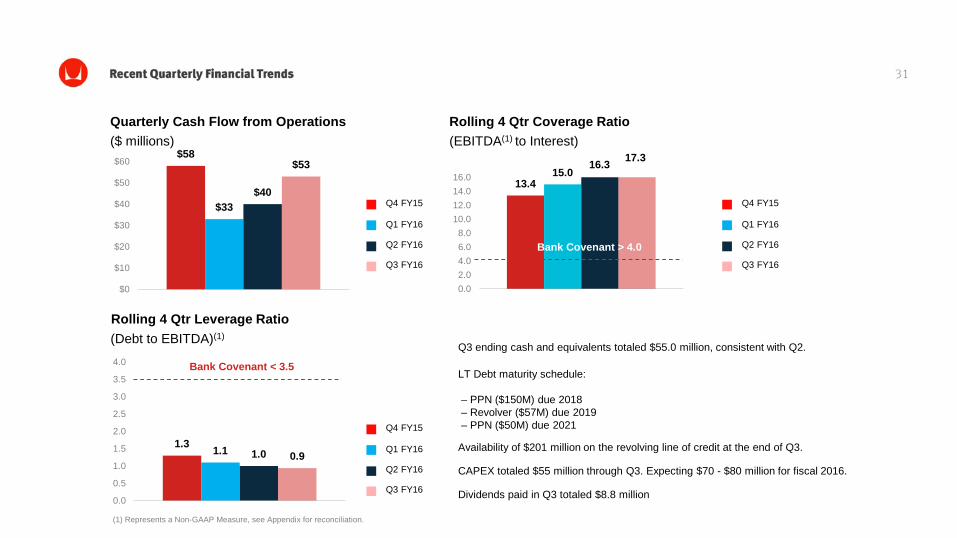
Q3 ending cash and equivalents totaled $55.0 million, consistent with Q2.
LT Debt maturity schedule:
– PPN ($150M) due 2018– Revolver ($57M) due 2019– PPN ($50M) due 2021
Availability of $201 million on the revolving line of credit at the end of Q3.
CAPEX totaled $55 million through Q3. Expecting $70 - $80 million for fiscal 2016.
Dividends paid in Q3 totaled $8.8 million
Quarterly Cash Flow from Operations($ millions)
Q4 FY15
Q1 FY16
Q2 FY16
Q3 FY16
$58
$33$40
$53
$0
$10
$20
$30
$40
$50
$60
Q4 FY15
Q1 FY16
Q2 FY16
Q3 FY16
Rolling 4 Qtr Coverage Ratio(EBITDA(1) to Interest)
Rolling 4 Qtr Leverage Ratio(Debt to EBITDA)(1)
(1) Represents a Non-GAAP Measure, see Appendix for reconciliation.
13.415.0
16.3 17.3
0.02.04.06.08.0
10.012.014.016.0
Bank Covenant > 4.0
1.3 1.1 1.0 0.9
0.0
0.5
1.0
1.5
2.0
2.5
3.0
3.5
4.0 Bank Covenant < 3.5
Q4 FY15
Q1 FY16
Q2 FY16
Q3 FY16
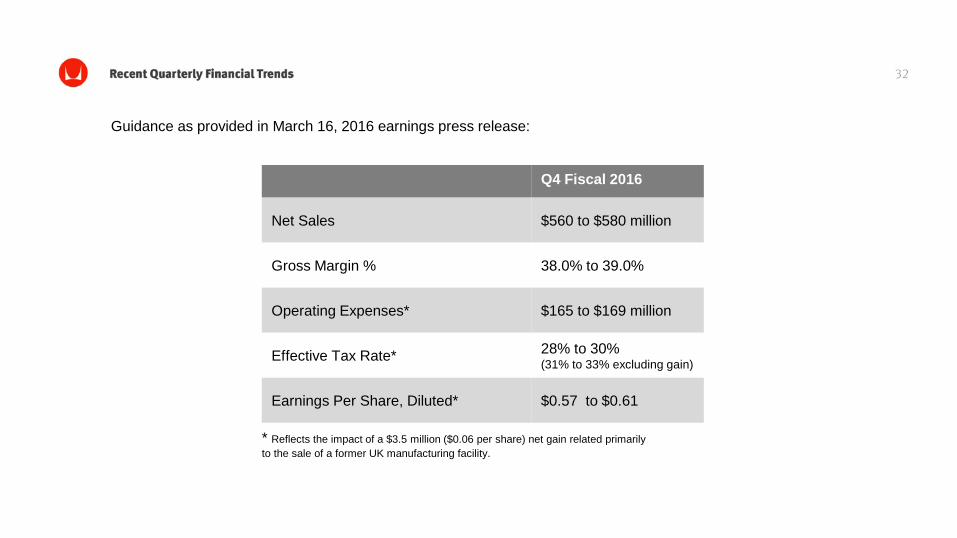
Q4 Fiscal 2016
Net Sales $560 to $580 million
Gross Margin % 38.0% to 39.0%
Operating Expenses* $165 to $169 million
Effective Tax Rate* 28% to 30%(31% to 33% excluding gain)
Earnings Per Share, Diluted* $0.57 to $0.61
* Reflects the impact of a $3.5 million ($0.06 per share) net gain related primarily to the sale of a former UK manufacturing facility.
Guidance as provided in March 16, 2016 earnings press release:


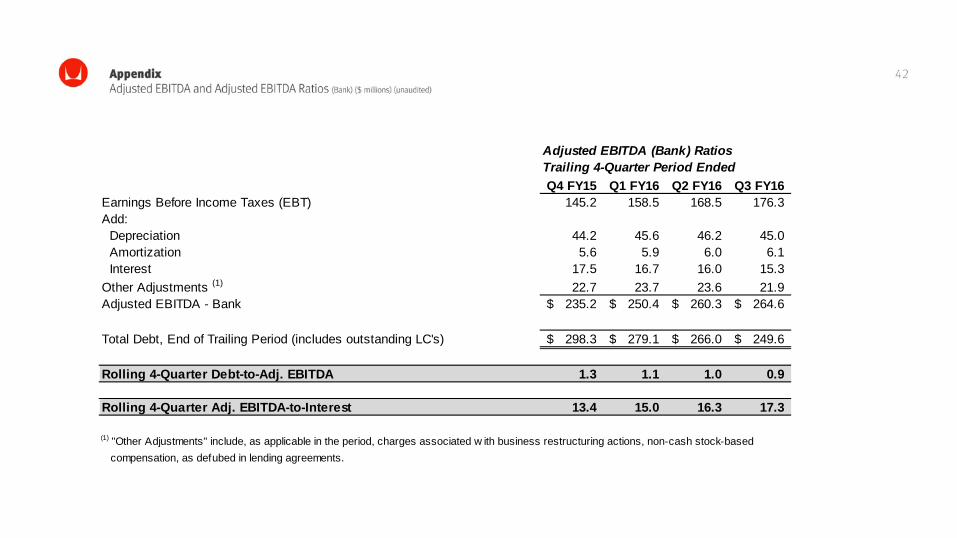
Adjusted EBITDA (Bank) RatiosTrailing 4-Quarter Period EndedQ4 FY15 Q1 FY16 Q2 FY16 Q3 FY16
Earnings Before Income Taxes (EBT) 145.2 158.5 168.5 176.3 Add: Depreciation 44.2 45.6 46.2 45.0 Amortization 5.6 5.9 6.0 6.1 Interest 17.5 16.7 16.0 15.3 Other Adjustments (1) 22.7 23.7 23.6 21.9 Adjusted EBITDA - Bank 235.2$ 250.4$ 260.3$ 264.6$
Total Debt, End of Trailing Period (includes outstanding LC's) 298.3$ 279.1$ 266.0$ 249.6$
Rolling 4-Quarter Debt-to-Adj. EBITDA 1.3 1.1 1.0 0.9
Rolling 4-Quarter Adj. EBITDA-to-Interest 13.4 15.0 16.3 17.3
(1) "Other Adjustments" include, as applicable in the period, charges associated w ith business restructuring actions, non-cash stock-based compensation, as defubed in lending agreements.