Embed Size (px)
Citation preview
Independent Wheelchair Transfers in the Built Environment: How Transfer Setup Impacts PerformancePhase 2: Final Report
Prepared for the United States Access Board
1
Independent Wheelchair Transfers in the Built Environment: How Transfers Setup Impacts Performance
REPORT PREPARED FOR: U.S ACCESS BOARD, WASHINGTON, DC
Authors:Alicia Koontz, PhD, RETSarah Bass, BSRory A. Cooper, PhD
November 18, 2015
This report is available on the web:http://herl.pitt.edu/ab/
2

DISCLAIMER
This study was conducted by the Human Engineering Research Laboratories (HERL) from the University of Pittsburgh and VA Pittsburgh Health Care System with support from the Access Board and the Department of Education. The study does not necessarily represent the views of the Access Board and readers should not assume any endorsement by the federal government.
3
Table of ContentsEXECUTIVE SUMMARY...........................................................................................................7
Key Study findings:...........................................................................................................7
BACKGROUND............................................................................................................................9
Study Objectives................................................................................................................11
METHODOLOGY......................................................................................................................12
Participants........................................................................................................................12
Design Criteria for the Transfer Station............................................................................12
Initial Measures and Transfer Setup..................................................................................18
Transfer Protocols..............................................................................................................20
Protocol A: Adjustable Height...........................................................................................22
Protocol B: Adjustable Height Protocol: Grab Bar Option...............................................23
Protocol C: Adjustable Height: Grab Bar and Backrest Option........................................23
Protocol D: Adjacent Two Step Transfer.........................................................................23
Protocol E: Two Step Transfer with Ramp........................................................................24
Data Analysis.....................................................................................................................24
RESULTS.....................................................................................................................................25
Participants........................................................................................................................25
Detailed Age Demographics..............................................................................................26
Self-Reported Disability Types Demographics.................................................................27
Mobility Use Demographics..............................................................................................28
Transfer Protocols..............................................................................................................30
Highest and Lowest Heights Obtained..............................................................................34
4
No Grab Bars/No Backrest.............................................................................................35
Two Step Transfers Attainable Heights.............................................................................35
Questionnaire on Two Step Transfers...............................................................................36
Space Needs.......................................................................................................................37
Preferred Seat Widths........................................................................................................45
Effect of Handhelds on Transfer Height............................................................................45
IMPLICATION FOR STANDARDS AND DESIGN..............................................................48
Transfer Heights................................................................................................................49
Two Step Transfer Evaluation...........................................................................................50
Clear Space Evaluation......................................................................................................51
Seat Width Evaluation.......................................................................................................53
Grab Bar and Backrest Evaluation....................................................................................54
Sample Size Estimation.....................................................................................................55
Study Limitations...............................................................................................................56
CONCLUSION............................................................................................................................59
ADDENDUM A: LIST OF TERMS..........................................................................................61
ADDENDUM B: LIST OF ABBREVIATIONS.......................................................................63
ADDENDUM C: PARTICIPANT RESPONSES TO TWO STEP TRANSFERS FOR
PROTOCOLS D AND E.............................................................................................................64
ADDENDUM D: COMPARISON OF DEMOGRAPHICS AND TRANSFER HEIGHT
BETWEEN PHASE 1 AND PHASE 2 OF THE STUDY........................................................66
ADDENDUM E: COMPARSISON BETWEEN NDVWC AND HERL SUBJECTS...........72
ADDENDUM F: RELATIVE HEIGHT DIFFERENCES......................................................77
5
ADDENDUM G: COMPARISON OF TRANSFER ABILITIES BETWEEN MEN AND
WOMEN.......................................................................................................................................79
REFERENCES............................................................................................................................81
6
Executive SummaryPerforming the task of transferring oneself from one surface to another is highly essential for
wheeled mobility device users in order to accomplish everyday activities such as going to
work/school, interacting with friends, and participating in the community. Limited data is
available concerning how the built environment impacts independent wheelchair transfer
performance. The United States Access Board and the National Institute on Disability and
Rehabilitation Research sponsored a multi-year research study on independent transfers to
collect more information on this issue. In this phase of the study, an international workgroup of
experts came together to exchange ideas and information related to independent transfers and
generate a future research agenda. Workgroup participant remarks combined with the ideas of
Access Board members and University of Pittsburgh researchers were used to design a new
transfer data collection tool. The objectives of the data collection part of this phase of the transfer
study was to use this tool to investigate the impact of various environmental features on
performance. These features included how high and how low wheeled mobility device users can
transfer to a platform above and below their mobility device seat, how high and how low users
can transfer between two platform steps, clear floor space dimensions, and the use and impact of
grab bars.
Key Study findings: The majority of participants (e.g. the 5th percentile or approximately 95% of the study
sample) could transfer independently to a platform at a height that was within one inch of
the mean wheelchair or scooter seat to floor height (22.1 inches) and to a platform that
was 27 inches wide.
Up to 78% of the study participants used grab bars when they were added to the platform
and they helped participants to transfer higher and lower than they could without them.
7
Grab bars were used more frequently (by up to 94% of participants) when performing
transfers between two platform steps verses transferring between the wheelchair and one
platform.
When multiple transfers are required to reach higher or lower surfaces 15.2% of the
participants in this study could not complete them at any height (11 out of 72
participants; 8 of which wouldn’t attempt to transfer at all and 3 of which attempted the
transfer but failed in the process).
Of the participants who attempted and were successful with performing two-step
transfers, the 50th percentile could attain a 7 inch vertical height difference which is
below the maximum allowable height difference in the standards of 8 inches. This was
true for both types of two-step transfers evaluated in this study. One two-step transfer
included a ramp in between two platform steps whereas the other two-step transfer had no
ramp or space between the first and second platform steps.
A 104 inch wide by 55.5 inch deep clear floor space in front of the platform
accommodated 100% of the study participants when considering all types of transfers
evaluated in this study.
A standard turning area of 60 inches by 60 inches accommodated between 52% to 66%
of the participants depending on the type of transfer (with or without grab bars and
backrest) and direction of transfer (moving to or moving from the platform).
8
BackgroundWheelchair use in the United States is at an all-time high and continues to grow. In 2010
approximately 3.6 million non-institutionalized Americans aged 15 and older required a
wheelchair to assist with mobility compared to 2.7 million Americans who were using
wheelchairs in 2002 [1, 2]. For those who use a wheeled mobility device (WMD) transfers are
required to perform essential tasks of daily living such as bathing, toileting and driving (see
Addendum B for a complete listing of all the abbreviations used in this report). Transfers are also
required for enabling participation in a wide variety of community settings such as restaurants,
parks, pools and medical offices. On average transfers are performed between 11 and 20 times
per day [3, 4]. Independent transfers are ranked among the most strenuous tasks of daily living
because of the high mechanical demands they place on upper limbs [5]. The built environment
can either increase or decrease the effort required to perform independent transfers [6].
Environments that require more effort to transfer ultimately limit the numbers of WMD users
who can access them.
Current accessibility standards include criteria related to seat height, clear floor space,
and grab bar placement in places where transfers are expected [7]. There is a general concern
that the standards are outdated as they were developed in the 1980's and mobility devices and the
demographics of those using these devices have evolved over the last few decades. Wheelchair
technology has also changed since these standards were made. Power wheelchairs are larger in
size due to add-ons like powered recline and tilt and the users themselves have also grown with
more bariatric chairs being developed. Over the last decade, accessibility standards have also
expanded and the number of seating surfaces designed for transfer has increased to more
elements designed for transferring to elements at recreational facilities like play areas, swimming
pools, and amusement rides.
9
In order to gather data that would support updates and expansions to the guidelines in
these and other areas, a two phase study, including the one that is being reported on in this
report, have been completed. The first phase evaluated the state of the science concerning
independent wheelchair transfers and in particular how various aspects of the built environment
affect the transfer process. This phase also included an experimental study to examine the design
standards for amusement park rides and transfers to other similar kinds of elements [8]. One-
hundred and twenty adult WMD users were tested and the primary outcome measures collected
were the maximum and minimum attainable vertical heights of the transfer surface, maximum
gap distance between the WMD and transfer surface, grab bar use, and WMD space needs (see
http://herl.pitt.edu/ab/ Phase I Final Report for detailed results on this study).
While the first phase addressed some of the key environmental issues concerning
transfers, there were some additional issues that the Access Board felt needed further research.
For instance, phase 1 was unable to address all possible elements that might be encountered in
the environment. Transfers steps, which require performing multiple transfers from one platform
to another platform, are one option that is provided for adults and children when transferring
into or out of an amusement ride car, a swimming pool or a piece of playground equipment to
help them overcome the large vertical distances separating the WMD height and the target seat
height. Research is needed to know if the current requirements for transfer steps (e.g. step
widths, step heights, grab bar setup and clear floor space in front of the first step) meet the needs
of current WMD users. Another place where more evidence is needed concerns the proposed
standard for transfers to medical diagnostic equipment. For example, the appropriate transfer
surface dimensions, vertical heights from the floor, floor space around the exam surfaces,
10
backrests and handheld dimensions are all issues that are under discussion and that require
further research.
With the procurement of additional funding, a second phase of research was conducted.
This phase included conducting a web-based live workshop to act as a forum for exchanging
ideas and information related to the first phase of research and to identify research priorities
related to independent transfers in the built environment (see http://herl.pitt.edu/ab/ IWT
Workshop Proceedings for detailed results on this study). Using the feedback collected during
the workshop combined with the need for additional information on platform transfers and
transfer steps, a follow up study was performed. This report describes the details and results of
this study.
Study Objectives The purpose of this study was to examine independent transfers to and from a WMD and a
simple platform, with and without the use of grab bars and/or a backrest, and transfers between
two platforms (e.g. two-step transfer). The specific objectives were to:
1. Define population-based percentiles for:
a) Level, highest and lowest heights for transfers to i) a seat with no handhelds present,
ii) a seat with grab-bars and iii) a seat with grab-bars and a backrest.
b) Seat widths needed for each level, highest and lowest transfers to i) a seat with no
handhelds present, ii) a seat with grab-bars and iii) a seat with grab-bars and a backrest
c) Floor space needed for level, highest and lowest height transfers to seats without
handhelds, with grab-bars, and with grab bars and a backrest
d) Highest and lowest heights for a two-step transfer with and without an integrated ramp
2. Determine user preferences for grab bar and backrest heights and prevalence of grab bar
and backrest use in each type of transfer.
11
3. Determine the relationship between grab bar and backrest presence and transfer ability.
We hypothesized that grab bars would enable participants to perform higher or lower
transfers.
MethodologyThis study was approved by the University of Pittsburgh's Institutional Review Board and all
participants provided informed consent before participating in any test procedures.
Participants The target sample populations were individuals who live in the community and use a wheeled
mobility device, as well as having the ability to transfer independently and represent a broad
spectrum of disabilities. Participants were eligible to participate if they (1) were at least 7 years
old, (2) self-reported ability to perform independent transfers to/from a WMD with or without a
transfer aide, (3) owned a WMD, (4) have been using the WMD for at least one year.
Participants were excluded if they had (1) significant upper extremity pain or injury that would
inhibit their ability to transfer, (2) any active pressure sores, (3) any history of pressure sores that
would be exacerbated with transfer activity and (4) cognitive impairments that would impair
following simple instructions.
Participants were tested at the 28th National Disabled Veterans Winter Sports Clinic in
Snowmass Village, Colorado during March 2014; at the Hiram G Andrews Center in Johnstown,
Pennsylvania during September 2013 and at the Human Engineering Research Laboratories in
Pittsburgh, Pennsylvania between July 2013 and July 2014.
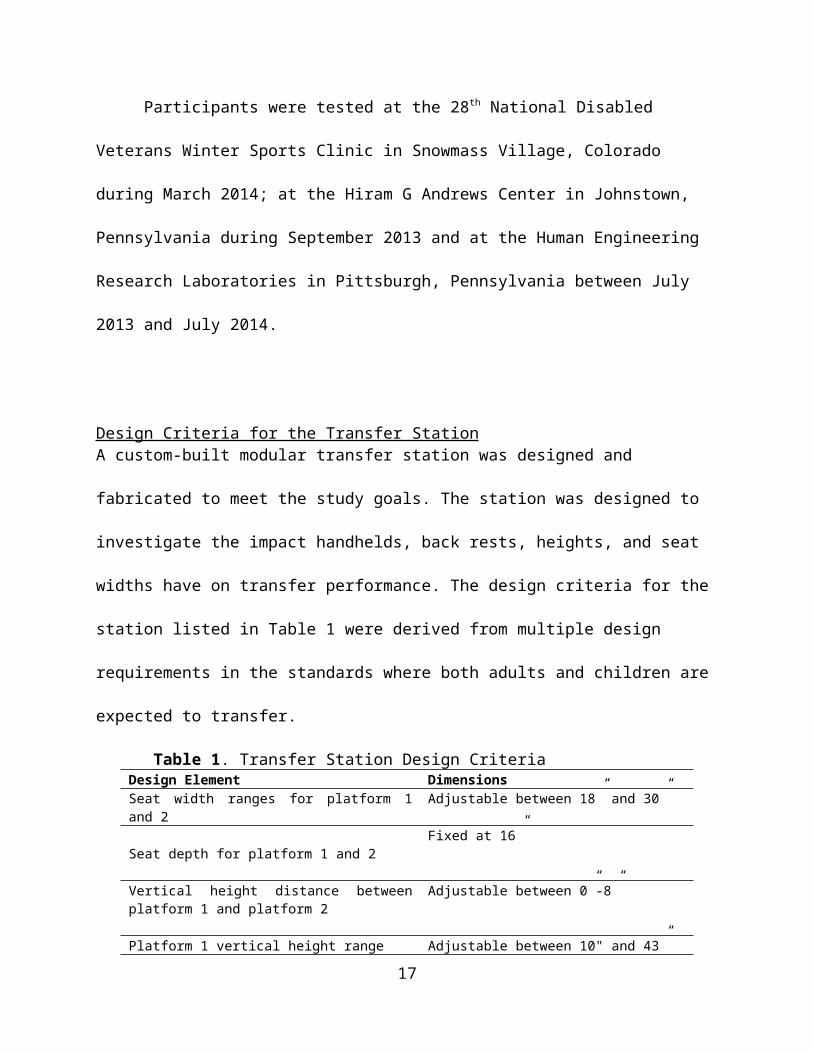
Design Criteria for the Transfer Station A custom-built modular transfer station was designed and fabricated to meet the study goals. The
station was designed to investigate the impact handhelds, back rests, heights, and seat widths
12
have on transfer performance. The design criteria for the station listed in Table 1 were derived
from multiple design requirements in the standards where both adults and children are expected
to transfer.
Table 1. Transfer Station Design CriteriaDesign Element DimensionsSeat width ranges for platform 1 and 2 Adjustable between 18” and 30”
Seat depth for platform 1 and 2Fixed at 16”
Vertical height distance between platform 1 and platform 2
Adjustable between 0”-8”
Platform 1 vertical height range Adjustable between 10" and 43”
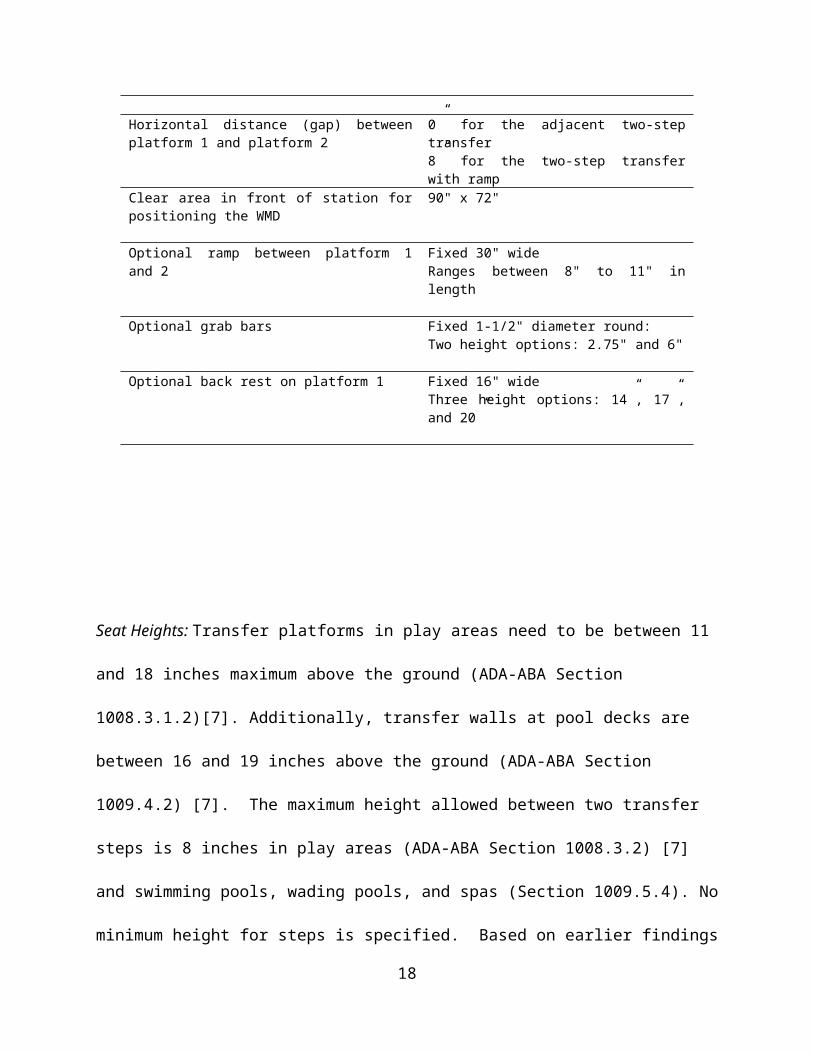
Horizontal distance (gap) between platform 1 and platform 2
0” for the adjacent two-step transfer8” for the two-step transfer with ramp
Clear area in front of station for positioning the WMD
90" x 72"
Optional ramp between platform 1 and 2 Fixed 30" wideRanges between 8" to 11" in length
Optional grab bars Fixed 1-1/2" diameter round:Two height options: 2.75" and 6"
Optional back rest on platform 1 Fixed 16" wideThree height options: 14”, 17”, and 20”
Seat Heights: Transfer platforms in play areas need to be between 11 and 18 inches maximum
above the ground (ADA-ABA Section 1008.3.1.2)[7]. Additionally, transfer walls at pool decks
are between 16 and 19 inches above the ground (ADA-ABA Section 1009.4.2) [7]. The
maximum height allowed between two transfer steps is 8 inches in play areas (ADA-ABA
Section 1008.3.2) [7] and swimming pools, wading pools, and spas (Section 1009.5.4). No
13
minimum height for steps is specified. Based on earlier findings (Phase 1 Final Report), there
was concern that the 8 inch maximum may not accommodate some wheelchair users. Because of
these concerns the station was designed to allow for adjustments in height up to, but not to
exceed the 8 inch maximum height allowance.
Seat width and depth: ADA-ABA currently requires a minimum entry point of 24 inches for
transfer steps in play (Section 1008.3.1.1) [7] and pool areas (Section 1009.4.5) [7].
Additionally a 30 inch minimum width has been proposed medical diagnostic exam tables. We
selected 18 inches minimum seat width as a starting point with the potential to grow to 30 inches.
The seat depth was not a primary variable of interest and was fixed at 16 inches. This dimension
is within the range of seat depths allowed for transfer steps in play and pool areas and for
proposed diagnostic equipment (14 to 17 inches). Transfer surfaces on the station were padded
with 1" foam and a vinyl cover for comfort and to protect the skin during the experimental
protocol.
Ramp: A ramped surface was designed to insert between two steps and serve as an integrated
sliding board to assist with the transfers by bridging the gap between steps. Ramped surfaces
used for transferring are not currently part of the standards but are present in some real world
transfer situations. For example, some amusement park rides have sloped surfaces built into the
structure of the ride vehicle to help individuals transfer into and out of the vehicle. A ramped
surface was made to attach between the two transfer platforms ('steps') and span across an 8 inch
wide space. The angle of the ramp varies as the second platform height changes and the ramp
grows or shrinks in size so as to maintain a constant 8-inch gap between the two transfer steps.
14
The ramp had a constant width of 30 inches and was 1 inch thick. The minimum length was 8
inches and the maximum length was 11 inches.
Grab bars: Section 609 of the ADA-ABA standards [7] includes provisions for grab bars in
areas where transfers are expected. Grab bars can have either circular or non-circular cross-
sections [7]. Circular grab bars are more commonly used and were selected for testing. The
outside diameter dimension range for circular cross-section grab bars are between 1.25 and 2
inches. A 1.5 inch diameter was chosen for the study. Section 1009.4.5 of ADA-ABA [7]
describes grab bars to be used on swimming pool, wading pool, and spa transfer walls. This
standard gives the grab bar height range of 4 to 6 inches from the wall to the top of the gripping
surface. Two grab bar height options were designed for the study; a 6-inch and a 2.75-inch. The
2.75-inch was added to examine the effects of a handheld when located closer to the transfer
surface. A 4 inch grab bar was not made because it was felt that the differences between the 6
inch and 4 inch would be negligible. The grab bars were designed to be 16 inches long so that
they could span the depth of the platforms. Section 1009.4.5 of the ADA standards also gives the
dimensions for grab bars spacing [7]. When two grab bars are provided there should be at least a
24-inch clearance between them. Since transfer seat width was a modifiable variable in the study,
the grab bars were designed to have a range between 18 and 30 inches. This allows for another 6
inches below and above the standard to be evaluated (note: provisions for grab bars were applied
to the handhelds which are referred to in several places throughout this report).
Backrests: The backrest design for platform 1, the first surface that participants transferred to
from their WMD as seen in Table 2, was based on bench seat back supports in section 903.5 of
the ADA [7]. Back supports should be a minimum of 18 inches from the seat surface to the top
15
of the support. Three different height back supports were designed for this study; a 14-inch, a 17-
inch, and a 20-inch. These heights were chosen because they range from below and above the
current minimum requirement. They were designed to be easily added and taken off of the
station by sliding them in and out of two circular slots located in the scissor lift table top. Each
backrest was also designed to have a 5o angle for comfort.
Clear space: A grid 72 inches long by 90 inches wide was used to facilitate the recording of
space requirements for each WMD user (Figure 1). This is more space than what is required in
the standards. If a person required space beyond the size of the grid, the additional distance was
measured and recorded. The grid was positioned such that it was centered with the middle of the
transfer station. A coordinate system was assigned to the grid so that each cell was given an
alphabetic (y-direction) and numeric (x-direction) name. The center point (0,0) was located on
the line in-between the grid values A15 and A16. There were a total of 720, 3 X 3 inch cells in
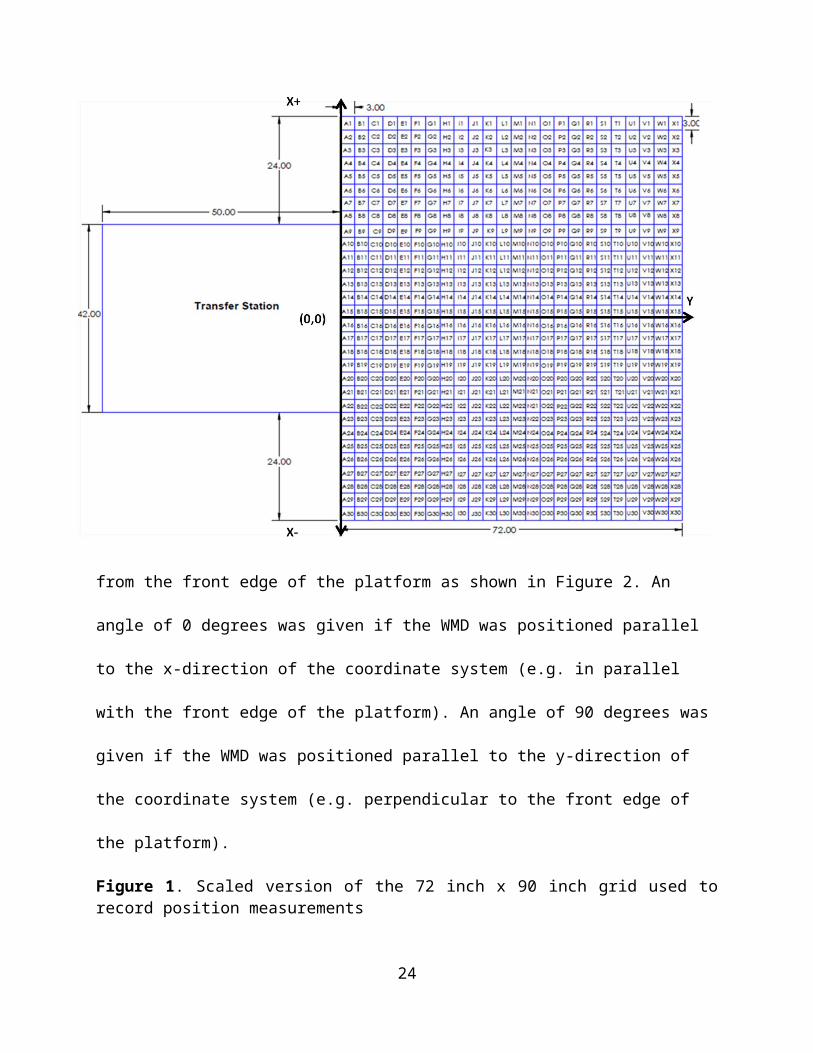
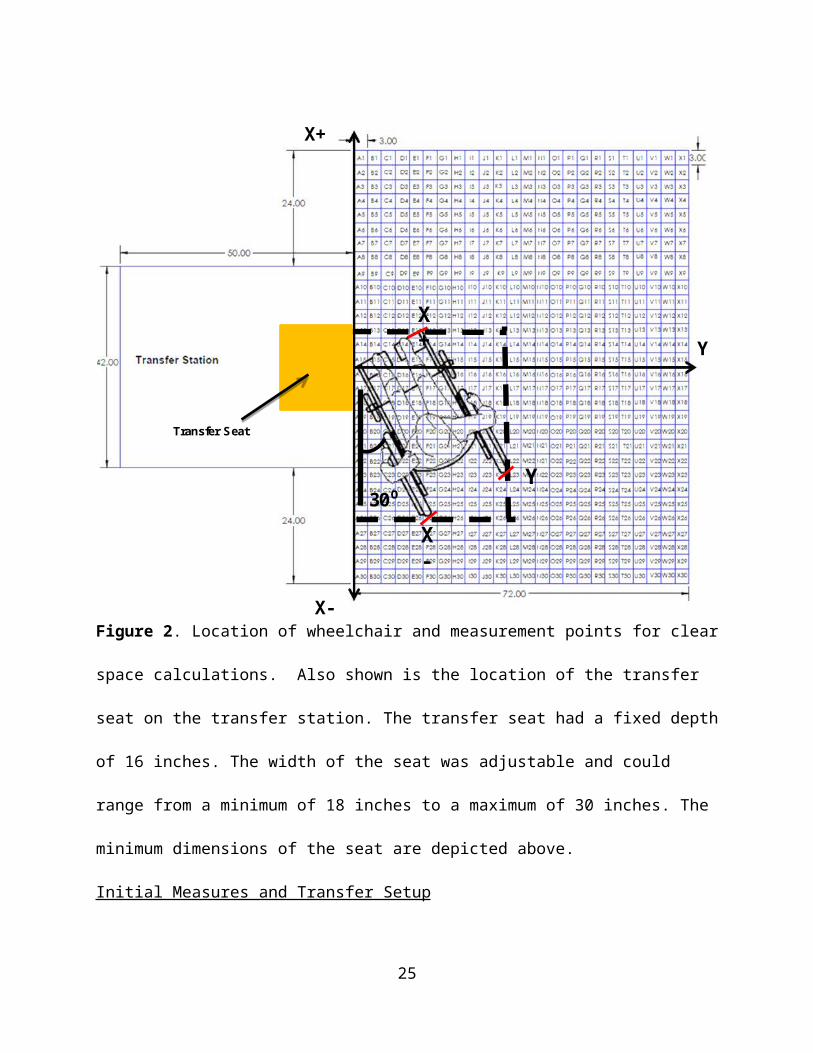
the grid. To calculate the space, three points were recorded for transfers to and from the
platform: a point to the right of center, a point to the left of center, and a depth value (Figure 2).
These points were found by recording each WMD's outermost points on the grid. When
calculating both right of center and left of center values any point right of the reference line
(A15/A16) was assigned a positive (+) value, while any point left of the reference line was
assigned a negative (-) value. For the depth, all values were positive (+). Space data was
recorded as the maximum distance away from the A15/A16 reference line to the right (right of
center), the maximum distance away from the A15/A16 reference line to the left (left of center),
and the maximum distance away from the front edge of the platform (depth). The angle the
WMD was positioned with respect to the transfer station was measured from the front edge of
the platform as shown in Figure 2. An angle of 0 degrees was given if the WMD was positioned
16
parallel to the x-direction of the coordinate system (e.g. in parallel with the front edge of the
platform). An angle of 90 degrees was given if the WMD was positioned parallel to the y-
direction of the coordinate system (e.g. perpendicular to the front edge of the platform).
Figure 1. Scaled version of the 72 inch x 90 inch grid used to record position measurements
17
Y
X+
X+
X-
Y30⁰
X-
Transfer Seat
Figure 2. Location of wheelchair and measurement points for clear space calculations. Also
shown is the location of the transfer seat on the transfer station. The transfer seat had a fixed
depth of 16 inches. The width of the seat was adjustable and could range from a minimum of 18
inches to a maximum of 30 inches. The minimum dimensions of the seat are depicted above.
Initial Measures and Transfer Setup Wheelchair measurements were completed without the person seated in their wheelchair. The
device seat to floor height was measured as the linear distance between the front of the seat,
center-line point on top of the cushion (if present) and the floor (Figure 3 left). This location was
chosen to account for any hammocking, wear or compression of the seat upholstery and/or
cushion. However, for the setup of the baseline level transfer (when the person and mobility
18

device were in a position next to platform ready to transfer), if there was a noticeable difference
(one inch or more) between the occupied seat-to-floor height at the same center-line point at the
front of the seat (plus cushion if present) (Figure 3 right) and the height of the platform which
was initially set based on the unoccupied seat to floor height, we adjusted the platform to match
the occupied seat-to-floor height and this new measurement replaced the unoccupied
measurement in the data set. This methodology is based on ANSI/RESNA standards used to
measure the wheelchair seat to floor height when conducting standards testing. This approach is
also widely promoted in rehabilitation research (A Clinical Application Guide to Standardized
Wheelchair Seating Measurements of the Body and Seating Support Surfaces, See References
for full guidelines)[9].
Figure 3: Seat height measurements in an unoccupied (20.5" seat to floor height) and occupied
wheelchair (19.5" seat to floor height).
19
Transfer Protocols For each transfer, participants were asked to position themselves next to the platform as they
normally would to prepare for a transfer. The angle of their WMD relative to the front of the
platform and the x and y positions of the WMD using the grid as described above were recorded
(see Figure 3). The first platform was adjusted to be level with the participant’s WMD seat
height. The barricades shown in Table 2 (top picture) were adjusted to the participant’s preferred
seat width. The participant transferred from their own WMD to the first platform and back to his
or her device. The participant's seat width was recorded. The next five protocols (A-E) were
performed in random order (Table 2). After each transfer in each protocol, any changes made to
device positioning (if any), use of a transfer board, and surface(s) used for the leading hand (e.g.
reaching to new surface) and trailing hand (e.g. left behind during move to new location) were
recorded. For each transfer for protocols A-C, a measurement of how high and how low a
participant transferred was recorded. This measurement was made from the ground to the top of
the yellow seat cushion that is on the station (Table 2) when the participant was not seated on the
station after they had returned to their mobility device seat; this value was recorded in inches for
all transfers.
20
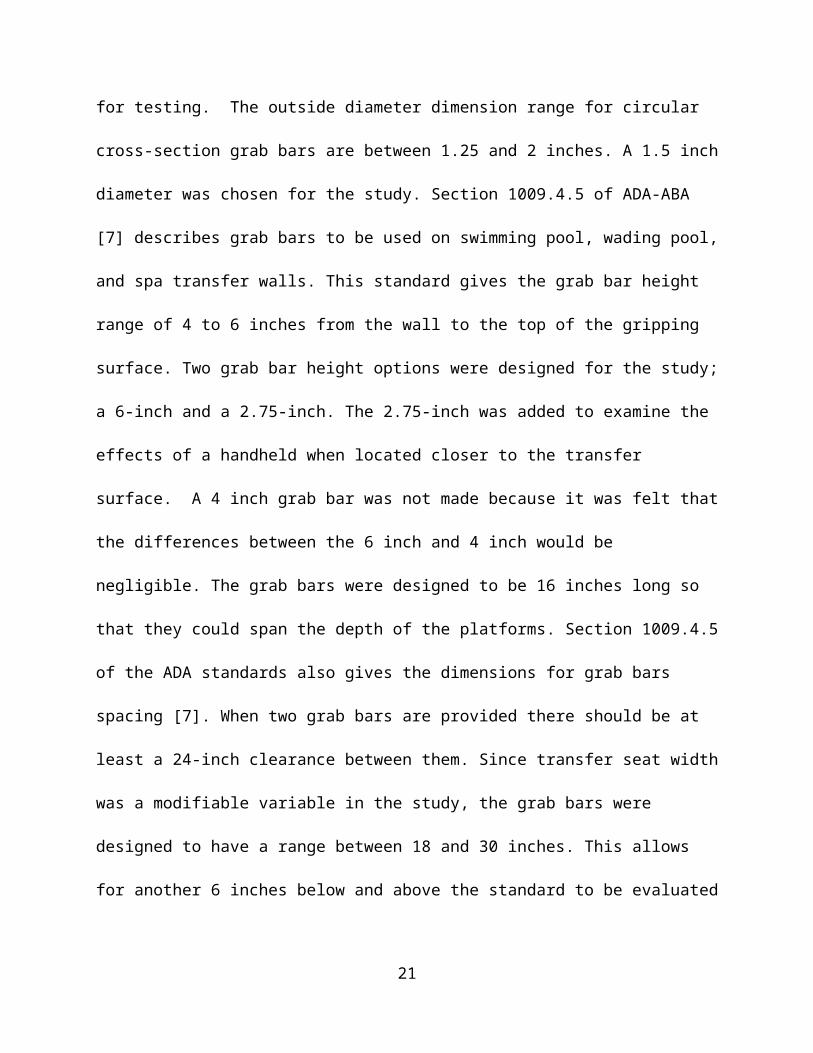
Table 2. Summary description and experimental setup for the five protocols (A-E)Protocol A: Adjustable Height Level height, maximum height transfer and
minimum height transfer Primary measures: maximum/minimum
heights attained, preferred seat width, WMD angle and position
Barricades
Transfer SeatTransfer Station
Protocol B: Adjustable Height/Grab Bars
Level height, maximum height transfer and Minimum height transfer
Participant selects which grab bars to use (2.75in or 6in) and seat width
Primary measures: maximum/minimum heights attained, preferred seat width, WMD angle and position
Grab Bars
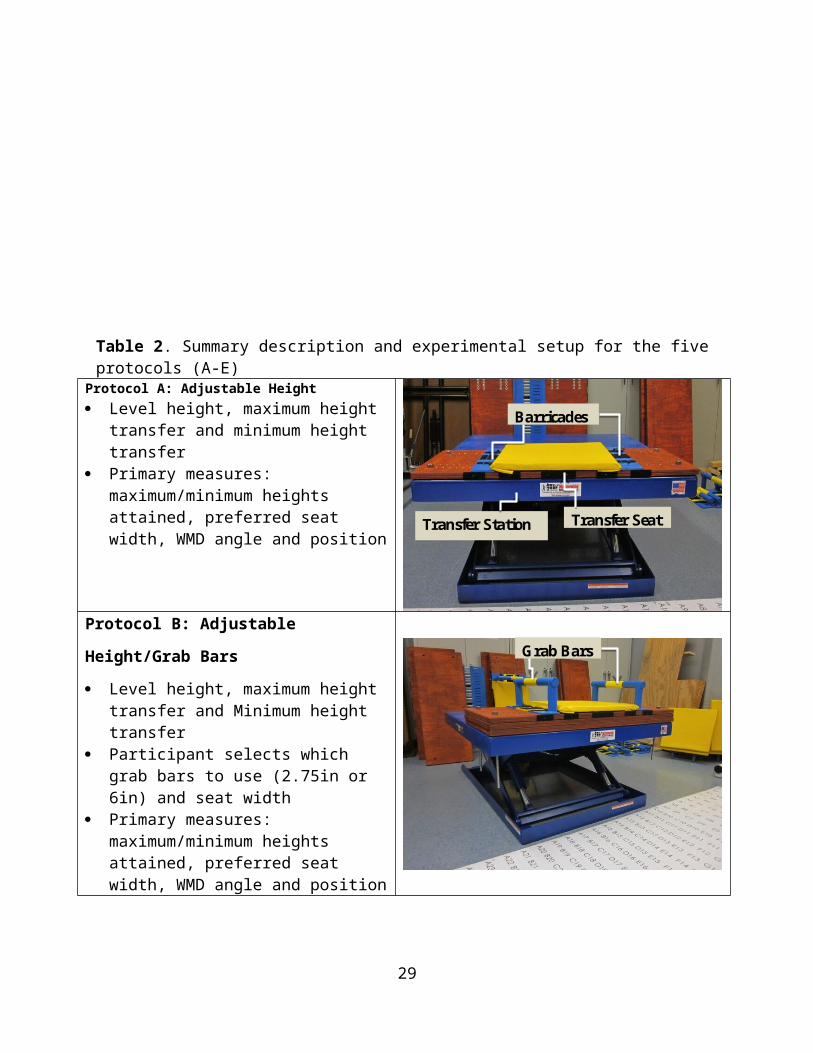
Protocol C: Adjustable Height Backrest and Grab Bar Options Level height, maximum and minimum
height transfer Participants choose a backrest size (16” X
14”, 16” X 17”, and 16” X 20”) and seat width
Participant selects which grab bars to use (2.75in or 6in) and seat width
Primary measures: maximum/minimum heights attained, preferred seat width, WMD angle and position
Backrest
21

Protocol D: Adjacent Two-Step Level transfer from WMD to Platform 1
and from Platform 1 to a higher Platform 2 Level transfer from WMD to Platform 1
and from Platform 1 to a lower Platform 2 Participants choose grab bar heights and
seat widths Primary measures: maximum and
minimum heights attained, preferred seat width, WMD angle and position
Platform 2
Platform 1
Protocol E: Two-Step with Ramp Level transfer from WMD to Platform 1
and from Platform 1 to a higher Platform 2 Level transfer from WMD to Platform 1
and from Platform 1 to a lower Platform 2 Participants choose grab bar heights and
seat widths Primary measures: maximum and
minimum heights attained, preferred seat width, WMD angle and position
Platform 2
Platform 1
Adjustable Height Ramp
Table 2. Alternative Text Description: table 2 has two column
Protocol A: Adjustable Height This protocol consisted of two parts: maximum height transfer and a lowest height transfer. From
the Initial Setup, the scissor lift was adjusted incrementally in height so that platform 1 could be
made higher or lower than the participant’s seat. The amount of vertical distance that the seat
was raised/lowered each time depended on the participant's perceived and observed transfer
abilities. The participant was asked to perform a transfer at each height increment until the
platform was raised/lowered to a level that they no longer felt they could perform a transfer
22

based on their own judgment or that of the study personnel. The maximum and minimum
transfer heights that were attainable were recorded.
Protocol B: Adjustable Height Protocol: Grab Bar Option This protocol consisted of three parts: level height transfer, maximum height transfer, and a
lowest height transfer. The barricades from Protocol A were replaced with grab bars of two
varying heights (2.75 inches and 6 inches) depending on the participant’s preference. They were
also adjusted to the participant’s preferred seat width if different from the initial setup. The rest
of the protocol followed the same procedure as Protocol A where the participant transferred to
the first platform and back.
Protocol C: Adjustable Height: Grab Bar and Backrest Option This protocol consisted of three parts: level height transfer, maximum height transfer, and a
lowest height transfer. Protocol C used the same grab bar set up as Protocol B, but added a
backrest attached behind platform 1. The participant chose one of three different height backrests
(16” X 14”, 16” X 17”, and 16” X 20”). The rest of the protocol followed the same as Protocol
B.
Protocol D: Adjacent Two Step Transfer This protocol consisted of two parts: level to a higher seat and level to lower seat. From Protocol
B the scissor lift was adjusted so that the first platform was set level with the participants WMD.
A second platform was added to the scissor lift behind platform 1 so that they were at a 90o angle
to each other. The vertical distance between platform 1 and 2 was adjusted incrementally in
height: higher and lower by adding one-inch boards to either platform. The participant was asked
to perform transfers to the first platform, to the second platform, back to the first platform, and
then finally back to his/her WMD. The vertical distance that the second platform was
raised/lowered each time depended on the participant's perceived and observed transfer abilities.
23
The participant was asked to repeat the transfers until the second platform was raised/lowered to
a level that they no longer felt they could perform a transfer based on their own judgment or that
of the study personnel. The maximum and minimum vertical distances that were attainable were
recorded.
Protocol E: Two Step Transfer with Ramp This protocol consisted of two parts: level to a higher seat and level to lower seat. As with
Protocol D, the first platform was set level with the participants WMD. An adjustable height
ramp was attached between platform 1 and platform 2. The ramp was used to get up to and down
from platform 2. The vertical distance between platform 1 and 2 was adjusted incrementally in
height: higher and lower by adding one-inch boards to either platform. The ramp was capable of
growing in length as the vertical distance between platforms grew. The participant was asked to
perform transfers to platform 1, to platform 2 (via the ramp), back to platform 1, and then finally
back to his/her WMD. The vertical distance that the second seat was raised/lowered each time
depended on the participant's perceived and observed transfer abilities. The participant was asked
to repeat the transfers until platform 2 was raised/lowered to a level that they no longer felt they
could perform a transfer based on their own judgment or that of the study personnel. The
maximum and minimum vertical distances that were attainable were recorded.
Data Analysis Descriptive statistics were used to find the population-based percentile level, highest, and lowest
heights for transfers for the one-step transfer protocols A, B, and C and the two-step transfer
protocols D and E. The 5th, 25th, 50th, 75th, and 95th percentiles were recorded along with the
minimum and maximum heights attained for each part of each protocol. A repeated measures
analysis of variance (ANOVA) statistical test was used to evaluate the effects of adding grab
24
bars and a backrest to the station with regards to the maximum and minimum heights achieved
with a significance level set at α<0.05.
For protocols A, B and C percentages were calculated for the space needed to transfer to
and from the transfer station. Areas centered around the transfer station were defined and the
percentage of the study participants who were able to transfer in that area were calculated.
Percentages were calculated instead of percentiles due to the complexity of the measurements.
For example, the area measurement depends on two variables that cannot be analyzed separately:
the amount of space occupied by the physical dimensions of the WMD user and the actual
location of the WMD and user relative to the center of the first platform. Graphical techniques
were developed to illustrate the areas and locations that WMD users used to position themselves
relative to the station.
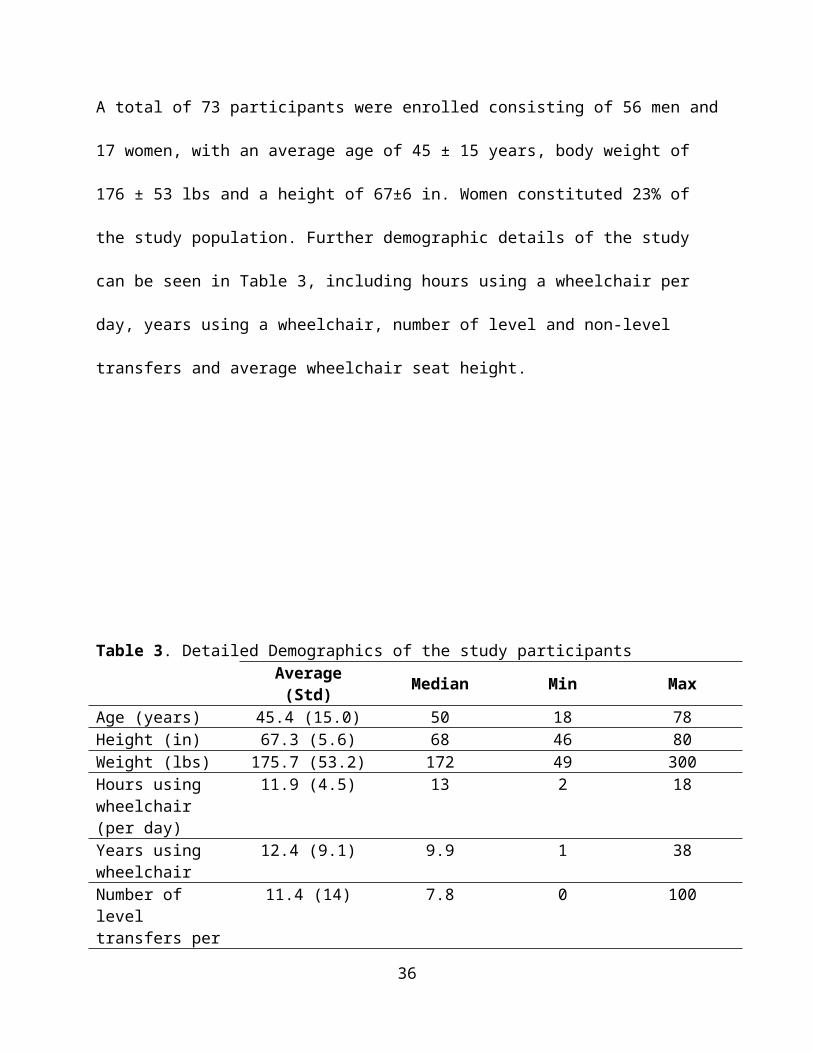
ResultsParticipants A total of 73 participants were enrolled consisting of 56 men and 17 women, with an average age
of 45 ± 15 years, body weight of 176 ± 53 lbs and a height of 67±6 in. Women constituted 23%
of the study population. Further demographic details of the study can be seen in Table 3,
including hours using a wheelchair per day, years using a wheelchair, number of level and non-
level transfers and average wheelchair seat height.
25
Table 3. Detailed Demographics of the study participantsAverage (Std) Median Min Max
Age (years) 45.4 (15.0) 50 18 78Height (in) 67.3 (5.6) 68 46 80Weight (lbs) 175.7 (53.2) 172 49 300Hours using wheelchair (per day)
11.9 (4.5) 13 2 18
Years using wheelchair
12.4 (9.1) 9.9 1 38
Number of level transfers per day
11.4 (14) 7.8 0 100
Number of non-level transfer per day
8.2 (14.2) 4 0 100
Seat Height (in) 22.1 (1.4) 22.0 19.0 27.5
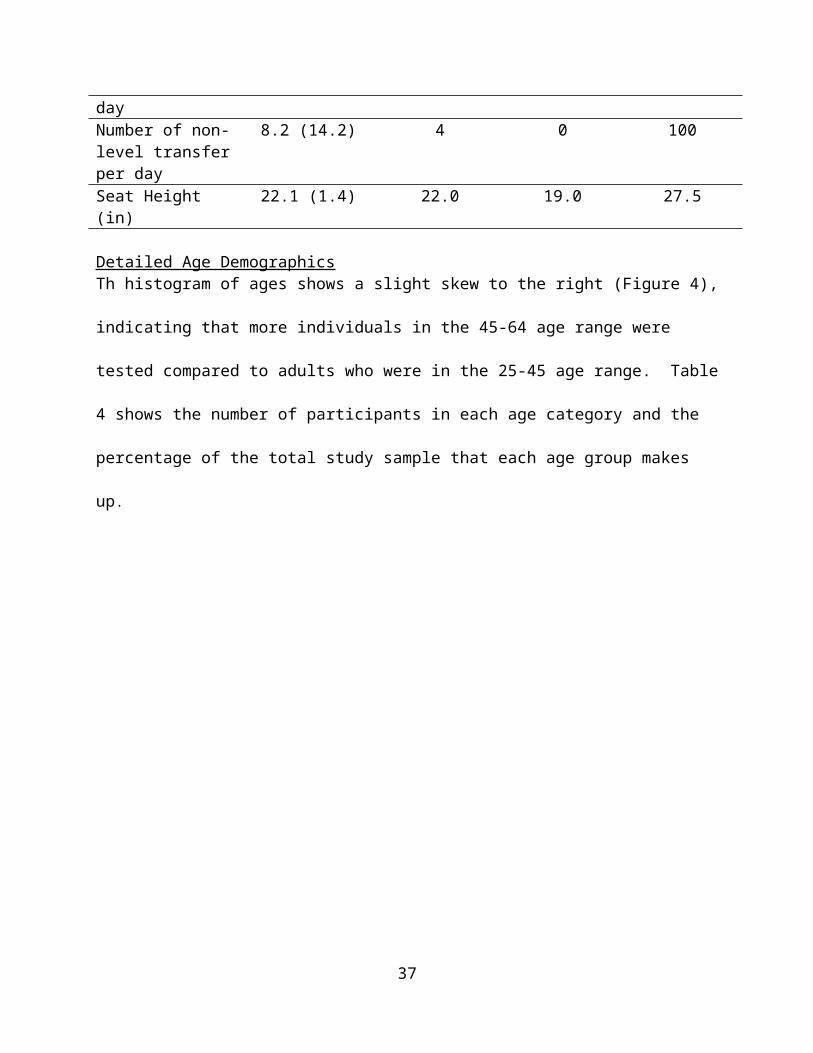
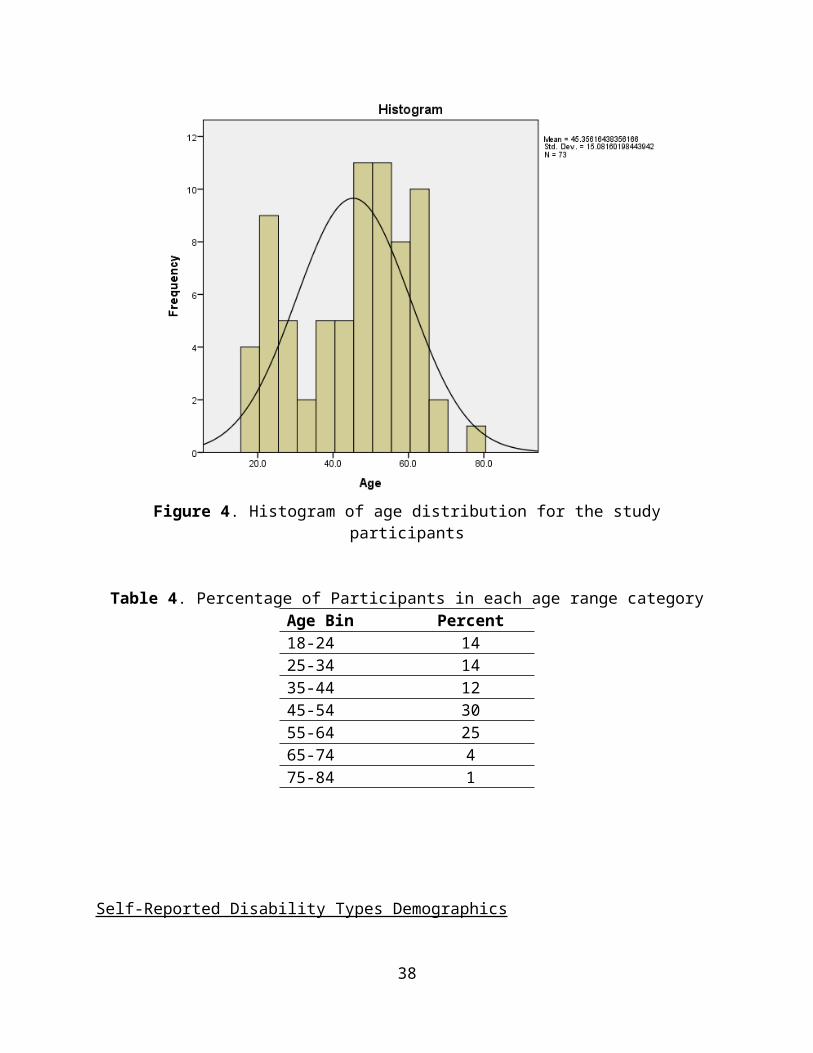
Detailed Age Demographics Th histogram of ages shows a slight skew to the right (Figure 4), indicating that more individuals
in the 45-64 age range were tested compared to adults who were in the 25-45 age range. Table 4
shows the number of participants in each age category and the percentage of the total study
sample that each age group makes up.
26
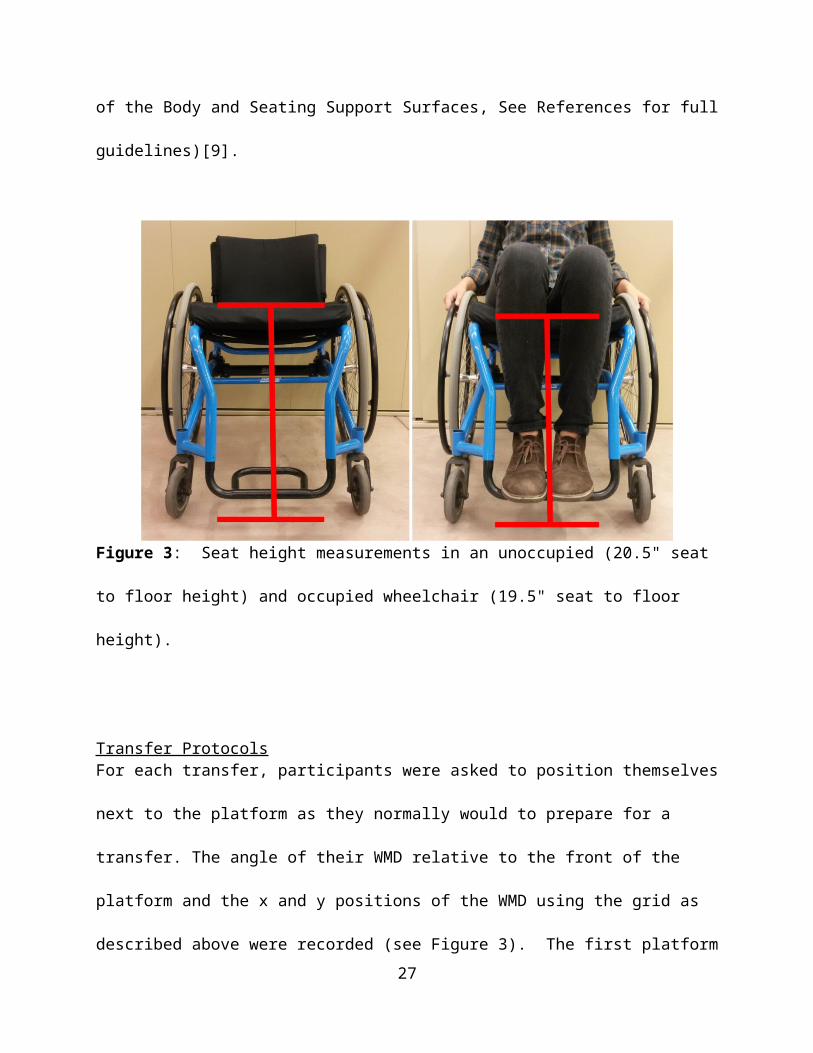
Figure 4. Histogram of age distribution for the study participants
Table 4. Percentage of Participants in each age range categoryAge Bin Percent18-24 1425-34 1435-44 1245-54 3055-64 2565-74 475-84 1
Self-Reported Disability Types Demographics A wide variety of disabilities were reported in the study. A detailed list of the self-reported
disabilities can be seen in Table 5 as well as the number of participants with each type of
disability and what percentage of the sample they make up.
27
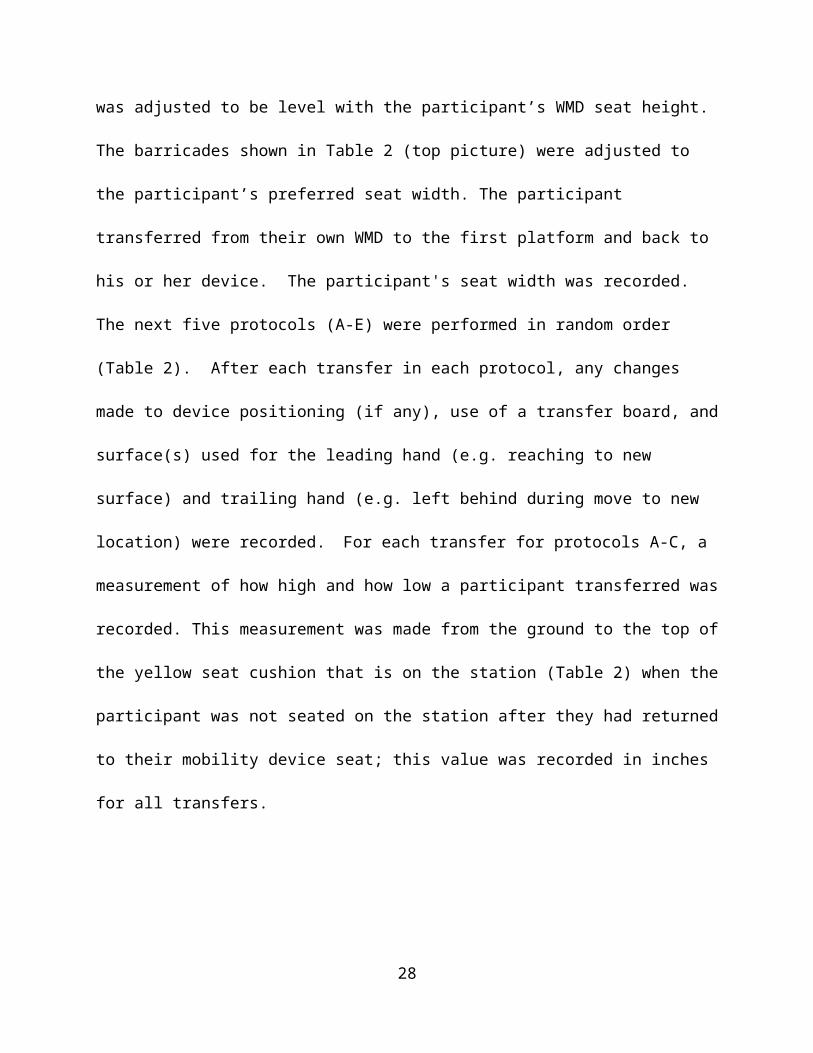
Table 5. Participants type of self-reported disability for the study populationDisability Number of ParticipantsSpinal cord injury 35 (48%)Multiple sclerosis 5 (7%)Cerebral Palsy 2 (3%)Lower extremity amputation 3 (4%)Spinal bifida 8 (11%)Multiple sclerosis and spinal cord injury 4 (6%)Osteogenesis imperfect 2 (3%)Muscular Dystrophy 1 (1.27%)Rheumatoid arthritis 1 (1.27%)Traumatic brain injury 3 (4%)Stroke 1 (1.27%)Ambulatory Dysfunction 1 (1.27%)Double lower extremity amputation and stroke 1 (1.27%)Adreno/Eukodystrophy 1 (1.27%)Cardiac complications 1 (1.27%)Guillian-Barre Syndrome (GBS) 1 (1.27%)Side effects of liver disease 1 (1.27%)Thrombocytopenia with absent radius (TAR Syndrome)
1 (1.27%)
SCI + Amputee 1 (1.27%)
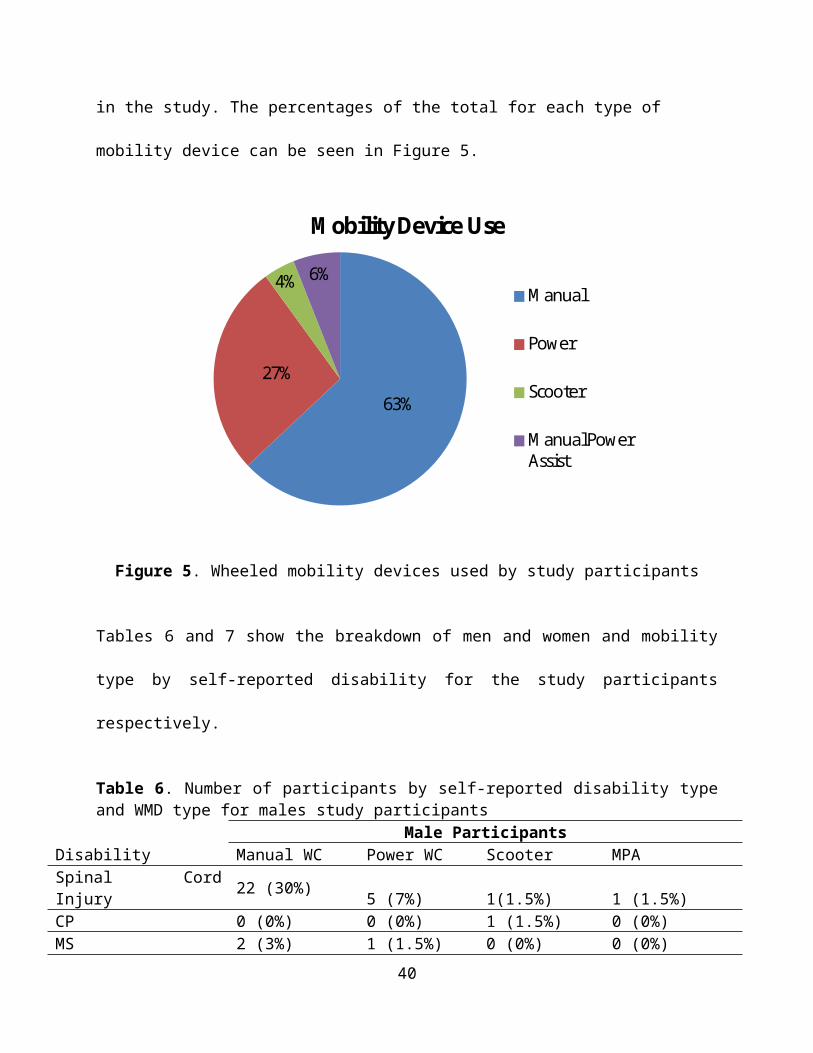
Mobility Use Demographics There were 46 manual wheelchairs users, 20 power wheelchair users, 3 scooter users and 4
manual power assist users enrolled in the study. The percentages of the total for each type of
mobility device can be seen in Figure 5.
28
63%
27%
4% 6%
Mobility Device Use
Manual
Power
Scooter
Manual Power Assist
Figure 5. Wheeled mobility devices used by study participants
Tables 6 and 7 show the breakdown of men and women and mobility type by self-reported
disability for the study participants respectively.
Table 6. Number of participants by self-reported disability type and WMD type for males study participants
Male ParticipantsDisability Manual WC Power WC Scooter MPASpinal Cord Injury 22 (30%) 5 (7%) 1(1.5%) 1 (1.5%)CP 0 (0%) 0 (0%) 1 (1.5%) 0 (0%)MS 2 (3%) 1 (1.5%) 0 (0%) 0 (0%)Amputee 8 (11%) 1 (1.5%) 0 (0%) 0 (0%)Spina Bifida 3 (4%) 1 (1.5%) 0 (0%) 0 (0%)Other 4 (5%) 4 (5.5%) 0 (0%) 2 (3%)Total 39 (53%) 12 (16%) 2 (3%) 3 (4%)
Table 7. Number of participants by self-reported disability type and WMD type for female study participants
29
Female ParticipantsDisability Manual WC Power WC Scooter MPASpinal Cord Injury 6 (8%) 1 (1.5%) 0 (0%) 1 (1.5%)CP 0 (0%) 2 (3%) 0 (0%) 0 (0%)MS 0 (0%) 2 (3%) 0 (0%) 0 (0%)Amputee 0 (0%) 0 (0%) 0 (0%) 0 (0%)Spina Bifida 0 (0%) 0 (0%) 0 (0%) 0 (0%)Other 1 (1.5%) 3 (4%) 1 (1.5%) 0 (0%)Total 7 (9.5%) 8 (11.5%) 1 (1.5%) 1 (1.5%)
Transfer Protocols In total 73 participants were enrolled the study. One participant was withdrawn because he self-
reported being able to independently transfer meeting inclusion criteria but when he came in to
do the study he was unable to transfer to any surface independently including a standard therapy
mat table which was in the testing room. He was a bilateral amputee that used a power
wheelchair. He was 57 years old with a height and weight of 73 inches and 285 lbs respectively.
The remaining 72 participants completed all or part of the study protocols as shown in Figure 6.
The primary reason why some participants did not complete all study protocols was due to an
onset of pain or fatigue experienced part way through the study.
30
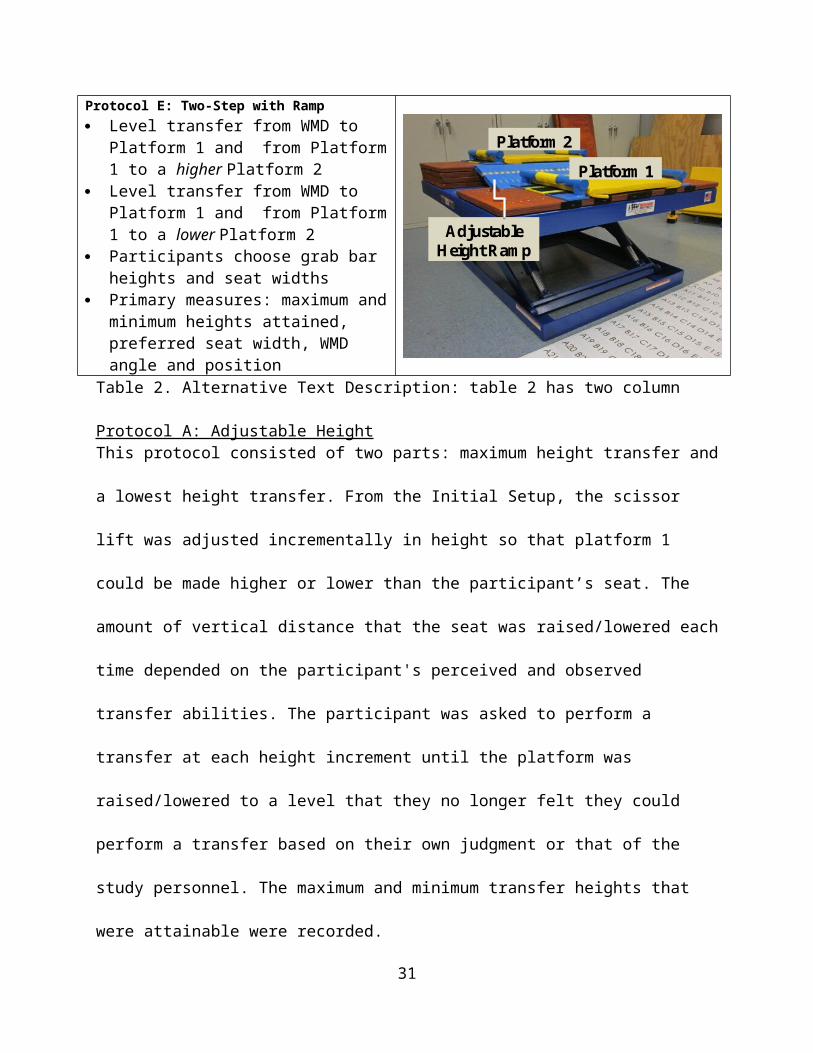
Figure 6. Flow chart of the number of participants that did not complete each protocol (Protocols
A, B and C) and participants that did not attempt the two step protocols (Protocols D and E)
Protocol ALevel Transfer: All 72 study participants completed the level transfer in this protocol.
Maximum and Minimum Height Transfers: One the 72 study participants (P1) developed hip
pain and did not attempt these two transfers. He was a 52 year old amputee with a weight and
height of 220 lbs and 62 inches respectively, who used a manual wheelchair. His data were not
included in the result tables. Two participants (P2 and P3) did not attempt to transfer higher or
lower than their mobility seat for different reasons. Participant P2 was a 64 year old female with
Multiple Sclerosis and used a power chair. Her weight and height were 210 lbs and 66 inches
31
respectively and she lacked the ability to transfer to surfaces that were not at the same level as
her wheelchair seat to floor height. Participant P3, was unable to transfer higher or lower than
her mobility device seat without the presence of grab bars on the platform. She was a 46 year old
female with Multiple Sclerosis that also used a power chair. Her height and weight were 69
inches and 154 lbs respectively. These two participants were included in the results tables with
their level seat height being recorded as their maximum and lowest height transfer for this
protocol.
Protocol BLevel Transfer: All 72 study participants completed the level transfer in this protocol.
Maximum Height Transfer: Of the 72 participants, participant (P2) did not attempt to transfer
higher than her mobility device seat because she lacked the ability. Like protocol A her level
height was recorded as her maximum height for this protocol.
Minimum Height Transfer: Of the 72 participants, P4, developed fatigue and was unable to
attempt this transfer. He was a 70 year old male with a spinal cord injury who uses a manual
wheelchair. His weight and height were 157 lbs and 68 inches respectively. Participant (P2) did
not attempt to transfer lower because she lacked the ability. Her data were included in the results
and level seat height was recorded as her minimum transfer height.
Protocol CLevel Transfer: All 72 participants completed the level transfer in this protocol.
Maximum Height Transfer: Of the 72 participants, one participant (P2) again did not attempt
this transfer because she was unable to transfer higher than her mobility device seat. Like the
other protocols her level transfer height was used as the maximum transfer height in the results.
Minimum Height Transfer: Of the 72 participants, one participant (P4) had developed fatigue
and was unable to attempt this transfer. His data was not included in the analysis. Participant
32
(P2) did not attempt the transfer because she was unable to transfer lower than her mobility
device seat. Like the other protocols her level height was used as the minimum height in the
analysis. Participant P3, attempted the transfer but was not successful at completing it (e.g. failed
attempt). Her data were included in the data analysis and her level transfer height was used as the
minimum height in the analysis.
Protocols D and EFor protocols D and E there were several participants who were unable to complete the two step
transfer. The demographics of these individuals are listed in Table 8. For these protocols,
participants either attempted the protocol and failed or did not attempt the protocol after visual
inspection. For these protocols a failed transfer, is one where the participant transfers to the first
platform, but was unable to transfer to the second platform. For protocol D 11% (8/72) of the
participants did not attempt it and of the 64 participants who did attempt the protocol, 5% (3/64)
had a failed attempt. For protocol E transferring to a higher platform with the ramp, 11% (8/72)
of the participants did not attempt the protocol and of the 64 participants who attempted the
transfer 11% (7/64) had a failed attempt. When transferring to a lower platform with the ramp,
13% (9/72) did not attempt the transfer and of the 63 subjects who attempted the transfer, 3.2%
(2/63) had a failed attempt. Participants who did not attempt two-step transfers or had failed
transfers were not included in the results tables for these types of transfers.
33
Table 8. Characteristics of participants who did not attempt a transfer or had a failed transfer during the two-step transfer protocols D and E.
Participant ID
Diagnosisa Sex Age (yrs)
Weight (lbs)
Height (in)
Failed Transfer Attempts
Transfers Not Attempted
WCb Type
P2 MS F 64 210 66 None D1,D1E1,E2
P
P3 MS F 46 154 69 None D1,D2E1,E2
P
P5 SCI (C4-C5) M 49 275.0 71.0 E1 ---- PP6 Stroke, Edema,
COPDM 57 280.0 70.0 D1, E1 ---- P
P7 CP F 45 110 59.0 E1 E2 PP8 MS M 56 210 70.9 D1, D2 E1, E2 PP9 SCI M 31 210 78.7 E2 E1 MP10 MD M 50 89.9 66.9 E1 ---- MP11 Limited
MobilityM 63 300 76 None D1,D2 M
P12 TBI F 48 164 68 None D1,D2E1,E2
P
P13 SCI,MS F 55 88 62 E1,E2 D1,D2 MP14 SCI M 56 135 67 E1 ---- PP15 Guillian-Barre
SyndromeM 78 155 71 None D1,D2
E1,E2MPA
P16 SCI, Amputee F 50 276 65 None D1,D2E1,E2
P
P17 SCI F 64 172 59.5 None D1,D1E1,E2
P
P18 SCI M 63 180 74 D1,D2E1
E2 MPA
Note. D1 = Protocol D transfer level to increment higher, D2 = Protocol D transfer level to increment lower, E1 = Protocol E transfer level to increment higher, E2 = Protocol E transfer level to increment lower. aDiagnosis acronyms = SCI (Spinal cord injury), COPD (and Chronic obstructive pulmonary disease), CP (Cerebral palsy), MS (Multiple Sclerosis ), MD (Muscular Dystrophy). bWC Type = Wheelchair Type used, P (power wheelchair), M (manual wheelchair).
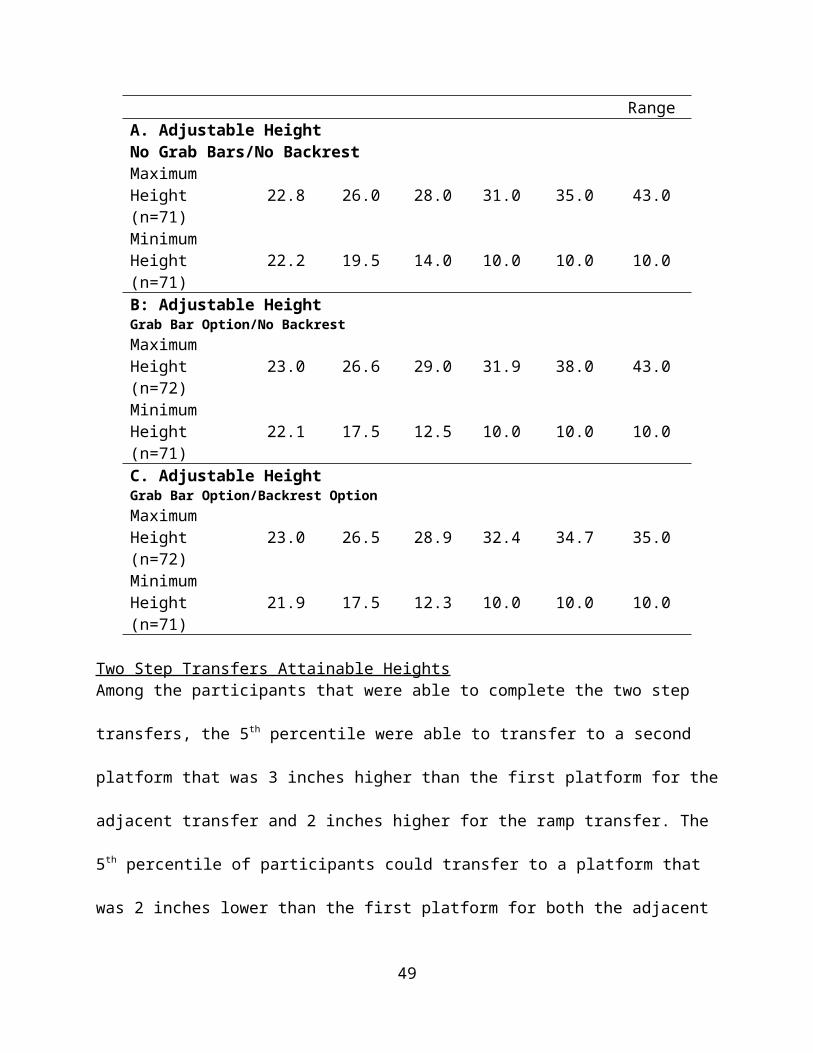
Highest and Lowest Heights Obtained Table 9 shows the 5th, 25th, 50th, 75th, and 95th percentiles for protocols A through C. These data
represent the ability of the participants in the study to complete a transfer. The 5th percentile
lowest and highest transfers attained were similar to the average WMD seat height (22.1 inch)
34
for all protocols. The 50th percentile participants were able to transfer to a simple platform (no
grab bars or a backrest present) that was 28 inches high with respect to the floor and 14 inches
low relative to the floor (about 6 inches above and below average wheelchair seat to floor
height). For all of the minimum height transfers, the 75th and 95th percentiles were at the
minimum transfer height possible with the station (10 inches). For protocols A and B one person
could transfer to the maximum height of the station (43 inches) and was an outlier in the study.
The relative height differences for the high and low transfers can be seen in Addendum F.
Table 9. Maximum attainable height variable percentiles (in inches)Percentiles
Protocol 5th 25th 50th 75th 95th End Range
A. Adjustable HeightNo Grab Bars/No BackrestMaximum Height (n=71) 22.8 26.0 28.0 31.0 35.0 43.0
Minimum Height (n=71) 22.2 19.5 14.0 10.0 10.0 10.0
B: Adjustable HeightGrab Bar Option/No BackrestMaximum Height (n=72) 23.0 26.6 29.0 31.9 38.0 43.0
Minimum Height (n=71) 22.1 17.5 12.5 10.0 10.0 10.0
C. Adjustable HeightGrab Bar Option/Backrest OptionMaximum Height (n=72) 23.0 26.5 28.9 32.4 34.7 35.0
Minimum Height (n=71) 21.9 17.5 12.3 10.0 10.0 10.0
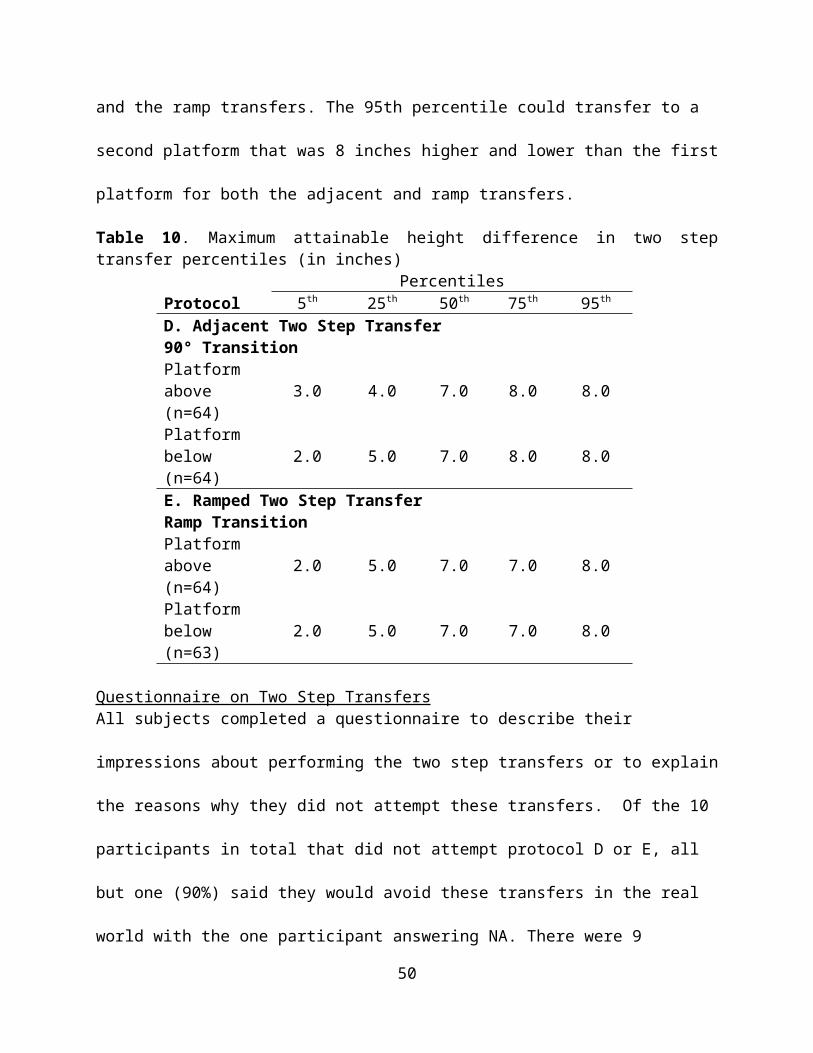
Two Step Transfers Attainable Heights Among the participants that were able to complete the two step transfers, the 5th percentile were
able to transfer to a second platform that was 3 inches higher than the first platform for the
adjacent transfer and 2 inches higher for the ramp transfer. The 5th percentile of participants
could transfer to a platform that was 2 inches lower than the first platform for both the adjacent
35
and the ramp transfers. The 95th percentile could transfer to a second platform that was 8 inches
higher and lower than the first platform for both the adjacent and ramp transfers.
Table 10. Maximum attainable height difference in two step transfer percentiles (in inches)Percentiles
Protocol 5th 25th 50th 75th 95th
D. Adjacent Two Step Transfer 90° TransitionPlatform above (n=64) 3.0 4.0 7.0 8.0 8.0
Platform below (n=64) 2.0 5.0 7.0 8.0 8.0
E. Ramped Two Step Transfer Ramp TransitionPlatform above (n=64) 2.0 5.0 7.0 7.0 8.0
Platform below (n=63) 2.0 5.0 7.0 7.0 8.0
Questionnaire on Two Step Transfers All subjects completed a questionnaire to describe their impressions about performing the two
step transfers or to explain the reasons why they did not attempt these transfers. Of the 10
participants in total that did not attempt protocol D or E, all but one (90%) said they would avoid
these transfers in the real world with the one participant answering NA. There were 9
participants in total who had a failed attempt on any of the transfers in protocols D and E. A
majority of these 9 participants 89% (8/9) said they would avoid the two step transfers if they
were encountered in the real world, while one person said that they would attempt these transfers
in the real world. Of the 56 participants who completed both two-step protocols successfully
73% (41/56) said they would complete these transfers again if they encountered them in the
community. Additionally, 21% of study participants (12/56) said they would avoid them and 5%
(3/56) answered NA. Addendum C lists some of the participant’s responses for either willing to
transfer or wanting to avoid the two-step transfers they performed.
36
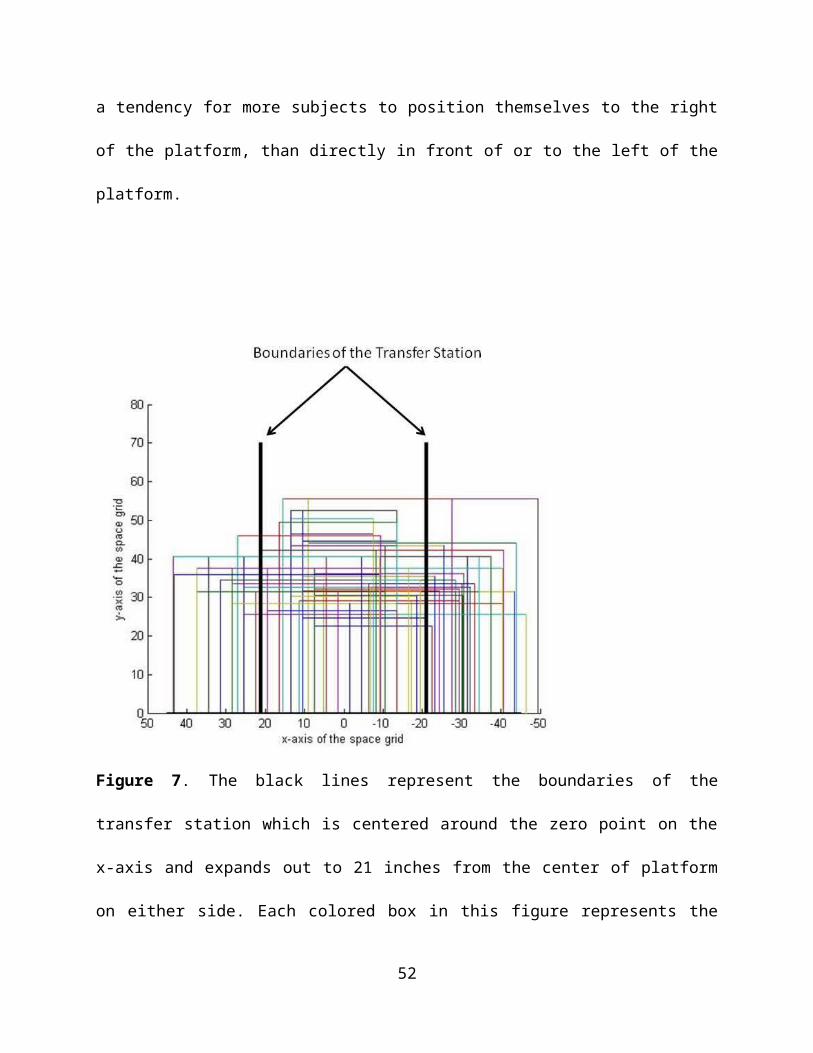
Space Needs Figure 7 was composed to provide a general idea of the variability observed among participants
in 1) the amount of space in front of the platform required by each participant and their WMDs
and 2) the physical locations of these spaces relative to the first platform. Subjects in general
required more width (distance along the x-axis) than depth (distance along the y-axis) when
performing transfers to this platform. Also there was a tendency for more subjects to position
themselves to the right of the platform, than directly in front of or to the left of the platform.
Figure 7. The black lines represent the boundaries of the transfer station which is centered
around the zero point on the x-axis and expands out to 21 inches from the center of platform on
either side. Each colored box in this figure represents the amount of area used by each study
37
participant and their WMD (72 total boxes). The x-axis is the width of the grid space and the y-
axis is the total depth of the grid space (see figure 1 above as a reference).
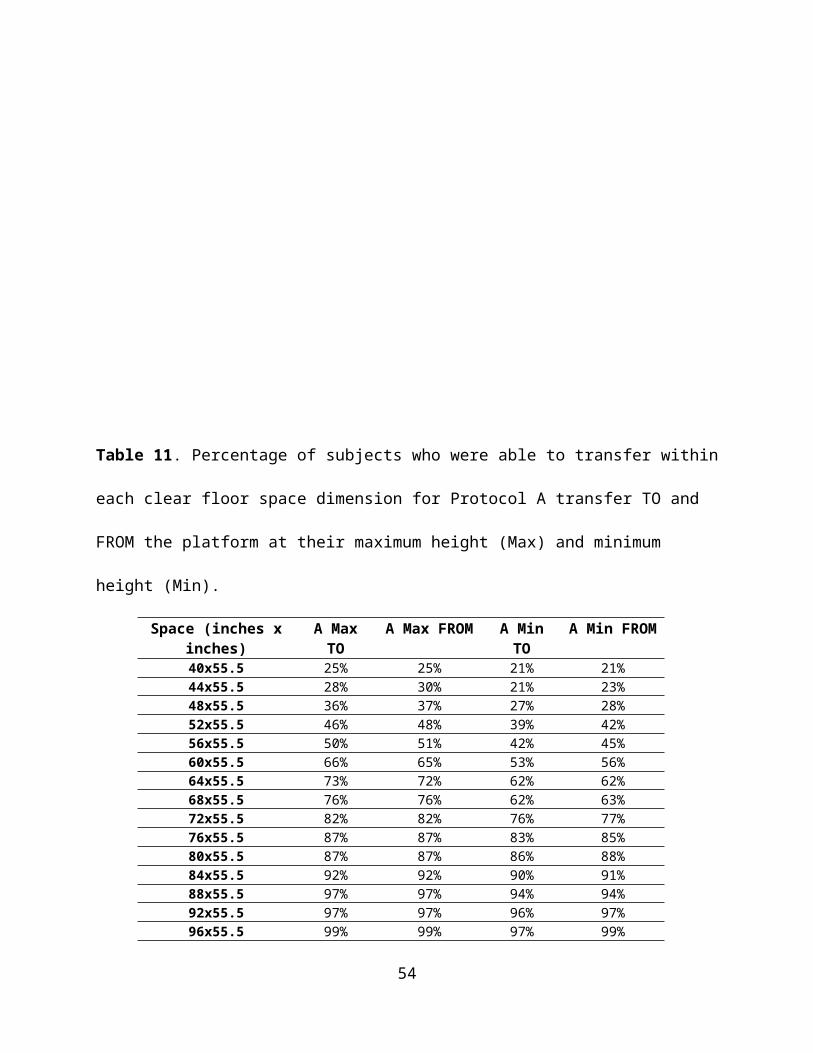
Tables 11, 12 and 13 illustrate how and what percentage of individuals in the study positioned
themselves within a defined floor area centered on the transfer station. Percentages were
calculated instead of percentiles due to complexity of the measures (see Data Analysis section in
the Methods for further explanation). All participants were able to transfer inside a space with a
depth of 55.5 inches (along the y-axis as shown in Figure 7). Table 11 shows that for a given
width of 40 inches (centered in front of the transfer station) that 25% of the subjects were able to
perform a transfer to the platform in Protocol A (no grab bars or backrest on the station) whereas
for a given width of 100 inches (e.g. 50 inches on either side of the transfer station) 100% of
subjects were able to perform a transfer to the platform during Protocol A.
38
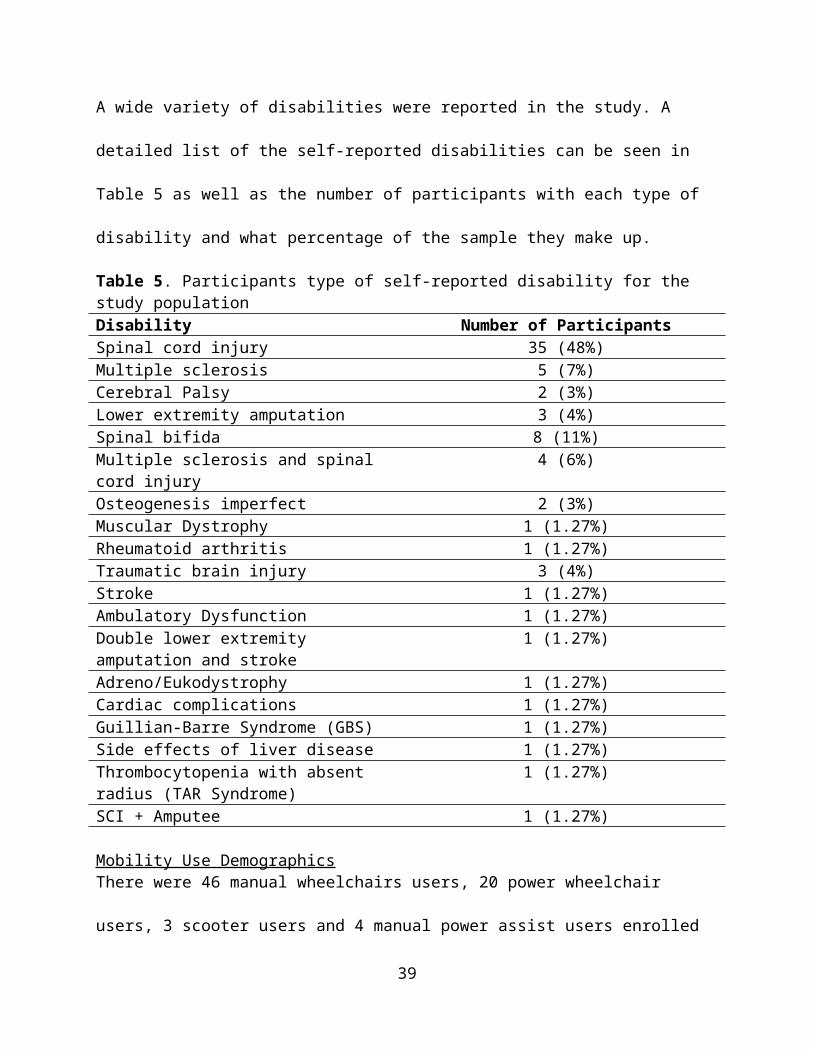
Table 11. Percentage of subjects who were able to transfer within each clear floor space
dimension for Protocol A transfer TO and FROM the platform at their maximum height (Max)
and minimum height (Min).
Space (inches x inches)
A Max TO A Max FROM A Min TO
A Min FROM
40x55.5 25% 25% 21% 21%44x55.5 28% 30% 21% 23%48x55.5 36% 37% 27% 28%52x55.5 46% 48% 39% 42%56x55.5 50% 51% 42% 45%60x55.5 66% 65% 53% 56%64x55.5 73% 72% 62% 62%68x55.5 76% 76% 62% 63%72x55.5 82% 82% 76% 77%76x55.5 87% 87% 83% 85%80x55.5 87% 87% 86% 88%84x55.5 92% 92% 90% 91%88x55.5 97% 97% 94% 94%92x55.5 97% 97% 96% 97%96x55.5 99% 99% 97% 99%100x55.5 100% 100% 100% 100%
Table 12. Percentage of subjects who were able to transfer within each clear floor space
dimension for Protocol B transfer TO and FROM the platform at their maximum height (Max)
and minimum height (Max)
39
Space (inches x inches) B Max TO B Max FROM B Min TO B Min FROM40x55.5 23% 24% 21% 21%44x55.5 23% 27% 21% 21%48x55.5 34% 35% 27% 30%52x55.5 48% 46% 39% 42%56x55.5 49% 49% 42% 46%60x55.5 65% 66% 53% 53%64x55.5 75% 73% 62% 67%68x55.5 76% 77% 62% 70%72x55.5 82% 82% 76% 77%76x55.5 87% 87% 83% 83%80x55.5 87% 87% 86% 84%84x55.5 91% 92% 90% 90%88x55.5 96% 97% 94% 94%92x55.5 96% 97% 96% 96%96x55.5 99% 99% 97% 97%100x55.5 100% 100% 100% 100%
Table 13. Percentage of subjects who were able to transfer within each clear floor space
dimension for Protocol C transfer TO and FROM the platform at their maximum height (Max)
and minimum height (Min (note: that there was one subject who positioned himself 52 inches
right of center with respect to station (outlier)).
Space (inches x inches) C Max TO C Max FROM C Min TO C Min FROM40x55.5 21% 20% 20% 23%
40

44x55.5 21% 21% 20% 23%48x55.5 30% 30% 30% 31%52x55.5 48% 46% 42% 44%56x55.5 51% 50% 45% 46%60x55.5 65% 62% 55% 52%64x55.5 76% 75% 69% 69%68x55.5 76% 75% 69% 69%72x55.5 83% 80% 75% 75%76x55.5 90% 89% 85% 85%80x55.5 90% 89% 85% 87%84x55.5 94% 93% 88% 90%88x55.5 97% 96% 94% 94%92x55.5 97% 96% 96% 96%96x55.5 97% 97% 97% 97%100x55.5 100% 99% 100% 100%104x55.5 - 100% - -
A 60 inch wide turning space dimension similar to that found in the ADA-ABA is shown
mapped onto the grid space in front of the transfer station in Figure 8. The ADA-ABA depth of
60 inches would accommodate all the subjects in this study whereas a 60 inch width would only
accommodate between 52% and 66% of the subjects depending on the type of transfer (with or
without grab bars and backrest) and direction of transfer (to or from the platform) (Tables 11-
13).
41

Figure 8. The black lines represent the boundaries of a standard clear floor space dimension of
60 x 60 inches. Each colored box in this figure represents the amount of area used by each
study participant and their WMD (72 total boxes). The x-axis is the width of the grid space and
the y-axis is the total depth of the grid space (see figure 1 above as a reference).
42
The angle of approach (Figure 2), the angle at which WC users were located with respect to the
station, was measured and recorded for each transfer to and from the transfer station. Tables 14
and 15 shows the 5th, 25th, 50th, 75th and 95th percentiles, the maximum and minimum values for
the angles of approach used when transferring to and from the transfer station
Table 14. Angle of approach transferring TO the station Percentiles
Protocol 5th 25th 50th 75th 95th Maximum MinimumA. Level:No Grab Bars/No BackrestAngle (degrees) 0.0 14.5 28.0 50.0 90.0 90.0 0.0A. Maximum Height:No Grab Bars/No BackrestAngle (degrees) 0.0 18.0 30.0 53.0 90.0 90.0 0.0A. Minimum Height:No Grab Bars/No BackrestAngle (degrees) 0.0 17.0 30.0 50.0 90.0 90.0 0.0B. Maximum Height:Grab Bars/No BackrestAngle (degrees) 0.0 12.0 27.0 50.0 90.0 90.0 0.0B. Minimum Height: Grab Bars/No BackrestAngle (degrees) 0.0 13.5 28.0 52.5 90.0 90.0 0.0C. Maximum Height: Grab Bars and BackrestAngle (degrees) 0.0 11.8 24.5 44.0 90.0 90.0 0.0C. Minimum Height: Grab Bars and BackrestAngle (degrees) 0.0 12.3 28.0 49.3 90.0 90.0 0.0
Table 15. Angle of approach transferring FROM the station Percentiles
Protocol 5th 25th 50th 75th 95th Maximum Minimum
43
A. Level:No Grab Bars/No BackrestAngle (degrees) 0.0 14.5 30.0 50.0 90.0 90.0 0.0A. Maximum Height:No Grab Bars/No BackrestAngle (degrees) 0.0 18.0 30.0 53.0 90.0 90.0 0.0A. Minimum Height:No Grab Bars/No BackrestAngle (degrees) 0.0 17.0 30.0 50.0 90.0 90.0 0.0B. Maximum Height:Grab Bars/No BackrestAngle (degrees) 0.0 12.0 27.0 50.0 90.0 90.0 0.0B. Minimum Height:Grab Bars/No BackrestAngle (degrees) 0.0 13.5 28.0 52.5 90.0 90.0 0.0C. Maximum Height:Grab Bars and BackrestAngle (degrees) 0.0 11.8 24.5 44.0 90.0 90.0 0.0C. Minimum Height:Grab Bars and BackrestAngle (degrees) 0.0 12.3 28.0 49.3 90.0 90.0 0.0
Preferred Seat Widths
44
The seat width percentiles remained the same for transfers to and from the station and within
each protocol. For all protocols the majority of participants used the 18.0 inch transfer platform
seat width to make their attainable transfers (Table 16).
Table 16. Percentiles for the Preferred Seat Widths (in inches)Percentiles
5th 25th 50th 75th 95th Minimum MaximumLevel Height A(n=72)
24.6 18.0 18.0 18.0 18.0 18.0 28.0
Protocol A:No Grab Bars/No BackrestHighest Height(n=71)
26.9 18.0 18.0 18.0 18.0 18.0 28.0
Lowest Height(n=70)
26.9 18.0 18.0 18.0 18.0 18.0 28.0
Protocol B:Grab Bar Option/No BackrestHighest Height(n=72)
24.7 18.0 18.0 18.0 18.0 18.0 28.0
Lowest Height(n=71)
24.8 18.0 18.0 18.0 18.0 18.0 28.0
Protocol C:Grab Bar Option/ Backrest OptionHighest Heights(n=72)
24.7 18.0 18.0 18.0 18.0 18.0 28.0
Lowest Heights (n=70)
24.8 18.0 18.0 18.0 18.0 18.0 28.0
Effect of Handhelds on Transfer Height Participant preference for grab bars and backrest heights for protocols B through E are shown in
Table 17. For all protocols the tall grab bars were preferred. For protocol C the medium and
short back rests were almost equally preferred. Although the participants selected a grab bar and
backrest height, not all participants used them when they were on the station. The numbers and
percentages of participants that actually used the grab bars are shown in Table 18. Only a few
people used the backrests during the transfers. For transferring higher one participant used the
backrest with their trailing arm on the way back to their WMD seat after having obtained the
45
transfer. Two participants used the backrest for the minimum height transfers. They used the
backrest by their trailing arm moving back to their mobility device seat.
Table 17. Grab bar and backrest preferences for protocols B through E
Protocol Tall Grab Bar (6.00 in)
Short Grab Bar (2.75in)
Tall Backrest (20.0in)
Medium Backrest (17.0in)
Short Backrest (14.0in)
Protocol B Highest Height:
n = 54(76%)
n = 17(24%) NA NA NA
Protocol B Lowest Height:
n = 54(77%)
n = 16(23%) NA NA NA
Protocol C Highest Height:
n = 53(75%)
n = 18(25%)
n = 3(5%)
n = 33(46%)
n = 35(49%)
Protocol C Lowest Height:
n = 53(77%)
n = 16(23%)
n = 3(4%)
n = 33(48%)
n = 33(48%)
Protocol D Level to Highest Height
n = 52(81%)
n = 12(19%) NA NA NA
Protocol D Level to Lowest Height
n = 53(83%)
n = 11(17%) NA NA NA
Protocol ELevel to Highest Height
n = 53(83%)
n = 11(17%) NA NA NA
Protocol ELevel to Lowest Height
n = 52(83%)
n = 11(17%) NA NA NA
46
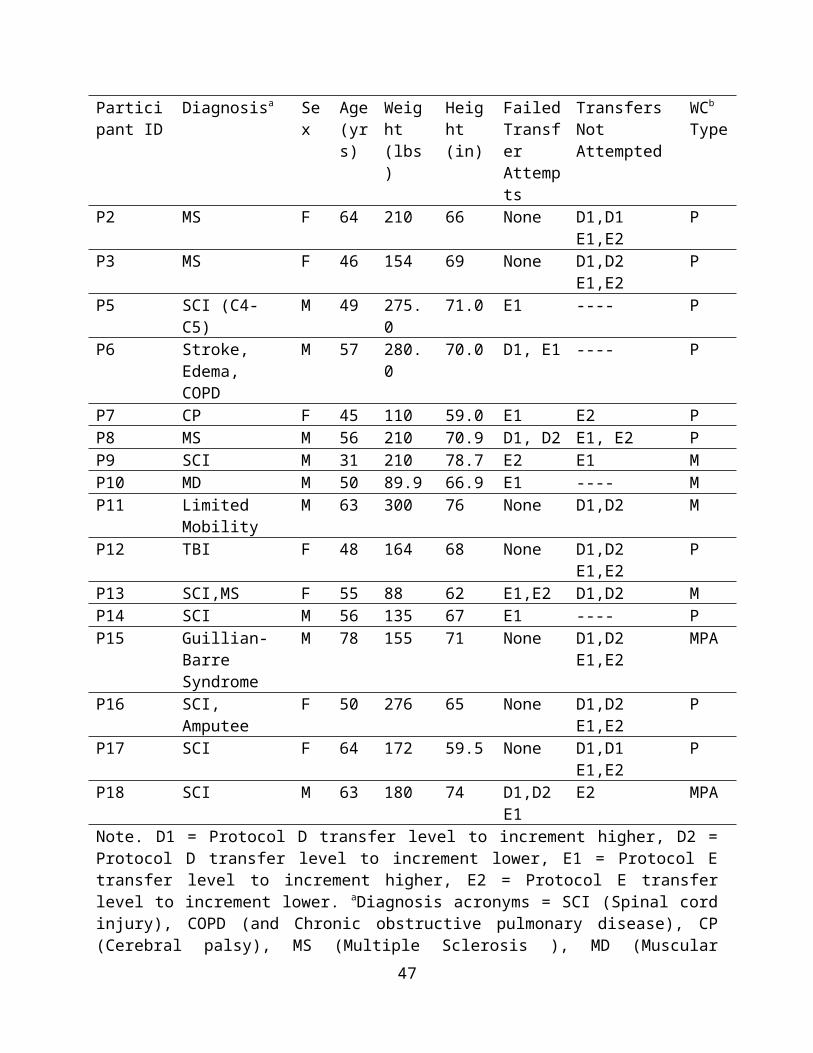
Table 18. The use of grab bars for protocols B through E
ProtocolLeading Arm TO
Trailing Arm TO
Leading Arm FROM
Trailing Arm FROM
TO Second Platform Leading
TO Second Platform Trailing
FROM Second Platform Leading
FROM Second Platform Leading
Protocol B (n=72)Highest Height:
n = 56(78%)
n = 15(21%)
n = 5(7%)
n = 56(78%) NA NA NA NA
Protocol B (n=71)Lowest Height:
n = 49(70%)
n = 15(21%)
n = 2(3%)
n = 47(66%) NA NA NA NA
Protocol C (n=72)Highest Height:
n = 54(75%)
n = 12(17%)
n = 4(6%)
n = 55(76%) NA NA NA NA
Protocol C (n=71)Lowest Height:
n = 51(72%)
n = 12(17%)
n = 1(1%)
n = 47(66%) NA NA NA NA
Protocol D (n=64)Level to Highest Height
n = 43(67%)
n = 12(19%)
n = 0(0%)
n = 46(72%)
n = 60(94%)
n =58(91%)
n = 59(92%)
n = 58(91%)
Protocol D (n=64)Level to Lowest Height
n = 43(67%)
n = 15(23%)
n = 4(6%)
n = 35(55%)
n = 58(91%)
n =58(91%)
n = 55(86%)
n = 51(80%)
Protocol E(n=64)Level to Highest Height
n = 46(72%)
n = 16(25%)
n = 5(8%)
n = 40(63%)
n = 55(86%)
n =53(83%)
n = 52(81%)
n = 51(80%)
Protocol E (n=63) Level to Lowest Height
n = 44(70%)
n = 17(27%)
n = 3(5%)
n = 32(51%)
n = 54(86%)
n =53(84%)
n = 51(81%)
n = 51(81%)
47

The repeated measures ANOVA showed that there was a significant difference between the
transfer heights when grab bars were on the station (protocols B and C) compared to when there
were no grab bars or a backrest on the station (protocol A). Participants were able to transfer
higher and lower with the presence of the grab bars. The results from this test are shown in Table
19.
Table 19. Repeated measures results for protocols A, B and C
Protocol ANo Grab Bars/No Backrest
Protocol BGrab Bars/ No Backrest
Protocol CGrab Bar and Backrest
Highest Height Attained
Mean 28.7ǂ 29.6ǂ 29.3Std. Deviation 3.9 4.2 3.5Median 28.0 29.0 29.0
Lowest Height Attained
Mean 14.5*+ 13.6* 13.6+Std. Deviation 4.2 4.1 4.1Median 14 12.3 12.3
ǂ Significant difference between A and B, p=0.001*Significant difference between A and B, p= 0.016+Significant difference between A and C, p=0.017
Implication for Standards and DesignClose to 200 community dwelling adults who independently transfer have been evaluated
during phases 1 and 2 combined of this multi-year study. The main difference between phase 1
and 2 relates to the tool used to collect the data on transfers. Each phase involved a highly
customized transfer station iteratively developed with scientific, expert and consumer input to
support the goals of the project. The station used in this second phase permitted greater freedom
of wheelchair positioning around the transfer surface compared to the first phase station.
Moreover, the second phase transfer station allowed for evaluating the presence/absence of
various height grab bars, a backrest added in parallel to the front edge of the transfer surface, a
variable width transfer surface, and adjustable height transfer steps.
48
Transfer Heights
Despite differences in the data collection tools, some results from the second phase of the
study were consistent with first phase of the independent transfer study. For instance, level seat
heights were 21.7± 1.2 inches and 22.1±1.4 inches for the first and second phases respectively.
Both of these heights are outside of the standards for heights for most elements where adults
would be expected to transfer (between 17 and 19 inches [7]). Also, like the first phase, the
second phase found that the majority of WMDs (92% of subjects in the first phase and the 5th
percentile (or approximately 94% in this study) could transfer within one inch of the mean
wheelchair seat to floor height (22 inches). Transfers to level surfaces require less exertion on
the upper extremities [5, 10, 11]. Transfers are easiest and safest to obtain when they are as close
to level as possible [6]. This is consistent with other research results that have found that level
transfers require less exertion on the upper limbs [5]. Based on the results of this study, it is
estimated that the current standards would accommodate close to the 25th percentile of WMD
users (approximately 75%) who can independently transfer to a transfer surface or platform.
The current station tested the ability of the study participants to transfer to an adjustable
table height ranging from 10 inches to 43 inches. Although the study did not aim to determine
what range of adjustable platform height would be needed to accommodate the majority of
WMD users, the data from the subjects in this study (Table 9) suggests a range between 19 to
27.5 inches above the ground or floor surface. This is based on the lowest wheelchair seat to
floor height and highest wheelchair seat to seat or floor height of the individuals in the study. All
participants can make a level transfer, and the majority of participants can transfer 1 inch above
or below their level seat height. Thus adjustability, including this range, would include all of the
study participants and allow for greater accessibility where transfers are needed.
49
Two Step Transfer Evaluation
The evaluation of two-step transfers has never been studied before and was evaluated in
this phase. The two-step transfers consisted of an adjacent transfer (no gap between two steps)
and a ramped transfer over a constant 8 inch gap between two steps. It should be noted that for
this evaluation not all study participants are included in the two-step analysis. Not all participants
attempted the two-step transfers as they were given the choice to not make the transfer.
Additionally, the study participants who made the two-step transfers appear more able on these
transfers when comparing the heights achieved during the two-step transfers to the heights
achieved from the WMD to and from the first platform (Table 9). Transferring to and from a
WMD is different than transferring between two surfaces. It's also possible that more able or
skilled WMD users completed the two step transfers.
In this study, participants who attempted the two-step transfers transferred from one step
to a second step that was higher and lower than first one. The results of our study suggest that
transfer steps of any height differential that currently exist in the built environment would
exclude about 15.2% of adult community dwelling WMD users who independently transfer (11
out of 72 participants; 8 of which wouldn’t attempt it at all and 3 of which attempted it but failed
in the process). The addition of a ramp to bridge the two steps did not improve the situation and
there were additional failed transfer attempts when the ramp was used to go up a step compared
to when the ramp wasn’t used. It’s possible that more failed attempts occurred because it was
‘new’ and a very different type of transfer than what these individuals were used to. These types
of transfers are not currently part of the standard training that patients receive during a typical
rehabilitation stay. Performance may improve with training and practice.
50
Results from the questionnaire asking for participants’ opinion on these transfers reflect a
mixed review of the ease and practicality of two-step transfers. Comments on the two-step
transfers varied from thinking they were fun, easy, and safe to impractical, difficult, and
uncomfortable. Both types of transfers received relatively equal responses for the number of
people who said they would or would not perform the transfer in a ‘real-world’ situation.
Participants who attempted and were successful with the two-step transfers performed at a high
level on average. The 50th percentile for the adjacent and ramp transfer attained a height of 7.0
inches, only 1 inch below the maximum allowable transition for this transfer (8.0 inches). A
lower step height (about 2.0 in) would be needed to accommodate the 5th percentile of users who
would attempt this type of transfer.
Clear Space Evaluation
Unlike the first phase of the transfer study, subjects in this study were not impeded by
any obstacles on the floor that limited the manner of which they approached the transfer station
(e.g. subjects in the previous study could not transfer to the station face on). As a result subjects
positioned themselves in a wide variety of locations about the transfer station. Both the physical
size of their WMD, where they positioned it with respect to the station and at what angle they
positioned their WMD were all factors that weighed into the space analysis. Graphical
techniques were used to better understand the relationships between these factors. As can be
seen in Figures 7 and 8 more participants set themselves up on the right side of the transfer
station compared to directly in front of or to the left of the station. This may be explained in part
by the effects of hand dominance on transfer ability and preferences. The majority of study
participants were right handed and likely their right side was stronger than their left side.
Positioning themselves to the right of the station allows them to use their right side as the trailing
51
arm which carries more of the force during a transfer than does the leading arm when moving
toward a new surface.
Additionally, from Figure 7 it can be seen that some study participants did not transfer
entirely within the boundaries of the transfer station. The space needed by the study participants
was compared to a turning space dimension as described in the ADA-ABA standards (60x60
inch space). All of the study participants were able to transfer within the 60 inch depth, in fact
the largest depth dimension required by anyone subject was 55.5 inches. However, when
looking at Protocol A for the maximum height transfer only 65% of the population could transfer
entirely inside of the 60 x 55.5 inch defined space. For the transfer to a lower platform that
number decreased to 53% when moving to the station and 56% when coming back to the station.
(Protocol A). A similar trend for participants requiring more space to transfer lower versus
higher was found for the other protocols as well (B and C). The reason that subjects may have
used more space to transfer lower than higher may be that they needed more clearance space to
accommodate the pivoting swing of the buttocks and increased knee and hip flexion that occurs
when moving their body closer towards the ground than when moving their body further from
the ground (e.g decreased knee and hip flexion). Increasing the width of the clear floor space an
additional 12 inches to 72 inches would accommodate 75-77% of users who would be expected
to transfer higher or lower than their seat to floor height. In order to accommodate 95% of the
study population transferring higher and lower than their mobility device seat, the total width
would need to be increased to 92 inches total.
As mentioned previously, the right side of the transfer station was preferred by the study
participants. Shifting the clear floor square area requirement more towards the right may
accommodate more people and minimize the overall amount of space required around transfer
52
elements. Like the previous study, subjects were not restricted to transferring from a certain
direction (e.g. to their left or right) or within certain predefined clear floor spaces. This was done
to better assess limitations associated with transfer heights and to limit the number of transfers
that each subject needed to perform. Had subjects been limited by a certain direction or standard
space dimension, it’s possible that fewer subjects could have completed the transfers at all or as
high or as low as they did due to a lack of function or inadequate space available to position their
WMD and themselves.
For the angle of WMD positioning, participants had the option to align themselves
parallel to the station (at 0 degrees), perpendicular to the station (at 90 degrees) or at any angle in
between. When transferring to and from the station, the 50th percentile study participants
preferred an orientation angle of around 30 degrees. It’s important to note that the angle of
positioning can increase the amount of space required (e.g. in either the width or length
dimensions) and should be accounted for in the future when planning the amount of clear floor
space to design for around transfer elements.
Seat Width Evaluation
An 18 inch seat was the smallest of the platform seat widths available in this study and was
suitable for many participants (the 25th through 95th percentiles) for their level, highest and
lowest height transfer regardless of the presence or absence of grab bars or a backrest on the
transfer surfaces. The 5th percentile wheelchair users however required transfer platform width
of 25 inches if there were grab bars on the platform and 27 inches without the grabs bars. The
additional two inches for the simple platform transfer was likely needed to allow hand placement
or grip directly on the transfer surface. The additional platform width may also have been needed
to accommodate larger individuals; however the size of the individual and seat width of the
53
wheelchair were not measured and therefore cannot be used to explain the transfer platform
widths selected by the participants in the study. Seat width preference did not change much over
the protocols. It was felt that some participants would have had greater performance on the
station if they had opted for a larger seat width and more room to position the hands for transfer,
but since they did not ask to increase the width when the option was offered it was left the same.
It may be of value in future work to investigate transfer performance when the seat width is
forced to vary between protocols and transfer trials. This was not done in the current study to
minimize the number of transfers performed.
Grab Bar and Backrest Evaluation
Grab bar and backrest preferences were reported in this study with the tall grab bar and the short
backrest being selected more often than the short grab bars and medium and tall backrests. The
grab bars were frequently used as handhelds during the transfer process and for one person it
made the difference of being able to do a non-level transfer to the platform. The analysis also
revealed that the presence of grab bars helped participants to transfer higher and lower than their
mobility device seats. Grab bars should be placed everywhere persons would encounter a non-
level transfer. This would allow persons with disabilities to make non-level transfers more easily
and safely. The backrest was used as a handheld less frequently and more often when
participants were transferring lower versus higher. The backrest may have helped to provide a
sense of security, comfort or support for participants when seated on the platform but it did not
appear to be as useful as the grab bars were for assisting with the transfer. One possible
explanation for this is that unlike the phase 1 study, participants were able to transfer from the
front of the station as well as from the side of the station. In the situation where a participant
54

transferred from the front, they may not have needed the backrest or the backrest may not have
been within reach.
Secondary data analyses were performed to compare phase 1 and phase 2 results. A
comparison of participant demographics and transfer performances between the two phases can
be found in Addendum D1. Also, a comparative analysis was done to investigate differences
between the veteran population that was tested at the National Disabled Veterans Winter Sports
Clinic and the population that was tested at the Human Engineering Research Laboratory. This
analysis was performed using data from phase 2 and the results are included in Addendum E2.
Lastly, a comparative analysis looking at the difference in transfer abilities between men and
women can be seen in Addendum G.
Sample Size Estimation A sample size estimation was performed to estimate the number of participants that would be
needed in a future study. Data from the maximum and minimum height transfers from protocol A
were used for this analysis. The percentile minimum and maximum heights attained for all 71
subjects are shown in Table 9. Ten participants were selected at random from the 71 participants
who performed transfers to a higher and a lower height seat. We then added 10 more participants
from the existing data set (randomly selected from the total sample) and reassessed the values
again. This process was repeated until the data for all 71 participants were included in the
analysis (last rows, Tables 20 and 21).
1Note that Addendum D was a preliminary analysis that was done before completion of the phase 2 study and thus contain a subset of the total numbers of participants tested.
2Note that Addendum E was a preliminary analysis that was done before completion of the phase 2 study and thus contain a subset of the total numbers of participants tested.
55
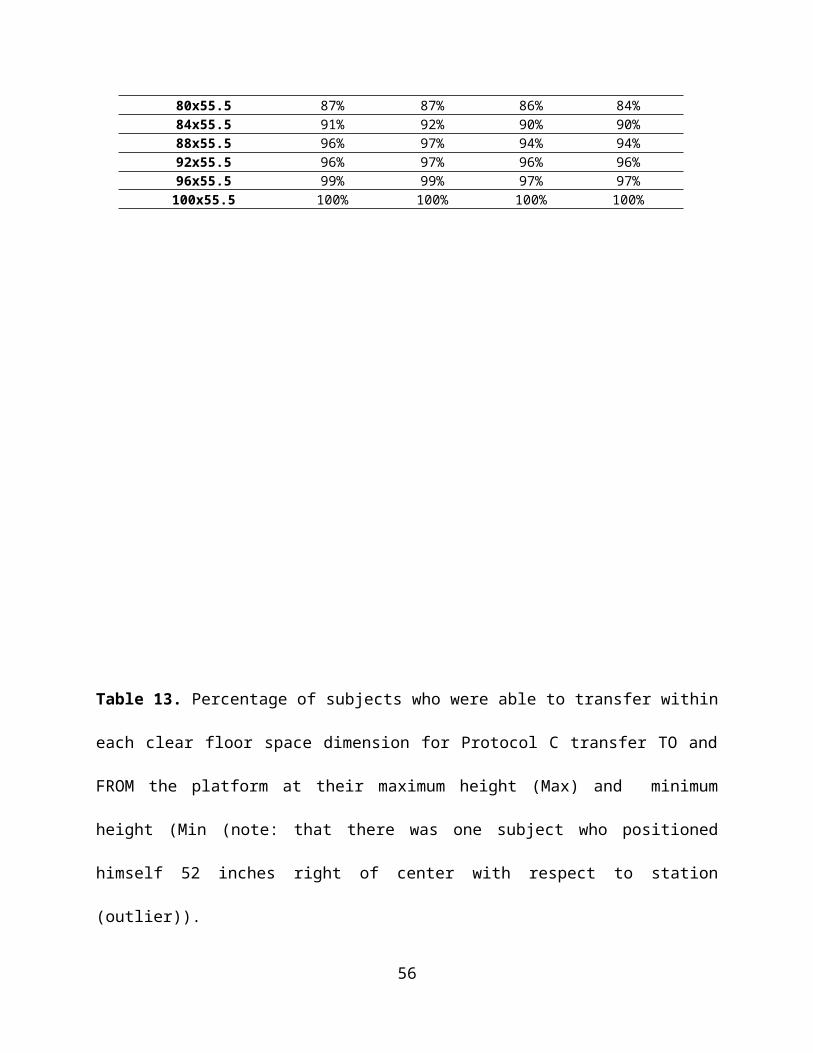
Table 20. Percentiles for Lowest Attainable Transfer heights Protocol APercentiles
Number of participants 5th 25th 50th 75th 95th
N=10 19.0 19.0 15.6 10.0 10.0N=20 23.0 18.7 14.0 10.0 10.0N=30 23.0 19.0 13.3 10.0 10.0N=40 22.9 18.8 13.8 10.0 10.0N=50 22.8 18.3 14.0 10.0 10.0N=60 22.4 19.0 14.0 10.0 10.0N=70 22.2 19.5 14.0 10.0 10.0All participants (N=71) 22.2 19.5 14.0 10.0 10.0
Table 21. Percentiles for Highest Attainable Transfer heights Protocol APercentiles
Number of participants 5th 25th 50th 75th 95th
N=10 22.5 25.4 29.4 32.3 32.3N=20 22.5 25.3 28.8 32.8 42.6N=30 22.8 25.8 28.1 32.3 38.6N=40 23.0 25.1 27.8 31.0 35.0N=50 22.8 25.0 27.8 31.0 35.0N=60 23.0 25.6 28.0 31.0 35.0N=70 22.8 25.9 28.0 31.0 35.0All participants (N=71) 22.8 26.0 28.0 31.0 35.0
The estimates for the highest and lowest attainable heights across all percentiles became
relatively stable with 60 participants. This analysis suggests that our sample may have reached a
potential saturation point at or around these numbers and that adding additional adult participants
with similar characteristics to the adults in this study would not change these results. However,
adding additional participants to the study with different demographics than the ones tested may
adjust these values.
Study Limitations Some limitations that occurred with this study were that occasionally the grab bars would get in
the way of a participant transferring to or from the station since they were located on either side
of the transfer surface. These participants were observed having to reposition their WMD or
having to transfer around the grab bar. A protocol or an option of using only one grab bar or
having a removable grab bar may be worth investigating in the future. Also, the grab bars were
placed perpendicular to the front edge of the transfer station. This may have forced some
56
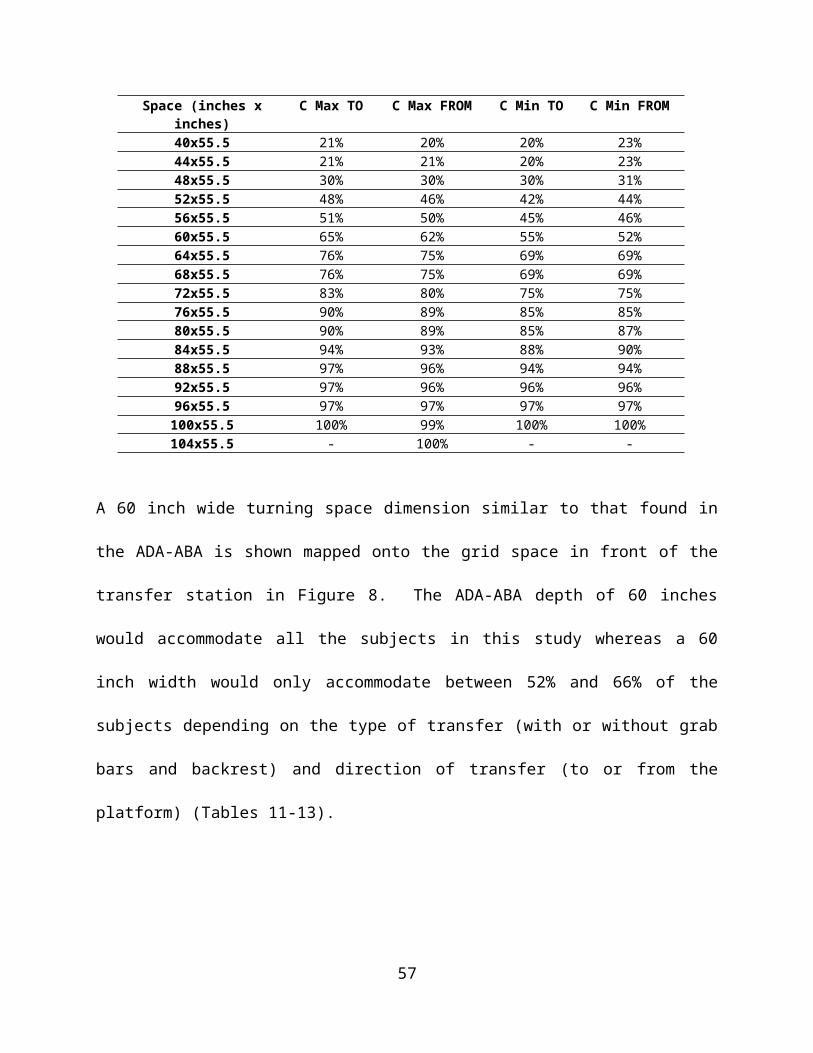
participants to approach the station more from the front (e.g. forward-facing) than from the side.
However, the study participants on average did not appear to adjust their angle of approach too
much in between protocols with and without the grab bars present on the station (Table 14).
Some participants also asked if they could use both size of grab bars on either platform
during the two-step transfers. They mentioned that the taller ones were more helpful for going to
lower elevations and the lower ones for transferring higher. This was not an option for this study
and it may be that developing a grab bar that is angled or easily adjustable in height would be
beneficial for future work. There was not a backrest available behind the second platform for the
two-step transfers. When performing these transfers to a higher elevation participants could be
transferring to a seat around 31.5 inches off the ground. Even though there were spotters
standing behind this platform having a wall, backrest, or another step available there would have
added to the safety of the transfer. The grab bars attached to this surface did help with keeping
the participants stable by allowing another surface to grip onto.
In addition to the grab bars, the backrest can also be seen as a study limitation. In this
phase of research, the backrest was placed parallel to the front edge of the first transfer platform
whereas in phase 1 the backrest was placed perpendicular to the front edge of the transfer
platform. This phase 2 backrest placement meant that participants were not able to orient
themselves right next to the back rest but instead would need to reach across the platform if
wanting to use the backrest as a handheld. For many participants, the backrest was too far out of
reach for them to grab it which would explain why very few participants placed their hands on
the backrest to help them transfer.
Another limitation concerns the small sample size collected. Although the above sample
size analysis suggests that we may have reached a saturation point, for standards research
57
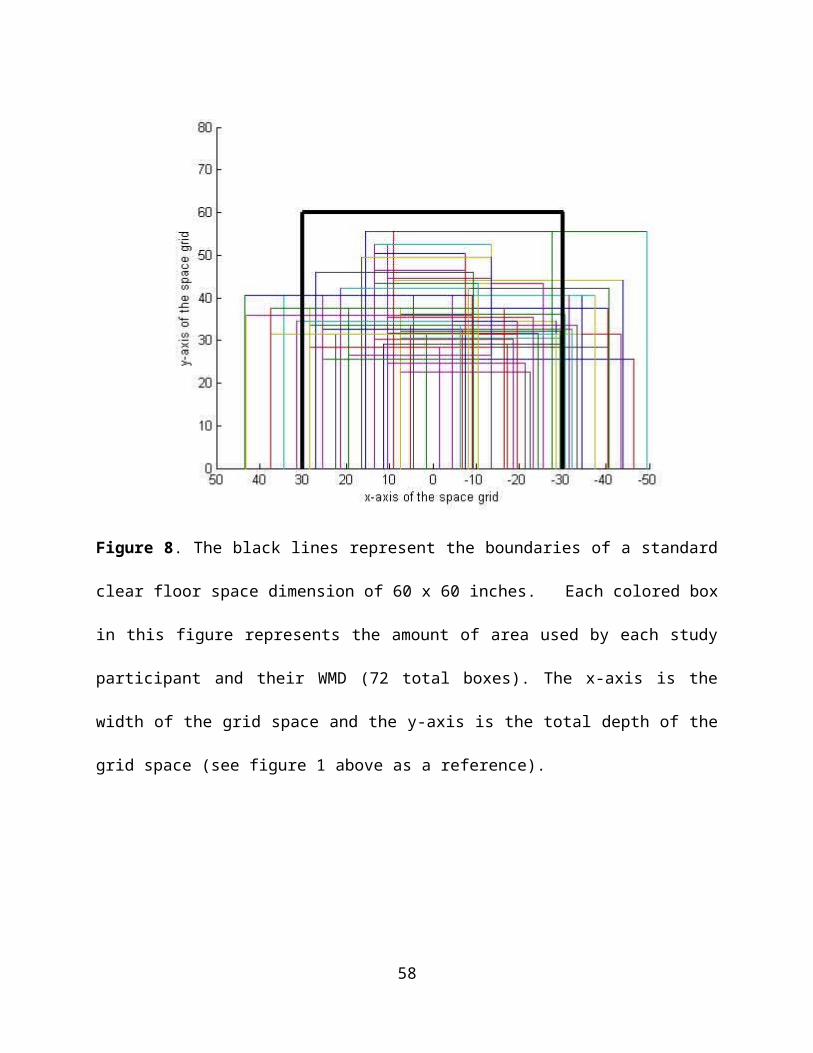
this is still considered a small sample size and may not reflect the demographics of the cohort of
individuals who independently transfer. Additional study participants would add to the strength
of the study and help to insure the study sample is as representative of the cohort population as
possible.
The study was open to children seven years old and older to participate. The Access
Board was particularly interested in collecting data from school aged WMD users to provide
guidance on playground equipment standards. Extensive efforts were made to advertise the study
to different schools, hospitals, and organizations known to work with children and only one
family over the course of the study had contacted us to participate. This family's son was eligible
for the study but his parents were not able to bring the child to HERL to be evaluated. We were
able to collect data from young and small adults. The youngest participant was 18 years old and
four participants were less than 4.9 feet tall.
Another study limitation was the low ratio of women compared to men in the study (23%
of the participants were women). Every effort was made to recruit women into the study and the
proportion of women examined in this study is similar to other studies that have involved
community dwelling adult wheelchair users [6, 12-14]. There is a lack of data on the numbers of
women and men who use WMDs and who independently transfer in the community. Another
issue concerning the US census statistic on the numbers of women versus men WMDs is that it
does not take into consideration the disparities associated with age and mobility use. Kaye et al.
states that there is a dramatic increase in WMD use with age [15]. Only 0.41% of the general
population uses a WMD from the ages of 18 to 64 years, but that percentage increases to 2.99%
for the population 65 years or older. It's possible that due to a women's longer life expectancy
that the census statistic is skewed towards including more older women (over 65) who would not
58
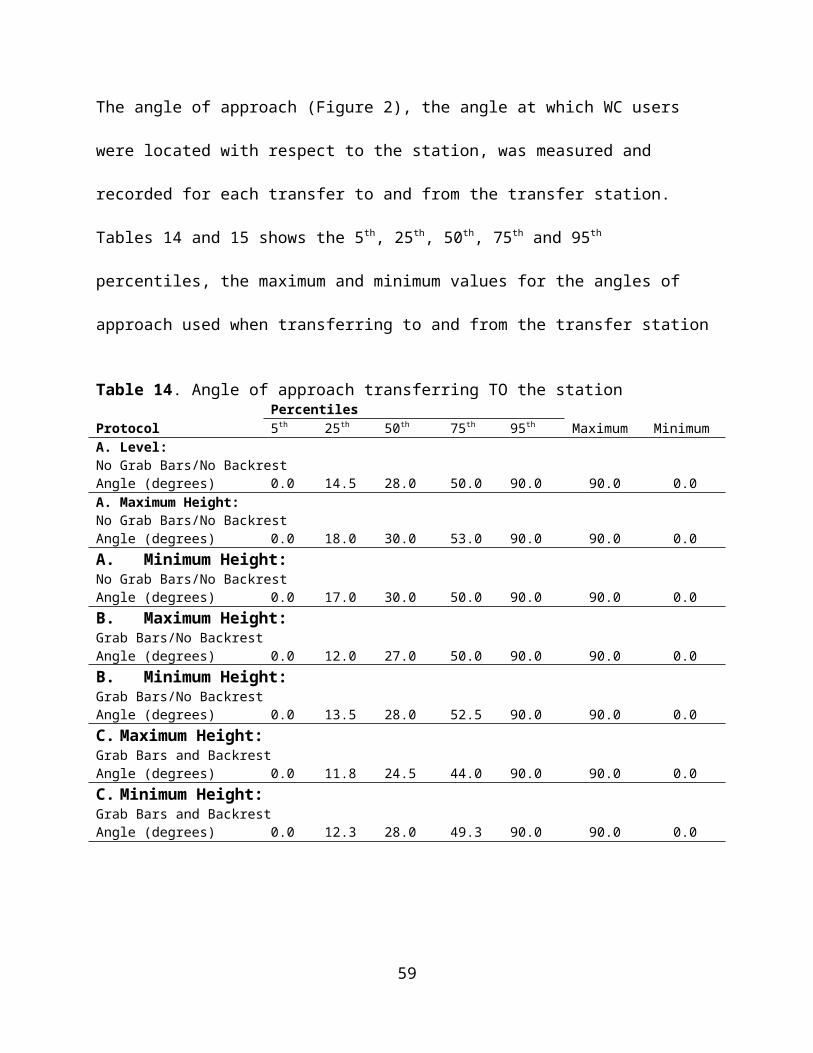
likely be actively transferring out in the community (e.g. who are residing in institutional
settings). Moreover data on working age adults shows that more men use mobility devices in
general than women (1.6% of men vs 1.3% of women of the population) [15]. Our study
involved men and women who were mostly working age and thus it’s possible that the true
proportion of women to men who actively transfer in the community is closer to that represented
in this study.
Conclusion During this second phase of the independent wheelchair transfer study, platform transfers with
and without grab-bars and a backrest and two-step transfers were evaluated. The study found that
the majority of participants (5th percentile) could transfer independently to the platform at a
height that was within one inch of the mean wheelchair or scooter seat to floor height (22.1
inches) and to a platform that was 27 inches wide. Grab bars had a significant impact on
performance when added. Up to 78% of the study participants used the grab bars when they were
added to the platform, enabling one person to independently transfer to the platform and many
others to transfer higher and lower than they could go without them. Furthermore, grab bars were
used more frequently (by up to 94% of participants) when performing transfers between two
platform steps verses transferring between the wheelchair and one platform.
Fifteen percent of WMD users who independently transfer would not likely attempt or
succeed with a two-step transfer if they were faced with them in the built environment. Of those
participants who did attempt to transfer, up to 5% failed to make it up or down to the second step
for the adjacent transfer and up to 11% failed to make it up or down to the second step for the
ramped transfer. Of the participants who attempted and were successful with both two-step
transfers, the 50th percentile could attain a 7 inch vertical height difference which is close to the
59
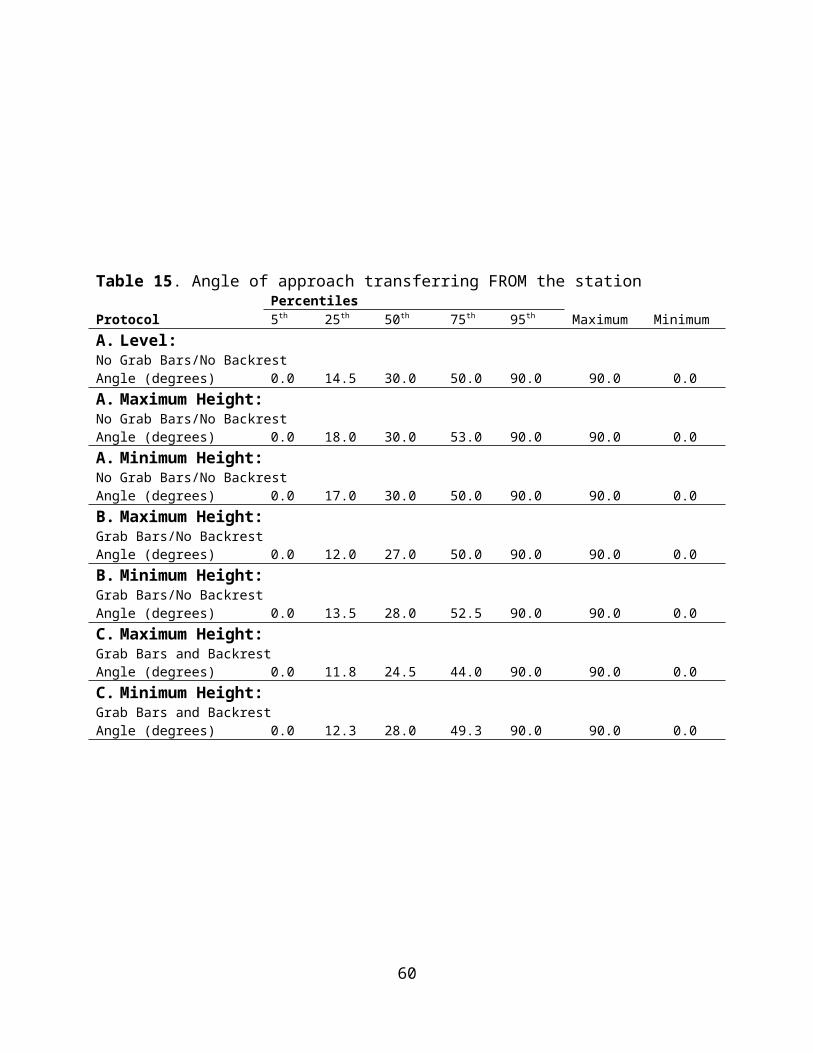
maximum allowable height difference in the standards of 8 inches. A lower step height (about
2.0 in) would be needed to accommodate the 5th percentile of users who would attempt this type
of transfer. When transferring to the platform, a 104 inch wide by 55.5 inch deep clear floor
space in front of the platform accommodated 100% of the study participants when considering
all types of transfers evaluated in this study. A standard clear floor space in front of the platform
(60 inches by 60 inches) accommodated between 52% to 66% of the participants depending on
the type of transfer (with or without grab bars and backrest) and direction of the transfer (moving
to or moving from the platform). The results from this study along with the results from the first
phase should be taken into consideration when designing and building environments for
independent wheelchair transfers and in particular recreational areas like amusement parks,
playgrounds, and pools as well as other areas that require the need for transfers like medical
diagnostic equipment and exam tables.
60
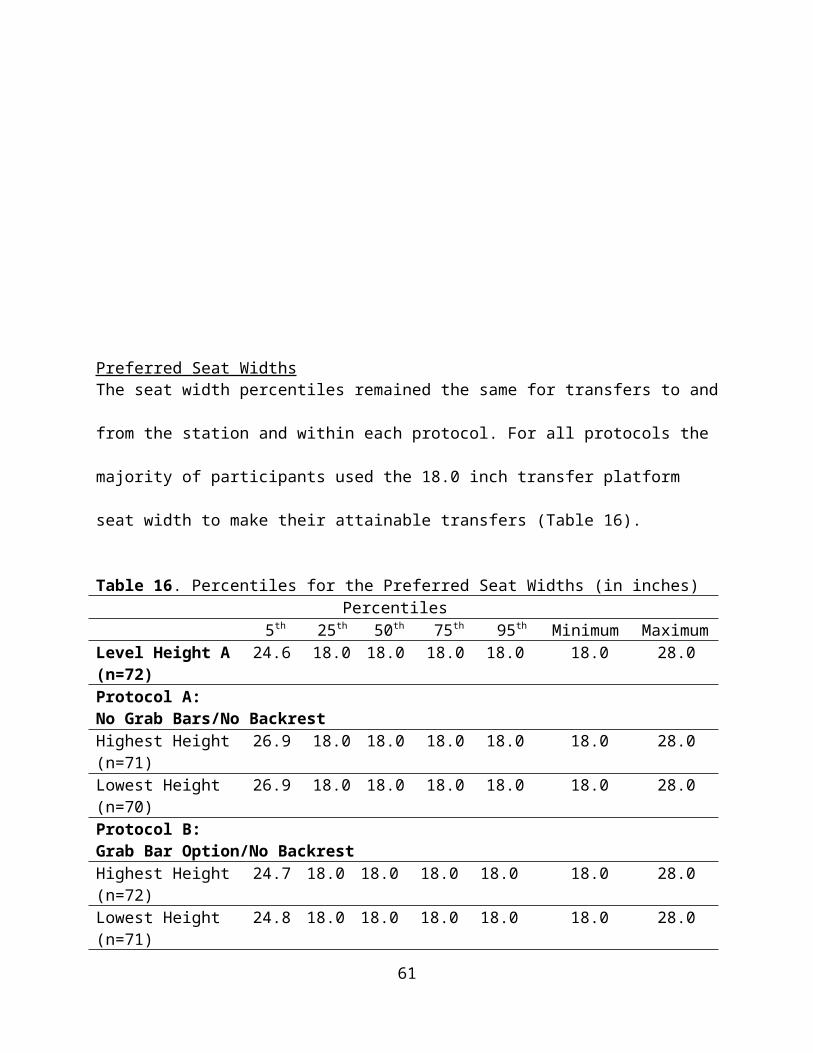
Addendum A: List of Terms Attempted Transfer- a transfer where the participant starts to transfer, by putting their hands on
the station or leaving their wheeled mobility device seat. If the participant lands on the desired
platform, then it is considered a successful transfer. If the participant does not end on the desired
platform it is considered a failed transfer.
Failed Transfer- an attempted transfer that the participant is unable to complete; not landing
securely onto the desired platform and ending back in the mobility device seat instead of on the
desired platform.
Independent Transfer: a transfer that can be completed without the assistance or intervention
Level Transfer- A transfer where the transfer surface is at the same height as the wheelchair seat
to floor height.
Non-level Transfer- A transfer where the transfer surface is higher or lower than the wheelchair
seat to floor height.
Not attempted Transfer- The participant visually inspects the set up or knows by personal
experience that they are not going to able to complete the transfer. They decide that they do not
want to attempt the transfer.
Relative Height Difference: difference between the wheelchair seat height and the height
obtained for the non-level transfers.
Successful Transfer- a transfer where the participant transfers from their wheeled mobility device
to the transfer station landing safely and securely on the transfer seat.
Transfer Board- a transfer board is a piece of assistive technology that helps a person transfer
from one surface to another. The board sits between the wheelchair and the transfer surface. The
boards come in a variety of shapes and sizes.
61

Transfer Station- instrument used for conducting the study consisting of a table on top of a
hydraulic adjustable height scissor lift, with the addition of modular parts for different transfer
set ups.
Two Step Transfer: a transfer from a wheelchair to a transfer surface (step 1) and then a second
transfer to another transfer surface that is either higher or lower than the previous one (step 2).
Wheelchair seat height- The distance measured from the floor to the top of the wheelchair seat
cushion. This distance is measured at the center of the seat.
62
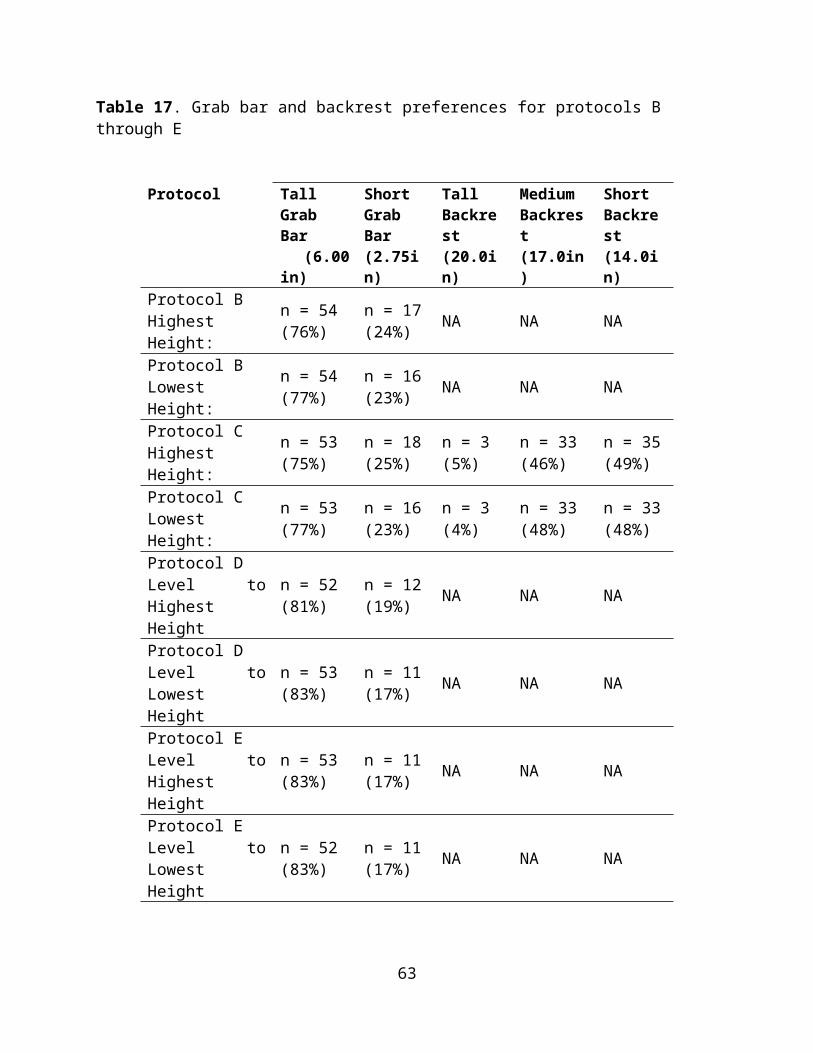
Addendum B: List of AbbreviationsADA- Americans with Disabilities Act (2010)
ADA-ABA Standards- Americans with Disabilities Act - Architectural Barriers Act Standards
COPD- Chronic obstructive pulmonary disease
CP- Cerebral Palsy
M-Manual wheelchair
MD-Muscular dystrophy
MPA- Manual power assist wheelchair
MS- Multiple Sclerosis
NA-Not applicable
P-Power wheelchair
S-Scooter
SCI-Spinal Cord Injury
WC Type-Wheelchair Type
WMD- Wheeled mobility device
63

Addendum C: Participant responses to two step transfers for protocols D and E
Adjacent Transfer/Two Step
Transfer with Ramp
Participant Remarks
Participants that Did Not Attempt the TransfersAvoid/Avoid Would find a different way to get there. The set up interferes with his
leg braces. May be able to transfer if the station was softer.Avoid/Avoid It was too difficult to position my legs for such transfersAvoid/Avoid Transfer hurt hands
Participants that had a Failed AttemptAvoid/Avoid Not Practical
Avoid/Avoid Not used to this kind of transfer. Used to doing 1 step transfers.
Avoid/Avoid Not comfortable performing this type of transferAvoid/Avoid It was too difficult to position my legs for such transfers
Transfer/Transfer Some transfers were a little tough, but I don't think I would avoid any of the situations
Participants that Completed the Transfers
Avoid/Avoid Would not complete due to feeling unsafe and feel they might fall
Avoid/Avoid It was manageable but too much of a pain to perform in public setting
Avoid/Avoid
Didn’t like the transfer because the arms were extended behind the body. For a high level para it is easier to try and grab onto something and climb up as supposed to
bumping up during a transfer.
Avoid/Avoid Not worth the risk of injury unless it was absolutely necessary.
Avoid/AvoidDepends on the situation and whether there are grab bars.
Would not choose to complete unless there was a very important reason to do so
Avoid/Avoid Made me short of breathAvoid/Transfer The ramp made it easier and could better control legs
Transfer/AvoidBoth transfers were new for me. The angled transfer was
very demanding to perform. Overall both the two-step transfers were rough and shoulder pain made it worse.
Transfer/AvoidFelt more comfortable transferring to a direct vertical height instead of the angled transfer. Felt less stable
during the angled transfer.
Transfer/AvoidThe 90o felt a lot like transferring up stairs. The angled transfer was like scooting up a hill. Would avoid doing
this unless he needed to go up a hill.
Transfer/Transfer Felt the transfers were easy since I have smaller legs. The ramp makes the angled transfer more comfortable.
Transfer/Transfer Felt the two-step process made transferring easier
64
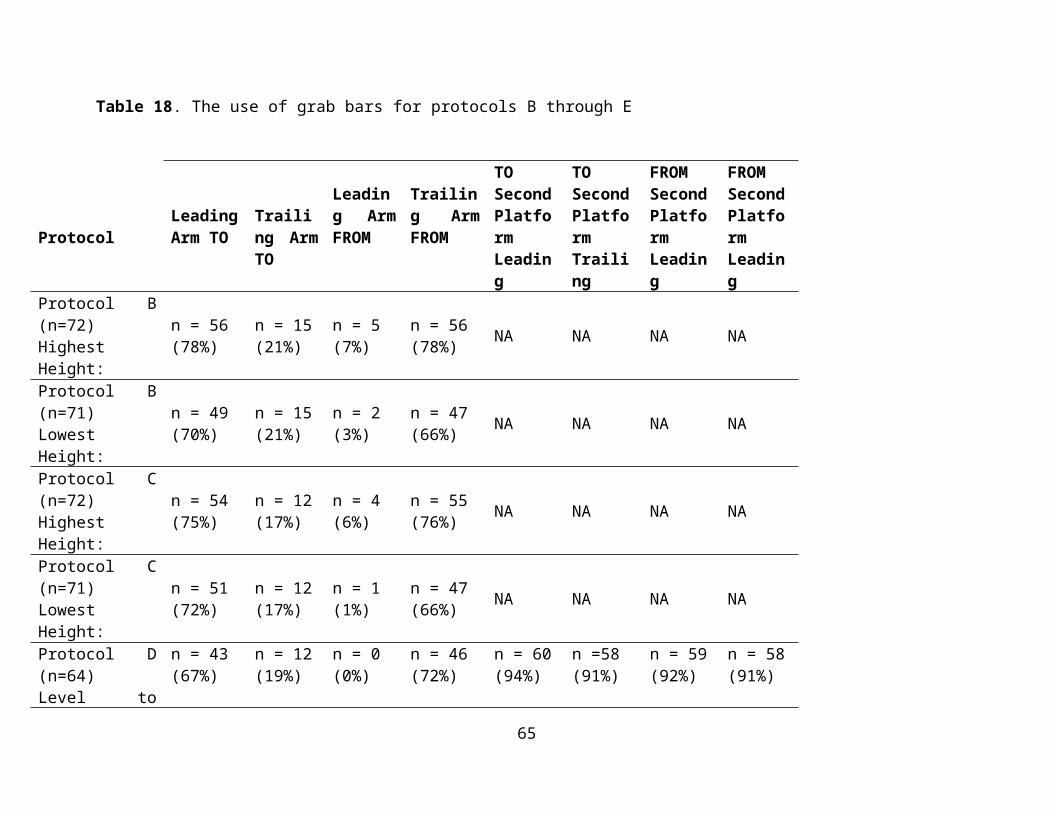
Transfer/Transfer Yes I would certainly do them over again. I found it very fun
Transfer/Transfer If it was something that needed done I would do it. I try not to set limitations
Transfer/Transfer Felt the transfer were easier because of the grab bars
Transfer/Transfer As an active wheelchair user I would make these transfers in the real world
Transfer/Transfer Preferred the sloped transfer and would try to figure out a different way to make the transfers
Addendum D: Comparison of demographics and transfer height between Phase 1 and Phase 2 of the study
ParticipantsIn the last transfer study a total of 120 participants were enrolled consisting of 95 men and 25
women with an average age of 47.7 ± 15.3 years, body weight of 171.5 ± 48.0 lbs, and height of
65
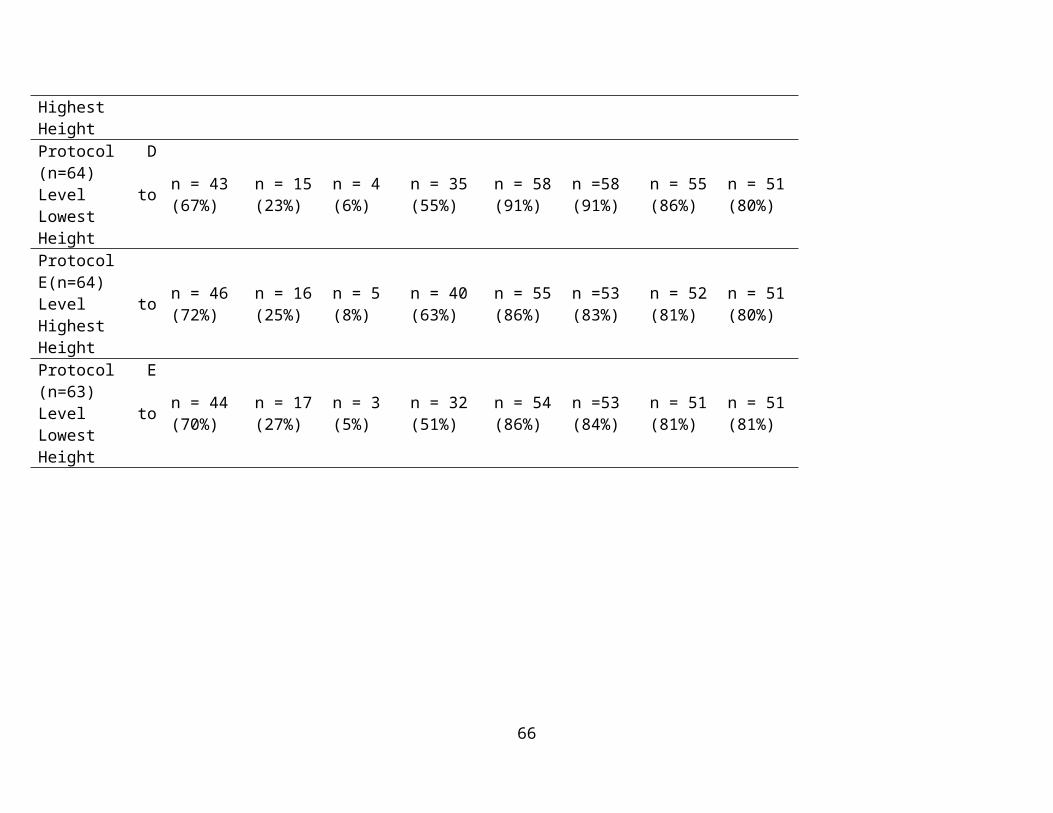
67 ± 6 in. At the time this addendum was composed, 63 participants had been enrolled in the
Phase II study consisting of 50 men and 13 women, with an average age of 45 ± 15 years, body
weight of 172 ± 53lbs and a height of 67±6in. Further details of the demographics from the two
studies can be seen in Table D1, including hours using a wheelchair per day, years using a
wheelchair and number of level and non-level transfers. The percentages of males and females
were the same for both phases of the study with 21% of the participants being female and 79% of
the participants being male.
Table D1. Detailed demographics of the study participants from phase 1 and phase 2. Average (Std) Median Min Max P1 P2 P1 P2 P1 P2 P1 P2Age (years) 48 (15) 45 (15) 52 49 18 18 85 78Height (in) 67 (6) 67 (6) 68.5 68 50 46 77 80Weight (lbs) 172 (48) 172 ( 53) 165 170 90 49 332 300Hour using wheelchair (per day)
11 (4) 12 (4) 12 12 2 3 18 18
Years using wheelchair
15 (12) 13 (9) 13.5 11 1 1 59 37
Number of level transfer
10 (8) 12 (12) 7 8 0 0 50 100
Number of non-level transfers
6 (6) 9 (15) 4 5 0 0 50 100
Note. P1-Phase 1 P2-Phase 2
Detailed Age Demographics
66
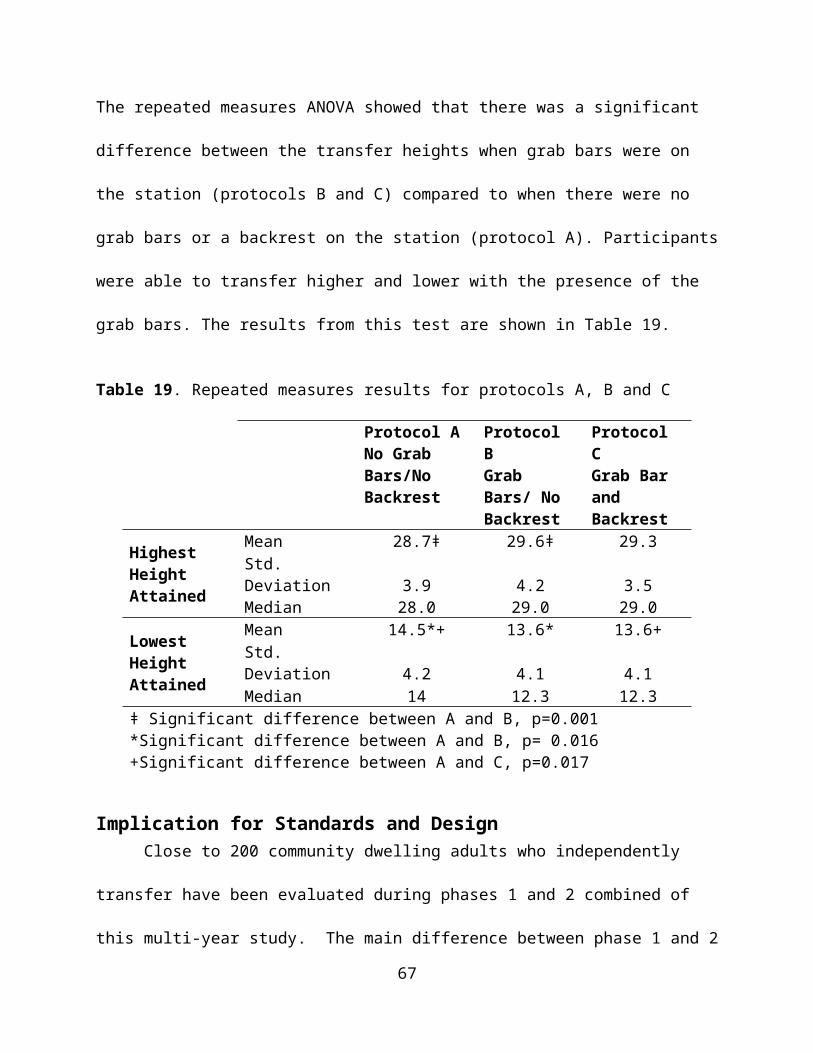
For phase 1 there were more people clustered around the 45-65 age range, skewing the histogram
slightly to the right (Figure D1). For phase 2 there is a small gap in the distribution around 25-35
years old causing the distribution on either side to be greater (Figure D2).
Figure D1. Age histogram phase 1 Figure D2. Age histogram for phase 2
Table D2. Percentage of participants in each age categoryAge Bin P1 (%) P2 (%)18-24 12 1425-34 10 1435-44 15 1345-54 22 3255-64 27 2165-74 13 575-84 1 1
67
Self-Reported Disability Types DemographicsA wide variety of disability types were reported in both of the study samples (Table D3).
Table D3. Participants type of self-reported disability for phase 1 and phase 2Disability Number of participants
Phase 1 (n = 120) Phase 2 (n=63)Spinal cord injury 54 (45%) 29 (46%)Multiple sclerosis 10 (8%) 2 (3%)Cerebral palsy 11 (9%) 3 (4%)Lower extremity amputation 9 (7%) 8 (12%)Spina bifida 6 (5%) 4 (6%)Multiple sclerosis and spinal cord injury 3 (2%) 2 (3%)Osteogenesis imperfecta 2 (1%) 2 (3%)Post-polio 2 (1%) 0 (0%)Traumatic brain injury and spinal cord injury 2 (1%) 0 (0%)Muscular dystrophy 2 (1%) 1 (1%)Rheumatoid arthritis 2 (1%) 1 (1%)Traumatic brain injury 2 (1%) 3 (4%)Other CategoryPhase 1 (n=15) Phase 2 (n=9)Traumatic brain injury and lower extremity amputation (n=1)
Stroke (n=2)
Spinal cord injury and lower extremity amputation (n=1)
Ambulatory Dysfunction (n=1)
Osteoporosis (n=1) Double lower extremity amputation and stroke (n=1)
Stroke (n=1) Adrenolukodystrophy (n=1)Adams-Oliver syndrome (n=1) Cardiac complications (n=1)Ambulatory Dysfunction (n=1) Guillian-Barre Syndrom (GBS) (n=1)Reflex sympathetic dystrophy (n=1) Side effect of liver disease (n=1)Spinal stenosis (n=1) Thrombocytopenia with absent radius
(TAR Syndrome) (n=1)Epidemiral cyst (n=1)Double lower extremity amputation and stroke (n=1)Amyotrophic lateral sclerosis (n=1)Respiratory problems (n=1)Sarcoidosis (n=1)Knee replacement complications (n=1)Hip injury (n=1)
68
Mobility Use DemographicsThere were 84 manual wheelchair, 29 power wheelchairs, 5 scooter, and 2 power assist users in
phase 1 of the study. In comparison, in phase 2 of the study there were 42 manual wheelchairs
users, 15 power wheelchairs, 3 scooters and 3 power assist users. The percentages of the total for
each type of mobility device for both phases is shown in figures D5 and D6.
Tables D4 and D5 show the breakdown of gender and mobility type by self-reported disability
for phase 1 and phase 2.
Table D4. Number of participants by self-reported disability type and WMD type for males study participants for both phases
Male Participants Phase 1 Phase 2 Phase 1 Phase 2 Phase 1 Phase 2 Phase 1 Phase 2Disability Manual WC Manual WC Power WC Power WC Scooter Scooter MPA MPASpinal Cord Injury 39 (32.5%) 19 (30%) 9 (7.5%) 4 (6%) 0(0%) 0 (0%) 0 (0%) 0 (0%)CP 1 (1%) 0 (0%) 4 (3%) 0 (0%) 2 (1%) 2 (3%) 0 (0%) 0 (0%)MS 4 (3%) 1 (1.5%) 2 (2%) 1 (1.5%) 1 (1%) 1 (1.5%) 1 (1%) 0 (0%)Amputee 7 (6%) 8 (12.5%) 3 (2.5%) 1 (1.5%) 0 (0%) 0 (0%) 0 (0%) 0 (0%)Spina Bifida 3 (2.5%) 3 (5%) 0 (0%) 1 (1.5%) 0 (0%) 0 (0%) 0 (0%) 0 (0%)Other 11 (9%) 4 (6%) 8 (7%) 4 (6%) 1 (1%) 1 (1.5%) 0 (0%) 2 (3%)Total 65 (54%) 35 (56%) 26 (22%) 11 (17%) 4 (3%) 2 (3%) 1 (1%)_ 2 (3%)
69
Table D5. Number of participants by self-reported disability type and WMD type for females for both phases.
Female ParticipantsPhase 1 Phase 2 Phase 1 Phase 2 Phase 1 Phase 2 Phase 1 Phase 2
Disability Manual WC Manual WC Power WC Power WC Scooter Scooter MPA MPASpinal Cord Injury 6 (5%) 6 (9.5%) 1 (1%) 0 (0%) 0 (0%) 0 (0%) 0 (0%) 1 (1.5%)CP 1 (1%) 0 (0%) 2 (2%) 2 (3%) 0 (0%) 0 (0%) 1 (1%) 0 (0%)MS 2 (2%) 0 (0%) 0 (0%) 0 (0%) 0 (0%) 0 (0%) 0 (0%) 0 (0%)Amputee 0 (0%) 0 (0%) 0 (0%) 0 (0%) 0 (0%) 0 (0%) 0 (0%) 0 (0%)Spina Bifida 3 (2.5%) 0 (0%) 0 (0%) 0 (0%) 0 (0%) 0 (0%) 0 (0%) 0 (0%)Other 6 (5%) 1 (1.5%) 2 (2%) 2 (3%) 0 (0%) 1 (1.5%) 0 (0%) 0 (0%)Total 18 (15%) 7 (11%) 5 (4%) 4 (6%) 0 (0%) 1 (2%) 1 (1%) 1 (2%)
Note. MPA= Manual Power Assist Wheelchair
Comparison of Transfer Protocols
A comparison of the 5th, 25th, 50th, 75th and 95th percentiles between the first transfer study and
this study are shown in Tables D6 and D7. This comparison is looking at the level transfer for
both of the studies.
Table D6. Highest Transfer Height Obtained
Percentiles5th 25th 50th 75th 95th End Ranges
Phase 1 (n=111) 22.3 25.0 27.0 29.0 29.0 20-29
Phase 2 (n=62) 22.1 26.4 28.4 30.2 36.2 22-43
Table D7. Lowest Transfer Height ObtainedPercentiles
5th 25th 50th 75th 95th End RangesPhase 1 (n=111) 22 18 15 10 10 10-23
Phase 2 (n=62) 22.9 21.9 14.4 10 10 10-25
The percentiles for the highest transfer height obtained are higher for phase 2 of the study. This
is due to the limitations of the transfer station used in phase 1. The station used in phase 1 has a
70
maximum height of 29 inches whereas the station used in phase 2 has a maximum of 43 inches.
In phase 1 there were many people that reached the maximum, where as in phase 2 only a couple
people reached the maximum.
71
Addendum E: Comparison of participants tested at the National Disabled Veterans Winter
Sports Clinic (NDVWSC) compared to the participants tested at the Human Engineering
Research Laboratories and Hiram G. Andrews Center.
At the time this addendum was composed, there were 31 participants enrolled in the phase 2
study at HERL (27 men and 4 women). This group of subjects was compared to all the subjects
who were tested at the NDVWSC (22 men and 9 women). The general subject demographics
broken down by group are shown in Tables E1-E3.
Table E1: Subject demographics for both HERL and NDVWSC study participants. Mean and
standard deviation of the samples are shown.
Subject Characteristic Tested at HERL(n=31)
Tested at NDVWSC (n=31)
Age (years) 37.0 (14.3) 52.6 (11.1)Height (in) 66.8 (7.5) 67.5 (3.5)Weight (lbs) 173.9 (66.6) 170.6 (36.2)Years using wheelchair 14.8 (9.5) 10.9 (7.9)Hours per day using the wheelchair
11.8 (4.1) 12.0 (4.6)
Table E2: Type of wheelchairs used by HERL and NDVWSC study participantsType of
WheelchairTested at HERL(n=31) Tested at NDVWSC (n=31)
Manual 19 23Power 9 5
Power Assist 1 2Scooter 2 1
72
Table E3: Disability types among the HERL and NDVWSC study participantsDisability Type Tested at HERL (n=31) Tested at NDVWSC (n=31)SCI 12 17Cerebral Palsy 3 0Spina Bifida 4 0Amputation 2 6Traumatic Brain Injury 0 3Osteogenesis Imperfecta 2 0SCI 0 2Multiple Sclerosis 1 1Muscular Dystrophy 1 0Other 6 2
For protocols A, B and C (same set up as described in the report) a comparison of the 5th, 25th,
50th, 75th, and 95th percentiles was calculated and shown below.
Protocol A Heights ObtainedThe highest and lowest obtained transfers were compared for the participants that were tested at
HERL (n=31) and the participants that were tested at the NDVSWC. The transfer heights
obtained in protocol A for both sample groups can be seen in tables E4 and E5.
Table E4. Percentiles for the Lowest Attainable Transfer Heights Protocol AData shown in inches
PercentilesParticipants 5th 25th 50th 75th 95th
Tested at HERL 23.6 16.5 12.6 10 10Tested at NDVWSC 23.6 20 14 10 10
All Participants 23.6 20 14 10 10Table E4 Alternative Text Description: This table shows the attainable height percentiles for
Protocol A minimum height transfers. Participants are divided into three groups in column one:
participants tested at HERL, participants tested at the NDVWSC, and all participants. Columns
two through six show the transfer heights for 5th, 25th, 50th, 75th, and 95th for each subset of
participants. HERL participants tended to be able to transfer lower than NDVWSC participants.
73
They attained lower heights in the 25th and 50th percentiles. The 5th, 75th, and 95th percentiles are
equal for all groups.
Table E5. Percentiles for the Highest Attainable Transfer Heights Protocol AData shown in inches
PercentilesParticipants 5th 25th 50th 75th 95th
Tested at HERL 21.9 26.8 28.5 31.9 35.6Tested at NDVWSC 22.8 25.4 27.8 31.3 38.6
All Participants 21.9 26.8 28.5 32.2 35.6
For the minimum height transfer, the participants tested at HERL transferred about 1.4" lower on
average than the participants tested at the NDVWSC. The upper 95th percentile transfer heights
were 3" higher for the NDVWSC than the HERL group for the maximum height transfer.
Protocol B Heights ObtainedThe data for each of the two groups can be seen in tables E6 and E7. Again for the minimum
height protocol HERL participants transferred lower on average than the NDVWSC participants.
For the maximum height transfer the participants tested at HERL transferred slightly higher than
the participants tested at the NDVWSC based on all calculated percentiles.
Table E6. Percentiles for the Lowest Attainable Transfer Heights Protocol BData shown in inches
PercentilesParticipants 5th 25th 50th 75th 95th
Tested at HERL 23.0 15.3 10 10 10Tested at NDVWSC 21.0 17.6 13.3 10 10
All Participants 23.0 15.3 10 10 10
74
Table E7. Percentiles for the Highest Attainable Transfer Heights Protocol BData shown in inches
PercentilesParticipants 5th 25th 50th 75th 95th
Tested at HERL 23.3 27.0 29.5 33.0 39.3Tested at NDVWSC 22.2 26.5 29.0 31.5 38.5
All Participants 23.3 27.0 29.5 33.0 39.3
Protocol C Heights ObtainedLike the two previous protocols the HERL participants transferred lower on average compared to
the NDVWSC participants. For the maximum height transfers HERL's percentile heights were
slightly higher for the 25th and 75th percentiles than the NDVWSC heights. These results can be
seen in tables E8 and E9 respectively.
Table E8. Percentiles for the Lowest Attainable Transfer Heights Protocol CData shown in inches
PercentilesParticipants 5th 25th 50th 75th 95th
Tested at HERL 23.0 15.3 10 10 10Tested at NDVWSC 21.0 17.6 13.3 10 10
All Participants 23.0 15.3 10 10 10
Table E9. Percentiles for the Highest Attainable Transfer Heights Protocol CData shown in inches
PercentilesParticipants 5th 25th 50th 75th 95th
Tested at HERL 24.2 27.0 30.0 33.3 34.3Tested at NDVWSC 22.2 26.5 29.0 31.5 35.0
All Participants 24.2 27.0 30.0 33.3 34.3
We compared the two groups for transfer heights to/from the wheelchair to a level platform with
and without grab bars and also evaluated their maximum and minimum transfers heights to the
platform for each grab bar condition. As can be seen from the results in Table E10, the HERL
and NDVWSC study participants attained similar transfer heights for all parts of the protocol.
75
An independent t-test comparison of these results (p-values shown in Table 10) showed no
statistically significant differences between the two groups for transfer performance. This result
supports that the veterans who participate in these events are not very different from the subjects
that we recruit at HERL from the general community.
Table E10: Comparison of transfer performance in Phase 2 of the multi-year study on transfers
between wheelchair users tested at HERL and veterans tested at the NDVWC
heights attained between both subject populations. Height data are shown in inches. No
significant difference was found between the subjects.
Protocol Mean (Std) P- ValueTested at HERL
(n=31)Tested at NDVWSC
(n=31)Level Transfer 22.4 (1.1) 21.8(1.6) .056Maximum Transfer Height to Platform
29.2 (3.50) 28.8 (4.5) .682
Minimum Transfer Height to Platform
13.8 ( 4.2) 14.9 (4.3) .292
Maximum Transfer Height to Platform with Grab Bars Present
30.2 (4.0) 29.4 (4.5) .464
Minimum Transfer Height to Platform with Grab Bars Present
12.9 (4.2) 13.9 (4.0) .313
76
Addendum F: Relative Height Differences
Relative heights were calculated for high and low transfers for all three protocols. Refer to
Addendum A for the definition of relative height. The following tables F1-F3 represent the data
for the three protocols.
Table F1. Relative Height Difference for High and Low Transfers for Protocol A.
Percentiles
5th 25th 50th 75th 95th
A. Adjustable HeightNo Grab Bars/No BackrestMaximum Height (n=71) .300 3.5 5.00 9.00 13.7
Minimum Height (n=71) .300 3.5 7.75 11.5 13.2
For protocol A, it can be seen that the majority of subjects (e.g. 5 th percentile or about 95%) can
transfer less than half an inch above their WMD seat height for both the high and low transfers.
This number increases to 5 inches for high transfers and 7.75 inches for low transfers for the 50 th
percentile.
Table F2. Relative Seat Height Difference for High and Low Transfers for Protocol B.
Percentiles5th 25th 50th 75th 95th
B: Adjustable HeightGrab Bar Option/No BackrestMaximum Height (n=72) .3250 4.00 6.375 10.0 15.79
Minimum Height (n=71) 1.3 4.00 9.00 11.75 13.5
For protocol B, the majority of subjects (e.g. 5 th percentile, or approximately 95%) were able to
transfer 0.325 inches above and 1.3 inches below their WMD seat height, while the 50th
77
percentile was able to transfer 6.375 inches higher and 9 inches lower than their WMD seat
height.
Table F3. Relative Seat Height Difference for High and Low Transfers for Protocol C.
Percentiles5th 25th 50th 75th 95th
C. Adjustable HeightGrab Bar Option/Backrest OptionMaximum Height (n=72) .3250 4.00 6.5 10.0 13.34
Minimum Height (n=71) 1.50 4.375 9.375 11.75 13.5
Protocol C follows a similar trend to protocol B. The majority of subjects (5 th percentile or about
95%) were able to transfer 0.325 inches higher and 1.5 inches lower than their WMD seat.
78
Addendum G: Comparison of Transfer Abilities between Men and Women
The sample consisted of 55 men and 17 women with women having an average age of 48 ± 12
years, body weight of 163.14 ± 50.71 pounds and a height of 64.17±3.0 inches and men having
an average age of 45 ± 16 years, body weight of 180.78 ± 55.12 pounds and a height of
68.11±0.6 inches. The average wheelchair seat to floor height for men was 22.2 (±1.44) inches
and the average height for women was 21.65 (±1.31) inches. The following figures G1 and G2
show the difference in transfer ability between men and women for high and low transfers.
Protocol A Protocol B Protocol C232425262728293031
29.4730.53 30.21
26.1526.73 26.71
Difference in Transfer Ability Between Men and Women for High Transfers
MenWomen
Figure G1. Mean differences in heights achieved relative to the ground between men and women for high transfers for all three protocols.
Men transferred significantly higher (A: 29.47 (3.9), B: 30.53 (4.2), C: 30.21 (3.4) inch) than the
women (A: 26.15 (2.5), B: 26.73 (2.7), C: 26.71 (2.5) inches) with p-values (0.01, p<0.01 and
p<0.01).
79
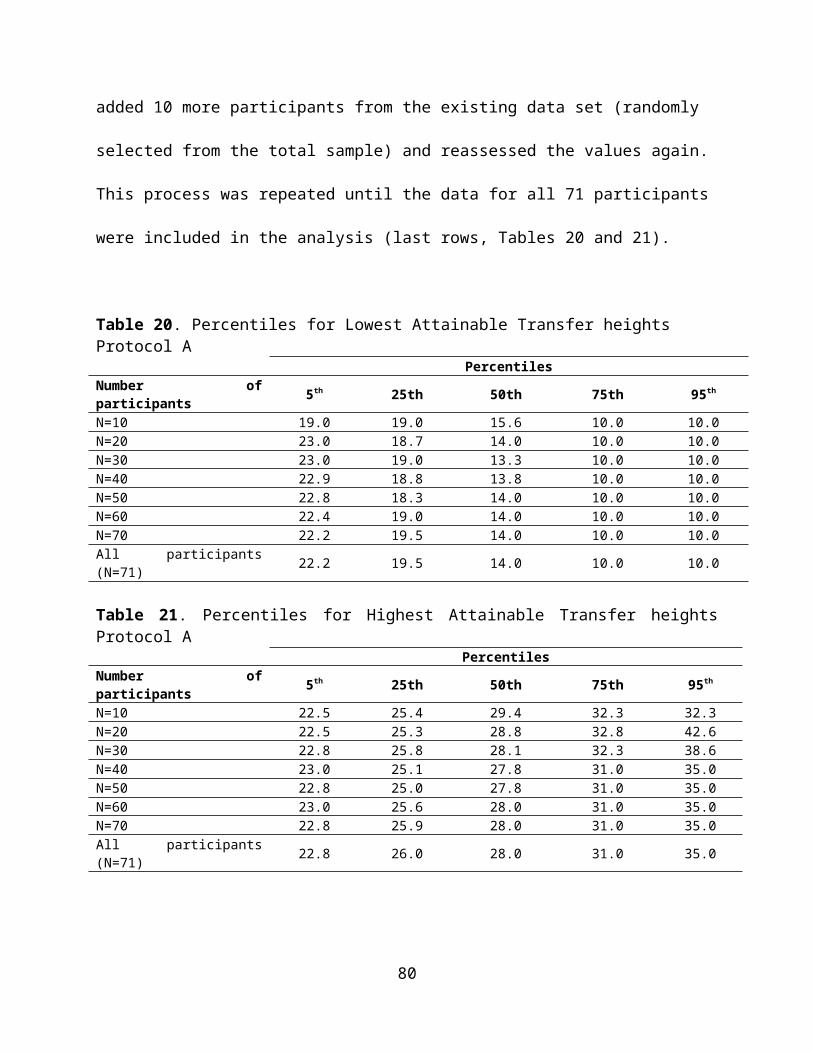
Protocol A Protocol B Protocol C02468
101214161820
13.612.61 12.74
17.8416.7 16.36
Difference in Transfer Ability Between Men and Women for Low Transfers
MenWomen
Figure G2. Mean differences between men and women for low transfers for all three protocols. The data are shown in inches.
Additionally, men transferred significantly lower (A: 13.6 (4.02), B: 12.61 (3.60), C: 12.74 (3.7)
inches) than women (A: 17.84 (4.2), B: 16.7 (4.41), C: 16.36 (4.69) inches) with p-values (0.04,
0.04 and 0.026).
The addition of grab bars helped the women and the men to transfer slightly higher and lower
than their wheelchair seat height.
80
References
1. Steinmetz E. Americans with disabilities. Household Economic Studies, 70-107. 2006.
2. Brault MW. Americans with disabilities. Household Economic Studies, 70-131. 2012.
3. Pentland WE and Twomey LT. Upper limb function in persons with long term paraplegia
and implications for independence: Part II. Paraplegia 32: 219-224, 1994
4. Finley MA, McQuade KJ and Rodgers MM. Scapular kinematics during transfers in manual
wheelchair users with and without shoulder impingement. Clin Biomech (Bristol, Avon) 20:
32-40, 2005.
5. Gagnon D, Koontz AM, Mulroy S, Nawoczenski D, Butler-Forslund E, Granstrom A,
Nadeau S and Boninger ML. Biomechanics of sitting pivot transfers among individuals with
spinal cord injury: A review of the current knowledge. Topics in Spinal Cord Injury
Rehabilitation 15: 33-58, 2009.
6. Toro ML, Koontz AM and Cooper RA. The impact of transfer setup on the performance of
independent transfers. The Journal of Human Factors and Ergonomics Society 55: 567-580,
2013.
7. US Access Board. ADA-ABA Accessibility Guidelines for Buildings and Facilities (ADA-
ABA). 2002. http://www.access-board.gov/guidelines-and-standards/buildings-and-sites/
about-the-ada-standards/background/ADA-ABA
8. The Impact of Transfer Setup on the Performance of Independent Wheelchair Transfers:
Final Report. (2010). VA Human Engineering Research Laboratory. Presented to the United
States Access Board September 2010. http://herl.pitt.edu/ab/transfer_assessment_report.pdf.
9. A Clinical Application Guide to Standardized Wheelchair Seating Measurements of the Body
and Seating Support Surfaces. (2013) Revised Edition, University of Colorado/Assistive
81
Technology Partners Denver, Colorado, USA, Available from:
https://www.assistivetechnologypartners.org
10. Koontz AM, Toro M, Kankipati P, Naber M and Cooper RA. An expert review of the
scientific literature on independent wheelchair transfers. Disability and Rehabilitation:
Assistive Technology 7(1); 20-9, 2012.
11. Nyland J, Quigley P, Huang C, Lloyd J, Harrow J and Nelson A. Preserving transfer
independence among individuals with spinal cord injury. [Review] [70 refs]. Spinal Cord 38:
649-657, 2000.
12. Sonenblum SE, Sprigle S and Lopez RA. Manual wheelchair use: bouts of mobility in
everyday life. Rehabilitation Research Practice 2012: 753165, Epbub July 15, 2012.
13. Tolerico ML, Ding D, Cooper RA, Spaeth DM, Fitzgerald SG, Cooper R, et al. Assessing
mobility characteristics and activity levels of manual wheechair users. journal of
Rehabilitation Research and Development. 2007;44(4):561-72.
14. Cooper RA, Molinero AM, Souza A, Collins DM, Karmarkar A, Teodorski E, Sporner M.
Effects of cross slopes on the mobility of manual wheelchair users. Assistive Technology.
2012; 24(2):102-9.
15. Kaye, H. S., Kang, T. and LaPlante, M.P. (2000). Mobility Device Use in
the United States. Disability Statistics Report, (14). Washington, D.C.: U.S.
Department of Education, National Institute on Disability and
Rehabilitation Research.
82