Embed Size (px)
DESCRIPTION
Here is what we look for in the histogram. We try to make sure we get the histogram to match up on top of each other and it in the 1E-4 to -5 range. The spike in the red channel is from our control probe that we use to line up the grid from extracting the probes. The whole image. - PowerPoint PPT Presentation
Citation preview

Here is what we look for in the histogram.
We try to make sure we get the histogram to match up on top of each other and it in the 1E-4 to -5 range
The spike in the red channel is from our control probe that we use to line up the grid from extracting the probes.
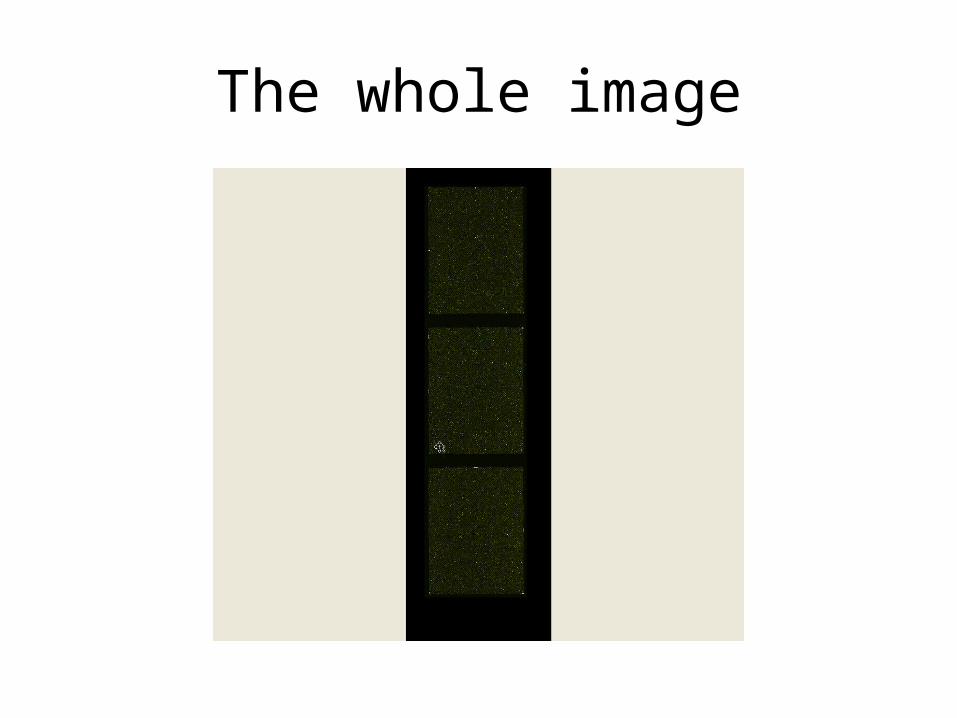
The whole image
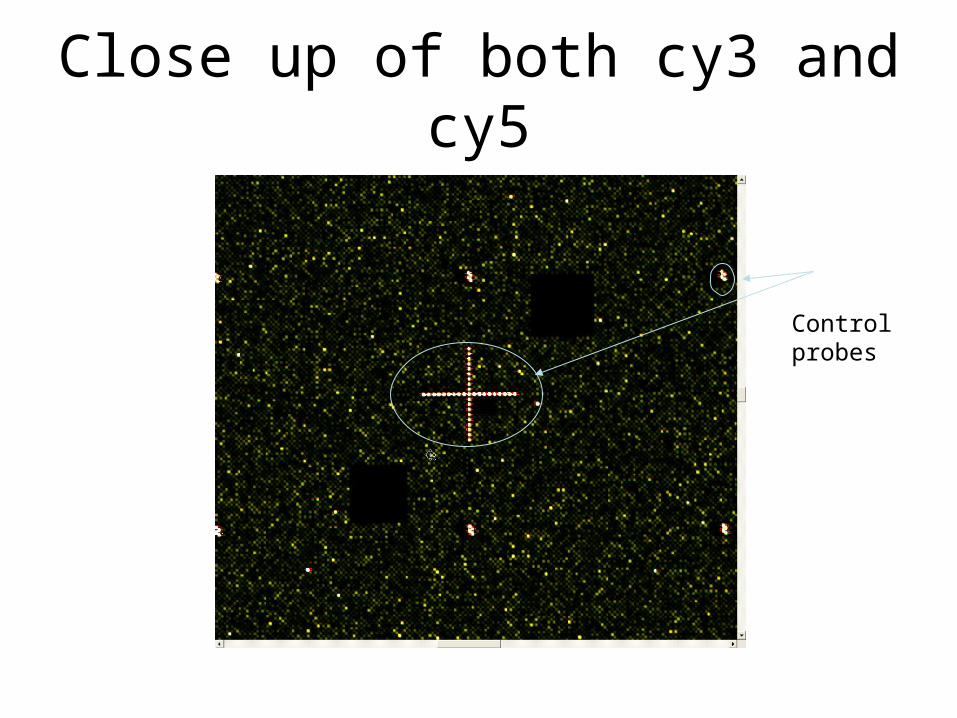
Close up of both cy3 and cy5
Control probes
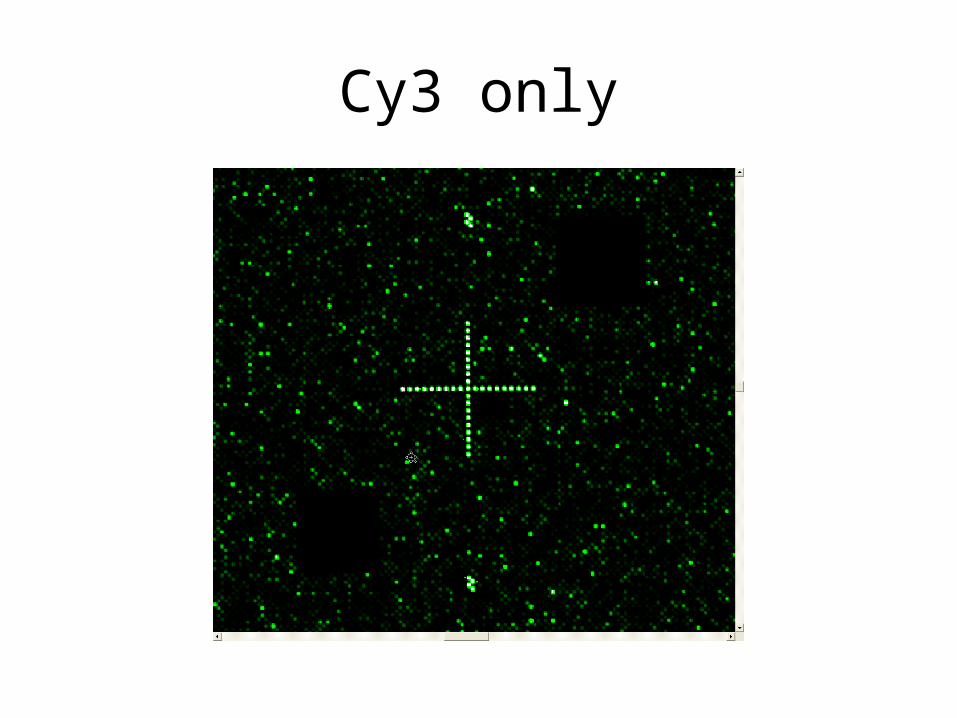
Cy3 only

Cy5 only