Embed Size (px)
Citation preview
1
Here Comes the
Sun Evaluation of a public sun
safety intervention
November 2016
2
Contents
1. Introduction ....................................................................................................................... 3
2. Methods ............................................................................................................................ 4
3. Headline Data ................................................................................................................... 5
4. Findings: Demographics................................................................................................... 6
5. Findings: Knowledge ........................................................................................................ 8
6. Findings: Current Behaviour ........................................................................................... 11
7. Findings: Self-reported behaviour changes .................................................................... 15
10. Appendix A – Sun Safety Quiz ..................................................................................... 21
3
1. Introduction
1.1 In the UK around 2,000 people die from malignant melanoma skin cancer each year1 and in Wales this figure is approximately 1502. Around 700 people in Wales are diagnosed each year and between 2003 and 2013 the number of cases of malignant melanoma in men rose by 82%.3
1.2 The Here Comes the Sun (HCTS) initiative began in 2010 to provide sun safety
messages with the ambition of improving knowledge and influencing a change in
dangerous behaviours amongst members of the public. Building on previous
campaigns, the aim of Here Comes the Sun 2016 was targeted particularly towards
raising awareness of appropriate use of sun cream including what information to look
out for e.g. UVA, UVB, star rating etc.
1.3 The following is an evaluation of the main findings found from this year’s campaign.
1 CRUK (2016) Skin Cancer Statistics. [Online]. Available at www.cancerresearchuk.org/cancer-
info/cancerstats/types/skin/ accessed 14.11.16 2 WCISU (2016) Incidence by cancer type.[Online] Available at www.wcisu.wales.nhs.uk/cancer-statistics
accessed 14.11.16 3 WCISU (2016) Interactive Cancer Statistics Tool. [Online] Available at
http://www.wcisu.wales.nhs.uk/interactive-cancer-statistics-tool accessed 9.12.16
4
2. Methods
Back to Top
2.1 Conversations were had with members of the public. These conversations were
facilitated with a quiz sheet which tested knowledge of sun cream use whilst also
asking about the individual’s sun cream habits. A conversation with a trained staff
member or volunteer then used the information to discuss habits and ways of
changing behaviour.
2.2 There were five types of locations where these conversations were undertaken this
year. Trained staff members attended local and national events throughout the
summer, often with our sun cream van, which is equipped to distribute sun cream
around Wales. Organisation led events also allowed members of the public to talk
about sun safety. Our charity shops were also used as a base to have conversations
with customers. Finally, workplaces took part in the campaign often tying in with
themed health and safety activities being undertaken by the company.
2.3 In addition to the quizzes, in all locations free sachets of sun cream were also
distributed as a means of engaging participants. A competition to win an electronic
tablet was also used to attract participants.
2.4 A sample of participants who agreed to be called back took part in a follow up semi-
structured telephone interview in order to ascertain whether behaviours were
changed as a result of the conversation.
2.5 In total there were 2,324 conversations.
5
3. Headline Data
Back to Top
We spoke to 2,324 people about sun safety this summer.
Of those, 275 (11.8%) left contact details and agreed to be contacted.
Of the 275, we got in touch with 116 (42%)
Of the 116, 76 reported making a behaviour change, therefore 67% of people we got in touch with are now safer in the sun because of the intervention
6
4. Findings: Demographics
Back to Top
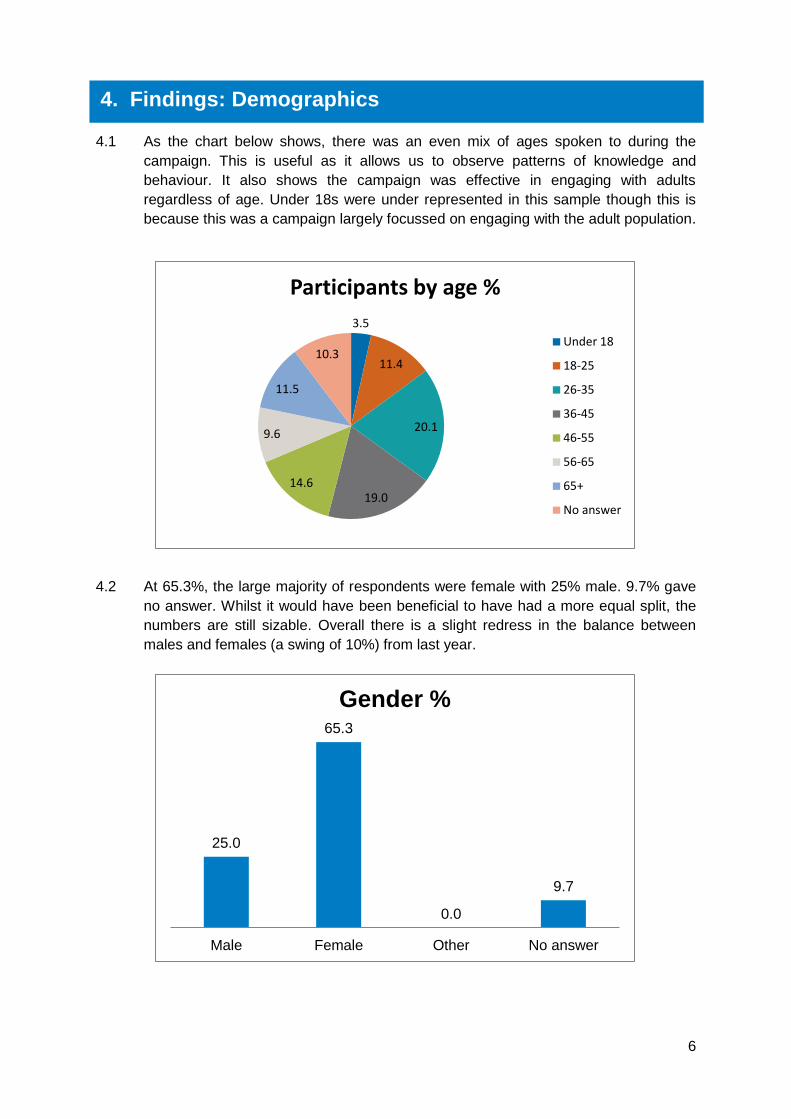
4.1 As the chart below shows, there was an even mix of ages spoken to during the
campaign. This is useful as it allows us to observe patterns of knowledge and
behaviour. It also shows the campaign was effective in engaging with adults
regardless of age. Under 18s were under represented in this sample though this is
because this was a campaign largely focussed on engaging with the adult population.
4.2 At 65.3%, the large majority of respondents were female with 25% male. 9.7% gave
no answer. Whilst it would have been beneficial to have had a more equal split, the
numbers are still sizable. Overall there is a slight redress in the balance between
males and females (a swing of 10%) from last year.
25.0
65.3
0.0
9.7
Male Female Other No answer
Gender %
3.5
11.4
20.1
19.0 14.6
9.6
11.5
10.3
Participants by age %
Under 18
18-25
26-35
36-45
46-55
56-65
65+
No answer
7
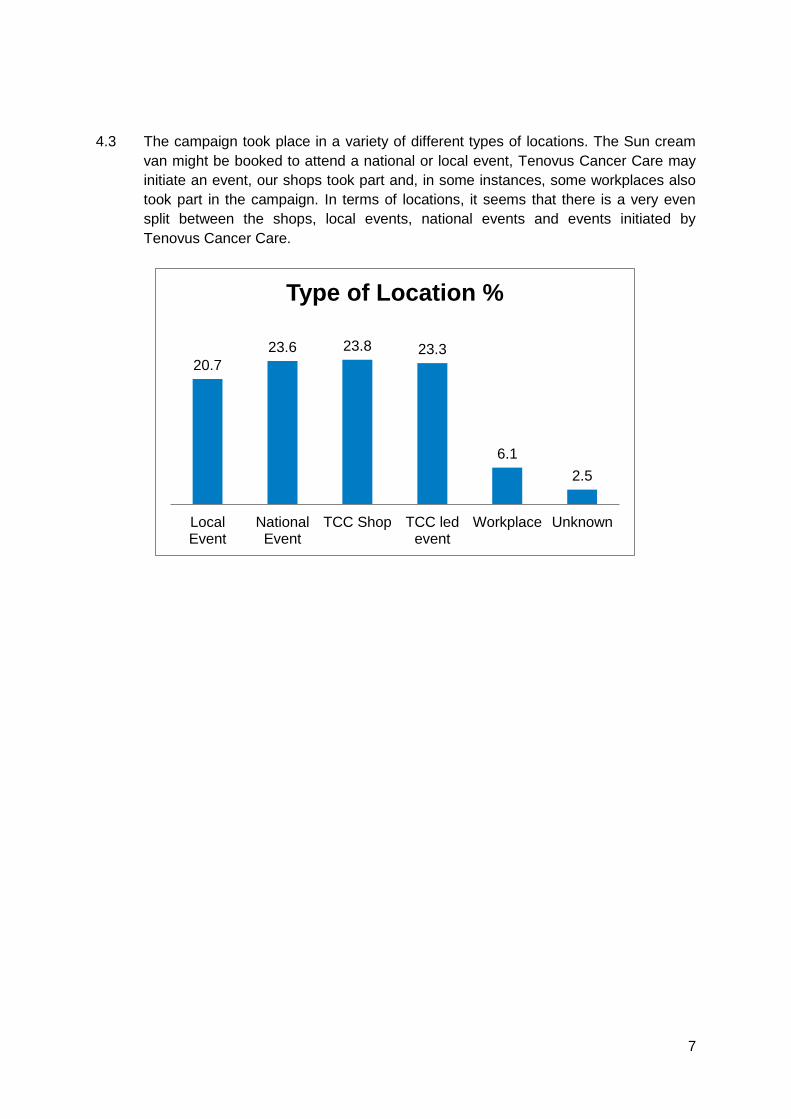
4.3 The campaign took place in a variety of different types of locations. The Sun cream
van might be booked to attend a national or local event, Tenovus Cancer Care may
initiate an event, our shops took part and, in some instances, some workplaces also
took part in the campaign. In terms of locations, it seems that there is a very even
split between the shops, local events, national events and events initiated by
Tenovus Cancer Care.
20.7
23.6 23.8 23.3
6.1
2.5
LocalEvent
NationalEvent
TCC Shop TCC ledevent
Workplace Unknown
Type of Location %
8
5. Findings: Knowledge
Back
to Top
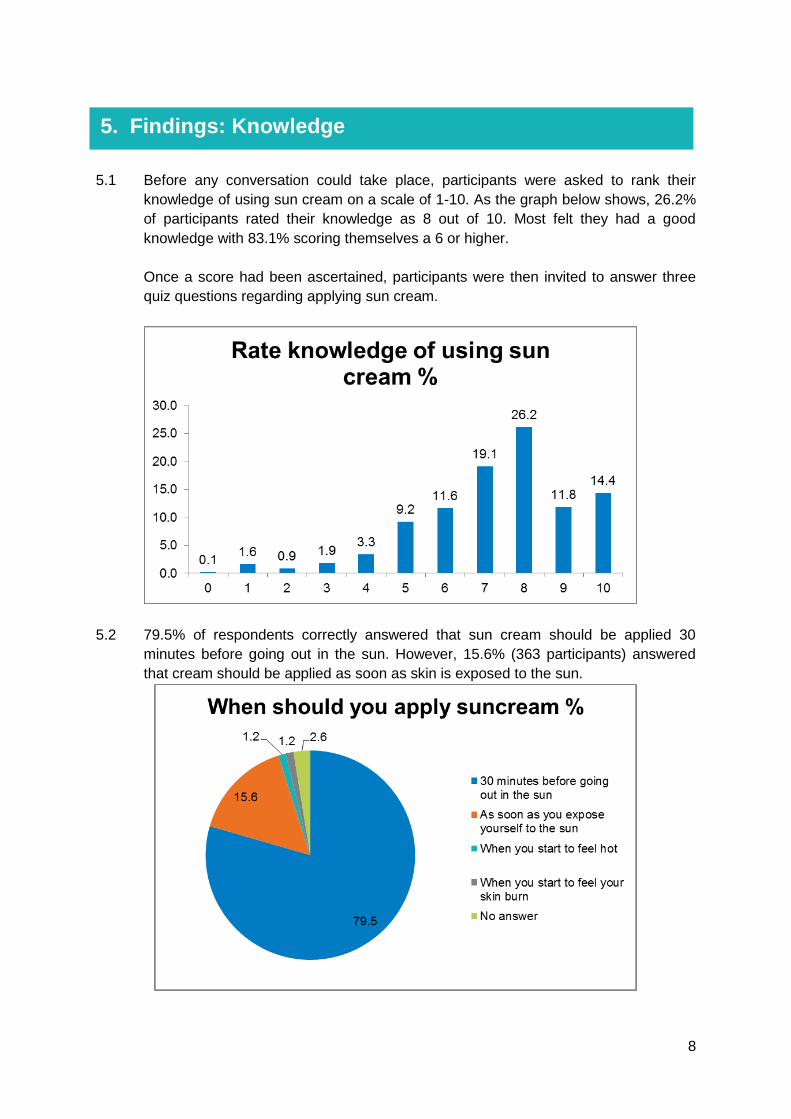
5.1 Before any conversation could take place, participants were asked to rank their
knowledge of using sun cream on a scale of 1-10. As the graph below shows, 26.2%
of participants rated their knowledge as 8 out of 10. Most felt they had a good
knowledge with 83.1% scoring themselves a 6 or higher.
Once a score had been ascertained, participants were then invited to answer three
quiz questions regarding applying sun cream.
5.2 79.5% of respondents correctly answered that sun cream should be applied 30
minutes before going out in the sun. However, 15.6% (363 participants) answered
that cream should be applied as soon as skin is exposed to the sun.
9
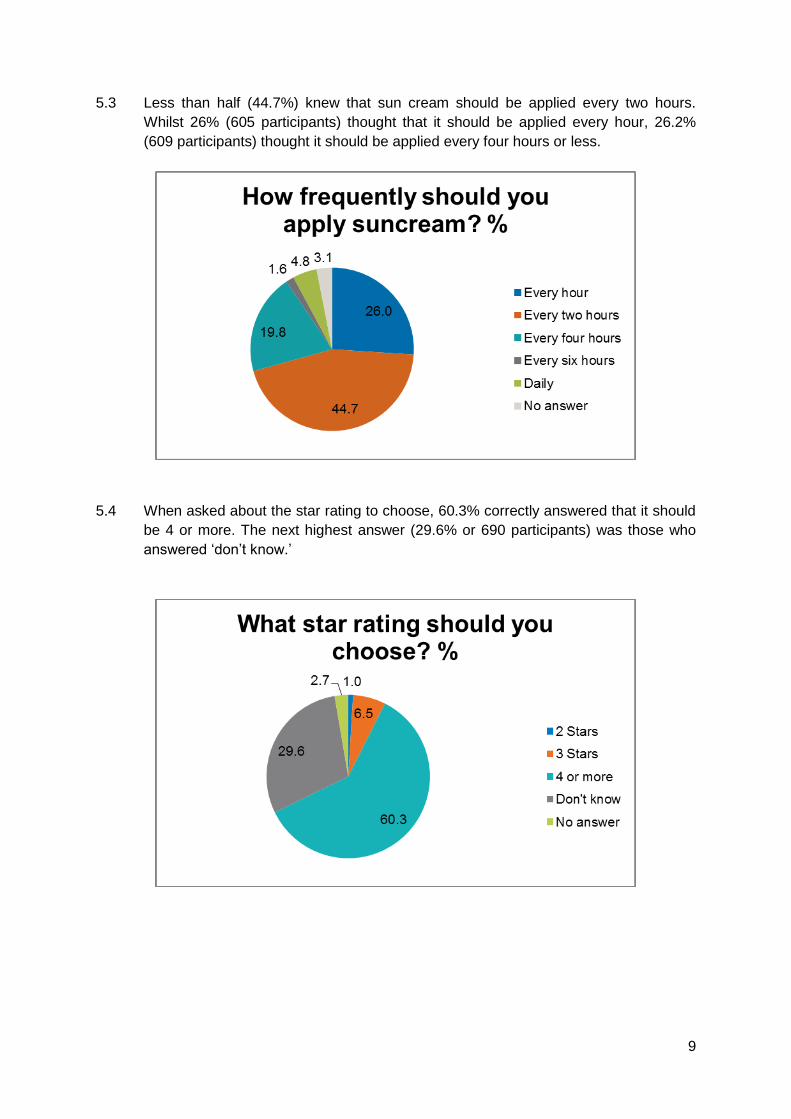
5.3 Less than half (44.7%) knew that sun cream should be applied every two hours.
Whilst 26% (605 participants) thought that it should be applied every hour, 26.2%
(609 participants) thought it should be applied every four hours or less.
5.4 When asked about the star rating to choose, 60.3% correctly answered that it should
be 4 or more. The next highest answer (29.6% or 690 participants) was those who
answered ‘don’t know.’
10
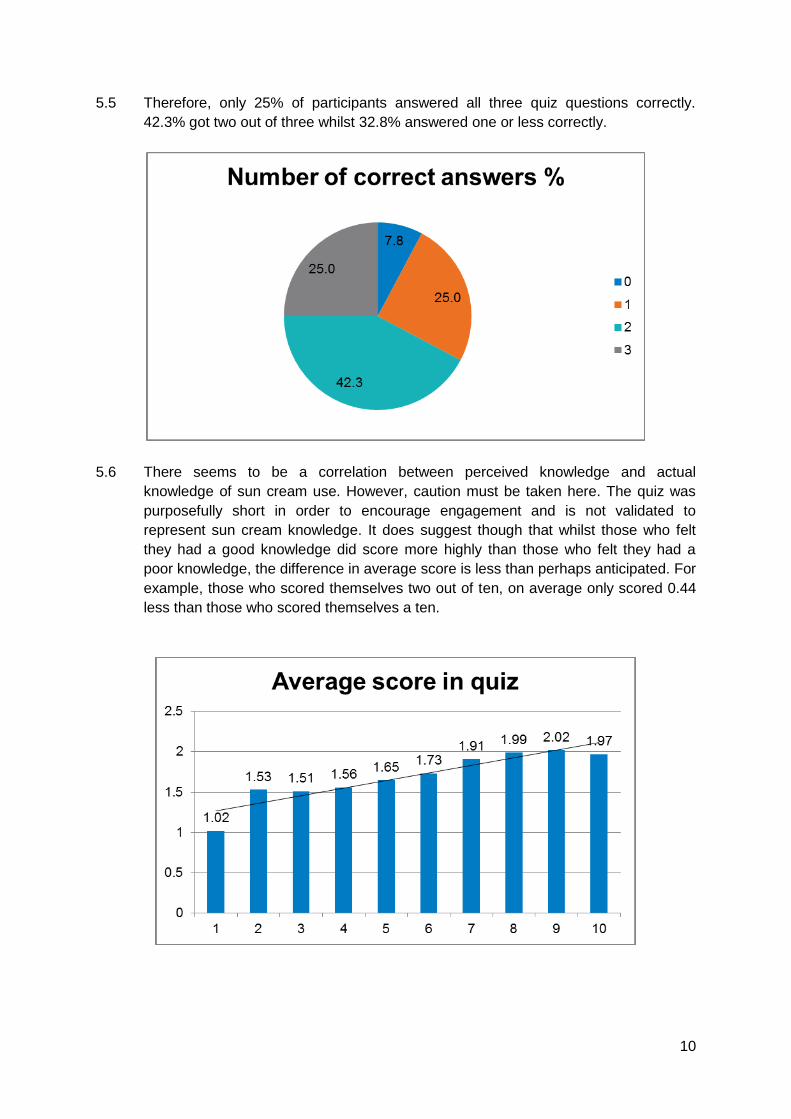
5.5 Therefore, only 25% of participants answered all three quiz questions correctly.
42.3% got two out of three whilst 32.8% answered one or less correctly.
5.6 There seems to be a correlation between perceived knowledge and actual
knowledge of sun cream use. However, caution must be taken here. The quiz was
purposefully short in order to encourage engagement and is not validated to
represent sun cream knowledge. It does suggest though that whilst those who felt
they had a good knowledge did score more highly than those who felt they had a
poor knowledge, the difference in average score is less than perhaps anticipated. For
example, those who scored themselves two out of ten, on average only scored 0.44
less than those who scored themselves a ten.
11
6. Findings: Current Behaviour
Back to Top
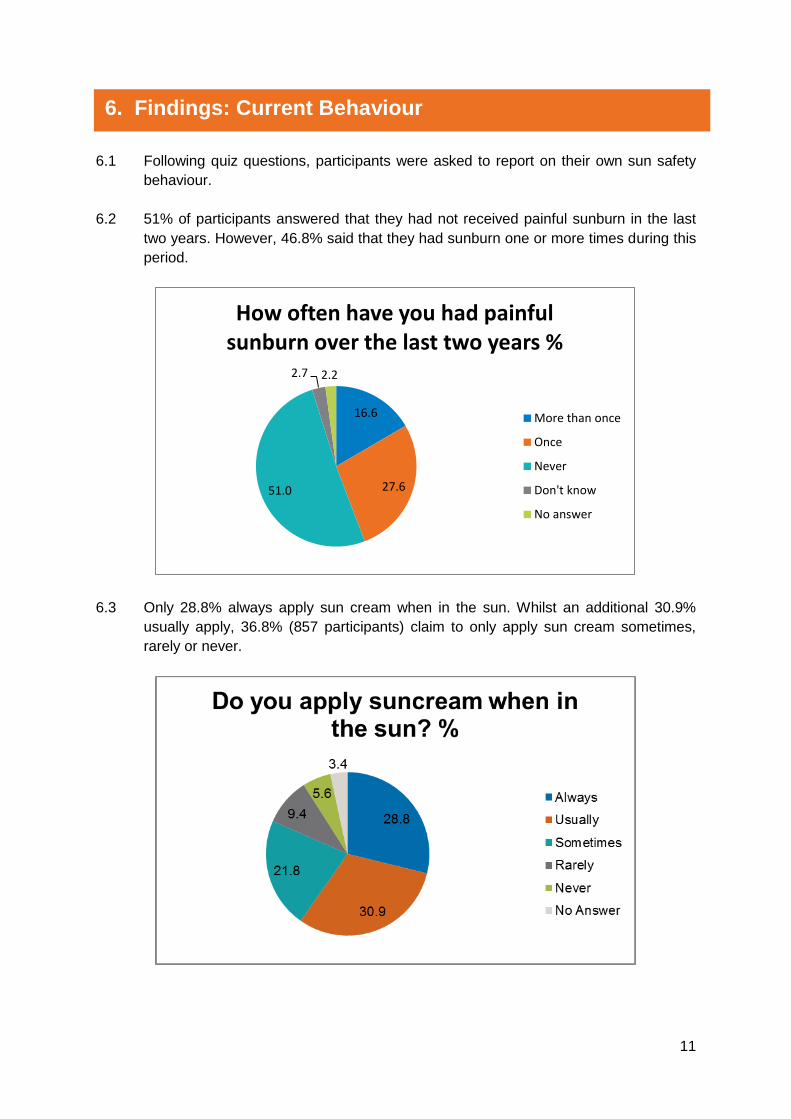
6.1 Following quiz questions, participants were asked to report on their own sun safety
behaviour.
6.2 51% of participants answered that they had not received painful sunburn in the last
two years. However, 46.8% said that they had sunburn one or more times during this
period.
6.3 Only 28.8% always apply sun cream when in the sun. Whilst an additional 30.9%
usually apply, 36.8% (857 participants) claim to only apply sun cream sometimes,
rarely or never.
16.6
27.6 51.0
2.7 2.2
How often have you had painful sunburn over the last two years %
More than once
Once
Never
Don't know
No answer
12
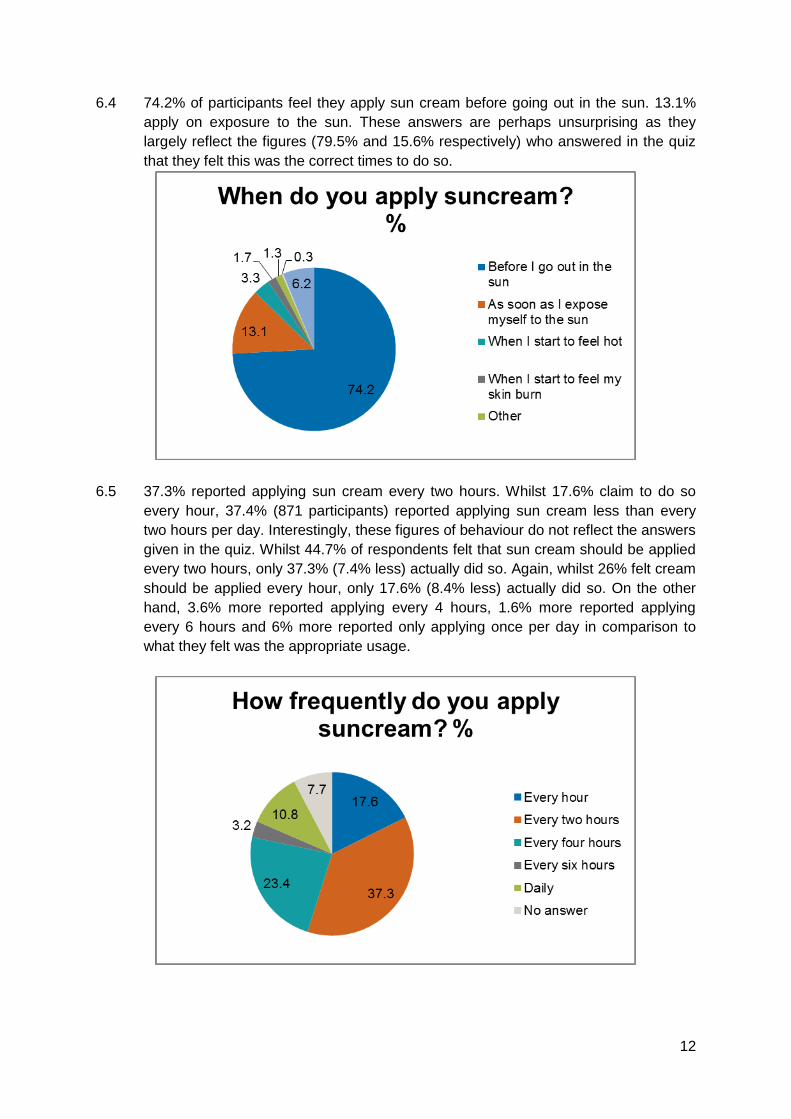
6.4 74.2% of participants feel they apply sun cream before going out in the sun. 13.1%
apply on exposure to the sun. These answers are perhaps unsurprising as they
largely reflect the figures (79.5% and 15.6% respectively) who answered in the quiz
that they felt this was the correct times to do so.
6.5 37.3% reported applying sun cream every two hours. Whilst 17.6% claim to do so
every hour, 37.4% (871 participants) reported applying sun cream less than every
two hours per day. Interestingly, these figures of behaviour do not reflect the answers
given in the quiz. Whilst 44.7% of respondents felt that sun cream should be applied
every two hours, only 37.3% (7.4% less) actually did so. Again, whilst 26% felt cream
should be applied every hour, only 17.6% (8.4% less) actually did so. On the other
hand, 3.6% more reported applying every 4 hours, 1.6% more reported applying
every 6 hours and 6% more reported only applying once per day in comparison to
what they felt was the appropriate usage.
13
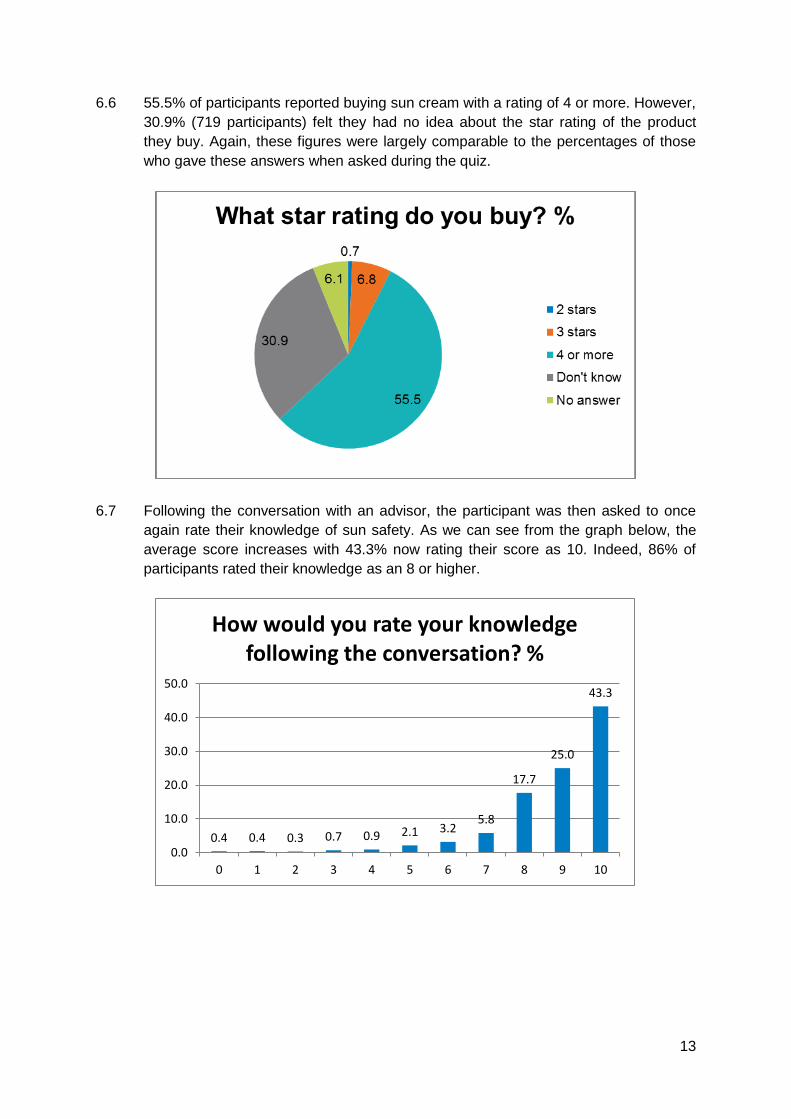
6.6 55.5% of participants reported buying sun cream with a rating of 4 or more. However,
30.9% (719 participants) felt they had no idea about the star rating of the product
they buy. Again, these figures were largely comparable to the percentages of those
who gave these answers when asked during the quiz.
6.7 Following the conversation with an advisor, the participant was then asked to once
again rate their knowledge of sun safety. As we can see from the graph below, the
average score increases with 43.3% now rating their score as 10. Indeed, 86% of
participants rated their knowledge as an 8 or higher.
0.4 0.4 0.3 0.7 0.9 2.1 3.2 5.8
17.7
25.0
43.3
0.0
10.0
20.0
30.0
40.0
50.0
0 1 2 3 4 5 6 7 8 9 10
How would you rate your knowledge following the conversation? %
14
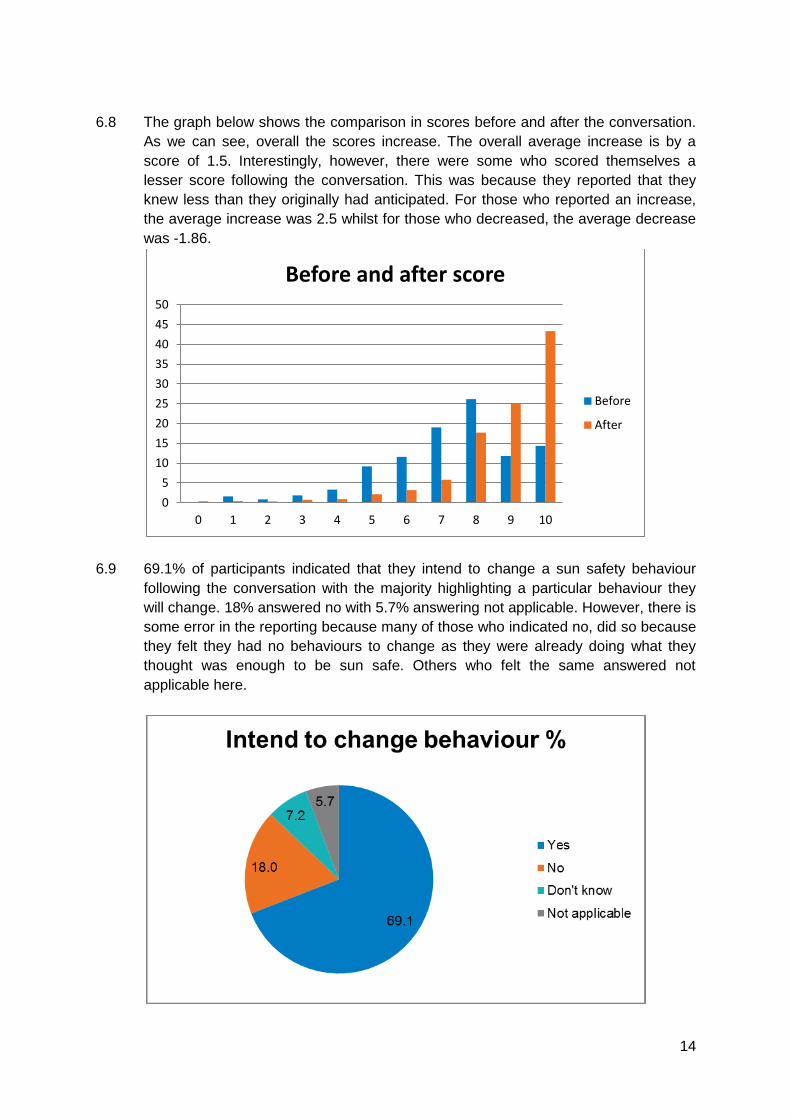
6.8 The graph below shows the comparison in scores before and after the conversation.
As we can see, overall the scores increase. The overall average increase is by a
score of 1.5. Interestingly, however, there were some who scored themselves a
lesser score following the conversation. This was because they reported that they
knew less than they originally had anticipated. For those who reported an increase,
the average increase was 2.5 whilst for those who decreased, the average decrease
was -1.86.
6.9 69.1% of participants indicated that they intend to change a sun safety behaviour
following the conversation with the majority highlighting a particular behaviour they
will change. 18% answered no with 5.7% answering not applicable. However, there is
some error in the reporting because many of those who indicated no, did so because
they felt they had no behaviours to change as they were already doing what they
thought was enough to be sun safe. Others who felt the same answered not
applicable here.
0
5
10
15
20
25
30
35
40
45
50
0 1 2 3 4 5 6 7 8 9 10
Before and after score
Before
After
15
7. Findings: Self-reported behaviour changes
Back to Top
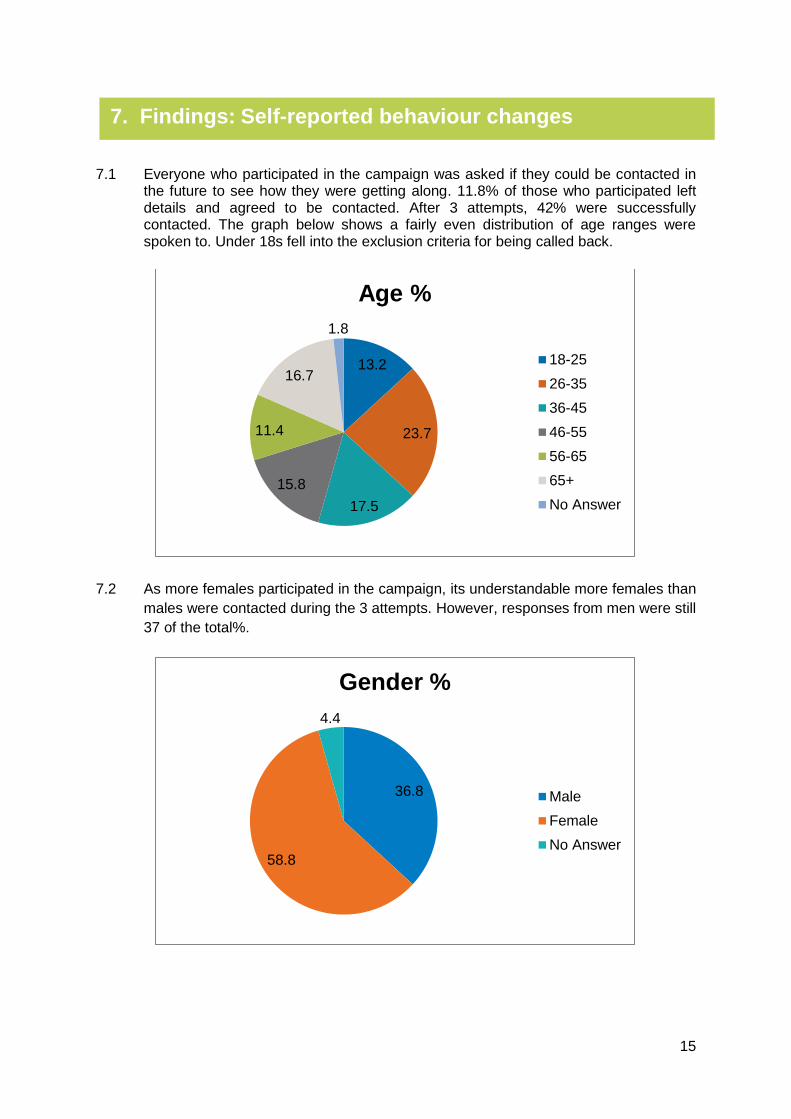
7.1 Everyone who participated in the campaign was asked if they could be contacted in the future to see how they were getting along. 11.8% of those who participated left details and agreed to be contacted. After 3 attempts, 42% were successfully contacted. The graph below shows a fairly even distribution of age ranges were spoken to. Under 18s fell into the exclusion criteria for being called back.
7.2 As more females participated in the campaign, its understandable more females than
males were contacted during the 3 attempts. However, responses from men were still
37 of the total%.
13.2
23.7
17.5
15.8
11.4
16.7
1.8
Age %
18-25
26-35
36-45
46-55
56-65
65+
No Answer
36.8
58.8
4.4
Gender %
Male
Female
No Answer
16
7.3 The location where followed up participants took part can be seen below. The smaller
response from those in the workplace could be due to the majority of call backs being
made during standard 9-5 office hours when these participants would have been
likely to have been at work and unable to answer the phone.
7.4 Participants who were followed up were asked if they’d made a change in their sun
safety behaviour following a conversation with a sun safety advisor. 67% felt their
behaviour was now safer in the sun.
21.9
37.7
10.5
21.1
4.4 4.4
Local Event NationalEvent
Shop TCC ledevent
Workplace Unknown
Location type %
66.7
33.3
Change in sun safety behaviour %
Yes
No
17
7.5 Participants were asked what they had done differently to support their response.
Answers have been categorised into the most popular behaviours described. The
campaign concentrated on the correct use of sun cream explaining related behaviour
changes. ‘Other’ answers included reducing or stopping the use of tanning beds and
getting moles checked by a GP. The three highest behaviour changes (re-applying
sun cream (26.7%), putting sun cream on before going out in the sun (16.7%) and
wearing sun cream (17.8%) ) relate to the ‘knowledge’ questions asked on the quiz
suggesting participants learned from the experience and applied behaviour changes
accordingly.
16.7
3.3 2.2
4.4
26.7
2.2
8.9
5.6
8.9
17.8
3.3
Self-reported behaviour changes %
18
7.6 If participants said they had not made a behaviour change following the sun safety
intervention, they were asked to elaborate why they felt no change was made.
Answers have been categorised into the most popular reasons given. Over half
(64.1%) felt they were already taking necessary precautions in the sun. 15.4%
explained they avoided being in the sun and felt no need to carry out sun safe
behaviour. ‘Other’ answers included two who felt there had been no sunny days
following the intervention for a change in behaviour and another who could not recall
the conversation.
7.7 Where applicable, participants were asked if anything would change their mind to
adopt sun safety behaviours. There were very few responses which included a ‘drop
in sun cream prices’ and ‘sensitive sun cream’. One person stated ‘nothing’ would
change their mind to become safer in the sun.
64.1
15.4
2.6 2.6 2.6 7.7 5.1
Alreadyfeels sun
safe
Avoids sun Reaction tocream
Sun creamtoo
expensive
Too busy Other No answer
Reasons for no change in behaviour %
19
7.8 Participants were asked if they read any information handed to them following the
conversation. Information being dispensed included a skin cancer leaflet, a tanning
bed leaflet, a sun safe postcard and a sachet of sun cream. Over half (61%) said
they had read through the information. 4% noted no information was given which
could be due to resources running out during a particularly busy event.
7.9 Of those who read the information given, participants were prompted to feedback on
the materials. Answers have been categorised below. Nobody gave any negative
feedback. 75% found the information ‘good’, ‘useful’ or ‘informative’ often overlapping
these terms. The 14% who were categorised as ‘straightforward’ made comments
such as finding the resources ‘clear’ and ‘easy to read’. ‘Other’ answers included
those who could not recall specifically what was in the leaflet to feedback
successfully.
7.10 Some other comments were made during the follow-up conversations. This included
some people reporting the sun cream sachet was useful and others passing on the
information to colleagues, family and even schools. This, along with the previous
results, suggests the campaign is impactful on members of the public.
60.5
5.3
9.6
4.4
20.2
Read information given %
Yes
Unsure
No
No Information given
No Answer
32.4
29.7
13.5
13.5
10.8
Feedback on information given %
Good
Informative
Useful
Straightforward
Other

20
21
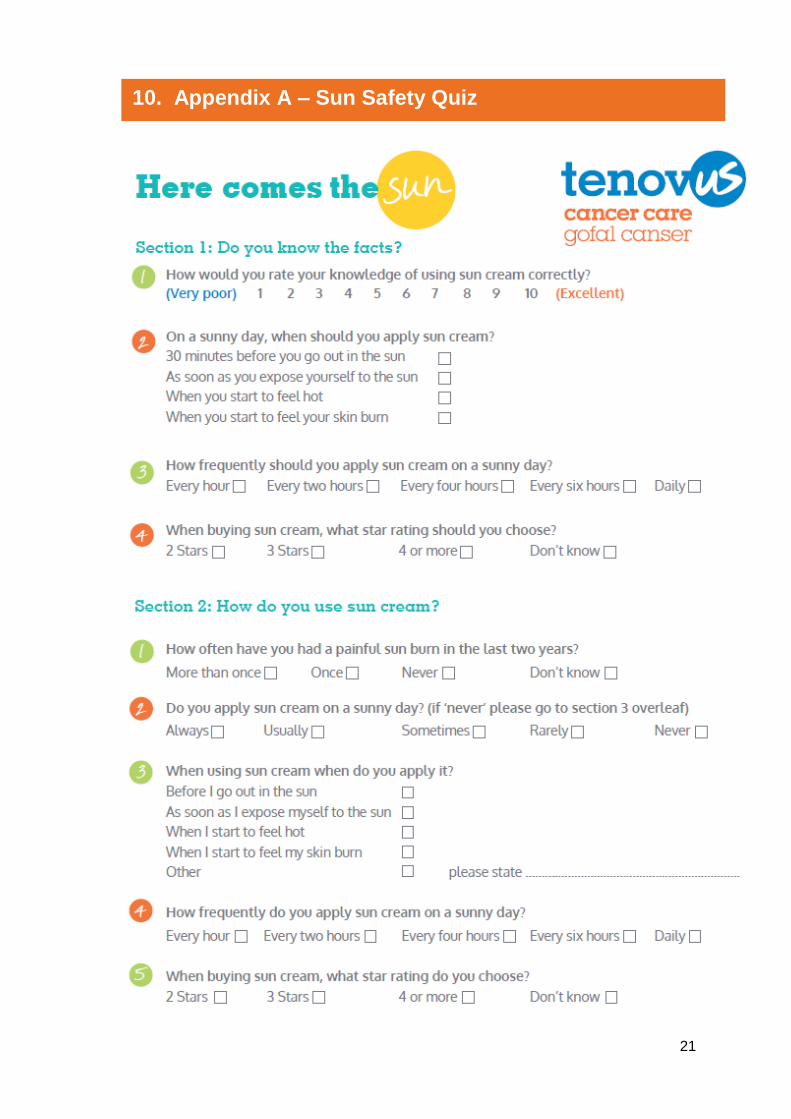
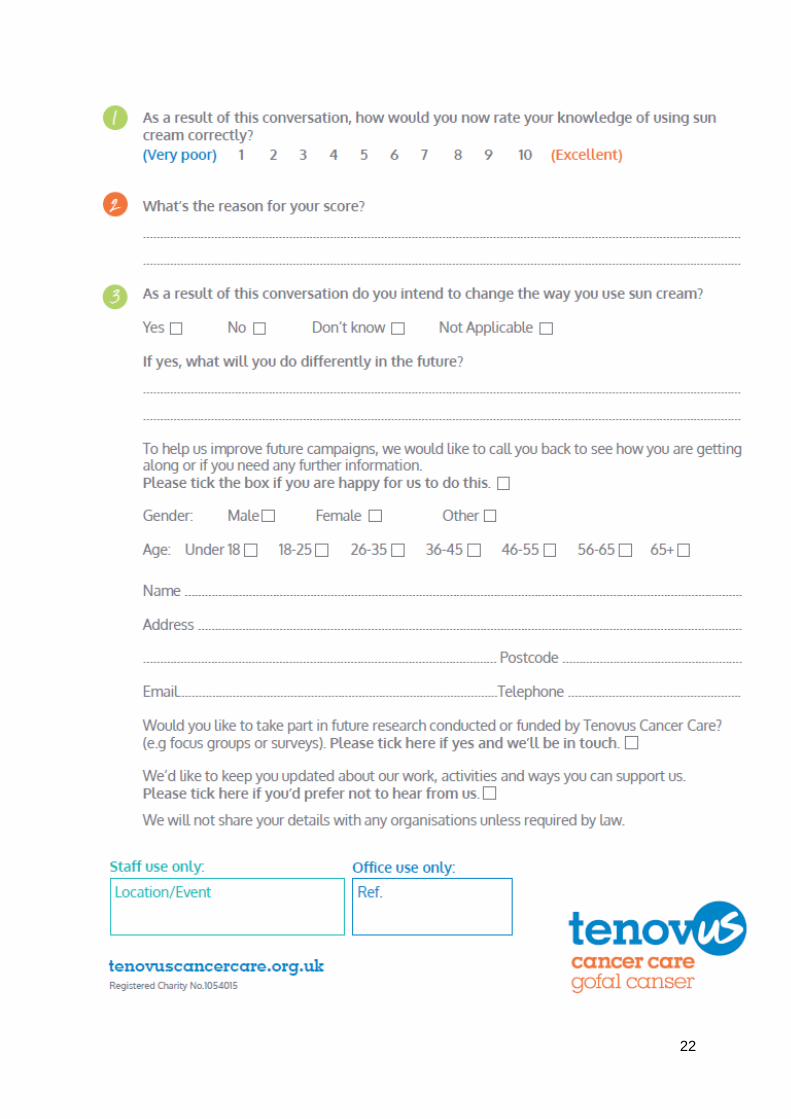
10. Appendix A – Sun Safety Quiz
Back to Top
22