Embed Size (px)
Citation preview

http://www.iaeme.com/JOM/index.asp 153 [email protected]
Journal of Management (JOM) Volume 5, Issue 4, July – August 2018, pp. 153–165, Article ID: JOM_05_04_017
Available online at
http://www.iaeme.com/JOM/issues.asp?JType=JOM&VType=5&IType=4
Journal Impact Factor (2016): 2.4352 (Calculated by GISI) www.jifactor.com
ISSN Print: 2347-3940 and ISSN Online: 2347-3959
© IAEME Publication
HERDING BEHAVIOUR AND SIZE OF THE
FIRMS: EVIDENCE FROM THE INDIAN STOCK
MARKET
Batchu Satish
Research Scholar, Department of Commerce,
Central University of Karnataka, Kalaburagi, India
Dr. Padmasree K
Professor, Department of Commerce,
Central University of Karnataka, Kalaburagi, India
ABSTRACT
This paper examines the relationship between herding behaviour and firm size in
Indian stock market using a sample of listed companies on National Stock Exchange
of India during the 2003 – 2017. The study applied the methodology proposed by the
Chang, Cheng and Khorana (2000), to examine the herding behaviour at asymmetric
nature, i.e., rising and declining movements for daily and weekly data for different
firm size i.e., small cap, mid cap and large-cap stocks. To capture the global financial
crisis effect on herding behaviour the study time frequency divided into three phases,
i.e., pre financial crisis during the financial crisis and post financial crisis and then
examined the herding behaviour in Indian stock market. Also, the study applied the
ADF statistics to check the unit root for the observations.
Key words: Herding behaviour, Cross Sectional Absolute Deviation, rising market and
declining market.
Cite this Article: Batchu Satish and Dr. Padmasree K, Herding Behaviour and Size of
the Firms: Evidence from the Indian Stock Market, Journal of Management, 5(4),
2018, pp. 153–165.
http://www.iaeme.com/JOM/issues.asp?JType=JOM&VType=5&IType=4
1. INTRODUCTION
Incorporation of human psychology into finance has initiated a big debate in finance literature
how an investors make investment decision. Many of behavioural economists expressed their
evidence that investors in the financial market influenced by the many behavioural factors,
among those factors herding behaviour is one of the important behavioural bias and many
researches empirically proved that a significant impact of herding behaviour on the financial
markets. In finance, herding behaviour has been defined as "a group of investors trading in the
same direction over a period of time"(Nofsinger & Sias, 1999)1. As in psychology, herding is
Herding Behaviour and Size of the Firms: Evidence from the Indian Stock Market
http://www.iaeme.com/JOM/index.asp 154 [email protected]
defined when persons change their concealed opinion to go with more strongly with the
openly uttered beliefs of others. Herding behaviour can be explained in two types, rational as
well as irrational. In rational herding, herding behaviour can defined as a tendency of
investors irrationally ignore their own analysis, information and confirm to the market
consensus, even if they do not agree with that (Christie, & Huang, 1995)2, on other side
irrational herding mainly happens to defend reputational concern of an investor. As investors
normally ignore their own available information and starts imitate the decision of other
investors by assuming that decisions made by other investor are more useful and they had
access to better source of information.
1.1. Importance of Size Factor in Herding behaviour
When examining the how investors employ funds to invest in stocks, it is necessary to know
the both investors anticipation of return and also risk craving. Once investor clears on these, it
will be a much feasible way for investors to allocate funds between the varieties of the
category of stocks. In this research, the study analysed the herding behaviour of stock returns
among the small mid and large capitalisation stocks. First, the study separates the sample into
different size according to their market capitalisation.
Though there are number of studies analysed the herding behaviour in Indian stock
market, the research of herding behaviour concerning to size of the stocks not conducted so
far. Further examining the relationship between sizes of the stocks in Indian stock market
make us a superior understanding of the dynamics of the financial market and how the
investors make decision with respect to the different capitalisation stocks.
This study aim is to detect the herding behaviour in Indian stock market concerning to
size of stocks listed on Indian stock exchange (NSE)
The reminder of this article is organised in the following manner. Section II presents the
review of literature for analysing the previous studies. Section III describes the methodology
and data descriptions. Section IV reports the analysis and discussion and Section V deals with
the finding & conclusion.
2. REVIEW OF LITERATURE
Many Researches in behavioural finance have focused on the relationship of investors’
financial decision-making behaviour with the variable viz., volatility, trading volume and
stock prices; also they attempt to test the relationship with all of these variables. Following
are some of the selected reviews pertaining to the herding behaviour.
For empirical analysis of herding behaviour (Christie, & Huang, 1995)2,in their study
proposed a new method called Cross-Sectional Standard Deviation(cssd) as a measure of
dispersion to investigate herding behaviour in an aggregate market by observing at how
returns on individual stock returns move around the market return during the large price
swings. The study was taken under the rationale that, under the market stress, individual
investor suppresses their beliefs and takes investment decision according to the market
consensus. The study applied return dispersion method on daily and monthly data for New
York Stock exchange and Amex firms during the year from 1962 to 1988. The study revealed
that dispersion increases significantly during the periods of large price movements and this
results were consistent with the rational asset pricing models, hence, this method is failed to
detect the herding behaviour. Later (Chang, Cheng, & Khorana, 2000)3developed a new
method based on the Cross-Sectional Return Dispersion(CSAD) of return which is a extended
version of (Christie, & Huang, 1995)2. The study examined the herding behaviour in some

Batchu Satish and Dr. Padmasree K
http://www.iaeme.com/JOM/index.asp 155 [email protected]
global stock markets and found that the results of the herding behaviour in the global markets
are mixed. In developed markets, no evidence of herding behaviour was found. However,
found evidence of herding behaviour in the developing stock markets like South Korea and
Taiwan. The study also noted that the proposed methodology of (Christie, & Huang, 1995)2
was more stringent, as it requires extreme return data to examine the herding behaviour. (Tan,
Chiang, Mason, & Nelling, 2008)4examined the herding behaviour of listed A and B share
stocks in Chinese stock market. In China A share market dominated by domestic investors
and B share market is by the foreign Institutional Investors, and the research found that the
study has detected the herding behaviour for both markets, also study analysed the this
behaviour in rising and declining pattern of market, High volume and low volume state as
well high volatility and low volatility of stocks and found evidence that herding behaviour
was presented both rising and declining and it is more intensity when market return is rising,
trading volume high and high volatility. With respect to Indian context (Lakshman, Basu, &
Vaidyanathan, 2013)5 examined the role of herding behaviour in Indian stock by taking into
consideration of FII’s and Mutual fund investors trading pattern. The results of the study
showed that mutual fund investors trading pattern leads to herding behaviour and no evidence
of herding found among the FII’s in Indian stock market. Also, the study noted that herding
behaviour was found increasing during the 2003-2005 and it started to decrease in later years,
this is because of financial crisis of 2008 affect on MFs and FIIs. In other study (Tayde &
Rao, 2011)6examined the herding behaviour among the foreign Institutional Investors in
Indian markets. The study found significant evidence of herding behaviour among FIIs on
different phases of market and these results were opposite to Lakshman et al. (2011) study.
With the use of methodologies proposed by the (Christie, & Huang, 1995)and (Chang et al.,
2000) in 2011, (Lao & Singh)7examined the existence of herding behaviour of stocks listed on
Indian and Chinese stock markets over the period. The results of the study provided the
evidence of herding behaviour is presented in listed stocks for both market and this behaviour
is depends on the different market conditions which could impact the market return over the
period. In Chinese stocks this behaviour was found when trading volume is high and return of
the market was shown declining trend and Indian market, it was exhibited when the market
return shows increasing state. However, Herding behaviour seems to be irrelevant at the level
of trading volume in India, unlike Chinese markets. Finally the study concludes that in both
the markets herding behaviour is stronger due to the presence of global financial crisis.
(Garg & Gulati, 2013)8investigated the presence of herding behaviour in Indian Stock
Market with consideration of daily, weekly and monthly data frequency of the return of the
stocks listed in CNX 500 during the period 2000-2013. (Christie, & Huang, 1995), and
(Chang et al., 2000) measures were employed in the study. The result provides that Indian
stock market not follow the herding behaviour. The existence of herd behaviour was also
investigated during increasing market state, decreasing market state, high volume state, low
volume state, pre-crisis, during the crisis and post-crisis. The results of the study states that
herding behaviour not exhibited in Indian stock market during the mentioned period. It seems
that Investors behaviour is entirely rational in Indian Stock Market as the same way by
considering daily and monthly returns of stocks listed on Indian stock market (Garg & Jindal,
2014)9 examined the herding behaviour during the 2000-2012.the study does not find any
evidence of herding behaviour among the stocks listed on the Indian market for mentioned
time.
(Chen, 2013)10
evaluated the herding behaviour in global stock markets. He found that
strongest evidence of herding behaviour in almost all stock markets. In addition to that, the
study also detected that herding behaviour is more apparent in the developed market than
other markets. The study also found that herding behaviour was presented in both Up and

Herding Behaviour and Size of the Firms: Evidence from the Indian Stock Market
http://www.iaeme.com/JOM/index.asp 156 [email protected]
down markets for some countries and Investors tend to be more herd in response to the bad
news regarding the stock market rather than the good news as the same direction (Houda &
Mohamed, 2013)11
have examined the investors herding behaviour in 28 stock markets during
up and down market by using (Christie, & Huang, 1995)and (Chang et al., 2000)
methodology. The study found that no indication of herding behaviour existed among stocks
traded in the markets. However in some markets, the herding behaviour was detected during
the market return shown declining state and investors of these markets posed to the
asymmetric reaction with respect to the superior and awful news in the market.
(Ramadan, 2015)12
examined herding behaviour in Amman Stock Exchange(ASE) by use
of Cross-Sectional Absolute Deviation of returns approach; found that herding behaviour
identified among investors in ASE also the study noted that investors of the ASE follow the
market characteristics not with the elements risk and return of Individual stocks..
From the available resources it was found that herding behaviour was less explored in the
developing countries, very few studies have been conducted so far in emerging countries
particularly in India. The studies were not reaching to any conclusive results also. And no
study was found to examine the herding behaviour of Indian stocks listed on the NSE with an
emphasize on size of the stock.
3. METHODOLOGY AND DATA DESCRIPTION
This section explains the methodology developed by the (CCK, 2000) to detect the existence
of herding behaviour of stocks listed in the NSE from 2003 to 2017. According to (Chang et
al., 2000) provided evidence of herding behaviour more likely present for the period of
relatively significant price movements. They have proposed the following model to detect the
herding in stock market.
CSADt = α + β1|Rmt|+ β2R2
mt+et (1)
CSADt indicates the return dispersion
CSADt=
∑ | | (2)
Where N is the number of stocks in the portfolio, Rit is the return of stock i at time t and
Rmt is the equally weighted average of all stock returns in the portfolio at time t. In equation
1; |Rmt| represents the absolute value of market return, β1 is the coefficient of |Rmt|, R2m,t is
the square of |Rmt|,β 2 is the coefficient of R2mt, β2is the coefficient of herding behaviour, if
it comes as significantly negative it will indicate the existence of herding behaviour in the
market.
To capture the asymmetric effects, the following equations have been used to identify the
existence of herding behaviour during upward and downward market situations. Extreme
market movements may lead to herding behaviour as investors may follow the actions of
others when market is either increasing or decreasing state.
CSADtup
= α + β1up
|Rmtup|+ β2up
R2
mtup+et Rmt>0 (3)
CSADtdown
= α + β1down
|Rmtdown |+ β2down
R2
mt down +et Rmt<= 0 (4)
Where, in equation 3 |Rmtup| represents the absolute market return in the rising state.
β1up is the coefficient of |Rmtup|, R2mt is the square of Rmt , β2up is the coefficient of R2mt
also it is the coefficient for herding behaviour if it comes the negative value and significant.
Equation4|Rmtdown| represents the absolute market return in the declining state. β1down is

Batchu Satish and Dr. Padmasree K
http://www.iaeme.com/JOM/index.asp 157 [email protected]
the coefficient of |Rmtdown|, R2mt is the square of Rmt , β2downis the coefficient of R2mt
also it is the coefficient for herding behaviour if it comes the negative value and significant.
The returns of the stocks is UP trend when it Rm value is greater than zero (and it is down
trend when Rm value is equal and less than zero.
Augmented Dickey-Fuller statistics applied to validate the stationarity of the various data
series and found that series is stationarity at level. Tests like Jarque-Bera, Durbin-Watson test,
were also applied to check the normality, the autocorrelation of the error terms.
3.1. Data Description
Data was collected from the secondary sources. CMIE PROWESS data base is used to collect
the data. Daily and weekly observations of stocks listed in the NSE from Jan 1st 2003 to Dec
31, 2017 were collected for the present study. The study has 3680 daily and 780 weekly
observations. The stock return Rit is calculated by using the log formula ln (Pt/Pt-1)*100. The
data series is divided into according to the size of the stocks and then assign the each stock
into different capitalisation which they fall under. Since the study has conducted for a long
period to capture the financial crisis effects on herding behaviour, the study time frequency
divided into three phases, i.e., pre financial crisis during the financial crisis and post financial
crisis and then examined the herding behaviour in Indian stock market
4. ANALYSIS AND DISCUSSION
Table 1 & 2 provides the descriptive statistics on daily and weekly market returns (Rm) and
CSAD for different market capitalisation stocks listed on National Stock Exchange of India.
For daily observations, the average return for the entire sample is 0.0182 with ranges of
0.0087 to 1.1169 while the mean of market returns for weekly observation is 0.0020. The
equity market returns in Indian stock market provides more volatility with a standard
deviation of 0.0159 (1.59 percentage), while the standard deviation of weekly market return is
0.0362 (3.6 percentage) which is highly volatile nature. The average value of market returns
for different capitalisation stocks are similar in nature, i.e., Small Cap is 0.0003, mid-cap is
0.0005, and the large cap is 0.0004. While large-cap stocks do exhibit the high magnitude of
volatility 0.0281 (2.81percentage) than the small cap (1.6 percentage) and mid-cap (1.6
percentage) respectively. Mean value of market returns of weekly observations for different
capitalisation stocks are 0.0020 (Whole data), 0.0017 (small cap), 0.0026 (mid-cap) and
0.0021 (large cap), the standard deviation for whole observation is 3.6 percent and small cap
(4.0 percent) provides the evidence of high volatility than mid (3.6 percent) and large cap
(2.9) respectively.
Also, Table 1&2 provides a preliminary description of CSAD values. The mean values of
CSAD for daily and weekly observations are 0.0182, 0.0403. Average values vary among the
size of the stocks, it means the mean of small-cap stocks is 0.0219, mid-cap stocks is 0.0173,
and large-cap stocks is 0.0157, and these CSAD values are lesser than the weekly data points,
that is mean of small cap is 0.0451, 0.0374 for mid-cap and 0.0334. Concerning the volatility
small, mid and large cap stocks positioned with same values. The statistics of the Jarque-Bera
test is very high for both CSAD and RM, indicating that stock returns differ significantly from
the normal distribution. Jarque-Bera statistics is a test statistic to test whether the return of the
series is normally distributed. The Jarque-Bera statistic measures the variation of the
skewness and kurtosis of the series with those from the normal distribution. The value of
skewness and kurtosis mean that the distributions of these variables have a leptokurtic feature.
It implies that the subsequent test of OLS has to take into account this violation of normality
assumption. To check the stationarity of the various series, Augmented Dickey-Fuller test is

Herding Behaviour and Size of the Firms: Evidence from the Indian Stock Market
http://www.iaeme.com/JOM/index.asp 158 [email protected]
applied. The significant t statistics of CSAD is -18.020 (000), and RM is -54.111(000)
confirm that series is stationary at level with intercept, thereby rejects the null hypothesis, i.e.,
non-stationary series. Moreover, the data is stationary for all size of stocks listed on Indian
stock market. From the ADF values of Table 1&2, the data can be interpreted that, all the
series in the model follows the stationary hypothesis at level with intercept.
Table 1 Descriptive Statistics daily observations
Observations Whole Data Small-Cap Mid-Cap Large-Cap
csad Rm csad Rm csad Rm csad Rm
Mean 0.0182 0.0004 0.0219 0.0003 0.0173 0.0005 0.0157 0.0004
Min 0.0087 -0.2563 0.0105 -0.1151 0.0068 -0.2048 0.0042 -1.0677
Max 1.1169 0.2905 0.9046 0.2595 1.1950 0.3400 1.2857 1.0445
STD 0.0261 0.0159 0.0225 0.01609 0.0280 0.0161 0.0303 0.0281
Skewness 40.5640 0.3278 32.5106 0.0810 40.0430 1.2634 40.0998 -0.7344
Kurtosis 1701.9409 64.1341 1247.350 26.1641 1675.198 70.3990 1678.956 1084.921
Jarque-bera 4.45e+08 572508.3 2.38e+08 82122.45 4.29e+08 696568.0 4.31e+08 1.79e+08
ADF -18.020
***
-54.113
***
-21.1867
***
-48.1034
***
-18.2956
***
-52.9685
***
-17.9502
***
-88.2297
***
*** At one percent significant level
- Where ADF refers to the Augmented Dickey-Fuller to determine whether data is stationary or not
Table 2 Descriptive Statistics Weekly Observations
Observations Whole Data Small-Cap Mid-Cap Large-Cap
csad Rm csad Rm csad Rm csad Rm
Mean 0.0403 0.0020 0.0451 0.0017 0.0374 0.0026 0.0334 0.0021
Min 0.0000 -02139 0.0000 -0.2248 0.0000 -0.2134 0.0000 -0.1795
Max 0.0898 0.2128 0.1876 0.2229 0.1130 0.2424 0.1131 0.1448
STD 0.0097 0.0362 0.0136 0.0403 0.0110 0.0362 0.0117 0.0290
Skewness 1.3030 -0.5278 2.7119 -0.3930 1.5425 -0.5205 1.9086 -0.7906
Kurtosis 6.4766 7.0737 21.1787 6.4813 7.7928 8.2953 9.3710 7.2132
Jarque-bera 616.7824 578.5281 11756.20 416.0902 1061.328 951.4003 1801.959 661.5671
ADF -7.6743
***
-15.7860
***
-9.4613
***
-14.1580
***
-17.6688
***
-13.6999
***
-17.4597
***
-16.1772
***
*** At one percent significant level
- Where ADF refers to the Augmented Dickey-Fuller to determine whether data is stationary or not
Following figures show the relationship between Cross-sectional absolute deviations of
return and equally weighted average market returns for different market capitalisation during
2003 to 2017

Batchu Satish and Dr. Padmasree K
http://www.iaeme.com/JOM/index.asp 159 [email protected]
To examine the herding behaviour based on size, the study divides the sample of stocks
listed on National Stock exchange of India into based market capitalisation during 2003 to
2017. Then we assign each stock in our sample into an appropriate size, i.e., small, mid and
large capitalisation stocks. Table 3. Provides the regression results of the examination of
herding behaviour concerning the small capitalisation stock for daily observations. The study
revealed that herding behaviour has not found in any of case for small-cap stocks during the
period. As a negative coefficient implies the herding behaviour, this research pays the
particular attention to all coefficients (β2) in the regression model. The results of the
-0.1
0
0.1
0.2
0.3
0.4
0.5
0.6
0.7
0.8
0.9
1
-0.1 -0.05 0 0.05 0.1 0.15 0.2 0.25
CSAD
Rm
CSAD versus Rm (with least squares fit)
Y = 0.0220 - 0.136X
0
0.2
0.4
0.6
0.8
1
1.2
-0.2 -0.1 0 0.1 0.2 0.3
CSAD
Rm
CSAD Vs Rm [mid-stock]
-0.2
0
0.2
0.4
0.6
0.8
1
1.2
1.4
-1 -0.5 0 0.5 1
CSAD
RM
CSAD versus RM (with least squares fit)
0
0.02
0.04
0.06
0.08
0.1
0.12
0.14
0.16
0.18
0.2
-0.2 -0.15 -0.1 -0.05 0 0.05 0.1 0.15 0.2
CSAD
Rm
CSAD versus Rm [weekly small cap]
Y = 0.0451 + 0.0367X
0
0.02
0.04
0.06
0.08
0.1
0.12
-0.2 -0.15 -0.1 -0.05 0 0.05 0.1 0.15 0.2 0.25
CSAD
Rm
CSAD versus Rm [weekly Mid cap]
Y = 0.0375 - 0.0290X
0
0.02
0.04
0.06
0.08
0.1
0.12
-0.15 -0.1 -0.05 0 0.05 0.1 0.15
CSAD
Rm
CSAD versus Rm [weekly large cap]

Herding Behaviour and Size of the Firms: Evidence from the Indian Stock Market
http://www.iaeme.com/JOM/index.asp 160 [email protected]
regression, coefficients (β2) of regression estimation for market returns found the positive and
significant. Moreover, the study divided into different phases (pre-crisis, during crisis and
post-crisis) to analyse the impact of financial crisis on herding behaviour, the results repeated
same coefficients (β2) of estimation show positive and significant for all observations it
means, the study has not detected the herding behaviour during different phases.
4.1. Asymmetric Effect of Market Return
To investigate the whether herding behaviour has an asymmetric in the up and down market.
The research set up a non-linear regression model by examining the asymmetric effects Rmt>0
and Rmt<0. The estimates of regression in Table 3, shows that the estimated coefficient (β2)
for both up and down market are positive and statistically significant at the level. In this
study, the small capitalisation stocks not provided at any evidence of herding behaviour when
the market it goes up and goes down.
Overall in Table 2 provided supportive evidence that herding behaviour is not found
among the small capitalisation stocks which listed on the Indian stock market. Investors of
these stocks have a rational choice and support to the CAPM assumptions.
Table 3 Regression Results for Cross-Sectional Absolute Deviation of return and Market Return on
Aggregate Market level and Pre, during and Post Crisis [2003-2017] for NSE listed small
capitalisation stocks.
CSADt = α + β1|Rmt|+ β2R2
mt+et
CSADtup
= α + β1up
|Rmtup|+ β2up
R2
mtup+et Rmt>= 0
CSADtdown
= α + β1down
|Rmtdown |+ β2down
R2
mt down +et Rmt< 0 Variabl
e Small Cap Pre (2003-2017) During(2008-2012) Post(2013-2017)
ALL Rising
Declinin
g ALL Rising
Declinin
g ALL Rising
Declinin
g ALL Rising
Declini
ng
Α 0.0143 0.0125 0.0169 0.0188 0.0226 0.0205 0.0148 0.0145 0.0138 0.0157 0.0166 0.0150
β1 0.6381 0.81929 0.1479 0.0612 -1.0396 -0.3372 0.5711 0.4857 0.6803 0.3470 0.1432 0.4534
β2 2.1427
***
0.9508
***
13.4275
***
4.3323
***
60.4492
***
25.0326
***
1.7832
***
1.8223
***
0.3053
***
5.3303
***
11.0177
***
4.1120
***
Adj.R^2 0.4318 0.1979 0.3480 0.4652 0.1942 0.3322 0.9437 0.9448 0.9127 0.8806 0.7950 0.9220
D.W 1.7002 1.9629 1.9404 1.8718 1.9329 1.9282 2.1224 2.1032 2.0407 2.0694 2.0480 2.0292
R^2 0.4323 0.1987 0.3488 0.4669 0.1964 0.3348 0.9439 0.9451 0.9134 0.8809 0.7962 0.9226
*** At one percent significant level
In Table 4. Provides the regression results of the examination of herding behaviour
concerning the mid capitalisation stocks for daily observations. The results of the regression,
coefficients (β2) of regressors for market returns found the positive and statistically
significant, results of the study reports that the results of the test shows herding behaviour has
not found in any of case for mid-cap stocks during the period. As like small capitalisation
stocks the study divided into different phases (pre-crisis, during crisis and post-crisis) to
analyse the impact of financial crisis on herding behaviour, the results repeated same
coefficients (β2) of regressors positive and statistically significant for all observations it
means, the study has not detect the herding behaviour during different phases.
4.2. Asymmetric Effect of Market Return
To analyse the whether herding behaviour has an asymmetric in the up and down market. The
research set up a non-linear regression model by examining the asymmetric effects Rmt>0 and

Batchu Satish and Dr. Padmasree K
http://www.iaeme.com/JOM/index.asp 161 [email protected]
Rmt<0. The estimates of regression in Table 4, shows that the estimated coefficient (β2) for
both up and down market are positive and statistically significant at the level except the down
market in during crisis phase. During crisis period, Indian market faces the significant impact
of global financial crisis. As a result the investors of the mid-cap stocks in the market mimic
the other when the market down trends to avoid the massive losses from the market. The
coefficient of estimation in the model during the financial crisis shows contrary (βdown=-
0.9926) and statistically significant.
Table 4 Regression Results for Cross-Sectional Absolute Deviation return and Market Return on
Aggregate Market level and Pre, during and Post Crisis [2003-2017] for NSE Mid capitalisation
stocks.
CSADt = α + β1|Rmt|+ β2R2
mt+et
CSADtup
= α + β1up
|Rmtup|+ β2up
R2
mtup+et Rmt>= 0
CSADtdown
= α + β1down
|Rmtdown |+ β2down
R2
mt down +et Rmt< 0 Variabl
e Mid Cap Pre (2003-2017) During(2008-2012) Post(2013-2017)
ALL Rising
Declinin
g ALL Rising
Declinin
g ALL Rising
Declinin
g ALL Rising
Declini
ng
α 0.0121 0.0077 0.0221 0.0257 0.0059 0.0280 0.0147 0.0143 0.0123 0.0133 0.0141 0.0129
β1 0.4386 0.9763 -1.0889 -1.4627 -0.5755 -1.7236 0.1660 0.1742 0.3891 0.1650 0.0133 0.2269
β2 2.6868
***
0.34199
***
25.4695
***
35.9429
***
40.9260
***
32.8808
***
0.7167
***
0.7007
***
-0.9926
***
1.7920
***
6.7998
***
1.1539
***
Adj.R^2 0.3928 0.1978 0.7271 0.8462 0.9455 0.8798 0.6775 0.7919 0.4754 0.3789 0.3782 0.3563
D.W 1.7664 1.9886 1.6731 1.5826 2.4914 1.5699 2.0852 2.0625 1.8198 2.1279 2.1203 1.6379
R^2 0.3933 0.1986 0.7275 0.8465 0.9456 0.8803 0.6786 0.7932 0.4733 0.3804 0.3807 0.3588
*** At one percent significant level
In Table 5. Provides the regression results of the examination of herding behaviour
concerning the large capitalisation stocks for daily observations. The results of the regression,
coefficients (β2) of regressors for market returns found the positive and statistically
significant, results of the study reports that the results of the test shows herding behaviour has
not found in any of case for large-cap stocks during the period. As like small and mid
capitalisation stocks the study divided into different phases (pre-crisis, during crisis and post-
crisis) to analyse the effects of financial crisis on herding behaviour, except during financial
crisis, the results repeated same coefficients (β2) of regressors positive and statistically
significant for all observations as small and mid capitalisation stocks. During the financial
crisis the coefficient (β2= -0.1012) of regression estimation provided the negative and
statistically significant, it means during the financial crisis the study has detected the herding
behaviour.
4.3. Asymmetric Effect of Market Return
To analyse the whether herding behaviour has an asymmetric in the up and down market. The
research set up a non-linear regression model by examining the asymmetric effects Rmt>0 and
Rmt<0. The estimates of regression in Table 5, shows that the estimated coefficient (β2) for
both up and down market are positive and statistically significant at the level except the down
market in during crisis phase and post-crisis phase. During crisis period, Indian market faces
the significant impact of global financial crisis. As a result the investors of the large cap
stocks in the market mimic the other when the market down trends to avoid the massive losses
from the market. The coefficient of estimation in the model during the financial crisis shows
Herding Behaviour and Size of the Firms: Evidence from the Indian Stock Market
http://www.iaeme.com/JOM/index.asp 162 [email protected]
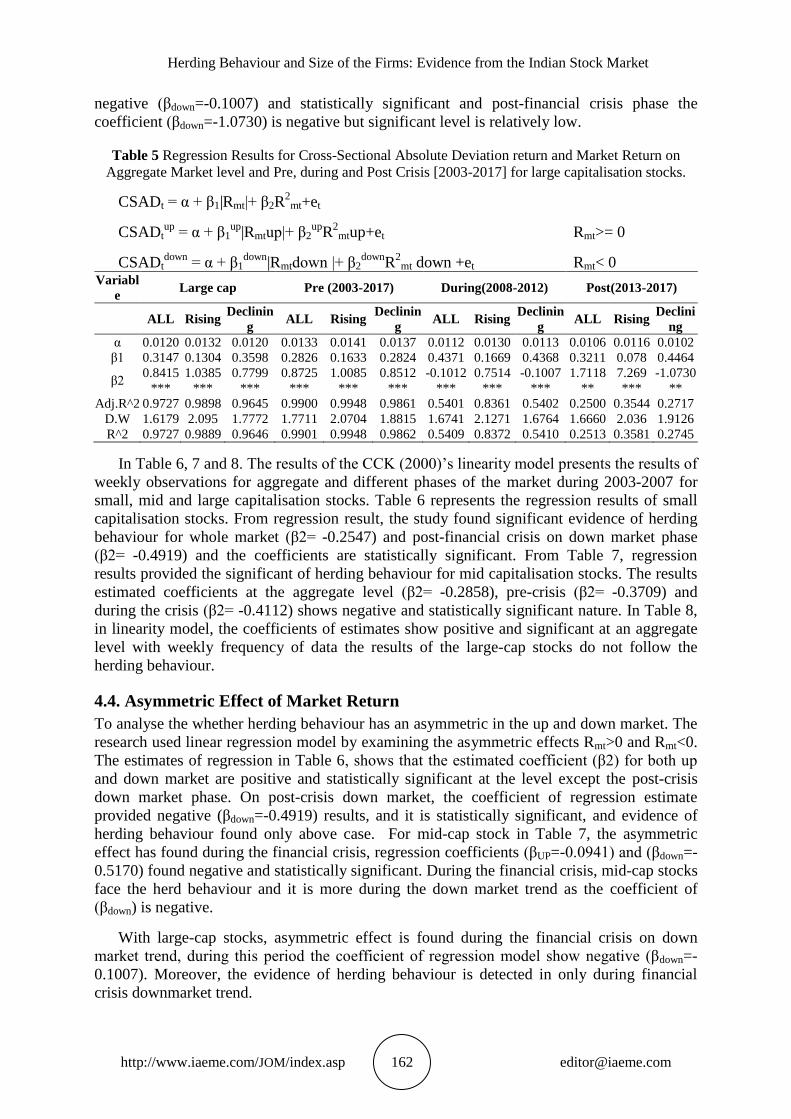
negative (βdown=-0.1007) and statistically significant and post-financial crisis phase the
coefficient (βdown=-1.0730) is negative but significant level is relatively low.
Table 5 Regression Results for Cross-Sectional Absolute Deviation return and Market Return on
Aggregate Market level and Pre, during and Post Crisis [2003-2017] for large capitalisation stocks.
CSADt = α + β1|Rmt|+ β2R2
mt+et
CSADtup
= α + β1up
|Rmtup|+ β2up
R2
mtup+et Rmt>= 0
CSADtdown
= α + β1down
|Rmtdown |+ β2down
R2
mt down +et Rmt< 0 Variabl
e Large cap Pre (2003-2017) During(2008-2012) Post(2013-2017)
ALL Rising
Declinin
g ALL Rising
Declinin
g ALL Rising
Declinin
g ALL Rising
Declini
ng
α 0.0120 0.0132 0.0120 0.0133 0.0141 0.0137 0.0112 0.0130 0.0113 0.0106 0.0116 0.0102
β1 0.3147 0.1304 0.3598 0.2826 0.1633 0.2824 0.4371 0.1669 0.4368 0.3211 0.078 0.4464
β2 0.8415
***
1.0385
***
0.7799
***
0.8725
***
1.0085
***
0.8512
***
-0.1012
***
0.7514
***
-0.1007
***
1.7118
**
7.269
***
-1.0730
**
Adj.R^2 0.9727 0.9898 0.9645 0.9900 0.9948 0.9861 0.5401 0.8361 0.5402 0.2500 0.3544 0.2717
D.W 1.6179 2.095 1.7772 1.7711 2.0704 1.8815 1.6741 2.1271 1.6764 1.6660 2.036 1.9126
R^2 0.9727 0.9889 0.9646 0.9901 0.9948 0.9862 0.5409 0.8372 0.5410 0.2513 0.3581 0.2745
In Table 6, 7 and 8. The results of the CCK (2000)’s linearity model presents the results of
weekly observations for aggregate and different phases of the market during 2003-2007 for
small, mid and large capitalisation stocks. Table 6 represents the regression results of small
capitalisation stocks. From regression result, the study found significant evidence of herding
behaviour for whole market (β2= -0.2547) and post-financial crisis on down market phase
(β2= -0.4919) and the coefficients are statistically significant. From Table 7, regression
results provided the significant of herding behaviour for mid capitalisation stocks. The results
estimated coefficients at the aggregate level (β2= -0.2858), pre-crisis (β2= -0.3709) and
during the crisis (β2= -0.4112) shows negative and statistically significant nature. In Table 8,
in linearity model, the coefficients of estimates show positive and significant at an aggregate
level with weekly frequency of data the results of the large-cap stocks do not follow the
herding behaviour.
4.4. Asymmetric Effect of Market Return
To analyse the whether herding behaviour has an asymmetric in the up and down market. The
research used linear regression model by examining the asymmetric effects Rmt>0 and Rmt<0.
The estimates of regression in Table 6, shows that the estimated coefficient (β2) for both up
and down market are positive and statistically significant at the level except the post-crisis
down market phase. On post-crisis down market, the coefficient of regression estimate
provided negative (βdown=-0.4919) results, and it is statistically significant, and evidence of
herding behaviour found only above case. For mid-cap stock in Table 7, the asymmetric
effect has found during the financial crisis, regression coefficients (βUP=-0.0941) and (βdown=-
0.5170) found negative and statistically significant. During the financial crisis, mid-cap stocks
face the herd behaviour and it is more during the down market trend as the coefficient of
(βdown) is negative.
With large-cap stocks, asymmetric effect is found during the financial crisis on down
market trend, during this period the coefficient of regression model show negative (βdown=-
0.1007). Moreover, the evidence of herding behaviour is detected in only during financial
crisis downmarket trend.

Batchu Satish and Dr. Padmasree K
http://www.iaeme.com/JOM/index.asp 163 [email protected]
Table 6 Regression Results for Cross-Sectional Absolute Deviation return and Market Return on the
weekly Market level and Pre, during and Post Crisis [2003-2017] for NSE listed small capitalisation
stocks.
CSADt = α + β1|Rmt|+ β2R2
mt+et
CSADtup
= α + β1up
|Rmtup|+ β2up
R2
mtup+et Rmt>= 0
CSADtdown
= α + β1down
|Rmtdown |+ β2down
R2
mt down +et Rmt< 0 Variabl
e
Small cap Pre (2003-2017) During(2008-2012) Post(2013-2017)
ALL Rising
Declinin
g
ALL Rising
Declinin
g
ALL Rising
Declinin
g
ALL Rising
Declini
ng
α 0.0356 0.0371 0.0357 0.0423 0.0434 0.0426 0.0358 0.0354 0.0368 0.0355 0.0356 0.0287
β1 0.3193 0.2927 0.2725 0.1912 0.1934 0.0136 0.3333 0.3395 0.2827 0.1338 0.1937 0.2946
β2 -
0.2547
***
0.5336
**
-0.2281
(no sig)
-0.4046
(no sig)
0.4061
(no sig)
0.6378
**
2.7407
***
2.5944
***
3.7194
***
0.0904
(no sig)
-0.0261
(no sig)
-0.4919
***
Adj.R^2 0.5373 0.5735 0.4621 0.4007 0.4582 0.2228 0.8976 0.8909 0.8809 0.6313 0.5582 0.5937
D.W 2.0832 2.0094 2.0741 2.0452 2.0181 2.0001 1.9666 1.9563 2.0256 2.0471 2.0079 1.6242
R^2 0.5397 0.5775 0.4683 0.4101 0.4729 0.2521 0.8992 0.8938 0.8854 0.6376 0.5724 0.5999
*** At one percent significant level, ** At five percent significant level, * At ten percent significant
level
Table 7 Regression Results for Cross-Sectional Absolute Deviation return and Market Return on the
weekly Market level and Pre, during and Post Crisis [2003-2017] for NSE listed mid capitalisation
stocks.
CSADt = α + β1|Rmt|+ β2R2
mt+et
CSADtup
= α + β1up
|Rmtup|+ β2up
R2
mtup+et Rmt>= 0
CSADtdown
= α + β1down
|Rmtdown |+ β2down
R2
mt down +et Rmt< 0 Variabl
e
Mid cap Pre (2003-2017) During(2008-2012) Post(2013-2017)
ALL Rising
Declinin
g
ALL Rising
Declinin
g
ALL Rising
Declinin
g
ALL Rising
Declini
ng
α 0.0302 0.0323 0.0316 0.0344 0.0362 0.0368 0.0267 0.0299 0.0261 0.0297 0.0298 0.0294
β1 0.2656 0.1750 0.1857 0.2597 0.2420 0.1290 0.3370 0.2076 0.3739 0.0997 0.0749 0.1850
β2 -0.2858
***
0.0295
(no sig)
0.6757
**
-0.3709
**
-1.0790
(no sig)
0.7144
(no sig)
-0.4112
***
-0.0941
**
-0.5170
***
1.6210
***
1.7028
***
0.6997
(no sig)
Adj.R^
2
0.4400 0.4418 0.4040 0.3117 0.2710 0.2613 0.5028 0.5600 0.5600 0.3313 0.3336 0.3673
D.W 2.1270 2.0686 1.6747 2.0577 2.0352 1.7567 1.6841 1.9364 1.9364 1.5589 1.6832 1.9882
R^2 0.4421 0.4468 0.4075 0.3197 0.2893 0.2766 0.5067 0.5667 0.5667 0.3389 0.3420 0.3929
*** At one percent significant level, ** At five percent significant level, * At ten percent significant
level

Herding Behaviour and Size of the Firms: Evidence from the Indian Stock Market
http://www.iaeme.com/JOM/index.asp 164 [email protected]
Table 8 Regression Results for Cross-Sectional Absolute Deviation return and Market Return on the
weekly Market level and Pre, during and Post Crisis [2003-2017] for large capitalisation stocks.
CSADt = α + β1|Rmt|+ β2R2
mt+et
CSADtup
= α + β1up
|Rmtup|+ β2up
R2
mtup+et Rmt>= 0
CSADtdown
= α + β1down
|Rmtdown |+ β2down
R2
mt down +et Rmt< 0 Variabl
e Large cap Pre (2003-2017) During(2008-2012) Post(2013-2017)
ALL Rising
Declinin
g ALL Rising
Declinin
g ALL Rising
Declinin
g ALL Rising
Declini
ng
α 0.0279 0.0122 0.0120 0.0341 0.0141 0.0137 0.0257 0.0130 0.0113 0.0281 0.0115 0.0102
β1 0.2115 0.2508 0.3598 -0.0163 0.1633 0.2824 0.3599 0.1669 0.4368 -0.1388 0.0806 0.4464
β2 1.0452
***
0.9244
***
0.7799
***
2.6161
***
1.0085
***
0.8512
***
-0.0610
(no sig)
0.7514
***
-0.1007
**
8.0077
***
7.3321
***
-1.0745
**
Adj.R^2 0.2608 0.9824 0.9646 0.1773 0.9959 0.9861 0.3838 0.8361 0.5402 0.2304 0.3340 0.2717
D.W 16227 1.6254 1.7772 1.6461 2.0704 1.8815 1.5693 2.1271 1.6764 1.8671 2.1488 1.9126
R^2 0.2627 0.9824 0.9824 0.1837 0.9948 0.9862 0.3886 0.8372 0.5410 0.2363 0.3368 0.2745
*** At one percent significant level, ** At five percent significant level, * At ten percent significant
level
5. FINDINGS
Secondary data used to examine the herding behaviour in Indian stock market during the 1st
Jan, 2003 to 31st Dec, 2017 by analysing the cross sectional variability of stock return and
market return. Chang, Cheng and Khorona (2000) methodology is applied and perform the
regression analysis. The following findings were list out from the regression analysis
At aggregate data level herding behaviour has not detected among the small
capitalisation stock during the investigation period but on weekly data, the behaviour
has found for whole period and post crisis down market period
While analysing the mid capitalisation stocks, the herding behaviour is existed on only
during financial crisis down market trend. In case of weekly data the herding
behaviour is found at pre and during crisis period.
Among the large cap stocks, herding behaviour is absent all phases except during the
financial crisis, during financial crisis period the herd behaviour is detected with
whole data and down market trend and same results were repeated at weekly
observations.
6. CONCLUSIONS
This study examine the presence of herding behaviour in national stock exchange of India by
segregating the listed stocks into different capitalisation i.e., small, mid and large
capitalisation stock during the 2003 to 2017. Also, the study divided the time frame into three
phases as pre crisis, during crisis and post crisis period. Empirical results provided the
evidence that herding behaviour is existed among mid and large cap during the crisis and rest
of the phases the market follows the traditional finance assumptions. When time frame
segregated into daily and weekly frequency, herding behaviour is present on the small
capitalisation stock during financial crisis, also the results were same for large capitalisation
stock as like daily observations. Moreover, in Indian stock market the herding behaviour is
strong on during the financial crisis.

Batchu Satish and Dr. Padmasree K
http://www.iaeme.com/JOM/index.asp 165 [email protected]
REFERENCES
[1] Nofsinger, J. R., & Sias, R. W. (1999). Herding and Feedback Trading by Institutional and
Individual Investors. The Jounal of Finance, LIV(6).
[2] Christie, W. G., Huang, R. D., Christie, W. G., & Huang, R. D. (1995). Following the Pied
Piper : Do Individual Returns Herd around the Market ? Financial Analysts Journal, 51(4),
31–37.
[3] Chang, E. C., Cheng, J. W., & Khorana, A. (2000). An examination of herd behavior in
equity markets : An international perspective. Journal of Banking and Finance, 24, 1651–
1679.
[4] Tan, L., Chiang, T. C., Mason, J. R., & Nelling, E. (2008). Herding behavior in Chinese
stock markets : An examination of A and B shares. Pacific-Basin Finance Journal, 16, 61–
77. https://doi.org/10.1016/j.pacfin.2007.04.004
[5] Lakshman, M. V, Basu, S., & Vaidyanathan, R. (2013). Market-wide Herding and the
Impact of Institutional Investors in the Indian Capital Market. Journal of Emerging Market
Finance, 12(2), 197–237. https://doi.org/10.1177/0972652713494046
[6] Tayde, M., & Rao, S. V. D. N. (2011). Do Foreign Institutional Investrs Exhibit Herding
and Positive Feedback Trading in Indian stock Markets? International Finance Review,
12, 169–185. https://doi.org/10.1108/S1569-3767(2011)0000012009
[7] Lao, P., & Singh, H. (2011). Herding behaviour in the Chinese and Indian stock markets.
Journal of Asian Economics, 22(6), 495–506. https://doi.org/10.1016/j.asieco.2011.08.001
[8] Garg, A., & Gulati, R. (2013). Do investors herd in Indian market. Decision, 40(3), 181–
196. https://doi.org/10.1007/s40622-013-0015-z
[9] Garg, Ashish and Jindal, Kiran, Herding Behavior in an Emerging Stock Market:
Empirical Evidence from India (October 11, 2014). The IUP Journal of Applied Finance,
Vol. 20, No. 2, April 2014, pp. 18-36. SSRN: https://ssrn.com/abstract=2508547
[10] Chen, T. (2013). Do Investors Herd in Global Stock Markets ? Do Investors Herd in
Global Stock Markets ? Journal of Behavioral Finance ISSN:, 14(3), 230–239.
https://doi.org/10.1080/15427560.2013.819804
[11] Houda, B. M., & Mohamed, F. (2013). Herding During Market Upturns and Downturns :
International Evidence. IUP Journal.
[12] Ramadan, I. Z. (2015). Cross-Sectional Absolute Deviation Approach for Testing the
Herd Behavior Theory : The Case of the ASE Index. International Journal of Economics
and Finance, 7(3), 188–193. https://doi.org/10.5539/ijef.v7n3p188