Embed Size (px)
Citation preview

HERCULES USER MANUAL
Version 5 Series
© 2013 DG Technologies 33604 West Eight Mile Road Farmington Hills, MI 48335
Phone (248) 888-2000 • Fax (248) 888-9977 http://www.dgtech.com

2
This document is copyrighted by Dearborn Group Inc. Permission is granted to copy any or all portions of this manual, provided that such copies are for use with the product provided by the Dearborn Group, and that the name “Dearborn Group Inc.” remain on all copies as on the original.
IMPORTANT NOTICE When using this manual, please remember the following:
• This manual may be changed, in whole or in part, without notice.
• Dearborn Group Inc. assumes no responsibility for damage resulting from any accident – or for any other reason – which occurs while the Hercules Software is in use.
• No license is granted – by implication or otherwise – for any patents or other rights of
Dearborn Group Inc., or of any third party.
GRYPHON® is a registered trademark of Dearborn Group Inc. Recent manual revision history for this version:
December 2, 2008 (Manual Update contents to version 5.0) March 29, 2013 (Manual Update contents for UDS/Ford Diagnostics)

3
TABLE OF CONTENTS 1. INTRODUCTION .................................................................................................................................................... 6
1.1 DOCUMENT ORGANIZATION AND FORMAT .............................................................................................................. 7 1.2 TECHNICAL SUPPORT .............................................................................................................................................. 8 1.3 SUPPLEMENTAL DOCUMENTATION ......................................................................................................................... 8
2. INSTALLATION ..................................................................................................................................................... 9
2.1 REQUIRED OPERATING ENVIRONMENT .................................................................................................................... 9 2.2 INSTALLATION INSTRUCTIONS .............................................................................................................................. 10
3. GETTING STARTED ............................................................................................................................................ 11
3.1 APPLICATION OVERVIEW ..................................................................................................................................... 11 3.1.1 First step ................................................................................................................................................... 13 3.1.2 Global Options .......................................................................................................................................... 13 3.1.3 ONLINE / OFFLINE ................................................................................................................................. 14 3.1.4 Basic Viewing Display Features ............................................................................................................... 14 3.1.5 Advanced Viewing Features ...................................................................................................................... 15 3.1.6 Basic Transmit Features ........................................................................................................................... 15 3.1.7 Advanced Transmit Features .................................................................................................................... 15 3.1.8 LIN Emulation with an LDF ..................................................................................................................... 15 3.1.9 Save and Load Configuration and Other Features ................................................................................... 15
3.2 INITIALIZING THE HARDWARE .............................................................................................................................. 16 3.2.1 Configuring the Ethernet interface ........................................................................................................... 17 3.2.2 Configuring the network channels ............................................................................................................ 18
3.3 DATABASE MENU ................................................................................................................................................. 20 3.3.1 Database Formats and Protocol ............................................................................................................... 21 3.3.3 Associate Database(s) ............................................................................................................................... 24 3.3.4 Merge Database ........................................................................................................................................ 25 3.3.5 Import database ........................................................................................................................................ 27 3.3.6 Non-Diag Frame Data .............................................................................................................................. 34 3.3.7 Non-Diag. Signal Data ............................................................................................................................. 39 3.3.8 Diag. Frame .............................................................................................................................................. 42 3.3.9 Unit Description ........................................................................................................................................ 44 3.3.10 Virtual Device(s) ....................................................................................................................................... 44
4. CONFIGURATION MENU .................................................................................................................................. 46
4.1 TRANSMIT FRAME TABLE (TFT) .......................................................................................................................... 47 4.1.1 Selecting frames for transmission ............................................................................................................. 47 4.1.2 Editing data in frames ............................................................................................................................... 51 4.1.3 Assigning Transmission Channels, Hot Keys, Types ................................................................................ 52 4.1.4 Associate Frame ........................................................................................................................................ 54 4.1.5 Saving Transmit Frame Table Configurations .......................................................................................... 55 4.1.6 Transmitting frames .................................................................................................................................. 55 4.1.7 Transmit Frame Table Online Editing ...................................................................................................... 55
4.2 BUFFER CONFIGURATION ..................................................................................................................................... 56 4.3 TRIGGER CONFIGURATION ................................................................................................................................... 58
4.3.1 Frame Trigger (On TimeOut) Configuration ............................................................................................ 61 4.3.2 Trigger On Engineering Value Configuration .......................................................................................... 63 4.3.3 Event Trigger ............................................................................................................................................ 65
4.4 HARDWARE CONFIGURATION ............................................................................................................................... 65 4.5 FILTER TABLE ...................................................................................................................................................... 66
4.5.1 Adding to the Filter Table ......................................................................................................................... 66 4.5.2 Other Filter Table Configurations ............................................................................................................ 69 4.5.3 Saving and Loading Filter Table Configurations ..................................................................................... 71 4.5.4 Enabling and disabling the filter mechanism ............................................................................................ 71
4.6 FRAME RESPONDER .............................................................................................................................................. 72
4
4.7 UCS (USER-CONFIGURED SCHEDULER) ............................................................................................................... 75 4.7.1 Output command ....................................................................................................................................... 76 4.7.2 Wait command .......................................................................................................................................... 77 4.7.3 Jump command ......................................................................................................................................... 78 4.7.4 End command ............................................................................................................................................ 79 4.7.5 Comment command ................................................................................................................................... 79 4.7.6 Editing UCS Script commands .................................................................................................................. 80 4.7.7 Opening, creating, and saving .ucs files ................................................................................................... 80 4.7.8 Enabling the UCS...................................................................................................................................... 81 4.7.9 UCS example ............................................................................................................................................. 81
4.8 PROGRAM BLOCKS ............................................................................................................................................... 82 4.9 SERIAL PORT CONFIGURATION ............................................................................................................................. 83 4.10 GLOBAL OPTIONS ............................................................................................................................................ 84
5. DISPLAY MENU ................................................................................................................................................... 86
5.1 SELECTING A MONITOR ........................................................................................................................................ 87 5.1.1 Scrolling Monitor ...................................................................................................................................... 88 5.1.2 InPlace Monitor ........................................................................................................................................ 91 5.1.3 Signal Monitor .......................................................................................................................................... 95
5.2 SELECTING SPECIAL VIEWS .................................................................................................................................. 99 5.2.1 Offline Buffer View.................................................................................................................................... 99 5.2.2 Information View .................................................................................................................................... 101 5.2.3 Statistics View ......................................................................................................................................... 101 5.2.4 Signal Graph ........................................................................................................................................... 104 5.2.5 Statistics Graph ....................................................................................................................................... 108 5.2.6 Diagnostic View ...................................................................................................................................... 112 5.2.7 LIN Emulation View ................................................................................................................................ 113
6. FILTER MODE MENU ....................................................................................................................................... 115
7. MONITORING MENU ....................................................................................................................................... 116
8. PLAYBACK MENU ............................................................................................................................................ 117
8.1 EDITING PLAYBACK FILES IN EXCEL (CSV) FORMAT ......................................................................................... 118 8.1.1 Required File Format .............................................................................................................................. 118 8.1.2 File Format saved by Excel (CSV) .......................................................................................................... 118 8.1.3 Creating New Files within Excel and saving as (CSV) ........................................................................... 119
9. DIAGNOSTICS MENU ....................................................................................................................................... 120
9.1 SETTING UP OR LOADING A DIAGNOSTIC CONFIGURATION ................................................................................ 120 9.1.1 Setting up a GMLAN Diagnostic Configuration ..................................................................................... 120 9.1.2 Setting up an UDS/FORD Diagnostic Configuration ............................................................................. 123 9.1.3 Setting up J1979 Diagnostics .................................................................................................................. 125
9.2 LAUNCH DIAGNOSTIC SERVICES ........................................................................................................................ 126 9.3 UTILIZING DIAGNOSTIC SERVICES ....................................................................................................................... 127 9.4 SIMPLE DIAGNOSTIC TUTORIAL ......................................................................................................................... 127
9.4.1 Hercules Diagnostic Support .................................................................................................................. 128
10. VIEW MENU ........................................................................................................................................................ 130
11. LANGUAGE MENU ............................................................................................................................................ 131
12. HELP MENU ........................................................................................................................................................ 131
12.1 HELP TOPICS .................................................................................................................................................. 131 12.2 ABOUT HERCULES ......................................................................................................................................... 131
A. APPENDIX A: SUPPORTED HARDWARE MODULES ............................................................................... 132
A.1 CAN 82527 MODULES ................................................................................................................................... 132 A.2 CAN SJA1000 MODULES .............................................................................................................................. 134

5
A.3 HBCC (FORD SCP) MODULE ......................................................................................................................... 137 A.4 DLC (GM CLASS 2 / J1850 VPW) MODULE .................................................................................................. 138 A.5 DCX (J1850 VPW) MODULE ......................................................................................................................... 138 A.6 LIN 1.2 MODULE ............................................................................................................................................ 139 A.7 LIN 2.0 MODULE ............................................................................................................................................ 139
A.7.1 Monitor Mode set as Normal for monitoring purposes. .......................................................................... 139 A.7.2 Monitor Mode set to Emulate with a customized LIN Description File (LDF). ...................................... 140

6
1. Introduction The software package is a 32-bit Windows based application for advanced network analysis and interaction with in-vehicle network systems. Using this software with a GRYPHON® or S-CAT hardware interface, you can monitor, receive, filter, transmit and edit CAN frames, as well as frames from other protocols (e.g., LIN, J1850, J1939) over a variety of communication links. You can also access the Hercules database for industry standard translation of these frames.
You may interact with the translation database of Hercules, where frame definitions are stored and retrieved, in order to decode received frames and encode frames for transmission.
Hercules software currently supports up to six channels using a PC computer via a point-to-point connection.
The Hercules Configuration file is maintained in an *.xml format and requires the User to save the files if content is to be used multiple times. The Configuration file maintains User defined content for selected frames and signals on the InPlace Monitor, Signal Monitor and Signal Graphs as well as other selections and links to related Hercules files such as, * .txt (Transmit Frame Table), *rft (Filter), *.cfg (Diagnostic Configurations. Hercules allows loading of the current .xml format and the older*.her format.
7
1.1 Document organization and format
Section 1 – Introduction – Summarizes the contents of the manual and provides references to related documentation and technical support.
Section 2 – Installation – Covers the software and hardware necessary to successfully install and operate the Hercules tool, including the required operating environment, installation instructions, and main menu overview.
Section 3 – Getting Started – Describes the procedure to configure your hardware and summaries steps to use the software.
Section 4 – Configuration Menu – Describes the procedure to properly set up and configure the Hercules software.
Section 5 – Display Menu – Presents the display formats (monitors/views) available for the viewing of frames and Hercules tool status.
Section 6 – Filter Mode Menu – Describes the function of filtering frames and how to enable and disable filters.
Section 7 – Monitoring Menu – Describes the procedure for initiating an online monitoring session and identifies the various features enabled and disabled by main-menu option selections.
Section 8 – Playback Menu – Describes the procedure for playing back a previous monitoring session.
Section 9 – Diagnostics Menu – Describes the procedure for accessing and utilizing services available to the Diagnostic View.
Section 10 – View Menu – Shows the Tool Bar and Status Bar options for work within the application.
Section 11 – Language Menu – Describes the options for languages and types of views of monitors.
Section 12 – Help Menu – Has Hercules Help Topics, feature to update firmware, and also displays which version of the Hercules Software is installed in the computer.
8
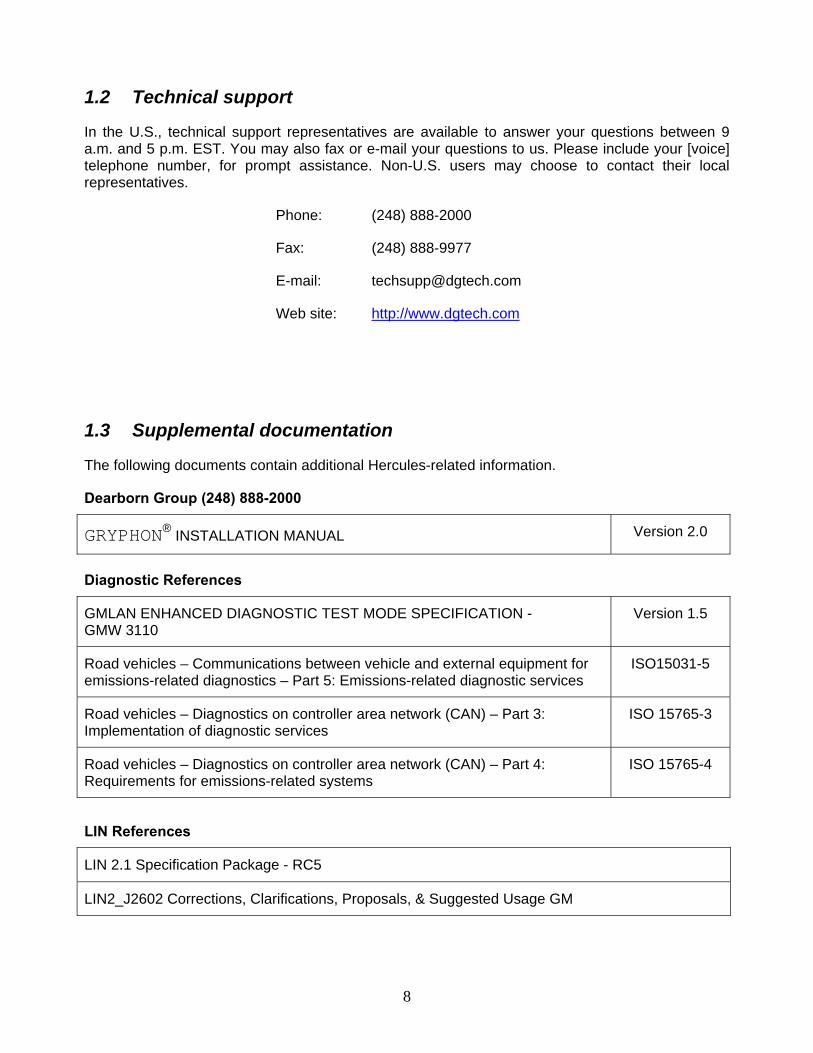
1.2 Technical support
In the U.S., technical support representatives are available to answer your questions between 9 a.m. and 5 p.m. EST. You may also fax or e-mail your questions to us. Please include your [voice] telephone number, for prompt assistance. Non-U.S. users may choose to contact their local representatives.
Phone: (248) 888-2000
Fax: (248) 888-9977
E-mail: [email protected]
Web site: http://www.dgtech.com
1.3 Supplemental documentation
The following documents contain additional Hercules-related information.
Dearborn Group (248) 888-2000
GRYPHON® INSTALLATION MANUAL Version 2.0
Diagnostic References
GMLAN ENHANCED DIAGNOSTIC TEST MODE SPECIFICATION - GMW 3110
Version 1.5
Road vehicles – Communications between vehicle and external equipment for emissions-related diagnostics – Part 5: Emissions-related diagnostic services
ISO15031-5
Road vehicles – Diagnostics on controller area network (CAN) – Part 3: Implementation of diagnostic services
ISO 15765-3
Road vehicles – Diagnostics on controller area network (CAN) – Part 4: Requirements for emissions-related systems
ISO 15765-4
LIN References
LIN 2.1 Specification Package - RC5
LIN2_J2602 Corrections, Clarifications, Proposals, & Suggested Usage GM

9
2. Installation Before installing the Hercules software, verify that your computer has the minimum hardware specifications to permit using the program. See the following section for detail about the required operating environment.
2.1 Required operating environment
The minimum recommended operating environment for the Hercules software consists of the following components:
• Personal computer – 533 MHz or faster
• 256 MB RAM (minimum)
• 1 GB of hard drive space (minimum)
• XP and Windows 2000 with latest Service pack installed
• Dearborn Group hardware interface
• Ethernet card capable of 10MB-per-second data transfer (or faster)
• Null Ethernet (crossed) cable
NOTE: Hardware interface refers to Dearborn Group’s GRYPHON® family of hardware (including Gryphon 2, Gryphon S3).
10
2.2 Installation instructions
The Hercules installation program will ask you to uninstall a previous version of the Hercules or S-CAT software prior to installing a more recent version. When ready, follow these steps:
1. Start Windows.
2. Insert Hercules CD-ROM into your PC computer CD-ROM drive.
3. Click Start | Run.
4. Type D:\Hercules\INSTALL_Hercules.EXE
5. (If “D” is your PC’s CD-ROM label; otherwise, replace “D” with the correct letter for your CD-ROM drive).
6. Follow the instructions that appear on the screen.
7. When prompted for a TCP/IP configuration, click Next to choose the default settings or
enter the IP address of the hardware to which you will connect. Section 3.2.1.2 describes how to change these settings.
Continue following the directions on the screen.
After installation, two icons will appear on the Windows desktop – Hercules and Hercules Compiler. To run the Hercules application, double-click the Hercules icon.
For point-to-point connections, apply power to the hardware prior to booting your laptop to guarantee proper IP assignment.
IP Address: 192.168. 1. 1 Port No: 7000
11
3. Getting Started After installation, two icons are added to the Windows desktop – Hercules and Hercules Compiler. The Hercules icon launches the main application, while the Hercules Compiler starts the advanced programming and compiler program. The Hercules Compiler program is also accessible from within the Hercules program.
3.1 Application Overview
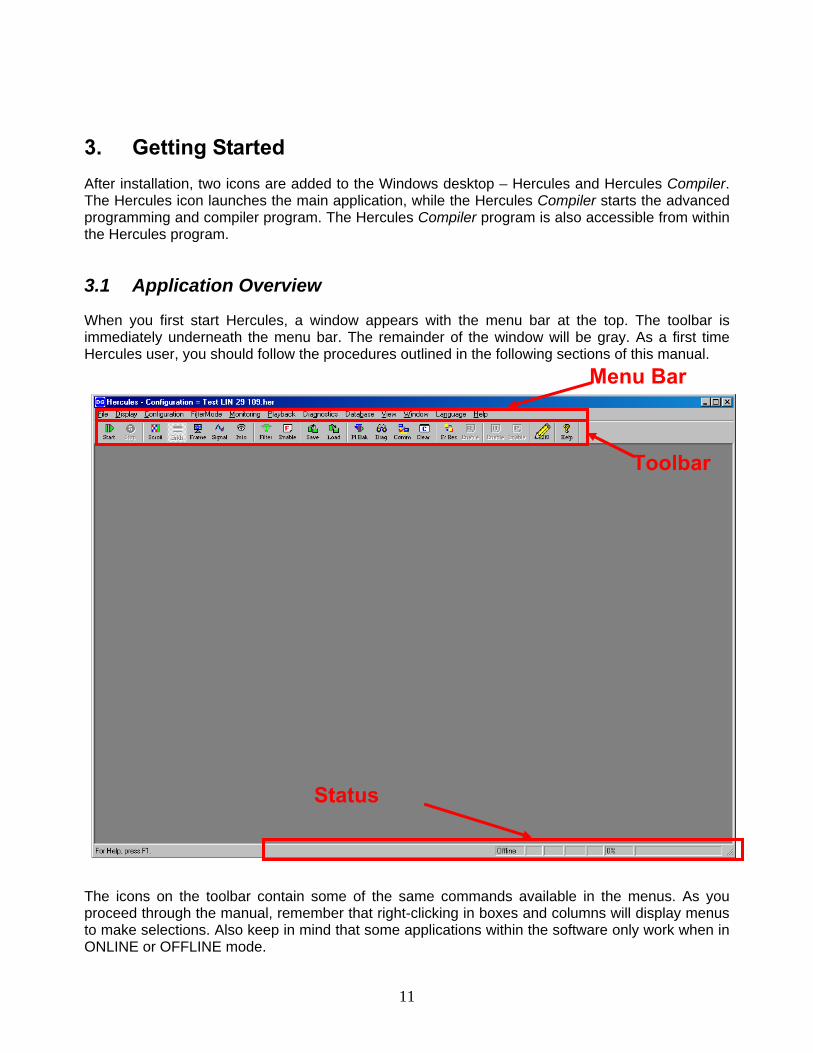
When you first start Hercules, a window appears with the menu bar at the top. The toolbar is immediately underneath the menu bar. The remainder of the window will be gray. As a first time Hercules user, you should follow the procedures outlined in the following sections of this manual.
The icons on the toolbar contain some of the same commands available in the menus. As you proceed through the manual, remember that right-clicking in boxes and columns will display menus to make selections. Also keep in mind that some applications within the software only work when in ONLINE or OFFLINE mode.
Menu Bar
Toolbar
Status
12
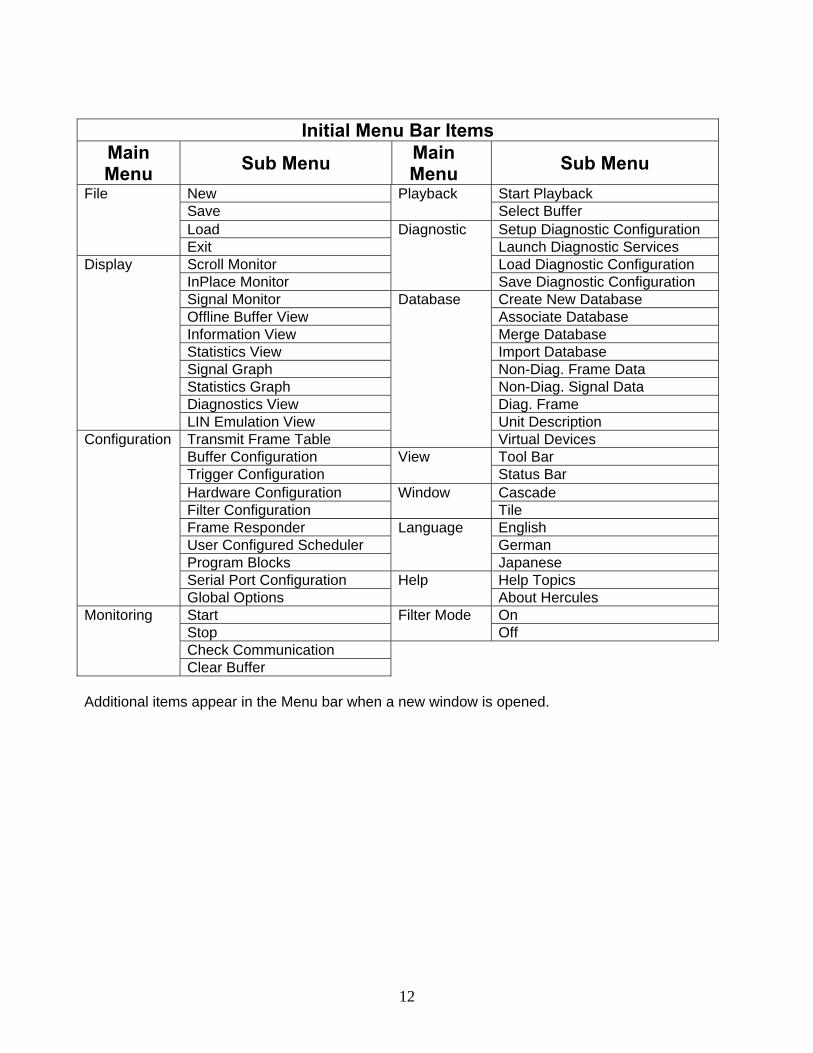
Initial Menu Bar Items Main Menu Sub Menu Main
Menu Sub Menu File New Playback
Start Playback
Save Select Buffer Load Diagnostic
Setup Diagnostic Configuration
Exit Launch Diagnostic Services Display Scroll Monitor Load Diagnostic Configuration
InPlace Monitor Save Diagnostic Configuration Signal Monitor Database
Create New Database
Offline Buffer View Associate Database Information View Merge Database Statistics View Import Database Signal Graph Non-Diag. Frame Data Statistics Graph Non-Diag. Signal Data Diagnostics View Diag. Frame LIN Emulation View Unit Description
Configuration Transmit Frame Table Virtual Devices Buffer Configuration View
Tool Bar
Trigger Configuration Status Bar Hardware Configuration Window
Cascade
Filter Configuration Tile Frame Responder Language English User Configured Scheduler German Program Blocks Japanese Serial Port Configuration Help Help Topics Global Options About Hercules
Monitoring
Start Filter Mode On Stop Off Check Communication Clear Buffer
Additional items appear in the Menu bar when a new window is opened.
13
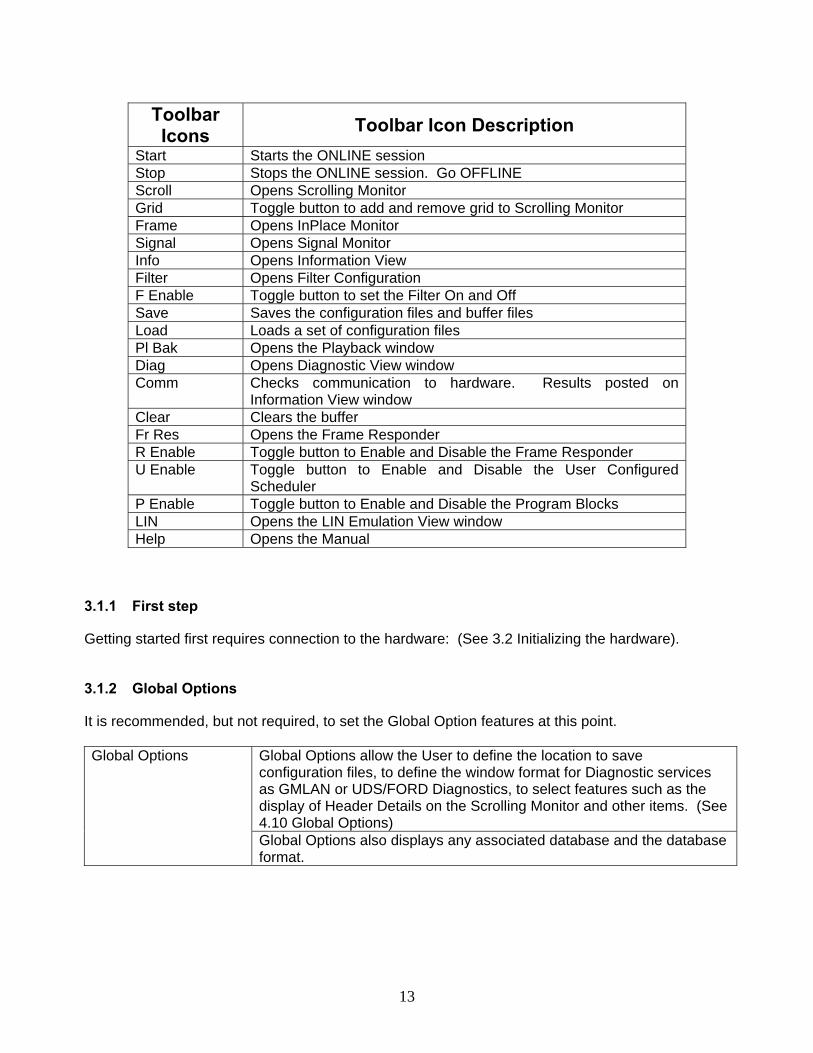
Toolbar Icons Toolbar Icon Description
Start Starts the ONLINE session Stop Stops the ONLINE session. Go OFFLINE Scroll Opens Scrolling Monitor Grid Toggle button to add and remove grid to Scrolling Monitor Frame Opens InPlace Monitor Signal Opens Signal Monitor Info Opens Information View Filter Opens Filter Configuration F Enable Toggle button to set the Filter On and Off Save Saves the configuration files and buffer files Load Loads a set of configuration files Pl Bak Opens the Playback window Diag Opens Diagnostic View window Comm Checks communication to hardware. Results posted on
Information View window Clear Clears the buffer Fr Res Opens the Frame Responder R Enable Toggle button to Enable and Disable the Frame Responder U Enable Toggle button to Enable and Disable the User Configured
Scheduler P Enable Toggle button to Enable and Disable the Program Blocks LIN Opens the LIN Emulation View window Help Opens the Manual
3.1.1 First step
Getting started first requires connection to the hardware: (See 3.2 Initializing the hardware).
3.1.2 Global Options
It is recommended, but not required, to set the Global Option features at this point. Global Options Global Options allow the User to define the location to save
configuration files, to define the window format for Diagnostic services as GMLAN or UDS/FORD Diagnostics, to select features such as the display of Header Details on the Scrolling Monitor and other items. (See 4.10 Global Options) Global Options also displays any associated database and the database format.
14
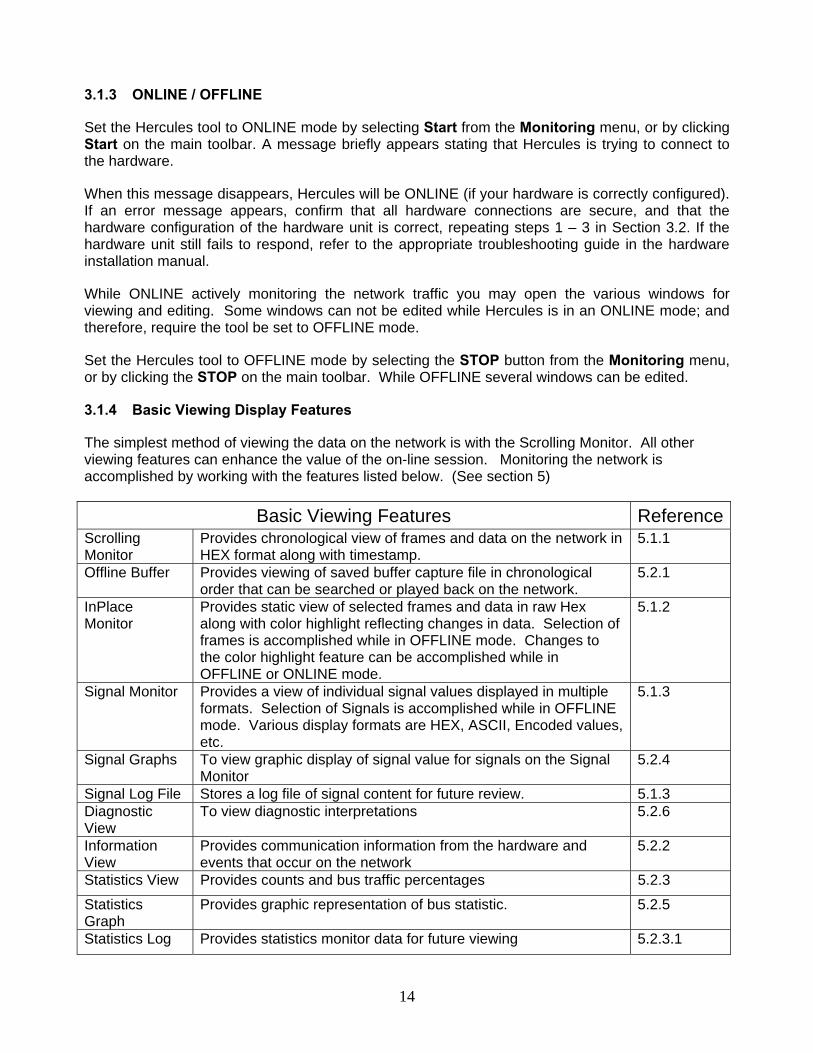
3.1.3 ONLINE / OFFLINE
Set the Hercules tool to ONLINE mode by selecting Start from the Monitoring menu, or by clicking Start on the main toolbar. A message briefly appears stating that Hercules is trying to connect to the hardware.
When this message disappears, Hercules will be ONLINE (if your hardware is correctly configured). If an error message appears, confirm that all hardware connections are secure, and that the hardware configuration of the hardware unit is correct, repeating steps 1 – 3 in Section 3.2. If the hardware unit still fails to respond, refer to the appropriate troubleshooting guide in the hardware installation manual.
While ONLINE actively monitoring the network traffic you may open the various windows for viewing and editing. Some windows can not be edited while Hercules is in an ONLINE mode; and therefore, require the tool be set to OFFLINE mode.
Set the Hercules tool to OFFLINE mode by selecting the STOP button from the Monitoring menu, or by clicking the STOP on the main toolbar. While OFFLINE several windows can be edited.
3.1.4 Basic Viewing Display Features
The simplest method of viewing the data on the network is with the Scrolling Monitor. All other viewing features can enhance the value of the on-line session. Monitoring the network is accomplished by working with the features listed below. (See section 5)
Basic Viewing Features ReferenceScrolling Monitor
Provides chronological view of frames and data on the network in HEX format along with timestamp.
5.1.1
Offline Buffer Provides viewing of saved buffer capture file in chronological order that can be searched or played back on the network.
5.2.1
InPlace Monitor
Provides static view of selected frames and data in raw Hex along with color highlight reflecting changes in data. Selection of frames is accomplished while in OFFLINE mode. Changes to the color highlight feature can be accomplished while in OFFLINE or ONLINE mode.
5.1.2
Signal Monitor Provides a view of individual signal values displayed in multiple formats. Selection of Signals is accomplished while in OFFLINE mode. Various display formats are HEX, ASCII, Encoded values, etc.
5.1.3
Signal Graphs To view graphic display of signal value for signals on the Signal Monitor
5.2.4
Signal Log File Stores a log file of signal content for future review. 5.1.3 Diagnostic View
To view diagnostic interpretations 5.2.6
Information View
Provides communication information from the hardware and events that occur on the network
5.2.2
Statistics View Provides counts and bus traffic percentages 5.2.3
Statistics Graph
Provides graphic representation of bus statistic. 5.2.5
Statistics Log Provides statistics monitor data for future viewing 5.2.3.1
15
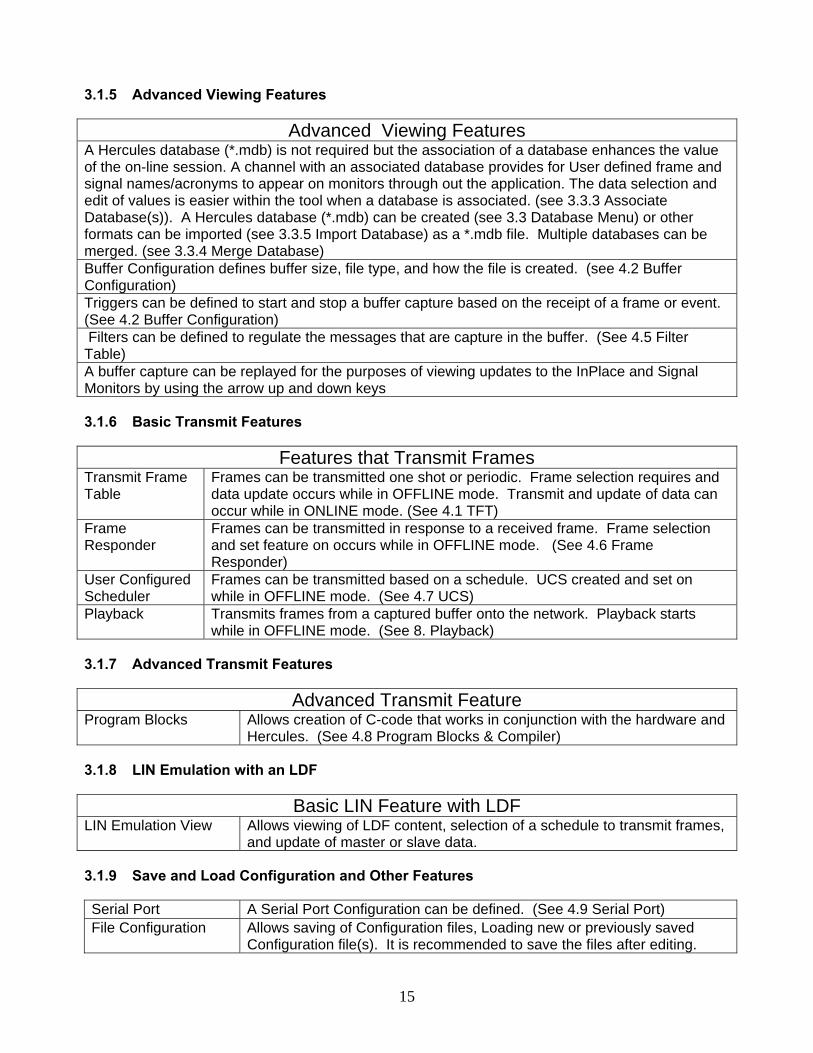
3.1.5 Advanced Viewing Features
Advanced Viewing Features A Hercules database (*.mdb) is not required but the association of a database enhances the value of the on-line session. A channel with an associated database provides for User defined frame and signal names/acronyms to appear on monitors through out the application. The data selection and edit of values is easier within the tool when a database is associated. (see 3.3.3 Associate Database(s)). A Hercules database (*.mdb) can be created (see 3.3 Database Menu) or other formats can be imported (see 3.3.5 Import Database) as a *.mdb file. Multiple databases can be merged. (see 3.3.4 Merge Database) Buffer Configuration defines buffer size, file type, and how the file is created. (see 4.2 Buffer Configuration) Triggers can be defined to start and stop a buffer capture based on the receipt of a frame or event. (See 4.2 Buffer Configuration) Filters can be defined to regulate the messages that are capture in the buffer. (See 4.5 Filter Table) A buffer capture can be replayed for the purposes of viewing updates to the InPlace and Signal Monitors by using the arrow up and down keys
3.1.6 Basic Transmit Features
Features that Transmit Frames Transmit Frame Table
Frames can be transmitted one shot or periodic. Frame selection requires and data update occurs while in OFFLINE mode. Transmit and update of data can occur while in ONLINE mode. (See 4.1 TFT)
Frame Responder
Frames can be transmitted in response to a received frame. Frame selection and set feature on occurs while in OFFLINE mode. (See 4.6 Frame Responder)
User Configured Scheduler
Frames can be transmitted based on a schedule. UCS created and set on while in OFFLINE mode. (See 4.7 UCS)
Playback Transmits frames from a captured buffer onto the network. Playback starts while in OFFLINE mode. (See 8. Playback)
3.1.7 Advanced Transmit Features
Advanced Transmit Feature Program Blocks Allows creation of C-code that works in conjunction with the hardware and
Hercules. (See 4.8 Program Blocks & Compiler)
3.1.8 LIN Emulation with an LDF
Basic LIN Feature with LDF LIN Emulation View Allows viewing of LDF content, selection of a schedule to transmit frames,
and update of master or slave data.
3.1.9 Save and Load Configuration and Other Features
Serial Port A Serial Port Configuration can be defined. (See 4.9 Serial Port) File Configuration Allows saving of Configuration files, Loading new or previously saved
Configuration file(s). It is recommended to save the files after editing.
16
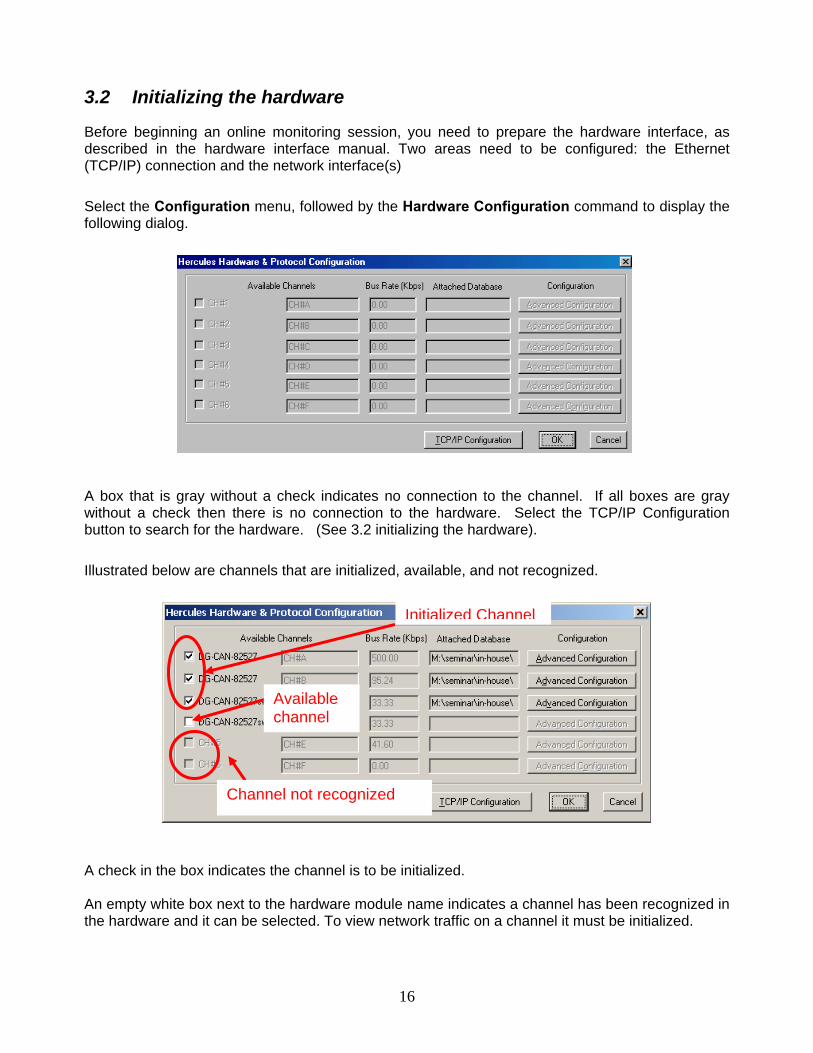
3.2 Initializing the hardware
Before beginning an online monitoring session, you need to prepare the hardware interface, as described in the hardware interface manual. Two areas need to be configured: the Ethernet (TCP/IP) connection and the network interface(s)
Select the Configuration menu, followed by the Hardware Configuration command to display the following dialog.
A box that is gray without a check indicates no connection to the channel. If all boxes are gray without a check then there is no connection to the hardware. Select the TCP/IP Configuration button to search for the hardware. (See 3.2 initializing the hardware).
Illustrated below are channels that are initialized, available, and not recognized.
A check in the box indicates the channel is to be initialized. An empty white box next to the hardware module name indicates a channel has been recognized in the hardware and it can be selected. To view network traffic on a channel it must be initialized.
Available channel
Channel not recognized
Initialized Channel
17
3.2.1 Configuring the Ethernet interface
3.2.1.1 Power up sequence
For the Ethernet connection to work properly, it is recommended that you first apply power to the hardware unit before powering up your PC. Here the recommended procedure:
1. Confirm that both your PC and hardware are off.
2. Apply power the hardware unit. Wait approximately one minute, during which time you should hear two “beeps” from the unit (one beep after about five seconds and a second beep after about 40 seconds).
NOTE: It is important to wait until the hardware unit fully cycles power before attempting to enter ONLINE mode. The hardware unit is not ready for communication until its power has been fully cycled (The S-CAT indicates a completed power cycle at the sound of the second “beep”). The newer hardware does not beep.
Apply power to your PC and start Hercules. Configure your hardware settings properly to support communication with the hardware unit.
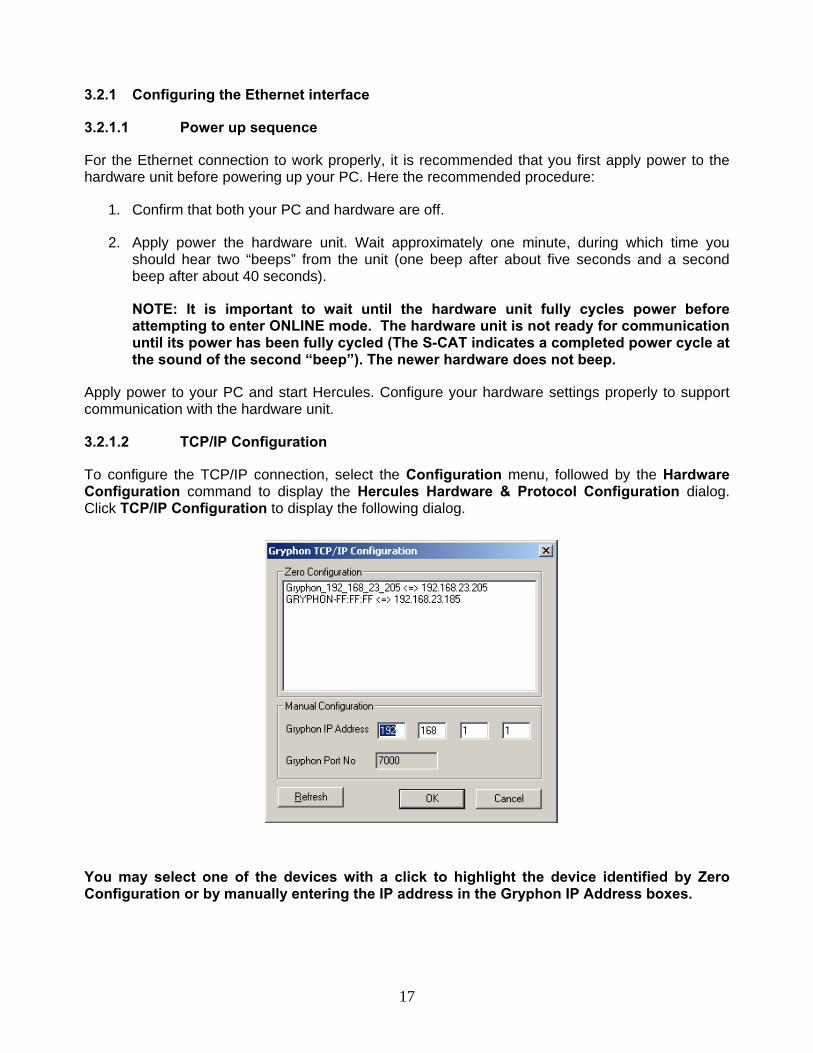
3.2.1.2 TCP/IP Configuration
To configure the TCP/IP connection, select the Configuration menu, followed by the Hardware Configuration command to display the Hercules Hardware & Protocol Configuration dialog. Click TCP/IP Configuration to display the following dialog.
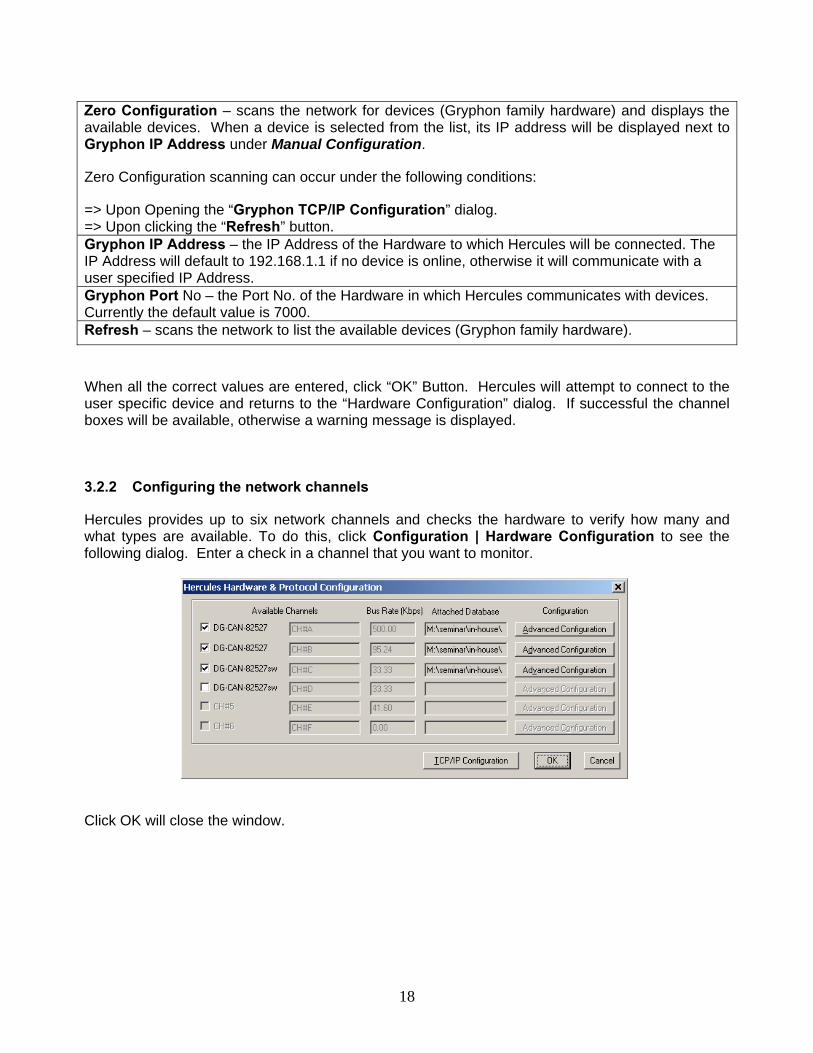
You may select one of the devices with a click to highlight the device identified by Zero Configuration or by manually entering the IP address in the Gryphon IP Address boxes.
18
Zero Configuration – scans the network for devices (Gryphon family hardware) and displays the available devices. When a device is selected from the list, its IP address will be displayed next to Gryphon IP Address under Manual Configuration.
Zero Configuration scanning can occur under the following conditions:
=> Upon Opening the “Gryphon TCP/IP Configuration” dialog. => Upon clicking the “Refresh” button. Gryphon IP Address – the IP Address of the Hardware to which Hercules will be connected. The IP Address will default to 192.168.1.1 if no device is online, otherwise it will communicate with a user specified IP Address. Gryphon Port No – the Port No. of the Hardware in which Hercules communicates with devices. Currently the default value is 7000. Refresh – scans the network to list the available devices (Gryphon family hardware).
When all the correct values are entered, click “OK” Button. Hercules will attempt to connect to the user specific device and returns to the “Hardware Configuration” dialog. If successful the channel boxes will be available, otherwise a warning message is displayed.
3.2.2 Configuring the network channels
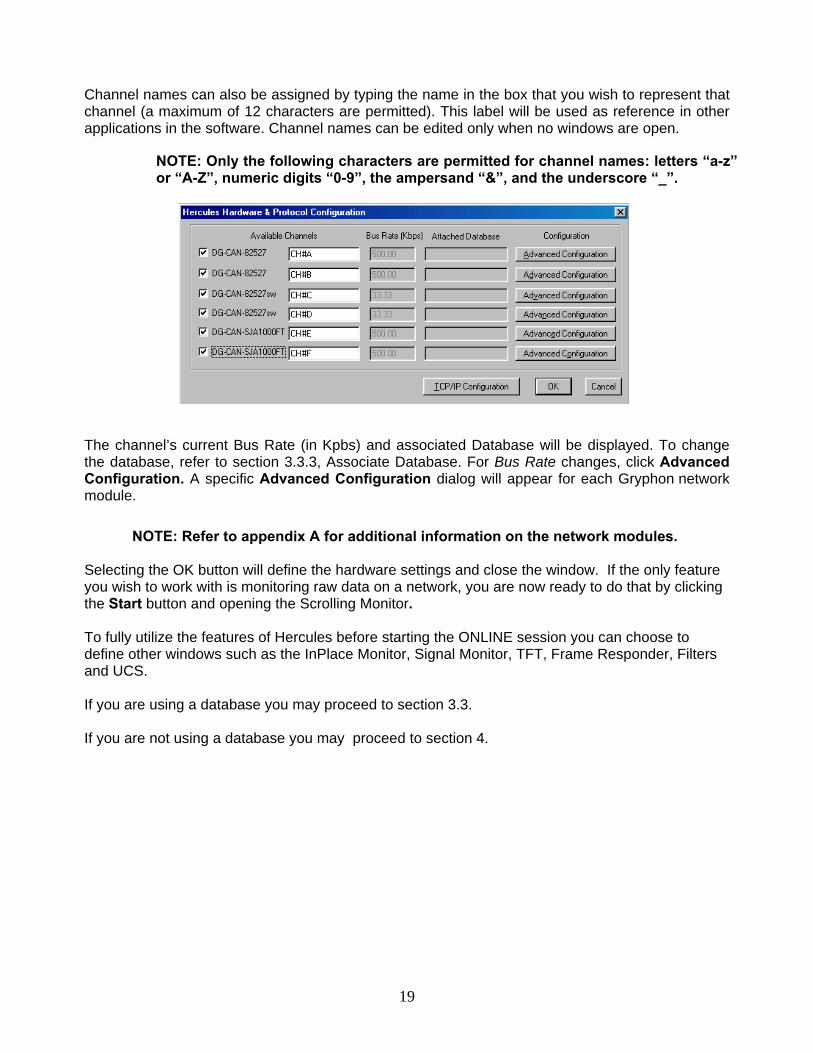
Hercules provides up to six network channels and checks the hardware to verify how many and what types are available. To do this, click Configuration | Hardware Configuration to see the following dialog. Enter a check in a channel that you want to monitor.
Click OK will close the window.
19
Channel names can also be assigned by typing the name in the box that you wish to represent that channel (a maximum of 12 characters are permitted). This label will be used as reference in other applications in the software. Channel names can be edited only when no windows are open.
NOTE: Only the following characters are permitted for channel names: letters “a-z” or “A-Z”, numeric digits “0-9”, the ampersand “&”, and the underscore “_”.
The channel’s current Bus Rate (in Kpbs) and associated Database will be displayed. To change the database, refer to section 3.3.3, Associate Database. For Bus Rate changes, click Advanced Configuration. A specific Advanced Configuration dialog will appear for each Gryphon network module.
NOTE: Refer to appendix A for additional information on the network modules.
Selecting the OK button will define the hardware settings and close the window. If the only feature you wish to work with is monitoring raw data on a network, you are now ready to do that by clicking the Start button and opening the Scrolling Monitor. To fully utilize the features of Hercules before starting the ONLINE session you can choose to define other windows such as the InPlace Monitor, Signal Monitor, TFT, Frame Responder, Filters and UCS. If you are using a database you may proceed to section 3.3. If you are not using a database you may proceed to section 4.
20
3.3 Database Menu
The Hercules program works with or without a database. The value of working with a database is that it provides a source of decoding messages in terms defined by the customer for transmitted and received messages on the networks. Once you have started Hercules application, you may select a translation database that is used during your session. The database translates frame acronyms and data into user-defined values.
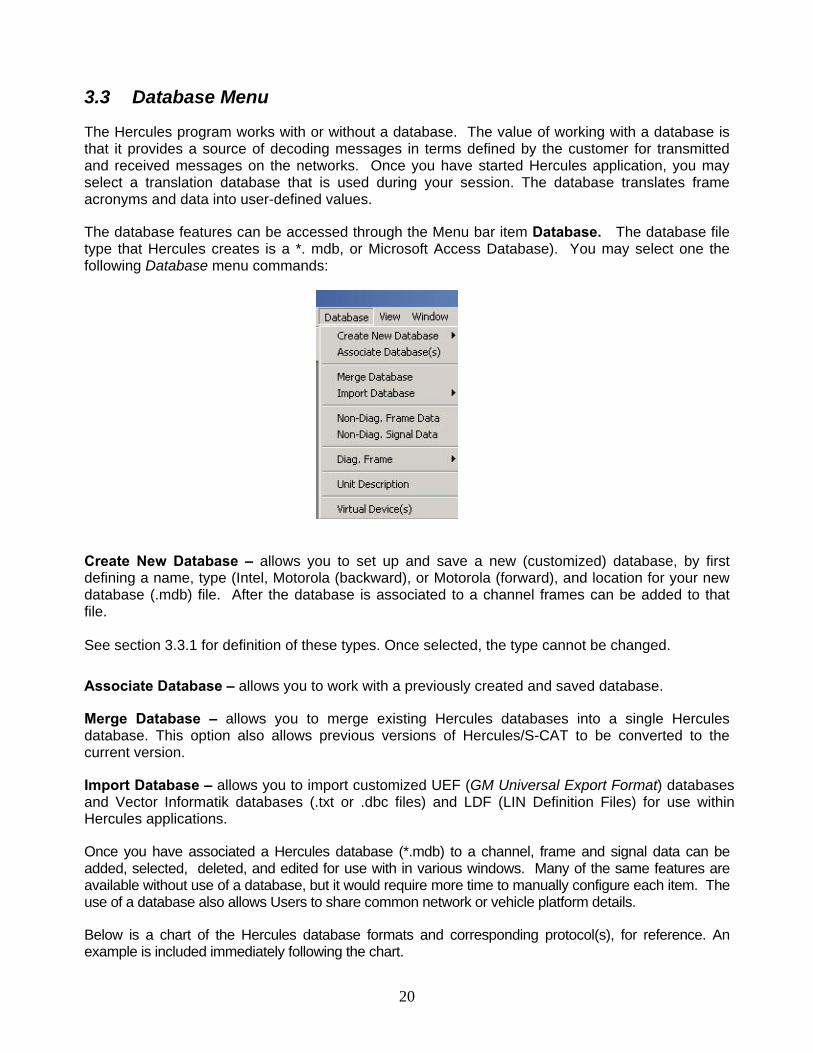
The database features can be accessed through the Menu bar item Database. The database file type that Hercules creates is a *. mdb, or Microsoft Access Database). You may select one the following Database menu commands:
Create New Database – allows you to set up and save a new (customized) database, by first defining a name, type (Intel, Motorola (backward), or Motorola (forward), and location for your new database (.mdb) file. After the database is associated to a channel frames can be added to that file. See section 3.3.1 for definition of these types. Once selected, the type cannot be changed.
Associate Database – allows you to work with a previously created and saved database.
Merge Database – allows you to merge existing Hercules databases into a single Hercules database. This option also allows previous versions of Hercules/S-CAT to be converted to the current version.
Import Database – allows you to import customized UEF (GM Universal Export Format) databases and Vector Informatik databases (.txt or .dbc files) and LDF (LIN Definition Files) for use within Hercules applications.
Once you have associated a Hercules database (*.mdb) to a channel, frame and signal data can be added, selected, deleted, and edited for use with in various windows. Many of the same features are available without use of a database, but it would require more time to manually configure each item. The use of a database also allows Users to share common network or vehicle platform details.
Below is a chart of the Hercules database formats and corresponding protocol(s), for reference. An example is included immediately following the chart.
21
3.3.1 Database Formats and Protocol
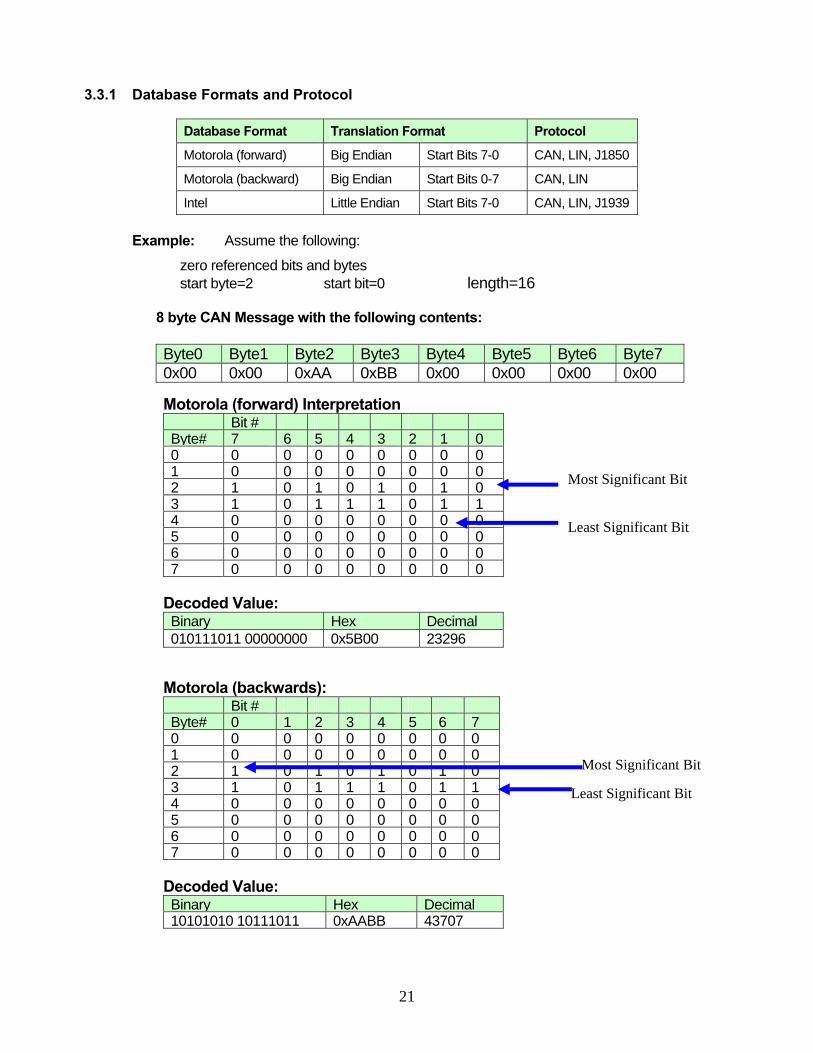
Database Format Translation Format Protocol
Motorola (forward) Big Endian Start Bits 7-0 CAN, LIN, J1850
Motorola (backward) Big Endian Start Bits 0-7 CAN, LIN
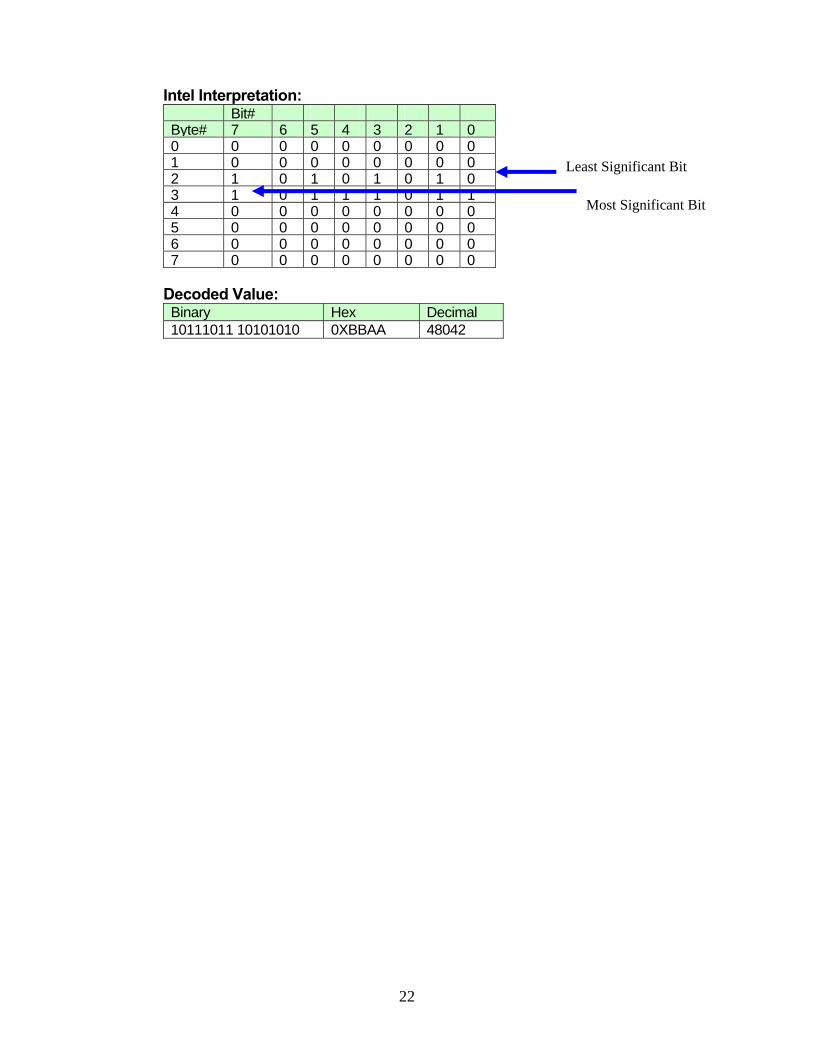
Intel Little Endian Start Bits 7-0 CAN, LIN, J1939 Example: Assume the following:
zero referenced bits and bytes start byte=2 start bit=0 length=16
8 byte CAN Message with the following contents:
Byte0 Byte1 Byte2 Byte3 Byte4 Byte5 Byte6 Byte7 0x00 0x00 0xAA 0xBB 0x00 0x00 0x00 0x00
Motorola (forward) Interpretation Bit # Byte# 7 6 5 4 3 2 1 00 0 0 0 0 0 0 0 01 0 0 0 0 0 0 0 02 1 0 1 0 1 0 1 03 1 0 1 1 1 0 1 14 0 0 0 0 0 0 0 05 0 0 0 0 0 0 0 06 0 0 0 0 0 0 0 07 0 0 0 0 0 0 0 0
Decoded Value: Binary Hex Decimal 010111011 00000000 0x5B00 23296
Motorola (backwards): Bit # Byte# 0 1 2 3 4 5 6 70 0 0 0 0 0 0 0 01 0 0 0 0 0 0 0 02 1 0 1 0 1 0 1 03 1 0 1 1 1 0 1 14 0 0 0 0 0 0 0 05 0 0 0 0 0 0 0 06 0 0 0 0 0 0 0 07 0 0 0 0 0 0 0 0
Decoded Value: Binary Hex Decimal 10101010 10111011 0xAABB 43707
Least Significant Bit
Most Significant Bit
Least Significant Bit
Most Significant Bit
22
Intel Interpretation: Bit# Byte# 7 6 5 4 3 2 1 00 0 0 0 0 0 0 0 01 0 0 0 0 0 0 0 02 1 0 1 0 1 0 1 0 3 1 0 1 1 1 0 1 14 0 0 0 0 0 0 0 05 0 0 0 0 0 0 0 06 0 0 0 0 0 0 0 07 0 0 0 0 0 0 0 0
Decoded Value: Binary Hex Decimal 10111011 10101010 0XBBAA 48042
Least Significant Bit
Most Significant Bit
23
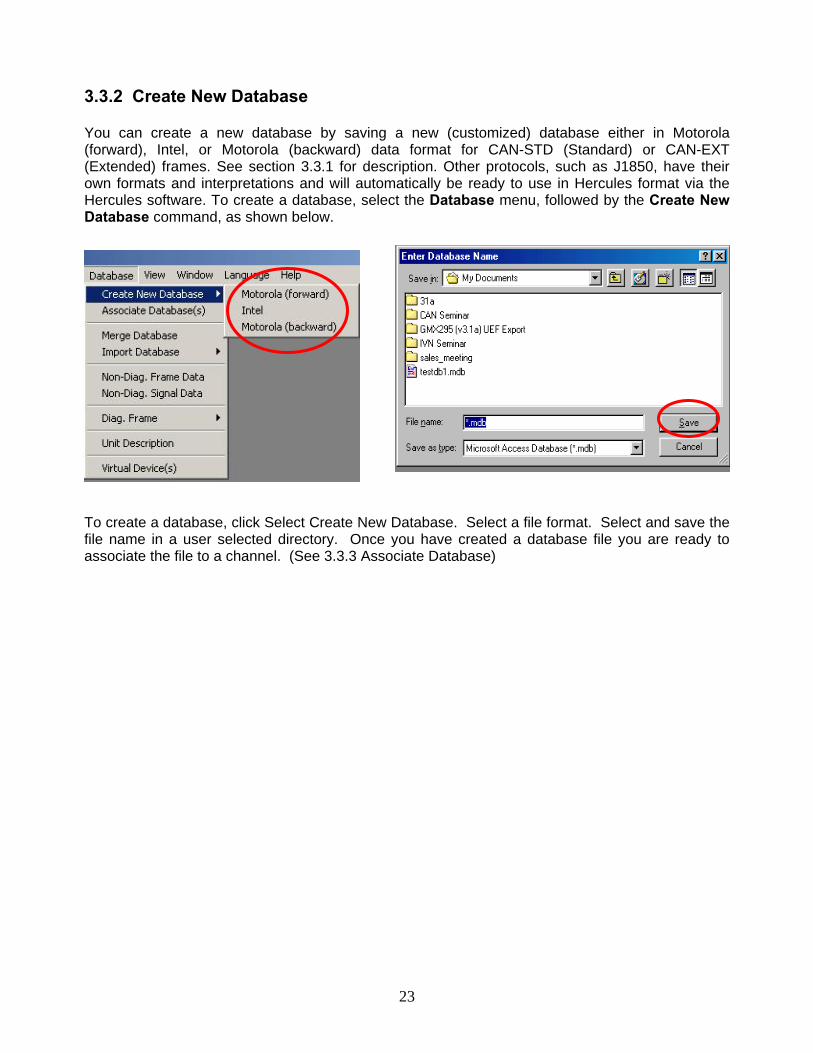
3.3.2 Create New Database You can create a new database by saving a new (customized) database either in Motorola (forward), Intel, or Motorola (backward) data format for CAN-STD (Standard) or CAN-EXT (Extended) frames. See section 3.3.1 for description. Other protocols, such as J1850, have their own formats and interpretations and will automatically be ready to use in Hercules format via the Hercules software. To create a database, select the Database menu, followed by the Create New Database command, as shown below.
To create a database, click Select Create New Database. Select a file format. Select and save the file name in a user selected directory. Once you have created a database file you are ready to associate the file to a channel. (See 3.3.3 Associate Database)
24
3.3.3 Associate Database(s)
Associate Database(s) lets you work with a previously created and saved database to interpret frames on assigned channels. You may select different databases for each channel or a single database may be assigned to all the channels. You should associate a database to each channel to which it applies. Frames and Signals can be selected, edited, or deleted from an associated database.
To ensure that you have the channels that you need for the monitoring session, please read through Section 3.2, Hardware Configuration.
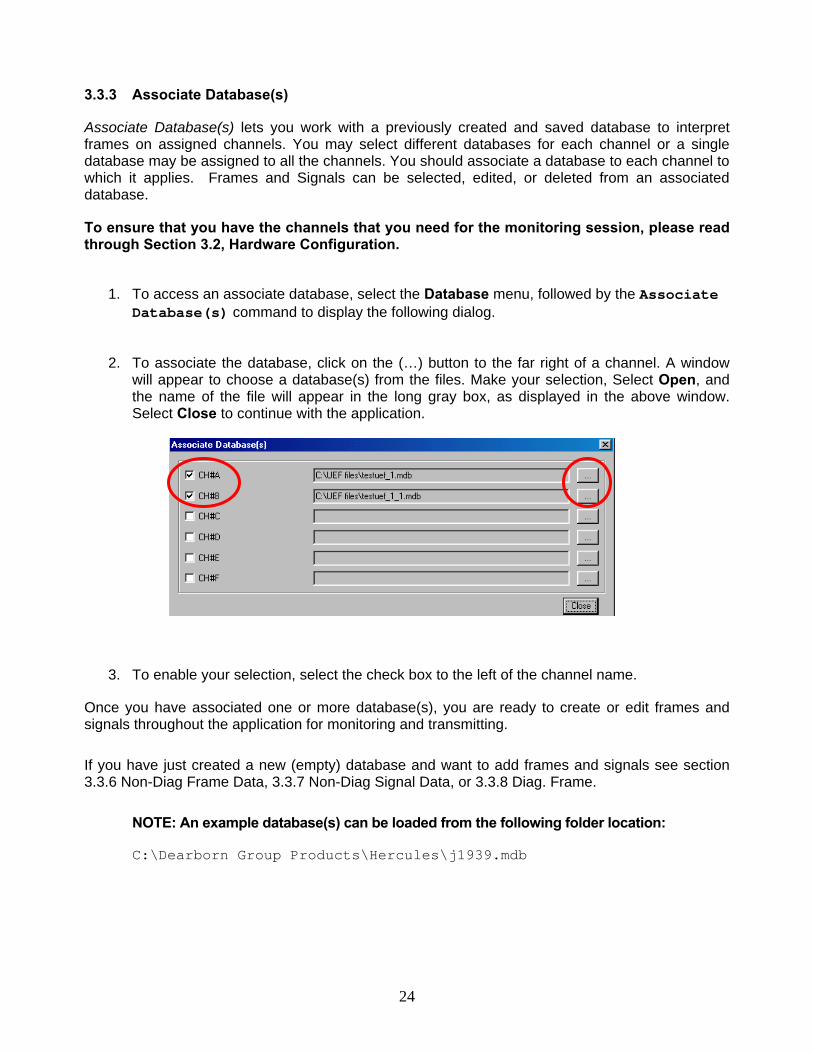
1. To access an associate database, select the Database menu, followed by the Associate Database(s) command to display the following dialog.
2. To associate the database, click on the (…) button to the far right of a channel. A window
will appear to choose a database(s) from the files. Make your selection, Select Open, and the name of the file will appear in the long gray box, as displayed in the above window. Select Close to continue with the application.
3. To enable your selection, select the check box to the left of the channel name.
Once you have associated one or more database(s), you are ready to create or edit frames and signals throughout the application for monitoring and transmitting.
If you have just created a new (empty) database and want to add frames and signals see section 3.3.6 Non-Diag Frame Data, 3.3.7 Non-Diag Signal Data, or 3.3.8 Diag. Frame.
NOTE: An example database(s) can be loaded from the following folder location:
C:\Dearborn Group Products\Hercules\j1939.mdb
25
3.3.4 Merge Database
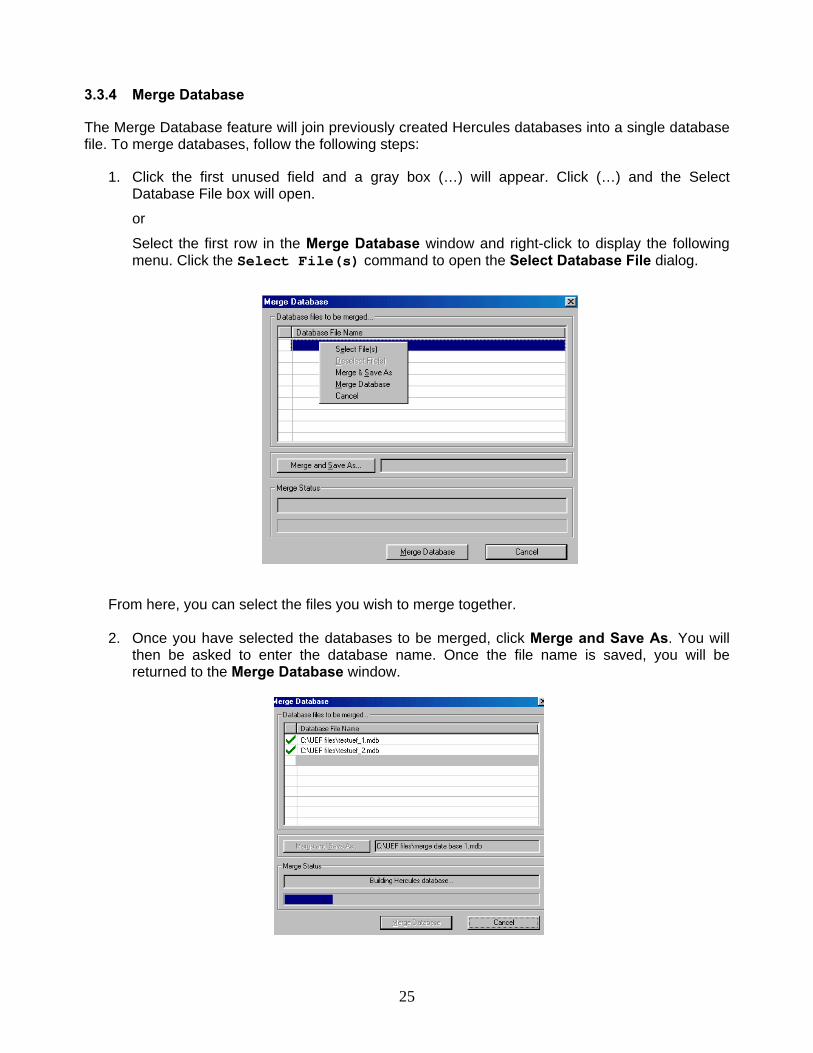
The Merge Database feature will join previously created Hercules databases into a single database file. To merge databases, follow the following steps:
1. Click the first unused field and a gray box (…) will appear. Click (…) and the Select Database File box will open.
or
Select the first row in the Merge Database window and right-click to display the following menu. Click the Select File(s) command to open the Select Database File dialog.
From here, you can select the files you wish to merge together.
2. Once you have selected the databases to be merged, click Merge and Save As. You will then be asked to enter the database name. Once the file name is saved, you will be returned to the Merge Database window.

26
3. The final step is to click Merge Database at the bottom of the window. The program will begin joining the databases you have selected, and the blue progress bar indicates the Merge Status is updating. Checkmarks will also appear next to each database to indicate whether each database was merged successfully.
Once the updating is complete, a message will appear to indicate if the database(s) were successfully merged. If an error occurs while merging databases (i.e., duplicate frames, signal overlaps, etc.), a message describing the error will appear and the merging process will terminate. If two or more databases have duplicate frames, the software will only read one of the frames, so no duplication will be sent during transmission.
27
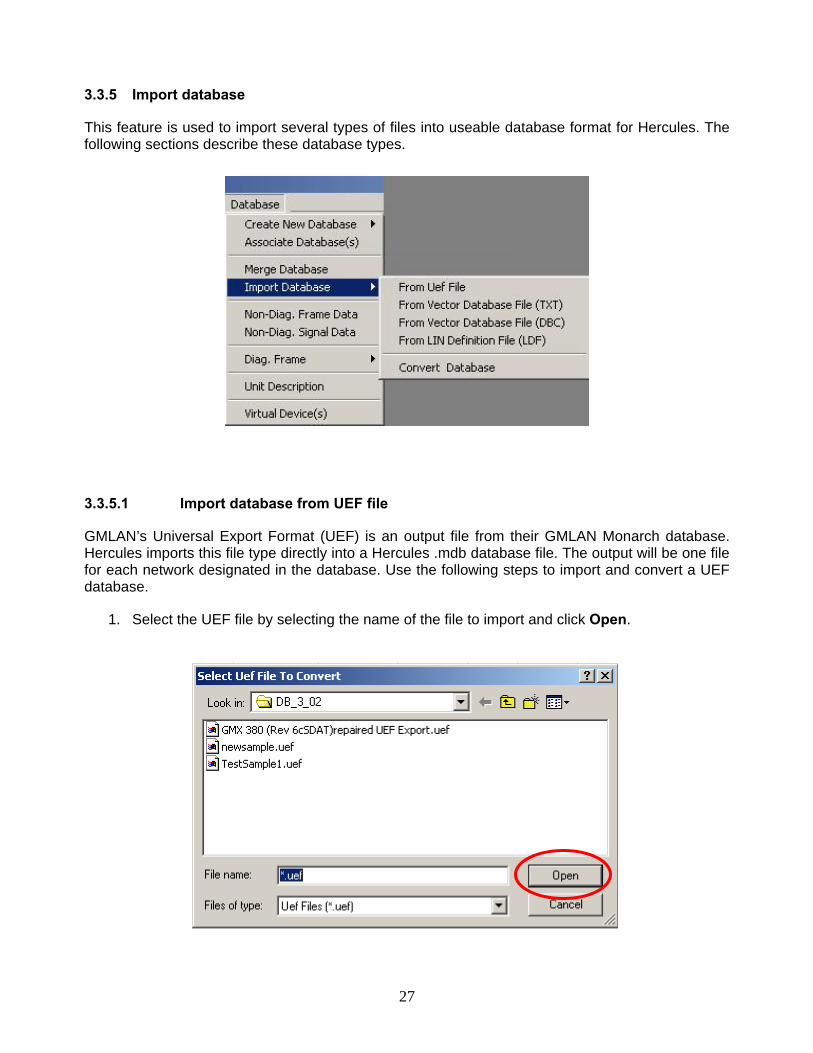
3.3.5 Import database
This feature is used to import several types of files into useable database format for Hercules. The following sections describe these database types.
3.3.5.1 Import database from UEF file
GMLAN’s Universal Export Format (UEF) is an output file from their GMLAN Monarch database. Hercules imports this file type directly into a Hercules .mdb database file. The output will be one file for each network designated in the database. Use the following steps to import and convert a UEF database.
1. Select the UEF file by selecting the name of the file to import and click Open.
28
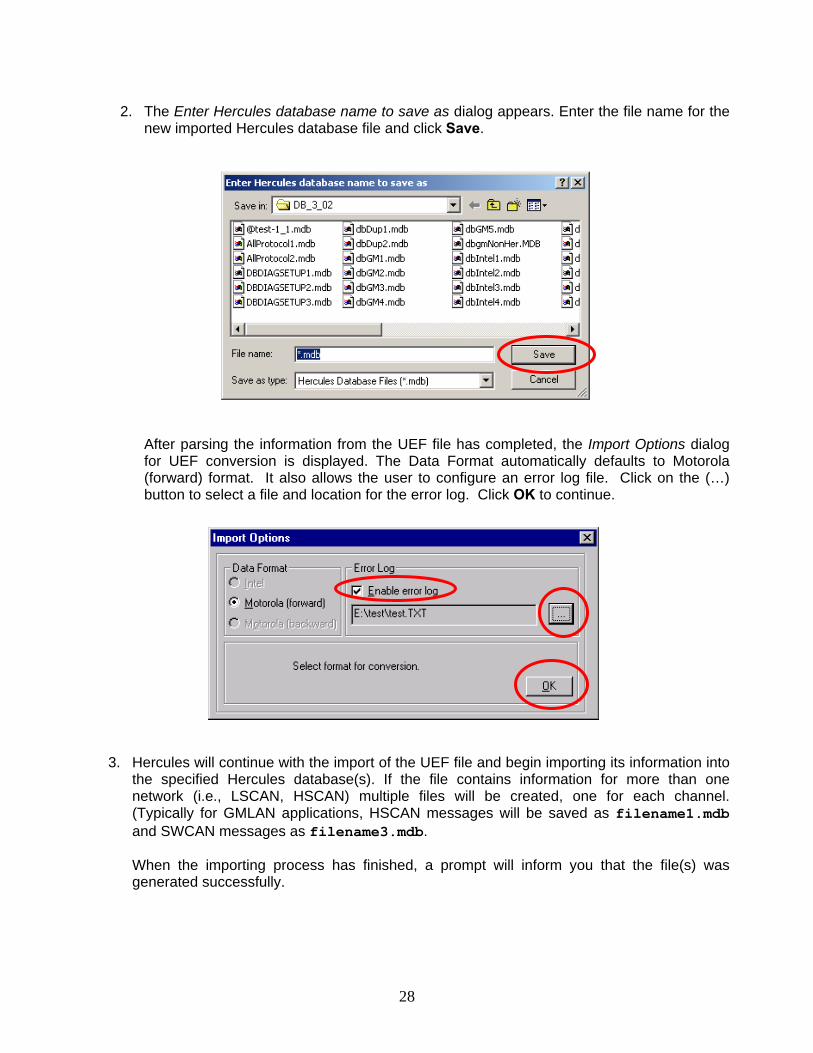
2. The Enter Hercules database name to save as dialog appears. Enter the file name for the
new imported Hercules database file and click Save.
After parsing the information from the UEF file has completed, the Import Options dialog for UEF conversion is displayed. The Data Format automatically defaults to Motorola (forward) format. It also allows the user to configure an error log file. Click on the (…) button to select a file and location for the error log. Click OK to continue.
3. Hercules will continue with the import of the UEF file and begin importing its information into the specified Hercules database(s). If the file contains information for more than one network (i.e., LSCAN, HSCAN) multiple files will be created, one for each channel. (Typically for GMLAN applications, HSCAN messages will be saved as filename1.mdb and SWCAN messages as filename3.mdb.
When the importing process has finished, a prompt will inform you that the file(s) was generated successfully.
29
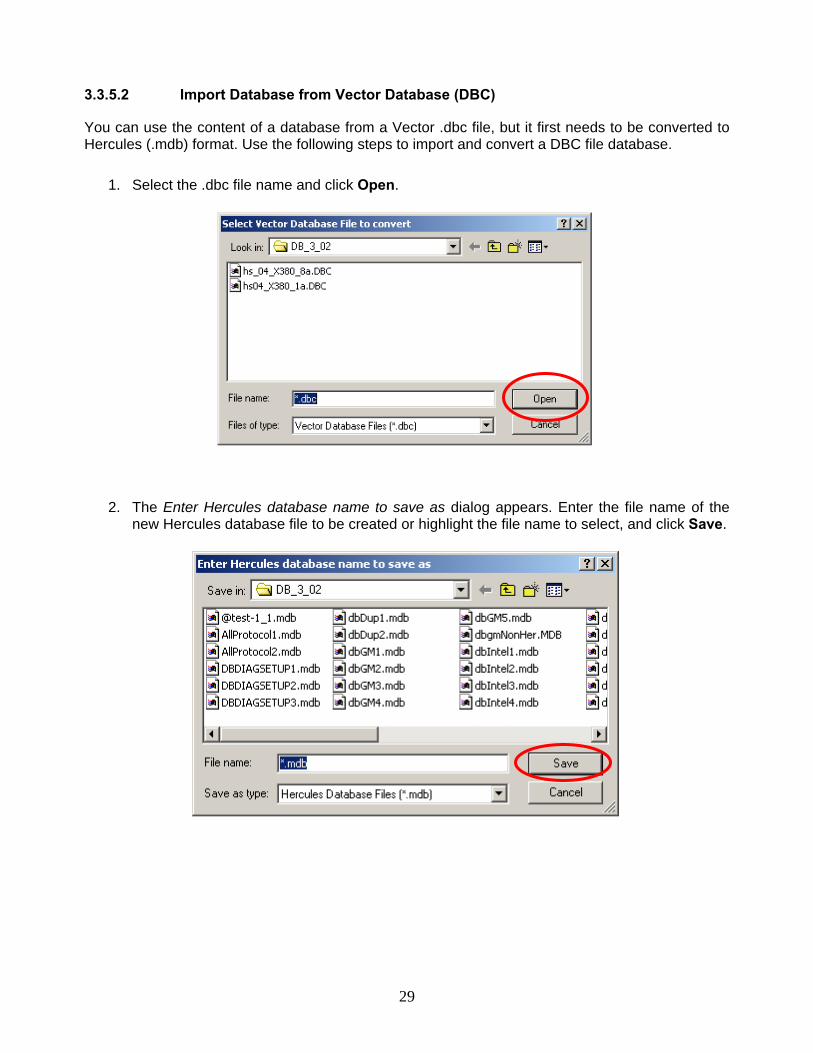
3.3.5.2 Import Database from Vector Database (DBC)
You can use the content of a database from a Vector .dbc file, but it first needs to be converted to Hercules (.mdb) format. Use the following steps to import and convert a DBC file database.
1. Select the .dbc file name and click Open.
2. The Enter Hercules database name to save as dialog appears. Enter the file name of the new Hercules database file to be created or highlight the file name to select, and click Save.
30
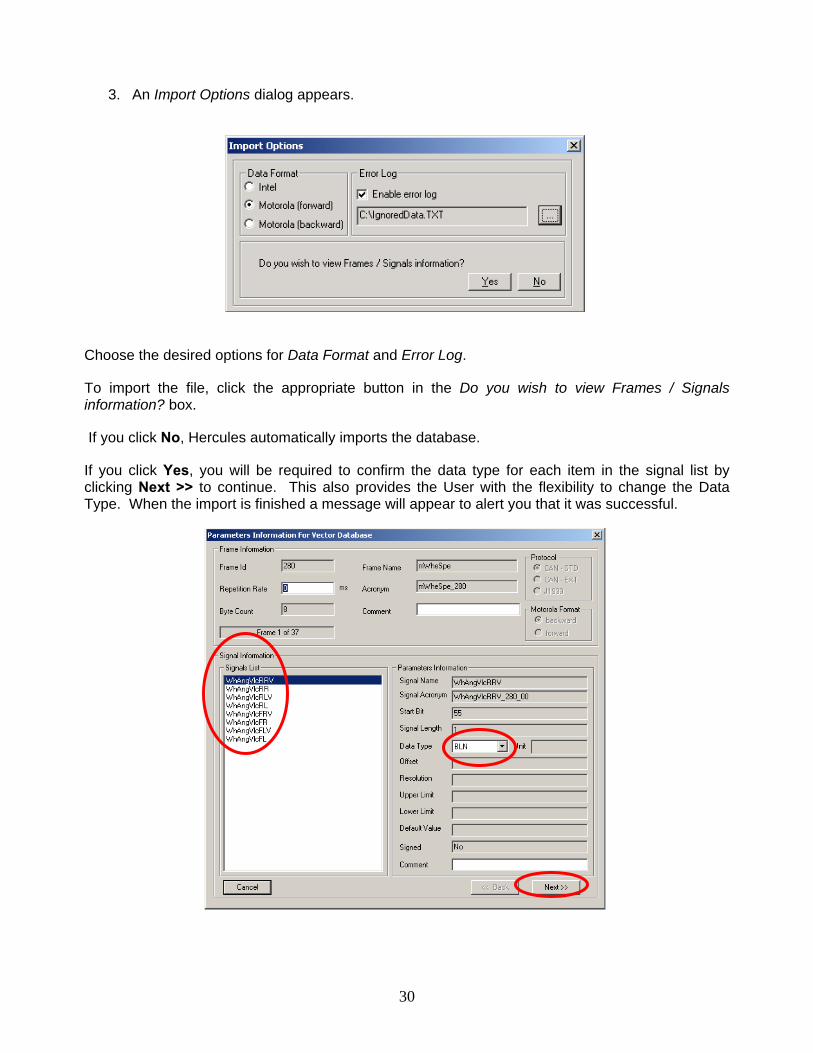
3. An Import Options dialog appears.
Choose the desired options for Data Format and Error Log.
To import the file, click the appropriate button in the Do you wish to view Frames / Signals information? box.
If you click No, Hercules automatically imports the database.
If you click Yes, you will be required to confirm the data type for each item in the signal list by clicking Next >> to continue. This also provides the User with the flexibility to change the Data Type. When the import is finished a message will appear to alert you that it was successful.
31
3.3.5.3 Import Database from Vector database (TXT)
This feature is no longer needed due to the implementation of the Import Database from Vector database (DBC) feature.
3.3.5.4 Import Database from LIN Definition file (LDF)
Hercules imports the LIN Definition file type directly into a Hercules .mdb database file. Use the following steps to import and convert a LDF file.
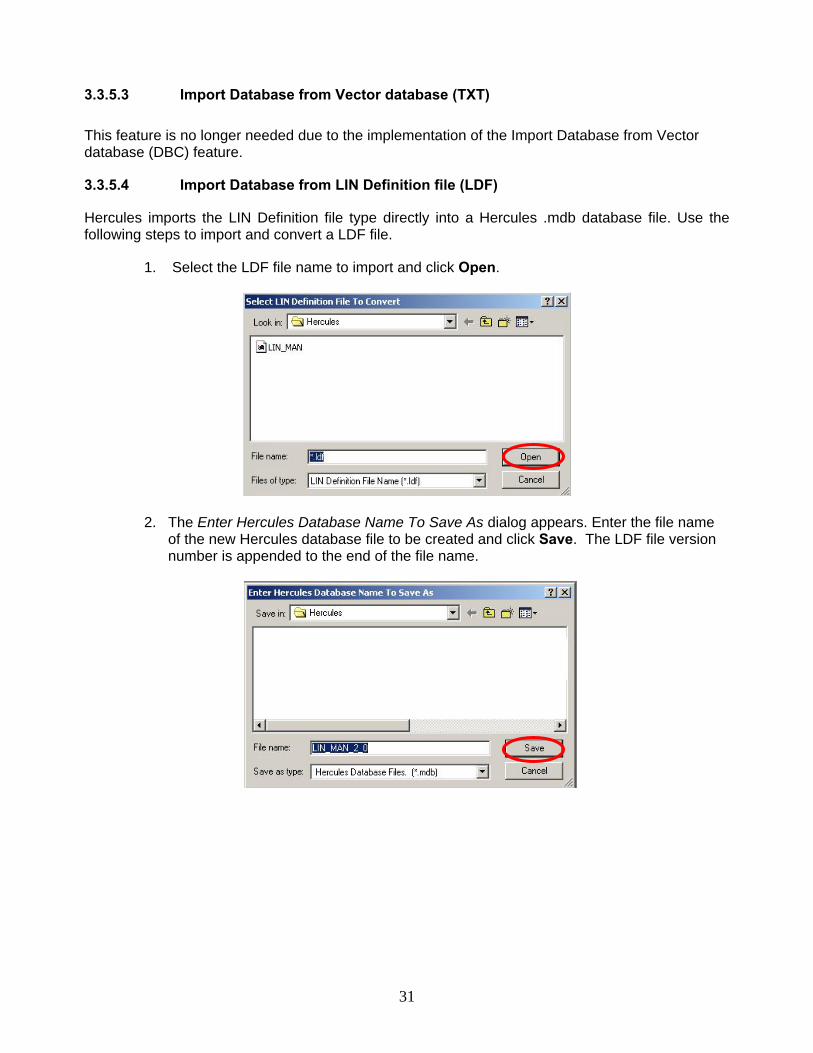
1. Select the LDF file name to import and click Open.
2. The Enter Hercules Database Name To Save As dialog appears. Enter the file name of the new Hercules database file to be created and click Save. The LDF file version number is appended to the end of the file name.
32
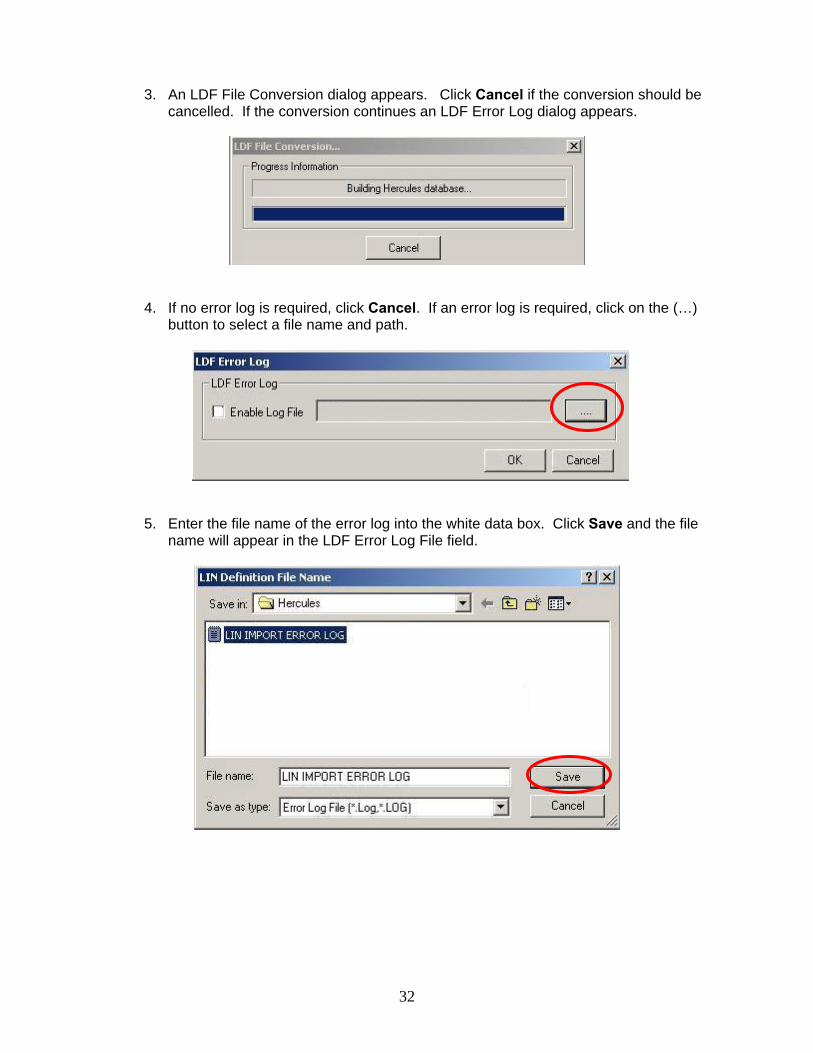
3. An LDF File Conversion dialog appears. Click Cancel if the conversion should be cancelled. If the conversion continues an LDF Error Log dialog appears.
4. If no error log is required, click Cancel. If an error log is required, click on the (…)
button to select a file name and path.
5. Enter the file name of the error log into the white data box. Click Save and the file
name will appear in the LDF Error Log File field.
33
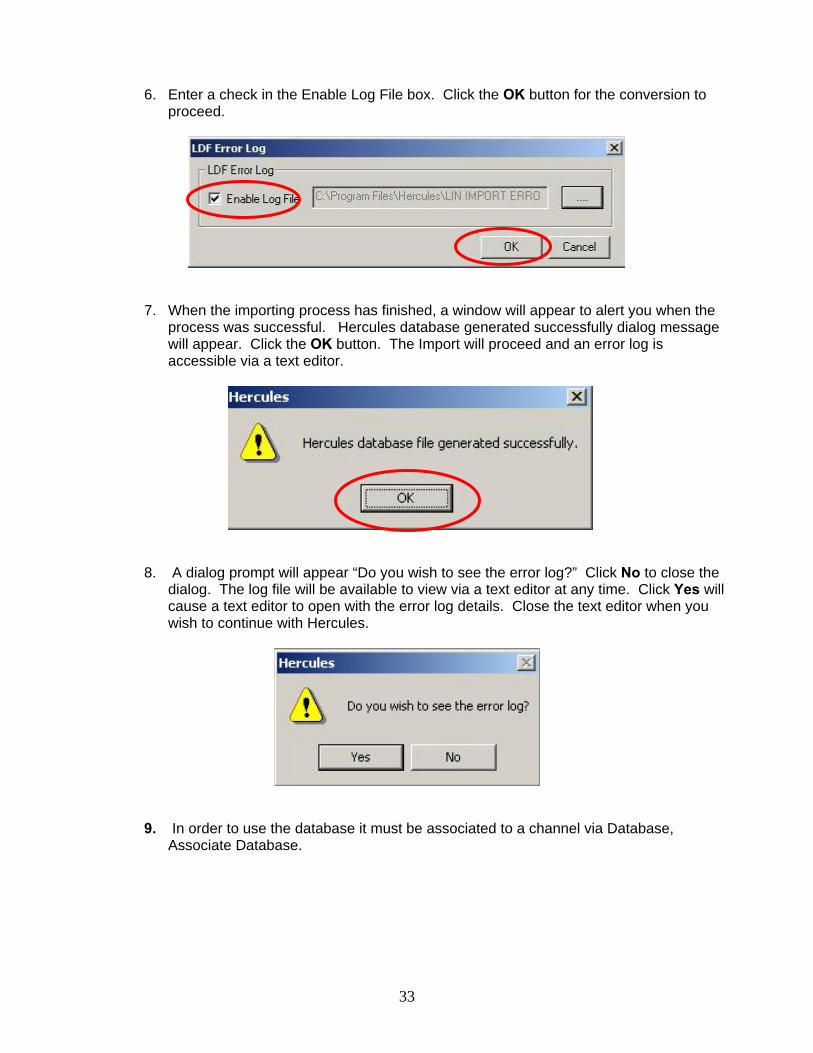
6. Enter a check in the Enable Log File box. Click the OK button for the conversion to proceed.
7. When the importing process has finished, a window will appear to alert you when the
process was successful. Hercules database generated successfully dialog message will appear. Click the OK button. The Import will proceed and an error log is accessible via a text editor.
8. A dialog prompt will appear “Do you wish to see the error log?” Click No to close the
dialog. The log file will be available to view via a text editor at any time. Click Yes will cause a text editor to open with the error log details. Close the text editor when you wish to continue with Hercules.
9. In order to use the database it must be associated to a channel via Database, Associate Database.
34
Convert Database To convert a previous-version database, simply select the database from the files, and the Hercules software will convert the file, from a previous Hercules version, to the current Hercules .mdb database format. Multiple databases will be created; one for each channel existing in the previous database.
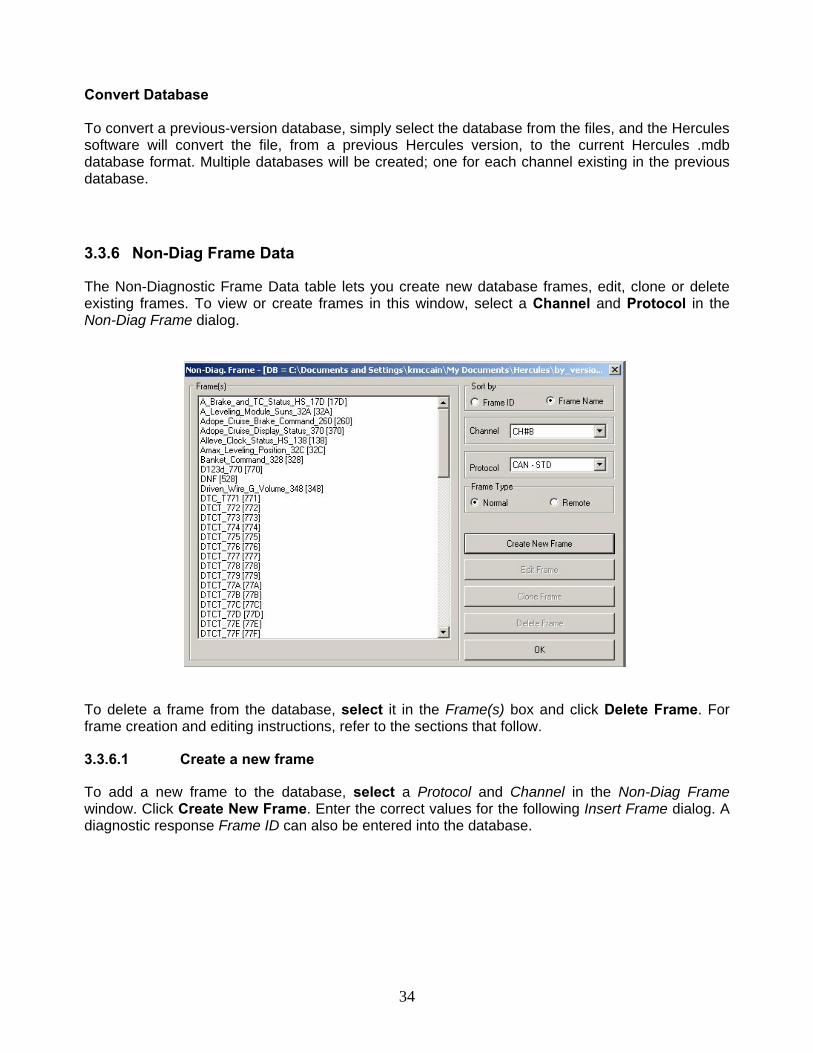
3.3.6 Non-Diag Frame Data
The Non-Diagnostic Frame Data table lets you create new database frames, edit, clone or delete existing frames. To view or create frames in this window, select a Channel and Protocol in the Non-Diag Frame dialog.
To delete a frame from the database, select it in the Frame(s) box and click Delete Frame. For frame creation and editing instructions, refer to the sections that follow.
3.3.6.1 Create a new frame
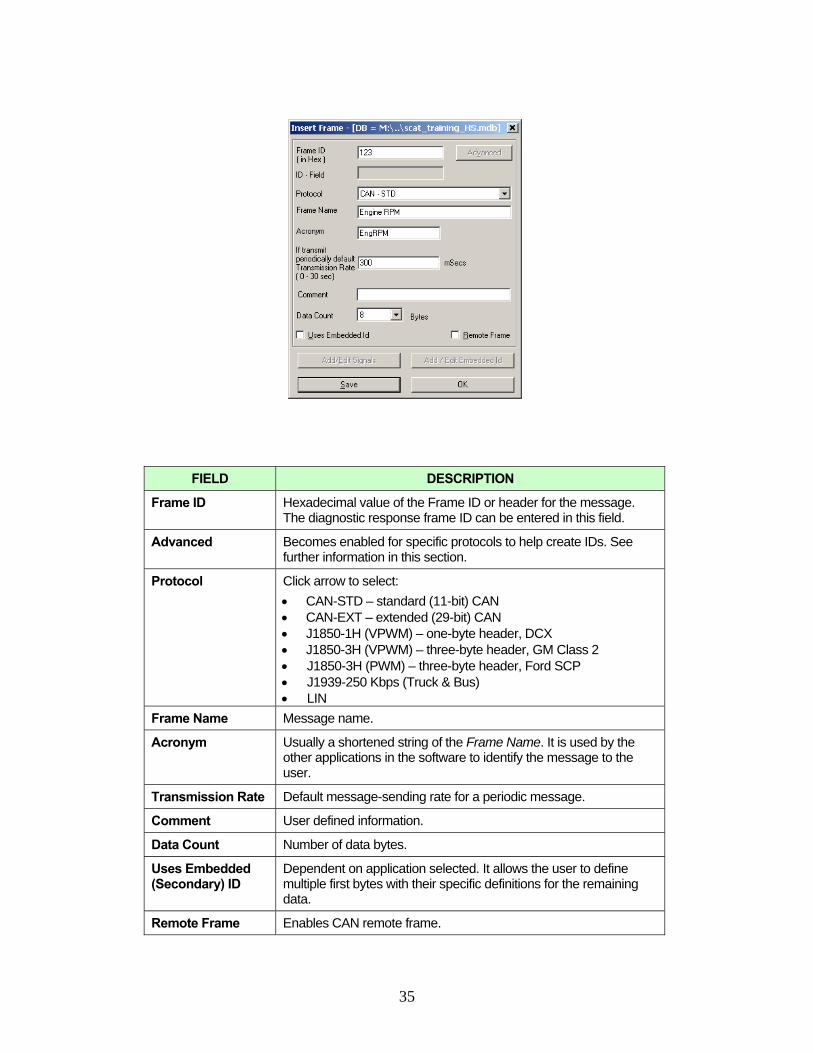
To add a new frame to the database, select a Protocol and Channel in the Non-Diag Frame window. Click Create New Frame. Enter the correct values for the following Insert Frame dialog. A diagnostic response Frame ID can also be entered into the database.
35
FIELD DESCRIPTION
Frame ID Hexadecimal value of the Frame ID or header for the message. The diagnostic response frame ID can be entered in this field.
Advanced Becomes enabled for specific protocols to help create IDs. See further information in this section.
Protocol Click arrow to select: • CAN-STD – standard (11-bit) CAN • CAN-EXT – extended (29-bit) CAN • J1850-1H (VPWM) – one-byte header, DCX • J1850-3H (VPWM) – three-byte header, GM Class 2 • J1850-3H (PWM) – three-byte header, Ford SCP • J1939-250 Kbps (Truck & Bus) • LIN
Frame Name Message name.
Acronym Usually a shortened string of the Frame Name. It is used by the other applications in the software to identify the message to the user.
Transmission Rate Default message-sending rate for a periodic message.
Comment User defined information.
Data Count Number of data bytes.
Uses Embedded (Secondary) ID
Dependent on application selected. It allows the user to define multiple first bytes with their specific definitions for the remaining data.
Remote Frame Enables CAN remote frame.
36
Once you click Save, you will be able to access Add/Edit Embedded (Secondary) Id (if this option was selected) and/or Add/Edit Signals. (See section 3.3.7 for information on how to edit signals).
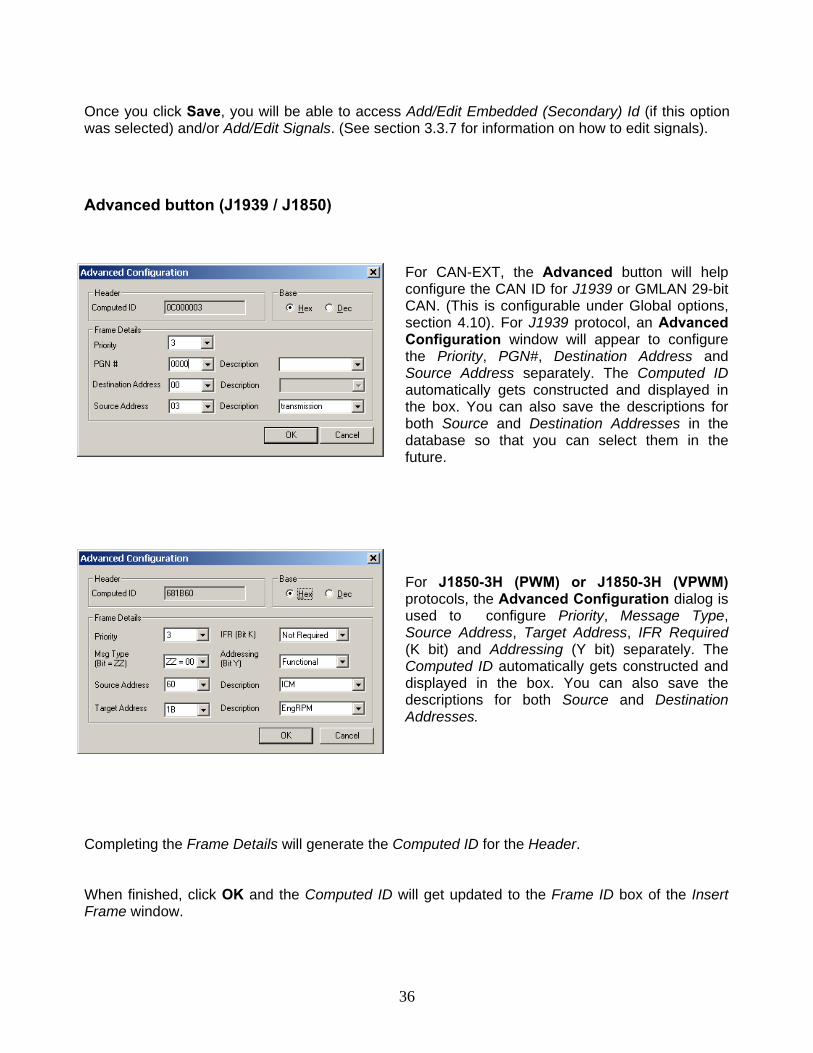
Advanced button (J1939 / J1850)
For CAN-EXT, the Advanced button will help configure the CAN ID for J1939 or GMLAN 29-bit CAN. (This is configurable under Global options, section 4.10). For J1939 protocol, an Advanced Configuration window will appear to configure the Priority, PGN#, Destination Address and Source Address separately. The Computed ID automatically gets constructed and displayed in the box. You can also save the descriptions for both Source and Destination Addresses in the database so that you can select them in the future.
For J1850-3H (PWM) or J1850-3H (VPWM) protocols, the Advanced Configuration dialog is used to configure Priority, Message Type, Source Address, Target Address, IFR Required (K bit) and Addressing (Y bit) separately. The Computed ID automatically gets constructed and displayed in the box. You can also save the descriptions for both Source and Destination Addresses.
Completing the Frame Details will generate the Computed ID for the Header. When finished, click OK and the Computed ID will get updated to the Frame ID box of the Insert Frame window.
37
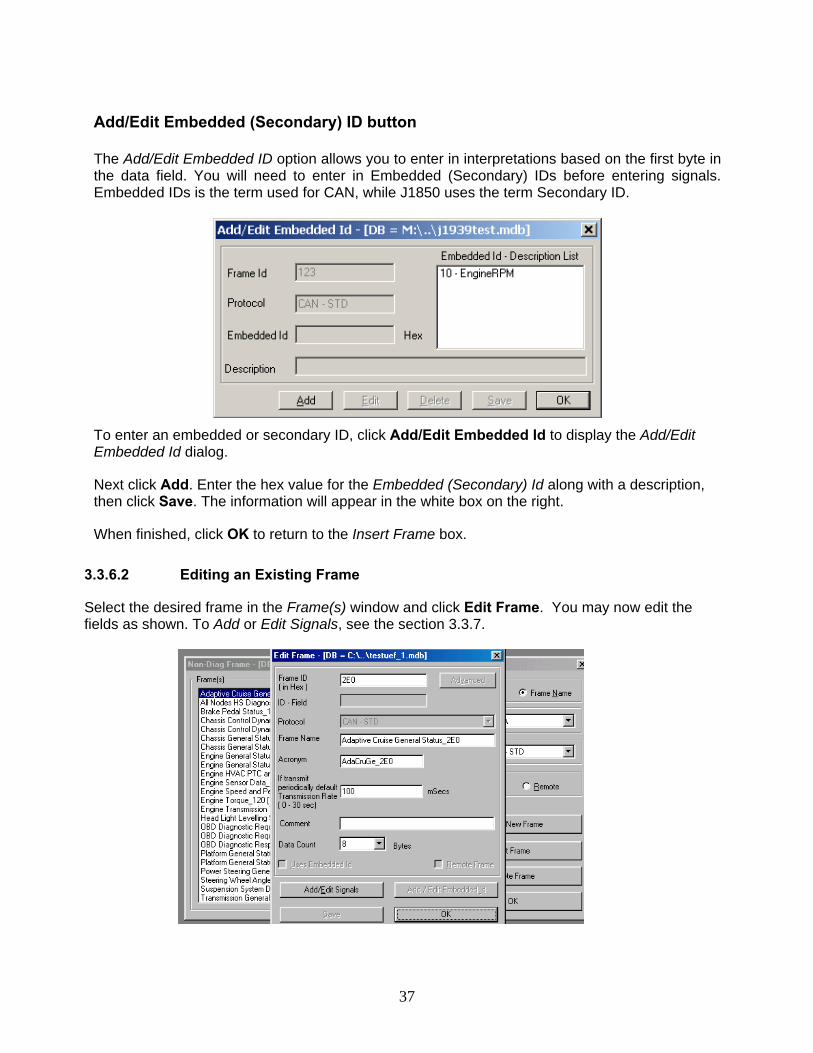
Add/Edit Embedded (Secondary) ID button
The Add/Edit Embedded ID option allows you to enter in interpretations based on the first byte in the data field. You will need to enter in Embedded (Secondary) IDs before entering signals. Embedded IDs is the term used for CAN, while J1850 uses the term Secondary ID.
To enter an embedded or secondary ID, click Add/Edit Embedded Id to display the Add/Edit Embedded Id dialog.
Next click Add. Enter the hex value for the Embedded (Secondary) Id along with a description, then click Save. The information will appear in the white box on the right.
When finished, click OK to return to the Insert Frame box.
3.3.6.2 Editing an Existing Frame
Select the desired frame in the Frame(s) window and click Edit Frame. You may now edit the fields as shown. To Add or Edit Signals, see the section 3.3.7.
38
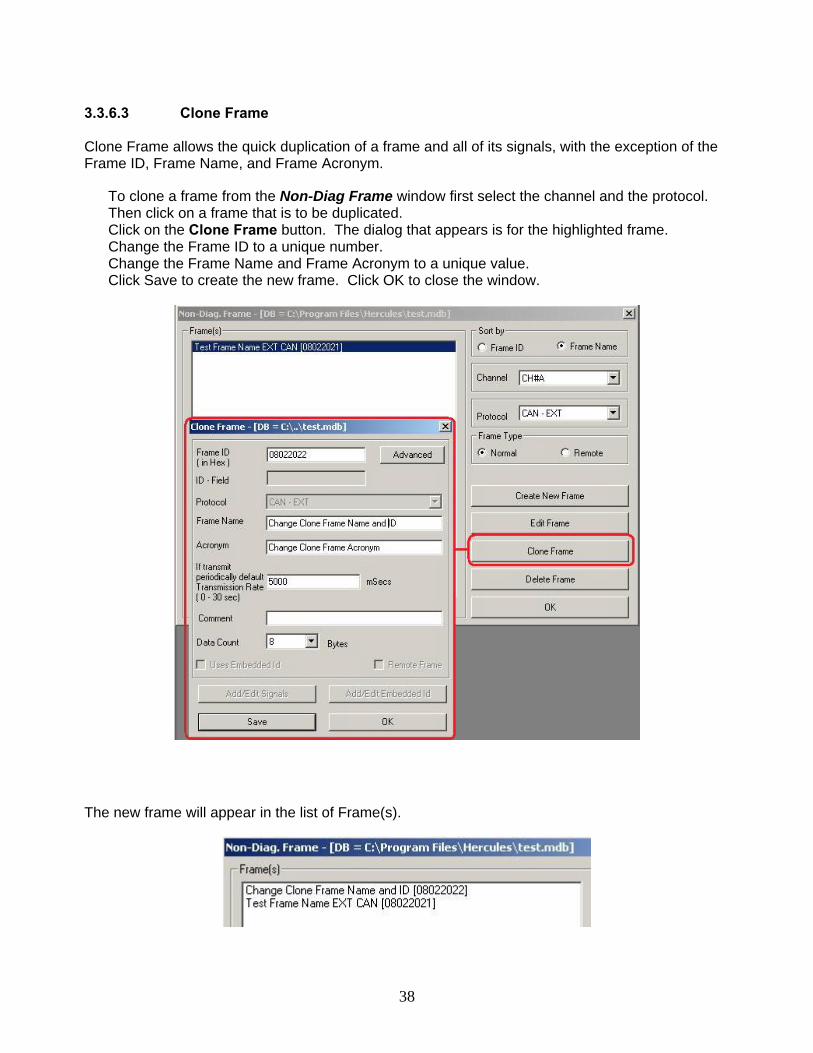
3.3.6.3 Clone Frame Clone Frame allows the quick duplication of a frame and all of its signals, with the exception of the Frame ID, Frame Name, and Frame Acronym.
To clone a frame from the Non-Diag Frame window first select the channel and the protocol. Then click on a frame that is to be duplicated. Click on the Clone Frame button. The dialog that appears is for the highlighted frame. Change the Frame ID to a unique number. Change the Frame Name and Frame Acronym to a unique value. Click Save to create the new frame. Click OK to close the window.
The new frame will appear in the list of Frame(s).
39
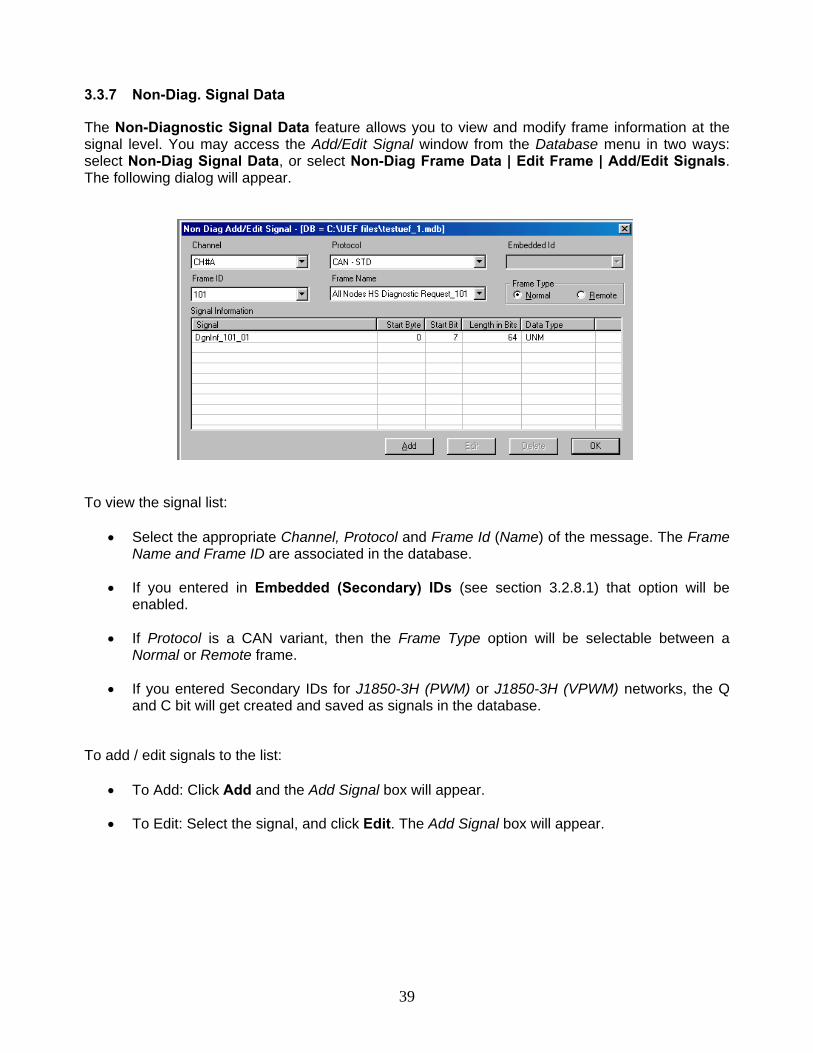
3.3.7 Non-Diag. Signal Data
The Non-Diagnostic Signal Data feature allows you to view and modify frame information at the signal level. You may access the Add/Edit Signal window from the Database menu in two ways: select Non-Diag Signal Data, or select Non-Diag Frame Data | Edit Frame | Add/Edit Signals. The following dialog will appear.
To view the signal list:
• Select the appropriate Channel, Protocol and Frame Id (Name) of the message. The Frame Name and Frame ID are associated in the database.
• If you entered in Embedded (Secondary) IDs (see section 3.2.8.1) that option will be enabled.
• If Protocol is a CAN variant, then the Frame Type option will be selectable between a Normal or Remote frame.
• If you entered Secondary IDs for J1850-3H (PWM) or J1850-3H (VPWM) networks, the Q and C bit will get created and saved as signals in the database.
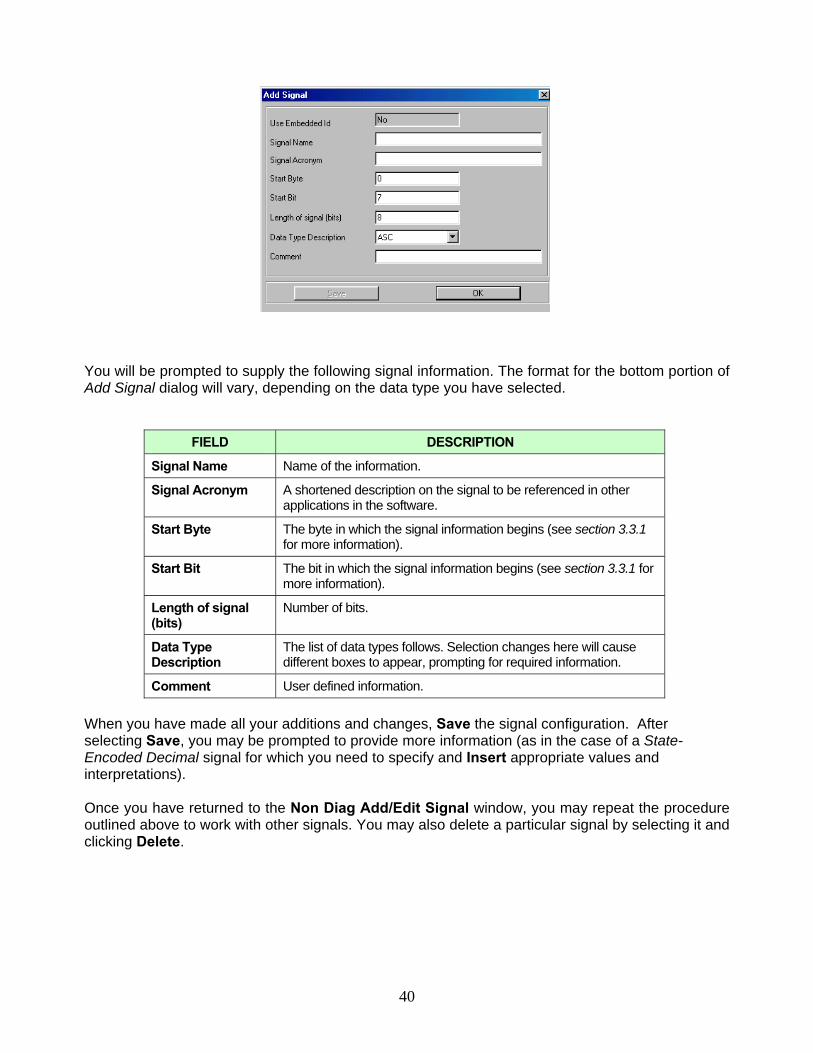
To add / edit signals to the list:
• To Add: Click Add and the Add Signal box will appear.
• To Edit: Select the signal, and click Edit. The Add Signal box will appear.
40
You will be prompted to supply the following signal information. The format for the bottom portion of Add Signal dialog will vary, depending on the data type you have selected.
FIELD DESCRIPTION
Signal Name Name of the information.
Signal Acronym A shortened description on the signal to be referenced in other applications in the software.
Start Byte The byte in which the signal information begins (see section 3.3.1 for more information).
Start Bit The bit in which the signal information begins (see section 3.3.1 for more information).
Length of signal (bits)
Number of bits.
Data Type Description
The list of data types follows. Selection changes here will cause different boxes to appear, prompting for required information.
Comment User defined information. When you have made all your additions and changes, Save the signal configuration. After selecting Save, you may be prompted to provide more information (as in the case of a State-Encoded Decimal signal for which you need to specify and Insert appropriate values and interpretations). Once you have returned to the Non Diag Add/Edit Signal window, you may repeat the procedure outlined above to work with other signals. You may also delete a particular signal by selecting it and clicking Delete.
41
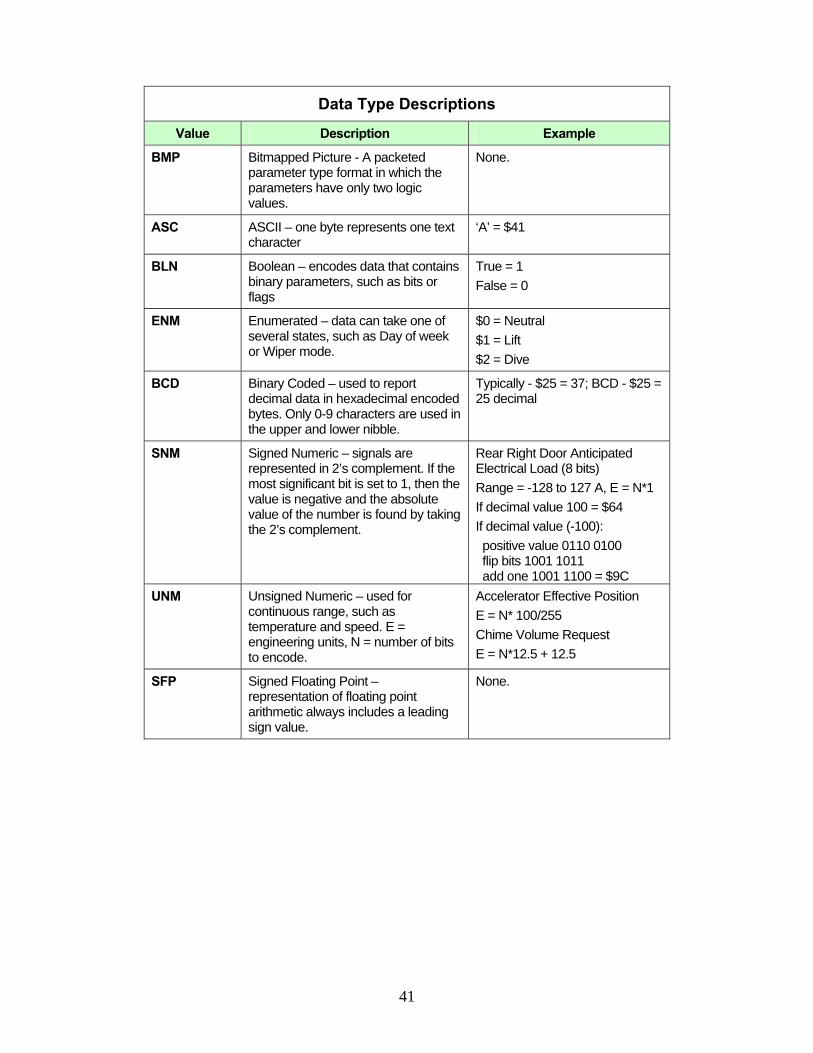
Data Type Descriptions
Value Description Example
BMP Bitmapped Picture - A packeted parameter type format in which the parameters have only two logic values.
None.
ASC ASCII – one byte represents one text character
‘A’ = $41
BLN Boolean – encodes data that contains binary parameters, such as bits or flags
True = 1 False = 0
ENM Enumerated – data can take one of several states, such as Day of week or Wiper mode.
$0 = Neutral $1 = Lift $2 = Dive
BCD Binary Coded – used to report decimal data in hexadecimal encoded bytes. Only 0-9 characters are used in the upper and lower nibble.
Typically - $25 = 37; BCD - $25 = 25 decimal
SNM Signed Numeric – signals are represented in 2’s complement. If the most significant bit is set to 1, then the value is negative and the absolute value of the number is found by taking the 2’s complement.
Rear Right Door Anticipated Electrical Load (8 bits) Range = -128 to 127 A, E = N*1 If decimal value 100 = $64 If decimal value (-100): positive value 0110 0100 flip bits 1001 1011 add one 1001 1100 = $9C
UNM Unsigned Numeric – used for continuous range, such as temperature and speed. E = engineering units, N = number of bits to encode.
Accelerator Effective Position E = N* 100/255 Chime Volume Request E = N*12.5 + 12.5
SFP Signed Floating Point – representation of floating point arithmetic always includes a leading sign value.
None.
42
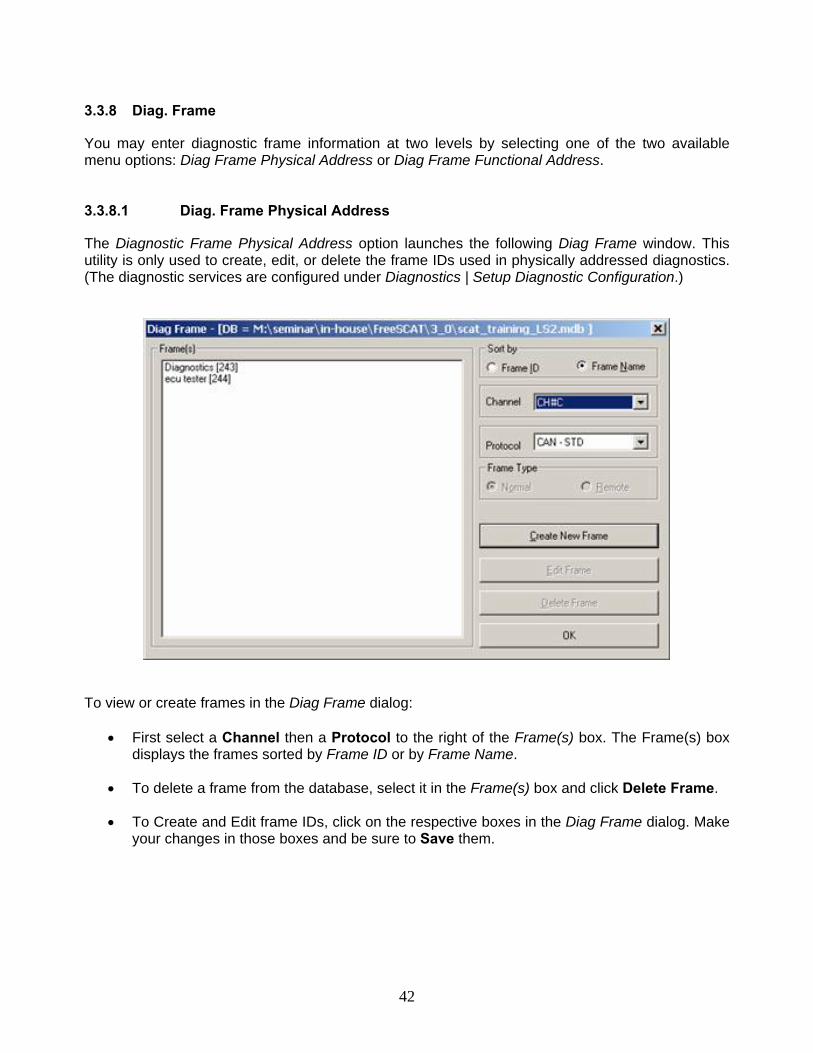
3.3.8 Diag. Frame
You may enter diagnostic frame information at two levels by selecting one of the two available menu options: Diag Frame Physical Address or Diag Frame Functional Address. 3.3.8.1 Diag. Frame Physical Address
The Diagnostic Frame Physical Address option launches the following Diag Frame window. This utility is only used to create, edit, or delete the frame IDs used in physically addressed diagnostics. (The diagnostic services are configured under Diagnostics | Setup Diagnostic Configuration.)
To view or create frames in the Diag Frame dialog:
• First select a Channel then a Protocol to the right of the Frame(s) box. The Frame(s) box displays the frames sorted by Frame ID or by Frame Name.
• To delete a frame from the database, select it in the Frame(s) box and click Delete Frame.
• To Create and Edit frame IDs, click on the respective boxes in the Diag Frame dialog. Make your changes in those boxes and be sure to Save them.
43
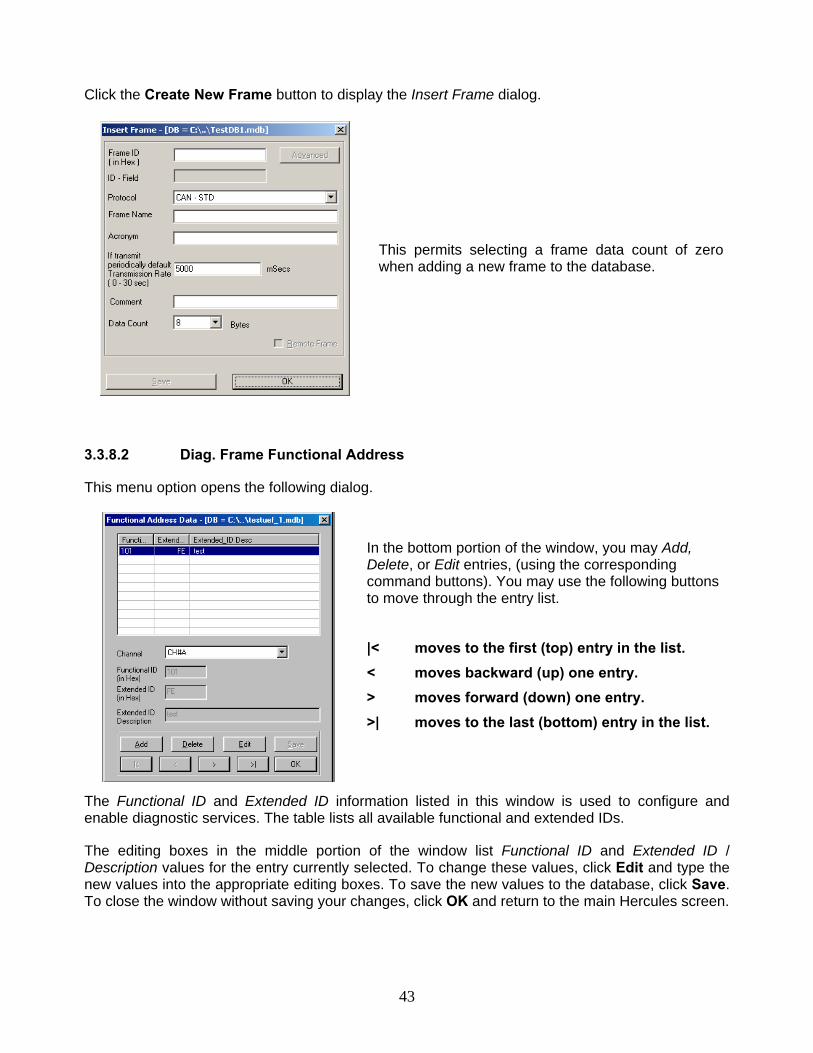
Click the Create New Frame button to display the Insert Frame dialog.
This permits selecting a frame data count of zero when adding a new frame to the database.
3.3.8.2 Diag. Frame Functional Address
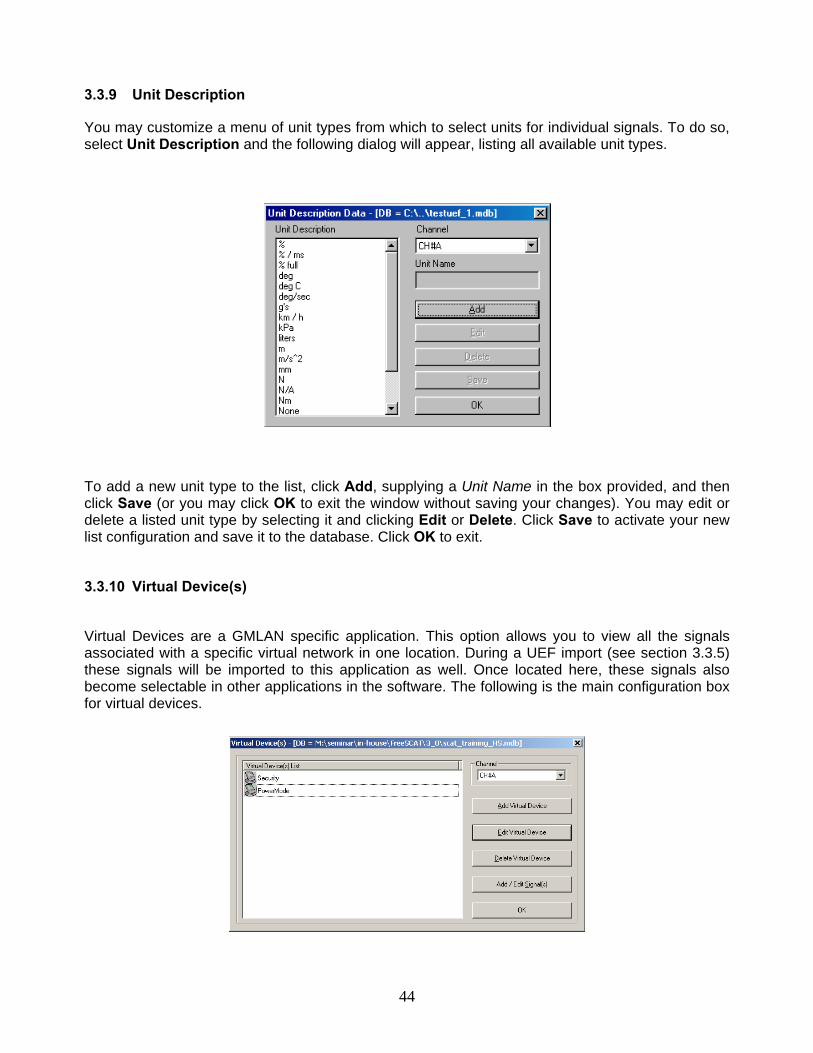
This menu option opens the following dialog.
In the bottom portion of the window, you may Add, Delete, or Edit entries, (using the corresponding command buttons). You may use the following buttons to move through the entry list.
|< moves to the first (top) entry in the list. < moves backward (up) one entry. > moves forward (down) one entry. >| moves to the last (bottom) entry in the list.
The Functional ID and Extended ID information listed in this window is used to configure and enable diagnostic services. The table lists all available functional and extended IDs.
The editing boxes in the middle portion of the window list Functional ID and Extended ID / Description values for the entry currently selected. To change these values, click Edit and type the new values into the appropriate editing boxes. To save the new values to the database, click Save. To close the window without saving your changes, click OK and return to the main Hercules screen.
44
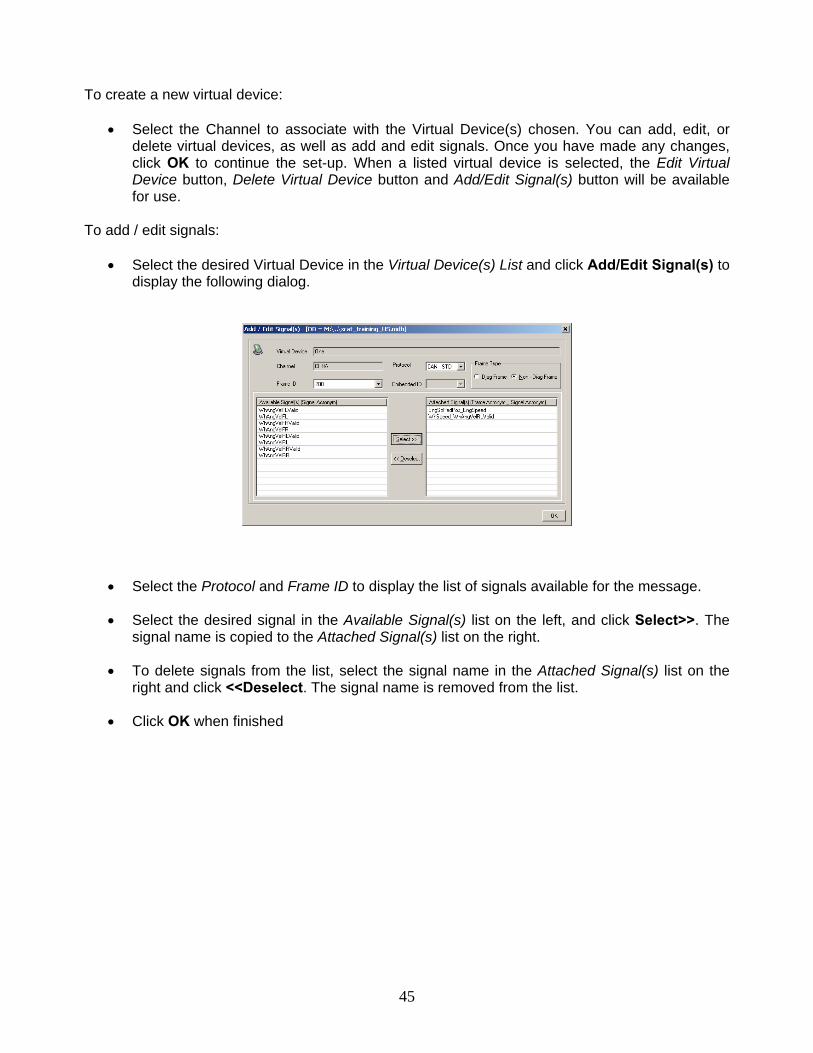
3.3.9 Unit Description
You may customize a menu of unit types from which to select units for individual signals. To do so, select Unit Description and the following dialog will appear, listing all available unit types.
To add a new unit type to the list, click Add, supplying a Unit Name in the box provided, and then click Save (or you may click OK to exit the window without saving your changes). You may edit or delete a listed unit type by selecting it and clicking Edit or Delete. Click Save to activate your new list configuration and save it to the database. Click OK to exit.
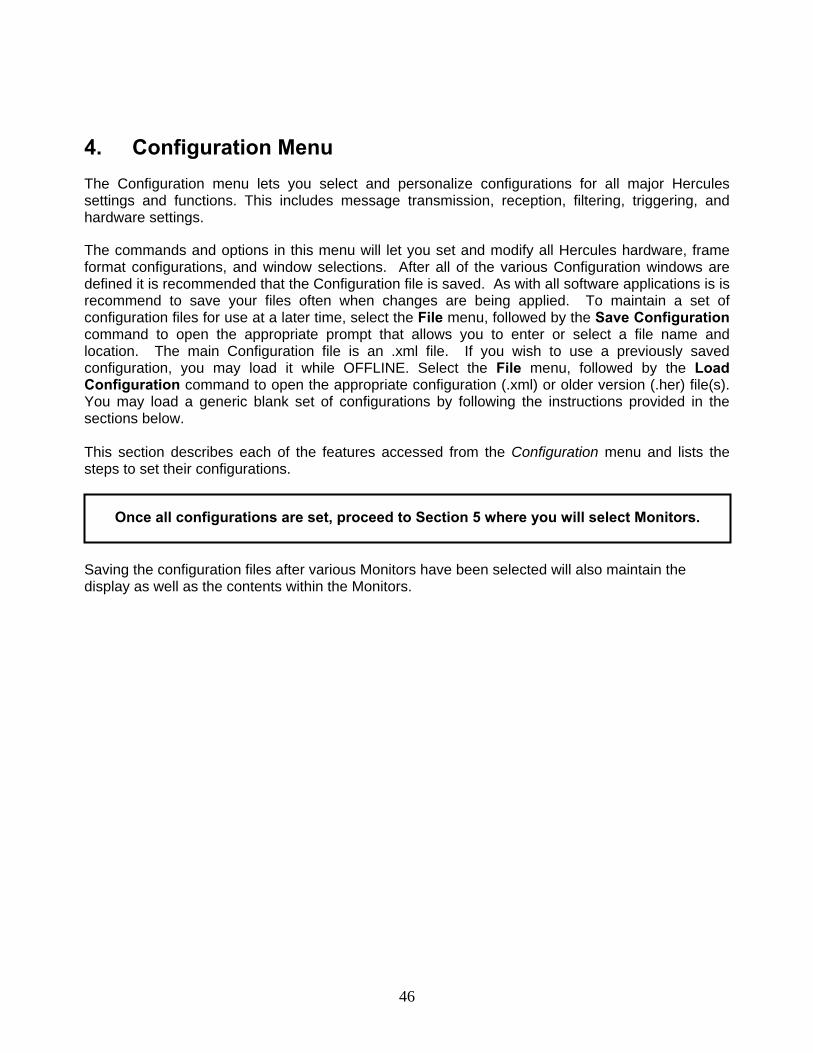
3.3.10 Virtual Device(s)
Virtual Devices are a GMLAN specific application. This option allows you to view all the signals associated with a specific virtual network in one location. During a UEF import (see section 3.3.5) these signals will be imported to this application as well. Once located here, these signals also become selectable in other applications in the software. The following is the main configuration box for virtual devices.
45
To create a new virtual device:
• Select the Channel to associate with the Virtual Device(s) chosen. You can add, edit, or delete virtual devices, as well as add and edit signals. Once you have made any changes, click OK to continue the set-up. When a listed virtual device is selected, the Edit Virtual Device button, Delete Virtual Device button and Add/Edit Signal(s) button will be available for use.
To add / edit signals:
• Select the desired Virtual Device in the Virtual Device(s) List and click Add/Edit Signal(s) to display the following dialog.
• Select the Protocol and Frame ID to display the list of signals available for the message.
• Select the desired signal in the Available Signal(s) list on the left, and click Select>>. The signal name is copied to the Attached Signal(s) list on the right.
• To delete signals from the list, select the signal name in the Attached Signal(s) list on the right and click <<Deselect. The signal name is removed from the list.
• Click OK when finished
46
4. Configuration Menu The Configuration menu lets you select and personalize configurations for all major Hercules settings and functions. This includes message transmission, reception, filtering, triggering, and hardware settings.
The commands and options in this menu will let you set and modify all Hercules hardware, frame format configurations, and window selections. After all of the various Configuration windows are defined it is recommended that the Configuration file is saved. As with all software applications is is recommend to save your files often when changes are being applied. To maintain a set of configuration files for use at a later time, select the File menu, followed by the Save Configuration command to open the appropriate prompt that allows you to enter or select a file name and location. The main Configuration file is an .xml file. If you wish to use a previously saved configuration, you may load it while OFFLINE. Select the File menu, followed by the Load Configuration command to open the appropriate configuration (.xml) or older version (.her) file(s). You may load a generic blank set of configurations by following the instructions provided in the sections below. This section describes each of the features accessed from the Configuration menu and lists the steps to set their configurations.
Saving the configuration files after various Monitors have been selected will also maintain the display as well as the contents within the Monitors.
Once all configurations are set, proceed to Section 5 where you will select Monitors.
47
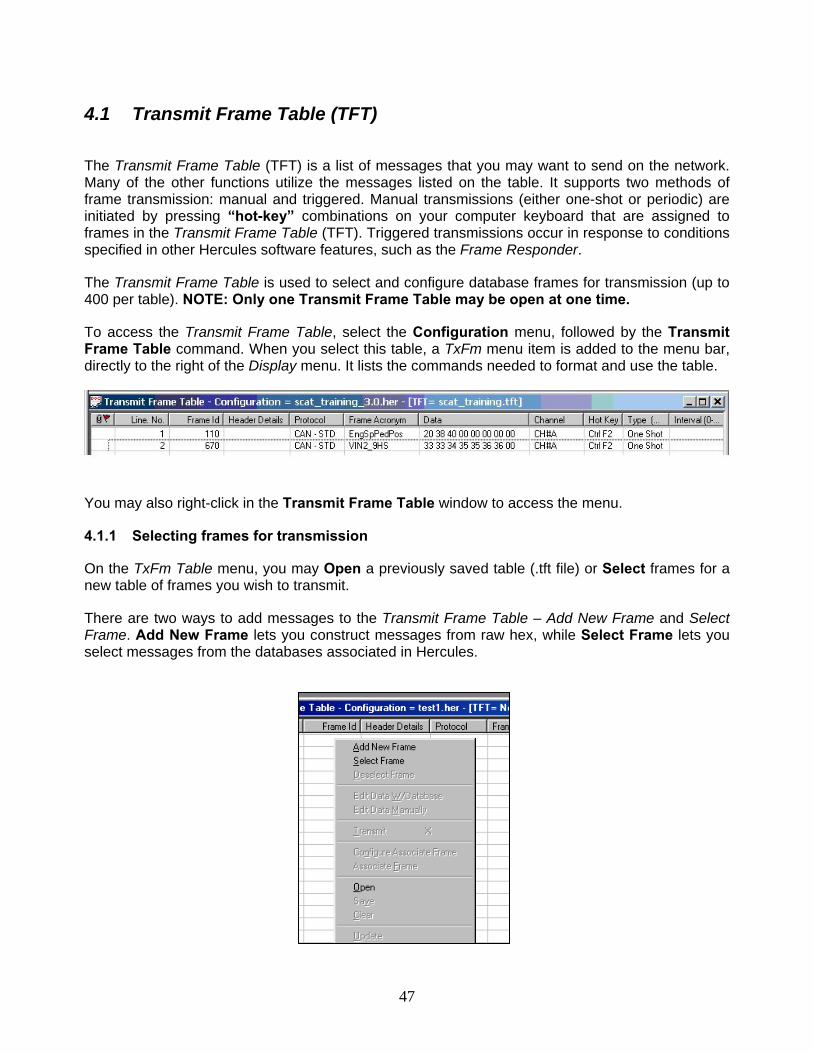
4.1 Transmit Frame Table (TFT)
The Transmit Frame Table (TFT) is a list of messages that you may want to send on the network. Many of the other functions utilize the messages listed on the table. It supports two methods of frame transmission: manual and triggered. Manual transmissions (either one-shot or periodic) are initiated by pressing “hot-key” combinations on your computer keyboard that are assigned to frames in the Transmit Frame Table (TFT). Triggered transmissions occur in response to conditions specified in other Hercules software features, such as the Frame Responder.
The Transmit Frame Table is used to select and configure database frames for transmission (up to 400 per table). NOTE: Only one Transmit Frame Table may be open at one time.
To access the Transmit Frame Table, select the Configuration menu, followed by the Transmit Frame Table command. When you select this table, a TxFm menu item is added to the menu bar, directly to the right of the Display menu. It lists the commands needed to format and use the table.
You may also right-click in the Transmit Frame Table window to access the menu.
4.1.1 Selecting frames for transmission
On the TxFm Table menu, you may Open a previously saved table (.tft file) or Select frames for a new table of frames you wish to transmit.
There are two ways to add messages to the Transmit Frame Table – Add New Frame and Select Frame. Add New Frame lets you construct messages from raw hex, while Select Frame lets you select messages from the databases associated in Hercules.
48
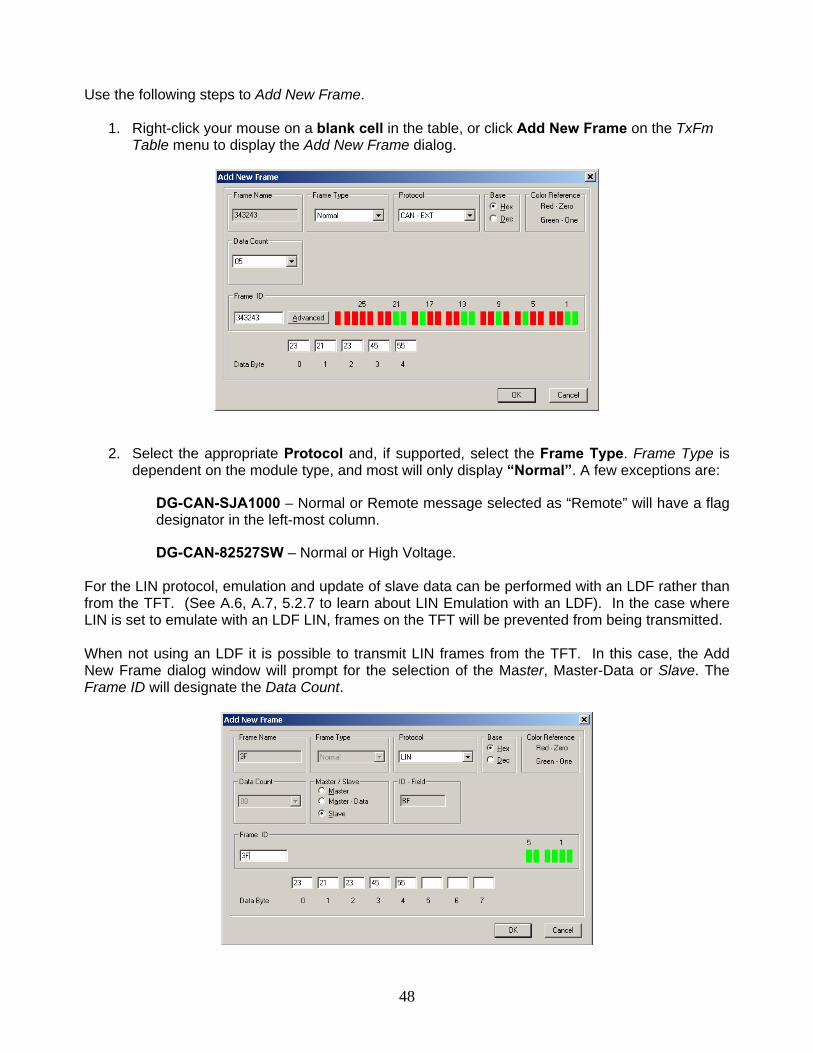
Use the following steps to Add New Frame.
1. Right-click your mouse on a blank cell in the table, or click Add New Frame on the TxFm Table menu to display the Add New Frame dialog.
2. Select the appropriate Protocol and, if supported, select the Frame Type. Frame Type is dependent on the module type, and most will only display “Normal”. A few exceptions are:
DG-CAN-SJA1000 – Normal or Remote message selected as “Remote” will have a flag designator in the left-most column.
DG-CAN-82527SW – Normal or High Voltage. For the LIN protocol, emulation and update of slave data can be performed with an LDF rather than from the TFT. (See A.6, A.7, 5.2.7 to learn about LIN Emulation with an LDF). In the case where LIN is set to emulate with an LDF LIN, frames on the TFT will be prevented from being transmitted. When not using an LDF it is possible to transmit LIN frames from the TFT. In this case, the Add New Frame dialog window will prompt for the selection of the Master, Master-Data or Slave. The Frame ID will designate the Data Count.
49
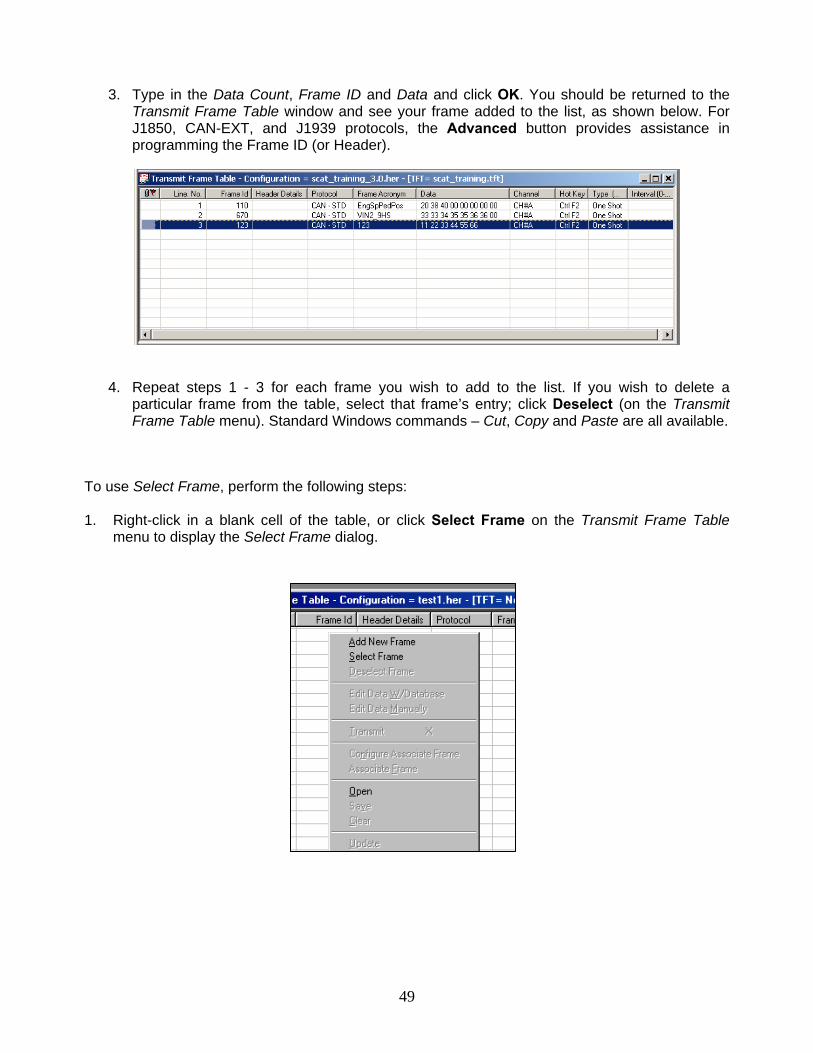
3. Type in the Data Count, Frame ID and Data and click OK. You should be returned to the Transmit Frame Table window and see your frame added to the list, as shown below. For J1850, CAN-EXT, and J1939 protocols, the Advanced button provides assistance in programming the Frame ID (or Header).
4. Repeat steps 1 - 3 for each frame you wish to add to the list. If you wish to delete a particular frame from the table, select that frame’s entry; click Deselect (on the Transmit Frame Table menu). Standard Windows commands – Cut, Copy and Paste are all available.
To use Select Frame, perform the following steps: 1. Right-click in a blank cell of the table, or click Select Frame on the Transmit Frame Table
menu to display the Select Frame dialog.
50
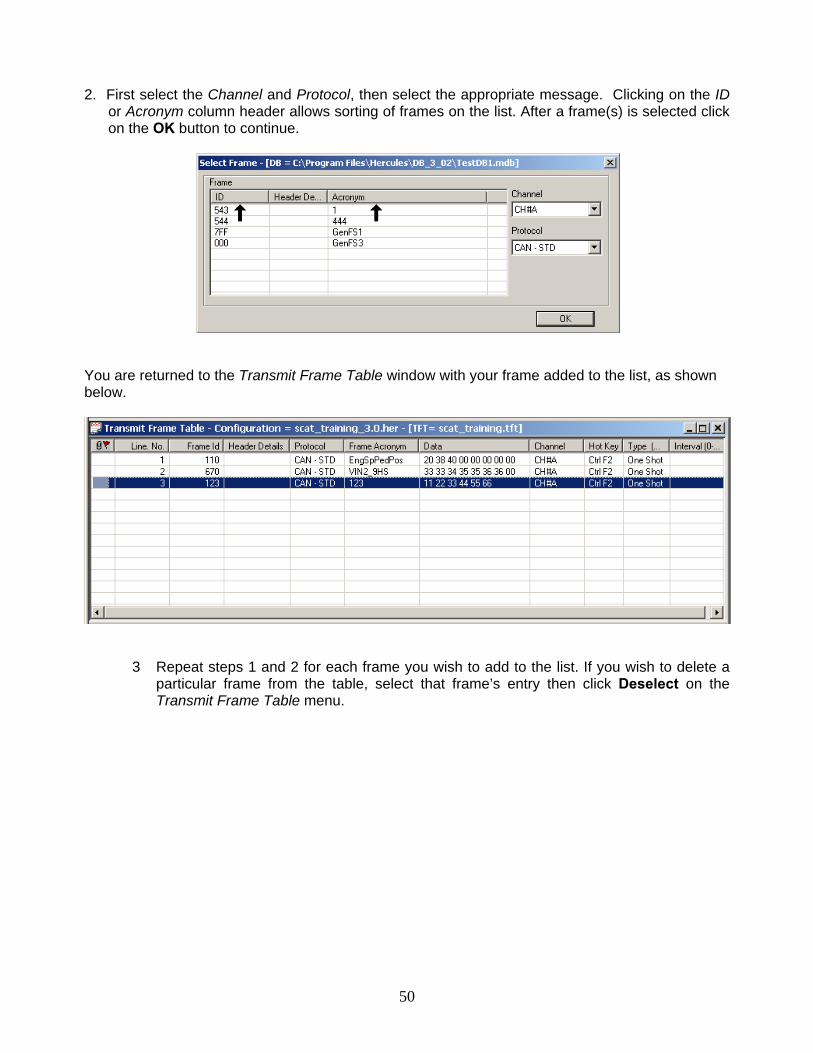
2. First select the Channel and Protocol, then select the appropriate message. Clicking on the ID or Acronym column header allows sorting of frames on the list. After a frame(s) is selected click on the OK button to continue.
You are returned to the Transmit Frame Table window with your frame added to the list, as shown below.
3 Repeat steps 1 and 2 for each frame you wish to add to the list. If you wish to delete a particular frame from the table, select that frame’s entry then click Deselect on the Transmit Frame Table menu.
51
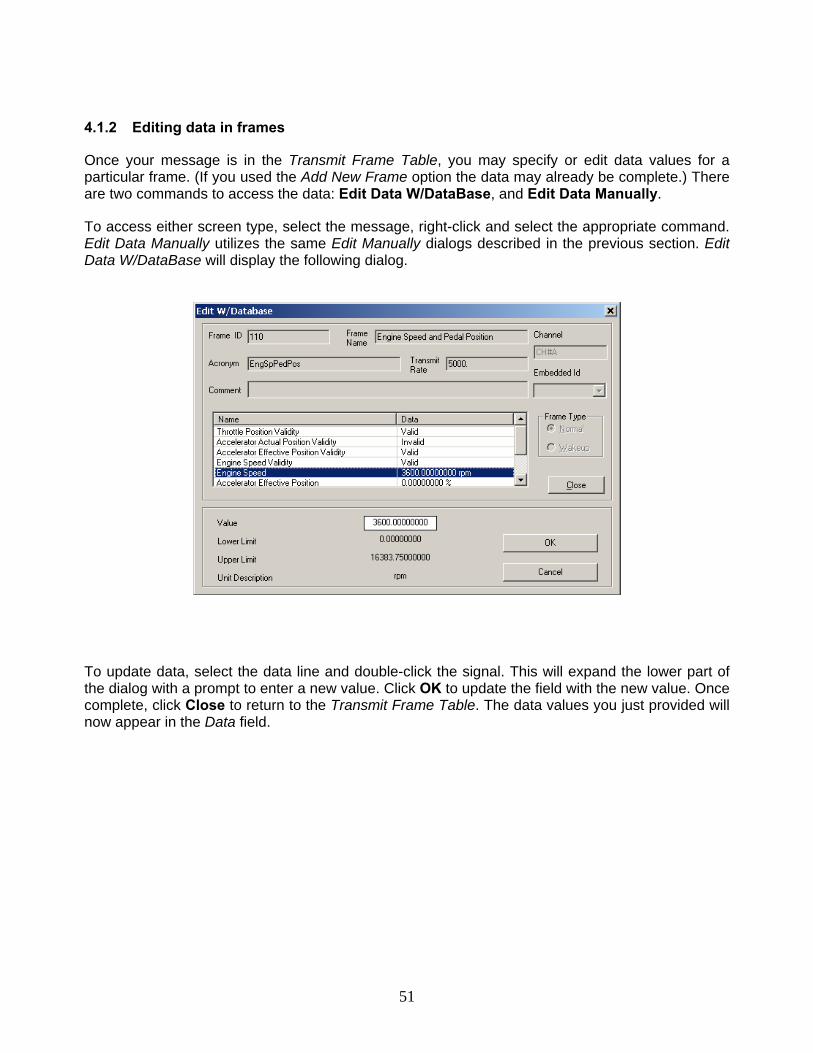
4.1.2 Editing data in frames
Once your message is in the Transmit Frame Table, you may specify or edit data values for a particular frame. (If you used the Add New Frame option the data may already be complete.) There are two commands to access the data: Edit Data W/DataBase, and Edit Data Manually.
To access either screen type, select the message, right-click and select the appropriate command. Edit Data Manually utilizes the same Edit Manually dialogs described in the previous section. Edit Data W/DataBase will display the following dialog.
To update data, select the data line and double-click the signal. This will expand the lower part of the dialog with a prompt to enter a new value. Click OK to update the field with the new value. Once complete, click Close to return to the Transmit Frame Table. The data values you just provided will now appear in the Data field.
52
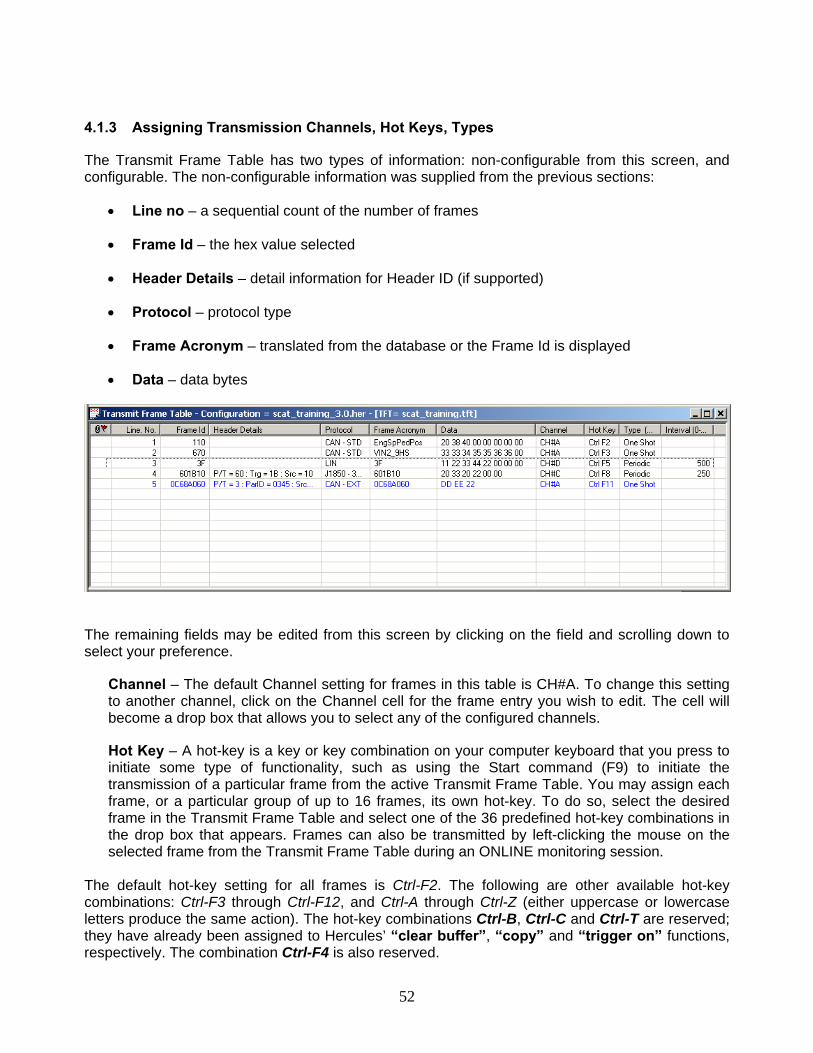
4.1.3 Assigning Transmission Channels, Hot Keys, Types
The Transmit Frame Table has two types of information: non-configurable from this screen, and configurable. The non-configurable information was supplied from the previous sections:
• Line no – a sequential count of the number of frames
• Frame Id – the hex value selected
• Header Details – detail information for Header ID (if supported)
• Protocol – protocol type
• Frame Acronym – translated from the database or the Frame Id is displayed
• Data – data bytes
The remaining fields may be edited from this screen by clicking on the field and scrolling down to select your preference.
Channel – The default Channel setting for frames in this table is CH#A. To change this setting to another channel, click on the Channel cell for the frame entry you wish to edit. The cell will become a drop box that allows you to select any of the configured channels.
Hot Key – A hot-key is a key or key combination on your computer keyboard that you press to initiate some type of functionality, such as using the Start command (F9) to initiate the transmission of a particular frame from the active Transmit Frame Table. You may assign each frame, or a particular group of up to 16 frames, its own hot-key. To do so, select the desired frame in the Transmit Frame Table and select one of the 36 predefined hot-key combinations in the drop box that appears. Frames can also be transmitted by left-clicking the mouse on the selected frame from the Transmit Frame Table during an ONLINE monitoring session.
The default hot-key setting for all frames is Ctrl-F2. The following are other available hot-key combinations: Ctrl-F3 through Ctrl-F12, and Ctrl-A through Ctrl-Z (either uppercase or lowercase letters produce the same action). The hot-key combinations Ctrl-B, Ctrl-C and Ctrl-T are reserved; they have already been assigned to Hercules’ “clear buffer”, “copy” and “trigger on” functions, respectively. The combination Ctrl-F4 is also reserved.
53
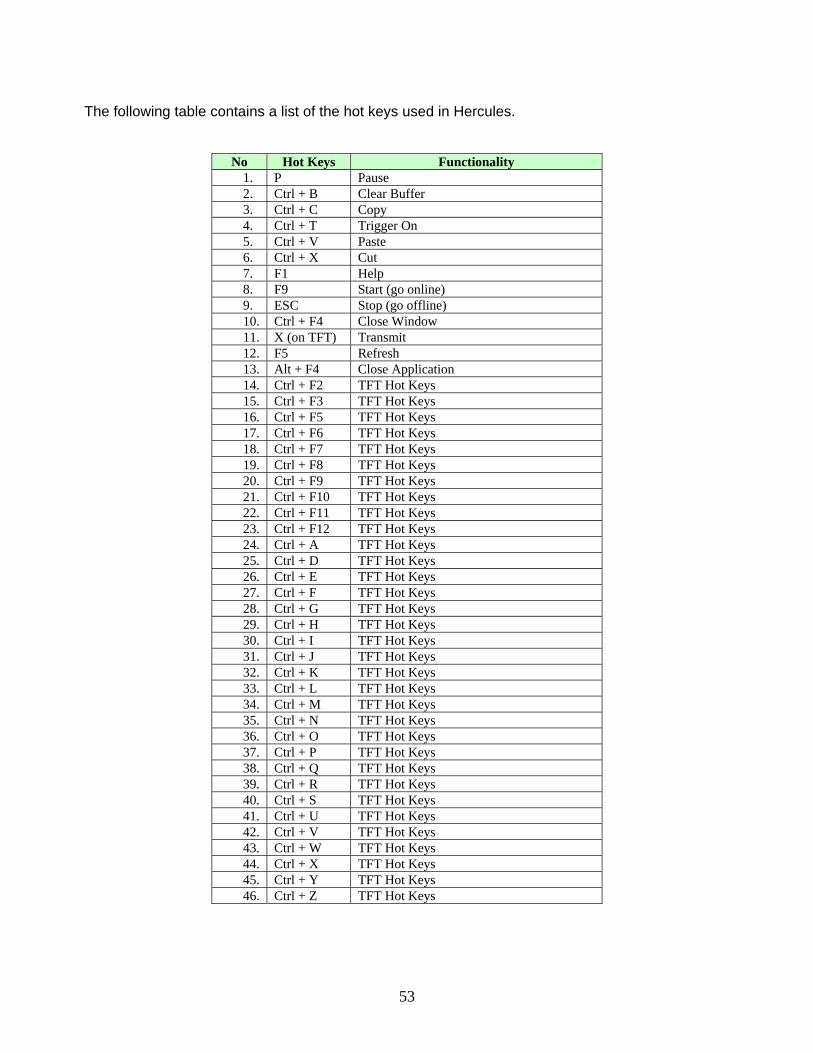
The following table contains a list of the hot keys used in Hercules.
No Hot Keys Functionality 1. P Pause 2. Ctrl + B Clear Buffer 3. Ctrl + C Copy 4. Ctrl + T Trigger On 5. Ctrl + V Paste 6. Ctrl + X Cut 7. F1 Help 8. F9 Start (go online) 9. ESC Stop (go offline) 10. Ctrl + F4 Close Window 11. X (on TFT) Transmit 12. F5 Refresh 13. Alt + F4 Close Application 14. Ctrl + F2 TFT Hot Keys 15. Ctrl + F3 TFT Hot Keys 16. Ctrl + F5 TFT Hot Keys 17. Ctrl + F6 TFT Hot Keys 18. Ctrl + F7 TFT Hot Keys 19. Ctrl + F8 TFT Hot Keys 20. Ctrl + F9 TFT Hot Keys 21. Ctrl + F10 TFT Hot Keys 22. Ctrl + F11 TFT Hot Keys 23. Ctrl + F12 TFT Hot Keys 24. Ctrl + A TFT Hot Keys 25. Ctrl + D TFT Hot Keys 26. Ctrl + E TFT Hot Keys 27. Ctrl + F TFT Hot Keys 28. Ctrl + G TFT Hot Keys 29. Ctrl + H TFT Hot Keys 30. Ctrl + I TFT Hot Keys 31. Ctrl + J TFT Hot Keys 32. Ctrl + K TFT Hot Keys 33. Ctrl + L TFT Hot Keys 34. Ctrl + M TFT Hot Keys 35. Ctrl + N TFT Hot Keys 36. Ctrl + O TFT Hot Keys 37. Ctrl + P TFT Hot Keys 38. Ctrl + Q TFT Hot Keys 39. Ctrl + R TFT Hot Keys 40. Ctrl + S TFT Hot Keys 41. Ctrl + U TFT Hot Keys 42. Ctrl + V TFT Hot Keys 43. Ctrl + W TFT Hot Keys 44. Ctrl + X TFT Hot Keys 45. Ctrl + Y TFT Hot Keys 46. Ctrl + Z TFT Hot Keys

54
TFT Hot Keys Type (Periodic/One Shot) / Interval – Each frame in the Transmit Frame Table is identified as a One Shot frame or a Periodic frame. A One Shot frame is transmitted one time when you press its hot-key combination in online mode. Several one-shot frames may be assigned to a particular hot-key combination, in which case all of those frames will be sent when the assigned hot-key combination is pressed.
A Periodic frame transmission is initiated the same way, but the frame is sent continuously at a user-specified interval. Successive pressing of that hot-key combination will alternately enable and disable the periodic transmission of that frame. In the corresponding Interval cell a pre-defined value from the database will appear. Therefore, click on that value to change it to the interval (in milliseconds) at which you would like the frame to be transmitted. The interval rate must be between 1 and 30,000 milliseconds (30 seconds).
At any point while online, double clicking on a message will transmit it one shot on the network (regardless of its designation as periodic or one shot).
4.1.4 Associate Frame
Associate Frame is a function that will let you define a single message that can then be “associated” to a message(s) in the Transmit Frame Table. The Associate Message is sent on the network before the message listed in the Transmit Frame Table. To use this function:
1. Right-click on your frame choice, and select the Configure Associate Frame command to display the following dialog.
2. Select the Channel and Protocol on which to send the Associate Frame. Select the Frame ID, Frame Name and Data Count. You can also delay the time in which the second message is sent by entering in a value for the Time Delay. Click OK.
3. Next after selecting the message in the Transmit Frame Table, right-click and select the Associate Frame command. Once associated, this frame will appear in the Transmit Frame Table with a “paperclip” icon in its far-left column (see below: the last message has an associated frame). Now whenever the Transmit Frame Table message is sent on the network, it will be preceded by the Associate Frame.
55
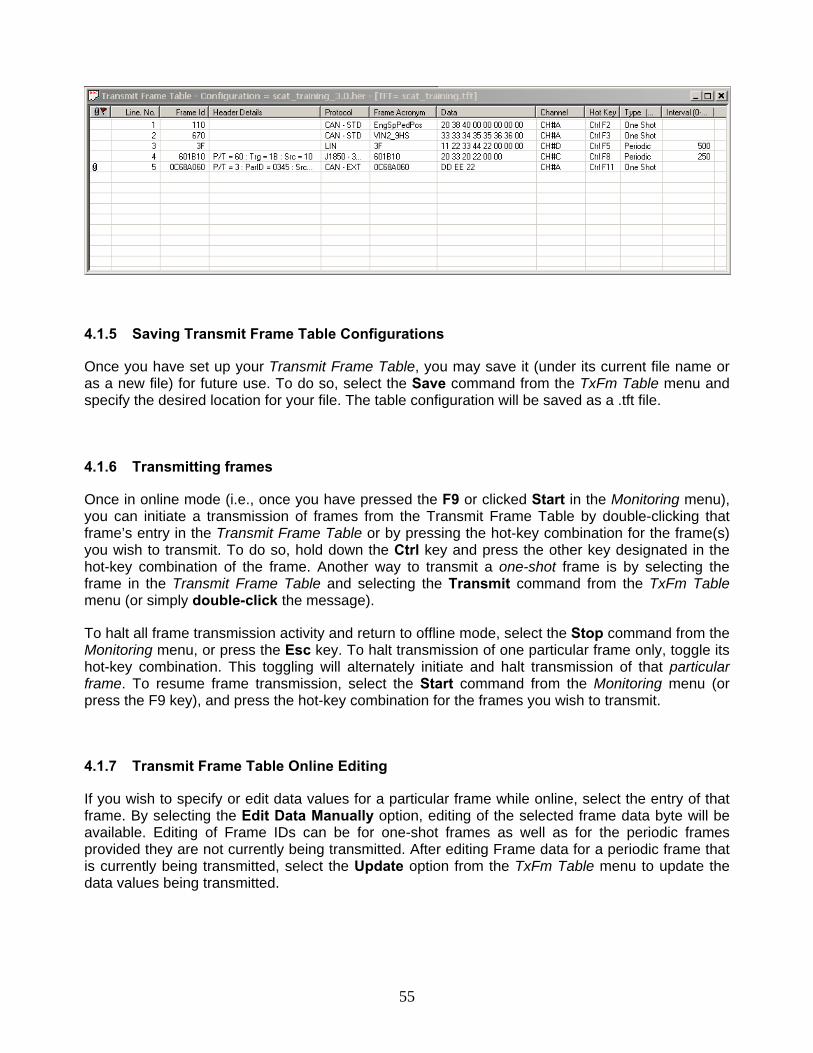
4.1.5 Saving Transmit Frame Table Configurations
Once you have set up your Transmit Frame Table, you may save it (under its current file name or as a new file) for future use. To do so, select the Save command from the TxFm Table menu and specify the desired location for your file. The table configuration will be saved as a .tft file.
4.1.6 Transmitting frames
Once in online mode (i.e., once you have pressed the F9 or clicked Start in the Monitoring menu), you can initiate a transmission of frames from the Transmit Frame Table by double-clicking that frame’s entry in the Transmit Frame Table or by pressing the hot-key combination for the frame(s) you wish to transmit. To do so, hold down the Ctrl key and press the other key designated in the hot-key combination of the frame. Another way to transmit a one-shot frame is by selecting the frame in the Transmit Frame Table and selecting the Transmit command from the TxFm Table menu (or simply double-click the message).
To halt all frame transmission activity and return to offline mode, select the Stop command from the Monitoring menu, or press the Esc key. To halt transmission of one particular frame only, toggle its hot-key combination. This toggling will alternately initiate and halt transmission of that particular frame. To resume frame transmission, select the Start command from the Monitoring menu (or press the F9 key), and press the hot-key combination for the frames you wish to transmit.
4.1.7 Transmit Frame Table Online Editing
If you wish to specify or edit data values for a particular frame while online, select the entry of that frame. By selecting the Edit Data Manually option, editing of the selected frame data byte will be available. Editing of Frame IDs can be for one-shot frames as well as for the periodic frames provided they are not currently being transmitted. After editing Frame data for a periodic frame that is currently being transmitted, select the Update option from the TxFm Table menu to update the data values being transmitted.
56
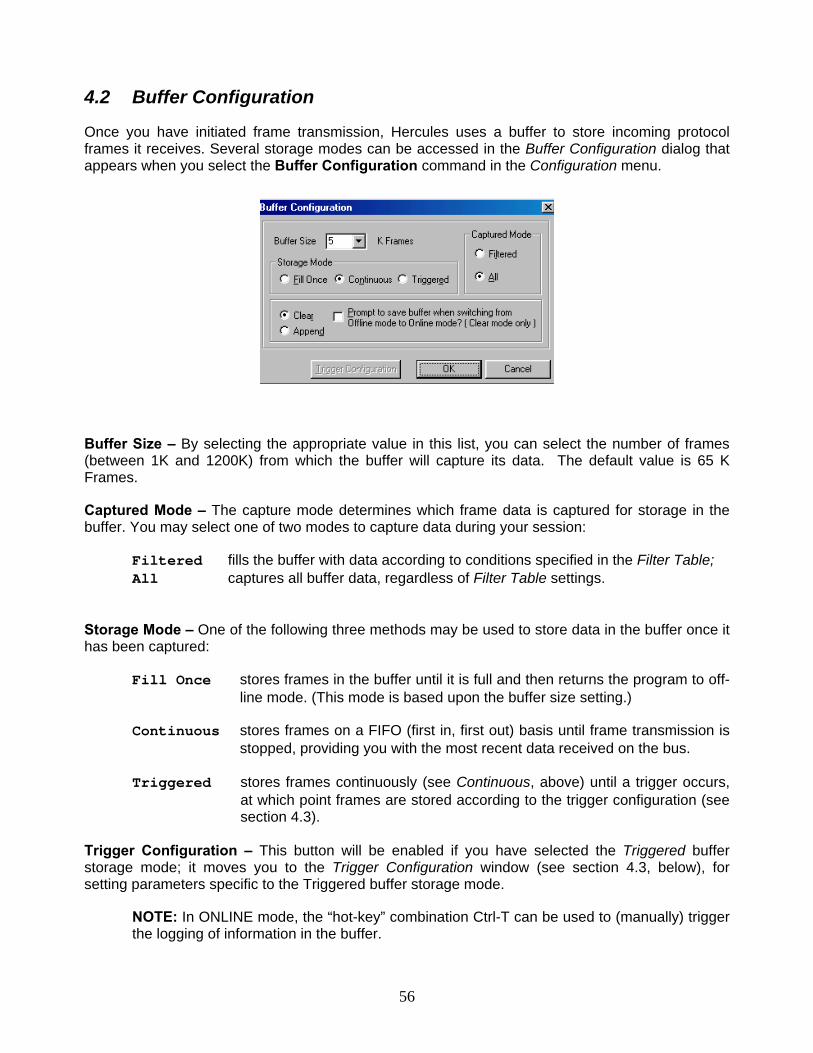
4.2 Buffer Configuration
Once you have initiated frame transmission, Hercules uses a buffer to store incoming protocol frames it receives. Several storage modes can be accessed in the Buffer Configuration dialog that appears when you select the Buffer Configuration command in the Configuration menu.
Buffer Size – By selecting the appropriate value in this list, you can select the number of frames (between 1K and 1200K) from which the buffer will capture its data. The default value is 65 K Frames.
Captured Mode – The capture mode determines which frame data is captured for storage in the buffer. You may select one of two modes to capture data during your session:
Filtered fills the buffer with data according to conditions specified in the Filter Table; All captures all buffer data, regardless of Filter Table settings.
Storage Mode – One of the following three methods may be used to store data in the buffer once it has been captured:
Fill Once stores frames in the buffer until it is full and then returns the program to off-line mode. (This mode is based upon the buffer size setting.)
Continuous stores frames on a FIFO (first in, first out) basis until frame transmission is stopped, providing you with the most recent data received on the bus.
Triggered stores frames continuously (see Continuous, above) until a trigger occurs,
at which point frames are stored according to the trigger configuration (see section 4.3).
Trigger Configuration – This button will be enabled if you have selected the Triggered buffer storage mode; it moves you to the Trigger Configuration window (see section 4.3, below), for setting parameters specific to the Triggered buffer storage mode.
NOTE: In ONLINE mode, the “hot-key” combination Ctrl-T can be used to (manually) trigger the logging of information in the buffer.

57
Clear / Append options – These options allow you to dictate what happens to the buffer’s contents once you have viewed them and wish to return to online mode. By default, this feature is set to Clear mode, which means that the buffer is cleared each time you return to ONLINE mode and initiate a new monitoring / transmission session.
You may save a buffer’s contents to a .txt file for later viewing, by clicking Save in the Offline Buffer View. If you select Clear mode, you may also request that you be prompted to save current buffer contents any time you attempt to return from the offline to the online mode. By selecting [√] the box beside this option (next to “Clear” in the Buffer Configuration window), you ensure that you will be reminded to save the current buffer contents before returning to the online mode.
If you prefer that the buffer contents NOT be deleted when you return to online mode, you may request that buffer information from subsequent monitoring (online) sessions be appended to the current buffer contents. In Append mode, the buffer’s contents are not automatically deleted when you return to online mode. Instead, any information recorded to the buffer once you return to online mode is appended to the end of the Offline Buffer View display. You may also clear the buffer manually by selecting the Clear Buffer (CTRL-B) command in the Monitoring menu, or click Clear Buffer on the main toolbar.
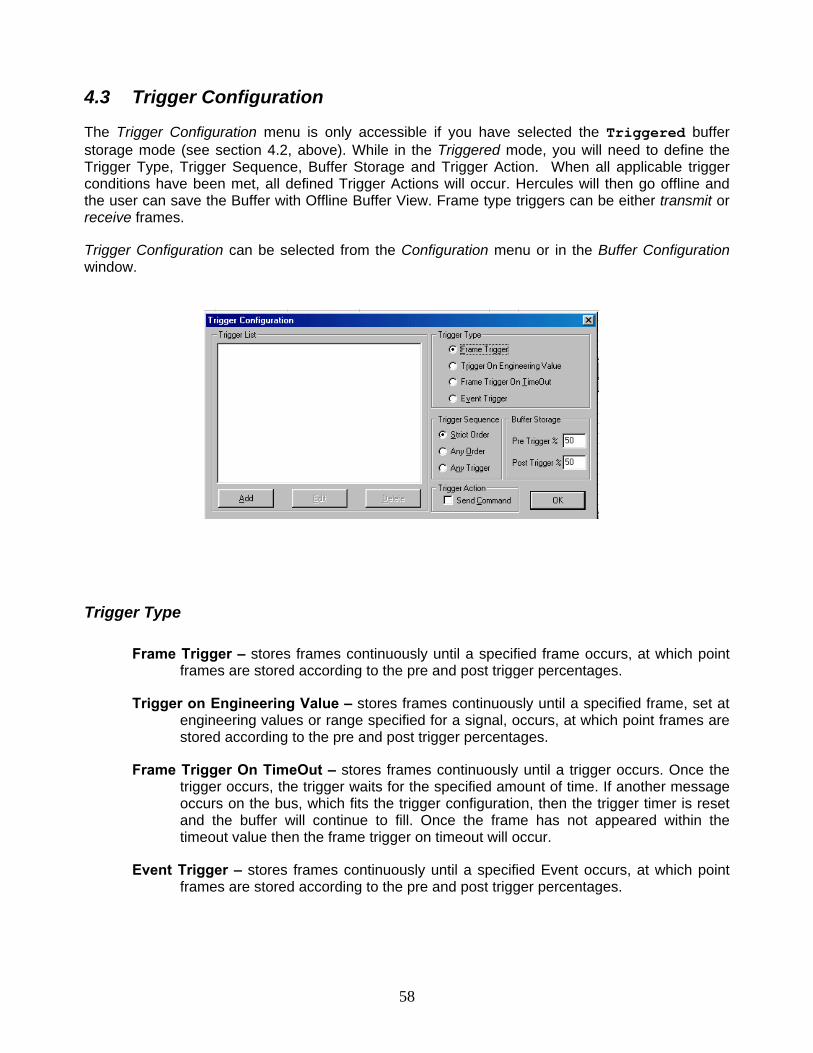
58
4.3 Trigger Configuration
The Trigger Configuration menu is only accessible if you have selected the Triggered buffer storage mode (see section 4.2, above). While in the Triggered mode, you will need to define the Trigger Type, Trigger Sequence, Buffer Storage and Trigger Action. When all applicable trigger conditions have been met, all defined Trigger Actions will occur. Hercules will then go offline and the user can save the Buffer with Offline Buffer View. Frame type triggers can be either transmit or receive frames.
Trigger Configuration can be selected from the Configuration menu or in the Buffer Configuration window.
Trigger Type
Frame Trigger – stores frames continuously until a specified frame occurs, at which point frames are stored according to the pre and post trigger percentages.
Trigger on Engineering Value – stores frames continuously until a specified frame, set at engineering values or range specified for a signal, occurs, at which point frames are stored according to the pre and post trigger percentages.
Frame Trigger On TimeOut – stores frames continuously until a trigger occurs. Once the trigger occurs, the trigger waits for the specified amount of time. If another message occurs on the bus, which fits the trigger configuration, then the trigger timer is reset and the buffer will continue to fill. Once the frame has not appeared within the timeout value then the frame trigger on timeout will occur.
Event Trigger – stores frames continuously until a specified Event occurs, at which point frames are stored according to the pre and post trigger percentages.

59
Trigger Sequence
You can specify Strict Order / Any Order / Any Trigger condition for the set of triggers that are configured. You can change the order of the configured triggers by using the Cut, Copy, and Paste commands provided through the short-cut menu.
NOTE: Paste occurs above the selected item.
Strict Order – If selected, all the trigger conditions in the trigger list must satisfy in the order they have been specified; only then will Hercules trigger. This is an AND condition for all triggers with the order specified.
Any Order – If selected, the trigger conditions for all the configured triggers must satisfy in
any order. Then, Hercules should trigger. This is an AND condition for all triggers, but no order is specified.
Any Trigger – If selected, Hercules should trigger when any one of the trigger conditions is satisfied. This is an OR condition for all triggers.
Buffer Storage
In triggered storage mode, buffer storage space is apportioned according to the following parameters:
Pre Trigger % – percentage of the buffer to be reserved for storage of frames received before a trigger occurrence.
Post Trigger % – percentage of the buffer to be reserved for storage of frames received after a trigger occurrence.
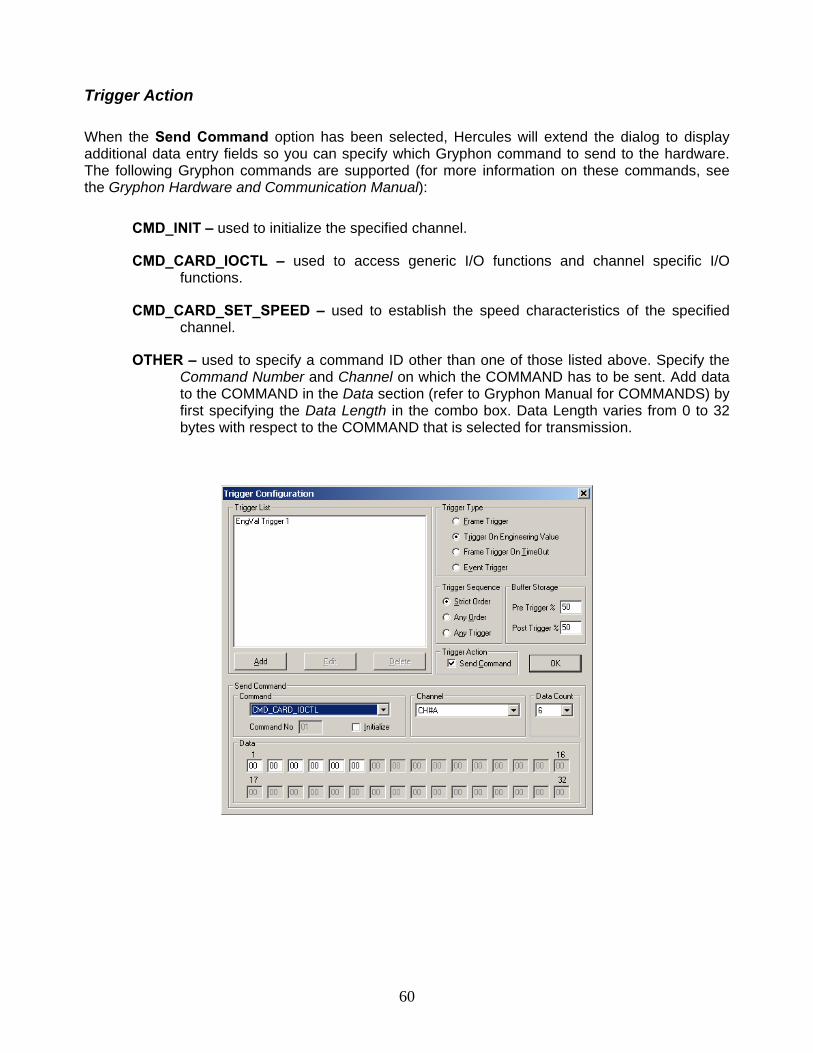
60
Trigger Action
When the Send Command option has been selected, Hercules will extend the dialog to display additional data entry fields so you can specify which Gryphon command to send to the hardware. The following Gryphon commands are supported (for more information on these commands, see the Gryphon Hardware and Communication Manual):
CMD_INIT – used to initialize the specified channel.
CMD_CARD_IOCTL – used to access generic I/O functions and channel specific I/O functions.
CMD_CARD_SET_SPEED – used to establish the speed characteristics of the specified channel.
OTHER – used to specify a command ID other than one of those listed above. Specify the Command Number and Channel on which the COMMAND has to be sent. Add data to the COMMAND in the Data section (refer to Gryphon Manual for COMMANDS) by first specifying the Data Length in the combo box. Data Length varies from 0 to 32 bytes with respect to the COMMAND that is selected for transmission.
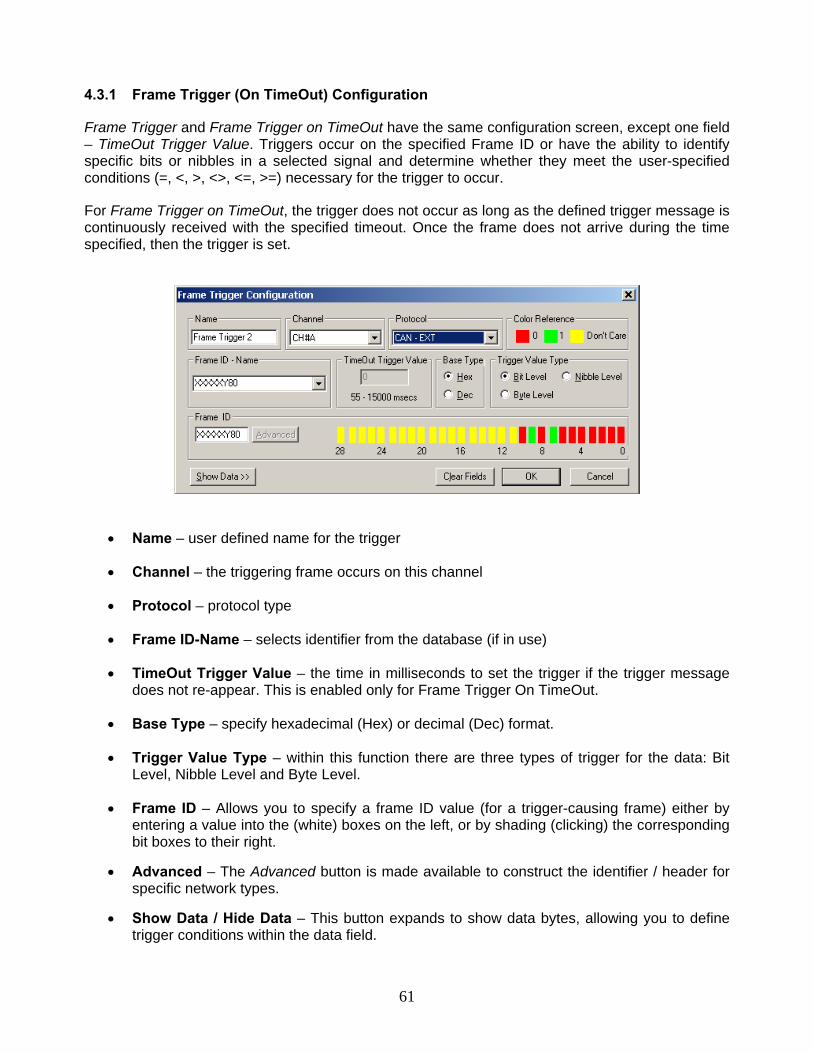
61
4.3.1 Frame Trigger (On TimeOut) Configuration
Frame Trigger and Frame Trigger on TimeOut have the same configuration screen, except one field – TimeOut Trigger Value. Triggers occur on the specified Frame ID or have the ability to identify specific bits or nibbles in a selected signal and determine whether they meet the user-specified conditions (=, <, >, <>, <=, >=) necessary for the trigger to occur.
For Frame Trigger on TimeOut, the trigger does not occur as long as the defined trigger message is continuously received with the specified timeout. Once the frame does not arrive during the time specified, then the trigger is set.
• Name – user defined name for the trigger
• Channel – the triggering frame occurs on this channel
• Protocol – protocol type
• Frame ID-Name – selects identifier from the database (if in use)
• TimeOut Trigger Value – the time in milliseconds to set the trigger if the trigger message does not re-appear. This is enabled only for Frame Trigger On TimeOut.
• Base Type – specify hexadecimal (Hex) or decimal (Dec) format.
• Trigger Value Type – within this function there are three types of trigger for the data: Bit Level, Nibble Level and Byte Level.
• Frame ID – Allows you to specify a frame ID value (for a trigger-causing frame) either by entering a value into the (white) boxes on the left, or by shading (clicking) the corresponding bit boxes to their right.
• Advanced – The Advanced button is made available to construct the identifier / header for specific network types.
• Show Data / Hide Data – This button expands to show data bytes, allowing you to define trigger conditions within the data field.
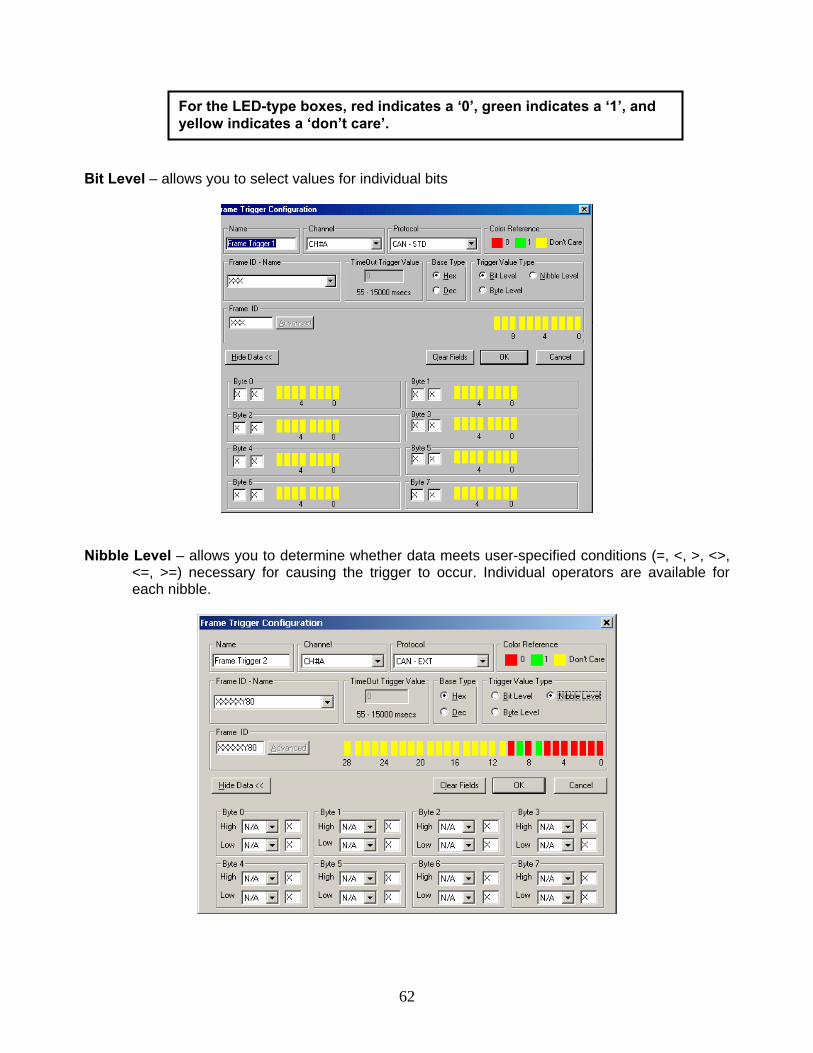
62
Bit Level – allows you to select values for individual bits
Nibble Level – allows you to determine whether data meets user-specified conditions (=, <, >, <>,
<=, >=) necessary for causing the trigger to occur. Individual operators are available for each nibble.
For the LED-type boxes, red indicates a ‘0’, green indicates a ‘1’, and yellow indicates a ‘don’t care’.
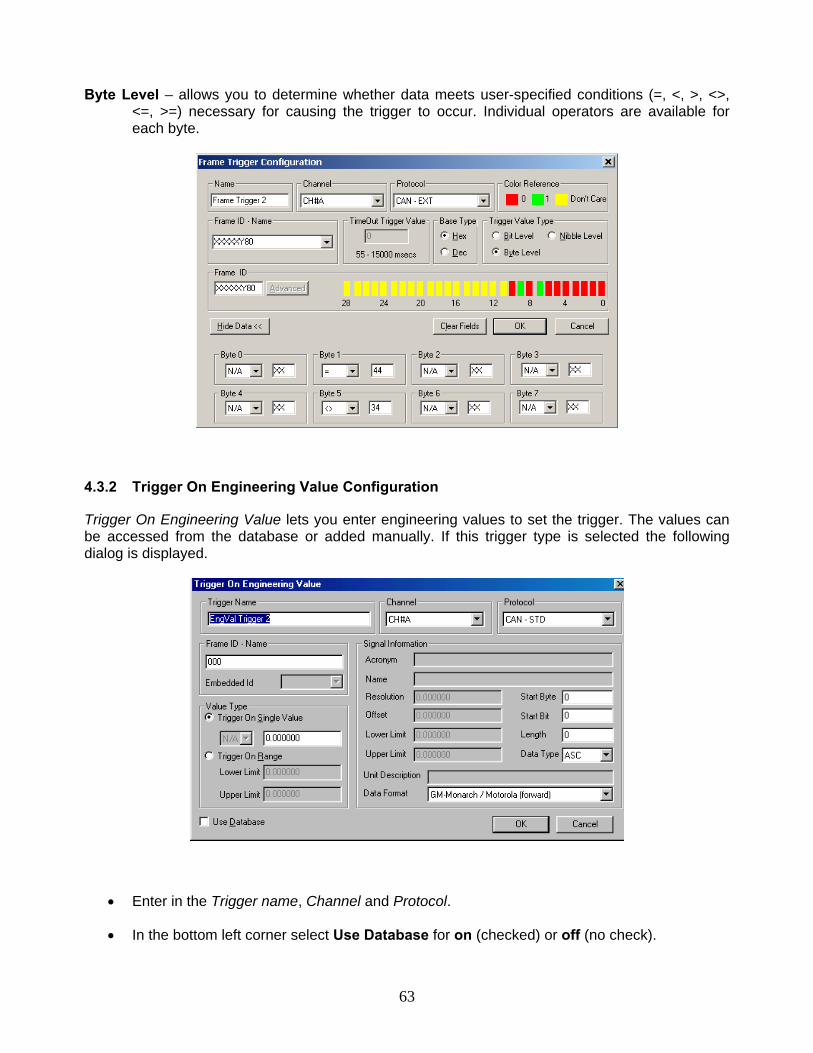
63
Byte Level – allows you to determine whether data meets user-specified conditions (=, <, >, <>, <=, >=) necessary for causing the trigger to occur. Individual operators are available for each byte.
4.3.2 Trigger On Engineering Value Configuration
Trigger On Engineering Value lets you enter engineering values to set the trigger. The values can be accessed from the database or added manually. If this trigger type is selected the following dialog is displayed.
• Enter in the Trigger name, Channel and Protocol.
• In the bottom left corner select Use Database for on (checked) or off (no check).
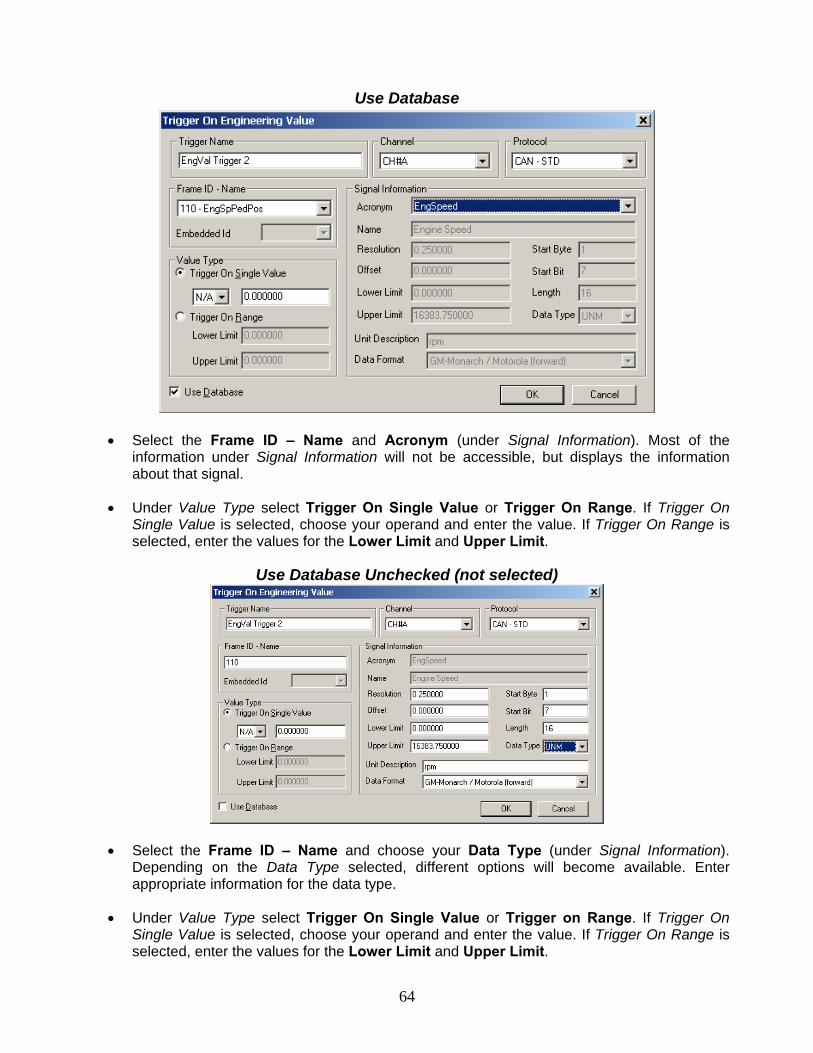
64
Use Database
• Select the Frame ID – Name and Acronym (under Signal Information). Most of the
information under Signal Information will not be accessible, but displays the information about that signal.
• Under Value Type select Trigger On Single Value or Trigger On Range. If Trigger On Single Value is selected, choose your operand and enter the value. If Trigger On Range is selected, enter the values for the Lower Limit and Upper Limit.
Use Database Unchecked (not selected)
• Select the Frame ID – Name and choose your Data Type (under Signal Information). Depending on the Data Type selected, different options will become available. Enter appropriate information for the data type.
• Under Value Type select Trigger On Single Value or Trigger on Range. If Trigger On Single Value is selected, choose your operand and enter the value. If Trigger On Range is selected, enter the values for the Lower Limit and Upper Limit.
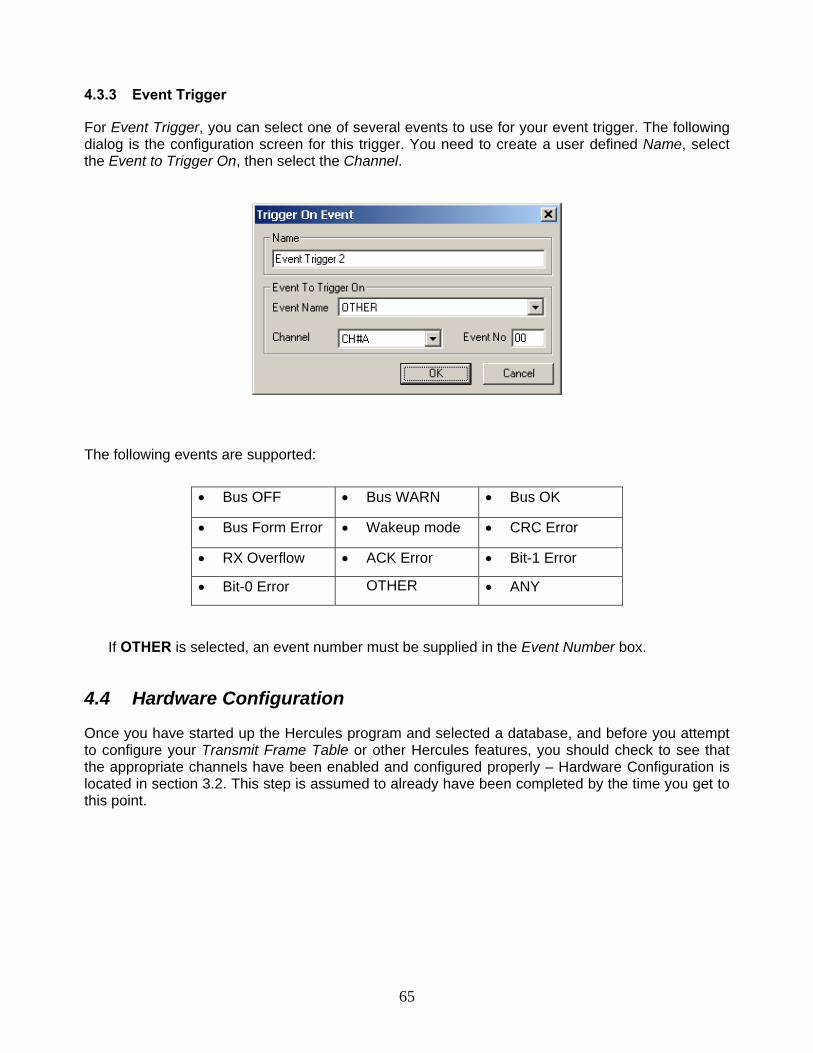
65
4.3.3 Event Trigger
For Event Trigger, you can select one of several events to use for your event trigger. The following dialog is the configuration screen for this trigger. You need to create a user defined Name, select the Event to Trigger On, then select the Channel.
The following events are supported:
• Bus OFF • Bus WARN • Bus OK
• Bus Form Error • Wakeup mode • CRC Error
• RX Overflow • ACK Error • Bit-1 Error
• Bit-0 Error OTHER • ANY
If OTHER is selected, an event number must be supplied in the Event Number box.
4.4 Hardware Configuration
Once you have started up the Hercules program and selected a database, and before you attempt to configure your Transmit Frame Table or other Hercules features, you should check to see that the appropriate channels have been enabled and configured properly – Hardware Configuration is located in section 3.2. This step is assumed to already have been completed by the time you get to this point.
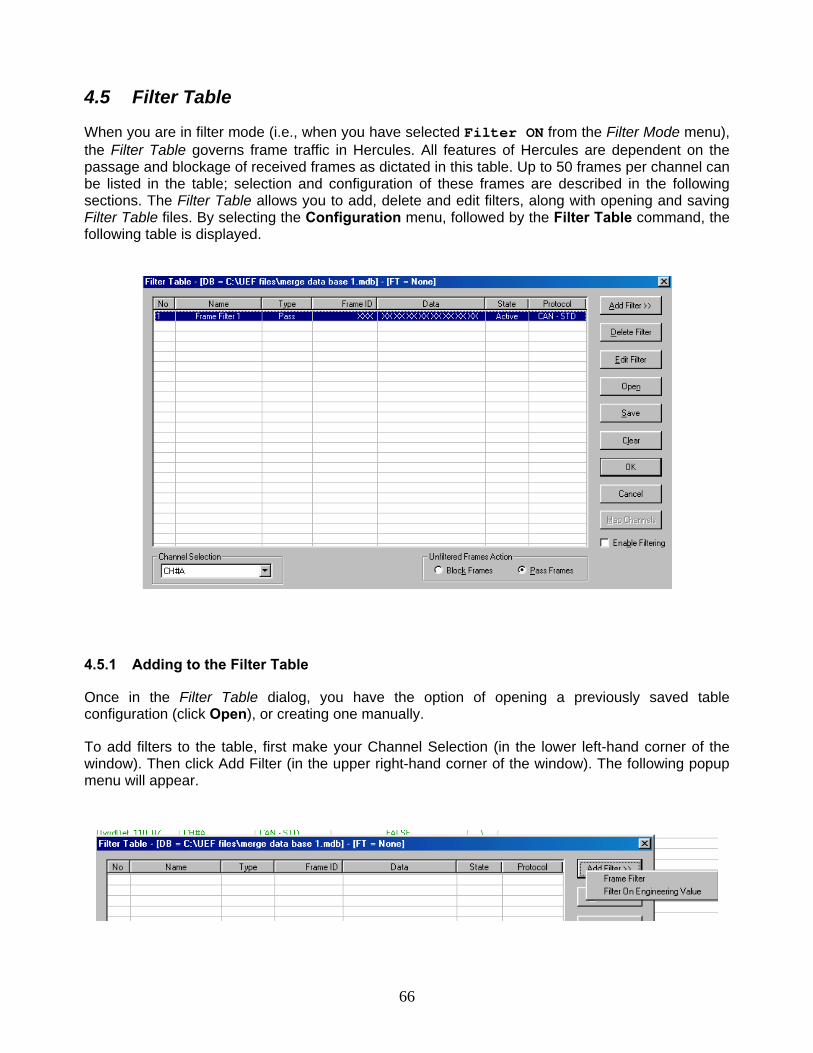
66
4.5 Filter Table
When you are in filter mode (i.e., when you have selected Filter ON from the Filter Mode menu), the Filter Table governs frame traffic in Hercules. All features of Hercules are dependent on the passage and blockage of received frames as dictated in this table. Up to 50 frames per channel can be listed in the table; selection and configuration of these frames are described in the following sections. The Filter Table allows you to add, delete and edit filters, along with opening and saving Filter Table files. By selecting the Configuration menu, followed by the Filter Table command, the following table is displayed.
4.5.1 Adding to the Filter Table
Once in the Filter Table dialog, you have the option of opening a previously saved table configuration (click Open), or creating one manually.
To add filters to the table, first make your Channel Selection (in the lower left-hand corner of the window). Then click Add Filter (in the upper right-hand corner of the window). The following popup menu will appear.
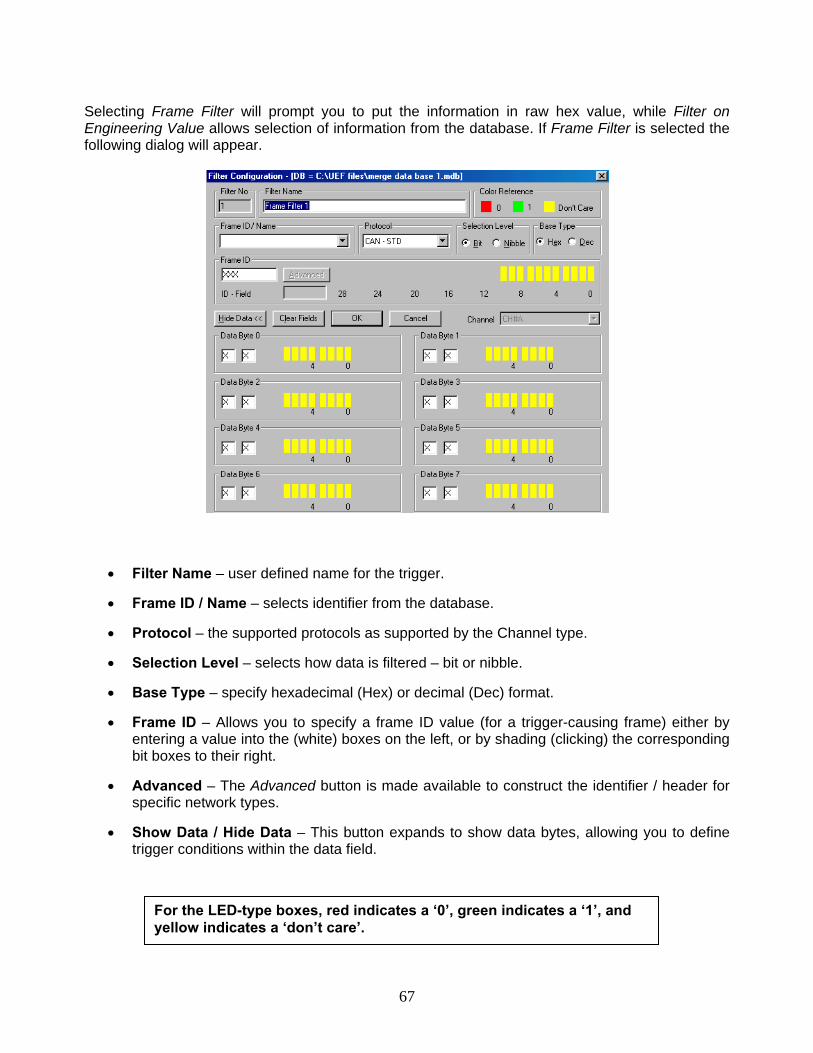
67
Selecting Frame Filter will prompt you to put the information in raw hex value, while Filter on Engineering Value allows selection of information from the database. If Frame Filter is selected the following dialog will appear.
• Filter Name – user defined name for the trigger.
• Frame ID / Name – selects identifier from the database.
• Protocol – the supported protocols as supported by the Channel type.
• Selection Level – selects how data is filtered – bit or nibble.
• Base Type – specify hexadecimal (Hex) or decimal (Dec) format.
• Frame ID – Allows you to specify a frame ID value (for a trigger-causing frame) either by entering a value into the (white) boxes on the left, or by shading (clicking) the corresponding bit boxes to their right.
• Advanced – The Advanced button is made available to construct the identifier / header for specific network types.
• Show Data / Hide Data – This button expands to show data bytes, allowing you to define trigger conditions within the data field.
For the LED-type boxes, red indicates a ‘0’, green indicates a ‘1’, and yellow indicates a ‘don’t care’.
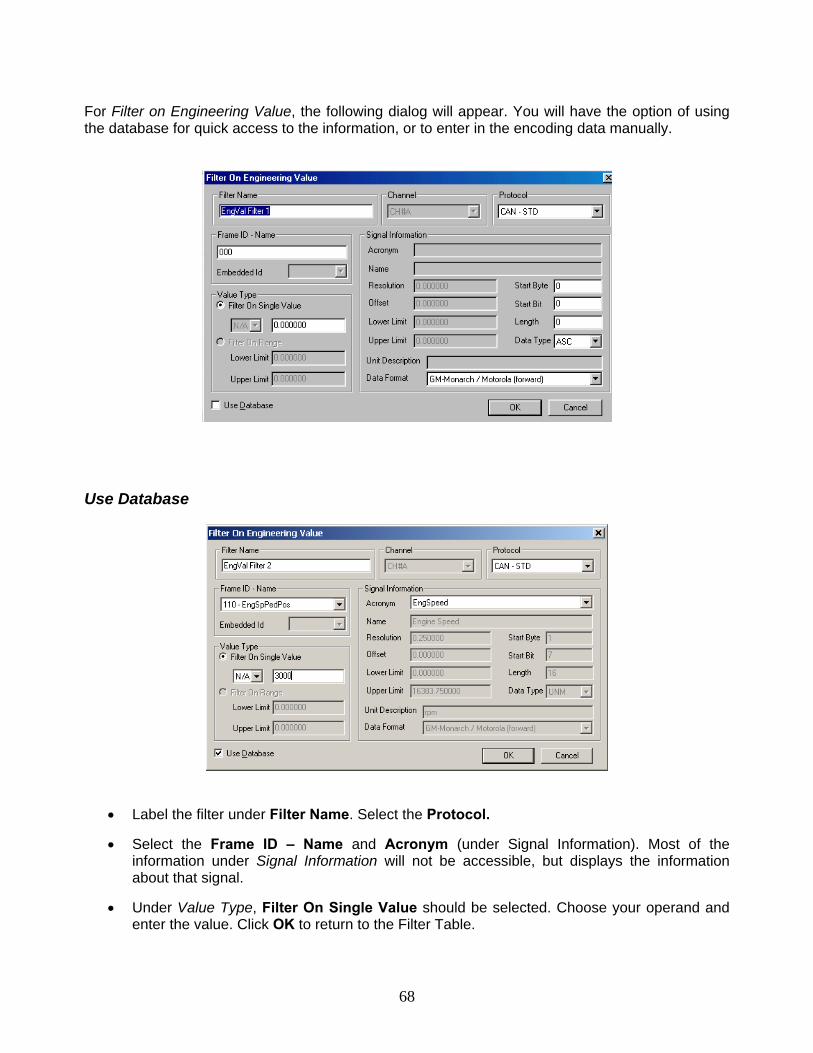
68
For Filter on Engineering Value, the following dialog will appear. You will have the option of using the database for quick access to the information, or to enter in the encoding data manually.
Use Database
• Label the filter under Filter Name. Select the Protocol.
• Select the Frame ID – Name and Acronym (under Signal Information). Most of the information under Signal Information will not be accessible, but displays the information about that signal.
• Under Value Type, Filter On Single Value should be selected. Choose your operand and enter the value. Click OK to return to the Filter Table.
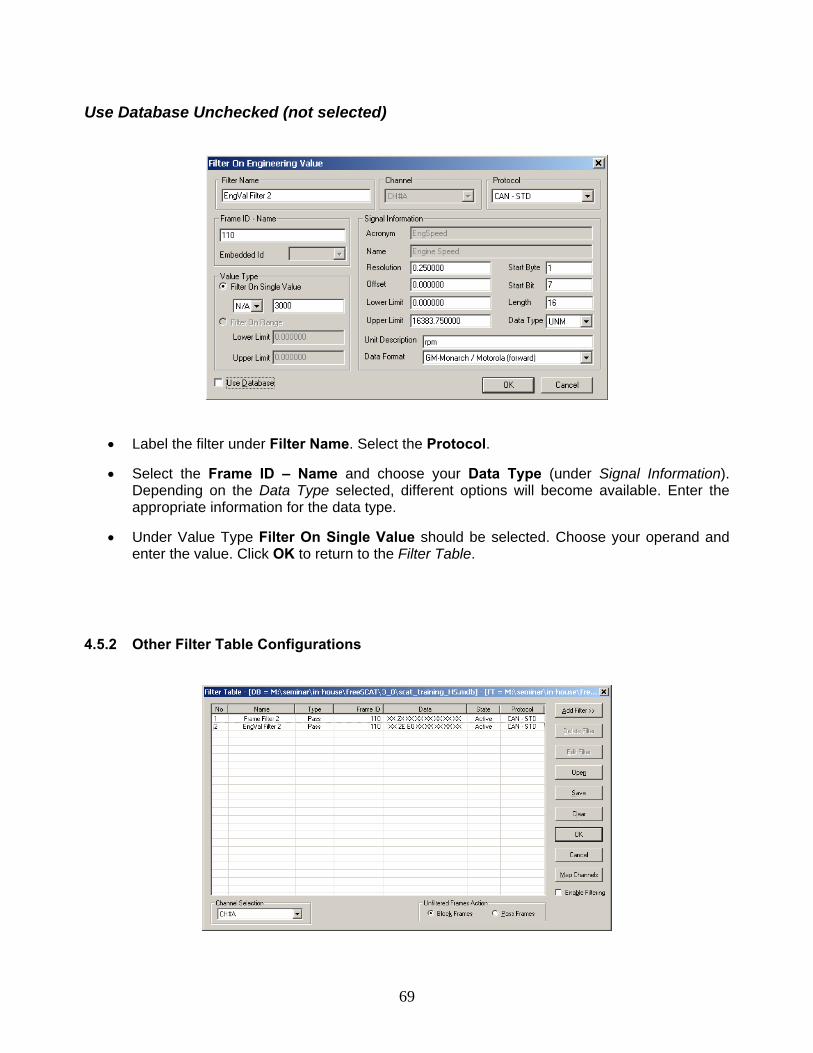
69
Use Database Unchecked (not selected)
• Label the filter under Filter Name. Select the Protocol.
• Select the Frame ID – Name and choose your Data Type (under Signal Information). Depending on the Data Type selected, different options will become available. Enter the appropriate information for the data type.
• Under Value Type Filter On Single Value should be selected. Choose your operand and enter the value. Click OK to return to the Filter Table.
4.5.2 Other Filter Table Configurations
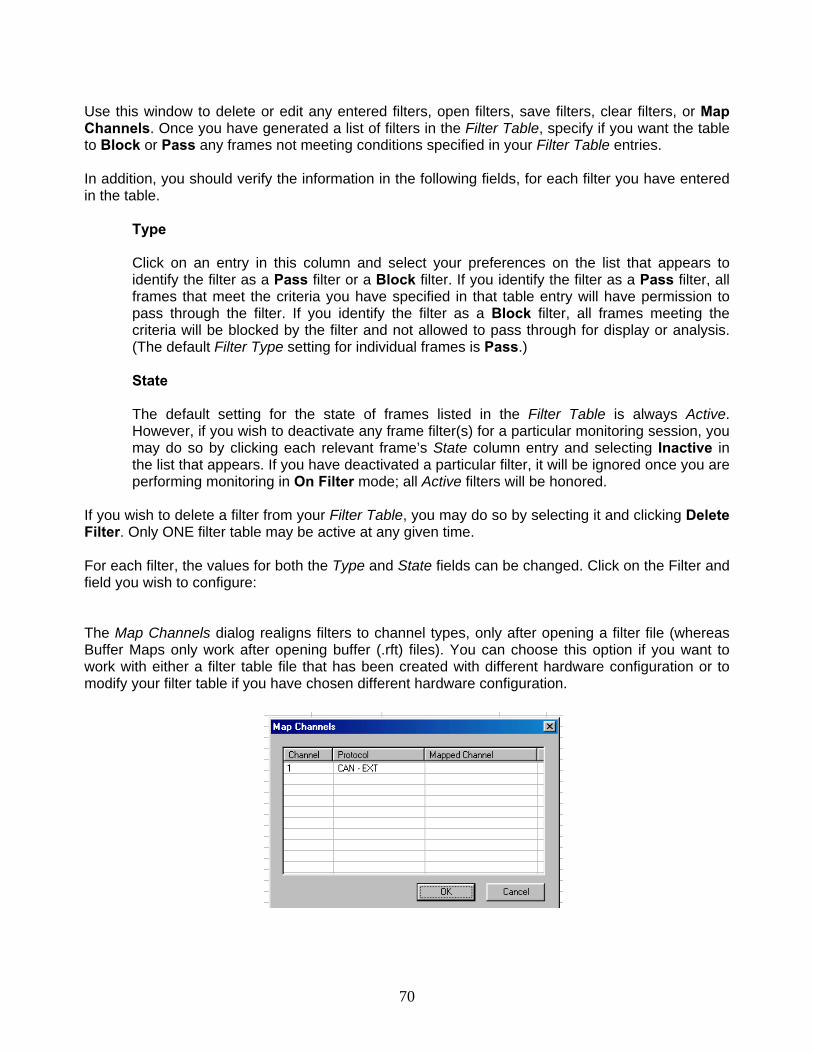
70
Use this window to delete or edit any entered filters, open filters, save filters, clear filters, or Map Channels. Once you have generated a list of filters in the Filter Table, specify if you want the table to Block or Pass any frames not meeting conditions specified in your Filter Table entries. In addition, you should verify the information in the following fields, for each filter you have entered in the table.
Type Click on an entry in this column and select your preferences on the list that appears to identify the filter as a Pass filter or a Block filter. If you identify the filter as a Pass filter, all frames that meet the criteria you have specified in that table entry will have permission to pass through the filter. If you identify the filter as a Block filter, all frames meeting the criteria will be blocked by the filter and not allowed to pass through for display or analysis. (The default Filter Type setting for individual frames is Pass.)
State The default setting for the state of frames listed in the Filter Table is always Active. However, if you wish to deactivate any frame filter(s) for a particular monitoring session, you may do so by clicking each relevant frame’s State column entry and selecting Inactive in the list that appears. If you have deactivated a particular filter, it will be ignored once you are performing monitoring in On Filter mode; all Active filters will be honored.
If you wish to delete a filter from your Filter Table, you may do so by selecting it and clicking Delete Filter. Only ONE filter table may be active at any given time. For each filter, the values for both the Type and State fields can be changed. Click on the Filter and field you wish to configure: The Map Channels dialog realigns filters to channel types, only after opening a filter file (whereas Buffer Maps only work after opening buffer (.rft) files). You can choose this option if you want to work with either a filter table file that has been created with different hardware configuration or to modify your filter table if you have chosen different hardware configuration.
71
4.5.3 Saving and Loading Filter Table Configurations
Once you have opened or created a Filter Table, you can save it (under its current file name or as a new file) for future use. To do so, click Save in the far right portion of the screen, and specify the desired name and location for your table. The table configuration is saved as an .rft file. The Open button will load that table for use in future monitoring sessions.
4.5.4 Enabling and disabling the filter mechanism
During a monitoring session, you can turn the filtering mechanism ON or OFF. You may select ( ) or clear ( ) the Enable Filtering box in the Receive Frame Filter Table window, or you may click the appropriate selection on the Filter Mode menu.
When the Filter Table is enabled (i.e., in Filter ON mode) any other monitor screens will receive frames only after being processed by the filter table. This means that certain database frames, although available for selection in particular monitoring modes, will not appear in those monitors if they are subject to blocking by active filters.
The Filters may be activated or deactivated while online, by selecting Filter Mode menu, followed by the Filter ON/Filter OFF command or clicking Filter Enable on the main toolbar.
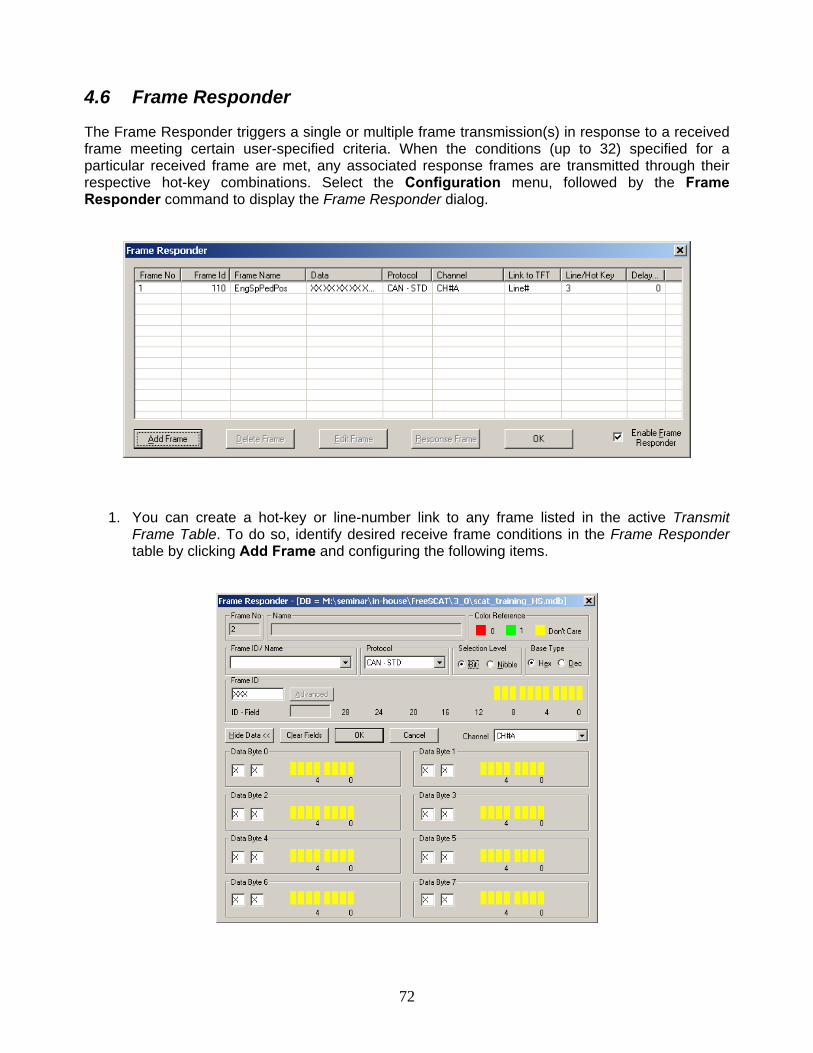
72
4.6 Frame Responder
The Frame Responder triggers a single or multiple frame transmission(s) in response to a received frame meeting certain user-specified criteria. When the conditions (up to 32) specified for a particular received frame are met, any associated response frames are transmitted through their respective hot-key combinations. Select the Configuration menu, followed by the Frame Responder command to display the Frame Responder dialog.
1. You can create a hot-key or line-number link to any frame listed in the active Transmit Frame Table. To do so, identify desired receive frame conditions in the Frame Responder table by clicking Add Frame and configuring the following items.
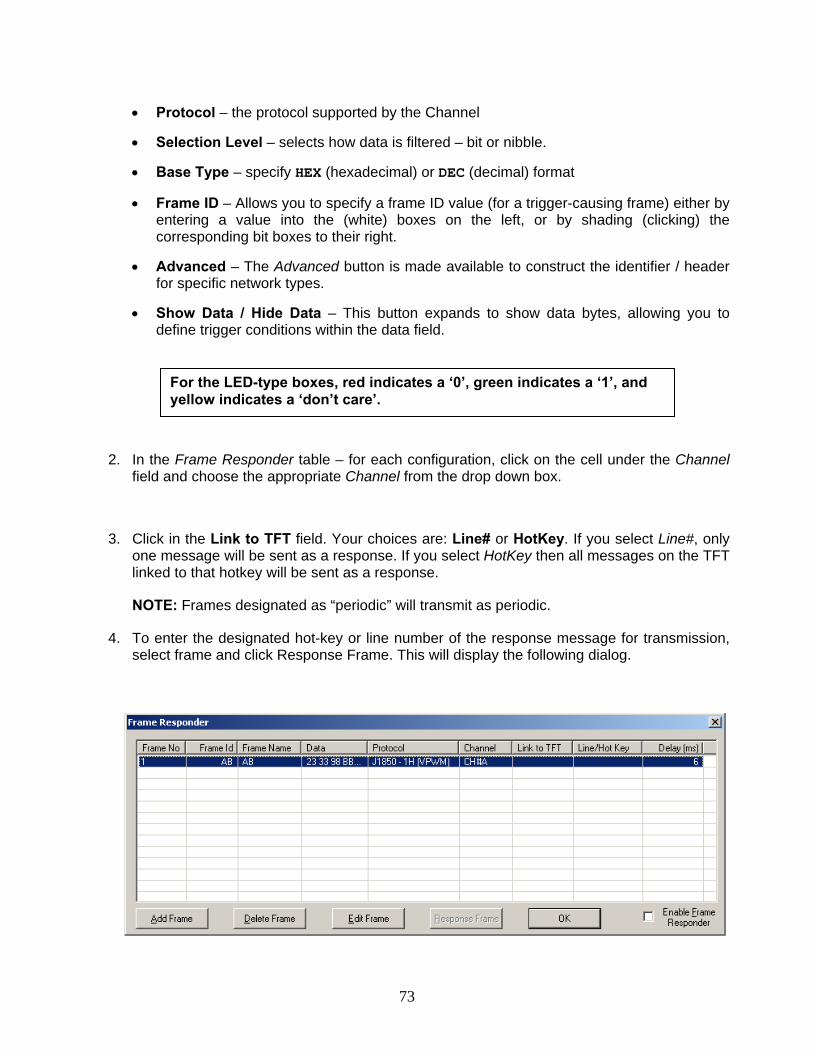
73
• Protocol – the protocol supported by the Channel
• Selection Level – selects how data is filtered – bit or nibble.
• Base Type – specify HEX (hexadecimal) or DEC (decimal) format
• Frame ID – Allows you to specify a frame ID value (for a trigger-causing frame) either by entering a value into the (white) boxes on the left, or by shading (clicking) the corresponding bit boxes to their right.
• Advanced – The Advanced button is made available to construct the identifier / header for specific network types.
• Show Data / Hide Data – This button expands to show data bytes, allowing you to define trigger conditions within the data field.
2. In the Frame Responder table – for each configuration, click on the cell under the Channel field and choose the appropriate Channel from the drop down box.
3. Click in the Link to TFT field. Your choices are: Line# or HotKey. If you select Line#, only
one message will be sent as a response. If you select HotKey then all messages on the TFT linked to that hotkey will be sent as a response.
NOTE: Frames designated as “periodic” will transmit as periodic.
4. To enter the designated hot-key or line number of the response message for transmission, select frame and click Response Frame. This will display the following dialog.
For the LED-type boxes, red indicates a ‘0’, green indicates a ‘1’, and yellow indicates a ‘don’t care’.

74
Select the desired item and click OK to return to the Frame Responder dialog.
5. If desired, you may enter a delay from 0 to 30,000 ms. The delay value is internally converted into an integer multiple value and rounded up in multiples of 10. For example, entering a ‘7’ is internally converted to ‘10’. An ‘11’ is converted to a ‘20’, and so on.
6. To activate the configured Frame Responder for an online monitoring session, you must enable it by selecting the Enable Frame Responder check box in this window or in the Global Options window (accessed from the bottom of the Configuration menu).
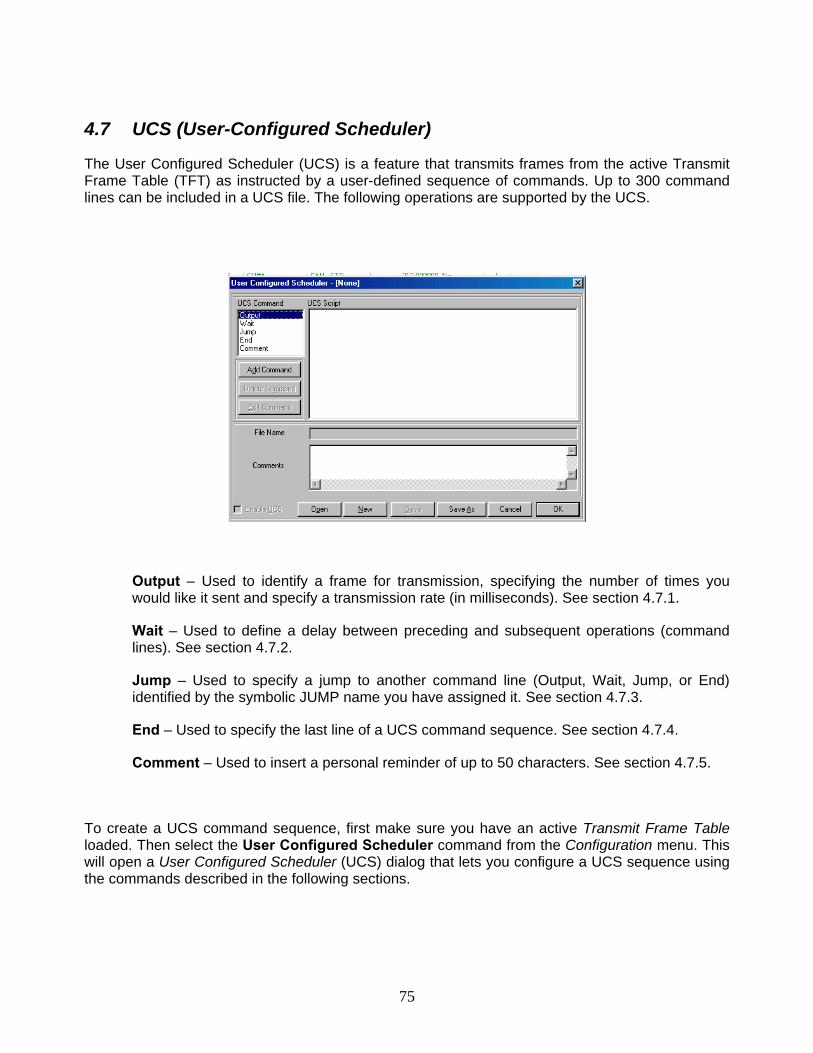
75
4.7 UCS (User-Configured Scheduler)
The User Configured Scheduler (UCS) is a feature that transmits frames from the active Transmit Frame Table (TFT) as instructed by a user-defined sequence of commands. Up to 300 command lines can be included in a UCS file. The following operations are supported by the UCS.
Output – Used to identify a frame for transmission, specifying the number of times you would like it sent and specify a transmission rate (in milliseconds). See section 4.7.1.
Wait – Used to define a delay between preceding and subsequent operations (command lines). See section 4.7.2.
Jump – Used to specify a jump to another command line (Output, Wait, Jump, or End) identified by the symbolic JUMP name you have assigned it. See section 4.7.3.
End – Used to specify the last line of a UCS command sequence. See section 4.7.4.
Comment – Used to insert a personal reminder of up to 50 characters. See section 4.7.5.
To create a UCS command sequence, first make sure you have an active Transmit Frame Table loaded. Then select the User Configured Scheduler command from the Configuration menu. This will open a User Configured Scheduler (UCS) dialog that lets you configure a UCS sequence using the commands described in the following sections.
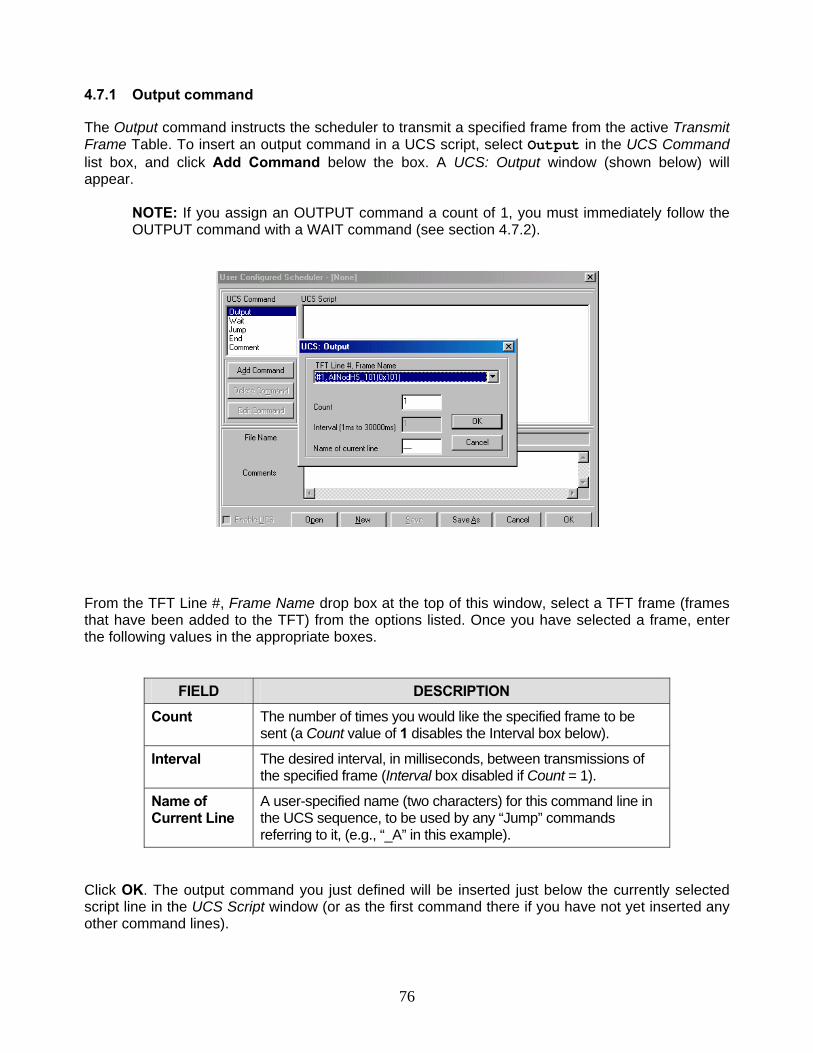
76
4.7.1 Output command
The Output command instructs the scheduler to transmit a specified frame from the active Transmit Frame Table. To insert an output command in a UCS script, select Output in the UCS Command list box, and click Add Command below the box. A UCS: Output window (shown below) will appear.
NOTE: If you assign an OUTPUT command a count of 1, you must immediately follow the OUTPUT command with a WAIT command (see section 4.7.2).
From the TFT Line #, Frame Name drop box at the top of this window, select a TFT frame (frames that have been added to the TFT) from the options listed. Once you have selected a frame, enter the following values in the appropriate boxes.
FIELD DESCRIPTION
Count The number of times you would like the specified frame to be sent (a Count value of 1 disables the Interval box below).
Interval The desired interval, in milliseconds, between transmissions of the specified frame (Interval box disabled if Count = 1).
Name of Current Line
A user-specified name (two characters) for this command line in the UCS sequence, to be used by any “Jump” commands referring to it, (e.g., “_A” in this example).
Click OK. The output command you just defined will be inserted just below the currently selected script line in the UCS Script window (or as the first command there if you have not yet inserted any other command lines).
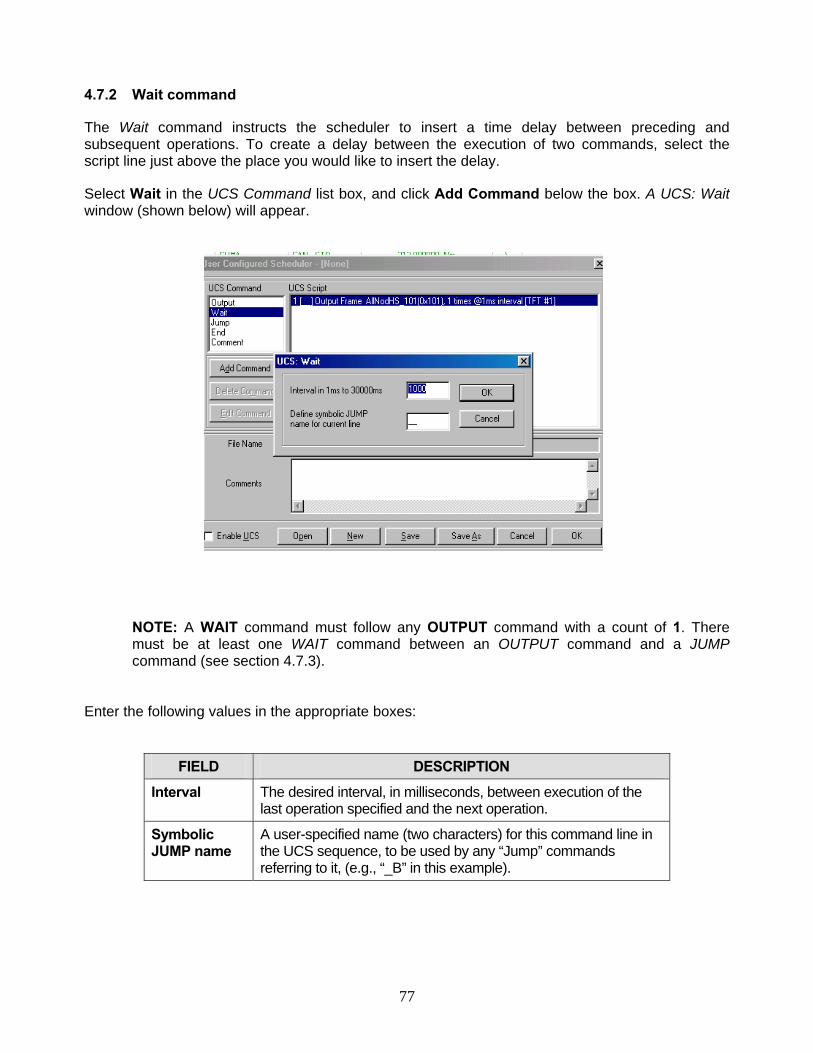
77
4.7.2 Wait command
The Wait command instructs the scheduler to insert a time delay between preceding and subsequent operations. To create a delay between the execution of two commands, select the script line just above the place you would like to insert the delay.
Select Wait in the UCS Command list box, and click Add Command below the box. A UCS: Wait window (shown below) will appear.
NOTE: A WAIT command must follow any OUTPUT command with a count of 1. There must be at least one WAIT command between an OUTPUT command and a JUMP command (see section 4.7.3).
Enter the following values in the appropriate boxes:
FIELD DESCRIPTION
Interval The desired interval, in milliseconds, between execution of the last operation specified and the next operation.
Symbolic JUMP name
A user-specified name (two characters) for this command line in the UCS sequence, to be used by any “Jump” commands referring to it, (e.g., “_B” in this example).
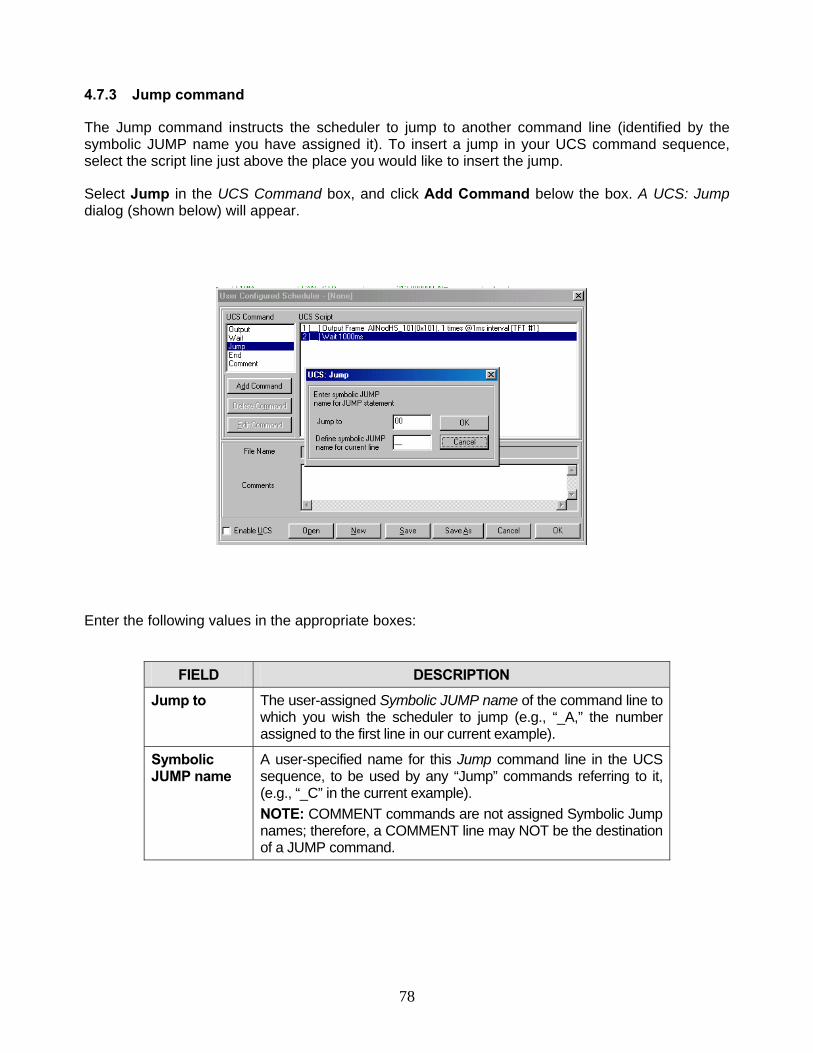
78
4.7.3 Jump command
The Jump command instructs the scheduler to jump to another command line (identified by the symbolic JUMP name you have assigned it). To insert a jump in your UCS command sequence, select the script line just above the place you would like to insert the jump.
Select Jump in the UCS Command box, and click Add Command below the box. A UCS: Jump dialog (shown below) will appear.
Enter the following values in the appropriate boxes:
FIELD DESCRIPTION
Jump to The user-assigned Symbolic JUMP name of the command line to which you wish the scheduler to jump (e.g., “_A,” the number assigned to the first line in our current example).
Symbolic JUMP name
A user-specified name for this Jump command line in the UCS sequence, to be used by any “Jump” commands referring to it, (e.g., “_C” in the current example). NOTE: COMMENT commands are not assigned Symbolic Jump names; therefore, a COMMENT line may NOT be the destination of a JUMP command.

79
4.7.4 End command
The End command signifies the final line of a UCS command sequence. To indicate the end of UCS sequence, select the last line of script in the UCS Script box.
NOTE: Every UCS sequence must include an END command.
Select End in the UCS Command box, and click Add Command.
Specify a line label for your End command, and click OK. An End line with the label you have specified will be added to the end of your UCS Script command sequence.
4.7.5 Comment command
The Comment command lets you insert a personal reminder (or a blank line) as a line of script in your sequence. To insert a comment into your command sequence, select the script line just above the place you would like the comment line to appear.
Select Comment in the UCS Command list box, and click Add Command. A UCS: Comment/Insert a blank line dialog (shown below) will appear.
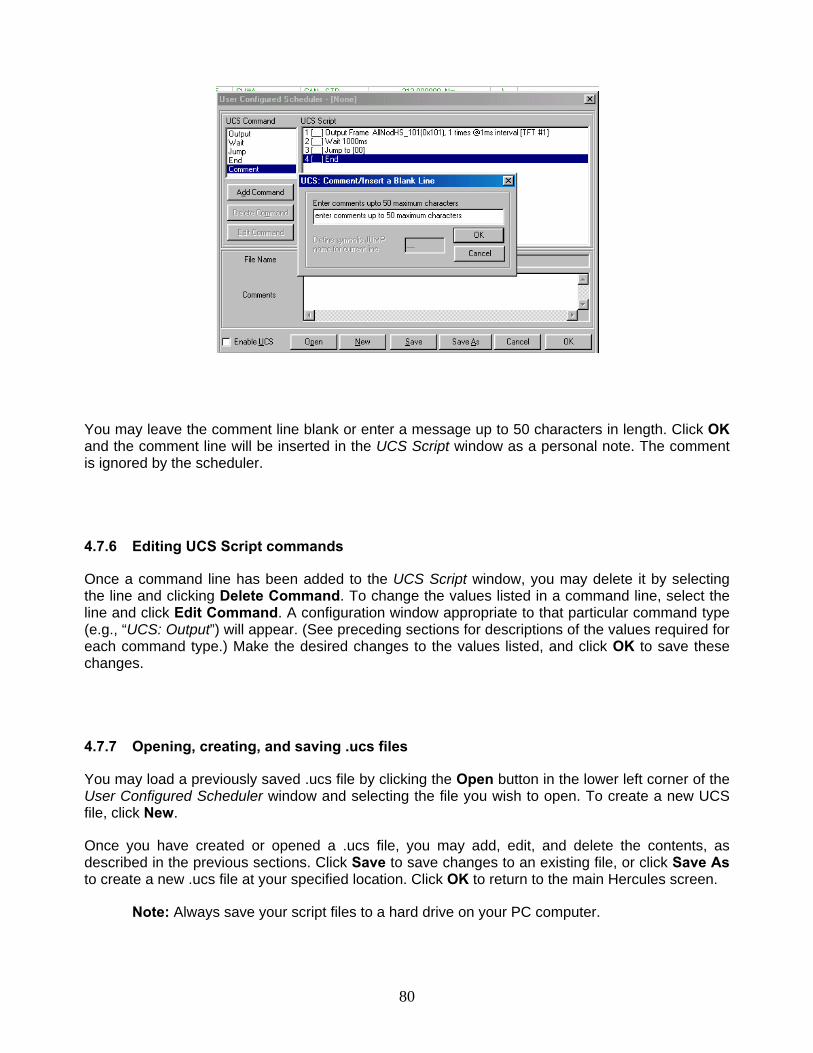
80
You may leave the comment line blank or enter a message up to 50 characters in length. Click OK and the comment line will be inserted in the UCS Script window as a personal note. The comment is ignored by the scheduler.
4.7.6 Editing UCS Script commands
Once a command line has been added to the UCS Script window, you may delete it by selecting the line and clicking Delete Command. To change the values listed in a command line, select the line and click Edit Command. A configuration window appropriate to that particular command type (e.g., “UCS: Output”) will appear. (See preceding sections for descriptions of the values required for each command type.) Make the desired changes to the values listed, and click OK to save these changes.
4.7.7 Opening, creating, and saving .ucs files
You may load a previously saved .ucs file by clicking the Open button in the lower left corner of the User Configured Scheduler window and selecting the file you wish to open. To create a new UCS file, click New.
Once you have created or opened a .ucs file, you may add, edit, and delete the contents, as described in the previous sections. Click Save to save changes to an existing file, or click Save As to create a new .ucs file at your specified location. Click OK to return to the main Hercules screen.
Note: Always save your script files to a hard drive on your PC computer.
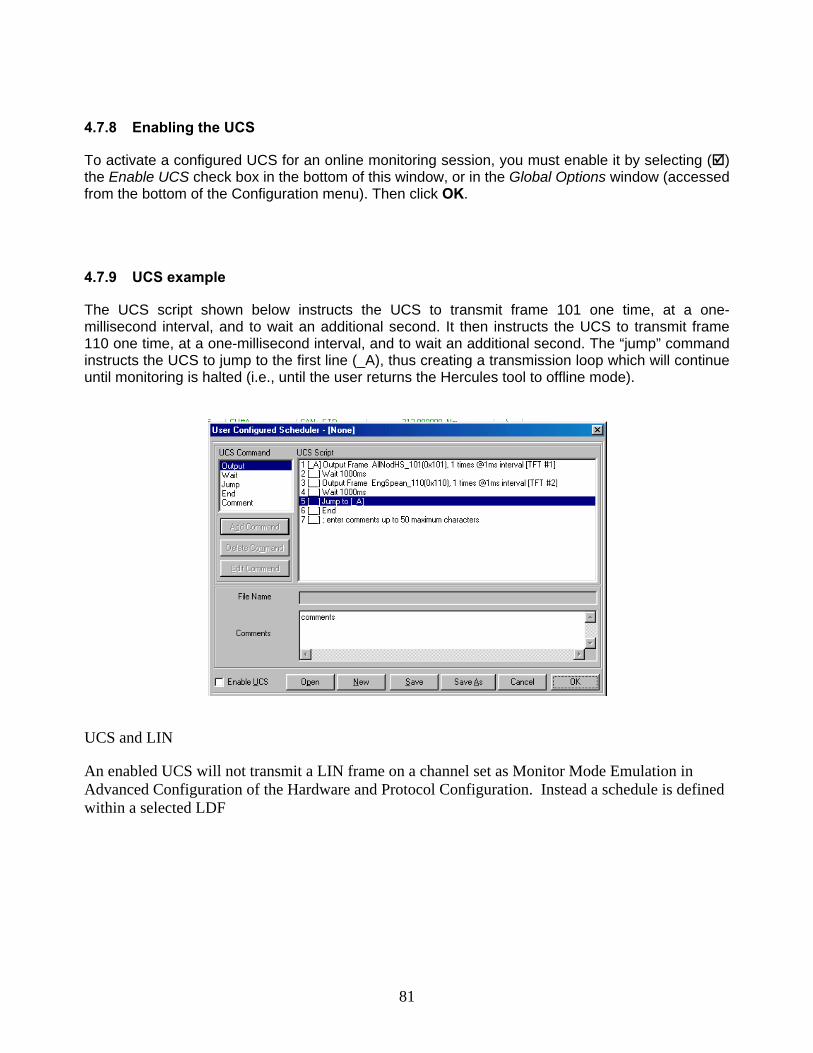
81
4.7.8 Enabling the UCS
To activate a configured UCS for an online monitoring session, you must enable it by selecting ( ) the Enable UCS check box in the bottom of this window, or in the Global Options window (accessed from the bottom of the Configuration menu). Then click OK.
4.7.9 UCS example
The UCS script shown below instructs the UCS to transmit frame 101 one time, at a one-millisecond interval, and to wait an additional second. It then instructs the UCS to transmit frame 110 one time, at a one-millisecond interval, and to wait an additional second. The “jump” command instructs the UCS to jump to the first line (_A), thus creating a transmission loop which will continue until monitoring is halted (i.e., until the user returns the Hercules tool to offline mode).
UCS and LIN An enabled UCS will not transmit a LIN frame on a channel set as Monitor Mode Emulation in Advanced Configuration of the Hardware and Protocol Configuration. Instead a schedule is defined within a selected LDF
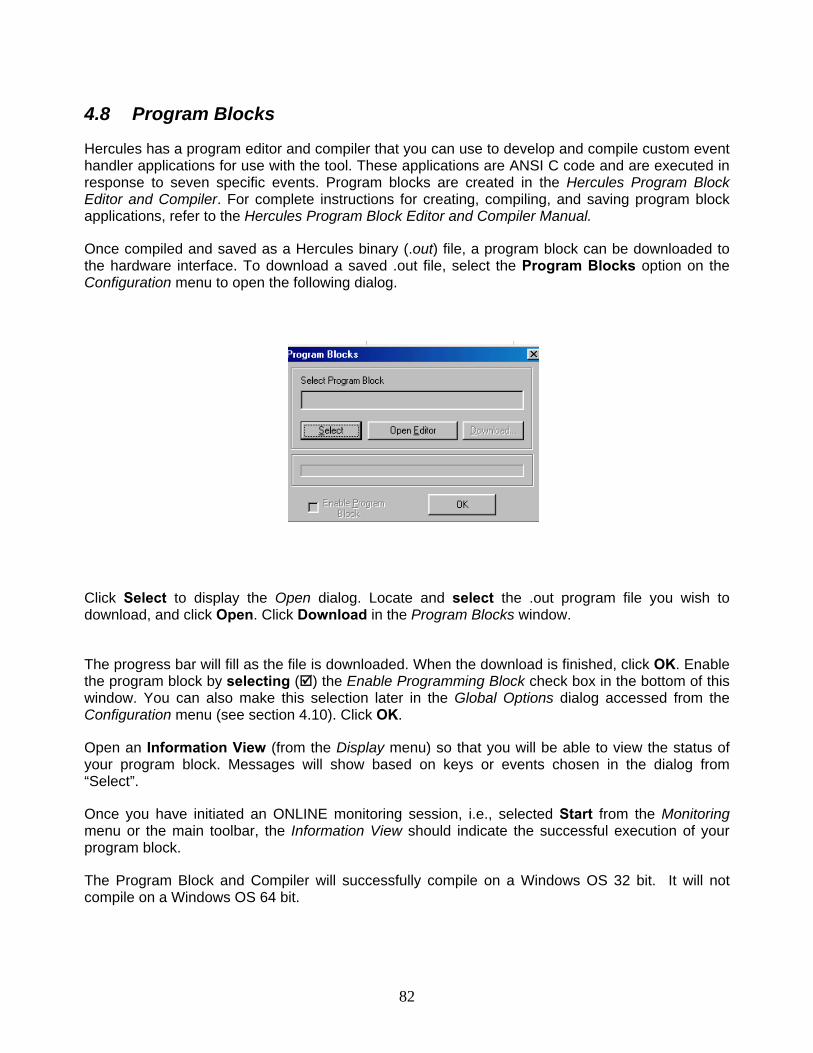
82
4.8 Program Blocks
Hercules has a program editor and compiler that you can use to develop and compile custom event handler applications for use with the tool. These applications are ANSI C code and are executed in response to seven specific events. Program blocks are created in the Hercules Program Block Editor and Compiler. For complete instructions for creating, compiling, and saving program block applications, refer to the Hercules Program Block Editor and Compiler Manual.
Once compiled and saved as a Hercules binary (.out) file, a program block can be downloaded to the hardware interface. To download a saved .out file, select the Program Blocks option on the Configuration menu to open the following dialog.
Click Select to display the Open dialog. Locate and select the .out program file you wish to download, and click Open. Click Download in the Program Blocks window.
The progress bar will fill as the file is downloaded. When the download is finished, click OK. Enable the program block by selecting ( ) the Enable Programming Block check box in the bottom of this window. You can also make this selection later in the Global Options dialog accessed from the Configuration menu (see section 4.10). Click OK.
Open an Information View (from the Display menu) so that you will be able to view the status of your program block. Messages will show based on keys or events chosen in the dialog from “Select”.
Once you have initiated an ONLINE monitoring session, i.e., selected Start from the Monitoring menu or the main toolbar, the Information View should indicate the successful execution of your program block.
The Program Block and Compiler will successfully compile on a Windows OS 32 bit. It will not compile on a Windows OS 64 bit.
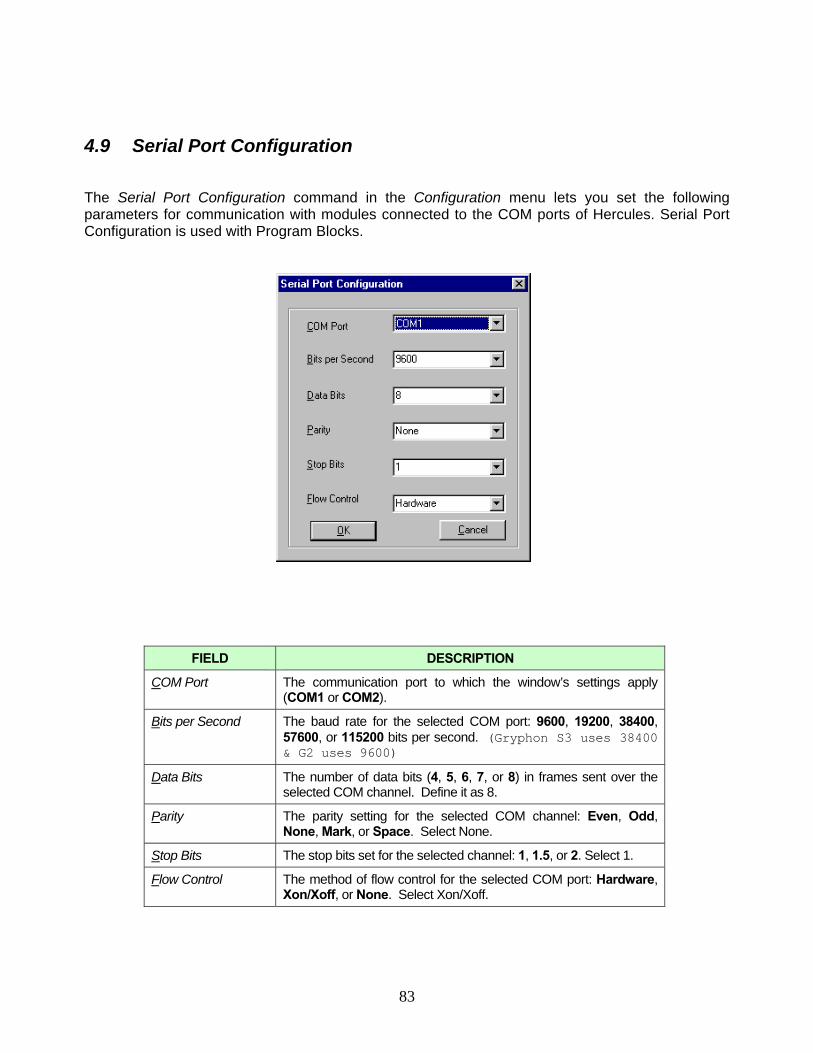
83
4.9 Serial Port Configuration
The Serial Port Configuration command in the Configuration menu lets you set the following parameters for communication with modules connected to the COM ports of Hercules. Serial Port Configuration is used with Program Blocks.
FIELD DESCRIPTION
COM Port The communication port to which the window’s settings apply (COM1 or COM2).
Bits per Second The baud rate for the selected COM port: 9600, 19200, 38400, 57600, or 115200 bits per second. (Gryphon S3 uses 38400& G2 uses 9600)
Data Bits The number of data bits (4, 5, 6, 7, or 8) in frames sent over the selected COM channel. Define it as 8.
Parity The parity setting for the selected COM channel: Even, Odd, None, Mark, or Space. Select None.
Stop Bits The stop bits set for the selected channel: 1, 1.5, or 2. Select 1.
Flow Control The method of flow control for the selected COM port: Hardware, Xon/Xoff, or None. Select Xon/Xoff.
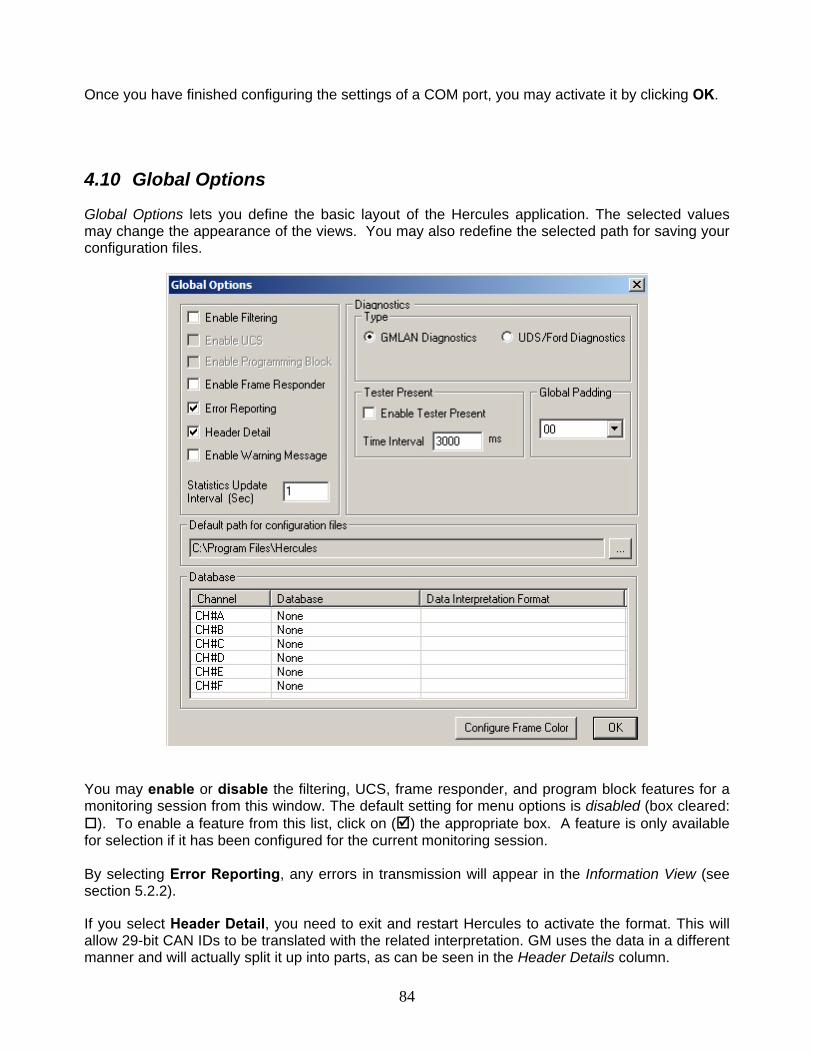
84
Once you have finished configuring the settings of a COM port, you may activate it by clicking OK.
4.10 Global Options
Global Options lets you define the basic layout of the Hercules application. The selected values may change the appearance of the views. You may also redefine the selected path for saving your configuration files.
You may enable or disable the filtering, UCS, frame responder, and program block features for a monitoring session from this window. The default setting for menu options is disabled (box cleared:
). To enable a feature from this list, click on ( ) the appropriate box. A feature is only available for selection if it has been configured for the current monitoring session. By selecting Error Reporting, any errors in transmission will appear in the Information View (see section 5.2.2).
If you select Header Detail, you need to exit and restart Hercules to activate the format. This will allow 29-bit CAN IDs to be translated with the related interpretation. GM uses the data in a different manner and will actually split it up into parts, as can be seen in the Header Details column.
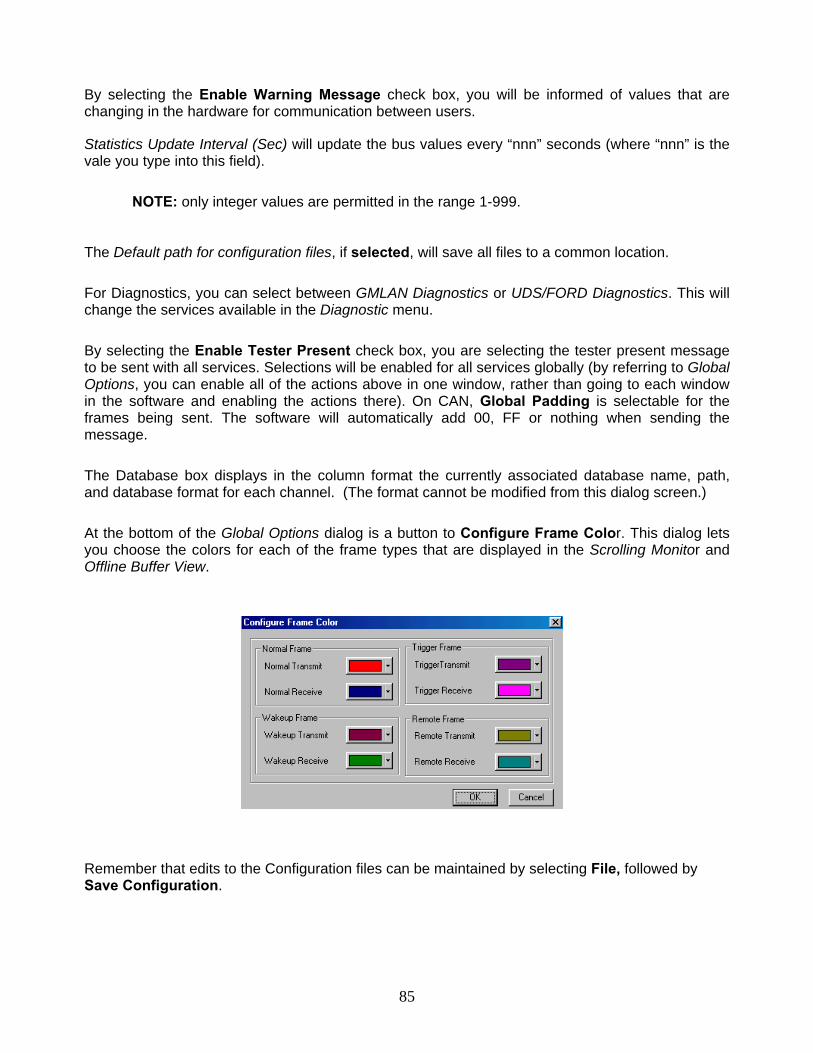
85
By selecting the Enable Warning Message check box, you will be informed of values that are changing in the hardware for communication between users.
Statistics Update Interval (Sec) will update the bus values every “nnn” seconds (where “nnn” is the vale you type into this field).
NOTE: only integer values are permitted in the range 1-999. The Default path for configuration files, if selected, will save all files to a common location.
For Diagnostics, you can select between GMLAN Diagnostics or UDS/FORD Diagnostics. This will change the services available in the Diagnostic menu.
By selecting the Enable Tester Present check box, you are selecting the tester present message to be sent with all services. Selections will be enabled for all services globally (by referring to Global Options, you can enable all of the actions above in one window, rather than going to each window in the software and enabling the actions there). On CAN, Global Padding is selectable for the frames being sent. The software will automatically add 00, FF or nothing when sending the message.
The Database box displays in the column format the currently associated database name, path, and database format for each channel. (The format cannot be modified from this dialog screen.)
At the bottom of the Global Options dialog is a button to Configure Frame Color. This dialog lets you choose the colors for each of the frame types that are displayed in the Scrolling Monitor and Offline Buffer View.
Remember that edits to the Configuration files can be maintained by selecting File, followed by Save Configuration.
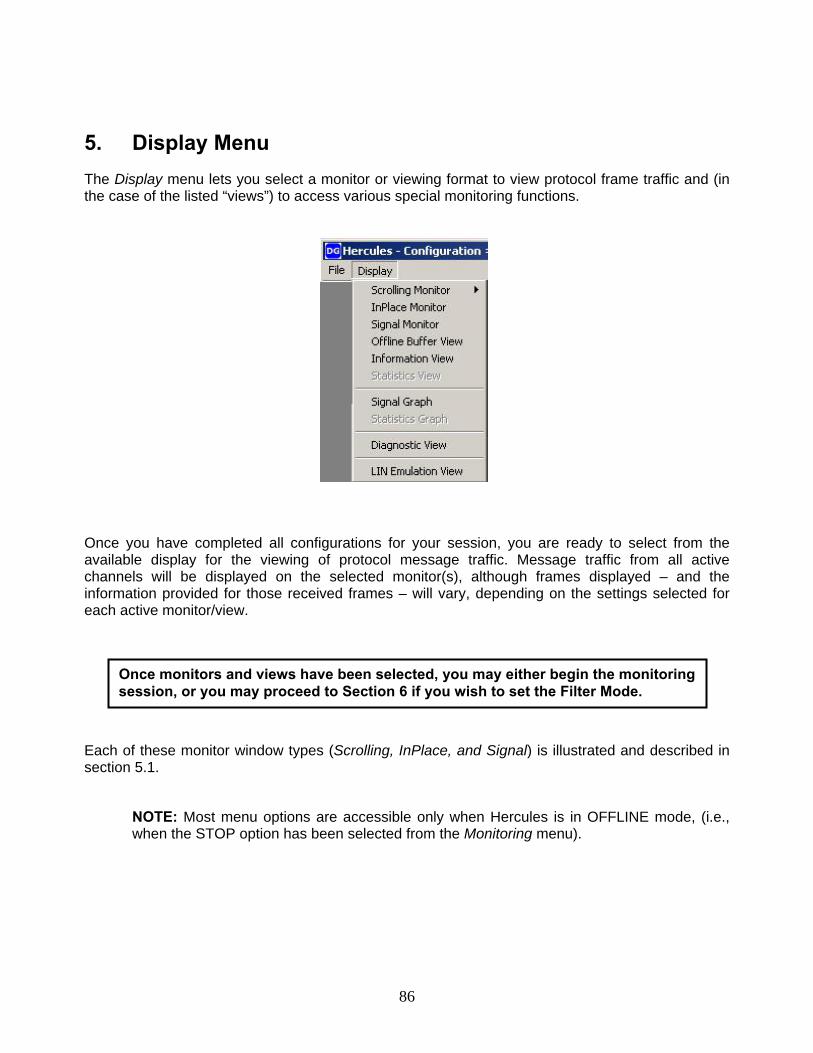
86
5. Display Menu The Display menu lets you select a monitor or viewing format to view protocol frame traffic and (in the case of the listed “views”) to access various special monitoring functions.
Once you have completed all configurations for your session, you are ready to select from the available display for the viewing of protocol message traffic. Message traffic from all active channels will be displayed on the selected monitor(s), although frames displayed – and the information provided for those received frames – will vary, depending on the settings selected for each active monitor/view.
Each of these monitor window types (Scrolling, InPlace, and Signal) is illustrated and described in section 5.1.
NOTE: Most menu options are accessible only when Hercules is in OFFLINE mode, (i.e., when the STOP option has been selected from the Monitoring menu).
Once monitors and views have been selected, you may either begin the monitoring session, or you may proceed to Section 6 if you wish to set the Filter Mode.
87
The following five special views are also available:
Offline Buffer View For: offline viewing of frames captured in the Hercules buffer.
Information View For: the viewing of login and hardware status.
Statistics View For: analysis of bus loading and frame transmission statistics.
Diagnostic View For: analysis of functions executed from the Diagnostics menu.
LIN Emulation View For: viewing LIN Emulation Information from a selected LDF, and for Frame Data update functionality. Available only if the LIN module is set as Emulation in Advanced Configuration in HW&P Configuration.
These views are shown and described in section 5.2.
5.1 Selecting a Monitor
There are three different monitor types that are available for displaying frame information: Scrolling Monitor, In-place Monitor, and Signal Monitor. These monitors can operate simultaneously. When you select a monitor, a menu appears directly to the right of the Display menu. It lists the commands needed to format and use the monitor. You may also right-click in the table to access the menus. Also appearing will be a Window menu with two arrangement options (Cascade and Tile) for the simultaneous display of multiple monitors.
The Scrolling Monitor records all bus traffic, where as the In-place Monitor displays only the messages with certain frame ID and the Signal Monitor displays signals specific to certain frames.
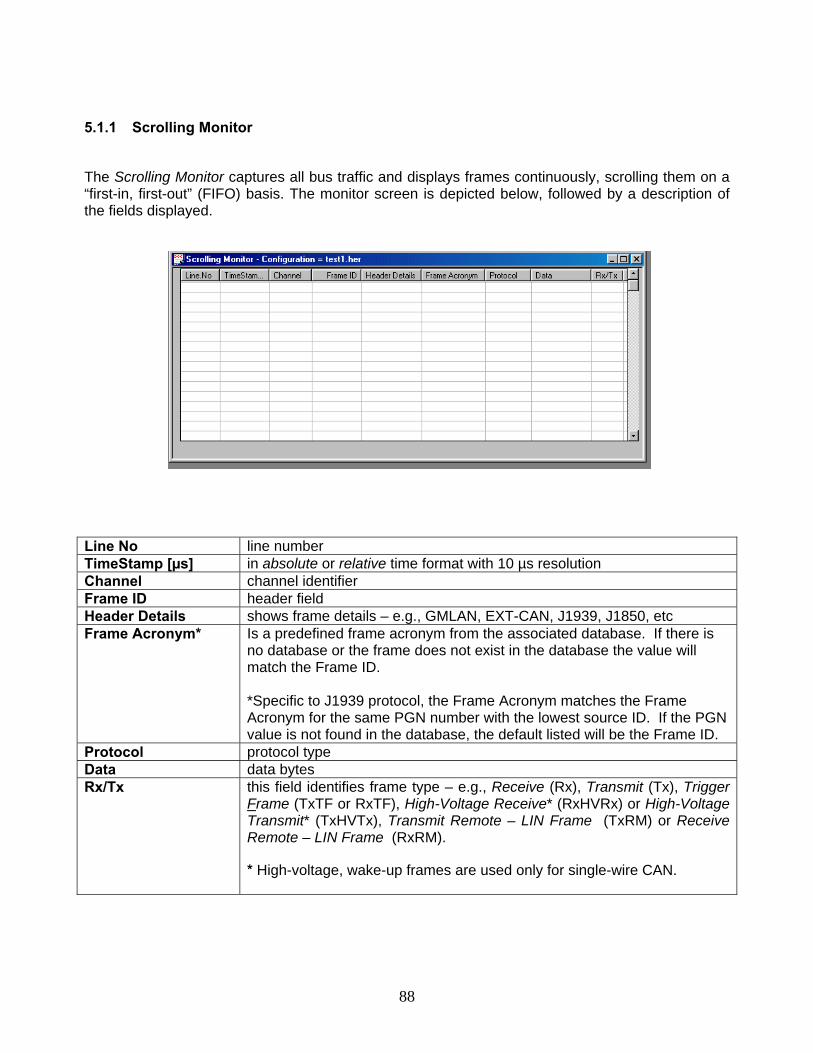
88
5.1.1 Scrolling Monitor
The Scrolling Monitor captures all bus traffic and displays frames continuously, scrolling them on a “first-in, first-out” (FIFO) basis. The monitor screen is depicted below, followed by a description of the fields displayed.
Line No line number TimeStamp [µs] in absolute or relative time format with 10 µs resolution Channel channel identifier Frame ID header field Header Details shows frame details – e.g., GMLAN, EXT-CAN, J1939, J1850, etc Frame Acronym* Is a predefined frame acronym from the associated database. If there is
no database or the frame does not exist in the database the value will match the Frame ID. *Specific to J1939 protocol, the Frame Acronym matches the Frame Acronym for the same PGN number with the lowest source ID. If the PGN value is not found in the database, the default listed will be the Frame ID.
Protocol protocol type Data data bytes Rx/Tx this field identifies frame type – e.g., Receive (Rx), Transmit (Tx), Trigger
Frame (TxTF or RxTF), High-Voltage Receive* (RxHVRx) or High-Voltage Transmit* (TxHVTx), Transmit Remote – LIN Frame (TxRM) or Receive Remote – LIN Frame (RxRM).
* High-voltage, wake-up frames are used only for single-wire CAN.
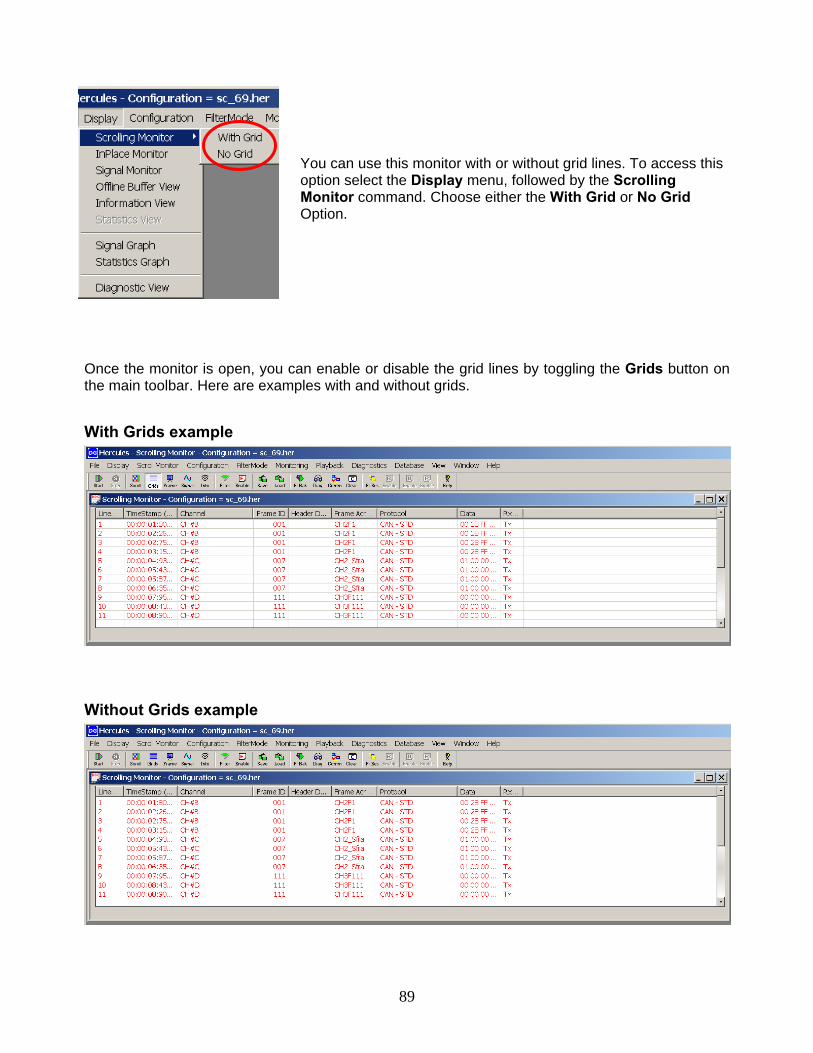
89
You can use this monitor with or without grid lines. To access this option select the Display menu, followed by the Scrolling Monitor command. Choose either the With Grid or No Grid Option.
Once the monitor is open, you can enable or disable the grid lines by toggling the Grids button on the main toolbar. Here are examples with and without grids.
With Grids example
Without Grids example
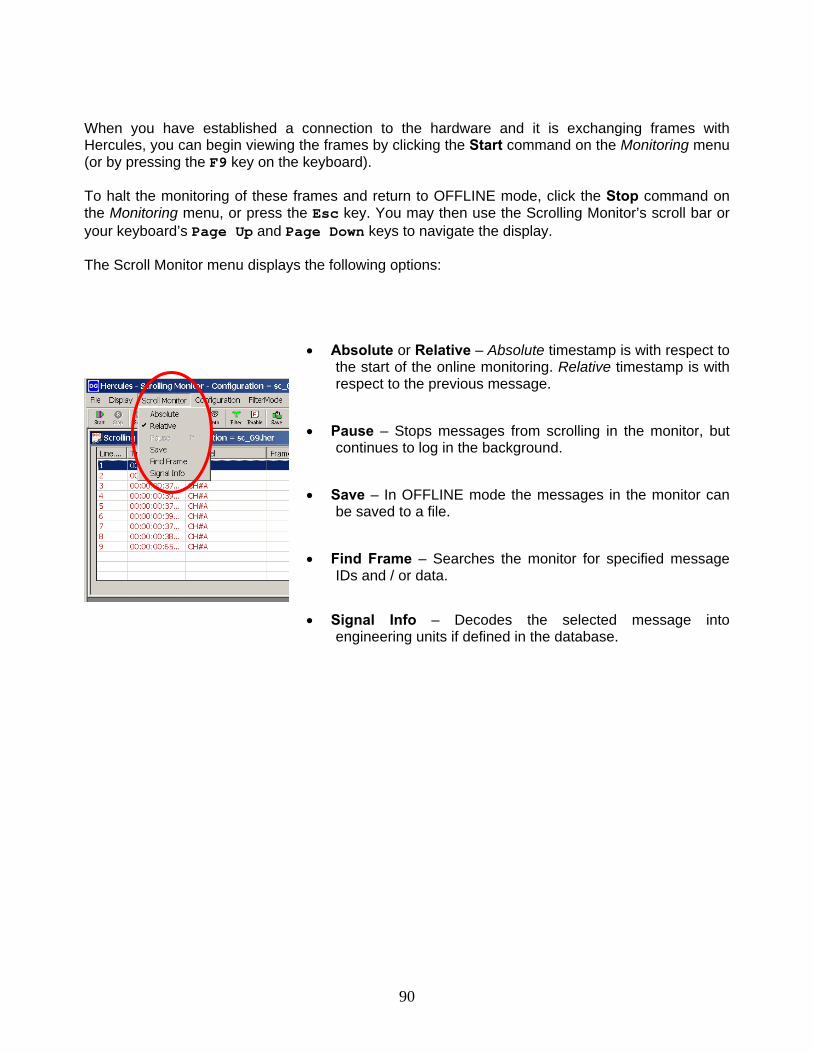
90
When you have established a connection to the hardware and it is exchanging frames with Hercules, you can begin viewing the frames by clicking the Start command on the Monitoring menu (or by pressing the F9 key on the keyboard).
To halt the monitoring of these frames and return to OFFLINE mode, click the Stop command on the Monitoring menu, or press the Esc key. You may then use the Scrolling Monitor’s scroll bar or your keyboard’s Page Up and Page Down keys to navigate the display.
The Scroll Monitor menu displays the following options:
• Absolute or Relative – Absolute timestamp is with respect to
the start of the online monitoring. Relative timestamp is with respect to the previous message.
• Pause – Stops messages from scrolling in the monitor, but continues to log in the background.
• Save – In OFFLINE mode the messages in the monitor can be saved to a file.
• Find Frame – Searches the monitor for specified message IDs and / or data.
• Signal Info – Decodes the selected message into engineering units if defined in the database.
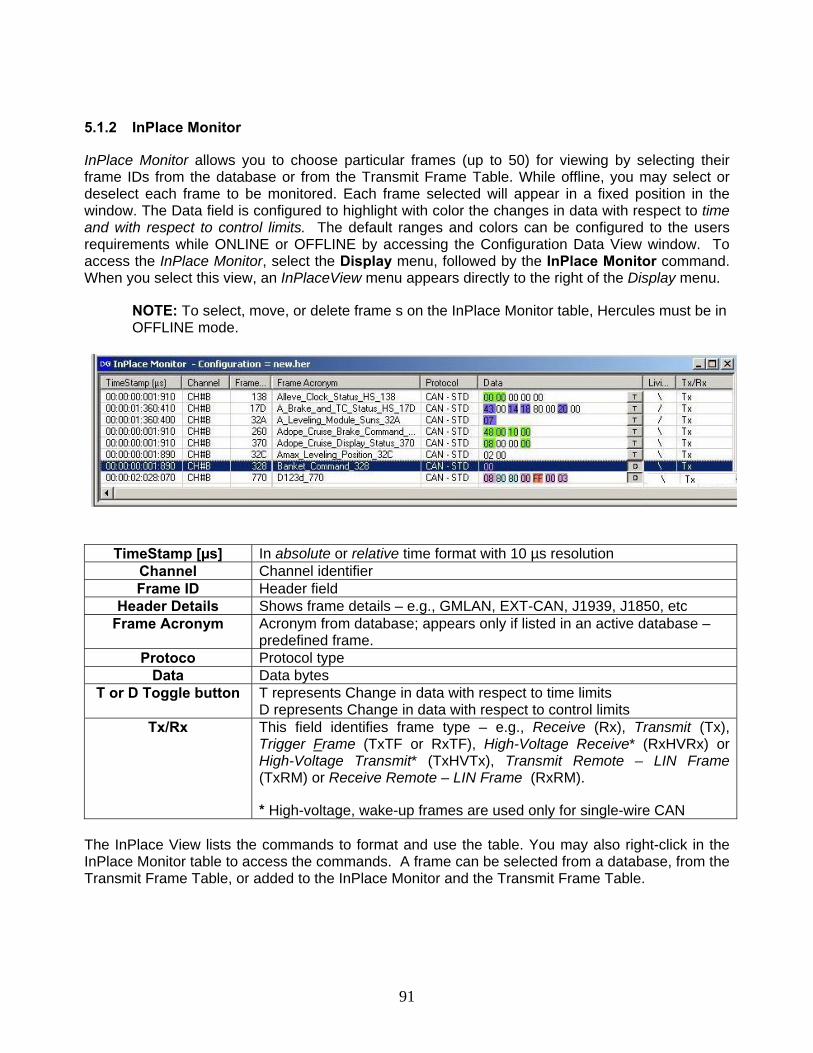
91
5.1.2 InPlace Monitor
InPlace Monitor allows you to choose particular frames (up to 50) for viewing by selecting their frame IDs from the database or from the Transmit Frame Table. While offline, you may select or deselect each frame to be monitored. Each frame selected will appear in a fixed position in the window. The Data field is configured to highlight with color the changes in data with respect to time and with respect to control limits. The default ranges and colors can be configured to the users requirements while ONLINE or OFFLINE by accessing the Configuration Data View window. To access the InPlace Monitor, select the Display menu, followed by the InPlace Monitor command. When you select this view, an InPlaceView menu appears directly to the right of the Display menu.
NOTE: To select, move, or delete frame s on the InPlace Monitor table, Hercules must be in OFFLINE mode.
TimeStamp [µs] In absolute or relative time format with 10 µs resolution Channel Channel identifier Frame ID Header field
Header Details Shows frame details – e.g., GMLAN, EXT-CAN, J1939, J1850, etc Frame Acronym Acronym from database; appears only if listed in an active database –
predefined frame. Protoco Protocol type
Data Data bytes T or D Toggle button T represents Change in data with respect to time limits
D represents Change in data with respect to control limits Tx/Rx This field identifies frame type – e.g., Receive (Rx), Transmit (Tx),
Trigger Frame (TxTF or RxTF), High-Voltage Receive* (RxHVRx) or High-Voltage Transmit* (TxHVTx), Transmit Remote – LIN Frame (TxRM) or Receive Remote – LIN Frame (RxRM).
* High-voltage, wake-up frames are used only for single-wire CAN The InPlace View lists the commands to format and use the table. You may also right-click in the InPlace Monitor table to access the commands. A frame can be selected from a database, from the Transmit Frame Table, or added to the InPlace Monitor and the Transmit Frame Table.
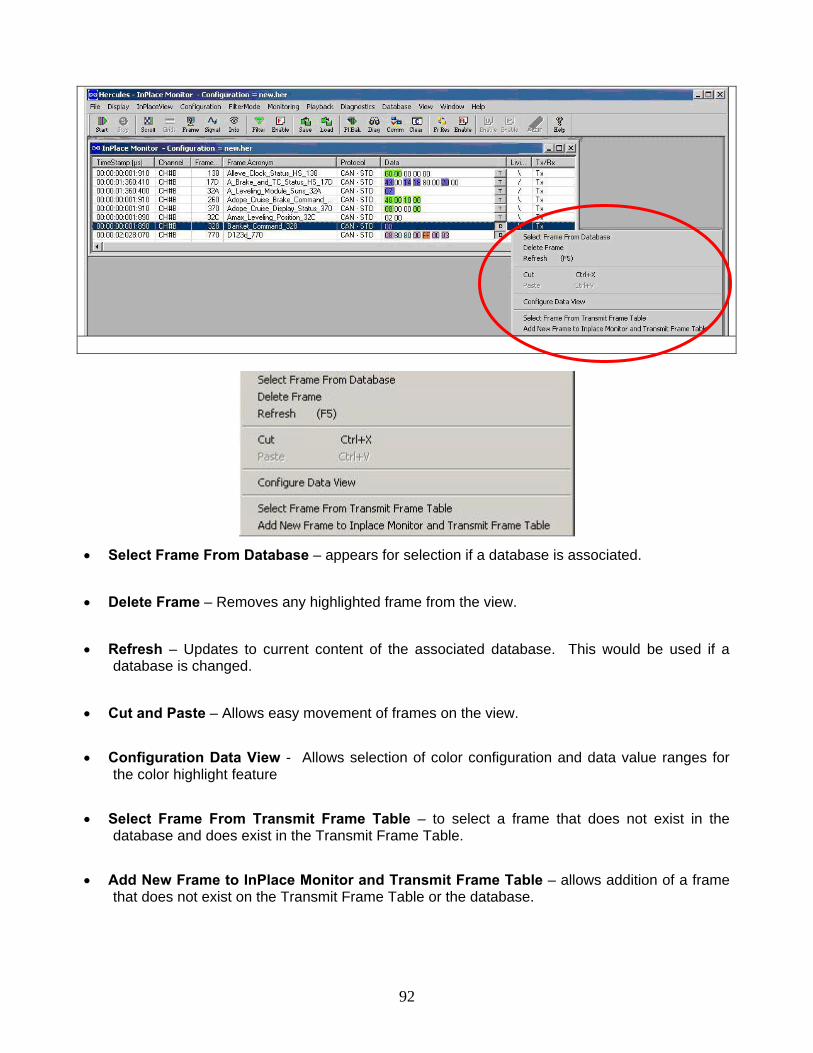
92
• Select Frame From Database – appears for selection if a database is associated.
• Delete Frame – Removes any highlighted frame from the view.
• Refresh – Updates to current content of the associated database. This would be used if a database is changed.
• Cut and Paste – Allows easy movement of frames on the view.
• Configuration Data View - Allows selection of color configuration and data value ranges for the color highlight feature
• Select Frame From Transmit Frame Table – to select a frame that does not exist in the database and does exist in the Transmit Frame Table.
• Add New Frame to InPlace Monitor and Transmit Frame Table – allows addition of a frame that does not exist on the Transmit Frame Table or the database.

93
You may add a frame to the InPlace Monitor . Select Frame from Database, Select Frame from Transmit Frame Table, and Add Frame to InPlace Monitor and Transmit Frame Table.
1. Select Frame from Database
1.1 Right-click a blank line in the InPlace Frame Monitor table, or click Select Frame from Database or Select Frame From Transmit Frame Table. on the InPlaceView menu. A Select Frame dialog displays frame IDs and frame acronyms from the database. To sort content, click on the ID or Acronym column header.
1.2 Select a CAN/protocol channel. If using CAN, select a CAN type: Standard (CAN-
STD) CAN or Extended (CAN-EXT) CAN. 1.3 Select one of the frames you would like to add to the monitor list, and click OK. You
are returned to the InPlace Monitor table with an entry for the selected frame.
Repeat steps 1 through 3 for each frame (up to a total of ten) that you wish to add to the monitor. To remove a frame from your list, select the frame’s entry in the InPlace Frame Monitor window; click Delete Frame in the InPlaceView menu, or on the menu that appears when you right-click in the InPlace Monitor window.
2. Select Frame from Transmit Frame Table
2.1 Right-click a blank line in the InPlace Frame Monitor table. Click Select Frame from Transmit Frame Table. A Select Frame dialog displays Frame IDs and Frame Acronyms from the Transmit Frame Table. Click to highlight one or more frames to add to the monitor. Click OK to include the frames and to close the window. Click Close to return to the Transmit Frame Table window with out added the frame.
3. Add Frame to Transmit Frame Table and InPlace Monitor
3.1 Right-click a blank line in the InPlace Frame Monitor table. Click Add Frame to Transmit Frame Table and InPlace Monitor. Add New Frame dialog window appears allowing the Frame type, Protocol, Frame ID, Data Count and Data bytes values to be selected. For the purpose of viewing only, the actual data byte values need not be correct. Click OK to include the frames and to close the window. Click Close to close the window with out added the frame
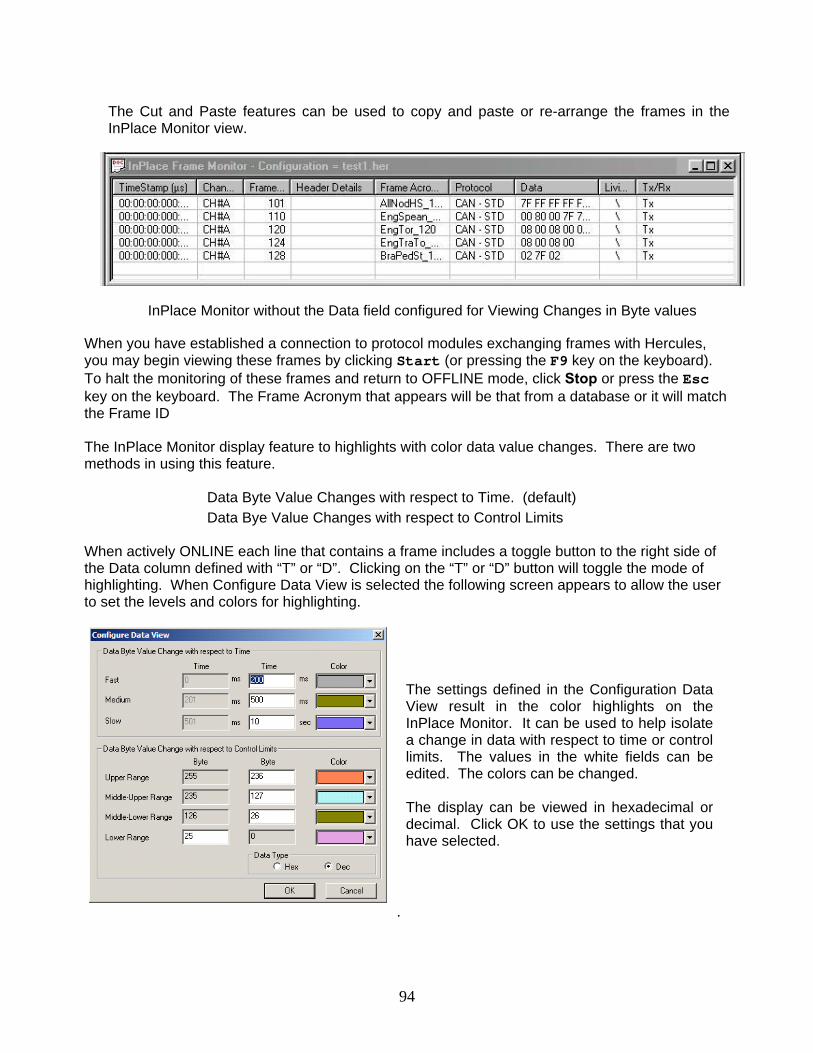
94
The Cut and Paste features can be used to copy and paste or re-arrange the frames in the InPlace Monitor view.
InPlace Monitor without the Data field configured for Viewing Changes in Byte values
When you have established a connection to protocol modules exchanging frames with Hercules, you may begin viewing these frames by clicking Start (or pressing the F9 key on the keyboard). To halt the monitoring of these frames and return to OFFLINE mode, click Stop or press the Esc key on the keyboard. The Frame Acronym that appears will be that from a database or it will match the Frame ID The InPlace Monitor display feature to highlights with color data value changes. There are two methods in using this feature.
Data Byte Value Changes with respect to Time. (default) Data Bye Value Changes with respect to Control Limits
When actively ONLINE each line that contains a frame includes a toggle button to the right side of the Data column defined with “T” or “D”. Clicking on the “T” or “D” button will toggle the mode of highlighting. When Configure Data View is selected the following screen appears to allow the user to set the levels and colors for highlighting.
The settings defined in the Configuration Data View result in the color highlights on the InPlace Monitor. It can be used to help isolate a change in data with respect to time or control limits. The values in the white fields can be edited. The colors can be changed. The display can be viewed in hexadecimal or decimal. Click OK to use the settings that you have selected.
.
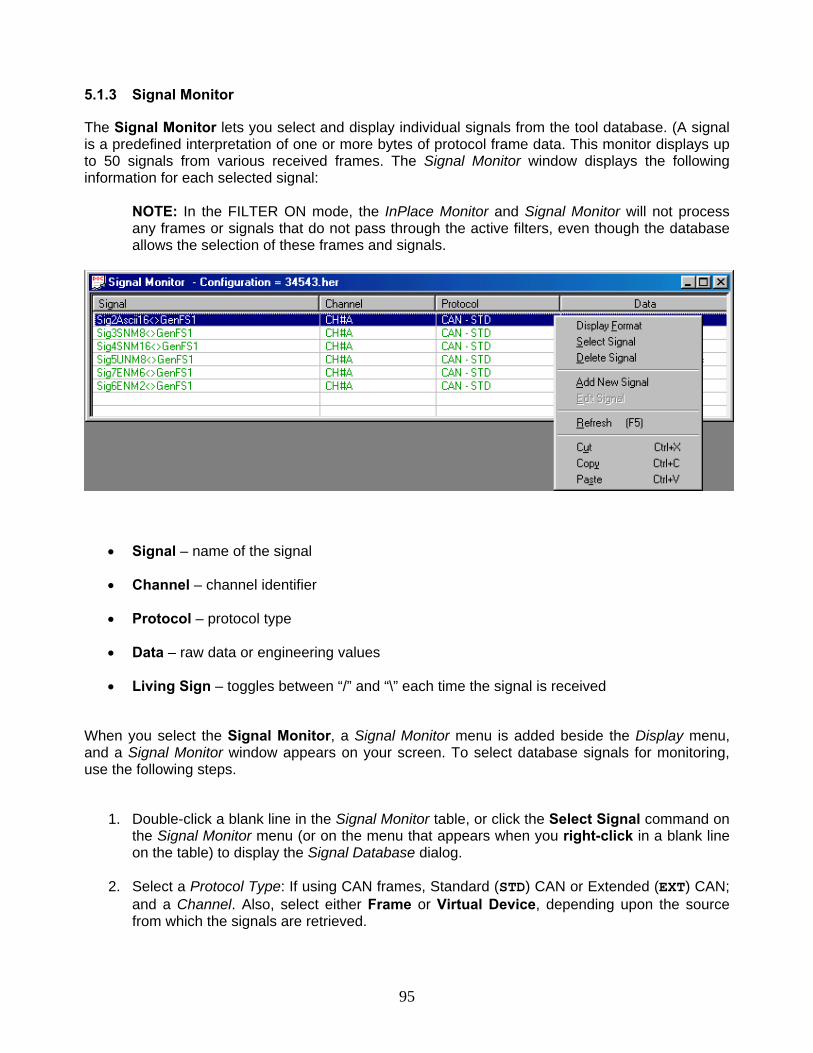
95
5.1.3 Signal Monitor
The Signal Monitor lets you select and display individual signals from the tool database. (A signal is a predefined interpretation of one or more bytes of protocol frame data. This monitor displays up to 50 signals from various received frames. The Signal Monitor window displays the following information for each selected signal:
NOTE: In the FILTER ON mode, the InPlace Monitor and Signal Monitor will not process any frames or signals that do not pass through the active filters, even though the database allows the selection of these frames and signals.
• Signal – name of the signal
• Channel – channel identifier
• Protocol – protocol type
• Data – raw data or engineering values
• Living Sign – toggles between “/” and “\” each time the signal is received
When you select the Signal Monitor, a Signal Monitor menu is added beside the Display menu, and a Signal Monitor window appears on your screen. To select database signals for monitoring, use the following steps.
1. Double-click a blank line in the Signal Monitor table, or click the Select Signal command on
the Signal Monitor menu (or on the menu that appears when you right-click in a blank line on the table) to display the Signal Database dialog.
2. Select a Protocol Type: If using CAN frames, Standard (STD) CAN or Extended (EXT) CAN;
and a Channel. Also, select either Frame or Virtual Device, depending upon the source from which the signals are retrieved.
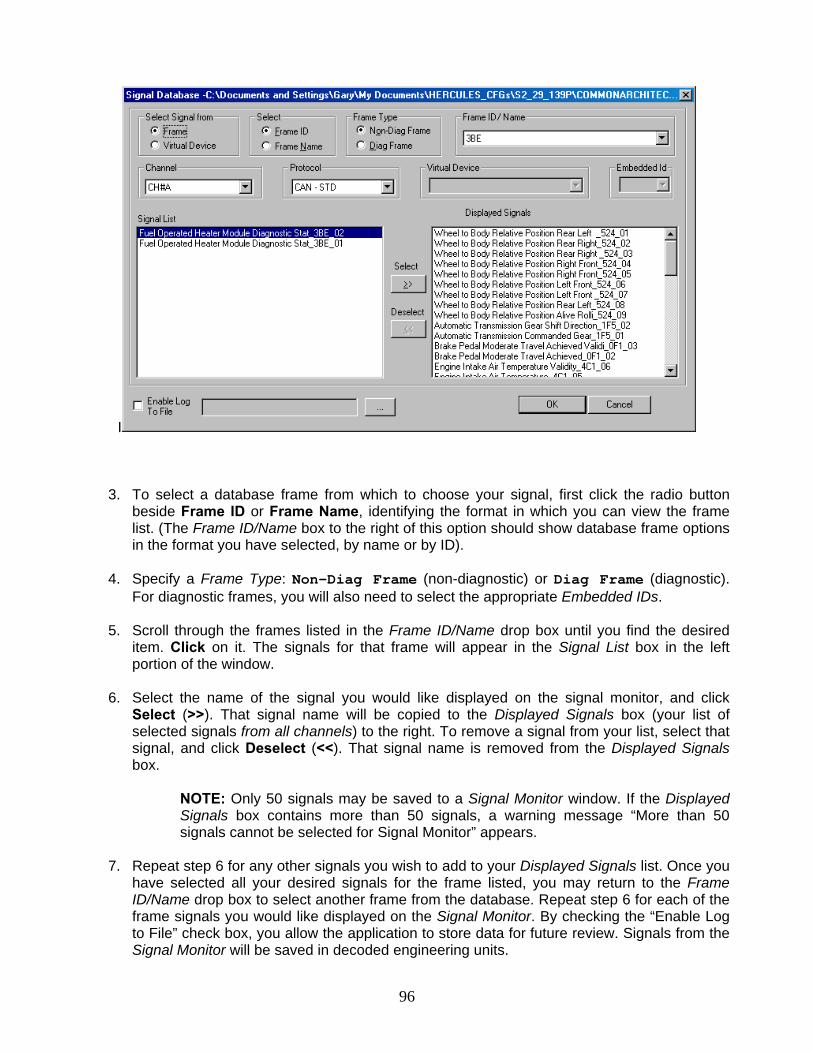
96
I
3. To select a database frame from which to choose your signal, first click the radio button beside Frame ID or Frame Name, identifying the format in which you can view the frame list. (The Frame ID/Name box to the right of this option should show database frame options in the format you have selected, by name or by ID).
4. Specify a Frame Type: Non-Diag Frame (non-diagnostic) or Diag Frame (diagnostic).
For diagnostic frames, you will also need to select the appropriate Embedded IDs.
5. Scroll through the frames listed in the Frame ID/Name drop box until you find the desired item. Click on it. The signals for that frame will appear in the Signal List box in the left portion of the window.
6. Select the name of the signal you would like displayed on the signal monitor, and click
Select (>>). That signal name will be copied to the Displayed Signals box (your list of selected signals from all channels) to the right. To remove a signal from your list, select that signal, and click Deselect (<<). That signal name is removed from the Displayed Signals box.
NOTE: Only 50 signals may be saved to a Signal Monitor window. If the Displayed Signals box contains more than 50 signals, a warning message “More than 50 signals cannot be selected for Signal Monitor” appears.
7. Repeat step 6 for any other signals you wish to add to your Displayed Signals list. Once you
have selected all your desired signals for the frame listed, you may return to the Frame ID/Name drop box to select another frame from the database. Repeat step 6 for each of the frame signals you would like displayed on the Signal Monitor. By checking the “Enable Log to File” check box, you allow the application to store data for future review. Signals from the Signal Monitor will be saved in decoded engineering units.
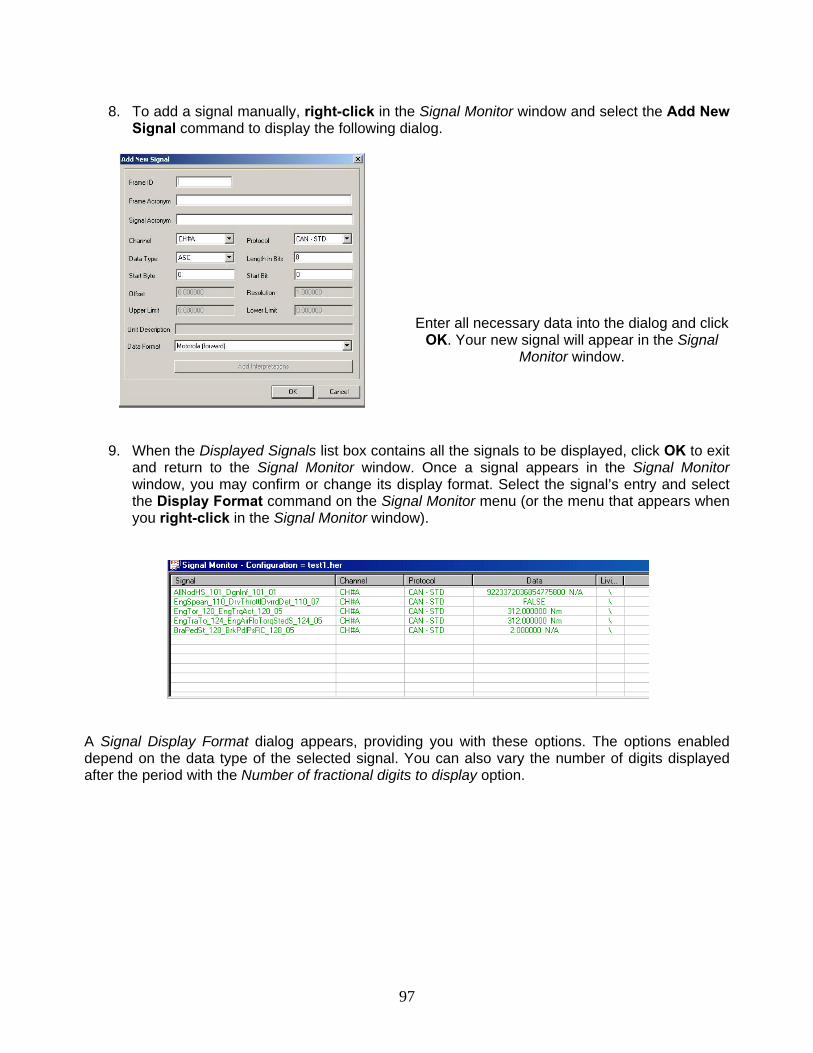
97
8. To add a signal manually, right-click in the Signal Monitor window and select the Add New
Signal command to display the following dialog.
Enter all necessary data into the dialog and click OK. Your new signal will appear in the Signal
Monitor window.
9. When the Displayed Signals list box contains all the signals to be displayed, click OK to exit and return to the Signal Monitor window. Once a signal appears in the Signal Monitor window, you may confirm or change its display format. Select the signal’s entry and select the Display Format command on the Signal Monitor menu (or the menu that appears when you right-click in the Signal Monitor window).
A Signal Display Format dialog appears, providing you with these options. The options enabled depend on the data type of the selected signal. You can also vary the number of digits displayed after the period with the Number of fractional digits to display option.
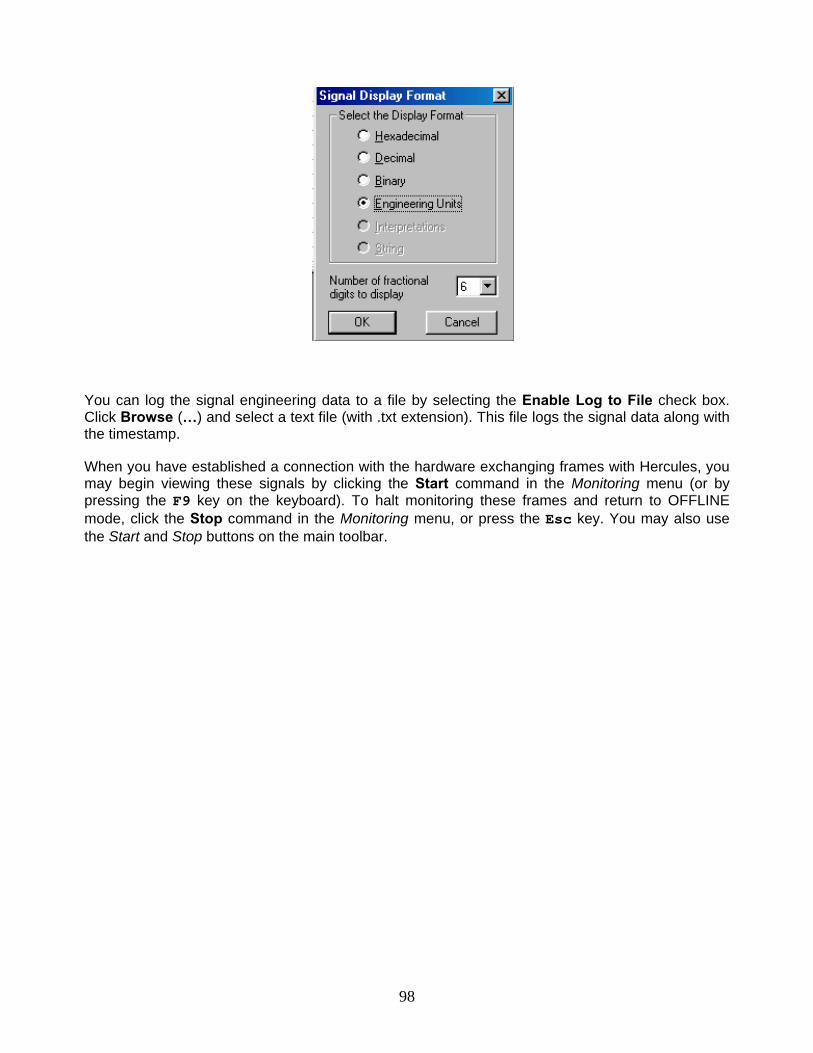
98
You can log the signal engineering data to a file by selecting the Enable Log to File check box. Click Browse (…) and select a text file (with .txt extension). This file logs the signal data along with the timestamp.
When you have established a connection with the hardware exchanging frames with Hercules, you may begin viewing these signals by clicking the Start command in the Monitoring menu (or by pressing the F9 key on the keyboard). To halt monitoring these frames and return to OFFLINE mode, click the Stop command in the Monitoring menu, or press the Esc key. You may also use the Start and Stop buttons on the main toolbar.
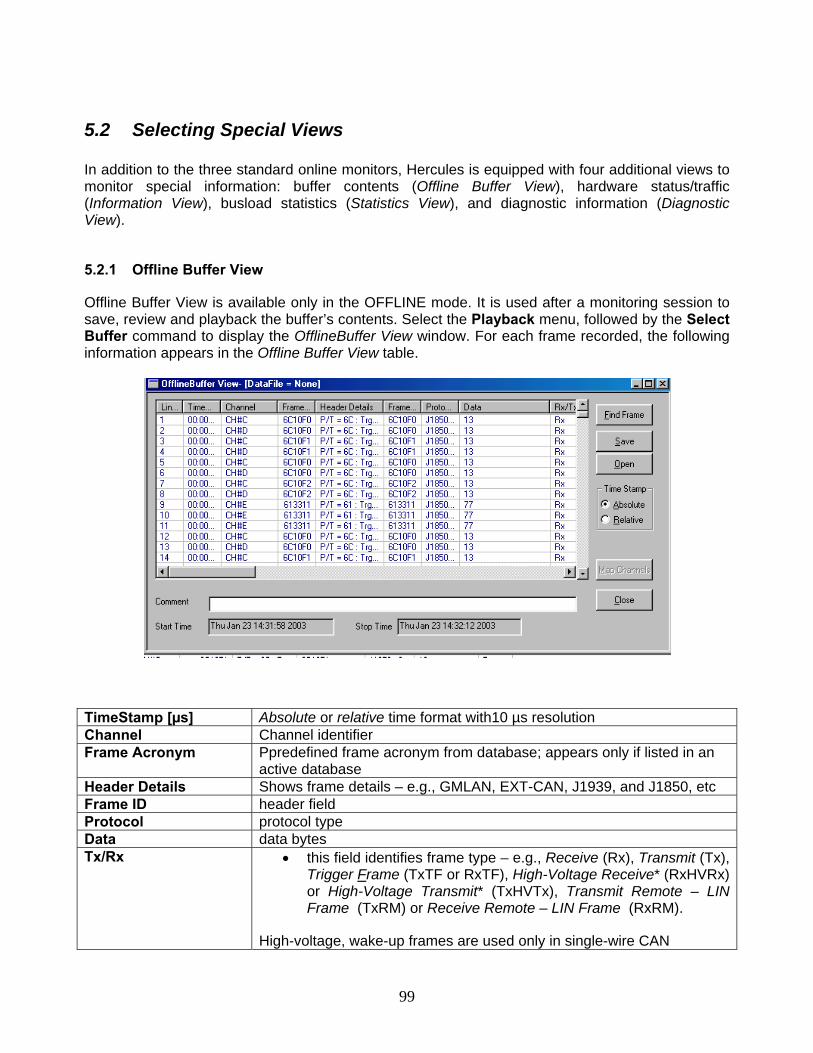
99
5.2 Selecting Special Views In addition to the three standard online monitors, Hercules is equipped with four additional views to monitor special information: buffer contents (Offline Buffer View), hardware status/traffic (Information View), busload statistics (Statistics View), and diagnostic information (Diagnostic View).
5.2.1 Offline Buffer View
Offline Buffer View is available only in the OFFLINE mode. It is used after a monitoring session to save, review and playback the buffer’s contents. Select the Playback menu, followed by the Select Buffer command to display the OfflineBuffer View window. For each frame recorded, the following information appears in the Offline Buffer View table.
TimeStamp [µs] Absolute or relative time format with10 µs resolution Channel Channel identifier Frame Acronym Ppredefined frame acronym from database; appears only if listed in an
active database Header Details Shows frame details – e.g., GMLAN, EXT-CAN, J1939, and J1850, etc Frame ID header field Protocol protocol type Data data bytes Tx/Rx • this field identifies frame type – e.g., Receive (Rx), Transmit (Tx),
Trigger Frame (TxTF or RxTF), High-Voltage Receive* (RxHVRx) or High-Voltage Transmit* (TxHVTx), Transmit Remote – LIN Frame (TxRM) or Receive Remote – LIN Frame (RxRM).
High-voltage, wake-up frames are used only in single-wire CAN

100
The storage of frames in the buffer starts automatically each time you select the Start command in the Monitoring menu, overwriting any information present in the buffer. Therefore, if you wish to view the content of a monitoring session’s buffer later and/or to send them back out over the bus, you must first save them. To save the contents in an OfflineBuffer View table, add any personal reminders you would like to include in the white Comment box; then click Save. Select a file type: Text or ASCII (.TXT), Binary (.BIN), or Data (.CSV: comma-separated-variable). TXT and CSV files are ideal for offline analysis of buffer information—they are easily imported into applications such as Excel, or other spreadsheet programs. BIN files are designed for the playback of a buffer’s contents over connected networks.
NOTE: To import Vector files (.asc) and CAT files, type {*.*} in the file name box and press Enter to display all files. Select the desired import file and click Open. The Hercules dialog is displayed. Click Yes to import the file.
Specify a name and location for your file, and click Save. Once you have saved your file, it is ready for export to other applications (in the case of TXT and CSV files) or for playback over the network (in the case of BIN files). You can also view the file contents later by using Open in this view. When you open a previously saved buffer file, with Map Channels option, you can load the frames on to a different channel of the same protocol.
To clear the current buffer, select the Clear Buffer command from the Monitoring menu, or click Clear Buffer on the main toolbar.
NOTE: Timestamps may be displayed in Absolute or Relative values. Absolute or Relative – Absolute timestamp is with respect to the start of the online monitoring. Relative timestamp is with respect to the previous message.
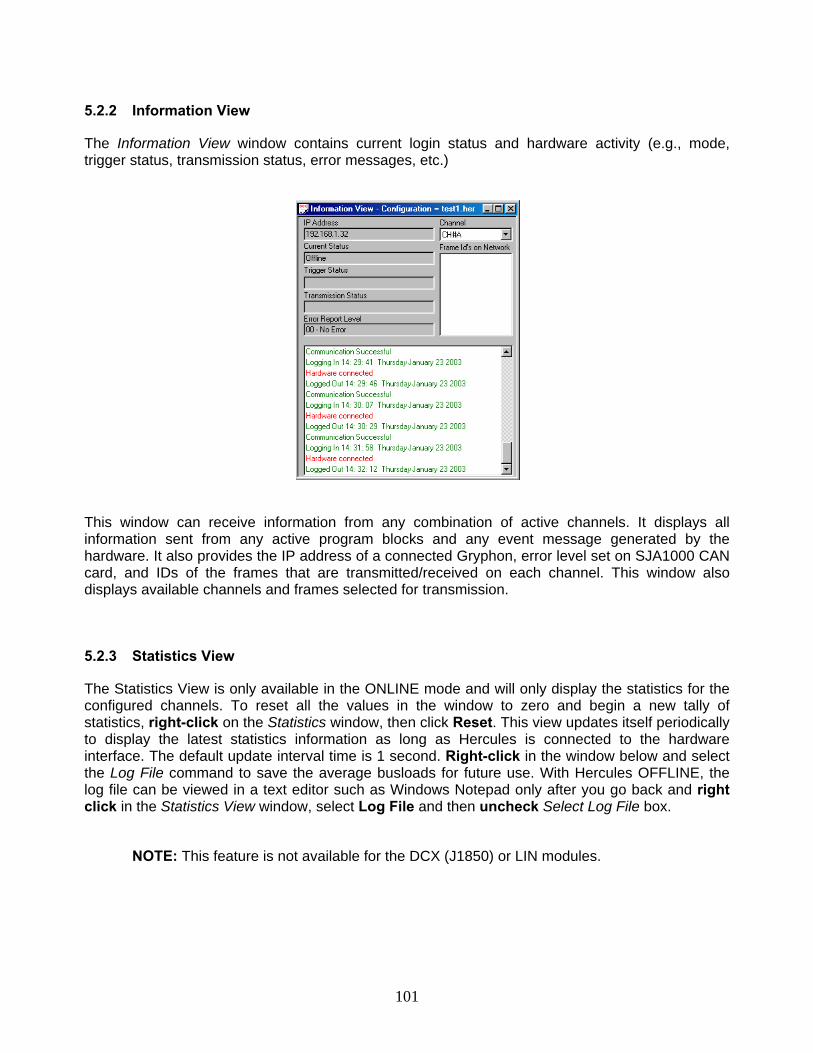
101
5.2.2 Information View
The Information View window contains current login status and hardware activity (e.g., mode, trigger status, transmission status, error messages, etc.)
This window can receive information from any combination of active channels. It displays all information sent from any active program blocks and any event message generated by the hardware. It also provides the IP address of a connected Gryphon, error level set on SJA1000 CAN card, and IDs of the frames that are transmitted/received on each channel. This window also displays available channels and frames selected for transmission.
5.2.3 Statistics View
The Statistics View is only available in the ONLINE mode and will only display the statistics for the configured channels. To reset all the values in the window to zero and begin a new tally of statistics, right-click on the Statistics window, then click Reset. This view updates itself periodically to display the latest statistics information as long as Hercules is connected to the hardware interface. The default update interval time is 1 second. Right-click in the window below and select the Log File command to save the average busloads for future use. With Hercules OFFLINE, the log file can be viewed in a text editor such as Windows Notepad only after you go back and right click in the Statistics View window, select Log File and then uncheck Select Log File box.
NOTE: This feature is not available for the DCX (J1850) or LIN modules.
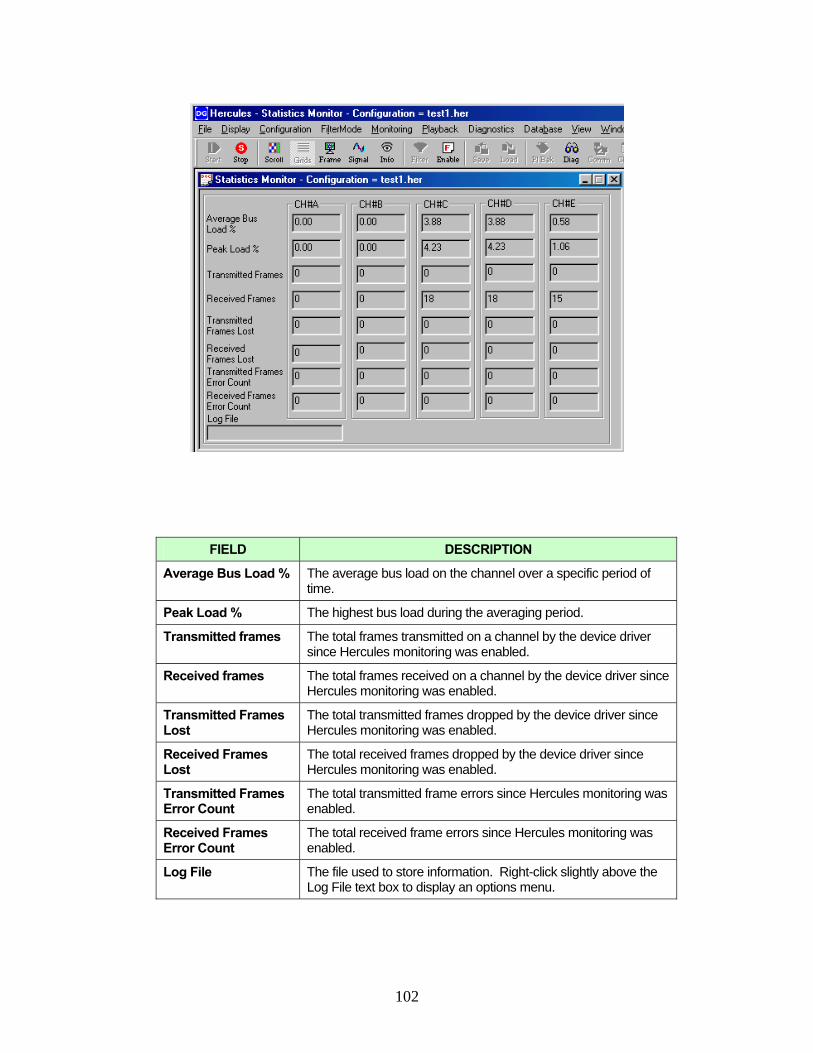
102
FIELD DESCRIPTION
Average Bus Load % The average bus load on the channel over a specific period of time.
Peak Load % The highest bus load during the averaging period.
Transmitted frames The total frames transmitted on a channel by the device driver since Hercules monitoring was enabled.
Received frames The total frames received on a channel by the device driver since Hercules monitoring was enabled.
Transmitted Frames Lost
The total transmitted frames dropped by the device driver since Hercules monitoring was enabled.
Received Frames Lost
The total received frames dropped by the device driver since Hercules monitoring was enabled.
Transmitted Frames Error Count
The total transmitted frame errors since Hercules monitoring was enabled.
Received Frames Error Count
The total received frame errors since Hercules monitoring was enabled.
Log File The file used to store information. Right-click slightly above the Log File text box to display an options menu.
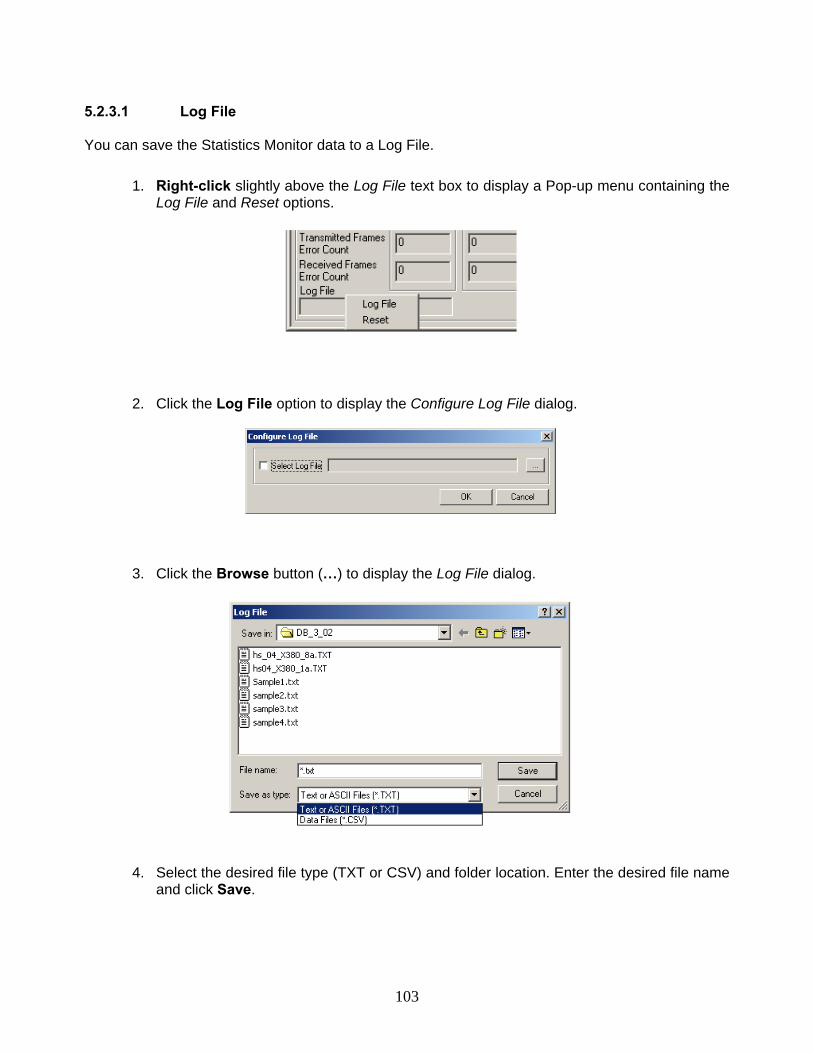
103
5.2.3.1 Log File You can save the Statistics Monitor data to a Log File.
1. Right-click slightly above the Log File text box to display a Pop-up menu containing the Log File and Reset options.
2. Click the Log File option to display the Configure Log File dialog.
3. Click the Browse button (…) to display the Log File dialog.
4. Select the desired file type (TXT or CSV) and folder location. Enter the desired file name and click Save.
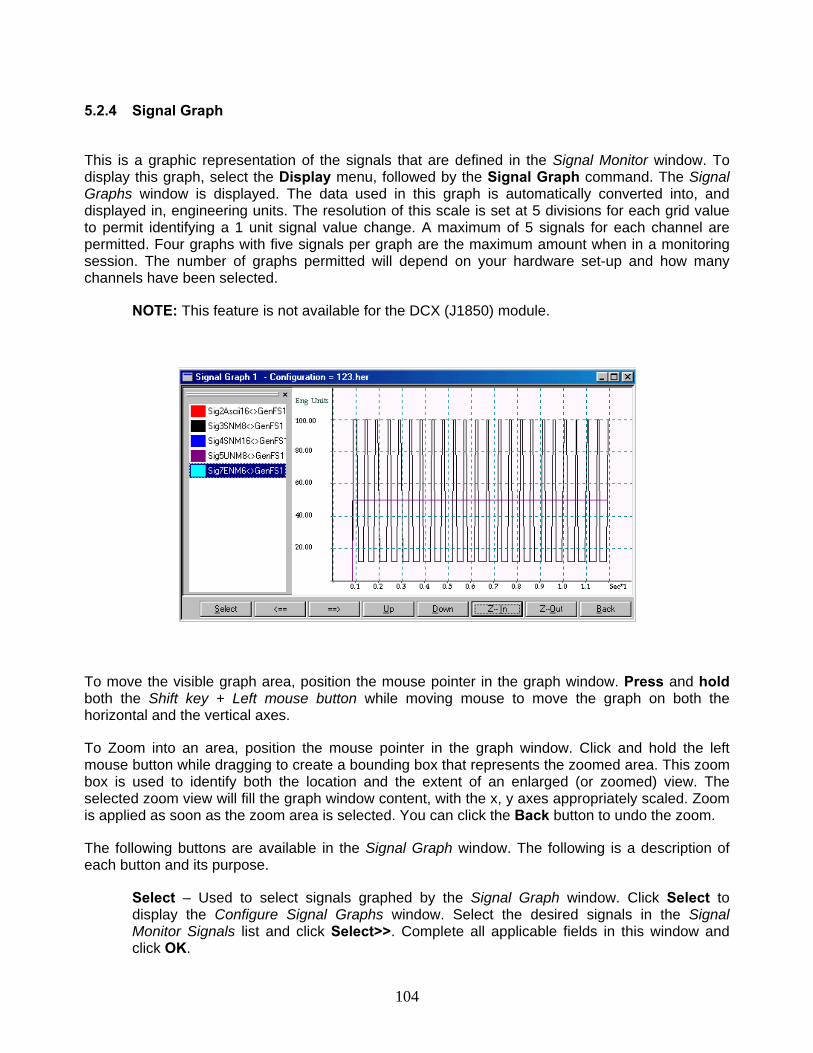
104
5.2.4 Signal Graph
This is a graphic representation of the signals that are defined in the Signal Monitor window. To display this graph, select the Display menu, followed by the Signal Graph command. The Signal Graphs window is displayed. The data used in this graph is automatically converted into, and displayed in, engineering units. The resolution of this scale is set at 5 divisions for each grid value to permit identifying a 1 unit signal value change. A maximum of 5 signals for each channel are permitted. Four graphs with five signals per graph are the maximum amount when in a monitoring session. The number of graphs permitted will depend on your hardware set-up and how many channels have been selected.
NOTE: This feature is not available for the DCX (J1850) module.
To move the visible graph area, position the mouse pointer in the graph window. Press and hold both the Shift key + Left mouse button while moving mouse to move the graph on both the horizontal and the vertical axes.
To Zoom into an area, position the mouse pointer in the graph window. Click and hold the left mouse button while dragging to create a bounding box that represents the zoomed area. This zoom box is used to identify both the location and the extent of an enlarged (or zoomed) view. The selected zoom view will fill the graph window content, with the x, y axes appropriately scaled. Zoom is applied as soon as the zoom area is selected. You can click the Back button to undo the zoom.
The following buttons are available in the Signal Graph window. The following is a description of each button and its purpose.
Select – Used to select signals graphed by the Signal Graph window. Click Select to display the Configure Signal Graphs window. Select the desired signals in the Signal Monitor Signals list and click Select>>. Complete all applicable fields in this window and click OK.

105
<== – Incrementally shift the entire Signal Graph window horizontally to display previous time based graph data. This action occurs each time this button is selected but ceases when the beginning of the time scale (zero) appears. To automatically repeat this action, press and hold the left arrow key on the computer keyboard.
==> – Incrementally shift the entire Signal Graph window horizontally to display subsequent time based graph data. This action occurs each time this button is selected. To automatically repeat this action, press and hold the right arrow key on the computer keyboard.
Up – Incrementally shift the entire Signal Graph window vertically to display higher engineering unit axis based graph data. This action occurs each time this button is selected but ceases when the beginning of the time scale (zero) appears. To automatically repeat this action, press and hold the U key on the computer keyboard.
Down – Incrementally shift the entire Signal Graph window vertically to display lower engineering unit axis based graph data. This action occurs each time this button is selected but ceases when the beginning of the time scale (zero) appears. To automatically repeat this action, press and hold the D key on the computer keyboard.
Z-In – Incrementally compresses both the time and engineering units scale in the Signal Graph window. This action occurs each time this button is selected. To automatically repeat this action, press and hold the letter I key on the computer keyboard.
Z-Out – Incrementally expands both the time and engineering units scale in the Signal Graph window. This action occurs each time this button is selected. To automatically repeat this action, press and hold the letter O key on the computer keyboard.
Back – Discards recent change and restores previous changes made to the Signal Graph. Stores the last 200 changes made to the Graph.
5.2.4.1 Options:
In addition to the buttons, several options are available. Right-click in the Signal Graph window and this will display the following options menu.

106
The following options are available and are described below.
Point marks – When selected (i.e., checked), the Signal Graph window will display points in the graph line where each signal occurred. When not selected, no points will display. Point marks are not shown by default.
Scatter graph – When selected, the Signal Graph window will display points only. The graph line connecting the points will not be visible. When not selected, the Signal Graph window will display data as dictated by any other selected option.
Trace mouse coordinates – When selected, the mouse pointer will include a constantly visible mouse pointer status box which will display the current mouse pointer position in x, y axis format and in engineering units. When not selected, no mouse pointer status box will be visible. This tool is useful to precisely identify where the item of interest appears on the signal graph.
Grid – When selected, the Signal Graph window will display grid lines that correspond to major x, y axis points in the window. When not selected, no grid lines are displayed. Grid lines are not shown by default.
Fit – When selected, three choices are available: Width, Height, and Page. When Width is selected, the existing graph data is scaled to fit into the entire horizontal width of the available Signal Graph window. When Height is selected, the existing graph data is scaled to fit into the entire vertical height of the available Signal Graph window. When Page is selected, the existing graph data is scaled to fit into the entire Signal Graph window and is the equivalent to selecting both the Width and Height choices.
Configure Graph – When selected, the Configure Graph window is displayed and contains two tabs: the General tab and the Graphs tab. The General tab is used to define the range of the graph coordinates (where x1 and y1 are in the lower left corner, x2 is the lower right corner, and y2 is in the upper right left corner). It also provides the following selections: Point Marks (previously described), Mouse coordinates (previously described in Trace Mouse Coordinates) and Axis (previously described in Grid). The Graphs tab provides a list of the signal sources and three buttons: Color, Show/Hide and Show all. To change the color graphed by a signal source, click the signal source to select it and click the Color button to display the Color window. Choose the desired color for the selected signal source then click OK. To hide a signal currently visible on the graph, click the signal source to select it and click Hide. To show a signal currently not visible on the graph, click the signal source to select it and click Show. To show all signal sources which are currently not visible on the graph, click Show all.
View – This option lets you display or hide the graph list in the left side of the window. Unselecting the Graph List choice will hide the list and allow more graphic data to be displayed. Selecting the Graph List choice will display the list of signals with reduced graphic data visible in the window. When visible, the Graph List can be undocked and moved to another area. Move the mouse pointer to the two horizontal lines at the top of the Graph list. Press and hold the left mouse button and drag it to the desired location. To dock the Graph List, move it to the left side of the Signal Graph window.

107
5.2.4.2 Configuring and using the Signal Graph
Here are the steps to configure and use the Signal Graph feature.
1. Check the hardware configuration. Select the Configuration menu, followed by the Hardware Configuration command. Verify that the applicable channels are selected and properly configured. Verify that the correct Gryphon IP address and port number are specified in the TCP/IP Configuration. Verify that the correct bus rate is selected.
2. Associate the desired database. Select the Database menu, followed by the Associate Database command. Verify that the desired databases are associated with the selected channels.
3. Display a Scrolling Monitor window. Select the Display menu, followed by the Scrolling Monitor command (either With Grid or with No Grid).
4. Display a Signal Monitor window. Select the Display menu, followed by the Signal Monitor command.
5. While in the Signal Monitor window, select one or more signals to add to the Signal Monitor window. The signal source can be from an existing database or from a signal that you manually create.
To select one or more signals from an existing database, right-click in this window and select the Select Signal command. This displays the Signal Database dialog. Complete all applicable fields in this dialog to display the available signals in the Signal List. From the Signal List, select the desired signals to be displayed (for a maximum of 20 signals) and click Select>>. Click OK to close this dialog.
To manually add one or more signals (for a maximum of 20 signals), right-click in this window and select the Add New Signal command. This displays the Add New Signal dialog. Complete all applicable fields in this window to define the signal and click OK.
6. Display the Signal Graphs window. Select the Display menu, followed by the Signal Graph command. Click Select to display the Configure Signal Graphs window. Confirm that the correct channel and protocol are selected. From the Signal Monitor Signals list, select the desired signals to be graphed and click Select. Click OK to close this window.
7. Click Start. Also refer to previous topics that describe the buttons and options available for the Signal Graph window.
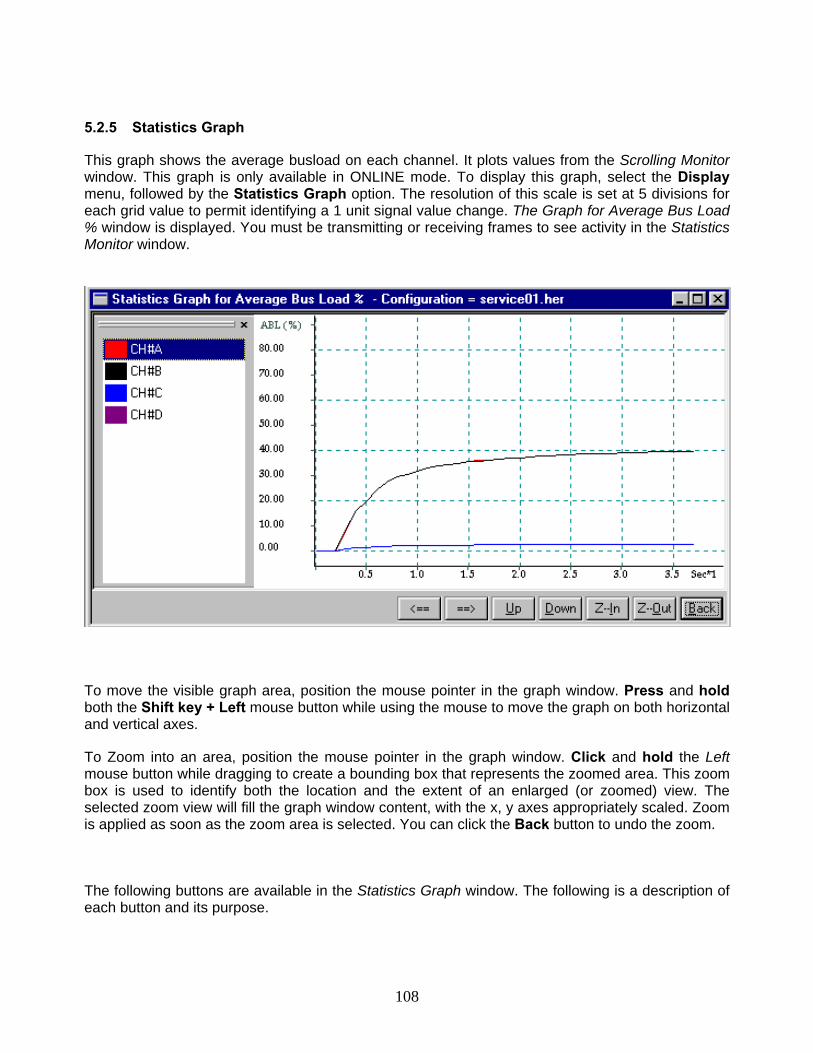
108
5.2.5 Statistics Graph
This graph shows the average busload on each channel. It plots values from the Scrolling Monitor window. This graph is only available in ONLINE mode. To display this graph, select the Display menu, followed by the Statistics Graph option. The resolution of this scale is set at 5 divisions for each grid value to permit identifying a 1 unit signal value change. The Graph for Average Bus Load % window is displayed. You must be transmitting or receiving frames to see activity in the Statistics Monitor window.
To move the visible graph area, position the mouse pointer in the graph window. Press and hold both the Shift key + Left mouse button while using the mouse to move the graph on both horizontal and vertical axes.
To Zoom into an area, position the mouse pointer in the graph window. Click and hold the Left mouse button while dragging to create a bounding box that represents the zoomed area. This zoom box is used to identify both the location and the extent of an enlarged (or zoomed) view. The selected zoom view will fill the graph window content, with the x, y axes appropriately scaled. Zoom is applied as soon as the zoom area is selected. You can click the Back button to undo the zoom.
The following buttons are available in the Statistics Graph window. The following is a description of each button and its purpose.
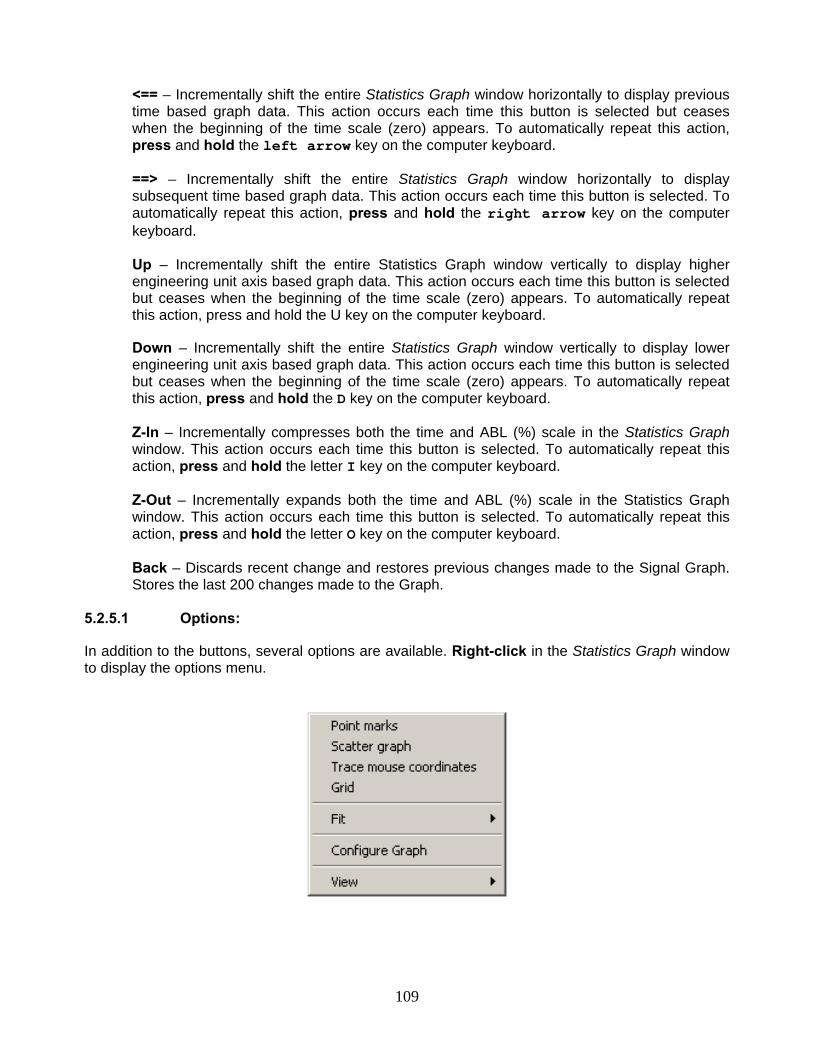
109
<== – Incrementally shift the entire Statistics Graph window horizontally to display previous time based graph data. This action occurs each time this button is selected but ceases when the beginning of the time scale (zero) appears. To automatically repeat this action, press and hold the left arrow key on the computer keyboard.
==> – Incrementally shift the entire Statistics Graph window horizontally to display subsequent time based graph data. This action occurs each time this button is selected. To automatically repeat this action, press and hold the right arrow key on the computer keyboard.
Up – Incrementally shift the entire Statistics Graph window vertically to display higher engineering unit axis based graph data. This action occurs each time this button is selected but ceases when the beginning of the time scale (zero) appears. To automatically repeat this action, press and hold the U key on the computer keyboard.
Down – Incrementally shift the entire Statistics Graph window vertically to display lower engineering unit axis based graph data. This action occurs each time this button is selected but ceases when the beginning of the time scale (zero) appears. To automatically repeat this action, press and hold the D key on the computer keyboard.
Z-In – Incrementally compresses both the time and ABL (%) scale in the Statistics Graph window. This action occurs each time this button is selected. To automatically repeat this action, press and hold the letter I key on the computer keyboard.
Z-Out – Incrementally expands both the time and ABL (%) scale in the Statistics Graph window. This action occurs each time this button is selected. To automatically repeat this action, press and hold the letter O key on the computer keyboard.
Back – Discards recent change and restores previous changes made to the Signal Graph. Stores the last 200 changes made to the Graph.
5.2.5.1 Options:
In addition to the buttons, several options are available. Right-click in the Statistics Graph window to display the options menu.
110
The following options are available. A description of each option and its purpose follows.
Point marks – When selected (checked), the Statistics Graph window will display points in the graph line where each signal occurred. When not selected, no points will display. Point marks are not shown by default.
Scatter graph – When selected, the Statistics Graph window will display points only. The graph line connecting the points will not be visible. When not selected, the window will display data as dictated by any other selected option.
Trace mouse coordinates – When selected, the mouse pointer will include a constantly visible mouse pointer status box which will display the current mouse pointer position in x, y axis format and in ABL (%). When not selected, no mouse pointer status box will be visible. This tool is useful to precisely identify where the item of interest appears on the Statistics Graph window.
Grid – When selected, the Statistics Graph window will display grid lines that correspond to major x, y axis points in the window. When not selected, no grid lines are displayed. Grid lines are not shown by default.
Fit – When selected, three choices are available: Width, Height, and Page. When Width is selected, the existing graph data is scaled to fit into the entire horizontal width of the available Statistics Graph window. When Height is selected, the existing graph data is scaled to fit into the entire vertical height of the available Statistics Graph window. When Page is selected, the existing graph data is scaled to fit into the entire Statistics Graph window and is the equivalent to selecting both the Width and Height choices.
Configure Graph – When selected, the Configure Graph window is displayed and contains two tabs: the General tab and the Graphs tab. The General tab is used to define the range of the graph coordinates (from x1, y1: lower left hand corner to x2, y2: upper right hand corner). It also provides the following selections: Point Marks (previously described), Mouse coordinates (previously described in Trace Mouse Coordinates) and Axis (previously described in Grid). The Graphs tab provides a list of the signal sources and three buttons: Color, Show/Hide and Show all. To change the color graphed by a signal source, click the signal source to select it and click the Color button to display the Color window. Choose the desired color for the selected signal source then click OK. To hide a signal currently visible on the graph, click the signal source to select it and click Hide. To show a signal currently not visible on the graph, click the signal source to select it and click Show. To show all signal sources that are currently not visible on the graph, click Show all.
View – This option lets you display or hide the graph list in the graph window. Unselecting the Graph List choice will hide the list and allow more graphic data to be displayed horizontally. Selecting the Graph List choice will display the list of signals with horizontally reduced graphic data visible in the window. When visible, the Graph List can be undocked and moved to another area. Move the mouse pointer to the two horizontal lines at the top of the Graph List. Press and hold the Left mouse button and drag it to the desired location. To dock the Graph List, move it to the left side of the Signal Graph window.

111
5.2.5.2 Configuring and using the Statistics Graph
Here are the steps to configure and use the Statistics Graph feature.
1. Check the hardware configuration. Select the Configuration menu, followed by the Hardware Configuration command. Verify that the applicable channels are selected and properly configured. Verify that the correct Gryphon IP address and port number are specified in the TCP/IP Configuration. Verify that the correct bus rate is selected.
2. Associate the desired database. Select the Database menu, followed by the Associate Database command. Verify that the desired databases are associated with the selected channels.
3. Display a Scrolling Monitor window by selecting the Display menu, followed by the Scrolling Monitor command (either With Grid or No Grid).
4. Display the Statistics Graph window. Select the Display menu, followed by the Signal Graph command.
5. Click Start. 6. Display the Statistics Monitor window. Select the Display menu, followed by the Statistics
View command.
7. NOTE: You must be ONLINE to access the Statistics View command. Also refer to the previous topics that describe the buttons and options available for the Statistics Graph window.
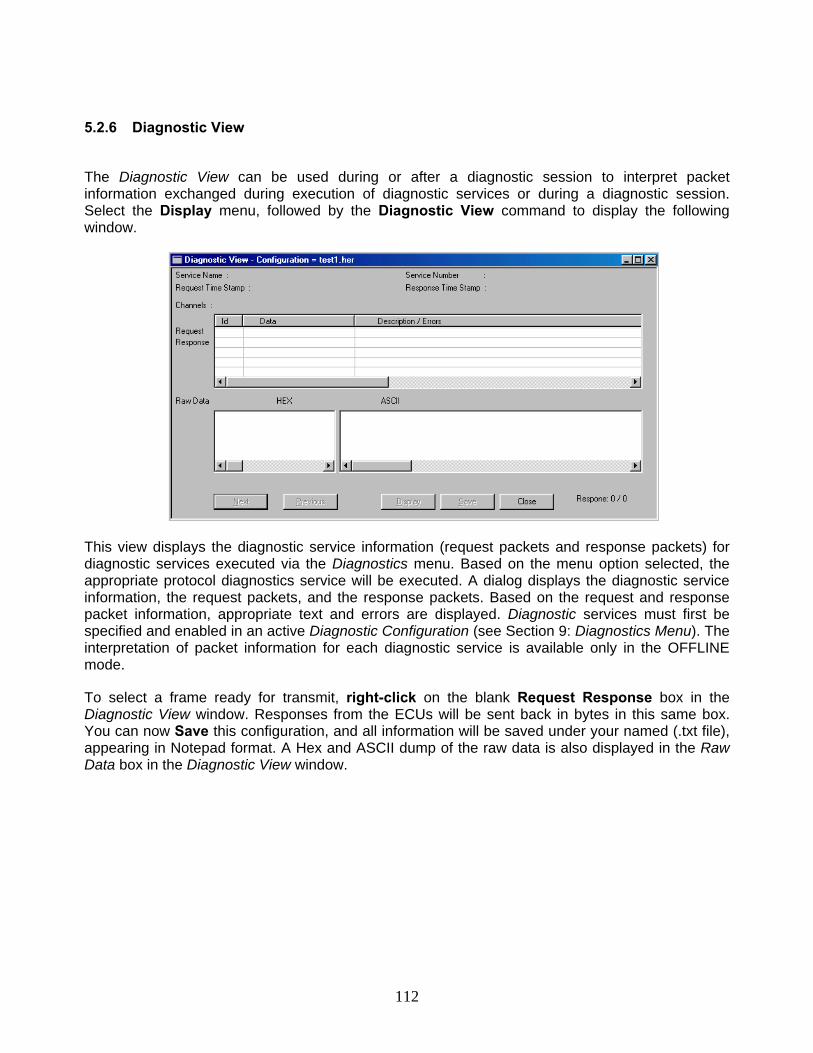
112
5.2.6 Diagnostic View
The Diagnostic View can be used during or after a diagnostic session to interpret packet information exchanged during execution of diagnostic services or during a diagnostic session. Select the Display menu, followed by the Diagnostic View command to display the following window.
This view displays the diagnostic service information (request packets and response packets) for diagnostic services executed via the Diagnostics menu. Based on the menu option selected, the appropriate protocol diagnostics service will be executed. A dialog displays the diagnostic service information, the request packets, and the response packets. Based on the request and response packet information, appropriate text and errors are displayed. Diagnostic services must first be specified and enabled in an active Diagnostic Configuration (see Section 9: Diagnostics Menu). The interpretation of packet information for each diagnostic service is available only in the OFFLINE mode.
To select a frame ready for transmit, right-click on the blank Request Response box in the Diagnostic View window. Responses from the ECUs will be sent back in bytes in this same box. You can now Save this configuration, and all information will be saved under your named (.txt file), appearing in Notepad format. A Hex and ASCII dump of the raw data is also displayed in the Raw Data box in the Diagnostic View window.
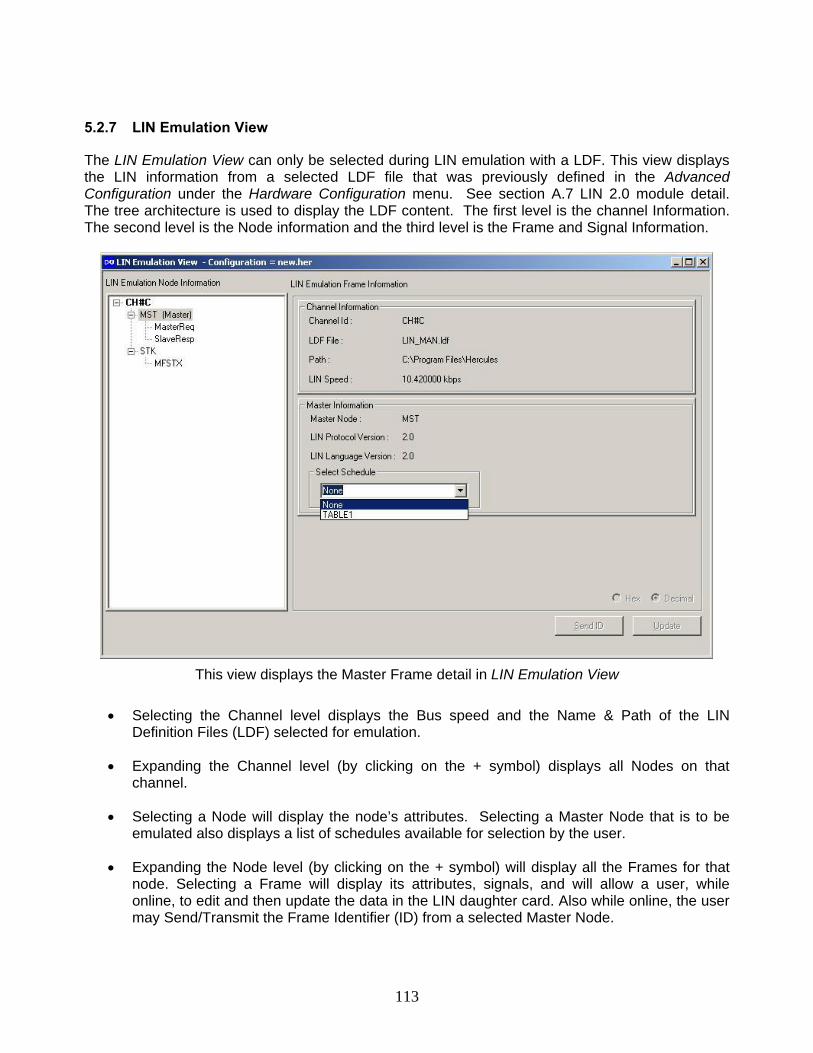
113
5.2.7 LIN Emulation View
The LIN Emulation View can only be selected during LIN emulation with a LDF. This view displays the LIN information from a selected LDF file that was previously defined in the Advanced Configuration under the Hardware Configuration menu. See section A.7 LIN 2.0 module detail. The tree architecture is used to display the LDF content. The first level is the channel Information. The second level is the Node information and the third level is the Frame and Signal Information.
This view displays the Master Frame detail in LIN Emulation View
• Selecting the Channel level displays the Bus speed and the Name & Path of the LIN Definition Files (LDF) selected for emulation.
• Expanding the Channel level (by clicking on the + symbol) displays all Nodes on that channel.
• Selecting a Node will display the node’s attributes. Selecting a Master Node that is to be emulated also displays a list of schedules available for selection by the user.
• Expanding the Node level (by clicking on the + symbol) will display all the Frames for that node. Selecting a Frame will display its attributes, signals, and will allow a user, while online, to edit and then update the data in the LIN daughter card. Also while online, the user may Send/Transmit the Frame Identifier (ID) from a selected Master Node.
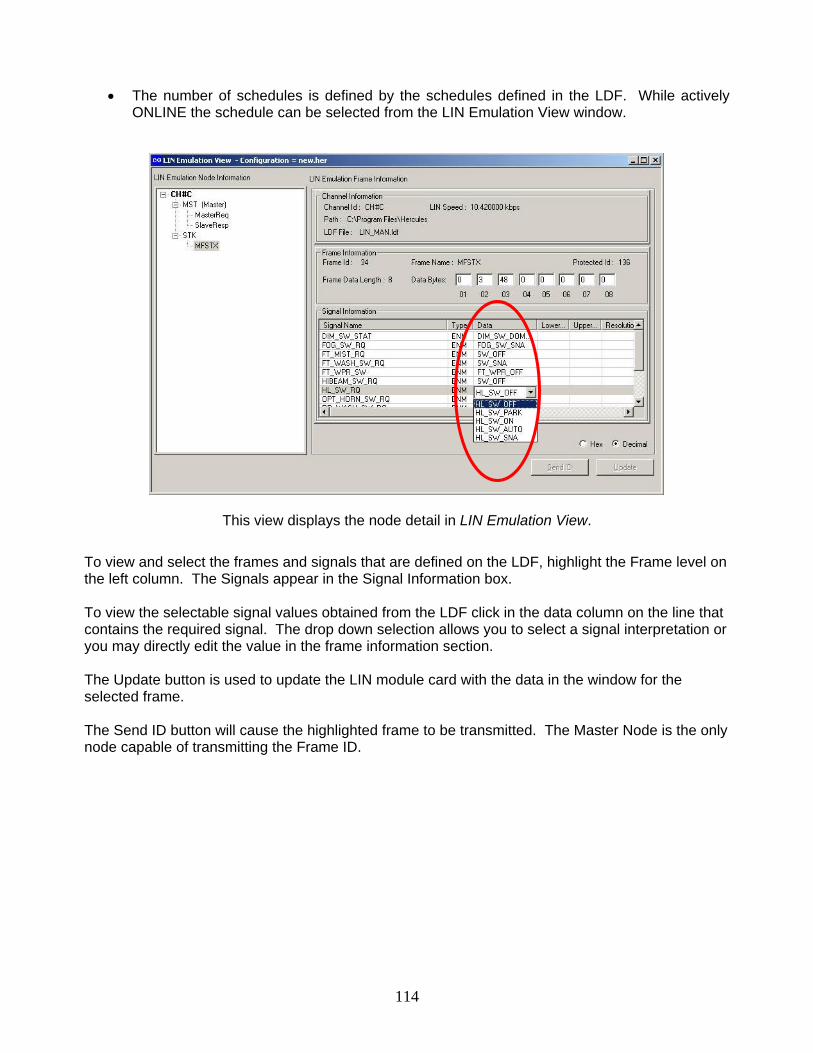
114
• The number of schedules is defined by the schedules defined in the LDF. While actively ONLINE the schedule can be selected from the LIN Emulation View window.
This view displays the node detail in LIN Emulation View.
To view and select the frames and signals that are defined on the LDF, highlight the Frame level on the left column. The Signals appear in the Signal Information box. To view the selectable signal values obtained from the LDF click in the data column on the line that contains the required signal. The drop down selection allows you to select a signal interpretation or you may directly edit the value in the frame information section. The Update button is used to update the LIN module card with the data in the window for the selected frame. The Send ID button will cause the highlighted frame to be transmitted. The Master Node is the only node capable of transmitting the Frame ID.
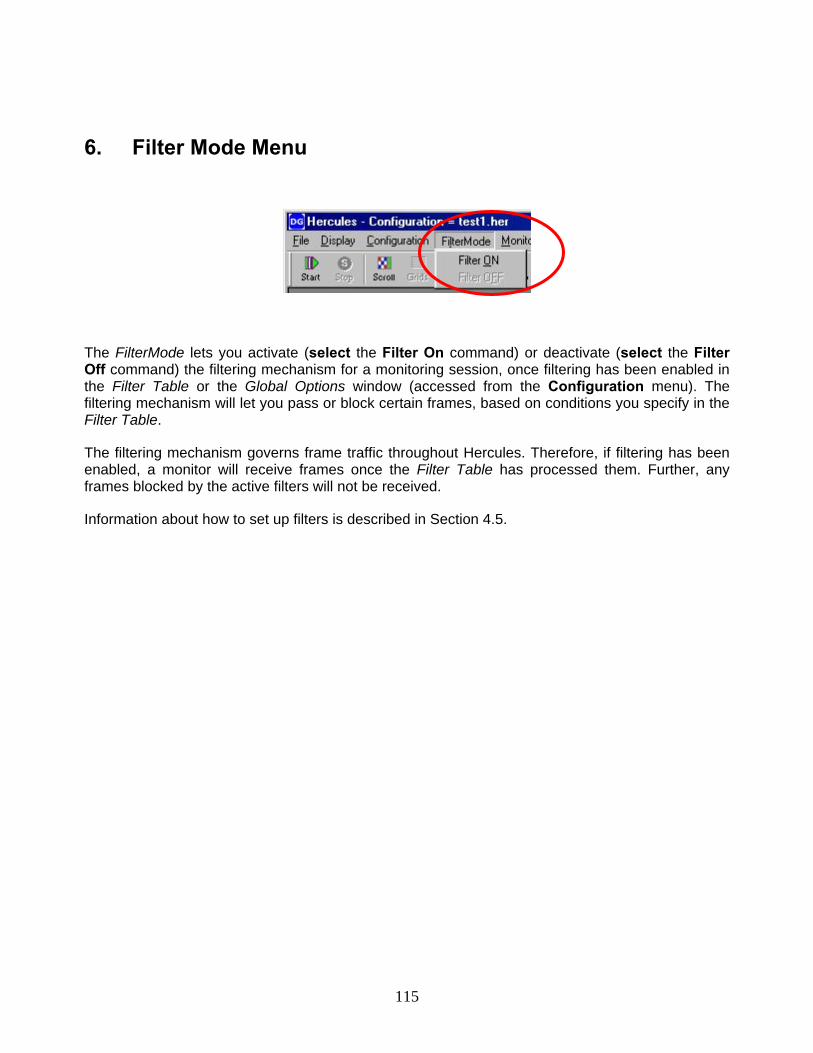
115
6. Filter Mode Menu
The FilterMode lets you activate (select the Filter On command) or deactivate (select the Filter Off command) the filtering mechanism for a monitoring session, once filtering has been enabled in the Filter Table or the Global Options window (accessed from the Configuration menu). The filtering mechanism will let you pass or block certain frames, based on conditions you specify in the Filter Table.
The filtering mechanism governs frame traffic throughout Hercules. Therefore, if filtering has been enabled, a monitor will receive frames once the Filter Table has processed them. Further, any frames blocked by the active filters will not be received.
Information about how to set up filters is described in Section 4.5.
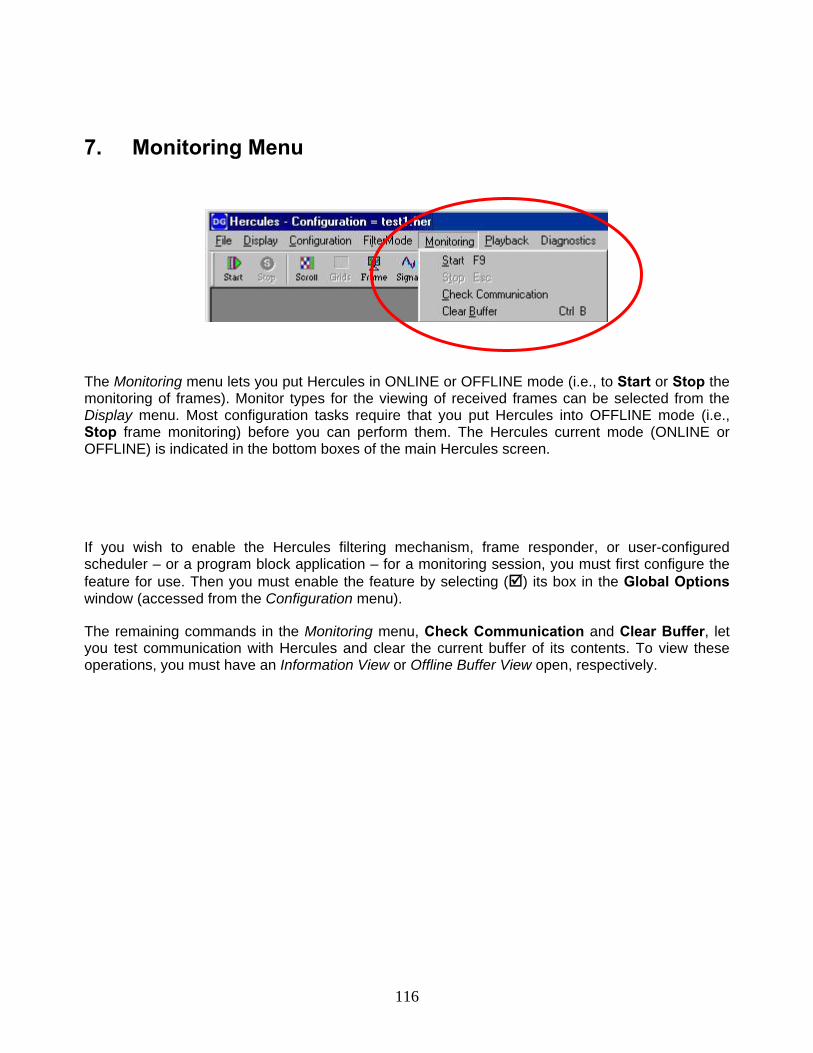
116
7. Monitoring Menu
The Monitoring menu lets you put Hercules in ONLINE or OFFLINE mode (i.e., to Start or Stop the monitoring of frames). Monitor types for the viewing of received frames can be selected from the Display menu. Most configuration tasks require that you put Hercules into OFFLINE mode (i.e., Stop frame monitoring) before you can perform them. The Hercules current mode (ONLINE or OFFLINE) is indicated in the bottom boxes of the main Hercules screen.
If you wish to enable the Hercules filtering mechanism, frame responder, or user-configured scheduler – or a program block application – for a monitoring session, you must first configure the feature for use. Then you must enable the feature by selecting ( ) its box in the Global Options window (accessed from the Configuration menu).
The remaining commands in the Monitoring menu, Check Communication and Clear Buffer, let you test communication with Hercules and clear the current buffer of its contents. To view these operations, you must have an Information View or Offline Buffer View open, respectively.
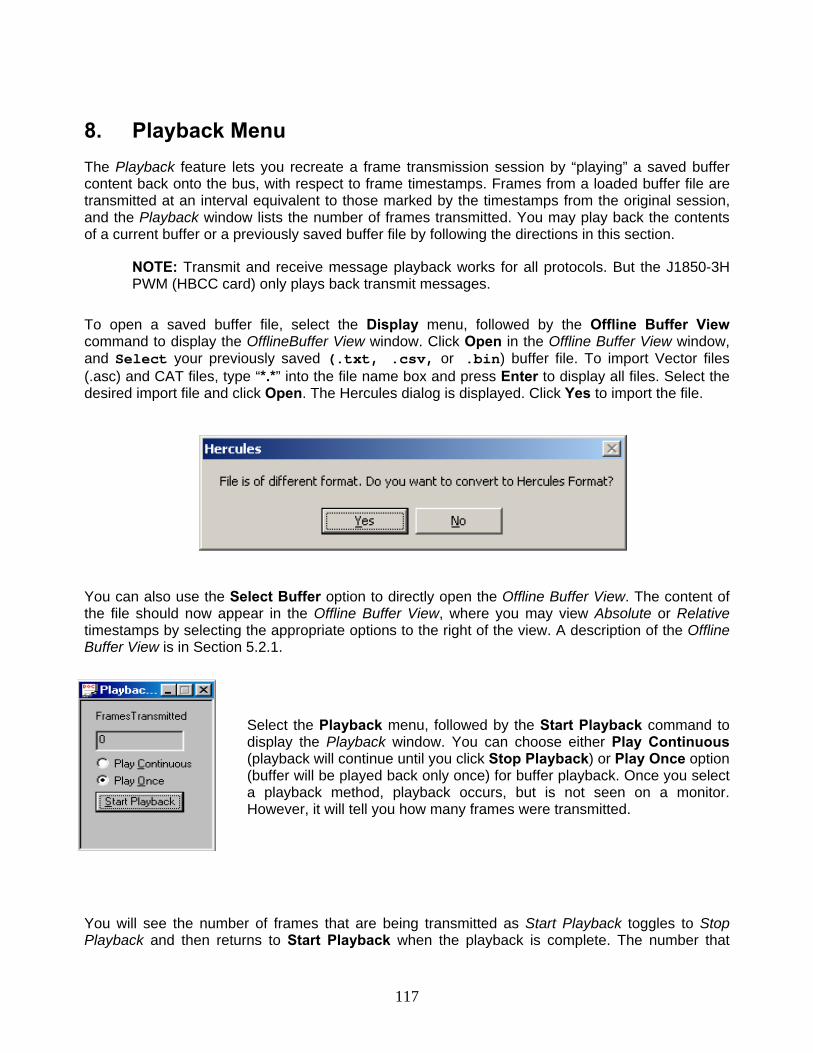
117
8. Playback Menu The Playback feature lets you recreate a frame transmission session by “playing” a saved buffer content back onto the bus, with respect to frame timestamps. Frames from a loaded buffer file are transmitted at an interval equivalent to those marked by the timestamps from the original session, and the Playback window lists the number of frames transmitted. You may play back the contents of a current buffer or a previously saved buffer file by following the directions in this section.
NOTE: Transmit and receive message playback works for all protocols. But the J1850-3H PWM (HBCC card) only plays back transmit messages.
To open a saved buffer file, select the Display menu, followed by the Offline Buffer View command to display the OfflineBuffer View window. Click Open in the Offline Buffer View window, and Select your previously saved (.txt, .csv, or .bin) buffer file. To import Vector files (.asc) and CAT files, type “*.*” into the file name box and press Enter to display all files. Select the desired import file and click Open. The Hercules dialog is displayed. Click Yes to import the file.
You can also use the Select Buffer option to directly open the Offline Buffer View. The content of the file should now appear in the Offline Buffer View, where you may view Absolute or Relative timestamps by selecting the appropriate options to the right of the view. A description of the Offline Buffer View is in Section 5.2.1.
Select the Playback menu, followed by the Start Playback command to display the Playback window. You can choose either Play Continuous (playback will continue until you click Stop Playback) or Play Once option (buffer will be played back only once) for buffer playback. Once you select a playback method, playback occurs, but is not seen on a monitor. However, it will tell you how many frames were transmitted.
You will see the number of frames that are being transmitted as Start Playback toggles to Stop Playback and then returns to Start Playback when the playback is complete. The number that
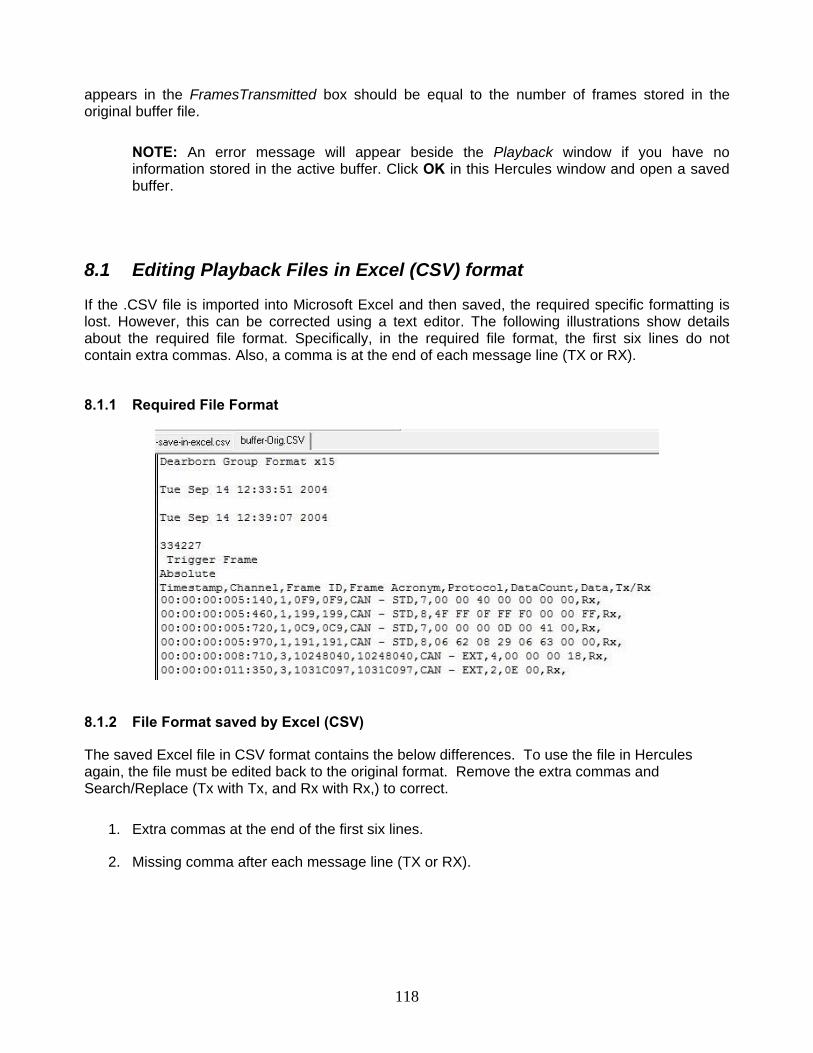
118
appears in the FramesTransmitted box should be equal to the number of frames stored in the original buffer file.
NOTE: An error message will appear beside the Playback window if you have no information stored in the active buffer. Click OK in this Hercules window and open a saved buffer.
8.1 Editing Playback Files in Excel (CSV) format
If the .CSV file is imported into Microsoft Excel and then saved, the required specific formatting is lost. However, this can be corrected using a text editor. The following illustrations show details about the required file format. Specifically, in the required file format, the first six lines do not contain extra commas. Also, a comma is at the end of each message line (TX or RX).
8.1.1 Required File Format
8.1.2 File Format saved by Excel (CSV)
The saved Excel file in CSV format contains the below differences. To use the file in Hercules again, the file must be edited back to the original format. Remove the extra commas and Search/Replace (Tx with Tx, and Rx with Rx,) to correct.
1. Extra commas at the end of the first six lines.
2. Missing comma after each message line (TX or RX).
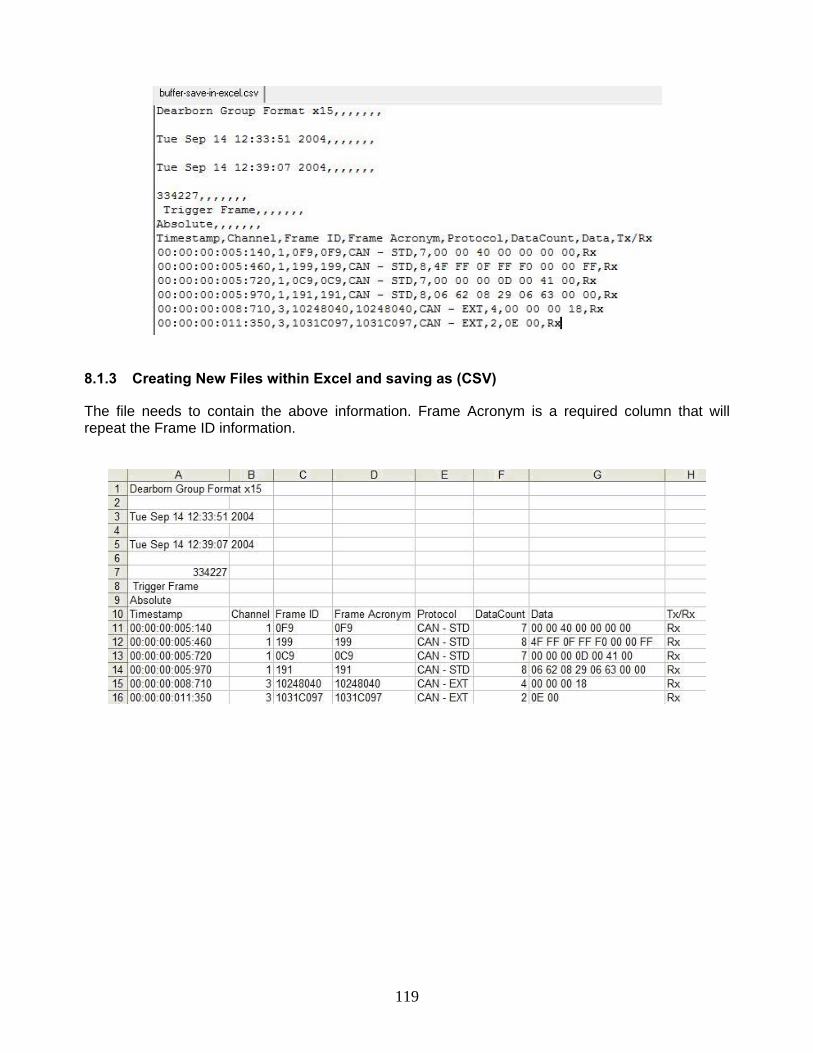
119
8.1.3 Creating New Files within Excel and saving as (CSV)
The file needs to contain the above information. Frame Acronym is a required column that will repeat the Frame ID information.

120
9. Diagnostics Menu Diagnostic services are supported for two CAN specifications – ISO 15765 and GMLAN 3110 (version 1.5) – as well as J1979 support for J1850 networks. Only one version is available at a time. To view the current diagnostics type chosen (GMLAN Diagnostics or UDS/FORD Diagnostics), select the Configuration menu, followed by the Global Options command.
To use the diagnostic functions on this menu, you must have Diagnostic frames available in the active database.
9.1 Setting up or Loading a Diagnostic Configuration
The first step in accessing diagnostic functions for use during a monitoring session is to load a previously saved Diagnostic Configuration or to set up a new one.
When you first start Hercules, a default Diagnostic Configuration file (default.cfg) is loaded. It is an empty, read-only file, and you must use the Save Diagnostic Configuration command in the Diagnostics menu in order to save any changes you wish to make. Each subsequent time Hercules is loaded, it uses the last saved configuration (.cfg) file.
To load a previously saved configuration for use, select the Diagnostics menu, followed by the Load Diagnostic Configuration command and select the appropriate saved .cfg file. Diagnostic files are also saved and loaded with the .xml and .her configuration.
A blank diagnostic configuration file called “new.cfg” is available. This file is a part of the installation under the folder C:\Dearborn Group Products\Hercules. This file can be loaded using the Load Configuration option.
9.1.1 Setting up a GMLAN Diagnostic Configuration
To set up a new diagnostic configuration for GMLAN, use these steps.
1. Select the Diagnostics menu, followed by the Setup Diagnostic Configuration command to display the following dialog. (Assumes GMLAN Diagnostics is selected in Global Options).
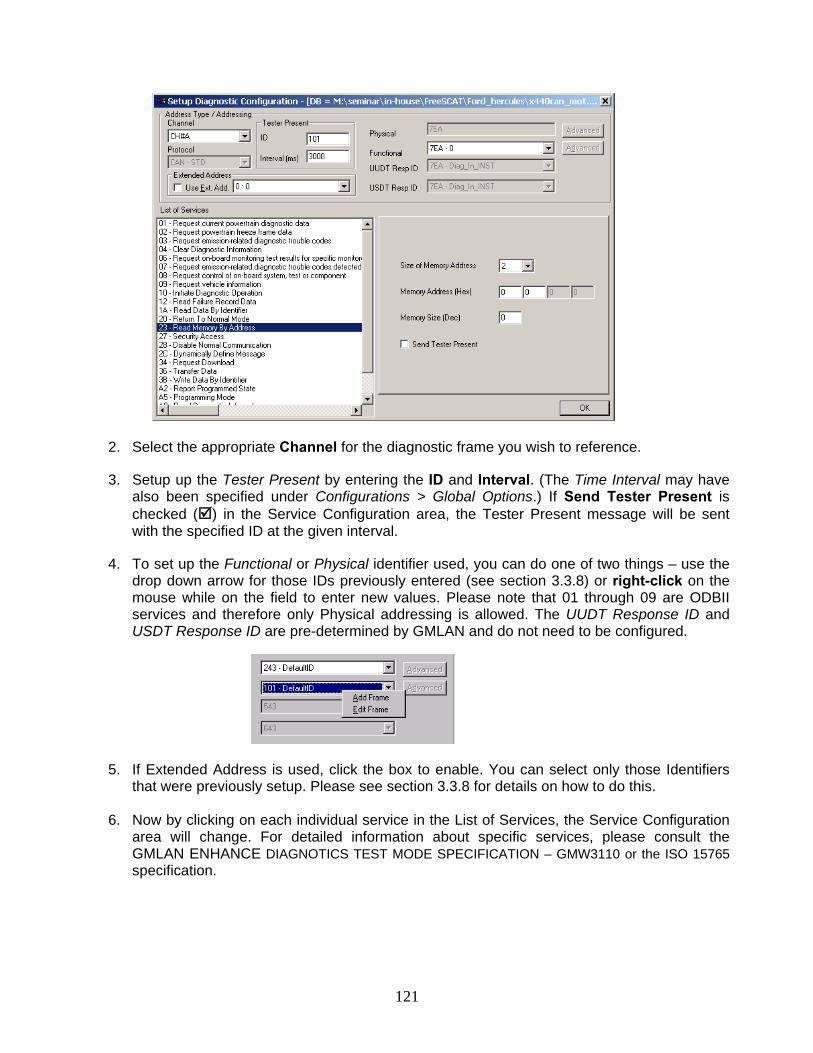
121
2. Select the appropriate Channel for the diagnostic frame you wish to reference.
3. Setup up the Tester Present by entering the ID and Interval. (The Time Interval may have also been specified under Configurations > Global Options.) If Send Tester Present is checked ( ) in the Service Configuration area, the Tester Present message will be sent with the specified ID at the given interval.
4. To set up the Functional or Physical identifier used, you can do one of two things – use the drop down arrow for those IDs previously entered (see section 3.3.8) or right-click on the mouse while on the field to enter new values. Please note that 01 through 09 are ODBII services and therefore only Physical addressing is allowed. The UUDT Response ID and USDT Response ID are pre-determined by GMLAN and do not need to be configured.
5. If Extended Address is used, click the box to enable. You can select only those Identifiers
that were previously setup. Please see section 3.3.8 for details on how to do this.
6. Now by clicking on each individual service in the List of Services, the Service Configuration area will change. For detailed information about specific services, please consult the GMLAN ENHANCE DIAGNOTICS TEST MODE SPECIFICATION – GMW3110 or the ISO 15765 specification.
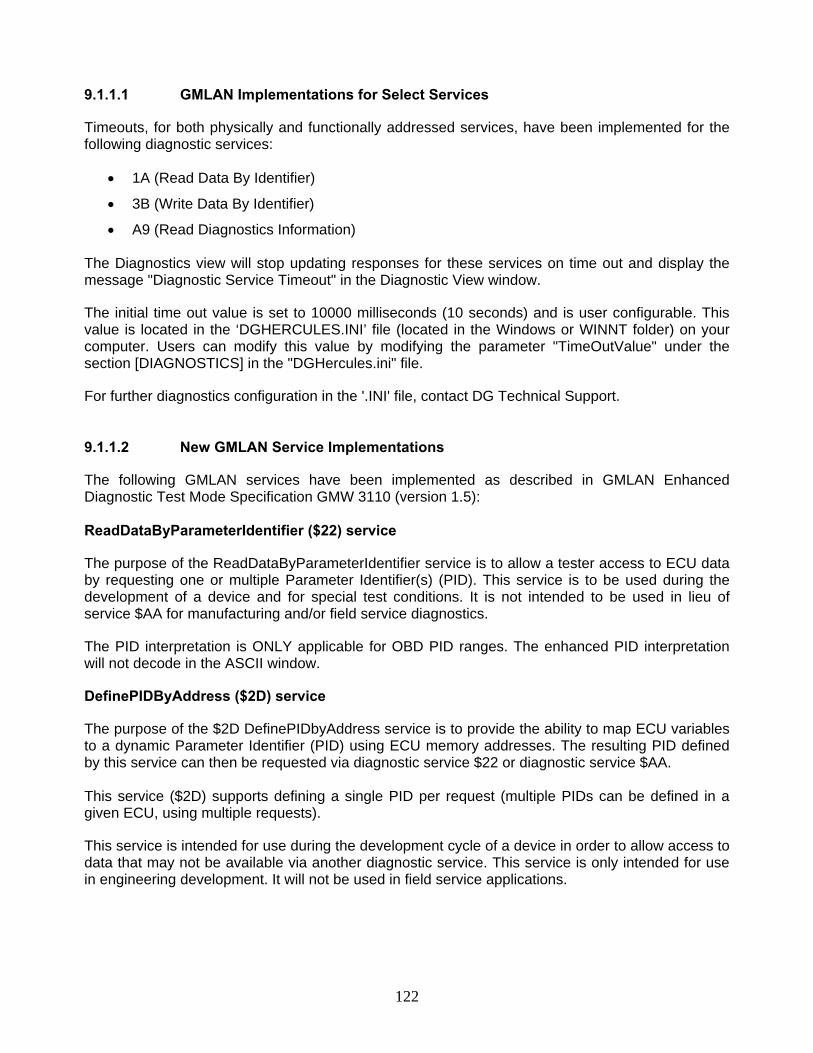
122
9.1.1.1 GMLAN Implementations for Select Services
Timeouts, for both physically and functionally addressed services, have been implemented for the following diagnostic services:
• 1A (Read Data By Identifier)
• 3B (Write Data By Identifier)
• A9 (Read Diagnostics Information) The Diagnostics view will stop updating responses for these services on time out and display the message "Diagnostic Service Timeout" in the Diagnostic View window.
The initial time out value is set to 10000 milliseconds (10 seconds) and is user configurable. This value is located in the ‘DGHERCULES.INI’ file (located in the Windows or WINNT folder) on your computer. Users can modify this value by modifying the parameter "TimeOutValue" under the section [DIAGNOSTICS] in the "DGHercules.ini" file.
For further diagnostics configuration in the '.INI' file, contact DG Technical Support.
9.1.1.2 New GMLAN Service Implementations
The following GMLAN services have been implemented as described in GMLAN Enhanced Diagnostic Test Mode Specification GMW 3110 (version 1.5): ReadDataByParameterIdentifier ($22) service
The purpose of the ReadDataByParameterIdentifier service is to allow a tester access to ECU data by requesting one or multiple Parameter Identifier(s) (PID). This service is to be used during the development of a device and for special test conditions. It is not intended to be used in lieu of service $AA for manufacturing and/or field service diagnostics.
The PID interpretation is ONLY applicable for OBD PID ranges. The enhanced PID interpretation will not decode in the ASCII window.
DefinePIDByAddress ($2D) service
The purpose of the $2D DefinePIDbyAddress service is to provide the ability to map ECU variables to a dynamic Parameter Identifier (PID) using ECU memory addresses. The resulting PID defined by this service can then be requested via diagnostic service $22 or diagnostic service $AA. This service ($2D) supports defining a single PID per request (multiple PIDs can be defined in a given ECU, using multiple requests).
This service is intended for use during the development cycle of a device in order to allow access to data that may not be available via another diagnostic service. This service is only intended for use in engineering development. It will not be used in field service applications.
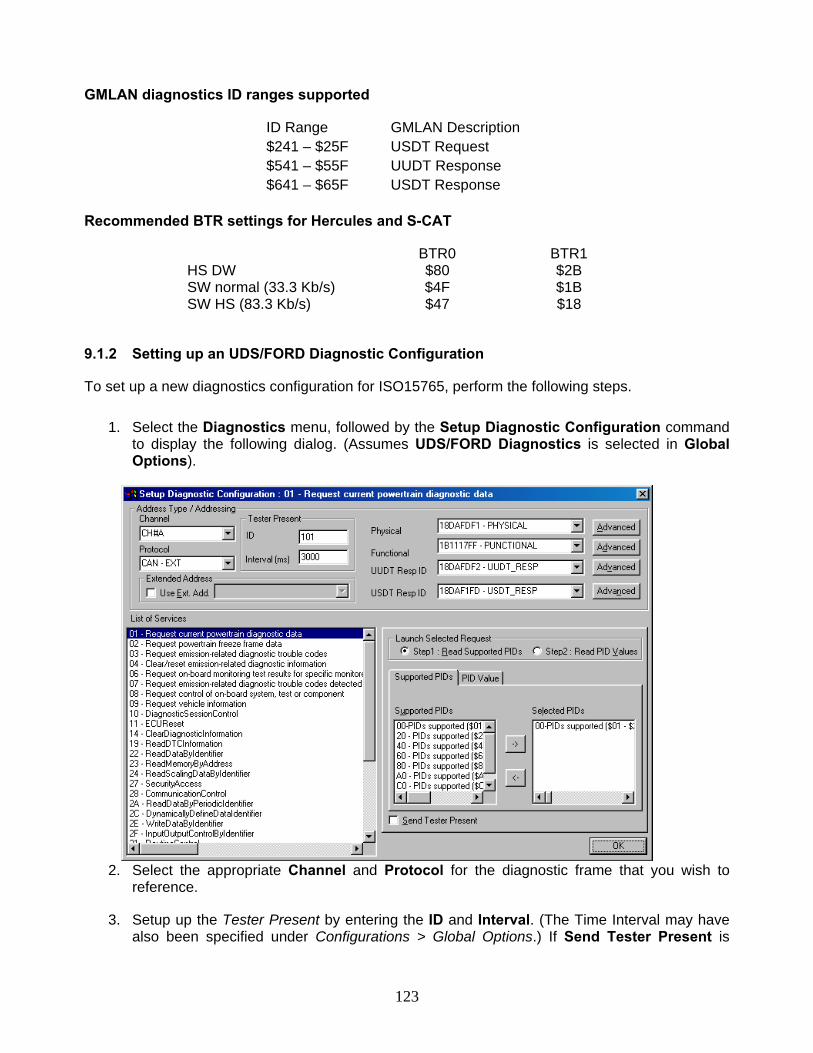
123
GMLAN diagnostics ID ranges supported
ID Range GMLAN Description $241 – $25F USDT Request $541 – $55F UUDT Response $641 – $65F USDT Response
Recommended BTR settings for Hercules and S-CAT
BTR0 BTR1 HS DW $80 $2B SW normal (33.3 Kb/s) $4F $1B SW HS (83.3 Kb/s) $47 $18
9.1.2 Setting up an UDS/FORD Diagnostic Configuration
To set up a new diagnostics configuration for ISO15765, perform the following steps.
1. Select the Diagnostics menu, followed by the Setup Diagnostic Configuration command to display the following dialog. (Assumes UDS/FORD Diagnostics is selected in Global Options).
2. Select the appropriate Channel and Protocol for the diagnostic frame that you wish to
reference.
3. Setup up the Tester Present by entering the ID and Interval. (The Time Interval may have also been specified under Configurations > Global Options.) If Send Tester Present is
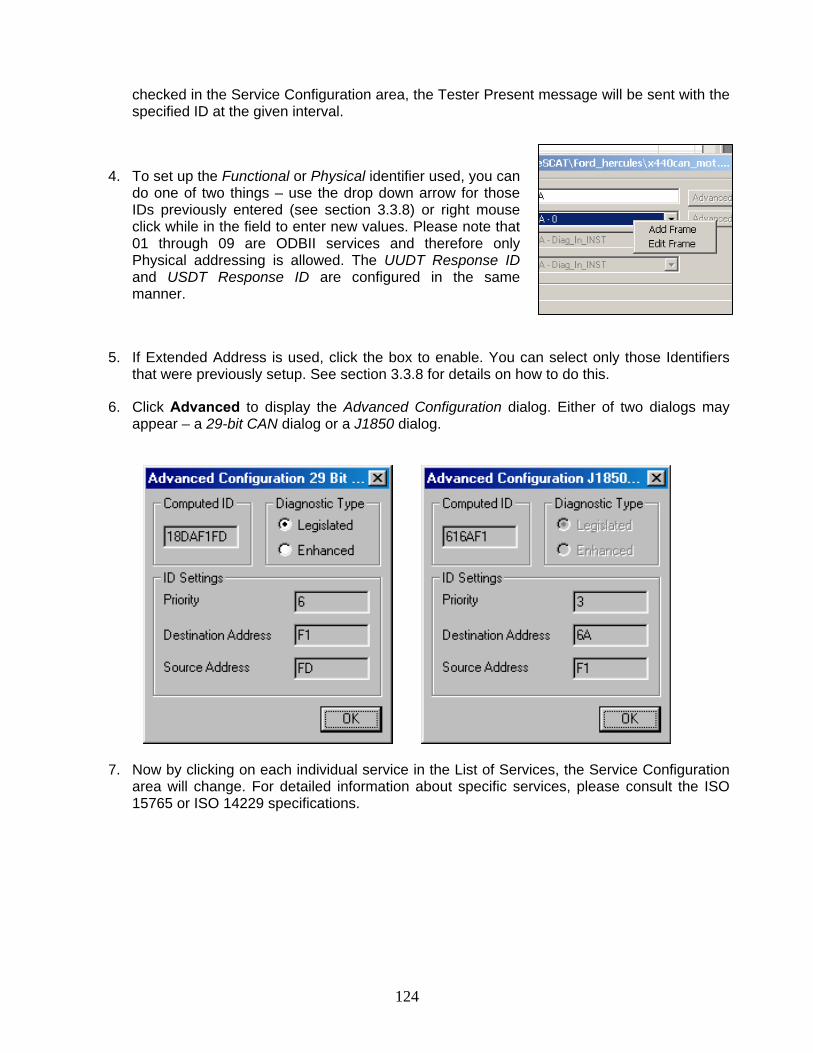
124
checked in the Service Configuration area, the Tester Present message will be sent with the specified ID at the given interval.
4. To set up the Functional or Physical identifier used, you can do one of two things – use the drop down arrow for those IDs previously entered (see section 3.3.8) or right mouse click while in the field to enter new values. Please note that 01 through 09 are ODBII services and therefore only Physical addressing is allowed. The UUDT Response ID and USDT Response ID are configured in the same manner.
5. If Extended Address is used, click the box to enable. You can select only those Identifiers that were previously setup. See section 3.3.8 for details on how to do this.
6. Click Advanced to display the Advanced Configuration dialog. Either of two dialogs may appear – a 29-bit CAN dialog or a J1850 dialog.
7. Now by clicking on each individual service in the List of Services, the Service Configuration area will change. For detailed information about specific services, please consult the ISO 15765 or ISO 14229 specifications.
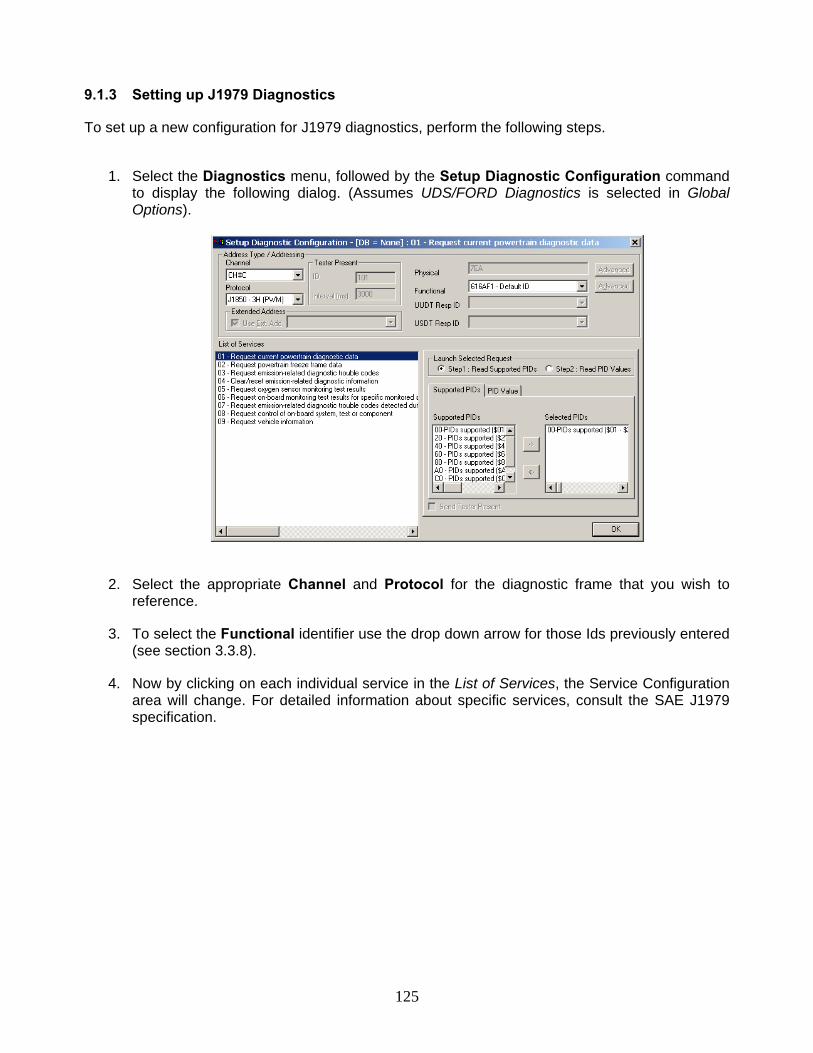
125
9.1.3 Setting up J1979 Diagnostics
To set up a new configuration for J1979 diagnostics, perform the following steps.
1. Select the Diagnostics menu, followed by the Setup Diagnostic Configuration command to display the following dialog. (Assumes UDS/FORD Diagnostics is selected in Global Options).
2. Select the appropriate Channel and Protocol for the diagnostic frame that you wish to reference.
3. To select the Functional identifier use the drop down arrow for those Ids previously entered (see section 3.3.8).
4. Now by clicking on each individual service in the List of Services, the Service Configuration area will change. For detailed information about specific services, consult the SAE J1979 specification.
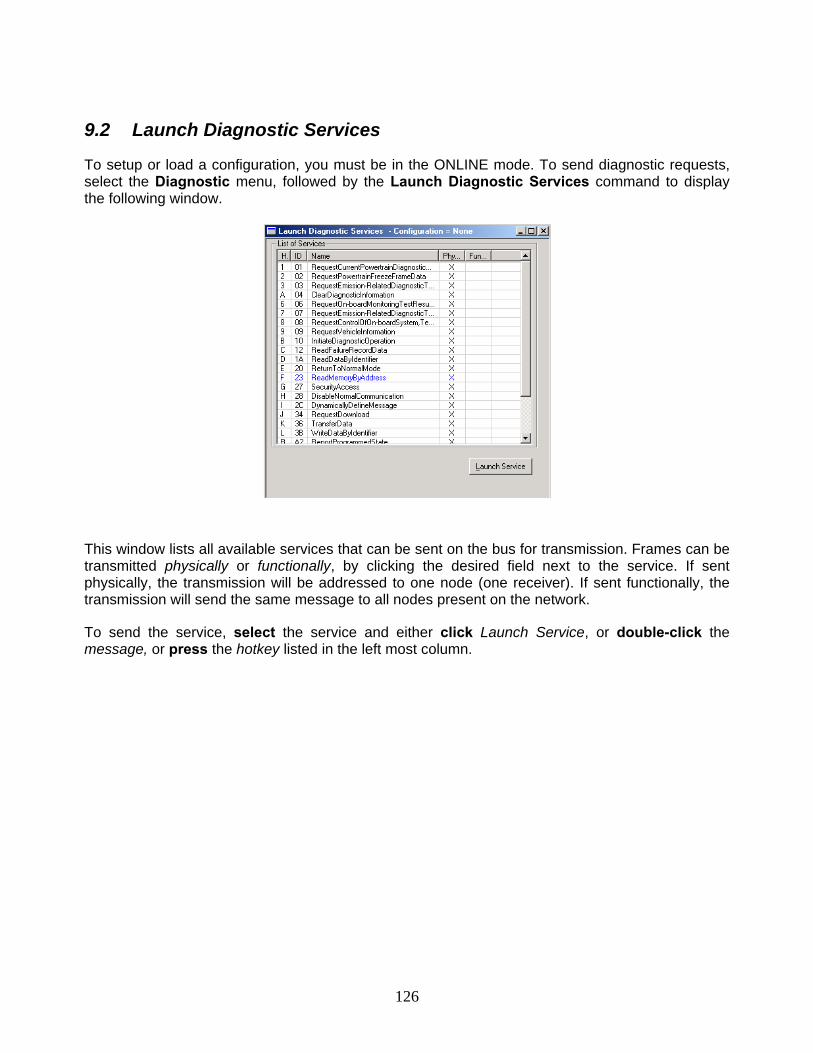
126
9.2 Launch Diagnostic Services
To setup or load a configuration, you must be in the ONLINE mode. To send diagnostic requests, select the Diagnostic menu, followed by the Launch Diagnostic Services command to display the following window.
This window lists all available services that can be sent on the bus for transmission. Frames can be transmitted physically or functionally, by clicking the desired field next to the service. If sent physically, the transmission will be addressed to one node (one receiver). If sent functionally, the transmission will send the same message to all nodes present on the network.
To send the service, select the service and either click Launch Service, or double-click the message, or press the hotkey listed in the left most column.
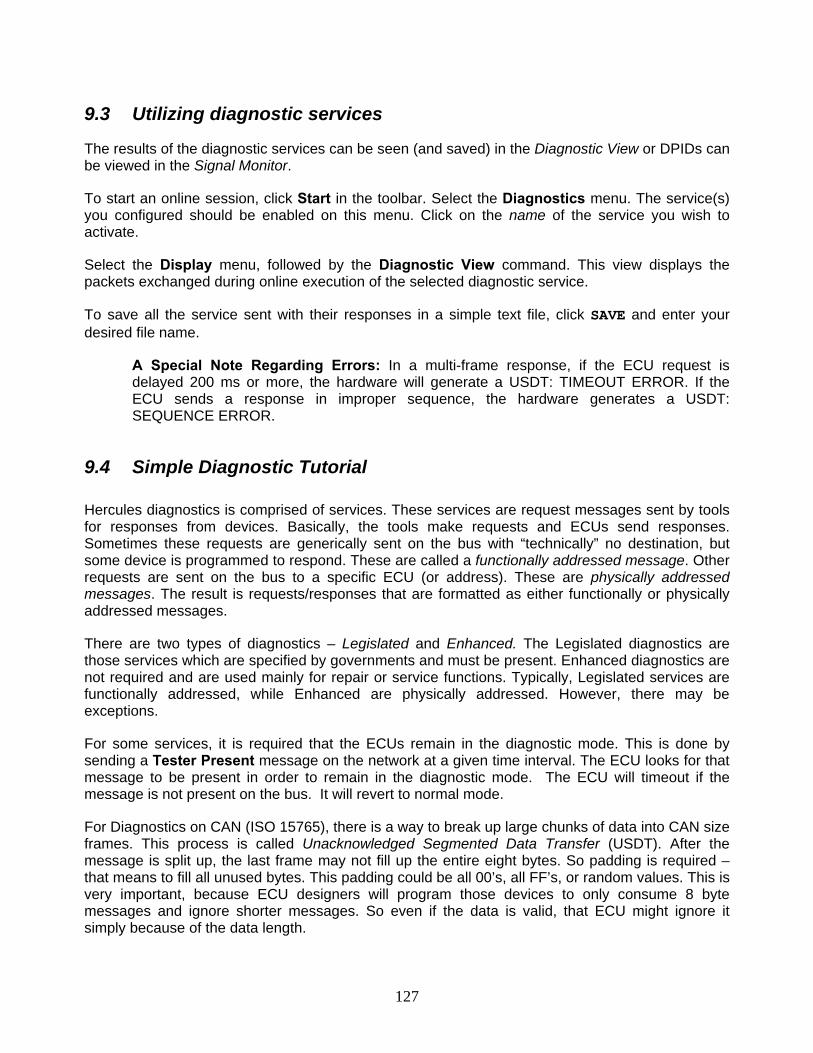
127
9.3 Utilizing diagnostic services
The results of the diagnostic services can be seen (and saved) in the Diagnostic View or DPIDs can be viewed in the Signal Monitor.
To start an online session, click Start in the toolbar. Select the Diagnostics menu. The service(s) you configured should be enabled on this menu. Click on the name of the service you wish to activate.
Select the Display menu, followed by the Diagnostic View command. This view displays the packets exchanged during online execution of the selected diagnostic service.
To save all the service sent with their responses in a simple text file, click SAVE and enter your desired file name.
A Special Note Regarding Errors: In a multi-frame response, if the ECU request is delayed 200 ms or more, the hardware will generate a USDT: TIMEOUT ERROR. If the ECU sends a response in improper sequence, the hardware generates a USDT: SEQUENCE ERROR.
9.4 Simple Diagnostic Tutorial
Hercules diagnostics is comprised of services. These services are request messages sent by tools for responses from devices. Basically, the tools make requests and ECUs send responses. Sometimes these requests are generically sent on the bus with “technically” no destination, but some device is programmed to respond. These are called a functionally addressed message. Other requests are sent on the bus to a specific ECU (or address). These are physically addressed messages. The result is requests/responses that are formatted as either functionally or physically addressed messages.
There are two types of diagnostics – Legislated and Enhanced. The Legislated diagnostics are those services which are specified by governments and must be present. Enhanced diagnostics are not required and are used mainly for repair or service functions. Typically, Legislated services are functionally addressed, while Enhanced are physically addressed. However, there may be exceptions.
For some services, it is required that the ECUs remain in the diagnostic mode. This is done by sending a Tester Present message on the network at a given time interval. The ECU looks for that message to be present in order to remain in the diagnostic mode. The ECU will timeout if the message is not present on the bus. It will revert to normal mode.
For Diagnostics on CAN (ISO 15765), there is a way to break up large chunks of data into CAN size frames. This process is called Unacknowledged Segmented Data Transfer (USDT). After the message is split up, the last frame may not fill up the entire eight bytes. So padding is required – that means to fill all unused bytes. This padding could be all 00’s, all FF’s, or random values. This is very important, because ECU designers will program those devices to only consume 8 byte messages and ignore shorter messages. So even if the data is valid, that ECU might ignore it simply because of the data length.

128
9.4.1 Hercules Diagnostic Support
CAN ISO 15765 with ISO 14229 services
GMLAN 3110 with ODBII legislated services
J1850 J1979 Services
Under the Configuration
Global Options
Hercules supports
Enabling Tester Present message for all services
Setting the Tester Present message time interval
Global Padding: None, All 00s, All FFs
Hercules supports decoding P-codes, C-codes, PIDs, etc. from the appropriate diagnostic services. (All of this information is held in a Windows INI file, so it is quickly editable if needed.)
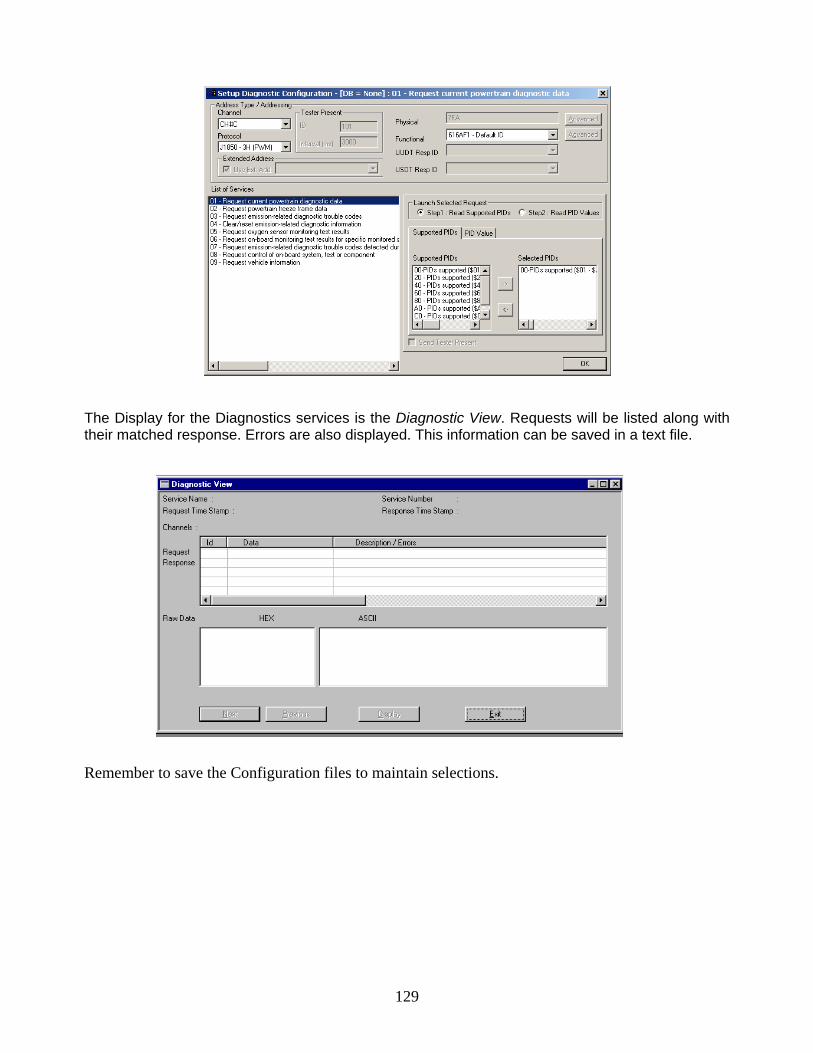
129
The Display for the Diagnostics services is the Diagnostic View. Requests will be listed along with their matched response. Errors are also displayed. This information can be saved in a text file.
Remember to save the Configuration files to maintain selections.
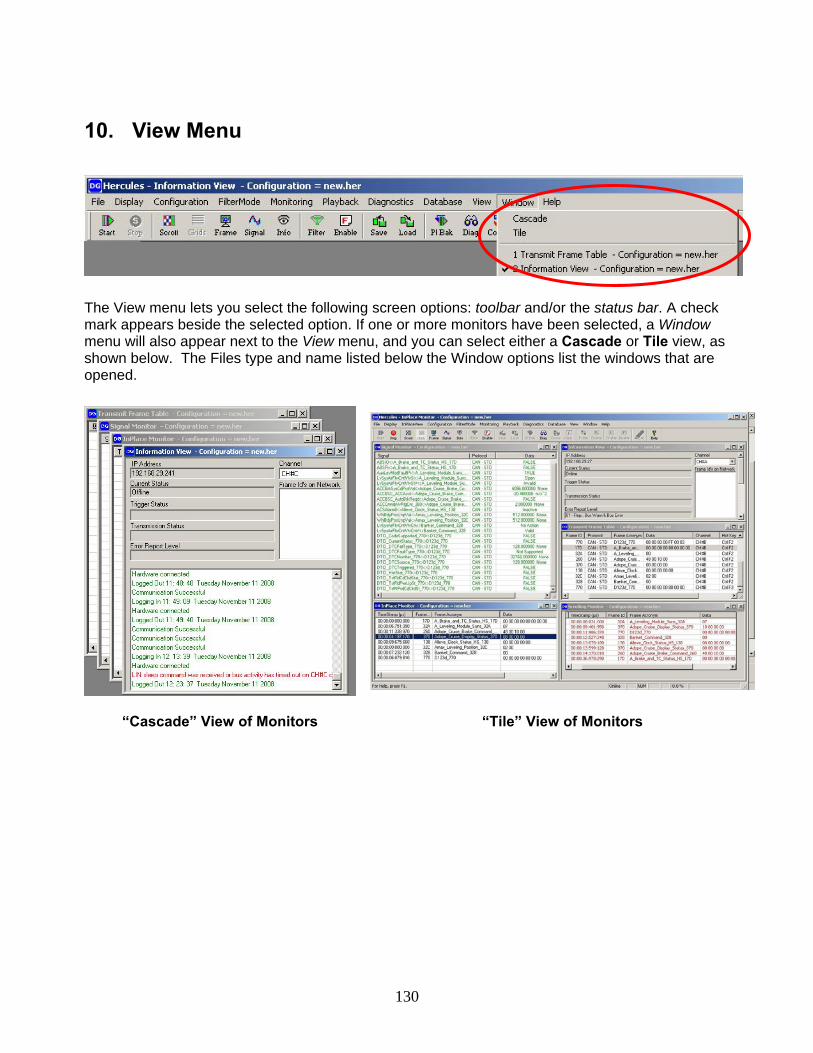
130
10. View Menu
The View menu lets you select the following screen options: toolbar and/or the status bar. A check mark appears beside the selected option. If one or more monitors have been selected, a Window menu will also appear next to the View menu, and you can select either a Cascade or Tile view, as shown below. The Files type and name listed below the Window options list the windows that are opened.
“Cascade” View of Monitors “Tile” View of Monitors
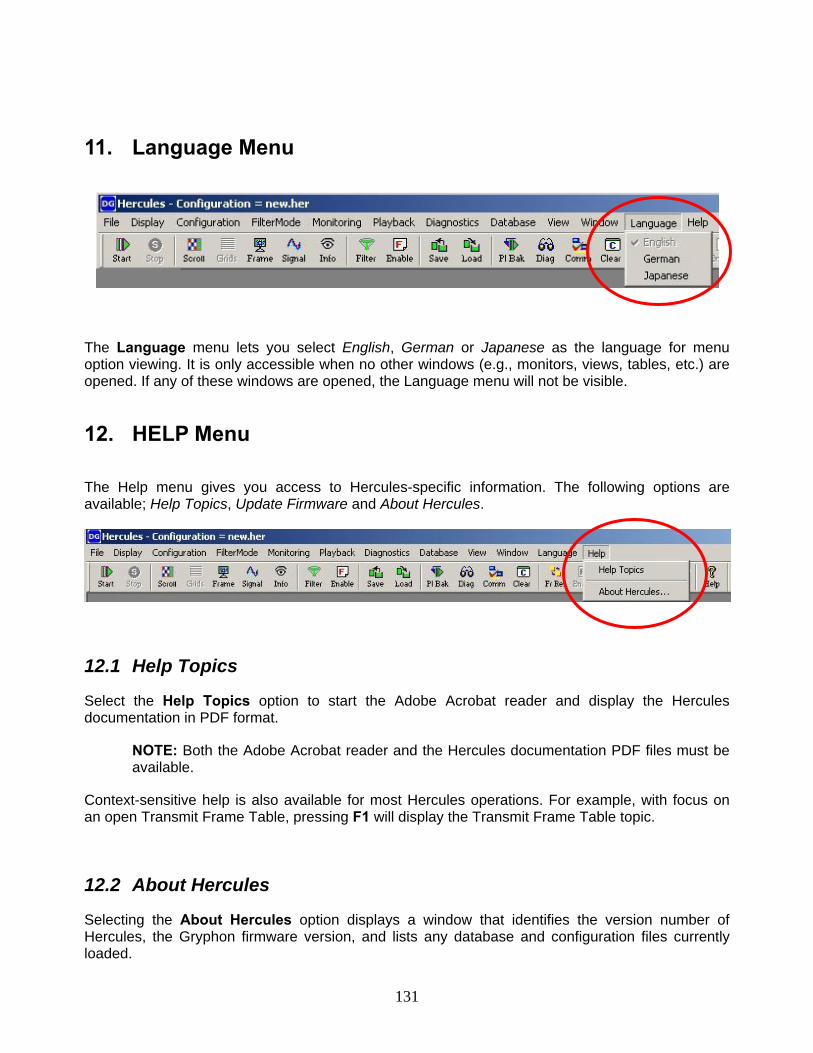
131
11. Language Menu
The Language menu lets you select English, German or Japanese as the language for menu option viewing. It is only accessible when no other windows (e.g., monitors, views, tables, etc.) are opened. If any of these windows are opened, the Language menu will not be visible.
12. HELP Menu The Help menu gives you access to Hercules-specific information. The following options are available; Help Topics, Update Firmware and About Hercules.
12.1 Help Topics
Select the Help Topics option to start the Adobe Acrobat reader and display the Hercules documentation in PDF format.
NOTE: Both the Adobe Acrobat reader and the Hercules documentation PDF files must be available.
Context-sensitive help is also available for most Hercules operations. For example, with focus on an open Transmit Frame Table, pressing F1 will display the Transmit Frame Table topic.
12.2 About Hercules
Selecting the About Hercules option displays a window that identifies the version number of Hercules, the Gryphon firmware version, and lists any database and configuration files currently loaded.
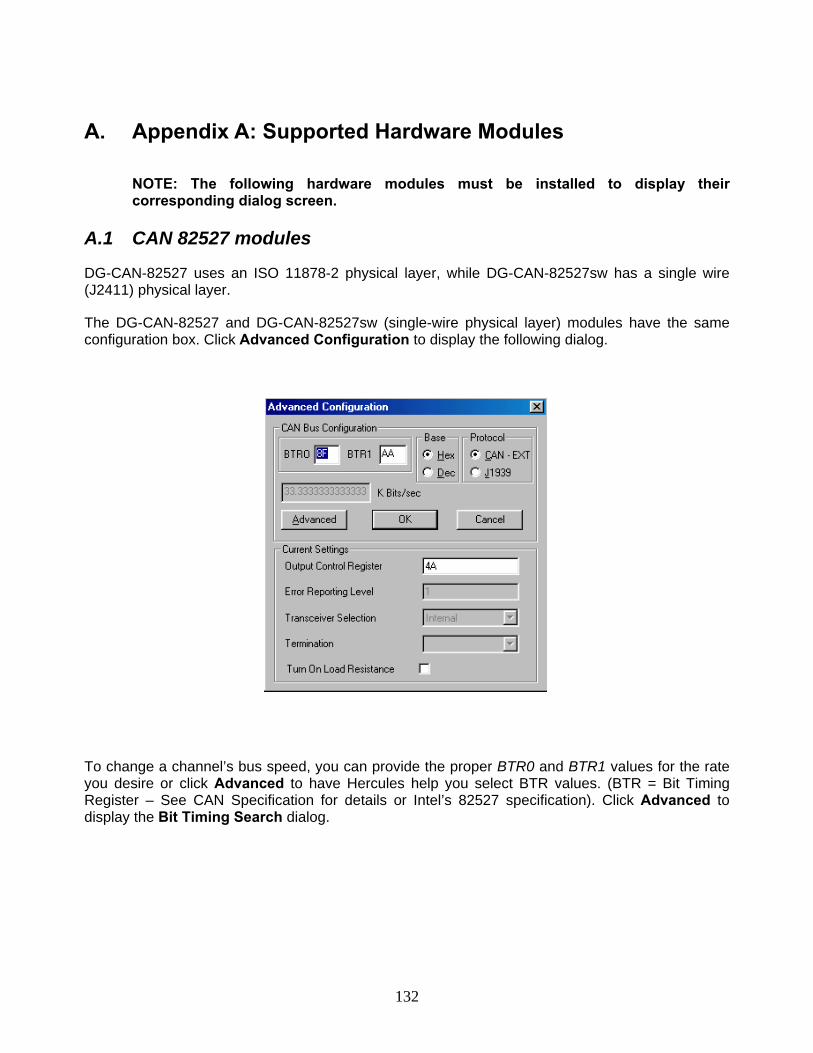
132
A. Appendix A: Supported Hardware Modules
NOTE: The following hardware modules must be installed to display their corresponding dialog screen.
A.1 CAN 82527 modules
DG-CAN-82527 uses an ISO 11878-2 physical layer, while DG-CAN-82527sw has a single wire (J2411) physical layer.
The DG-CAN-82527 and DG-CAN-82527sw (single-wire physical layer) modules have the same configuration box. Click Advanced Configuration to display the following dialog.
To change a channel’s bus speed, you can provide the proper BTR0 and BTR1 values for the rate you desire or click Advanced to have Hercules help you select BTR values. (BTR = Bit Timing Register – See CAN Specification for details or Intel’s 82527 specification). Click Advanced to display the Bit Timing Search dialog.
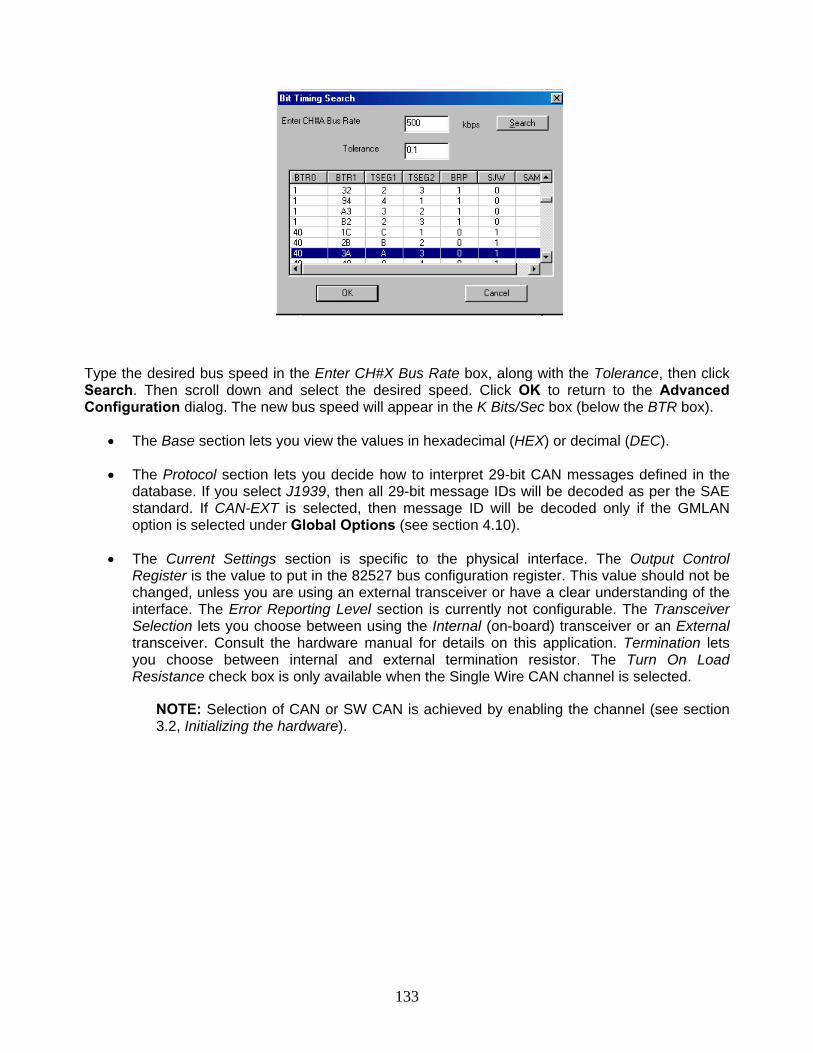
133
Type the desired bus speed in the Enter CH#X Bus Rate box, along with the Tolerance, then click Search. Then scroll down and select the desired speed. Click OK to return to the Advanced Configuration dialog. The new bus speed will appear in the K Bits/Sec box (below the BTR box).
• The Base section lets you view the values in hexadecimal (HEX) or decimal (DEC).
• The Protocol section lets you decide how to interpret 29-bit CAN messages defined in the database. If you select J1939, then all 29-bit message IDs will be decoded as per the SAE standard. If CAN-EXT is selected, then message ID will be decoded only if the GMLAN option is selected under Global Options (see section 4.10).
• The Current Settings section is specific to the physical interface. The Output Control Register is the value to put in the 82527 bus configuration register. This value should not be changed, unless you are using an external transceiver or have a clear understanding of the interface. The Error Reporting Level section is currently not configurable. The Transceiver Selection lets you choose between using the Internal (on-board) transceiver or an External transceiver. Consult the hardware manual for details on this application. Termination lets you choose between internal and external termination resistor. The Turn On Load Resistance check box is only available when the Single Wire CAN channel is selected.
NOTE: Selection of CAN or SW CAN is achieved by enabling the channel (see section 3.2, Initializing the hardware).
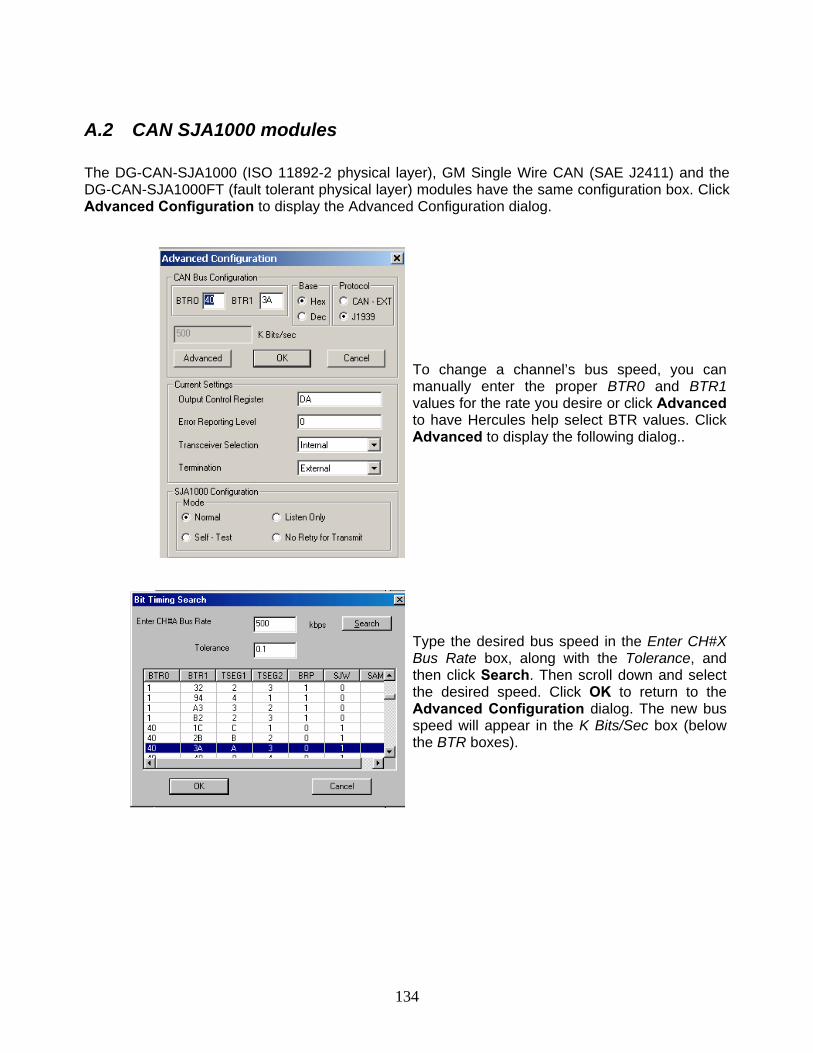
134
A.2 CAN SJA1000 modules
The DG-CAN-SJA1000 (ISO 11892-2 physical layer), GM Single Wire CAN (SAE J2411) and the DG-CAN-SJA1000FT (fault tolerant physical layer) modules have the same configuration box. Click Advanced Configuration to display the Advanced Configuration dialog.
To change a channel’s bus speed, you can manually enter the proper BTR0 and BTR1 values for the rate you desire or click Advanced to have Hercules help select BTR values. Click Advanced to display the following dialog..
Type the desired bus speed in the Enter CH#X Bus Rate box, along with the Tolerance, and then click Search. Then scroll down and select the desired speed. Click OK to return to the Advanced Configuration dialog. The new bus speed will appear in the K Bits/Sec box (below the BTR boxes).
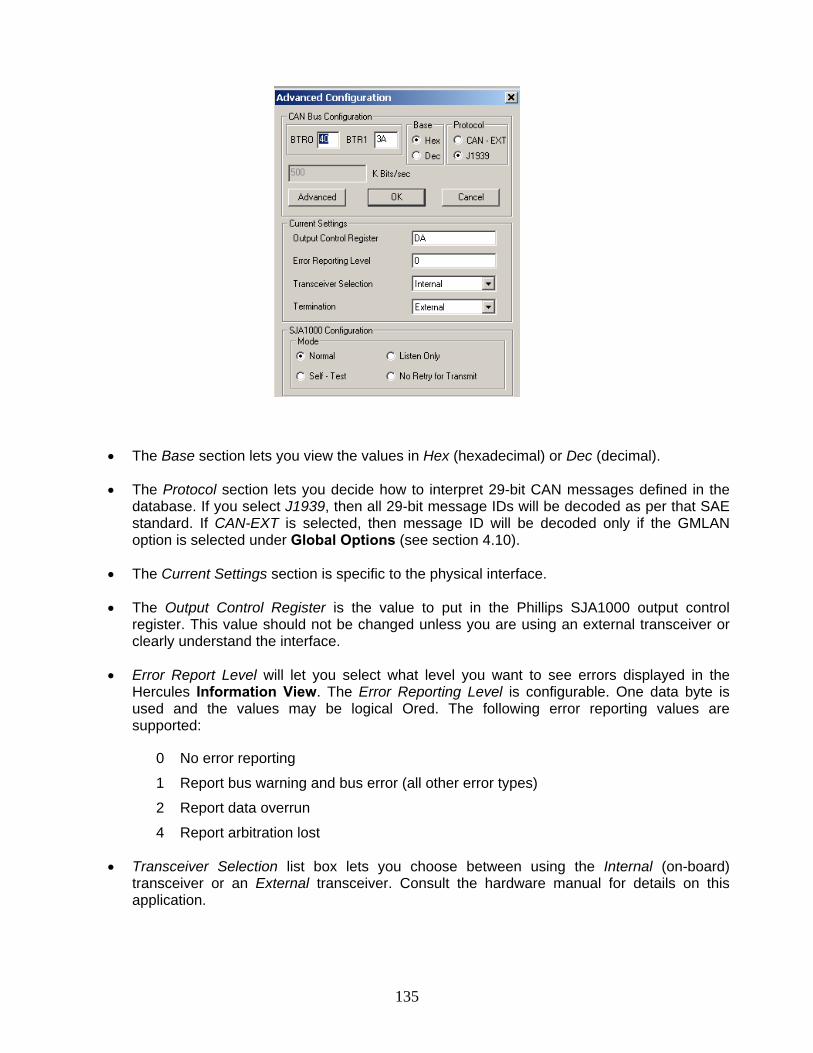
135
• The Base section lets you view the values in Hex (hexadecimal) or Dec (decimal).
• The Protocol section lets you decide how to interpret 29-bit CAN messages defined in the database. If you select J1939, then all 29-bit message IDs will be decoded as per that SAE standard. If CAN-EXT is selected, then message ID will be decoded only if the GMLAN option is selected under Global Options (see section 4.10).
• The Current Settings section is specific to the physical interface.
• The Output Control Register is the value to put in the Phillips SJA1000 output control register. This value should not be changed unless you are using an external transceiver or clearly understand the interface.
• Error Report Level will let you select what level you want to see errors displayed in the Hercules Information View. The Error Reporting Level is configurable. One data byte is used and the values may be logical Ored. The following error reporting values are supported:
0 No error reporting
1 Report bus warning and bus error (all other error types)
2 Report data overrun
4 Report arbitration lost
• Transceiver Selection list box lets you choose between using the Internal (on-board) transceiver or an External transceiver. Consult the hardware manual for details on this application.

136
• The SJA1000 module has an on-board termination of 120 ohms. This is selectable on / off via the Termination option.
• The SJA1000 Configuration lets you select one of four modes:
Normal – the regular configuration.
Self-Test – the channel sends an ACK after each messages it transmits on the CAN bus. This allows the channel to be the only device on a CAN network.
Listen Only – no data is transmitted and now ACKs are sent in response to received messages. All other data on the bus is received as normal.
No Retry for Transmit – all subsequent message transmissions are attempted only once. If arbitration is lost or if a bus error occurs, the message is not transmitted.
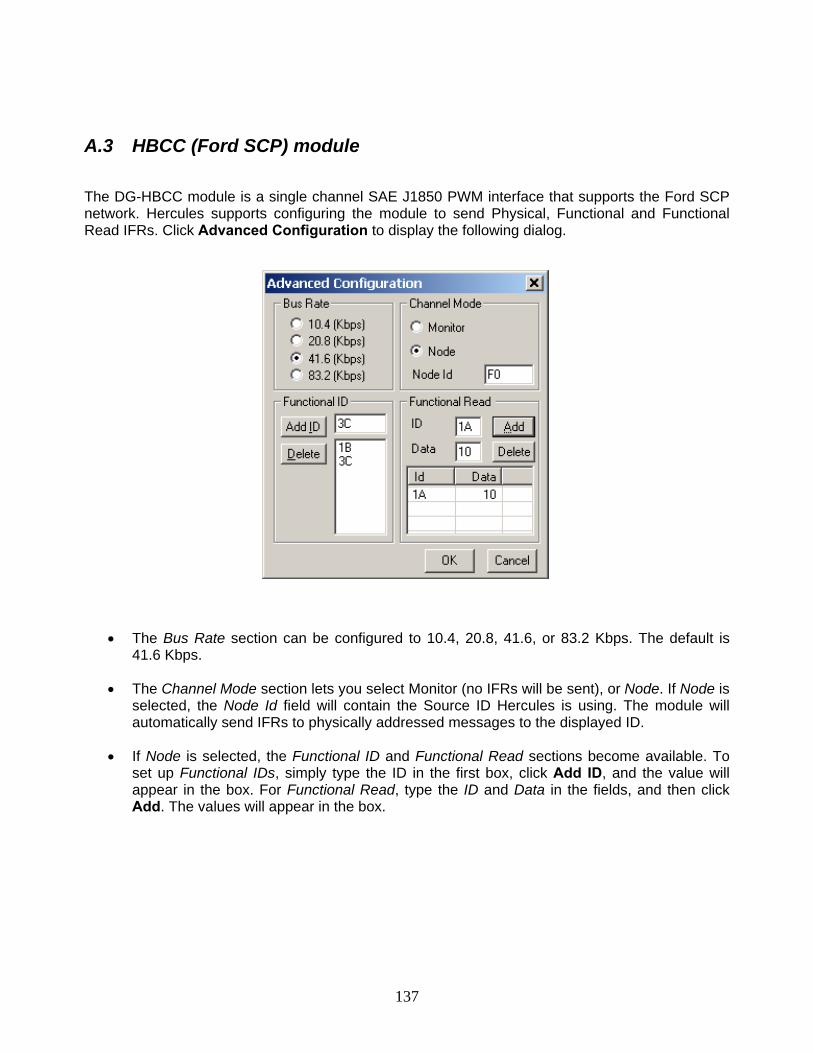
137
A.3 HBCC (Ford SCP) module
The DG-HBCC module is a single channel SAE J1850 PWM interface that supports the Ford SCP network. Hercules supports configuring the module to send Physical, Functional and Functional Read IFRs. Click Advanced Configuration to display the following dialog.
• The Bus Rate section can be configured to 10.4, 20.8, 41.6, or 83.2 Kbps. The default is 41.6 Kbps.
• The Channel Mode section lets you select Monitor (no IFRs will be sent), or Node. If Node is selected, the Node Id field will contain the Source ID Hercules is using. The module will automatically send IFRs to physically addressed messages to the displayed ID.
• If Node is selected, the Functional ID and Functional Read sections become available. To set up Functional IDs, simply type the ID in the first box, click Add ID, and the value will appear in the box. For Functional Read, type the ID and Data in the fields, and then click Add. The values will appear in the box.
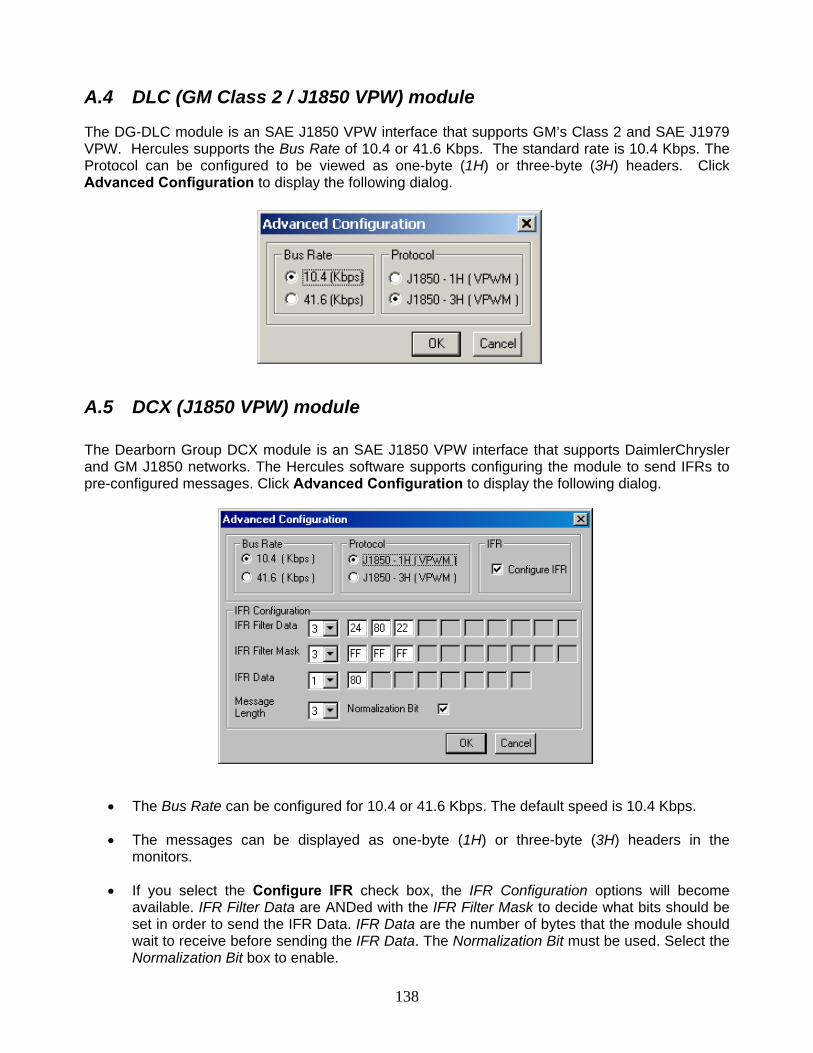
138
A.4 DLC (GM Class 2 / J1850 VPW) module
The DG-DLC module is an SAE J1850 VPW interface that supports GM’s Class 2 and SAE J1979 VPW. Hercules supports the Bus Rate of 10.4 or 41.6 Kbps. The standard rate is 10.4 Kbps. The Protocol can be configured to be viewed as one-byte (1H) or three-byte (3H) headers. Click Advanced Configuration to display the following dialog.
A.5 DCX (J1850 VPW) module
The Dearborn Group DCX module is an SAE J1850 VPW interface that supports DaimlerChrysler and GM J1850 networks. The Hercules software supports configuring the module to send IFRs to pre-configured messages. Click Advanced Configuration to display the following dialog.
• The Bus Rate can be configured for 10.4 or 41.6 Kbps. The default speed is 10.4 Kbps.
• The messages can be displayed as one-byte (1H) or three-byte (3H) headers in the monitors.
• If you select the Configure IFR check box, the IFR Configuration options will become available. IFR Filter Data are ANDed with the IFR Filter Mask to decide what bits should be set in order to send the IFR Data. IFR Data are the number of bytes that the module should wait to receive before sending the IFR Data. The Normalization Bit must be used. Select the Normalization Bit box to enable.
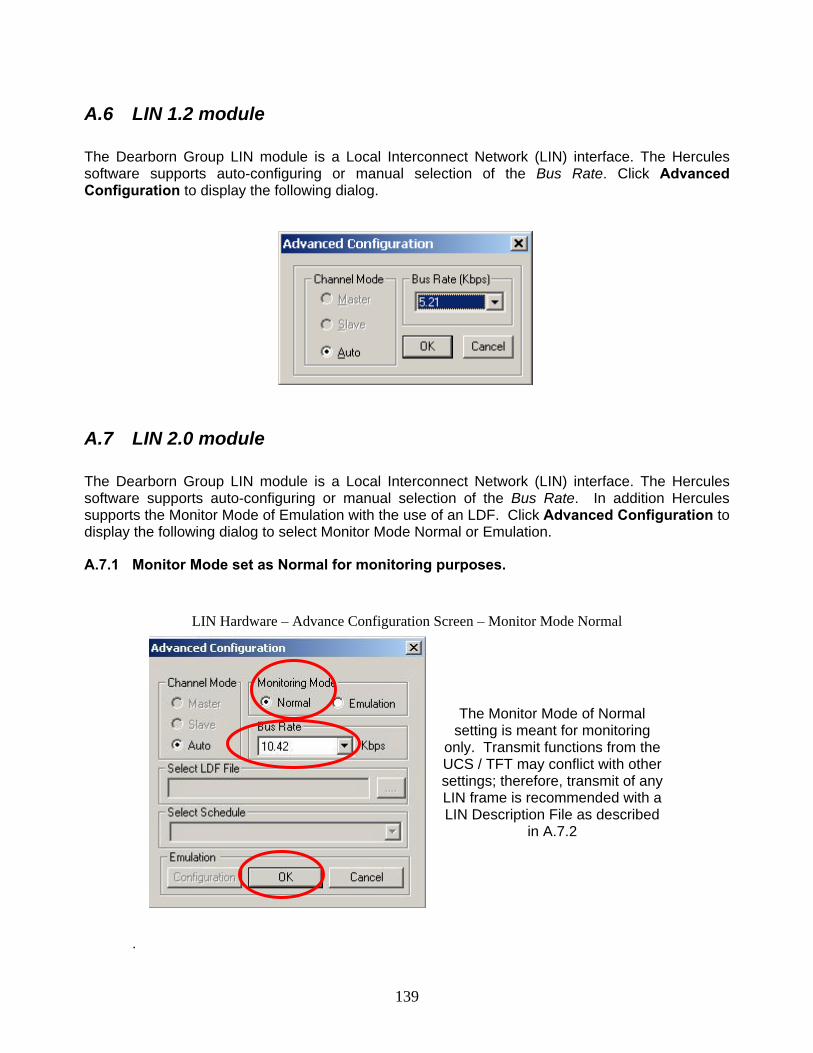
139
A.6 LIN 1.2 module
The Dearborn Group LIN module is a Local Interconnect Network (LIN) interface. The Hercules software supports auto-configuring or manual selection of the Bus Rate. Click Advanced Configuration to display the following dialog.
A.7 LIN 2.0 module
The Dearborn Group LIN module is a Local Interconnect Network (LIN) interface. The Hercules software supports auto-configuring or manual selection of the Bus Rate. In addition Hercules supports the Monitor Mode of Emulation with the use of an LDF. Click Advanced Configuration to display the following dialog to select Monitor Mode Normal or Emulation.
A.7.1 Monitor Mode set as Normal for monitoring purposes.
LIN Hardware – Advance Configuration Screen – Monitor Mode Normal
The Monitor Mode of Normal setting is meant for monitoring
only. Transmit functions from the UCS / TFT may conflict with other settings; therefore, transmit of any LIN frame is recommended with a LIN Description File as described
in A.7.2
.
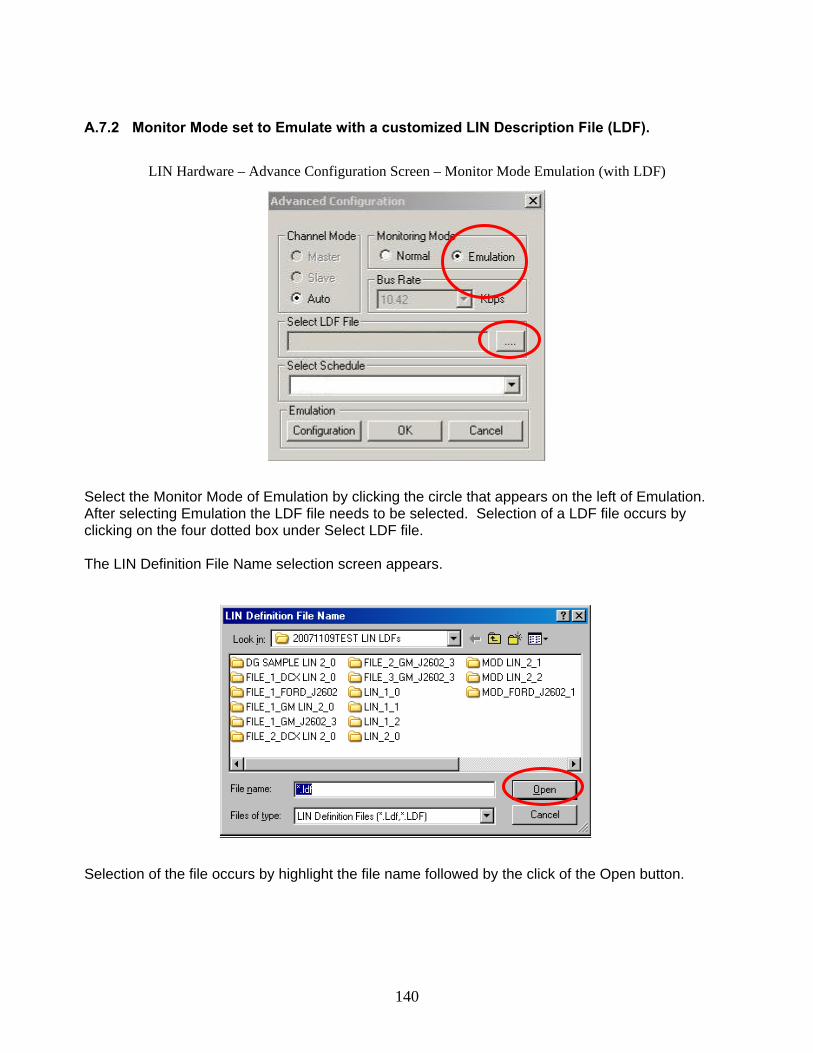
140
A.7.2 Monitor Mode set to Emulate with a customized LIN Description File (LDF).
LIN Hardware – Advance Configuration Screen – Monitor Mode Emulation (with LDF)
Select the Monitor Mode of Emulation by clicking the circle that appears on the left of Emulation. After selecting Emulation the LDF file needs to be selected. Selection of a LDF file occurs by clicking on the four dotted box under Select LDF file. The LIN Definition File Name selection screen appears.
Selection of the file occurs by highlight the file name followed by the click of the Open button.
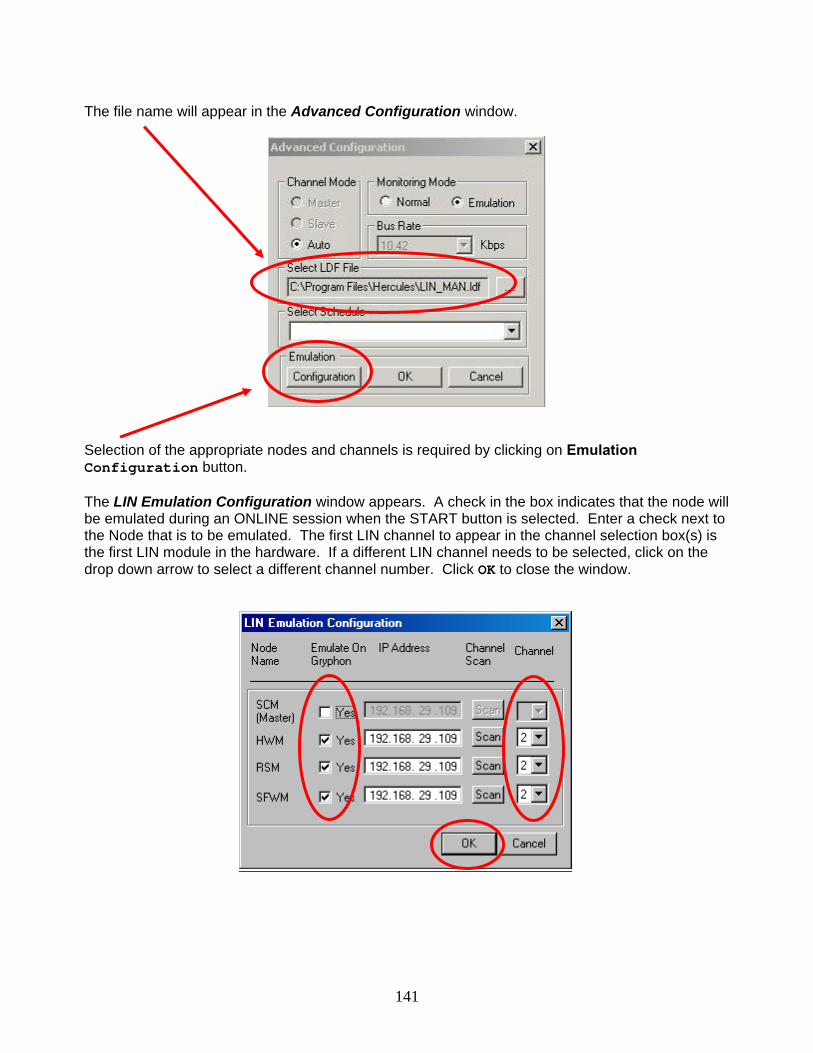
141
The file name will appear in the Advanced Configuration window.
Selection of the appropriate nodes and channels is required by clicking on Emulation Configuration button. The LIN Emulation Configuration window appears. A check in the box indicates that the node will be emulated during an ONLINE session when the START button is selected. Enter a check next to the Node that is to be emulated. The first LIN channel to appear in the channel selection box(s) is the first LIN module in the hardware. If a different LIN channel needs to be selected, click on the drop down arrow to select a different channel number. Click OK to close the window.
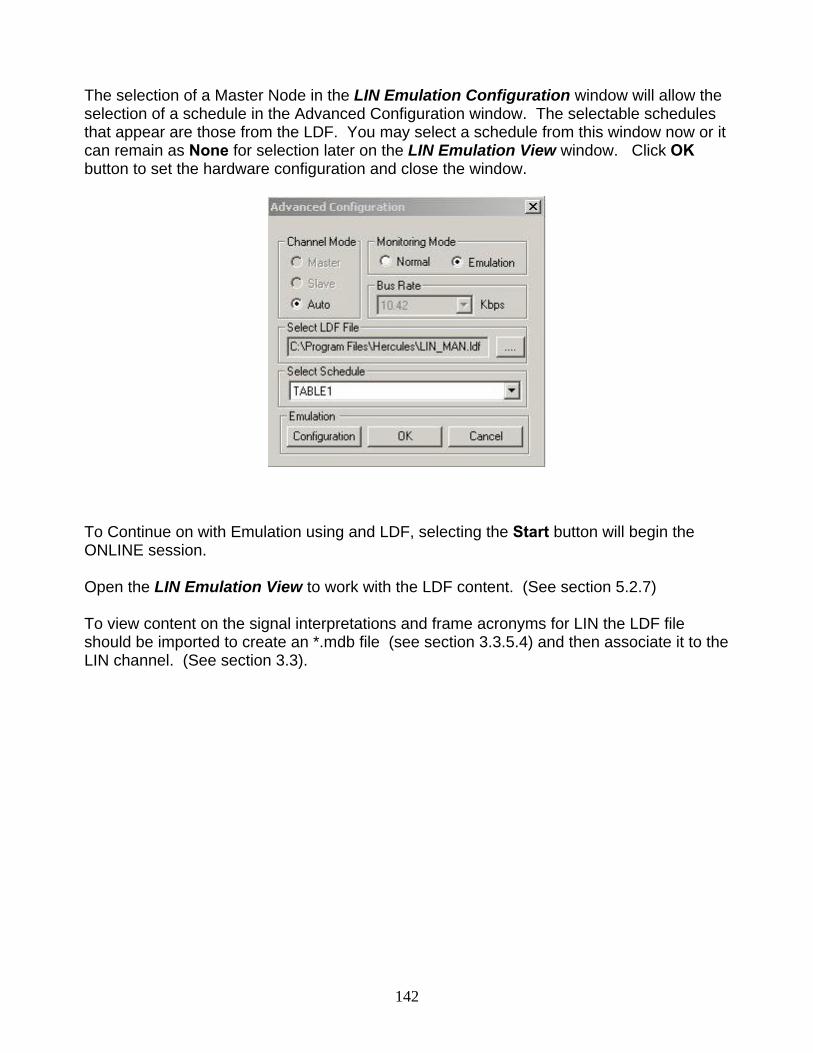
142
The selection of a Master Node in the LIN Emulation Configuration window will allow the selection of a schedule in the Advanced Configuration window. The selectable schedules that appear are those from the LDF. You may select a schedule from this window now or it can remain as None for selection later on the LIN Emulation View window. Click OK button to set the hardware configuration and close the window.
To Continue on with Emulation using and LDF, selecting the Start button will begin the ONLINE session. Open the LIN Emulation View to work with the LDF content. (See section 5.2.7) To view content on the signal interpretations and frame acronyms for LIN the LDF file should be imported to create an *.mdb file (see section 3.3.5.4) and then associate it to the LIN channel. (See section 3.3).