Embed Size (px)
Citation preview

Herbivorous coral reef fish responses to local and global stressors
by
Jenny Smith BSc, Dalhousie University, 2017
A Thesis Submitted in Partial Fulfillment of the Requirements for the Degree of
MASTER OF SCIENCE
in the Department of Biology
© Jenny Smith, 2019 University of Victoria
All rights reserved. This thesis may not be reproduced in whole or in part, by photocopy or other
means, without the permission of the author.

ii
Supervisory Committee
Herbivorous coral reef fish responses to local and global stressors
by
Jenny Smith BSc, Dalhousie University, 2017
Supervisory Committee Dr. Julia Baum, Supervisor Department of Biology Dr. Rana El-Sabaawi, Departmental Member Department of Biology Dr. Natalie Ban, Outside Member School of Environmental Studies

iii
Abstract
Given the current state of the climate and continuing local human impacts to coral reefs,
conservation of these ecosystems requires active management efforts to arrest further
deterioration. Some current management strategies focus on regulating local impacts such that
reefs are provided the best chance at resisting further degradation from global, climate change-
induced disturbances. One such strategy is to manage local herbivore populations. Herbivorous
coral reef fish are considered natural drivers of reef recovery due to their prevention of algal
overgrowth on coral and of further degradation of the reef to an undesirable state dominated by
macroalgae. While the numerical response of herbivorous fish to disturbance is commonly
investigated, the response of their key function to large-scale, global disturbance is still not well
understood. In this thesis, I attempt to take a functional approach to describe herbivory on
Kiritimati (Christmas Island), the largest coral atoll, located in the equatorial Pacific Ocean.
First, I describe species-specific herbivory using three metrics: (i) bite rates; (ii) grazing impacts;
and (iii) selectivity, to explore how these metrics vary with herbivore identity, individual size
and life phase, and to determine if they are influenced by local gradients of human disturbance
and whether or not they respond to a pulse heat stress and coral bleaching disturbance that
resulted from the 2015–2016 El Niño. I found that herbivore functional groups and species
exhibit distinct herbivory, driven, in part, by differences in fish size. Disturbance at a local level
does not appear to have a significant influence on species-specific herbivory, but I detected an
increase in bite rates and grazing impacts in response to a global heat stress event. These findings
have implications for how herbivores respond to different levels of disturbance. I then scale up
species-specific grazing impacts using site-averaged species’ densities to explore how the
herbivore assemblage grazing function responds to disturbance. Further, I summed average

iv
species’ impacts at each site by functional group and detected distinct grazing impacts among
groups and an increase following a global heat stress event. These findings suggest that the
herbivory function of the assemblage is relatively robust to withstanding disturbance. Given that
global scale disturbances of reef ecosystems are projected to become more frequent in the future,
it is imperative to understand how this function will be influenced by disturbance at different
scales. Taken together, the results in this thesis provide insight into the differing impacts of local
and global scale disturbances on the herbivory function and suggest a somewhat promising
outcome for the potential recovery of reefs following future disturbance.

v
Table of Contents Supervisory Committee .................................................................................................................. ii Abstract .......................................................................................................................................... iii Table of Contents ............................................................................................................................ v List of Tables ................................................................................................................................. vi List of Figures ............................................................................................................................... vii Acknowledgements ........................................................................................................................ ix Dedication ...................................................................................................................................... xi Chapter 1 – Introduction .............................................................................................................. 1
1.1 Coral reef herbivory .............................................................................................................. 2 1.2 Herbivorous reef fish responses to disturbance .................................................................... 6 1.3 Quantifying the herbivory function ...................................................................................... 8 1.4 Thesis Research .................................................................................................................. 10
Chapter 2 – Species-specific herbivory increases with global heat stress .............................. 14 2.1 Abstract ............................................................................................................................... 15 2.2 Introduction ......................................................................................................................... 16 2.3 Methods ............................................................................................................................... 20
2.3.1 Study site and overview ............................................................................................... 20 2.3.2 Data collection and treatment ...................................................................................... 20 2.3.3 Data analysis ................................................................................................................ 22
2.4 Results ................................................................................................................................. 25 2.4.1 Bite rates ...................................................................................................................... 25 2.4.2 Grazing impact ............................................................................................................. 27 2.4.3 Selectivity .................................................................................................................... 28
2.5 Discussion ........................................................................................................................... 29 Chapter 3 – Herbivore assemblage grazing impact is robust to a significant coral bleaching event ............................................................................................................................................. 46
3.1 Abstract ............................................................................................................................... 46 3.2 Introduction ......................................................................................................................... 47 3.3 Methods ............................................................................................................................... 53
3.3.1 Study site ...................................................................................................................... 53 3.3.2 Data collection ............................................................................................................. 54 3.3.3 Data processing ............................................................................................................ 55 3.3.4 Data visualization ......................................................................................................... 56 3.3.5 Data analysis ................................................................................................................ 57
3.4 Results ................................................................................................................................. 59 3.4.1 Multivariate analysis .................................................................................................... 59 3.4.2 Univariate analysis ....................................................................................................... 60
3.5 Discussion ........................................................................................................................... 61 Chapter 4 – Conclusion .............................................................................................................. 72 References ..................................................................................................................................... 78 Appendices .................................................................................................................................... 89
Appendix A - Literature review of coral reef fish herbivory .................................................... 89 Appendix B - Supplemental tables and figures for Chapter 2 ................................................ 113 Appendix C - Supplemental tables for Chapter 3 ................................................................... 134

vi
List of Tables Table 2.1 Number of feeding observations for each herbivore species in each year, classified by
family (Acanthuridae = surgeonfishes; Scaridae = parrotfishes) and functional group (FG).
Bolded species are the 13 most commonly observed (n≥ 25 feeding observations) which were
retained in the functional group analysis. Within each functional group, species are listed in
descending order by their total number of observations. .............................................................. 39
Table 2.2 Feeding observations for the 13 most commonly observed herbivore species (n≥25
observations) included in our functional group (FG) analysis at each disturbance level over three
survey years. Within each functional group, species are listed in descending order by their total
number of observations. ................................................................................................................ 40
Table 3.1 Number of instances that species had herbivore feeding observations and density
estimates from the same site in each year to calculate a metric for average species impact.
Species are classified by functional group (FG) and arranged within each group in descending
order by the total number of estimates. ......................................................................................... 66

vii
List of Figures
Figure 2.1 Map of twenty-one forereef study sites and villages on Kiritimati (Christmas Island),
Republic of Kiribati. Sites are coloured based on levels of local human disturbance, and villages
(red circles) are scaled to the human population. Inset indicates the island’s location (triangle) in
the equatorial Pacific Ocean. ........................................................................................................ 41
Figure 2.2 Herbivory: (a) bite rate (±SE); (b) grazing impact (±SE) (bite rate × gape area); (c)
selectivity, derived from in situ feeding observations of herbivorous (surgeonfish and parrotfish)
reef fishes, averaged over three years (2013, 2015, 2017) for the 13 most commonly observed
species on Kiritimati. Species are ordered from highest to lowest bite rate, with the species’ text
colour denoting functional group, following colour coding in panel (b). CCA= crustose coralline
algae. ............................................................................................................................................. 42
Figure 2.3 Effect size estimates and 95% confidence intervals for predictor coefficients: Local
Disturbance (Very high, Medium, Low relative to Very low); Year (2017, 2015 relative to 2013);
Functional Group (Scraper, Excavator, Browser relative to Grazer) from generalized linear
mixed models of overall herbivore: ( ) bite rates, ( ) grazing impact and ( ) selectivity
responses. ...................................................................................................................................... 43
Figure 2.4 Herbivorous fish functional group mean and 95% confidence intervals of (a, b) bite
rates and (c, d) grazing impacts to (a, c) heat stress and (b, d) local human disturbance. ............ 44
Figure 2.5 Mean and 95% confidence intervals of estimated herbivore selectivity for turf
substrates: (a) averaged across all observed species for each disturbance level; (b) by functional
group for each disturbance level. .................................................................................................. 45
Figure 3.1 Map of twenty-three forereef study sites and villages on Kiritimati (Christmas
Island), Republic of Kiribati. Sites are coloured based on levels of local human disturbance, and
villages (red circles) are scaled to the human population. Inset indicates the island’s location
(triangle) in the equatorial Pacific Ocean. .................................................................................... 67

viii
Figure 3.2 Redundancy analysis of the herbivore community impact constrained by local human
disturbance and global heat stress. (a) Triplot displaying site scores (open squares) and text
labels to indicate centroid scores (open circles) of the constraining variable factor levels. (b)
Biplot for the species (open circles) and site scores (open squares). The R2, R2 adj and the p-
value for the significance of the overall fit of the constrained ordination are displayed in the top
right-hand corner of panel (b). Axis labels include the cumulative proportion of constrained
variance. ........................................................................................................................................ 68
Figure 3.3 Redundancy analysis of the herbivore community impact constrained by local human
disturbance and heat stress. (a) Biplot displaying site scores coloured by the human disturbance
levels. (b) Biplot displaying site scores coloured by time period associated with the El Niño.
Axis labels include the cumulative proportion of constrained variance. ...................................... 69
Figure 3.4 Effect size estimates and 95% confidence intervals for fixed predictor coefficients:
Local disturbance (Very high, High, Medium, Low relative to Very low); El Niño (After relative
to Before); Functional group (Browser, Excavator, Scraper relative to Grazer) from generalized
linear mixed model of assemblage-level grazing impact. ............................................................. 70
Figure 3.5 Boxplot of model predictions of grazing impacts at each level of the fixed effect
predictors included in our generalized linear model of assemblage-level grazing impact: (a)
model predictions of grazing impact by functional group, (b) time period associated with the
global El Niño heat stress disturbance, and (c) local disturbance level. Asterisk indicates
significant (by Tukey test) differences between levels of the fixed predictors. Horizontal lines
indicate the median, the upper and lower limits of boxes indicate the interquartile range. Outliers
are removed from panel (a) (3 Grazer, 3 Scraper, 2 Excavator, 1 Browser) and panel (b) (4
Before, 3 After) to enable a better view of patterns. ..................................................................... 71

ix
Acknowledgements
First and foremost, I would like to extend my warmest thanks to my supervisor and
supervisory committee for their advice and mentorship. I count myself fortunate to have had a
strong female presence on my committee, all of whom are wonderful academics that serve as
fantastic examples of women in science conducting stellar research in their respective fields. It
provided such a positive and supportive atmosphere in which to discuss my project. Of course, I
owe the majority of thanks to my supervisor Dr. Julia Baum, for leading by example as a
rigorous researcher and for being an outspoken advocate for equality. Thank you also to Dr.
Rana El-Sabaawi for asking the poignant questions to make me think a little deeper. Thank you
finally to Dr. Natalie Ban for helping me see my thesis from a different perspective.
Secondly, I am grateful to my fellow grad students and office mates, past and present,
who shared their space and time with me. You all served as a great support system and I thank
you for all the cookie, friendship, and sunshine walks. I would like to acknowledge some key
Baum Lab members. Thank you, Geoff Osgood, for your invaluable insight into the world of
statistics and for being so open and willing to discuss my results. Thanks of course to Kristina
Tietjen for handling all things Kiritimati, your dedicated efforts to the long-term monitoring
program help make so many projects possible, and mine was no exception. Thank you also Sean
Dimoff for insight on all things fish related and Kevin Bruce for putting up with me as a dive
buddy on our KI 2018 trip. I cannot wait to see how your own projects turn out! Finally, I must
acknowledge past Baum Lab superstar Jenn Magel for providing wonderful editorial support on
early versions of one of my chapters. Although I cannot name everyone individually, all my
fellow Baum/Juanes lab members, please take this as my personal thanks to you as well. And of
course, in acknowledging my support system, my gratitude most certainly extends to my

x
roommates, especially Charles, Michael and Laura for opening up their home to me and putting
up with my antics during my stay in Victoria.
Thirdly, I am deeply appreciative to all those who help support the Baum Lab’s
monitoring program on Kiritimati, for without the work of many involved in the design,
collection and processing of the data, I would not have had the material to produce this thesis. In
particular, I am grateful to the Government and people of Kiribati for their support in conducting
the fieldwork and accommodating the research team year after year. I would also like to
acknowledge the research divers on the team, both past and present, who tirelessly counted
herbivore bites and identified fish (TB, SC, JG, MW, TP, SF, SD). As well, I thank the many lab
volunteers who had a hand in processing the benthic cover data from the various years. The data
collection and processing really is a collective effort and I cannot thank all those involved
enough.
Along that vein, I would also like to acknowledge the various sources of personal funding
that made this degree possible: Canadian Scholarships Trust, Natural Sciences and Engineering
Research Council of Canada (NSERC), a University of Victoria Graduate Entrance Award,
University of Victoria President Research Scholarship, Grieg Cosier Memorial Award, W.
Gordon Fields Memorial Fellowship, and the UVic Department of Biology and Faculty of Grad
Studies.
Finally, I really would not have gotten to this point without the unwavering support from
family and friends. Thank you, Richard, Lorna, William, Sarah, and Claire, for your encouraging
words to keep me going and to Lea for giving me the power to pursue my dreams.

xi
Dedication
Dedicated to the memory of the RMS Titanic –
whose stories served as early inspiration for my fascination
with the ocean and the power it holds
1
Chapter 1 – Introduction
Coral reefs are unique ecosystems that typically occupy nutrient-poor tropical waters, but
are able to harbour high biological productivity and support high biodiversity, allowing them to
provide key services to a multitude of species that rely on them (Hoegh-Guldberg 1999; Moberg
and Folke 1999; Coker et al. 2014). Despite occupying less than 0.1% of the ocean floor, coral
reefs are home to thousands of marine creatures, harbouring at minimum one quarter of marine
species worldwide, and serving as essential habitats, migratory refuges, and feeding havens for
resident and far-ranging marine species alike (Coker et al. 2014; Fisher et al. 2015). Humans also
benefit from coral reefs, as they serve as the backbone of many tropical coastal communities,
supporting populations by providing food, income and coastal protection (Hoegh-Guldberg et al.
2017).
Coral reefs are, however, threatened by human activities, from localized impacts such as
overexploitation and pollution, to global impacts of climate change (Hughes et al. 2010; Hoegh-
Guldberg et al. 2017; Hughes et al. 2017a). Global climate change is increasing the frequency of
severe disturbances, like pulse heat stress events, which trigger mass coral bleaching, to the
extent that many reefs will not have time to recover to mature coral assemblages before the next
event occurs (Osborne et al. 2018; Hughes et al. 2018a). A lack of coral recovery may initiate
ecosystem degradation (Knowlton 2004; Hughes et al. 2007; Holbrook et al. 2016). In fact,
climate-induced impacts are degrading the health of these ecosystems such that the distribution
of reef states is moving towards increasing emergence of more ‘mediocre’ or ‘poor’ coral reefs
(Mumby 2017). The loss of healthy and functioning coral reefs will have dramatic consequences
for biological diversity (Pratchett et al. 2011; 2014), land protection (Quataert et al. 2015), and
local economies (Moberg and Folke 1999).

2
Degradation of coral communities can cascade to other components of the food web,
including reef fishes, which rely on having adequate live coral cover for food, habitat, and
protection (Coker et al. 2014; Ruppert et al. 2018). Complex coral habitats support a higher
number of fish species and groups performing distinct functions compared to low-complexity,
macroalgal habitats (Chong-Seng et al. 2012, 2014; Robinson et al. 2019b). Thus, some of the
major consequences of ecosystem disturbance and degradation for reef fish assemblages are a
loss of diversity (Cheal et al. 2010) and homogenization of assemblage structure (Richardson et
al. 2018). Of particular concern is what a decline in abundance and diversity of coral reef fishes
could mean for the eventual loss of certain ecosystem functions (Pratchett et al. 2011).
With this thesis, I attempt to enhance our understanding of the impacts of anthropogenic-
induced disturbances on the feeding responses of herbivorous coral reef fish and the implications
for ecosystem functioning. First, I explore the literature on coral reef herbivory, what is known
about its response to disturbance and how to quantify this ecological function.
1.1 Coral reef herbivory
Coral reefs generally support a diverse assemblage of fishes performing distinct
ecological functions, of which reef herbivores are one component. Herbivorous coral reef fishes
are the most abundant and widespread marine herbivores on tropical reefs, and have evolved a
diverse array of highly specialized jaw structures and unique stomach morphologies that allow
them to efficiently consume algae (Choat 1991; Bellwood 2003). Two of the main coral reef
herbivore families in the Indo-Pacific are the surgeonfish (family Acanthuridae) and the
parrotfish (family Scaridae).
Early on, when scientists began evaluating the role of herbivores on reefs, it was fairly
simple to quantify patterns of abundance and diversity, but it remained a challenge for early

3
ecologists to come up with a standard method for measuring herbivory (Steneck 1983). Now,
there is a large body of work dedicated to observing and evaluating the role of herbivores, and a
few methods are employed to quantify herbivory. Techniques employed fall under two broad
categories: experimental manipulation or observational measurements. In the former, herbivore
exclusion cages can be used to assess herbivore ability to consume algal production, by
comparing algal abundance, cover, or biomass between treatments with and without herbivores
to determine the effect that the presence (or absence) of herbivores has on algal levels (e.g.
Bellwood et al. 2006; Hughes et al. 2007; Burkepile and Hay 2008; Smith et al. 2010; Suchley
and Alvarez-Filip 2017). Another method is to conduct a macroalgal assay experiment to
determine the ability of herbivorous fish to remove algal biomass from a certain part of the reef
(e.g. Mumby et al. 2006; Hoey and Bellwood 2009; Longo et al. 2015; Plass-Johnson et al.
2015). In this case, comparing algal mass from the onset to the end of the experiment determines
how much was removed, which is assumed to be due to herbivore consumption. Observational
measurements to evaluate herbivory require records of foraging activity and involve
documenting the species, size and life phase of individual feeding fish and timing the number of
bites taken from a certain substrate. These can be conducted underwater by divers (e.g.
Bruggemann et al. 1994a; Fox and Bellwood 2007; Hoey and Bellwood 2008; Hoey et al. 2016a;
Hamilton et al. 2014; Kelly et al. 2017) or analysed from videos of feeding behaviour (e.g.
Bruggemann et al. 1994b; Fox and Bellwood 2008; Hoey and Bellwood 2009; Longo et al. 2015;
Marshell and Mumby 2015). Whether conducted in situ or from video analysis, observations of
fish foraging and bite rate data can yield realistic estimates of herbivore impact (Fox and
Bellwood 2008).

4
Some general patterns about the natural variation in herbivory have emerged from these
studies which allow us to understand important species and site-specific factors that can
influence herbivory. For example, surgeonfish (family Acanthuridae) exhibit higher grazing rates
compared to parrotfish species (family Scaridae) (e.g. Kelly et al. 2016). Coral reef herbivores
are often further divided into finer functional groups, to acknowledge that species have different
methods for exploiting algal resources and as such, perform distinct functions (Green and
Bellwood 2009; Bonaldo et al. 2014; Puk et al. 2016): (i) grazers, consume algal turfs (e.g. most
surgeonfishes: Marshell and Mumby 2015); (ii) scrapers, scrape algal material from coral
structures (e.g. the Scarus genus of parrotfish: Adam et al. 2018); (iii) excavators, take deeper
bites of coral skeletons (e.g. Chlorurus genus of parrotfish: Bellwood 1995 and Bolbometopon
muricatum: McCauley et al. 2014), and (iv) browsers, consume larger, fleshy macroalgal fronds
(e.g. Naso genus of surgeonfish: Chong-Seng et al. 2014; Streit et al. 2015, and Sparisoma and
Calotomus genus of parrotfish: Bonaldo et al. 2014). We now recognize the importance of
species identity in influencing the herbivore function, as species exhibit varied grazing rates (Fox
and Bellwood 2007; Burkepile and Hay 2010; Adam et al. 2018; Lefcheck et al. 2019).
Investigating herbivory at a species-level is critically important for gaining a more
comprehensive understanding of the unique functional roles carried out by one or a few species
(Hoey et al. 2013; Tebbett et al. 2017a). For example, studies have revealed disproportionate
importance of some species, with certain functions solely carried out by one or two key species
[e.g. browsing by a batfish species (Bellwood et al. 2006), bioeroding by humphead parrotfish
(Bellwood et al. 2003; McCauley et al. 2014)]. Body size or life phase of individual species is
also a factor that can influence herbivory. For example, smaller fish and juvenile life phases
generally have higher bite rates than larger, more mature life phases (Bruggemann et al. 1994b;

5
Bonaldo et al. 2006), which tend to exhibit greater herbivore impacts due to their larger size
(Bonaldo and Bellwood 2008; Ong and Holland 2010).
Herbivory is also related to site-specific factors and influenced by abiotic conditions.
Studies have documented variable grazing amongst habitats, with some documenting higher
grazing in more exposed, predator-dominated habitats (Hamilton et al. 2014), while others have
observed lower grazing rates in open versus sheltered lagoon habitats (Longo et al. 2015).
Generally, the habitats with higher productivity support higher grazing intensity (Marshell and
Mumby 2015; Carlson et al. 2017). Across larger spatial scales, higher grazing has been
observed in inner or mid-shelf reefs (Hoey and Bellwood 2008; Marshell and Mumby 2015)
compared to offshore areas (Cvitanovic and Bellwood 2009). Herbivory also appears to differ
between broader regions (Hoey et al. 2016a), generally declining as you move from warm
tropical regions into more southern sub-tropical areas (Longo et al. 2014); these differences are
attributed to differences in environmental factors. Finally, there is also natural variation in
herbivory according to season. Warmer summer seasons generally see an increase in the levels of
herbivory (Bellwood 1995).
Herbivorous fish can play a key role in coral reef dynamics by exerting top-down control
on algae, limiting its proliferation and allowing corals to establish or maintain their dominance
(Mumby et al. 2006; Burkepile and Hay 2008, 2010; Steneck et al. 2014; Fong et al. 2016). The
role of herbivory in influencing the competitive interaction between corals and algae, is thought
to be key to allowing reefs to recover to coral-dominated states following major disturbance
events (Hughes et al. 2007; Rasher et al. 2013; Adam et al. 2015; Holbrook et al. 2016). Their
role as top-down regulators of algae is thought to be so key that some management strategies,
including the establishment of Marine Protected Areas (MPAs), are often touted as a solution for

6
enhancing reef resilience due to the cascading benefits that herbivore protection might have on
coral recruitment (Hughes et al. 2007; Steneck et al. 2014) or adult coral colony growth (Mumby
and Harborne 2010). This reef management solution, however, is not universally accepted, as
some studies highlight that there may be no benefit of herbivore protection on coral recovery
(reviewed by Bruno et al. 2019).
In 2015–2016, a pulse heat stress event associated with an extreme El Niño triggered the
worst global coral bleaching event to date (Claar et al. 2018; Eakin et al. 2019), resulting in
severe bleaching and subsequent coral mortality in all tropical oceans (Hughes et al. 2018a). A
disturbance event such as this can result in a fundamental change in the benthic coral assemblage
(Hughes et al. 2018b), potentially allowing for opportunistic algal species to colonize and take
over, ultimately driving an ecosystem shift to algal dominance (termed a phase or regime shift).
Recent work with long-term coral reef datasets indicates that repetitive bleaching events are
driving fundamental shifts in fish communities as well, such that even if species richness returns
after a bleaching event, species compositions are not recovering to their pre-bleaching
configurations (Bellwood et al. 2012; Robinson et al. 2019b). Quantifying how disturbances alter
herbivore populations and their herbivory is therefore important for understanding how the
function they carry out for the ecosystem may in turn help drive subsequent reef recovery (Done
1992; Hughes 1994; Bellwood et al. 2004).
1.2 Herbivorous reef fish responses to disturbance
Previous studies indicate that herbivorous coral reef fish responses to disturbances can be
highly variable (Hoey et al. 2016b), with moderate to high response diversity within this
functional group compared to other reef fish functional groups (Pratchett et al. 2011; 2014). For
example, most of the early studies published following significant coral bleaching events

7
quantified changes in herbivorous fish abundance, density or biomass: some of these
documented herbivore increases (likely due to increased algae following the event), while others
found no change or even declines (see Appendix A1). The true effect of a disturbance on the fish
assemblage is highly context-dependent and can be difficult to extract since there appear to be no
consistent trends, especially for herbivorous fish, either within or between species, or even
between the same species in different regions (Pratchett et al. 2018).
In most studies, the biomass of herbivore species or functional groups has been used as a
proxy for the function of herbivory, rather than directly quantifying how disturbance influences
the herbivory function (Graham et al. 2015). While some suggest presence in a fish survey can
be a reason enough to assume occurrence of fish feeding (Streit et al. 2019), this metric
overlooks the influence that individual behaviour has in determining function. The few studies
that have quantified how herbivory responds to disturbance either (i) employed experimental
techniques to artificially enhance algal availability or manipulate benthic cover and then
measured changes in herbivore grazing, or (ii) compared grazing patterns between protected and
unprotected areas to infer how herbivory differs on reefs in different states. Some have examined
the response to disturbances other than coral bleaching, such as fishing, localized impacts or
wave exposure (Appendix A1). Direct estimates of the impacts of natural pulse disturbances, and
especially the most recent global heat stress event, on the direct, quantitative response of
herbivory are rare.
The behavioural responses of fish to disturbance events like coral bleaching are also not
frequently studied (Pratchett et al. 2018). It is only more recently that studies have begun
investigating the behavioural effect of coral bleaching on coral reef fishes (e.g. Keith et al. 2018,
who examined aggressive butterflyfish behaviour). Taking a behavioural approach can provide a

8
better understanding of how fish performance might be disrupted by climate change and whether
or not this translates to a loss of a coral reef function (e.g. herbivory). Since loss of function is a
grave consequence of disturbance that further degrades the health of the reef ecosystem, taking
such an approach might help identify mechanisms that underpin the structure and dynamics of
ecological communities in a transforming world.
1.3 Quantifying the herbivory function
One of the challenges in determining the role that herbivores can have on reef recovery is
deciding how to scale up individual herbivore behavioural feeding responses to a broader
assemblage level. Quantifying the herbivory function at a larger scale is necessary for making
any general conclusions about how it responds to significant disturbances. A recent synthesis of
herbivore browsing studies suggested that herbivore diversity rather than biomass was a better
predictor of macroalgal browsing rates (Topor et al. 2019), with potential implications for reef
studies that commonly use biomass as a proxy for function.
In light of this, other approaches are being taken to quantify how fish function varies at a
community level without solely relying on fish biomass (see Appendix A2). One method is to
take a functional diversity approach to quantify functional structure concomitantly with
taxonomic structure (i.e. species richness of an assemblage). Generally, this method involves
describing a matrix of functional traits for species of interest and then coupling it with a matrix
of species abundances to define specific functional metrics that are independent of species
richness, in order to make unbiased comparisons between communities. It uses a combination of
multivariate and linear regression analyses to test hypotheses about how these vary spatially or
temporally (Appendix A2). The main conclusions from studies implementing such an approach
are (a) that changes in taxonomic structure are generally distinct from the variation in functional

9
structure of the community, and (b) that one consequence of significant disturbance is an
apparent decline in specialized coral reef functions (Appendix A2). One issue with this approach,
however, is that it still mainly relies on the change in species abundance when discussing
functional changes in the assemblage and does not directly examine a change in behaviour.
Other approaches to quantifying changes in herbivore function do take herbivore
behaviours into account (Appendix A3). Probably the most common method of quantifying
assemblage-level herbivory is to couple behavioural observations of fish feeding, with estimates
of fish abundance (or density). The body of work that defines key functional roles of herbivores
has largely focused on a few easy-to-follow (or measure) species. For example, a lot of the early
work on herbivore functional roles references studies of the stoplight parrotfish (Sparisoma
viride), and some foundational papers that defined certain biological relationships between fish
body size and food intake for parrotfish (e.g. Bruggemann et al. 1994a,b; van Rooij et al. 1998).
This led to the inclusion of a mass-standardized estimate of feeding rates due to the influence
that fish size could have on a species’ feeding impact and by extension its function in the
community (Bellwood et al. 2006). Fish size is also important as it relates to gape size (Dunic
and Baum 2017) and thus larger fish tend to have larger bites and greater impacts on the benthic
substrate (Mumby 2006; Bonaldo and Bellwood 2008). To reflect this, some estimates of
herbivory include bite volumes taken from bite scar measurements, although most seem to be
estimates gleaned from the literature (Bellwood et al. 2003). Since some fish, like surgeonfish,
do not leave noticeable bite scars, this could preclude the inclusion of bite size in a quantification
of herbivore function for an assemblage of fish that contains herbivores besides parrotfish.
Most of the work on herbivore functional roles at larger scales agrees that herbivore
identity is key to defining ecological impacts, as different species can be dominant drivers of

10
impacts across a wide spatial scale (e.g. Ruttenberg et al. 2019). Quantifying the functional roles
of herbivores at the assemblage-level thus requires some estimate of (i) species-specific bite
rates, to indicate feeding behaviour, (ii) fish sizes, to represent per-capita impacts, and (iii)
abundance or density, to estimate the overall species impact. Rather than quantifying responses
to disturbance, most studies that have quantified fish functional roles focus on biological
comparisons amongst species, habitats, seasons, and spatial scales or quantify the drivers of
herbivory (Appendix A3). Due to a paucity of studies that examine the behavioural responses of
herbivorous fish to disturbance, and coral bleaching in particular (Pratchett et al. 2018), we have
yet to gain a comprehensive understanding of how the herbivore function is altered by significant
disturbance.
Regardless of the specific approach taken to quantifying herbivory, there is a need for a
more functional, behavioural and ‘impact-focussed’ assessment rather than a simple ‘numerical’
approach to examining the herbivore community and its change over spatial or temporal scales.
Indeed, coral reef scientists are calling for more functional approaches when examining
ecosystem impacts of disturbance (Bellwood et al. 2019b). It is this approach that I have taken to
investigate the herbivore response to disturbance on Kiritimati Island.
1.4 Thesis Research This thesis attempts to enhance our understanding of the impacts of anthropogenic-
induced disturbances on herbivory rates and their implications for ecosystem functioning.
Specifically, I examine the effects of a severe heat stress event and local human disturbance on
(1) species-specific herbivore responses and (2) assemblage-level herbivory. I utilize data that
were collected from shallow forereefs of Kiritimati (Republic of Kiribati), a coral atoll in the
central equatorial Pacific Ocean, which was devastated by the 2015–2016 El Niño that caused
11
mass coral bleaching worldwide (Claar et al. 2018). Given the intensity of the heat stress, and the
resulting decline in coral cover observed around the island, I predicted that we would detect a
behavioural response in the herbivorous reef fish community, although it would likely vary
depending on the functional group examined. I also predicted that the extent of this response
might be influenced by the intensity of local human disturbance experienced at sites around the
island.
In Chapter 2, I attempt to quantify herbivory at a species level. Using herbivore feeding
observations and benthic community composition from before (1 year prior), during, and after (1
year following) severe heat stress, I calculate three metrics to represent herbivore responses: (i)
bite rates, taken directly from observations of herbivores feeding over a timed observation
period; (ii) grazing impact, calculated from bite rates and the individual’s bite size; (iii) an index
for selectivity, as an indication of an individual’s feeding preference. Using generalized linear
modelling, I examine what effects functional group (and species), size, life phase, global heat
stress and local human disturbance have on herbivore response metrics. This chapter provides
insight about the ecologically relevant variation in herbivory and the behavioural response of this
function to local and global stressors. I show that herbivore functional groups had varied
responses, but the degree to which they varied depends on the functional group and the metric
examined. Notably, we found that high bite rates do not necessarily translate to a high grazing
impact, thus bite size somewhat modulates our understanding of herbivory. Bite rates and
grazing impacts increased during global heat stress but were unaffected by local human
disturbance. Conversely, herbivore selectivity for algal turf substrates was unaffected by global
heat stress but did vary with local human disturbance. These results provide evidence of a short-

12
term positive impact of severe heat stress on herbivory and highlight the opposing effects that
local and global stressors can exert on ecosystem functions.
In Chapter 3, I attempt to scale up our measure of grazing impact to examine the effects
of disturbance on an assemblage-level estimate of herbivory. Using bite observations and fish
survey data collected before (2 years prior) and after (1 and 2 years following) the severe heat
stress and significant coral bleaching event, I multiply average estimates of species-specific
grazing impacts on turf substrates by average site-level density to calculate a metric for average
species impact. I take a multivariate approach to observe spatial and temporal variation in
average species impacts. I also apply a generalized linear mixed model to the summed species
impacts for each functional group in order to examine the effects of functional group, global heat
stress and local human disturbance on the assemblage-level grazing impact function. I show that
the overall grazing function of herbivory is influenced by the functional group identity and
increases after a significant heat stress event but is fairly robust to human disturbance. These
findings are reassuring considering the influence that herbivores can have in driving coral reef
dynamics following severe disturbance events.
In sum, the results of this thesis enhance our understanding of the behavioural response
of coral reef herbivores to an extreme thermal stress event, within the context of local
disturbance. In the face of accelerating climate change and human intervention, it is critical that
we quantitatively examine the interacting effects that multiple stressors can have on ecosystem
functions. If coral reef management is seeking to preserve the healthy functioning of these
systems, it is critical to understand how key functional groups will respond and what capacity
they have to carry out their functions despite repetitive disturbance to the ecosystem. Our
findings add to the limited but growing, body of coral reef literature concerning the behavioural

13
response of critical functions to severe thermal stress and support the assertion that herbivores
are key players to protect in our effort to preserve the health of these increasingly threatened
ecosystems.

14
Chapter 2 – Species-specific herbivory increases with global heat stress
Will be submitted as a report to Oecologia
Jenny Smith1, Geoffrey J. Osgood1, Sean A. Dimoff1, & Julia K. Baum1
1Department of Biology, University of Victoria, PO BOX 1700 Station CSC, Victoria, BC, V8W
2Y2, Canada.
Author contributions: JS conducted the analysis, created the figures/tables and wrote the
manuscript; GJO assisted with statistical design and interpretation; SD contributed data; JKB
designed study, contributed data and editing.
15
2.1 Abstract
Anthropogenic stressors are subjecting coral reefs to increasingly severe disturbances.
Herbivores are considered essential for maintaining resilience to such disturbances due to their
role in mediating coral-algal competition. Thus, understanding how anthropogenic stressors at
local and global scales affect herbivore feeding is key to understanding the functional role of
these organisms in driving ecosystem dynamics. In this study, we investigated the feeding
response of four herbivore functional groups to disturbance on Kiritimati Island, by coupling in
situ feeding observations of surgeonfish (grazers) and parrotfish (scrapers, excavators, browsers)
with benthic surveys from shallow forereef sites along a local gradient of human disturbance.
Sampling was done at three time points (2013, 2015, 2017) over five years, spanning a
significant coral bleaching and mortality event, driven by the heat stress induced by the 2015–
2016 El Niño. We estimated bite rates (bites min-1), grazing impact (bite s-1 × gape area (mm2))
and selectivity (Manly’s α) to examine how herbivory varies across functional groups and
between species, within the context of local and global disturbance. Although grazers had the
highest bite rates, grazing impact, which accounts for bite size, was highest in scrapers; the
functionally distinct browser Calotomus carolinus had the lowest bite rates and grazing impacts.
Bite rates and grazing impacts increased significantly whilst subjected to heat stress, but neither
was influenced by local human disturbance. In contrast, selectivity was impacted by local
disturbance but not heat stress, with higher selectivity for turf at very high disturbance sites. Our
results likely reflect a short-term herbivore response to a significant heat stress event, which was
universal along a gradient of local disturbance. We highlight the importance of taking a
behavioural approach to quantifying functional responses of coral reef herbivores to disturbance.

16
2.2 Introduction Human disturbance affects coral reefs on multiple scales, from local stressors such as
overexploitation and pollution (Wilson et al. 2010b) to global stressors like climate change
(Hughes et al. 2017b). In particular, recent episodes of unprecedented ocean warming have
triggered mass coral bleaching and mortality worldwide (Hughes et al. 2017a) even at highly
isolated reefs (Hughes et al. 2018a). Such heat stress can shift coral community composition and
lead to coral reproductive failure (Hughes et al. 2018b, 2019), while the resulting loss of coral
habitat complexity leads to a reduction and homogenization of fish diversity (Cheal et al. 2010;
Chong-Seng et al. 2012; Richardson et al. 2018). Local disturbances, such as fishing pressure
more directly impact the fish community by altering size spectra (Wilson et al. 2010b) and
reducing fish biomass (Edwards et al. 2014). Reductions in herbivorous fish biomass can be
particularly concerning, as herbivores act as top-down regulators of algae competitors and can
enhance coral settlement, growth and survival (Mumby et al. 2006; Burkepile and Hay 2008,
2010). This herbivory function is thought to be key for enabling reef recovery to a coral-
dominated state following major disturbances (Hughes et al. 2007; Adam et al. 2015; Holbrook
et al. 2016).
Responses of herbivorous fishes to bleaching disturbances are, however, variable (Hoey
et al. 2016b); herbivores show moderate to high response diversity compared to other reef fish
functional groups (Pratchett et al. 2011, 2014), leading to uncertainty as to what role they play as
a group for coral reef resilience (Bruno et al. 2019). For example, some studies have documented
positive responses of herbivores following disturbance (e.g. Graham et al. 2007; Gilmour et al.
2013; Han et al. 2016), but others have observed no change (e.g. Glynn et al. 2014) or even
declines (e.g. Halford et al. 2004; Stuart-Smith et al. 2018). The different ways that herbivore

17
functional groups (commonly divided into grazers, scrapers, excavators and browsers: Green and
Bellwood 2009; Bonaldo et al. 2014) exploit their algal resources can contribute to this response
diversity. The herbivore function may also be influenced in turn by factors such as species
identity (Fox and Bellwood 2007; Burkepile and Hay 2010; Lefcheck et al. 2019), individual
behaviour (Tebbett et al. 2017a), life phase (Bruggemann et al. 1994a), and body size (Bonaldo
and Bellwood 2008; Ong and Holland 2010). For instance, larger-bodied species generally have
greater herbivore impacts (Bonaldo and Bellwood 2008; Ong and Holland 2010). Species-
specific traits can also contribute to response diversity and are therefore important considerations
for quantifying the functional roles of herbivores (Cvitanovic and Bellwood 2009; Chong-Seng
et al. 2014; Adam et al. 2018) and understanding any stabilizing effects of functional redundancy
(Mouillot et al. 2014; Mora et al. 2016), since some key functions are limited to one or a few
species (e.g. Bellwood et al. 2006; Hoey et al. 2013; Tebbett et al. 2017a).
Most studies of herbivory on reefs post-disturbance have quantified changes in
herbivorous fish abundance, density, or biomass as a proxy for herbivore function (reviewed by
Graham et al. 2015), but do not directly quantify ecosystem functions as they relate to ecological
processes or their response to changes in global ecosystems (Mouillot et al. 2013; Bellwood et al.
2019b). Using a numerical proxy to quantify herbivory could obscure the influence of behaviour
on herbivore function and the capacity of herbivores to deliver ecosystem services and drive reef
resilience. Some studies have explicitly examined herbivore foraging activity (Bruggemann et al.
1994a, 1994b) and attempted to quantify functional roles (e.g. Mumby 2006; Hoey et al. 2016a;
Suchley and Alvarez-Filip 2017), but few of these studies quantified herbivory with the objective
of investigating its response to disturbance. Instead, previous research has primarily focussed on
biological comparisons amongst species (e.g. Bellwood and Choat 1990; Choat and Clements

18
1993; Polunin et al. 1995; Alwany et al. 2009), habitats (e.g. Hoey and Bellwood 2008; Hamilton
et al. 2014; Longo et al. 2015), seasons (Bellwood 1995), or spatial scales (Carlson et al. 2017).
The few studies to quantify herbivore responses to disturbance have done so either
experimentally (e.g. Bellwood et al. 2006; Holbrook et al. 2016; Kuempel and Altieri 2017) or
by comparing sites at varied levels of degradation (e.g. Mumby 2006; Chong-Seng et al. 2014;
Ferguson et al. 2017) with fewer examining the joint effects of local and global disturbances
from temporally separated natural observations of the herbivore community.
Herbivory needs to be investigated directly, using species-specific measures like bite
rates, if we are to understand how herbivore functional groups respond to disturbances on
different scales and influence coral reef resilience (Adam et al. 2015; Plass-Johnson et al. 2015).
Measures of herbivory will also have to incorporate two critical aspects of herbivore function:
gape size and selectivity. Few studies use fish gape size directly when measuring herbivory, and
in doing so, overlook the distinction between fish taking many small bites versus few large bites,
instead opting to standardize bite rates by body mass (e.g. Bellwood et al. 2006; Hoey and
Bellwood 2009; Longo et al. 2015, but see Fox and Bellwood 2007; Kelly et al. 2017; Suchley
and Alvarez-Filip 2017). The particular substrates that are targeted also affect herbivore function
(Clements et al. 2016). Herbivores generally target turf algae (Ledlie et al. 2007; Ong and
Holland 2010; Marshell and Mumby 2015), however some parrotfish species exhibit varied diet
preferences, targeting macroalgae (Mantyka and Bellwood 2007; Hamilton et al. 2014), coral
(Burkepile et al. 2019), and microscopic organisms within these substrates (Clements et al.
2016). Thus, both individual size and selectivity can modulate the functional response to
disturbance, requiring their integration into functional measures in studies of the impact of
disturbances on herbivory.

19
Here, we aim to examine ecologically relevant variation in herbivory and understand the
influence of local and global stressors on this coral reef function. To do so, we assessed
herbivory for the major species of herbivorous fishes in each of four functional groups (grazers,
browsers, scrapers, and excavators) on Kiritimati (Republic of Kiribati; central equatorial
Pacific), at sites spanning the atoll’s gradient of local disturbance (Fig. 2.1; Walsh 2011; Watson
et al. 2016) and over the course of the 2015–2016 El Niño warming event (Claar et al. 2019).
During this El Niño, Kiritimati experienced temperature anomalies exceeding 1°C above the
island’s historical maximum monthly temperature for nine months (Claar et al. 2019). We
quantified herbivory in three ways: (i) bite rates, (ii) ‘grazing impact’ (i.e. bite rate × gape area),
to account for differences in bite size amongst individual fishes and species, and (iii) substrate
selectivity. First, we were interested in examining variation in herbivore metrics in relation to
herbivore identity and size. We hypothesized that each of these metrics would vary significantly
across herbivore functional groups and species and that we would detect an influence of
individual size: we expected that grazers, which feed primarily on turf algae, would have the
highest bite rates, but not necessarily the highest grazing impact because of their small gape
sizes; we expected large parrotfish functional groups with their larger gapes to have higher
grazing impacts. We also expected that most species would selectively feed on turf. Second, we
aimed to understand the influence of local and global stressors on species-specific herbivory. We
further hypothesized that although local and global stressors would not influence the
fundamental feeding ecology of reef herbivores (and hence bite rates or grazing impact), that
these factors might influence selectivity for different substrates, due to differences in the
availability of preferred substrates across the local disturbance gradient and over the course of
the heat stress event.
20
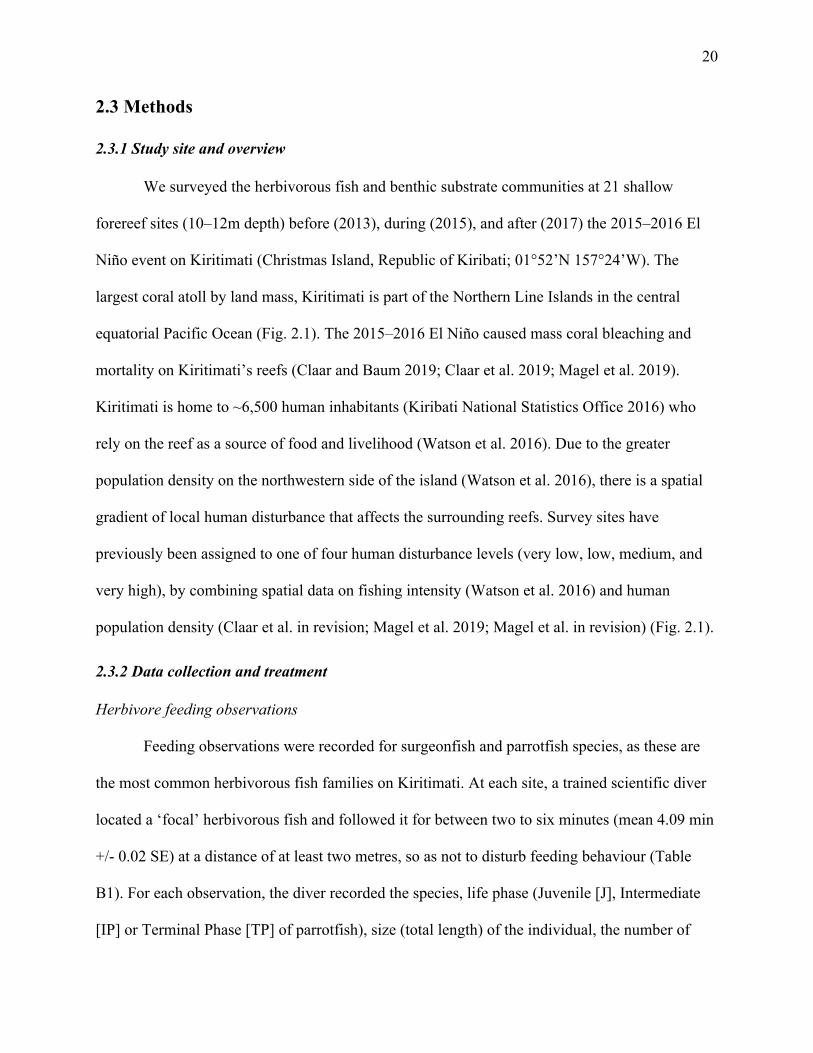
2.3 Methods 2.3.1 Study site and overview
We surveyed the herbivorous fish and benthic substrate communities at 21 shallow
forereef sites (10–12m depth) before (2013), during (2015), and after (2017) the 2015–2016 El
Niño event on Kiritimati (Christmas Island, Republic of Kiribati; 01°52’N 157°24’W). The
largest coral atoll by land mass, Kiritimati is part of the Northern Line Islands in the central
equatorial Pacific Ocean (Fig. 2.1). The 2015–2016 El Niño caused mass coral bleaching and
mortality on Kiritimati’s reefs (Claar and Baum 2019; Claar et al. 2019; Magel et al. 2019).
Kiritimati is home to ~6,500 human inhabitants (Kiribati National Statistics Office 2016) who
rely on the reef as a source of food and livelihood (Watson et al. 2016). Due to the greater
population density on the northwestern side of the island (Watson et al. 2016), there is a spatial
gradient of local human disturbance that affects the surrounding reefs. Survey sites have
previously been assigned to one of four human disturbance levels (very low, low, medium, and
very high), by combining spatial data on fishing intensity (Watson et al. 2016) and human
population density (Claar et al. in revision; Magel et al. 2019; Magel et al. in revision) (Fig. 2.1).
2.3.2 Data collection and treatment Herbivore feeding observations
Feeding observations were recorded for surgeonfish and parrotfish species, as these are
the most common herbivorous fish families on Kiritimati. At each site, a trained scientific diver
located a ‘focal’ herbivorous fish and followed it for between two to six minutes (mean 4.09 min
+/- 0.02 SE) at a distance of at least two metres, so as not to disturb feeding behaviour (Table
B1). For each observation, the diver recorded the species, life phase (Juvenile [J], Intermediate
[IP] or Terminal Phase [TP] of parrotfish), size (total length) of the individual, the number of

21
bites taken during the timed interval classified by food substrate type, and the time and length (in
seconds) of the observation. Observations were conducted during daylight hours (overall range:
07:42 – 17:43 hrs; range of 95% of observations: 07:58 – 16:45 hrs) to minimize diurnal
differences in feeding behaviour and were discontinued if the fish showed a marked response to
the diver’s presence. Food substrates were categorized as turf algae, encrusting coralline algae
(CCA), coral, or macroalgae identified to genus (i.e. Halimeda, Caulerpa, Dictyosphaeria,
Galaxaura, Lobophora and Mesopora). We summed bites across macroalgal genera into a single
‘Macroalgae’ category, because all macroalgae were eaten only infrequently. We categorized the
observed herbivore species into functional groups following Yeager et al. (2017): (i) grazers,
which consume algal turfs (e.g. surgeonfishes); (ii) scrapers, which scrape algal material from
coral structures (e.g. the Scarus genus of parrotfish); (iii) browsers, which consume larger, fleshy
macroalgal fronds (e.g. the Calotomus genus of parrotfish) and (iv) excavators, which take
deeper bites of coral skeletons (e.g. the Chlorurus genus of parrotfish).
Benthic cover
We quantified benthic community composition at each site along two 25 m transects
(separated by 10 m) that spanned the 10–12 m isobath. Between 12–15 quadrats (1 m2) were
randomly placed on either side of each transect, with their placement determined by a random
number generator, and the reef substrate within each quadrat was photographed. We later
identified the benthic substrate under 100 randomly placed points on each quadrat image using
the open source program CoralNet (coralnet.ucsd.edu). Benthic categories were defined as:
‘CCA’, ‘Coral’, ‘Substrate Consolidated Hard Rock (SCRO)’, ‘Rubble’, ‘Sand’, ‘Sediment’,
‘Macroalgae’ (summed cover of macroalgal genera: Caulerpa, Dictyosphaeria, Halimeda,
Lobophora, Peyssonnelia, and Padina) and ‘Turf’ (summed cover of what was categorized as

22
‘thin turf algae covering a hard surface’, thicker ‘algal turf mats’, and ‘cyanobacteria’). We
calculated the percent cover of each benthic category as the average of all quadrats at each site
for each year.
2.3.3 Data analysis Functional group- and species-specific bite rates and grazing impacts
We first assessed if bite rates (number of bites per individual fish) varied by herbivore
functional group, fish size, global heat stress or local human disturbance, by fitting a generalized
linear mixed model (GLMM) with a negative binomial error distribution and a ‘log’ link
function, to accommodate the overdispersion in the data, using the glmmADMB package
(Fournier et al. 2012; Skaug et al. 2016). We included functional group (grazer, scraper, browser,
excavator), heat stress period (as year; 2013 = before, 2015 = during, 2017 = after), disturbance
level (very low, low, medium, very high), body size (continuous), and time of day (continuous)
as fixed effects; species and site were random effects, and the length of the observation period
(as a logarithm) was used as an offset. Prior to analysis, we centered and standardized the
continuous input variables. Second, to examine species-specific differences, we modelled bite
rates for each functional group individually, using the same model structure and variables as for
the model above, but including species as a fixed effect for the two functional groups comprised
of multiple species (grazers = 5 species, scrapers = 6). We also included life phase (juvenile,
intermediate, terminal) as a fixed effect for the three parrotfish functional groups.
Next, we constructed a similar set of models as above, but with ‘grazing impact’ (bites
per second × gape area) as the response variable. Since grazing impact is a non-negative
continuous number, we fit models with a gamma distribution and a ‘log’ link using the lme4
package (Bates et al. 2015). Grazing impact was occasionally zero, which cannot be handled by a

23
gamma distribution; for these we added a small number to the response (0.25; approximately ½
of the smallest non-zero value). We estimated the gape area for each observed herbivore using
published regression equations relating gape size (gape width and gape height in mm) to fish
body size (Dunic and Baum 2017). Species-specific equations were available for five of our
herbivore species (Acanthurus nigricans, A. olivaceus, Chlorurus sordidus, Scarus frenatus, S.
rubroviolaceus). For the remaining species, we used the average gape size ~ body size
relationship of its congeners, except for Calotomus carolinus, for which we used the gape
regressions for S. frenatus, which were the closest available estimates (Table B2). Gape area was
estimated for each individual assuming gape area was approximately circular ($ = &'(, i.e. gape
area was the product of & × ½ gape height × ½ gape width), which introduced a quadratic
nonlinearity in the relationship between gape size and body size. We considered the same fixed
parameters in this set of models as in the bite rate models, but also included a polynomial (degree
3) term for the body size covariate to account for the nonlinearities introduced by the gape size ~
body size regressions and the log-link of the model.
Size analysis
Prior to fitting our models above, we conducted a regression analysis for the bite rate and
grazing impact responses separately with our size covariate alone to investigate its influence
(Figures B1–B2). Based on these analyses, we determined there was a significant linear
relationship between size and overall bite rate, so we included a linear term for the size covariate
in our bite rate models. A linear term for size in a gamma model of grazing impact, however, did
not predict impacts well at high sizes, because of the non-linearity introduced in the relationship
between gape size and body size, so we tried fitting a quadratic and a cubic polynomial term for
size. This is similar to what Lokrantz et al. (2008) found with their regression between body size

24
and area scraped, to which they fit a power function. From exploratory analysis of the residual
and model prediction plots, we determined a polynomial (degree 3) term for the body size
covariate was the best fit for the overall grazing impact response. To be confident about our
inclusion of the size covariate, we fit both bite rate and grazing impact models without size to
assess its influence.
Selectivity
To assess herbivore feeding preferences, we calculated an index of selectivity for each
substratum )* (turf, CCA, coral or macroalgae), similar to Hamilton et al. (2014), using Manly’s
α selectivity index, derived from Chesson (1983):
Here, for each observed individual, the index of selectivity for each substratum ()*) is
calculated as the proportion of bites on the substratum (ri) divided by the relative cover of that
substratum (ni) as measured from the benthic community survey data from the same site and year
and then scaled by the sum of this ratio for all (m=4) substrate types. We removed observations
(n=31) where zero total bites were observed, as these do not provide any selectivity information.
We modelled turf selectivity only, because this substrate accounted for the vast majority
of bites in feeding observations (97% of Acanthuridae bites and 87% of Scaridae bites). We fit
two sets of generalized linear mixed models (overall and for individual functional groups), each
with the same covariates as in the bite rate model above (excluding time of day and size).
Because the selectivity response is bounded by 0 and 1, we fit models with a beta error
distribution and a ‘logit’ link function, using the glmmTMB package (Magnusson et al. 2017),
)* = +,/.,∑ +,/.,0,12
, 4 = 1…7

25
adding or subtracting a small value (0.0000001) from the zeros and ones in the turf selectivity
values before fitting the models (Smithson and Verkuilen 2006).
For each set of models, we used likelihood ratio tests (LRT) to test hypotheses about the
influence of functional groups (and species), size (and life phase), the global heat stress event,
and the local human disturbance gradient on the variation in herbivory response metrics. If a
predictor had a significant effect, we then conducted post-hoc multiple comparisons using
pairwise Tukey tests to determine which differences between the levels of the predictor were
significant. The p-values were adjusted for multiple comparisons using the single-step method of
the glht function in the multcomp package (Hothorn et al. 2008).
All analyses were conducted using R version 3.3.3 (R Core Team 2017).
2.4 Results
In total, we observed the feeding activity of 1,984 individual herbivorous fishes from 21
different species [10 surgeonfish (family Acanthuridae) and 11 parrotfish (family Scaridae)]. We
limited analyses to the 13 most commonly observed species (n ≥ 25 observations each; n=1,942
observations total (97.8% of all observations); Tables 2.1–2.2); these species accounted for
~84% of total herbivore biomass recorded in fish census surveys across years on Kiritimati.
2.4.1 Bite rates Bite rates varied substantially, from an average high of 51.53 bites min-1 (± 4.15 SE) by
the grazer Acanthurus nigricauda to an average low of 6.70 bites min-1 (± 0.49 SE) by the
browser C. carolinus (Fig. 2.2a; Table B3). This difference was mirrored across species, with all
surgeonfishes (i.e. grazers; except for A. lineatus) having higher bite rates than parrotfishes (Fig.
2.2a; Table B3).

26
Similarly, in the overall model, bite rates were significantly higher in grazers and
significantly lower in browsers, compared to other functional groups (Fig. 2.3; LRT = 28.2, df =
3, p<0.001; Table B4). Within functional groups (Table B5), bite rates varied significantly
amongst grazer (LRT = 10.1, df = 4, p<0.05) and amongst scraper (LRT = 53.7, df = 5, p<0.001)
species. For grazers, differences were driven primarily by the low bite rates of A. lineatus
relative to the other species (Fig. 2a), although only the difference between A. lineatus and A.
nigricans was statistically significant, likely because of the low sample size of the two other
species (Table B6). Acanthurus nigricauda and A. olivaceus were found only at a few sites of
higher disturbance, and the model did not predict these species’ high bite rates well from their
lower sample size, especially once accounting for other factors. For scrapers, S. rubroviolaceus
and S. ghobban had significantly lower bite rates relative to the other species (Table B6).
Across all species, bite rates decreased significantly with body size (LRT = 53, df = 1,
p<0.001; Table B4). This result was driven by a significant decline in bite rate with body size for
scrapers (LRT = 12.7, df = 1, p<0.001), which was reflected in scraper life phase: intermediate
and terminal phase scrapers had marginally lower bite rates than juvenile scrapers, although the
overall effect of life phase on scraper bite rates was non-significant (Table B5). In contrast,
surgeonfish grazers exhibited a significant positive relationship between body size and bite rate
(LRT = 20.9, df = 1, p<0.001); body size and life phase were non-significant for excavators and
browsers (Table B5). Generally, removing size from our bite rate models did not change the
overall significance of our effects. When the size covariate was removed from functional group
models, however, phase had a significant effect for scrapers and excavators (Table B7).
Bite rates increased significantly when herbivores were subjected to heat stress (in 2015),
but declined significantly (relative to 2015), one year after heat stress had subsided (LRT = 47.2,

27
df = 2, p<0.001; Fig. 2.3; Table B4). This pattern was driven primarily by the grazers and
scrapers, both of which exhibited significantly higher bite rates under heat stress (grazers: LRT =
17.8, df = 2, p<0.001; scrapers: LRT = 19.7, df = 2, p<0.001; Fig. 2.4; Table B6). Local
disturbance had no effect on overall bite rates (Fig. 2.3; Table B4), and results for all functional
group models were non-significant (Fig. 2.4; Table B5). Models that were fit without size were
robust to these effects of disturbance on bite rates (Table B7).
2.4.2 Grazing impact
In contrast to bite rates, parrotfishes in the scraper functional group had the highest
estimated grazing impacts (Fig. 2.2b). In the overall model, however, accounting for size and
multiple comparisons, the only statistically significant difference in grazing impact across
functional groups was a lower impact of browsers (LRT = 14.8, df = 3, p<0.01; Table B8).
Grazing impact also differed significantly by species within the grazer (LRT = 14.5, df = 4,
p<0.01) and scraper (LRT = 36.2, df = 5, p<0.001) functional groups (Table B9). For grazers,
differences were driven primarily by the lower grazing impact of A. nigricans relative to the
other species (Figure 2.2b), however, by accounting for size, it offset any differences between
species such that the only difference that remained statistically significant was between A.
nigricans and A. lineatus (Table B10). For scrapers, differences were mainly driven by a lower
impact of S. psittacus and a higher impact of S. rubroviolaceus relative to the other species
(Figure 2.2b; Table B11), but when accounting for size, this reversed pairwise differences such
that S. ghobban showed a lower impact given its size and S. tricolor had a higher impact for a
given size relative to the other parrotfish species (Table B10).
Grazing impact increased significantly with body size overall (LRT = 1427.1, df = 3,
p<0.001; Table B8) and within each functional group (grazers: LRT = 357. 8, df = 3, p <0.001;

28
scrapers: LRT = 386.3, df = 3, p <0.001; browsers: LRT = 20.2, df = 3, p < 0.001; excavators:
LRT = 256.8, df = 3, p <0.001), but did not vary with life phase for the parrotfish functional
groups (Table B9). We found that life phase was a significant predictor of parrotfish grazing
impact if the size covariate was removed (Table B11).
Overall, grazing impact was significantly higher in 2015 during the global heat stress
event, but had significantly declined one year after heat stress had subsided (LRT = 33.4, df = 2,
p<0.001; Fig. 2.3; Table B8). Again, this pattern was driven primarily by the grazers and the
scrapers which both had significantly higher grazing impact in 2015 (grazers: LRT = 18.4, df =
2, p<0.001; scrapers: LRT = 12.6, df = 2, p<0.01; Fig. 2.4; Table B10). Local disturbance had no
effect on overall grazing impact (Fig. 2.3; Table B8) or that of individual functional groups (Fig.
2.4; Table B9). Grazing impact results overall, without size, were robust to these effects of
disturbance, except that differences between years were instead driven by scrapers and
excavators (Table B11).
2.4.3 Selectivity
Most species showed the highest selectivity for turf algae (Fig. 2.2c; Table B12).
However, turf selectivity still varied across functional groups (LRT = 19.1, df = 3, p<0.001),
being significantly higher for grazers (except when compared to the excavators) and significantly
lower for the browser (Fig. 2.3; Table B13). Selectivity did not vary amongst grazer species, but
did amongst scrapers (LRT = 25.5, df = 5, p<0.001; Table B14): turf selectivity was significantly
higher in S. globiceps compared to other scraper species, and that of S. rubroviolaceus was
significantly higher than S. ghobban (Table B15). Parrotfish life phase affected turf selectivity
only for excavators, with terminal phase individuals selecting for turf significantly more than
other life phases (LRT = 12.3, df = 3, p<0.05; Table B15).
29
Overall, turf selectivity was not significantly affected by heat stress (LRT = 5.08, df = 2,
p=0.079), except for in the excavators (LRT = 7.40, df = 2, p<0.05), which showed a slight
decline in turf selectivity in 2015, followed by a significant increase in 2017 after the heat stress
subsided (Table B15). Conversely, turf selectivity did vary significantly with human disturbance
(LRT = 18.0, df = 4, p<0.001), with higher selectivity exhibited at sites with very high human
disturbance and significantly lower selectivity at very low compared to low disturbance levels
(Fig. 2.5a; Table B13). The browsers (LRT = 15.7, df = 3, p<0.01), excavators (LRT = 10.9, df =
4, p<0.05), and scrapers (LRT = 19.4, df = 4, p<0.001) all responded to very high disturbance in
this way (Table B15); however the grazer species showed no significant differences across
disturbance levels (LRT = 1.59, df = 4, p = 0.662; Table B14). There were some other
differences across functional groups in their selectivity response to local disturbance. Turf
selectivity was second highest at very low disturbance for both scrapers and browsers (Figure
2.5b). In fact, turf selectivity at these sites was significantly different from low and medium sites
in scrapers and from medium sites in browsers (Table B15). In contrast, for excavators, turf
selectivity was second highest at medium disturbance (Figure 2.5b), which significantly differed
from low disturbance levels (Table B15). In general, turf selectivity was low at low disturbance
sites for all functional groups (Figure 2.5b).
2.5 Discussion
Our results revealed substantial variation in bite rates, grazing impact and selectivity, but
the degree to which these differ depends on the functional group and herbivory metric examined.
We found that grazers had the highest bite rates and the highest selectivity for turf, but not
necessarily the highest grazing impact, while our browser exhibited the slowest rates, the lowest
grazing impact, and lower selectivity for turf. Within a multi-species functional group, we also
30
detected significant differences between species, although responses were more variable between
species within the scraper functional group than between pairs of grazer species. These results
highlight the importance of species identity in quantifying herbivory (Adam et al. 2018;
Ruttenberg et al. 2019).
We were also interested in examining the influence of fish size on herbivory. In
accordance with other studies, we detected a significant relationship between bite rates and fish
size (Bruggemann et al. 1994a; van Rooij et al. 1998), but again, the influence of body size
differed depending on the functional group examined. Scrapers reduced their bite rates at larger
sizes, while grazers showed increased rates with increasing fish size, and the relationship was
unimportant for browsers and excavators. When we considered how body size relates to grazing
impact, we found a significant positive linear relationship with fish size for all functional groups.
This suggests that, despite varied influence of body size on species bite rates in different
functional groups, an individual’s grazing impact will be higher for the larger fish in all
functional groups. This corroborates other studies which report larger herbivore impacts for
larger-sized fish (Mumby 2006; Bonaldo and Bellwood 2008). Taken together, our results
suggest these herbivores do exhibit different feeding behaviours, with a significant influence of
size, and thus are likely playing different functional roles in the ecosystem.
We included ‘grazing impact’ to determine whether bite size modulates our
understanding of the herbivore response at a species-level. This is somewhat similar to efforts
carried out by others to calculate a metric for herbivore grazing pressure, although these
commonly use grazing rates standardized by body mass rather than bite size (e.g. Bellwood et al.
2006; Hoey and Bellwood 2009; Longo et al. 2015; Lefcheck et al. 2019). Grazing impact was
less variable across functional groups than bite rates, reflecting the modulating effect of gape

31
size and suggesting that bite rates do not necessarily reflect an individual’s herbivory impact.
Grazers, as hypothesized, focussed their feeding on turf substrates, and thus had the highest bite
rates; however, as they are smaller fish taking smaller bites, this did not translate to the highest
grazing impact. In fact, when we account for fish size in our model, we detected no differences
amongst grazer, scraper and excavator grazing impacts, only browsers showed significantly
lower grazing impact. This counters our predictions that the larger parrotfish functional groups
might exhibit greater impacts, as we expected that scraper impact would be significantly higher
than the grazers. Other studies incorporating size into a metric for herbivory use biomass due to
this influence of fish size on feeding rates (Bruggemann et al. 1994a,b; Hoey and Bellwood
2008; Lokrantz et al. 2008) and often find that larger-bodied fish exhibit greater impacts
(Bonaldo and Bellwood 2008). These are often comparing within a single parrotfish species (e.g.
Scarus rivulatus: Bonaldo and Bellwood 2008; Bolbometopon muricatum: McCauley et al. 2014)
or consider a few parrotfishes (e.g. Lokrantz et al. 2008; Ong and Holland 2010), Here, we
explicitly compare across functional groups (i.e. grazing surgeonfish vs. parrotfish) using
individual bite size to guide our understanding of herbivore impact. We suggest that faster rates
of small bites from grazers may be functionally similar to slower rates of larger bites from the
scrapers and excavators. Our distinction between bite rates and grazing impact caution against
using one metric alone to assess species-specific herbivory, as it may not reflect true differences
between herbivores.
Our study also contributes insight to the discussion about functional redundancy in the
herbivore community (see Burkepile and Hay 2011; Rasher et al. 2013; Streit et al. 2015; Kelly
et al. 2016; Nash et al. 2016b). When bite rates alone are considered, our herbivore functional
groups exhibit distinct differences and might be considered less redundant, but when grazing

32
impacts are also considered, our results suggest some complementarity between functional
groups. Surgeonfish grazers are thought to perform complementary functions to some parrotfish
scrapers (Marshell and Mumby 2015; Kelly et al. 2016), but it is surprising that excavators also
exhibit similar grazing impacts. When selectivity is also considered, however, the excavator
functional group did exhibit varied responses, and thus is distinguished from the other functional
groups. Notably, our browser (Calotomus carolinus) showed significantly distinct bite rates,
grazing impact and selectivity compared to the other herbivore functional groups. In fact, C.
carolinus was the only species that was frequently observed taking bites out of macroalgal
fronds, suggesting there may be limited redundancy on Kiritimati’s reefs with respect to the
browsing function. This runs counter to previous reports of functional overlap between some
herbivore species (Rasher et al. 2013; Brandl and Bellwood 2014); however, it corroborates a
study of Hawaiian herbivores which found that browsers separated more distinctly from other
functional groups when selectivity was taken into account (Kelly et al. 2016). There could be
important ramifications for Kiritimati’s reefs if this species is lost, as there would be few
replacements to carry out the important macroalgal browsing function. That being said, we also
found that C. carolinus’ herbivore responses were relatively unaffected by either local human
disturbance or severe thermal stress, suggesting that this function may be robust to both local and
global disturbances.
Grazing impact and bite rates increased during the heat stress, contrary to our predictions
that reef fish would not alter their feeding behaviours in response to such a stressor. The
response was functional-group-specific, driven by significant changes in scraper and grazer
functional groups. We detected no change in selectivity over time, which suggests that the
response was not likely due to a change in what substrates the herbivores were feeding on. A

33
number of studies investigating fish responses to heat stress and coral bleaching disturbance have
documented how herbivores respond numerically, with most detecting an increase in herbivore
density or biomass (Garpe et al. 2006; Adam et al. 2011; Gilmour et al. 2013), and some noting a
greater effect of coral bleaching on smaller bodied individuals (Graham et al. 2007; Ledlie et al.
2007; Nash et al. 2016b). Studies that consider how herbivory rates are affected by disturbance
generally consider sites at the same time points with differing benthic composition, or
experimentally manipulate algal levels to compare how herbivory rates vary with altered
substrate availability. Grazing rates did not differ between experimental treatments in one study
(Williams et al. 2001), but most find that different compositions of fish are feeding in areas with
different benthic composition (Bellwood et al. 2003; Bellwood et al. 2006; Chong-Seng et al.
2012; Plass-Johnson et al. 2015). We know generally that herbivore rates are determined by
species identity (e.g. Adam et al. 2018), can vary over the course of the day (Bruggemann et al.
1994a; Polunin et al. 1995; Afeworki et al. 2013), and are influenced by fish size (Bonaldo et al.
2006; Lokrantz et al. 2008; Afeworki et al. 2013), but few explicitly consider a large-scale heat
stress disturbance event as a driver of herbivory rates. Recently, a study of fish behaviour
reported no change in overall bite rates following the 2015–2016 El Niño, which counters what
we found here, although that study documented butterflyfish behaviour and not herbivorous fish
(Keith et al. 2018). Since few studies directly quantifying herbivory have explicitly considered
temporal variation (but see Lefèvre and Bellwood 2011), our results present a unique perspective
on the response of herbivory to an extreme heat stress event. Given that we detected a reduction
in bite rates and grazing impact once heat stress had subsided, it suggests that the response is
short-lived, and may not necessarily reflect a sustained alteration of herbivore feeding behaviour.
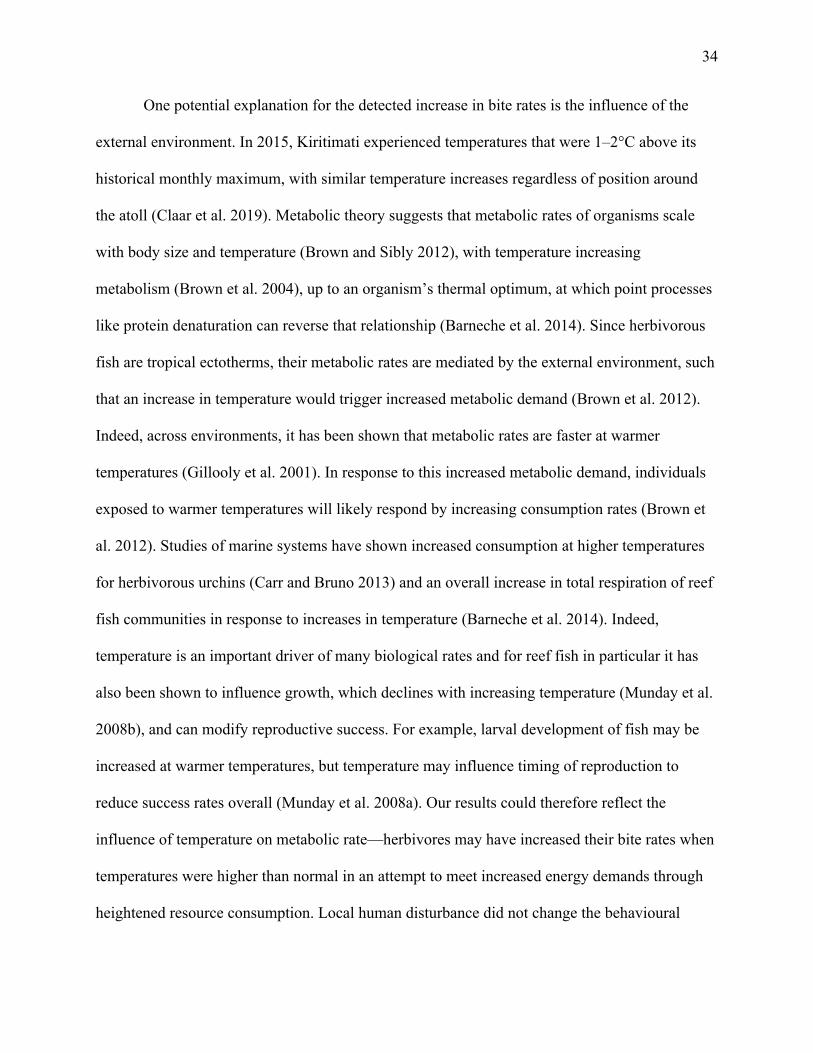
34
One potential explanation for the detected increase in bite rates is the influence of the
external environment. In 2015, Kiritimati experienced temperatures that were 1–2°C above its
historical monthly maximum, with similar temperature increases regardless of position around
the atoll (Claar et al. 2019). Metabolic theory suggests that metabolic rates of organisms scale
with body size and temperature (Brown and Sibly 2012), with temperature increasing
metabolism (Brown et al. 2004), up to an organism’s thermal optimum, at which point processes
like protein denaturation can reverse that relationship (Barneche et al. 2014). Since herbivorous
fish are tropical ectotherms, their metabolic rates are mediated by the external environment, such
that an increase in temperature would trigger increased metabolic demand (Brown et al. 2012).
Indeed, across environments, it has been shown that metabolic rates are faster at warmer
temperatures (Gillooly et al. 2001). In response to this increased metabolic demand, individuals
exposed to warmer temperatures will likely respond by increasing consumption rates (Brown et
al. 2012). Studies of marine systems have shown increased consumption at higher temperatures
for herbivorous urchins (Carr and Bruno 2013) and an overall increase in total respiration of reef
fish communities in response to increases in temperature (Barneche et al. 2014). Indeed,
temperature is an important driver of many biological rates and for reef fish in particular it has
also been shown to influence growth, which declines with increasing temperature (Munday et al.
2008b), and can modify reproductive success. For example, larval development of fish may be
increased at warmer temperatures, but temperature may influence timing of reproduction to
reduce success rates overall (Munday et al. 2008a). Our results could therefore reflect the
influence of temperature on metabolic rate—herbivores may have increased their bite rates when
temperatures were higher than normal in an attempt to meet increased energy demands through
heightened resource consumption. Local human disturbance did not change the behavioural

35
ecology of their feeding as temperature increases were similar across sites at all disturbance
levels. This aligns with the results of other studies suggesting that temperature increases the
grazing rates of certain species (Floeter et al. 2005; Smith 2008; Afeworki et al. 2013), and that
some herbivores have higher feeding rates during the warmer summer months (Bellwood 1995;
Lefèvre and Bellwood 2011). We did not find increased feeding rates during heat stress for all
functional groups (e.g. browsers and excavators exhibited no change); however, the positive
relationship between feeding and temperatures may not necessarily be universal among
herbivores. For example, some Hawaiian parrotfish that experience seasonal temperature
fluctuations of 2°C exhibit no change in feeding activity, or even show an increase during the
cooler months (Ong and Holland 2010). Indeed there is evidence for species and even individual
variation in responses to temperatures (Afeworki et al. 2013; Bruno et al. 2015). Our results
highlight species variability in feeding responses to global heat stress, and caution against
lumping herbivores into a single group when attempting to disentangle impacts of anthropogenic
disturbance on the fish community.
The increased bite rates and grazing impact observed here suggest a behavioural response
of the herbivorous fish on Kiritimati to El Niño-induced heat stress, which may have important
implications for algal control following coral bleaching events. Many studies have documented
changes in herbivore biomass following coral bleaching, with a general consensus that bleaching
can positively affect herbivore abundance, and—by extension—the function of herbivory (e.g.
reviews by Pratchett et al. 2008, 2011, 2014; Graham et al. 2015; Hoey et al. 2016b). As far as
we are aware, our study is one of the first to document a direct positive response of species
herbivory to a severe disturbance event. As of yet, we have not documented a clearly defined
phase shift (as per Done 1992; Knowlton 2004) to algal dominance on Kiritimati, such that the
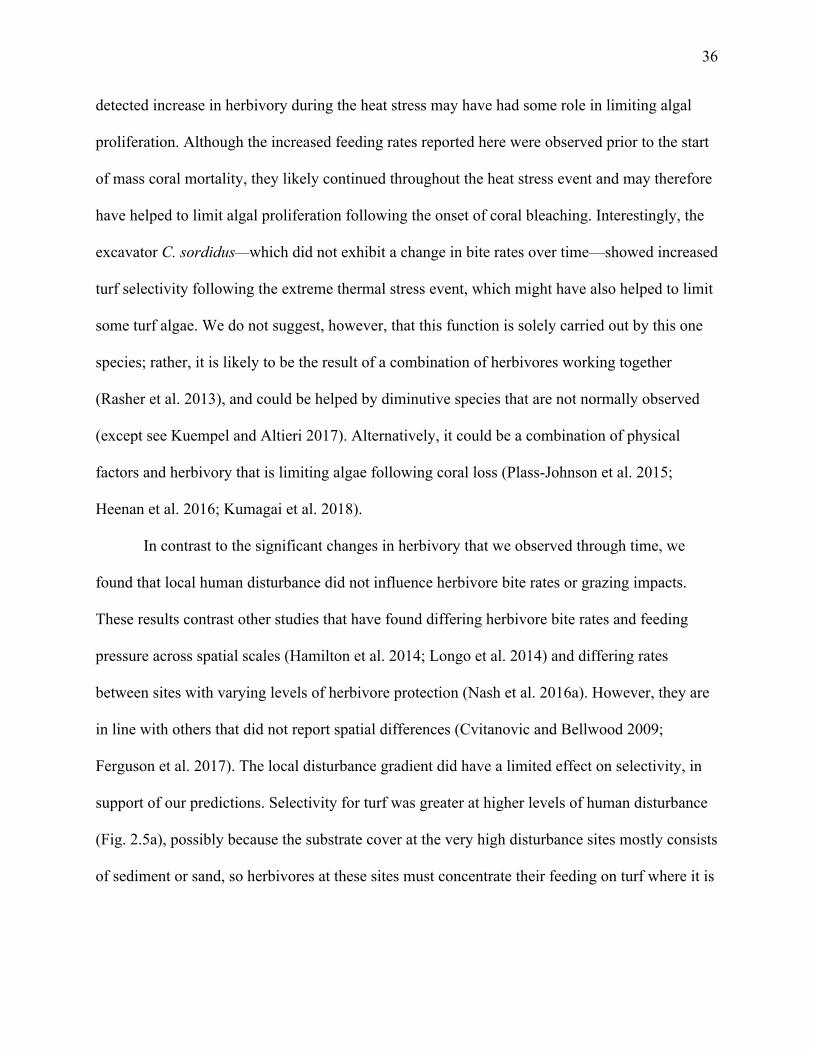
36
detected increase in herbivory during the heat stress may have had some role in limiting algal
proliferation. Although the increased feeding rates reported here were observed prior to the start
of mass coral mortality, they likely continued throughout the heat stress event and may therefore
have helped to limit algal proliferation following the onset of coral bleaching. Interestingly, the
excavator C. sordidus—which did not exhibit a change in bite rates over time—showed increased
turf selectivity following the extreme thermal stress event, which might have also helped to limit
some turf algae. We do not suggest, however, that this function is solely carried out by this one
species; rather, it is likely to be the result of a combination of herbivores working together
(Rasher et al. 2013), and could be helped by diminutive species that are not normally observed
(except see Kuempel and Altieri 2017). Alternatively, it could be a combination of physical
factors and herbivory that is limiting algae following coral loss (Plass-Johnson et al. 2015;
Heenan et al. 2016; Kumagai et al. 2018).
In contrast to the significant changes in herbivory that we observed through time, we
found that local human disturbance did not influence herbivore bite rates or grazing impacts.
These results contrast other studies that have found differing herbivore bite rates and feeding
pressure across spatial scales (Hamilton et al. 2014; Longo et al. 2014) and differing rates
between sites with varying levels of herbivore protection (Nash et al. 2016a). However, they are
in line with others that did not report spatial differences (Cvitanovic and Bellwood 2009;
Ferguson et al. 2017). The local disturbance gradient did have a limited effect on selectivity, in
support of our predictions. Selectivity for turf was greater at higher levels of human disturbance
(Fig. 2.5a), possibly because the substrate cover at the very high disturbance sites mostly consists
of sediment or sand, so herbivores at these sites must concentrate their feeding on turf where it is

37
available. Thus, while the rate of herbivory appears to remain constant across the gradient, we
did detect some effect of local human disturbance on herbivore selectivity.
The fact that herbivore bite rates and grazing impact were affected by the heat stress
event but were not significantly influenced by levels of local human disturbance suggests that
these stressors are not impacting herbivores in the same way. The differential effect of these
stressors is encouraging, as it could help to maintain the resilience of this ecosystem in the face
of extreme climate-induced disturbance despite the co-occurring chronic local disturbance (Mora
et al. 2016). However, this ability hinges on the health of the herbivore community, in terms of
having both an abundant and diverse group of herbivores. Although herbivorous fish are not the
main fisheries target on Kiritimati, they are still caught for consumption. If a combination of
herbivore overfishing and increasing stress from climate change work together to harm this
community in the future, we might see a loss of resilience and a phase shift to algal dominance if
the reduced number of herbivore consumers are no longer able to control algal abundance
(Mumby et al. 2006; Holbrook et al. 2016). We also found that herbivorous parrotfish species
were more variable in their herbivory responses compared to surgeonfish species. The varied
responses between herbivores in terms of bite rates, grazing impacts and selectivity highlight the
importance of maintaining a diverse herbivore community; this is also an important
consideration for management strategies that seek to protect herbivores and, ultimately, drive
coral reef recovery (Mumby 2017).
Our functional group models for excavators and browsers are somewhat limited by only
having one species representative, however since we were also interested in characterizing
species-specific herbivory, we thought it fair to include them. Since the species in each of these
models are the most abundantly observed for these functional groups, they were the best
38
candidates to represent the group. An increased number of herbivore observations for other
species belonging to these functional groups (e.g. Chlorurus sp. for excavators and Naso sp. for
browsers) would increase the generality of the model results to apply to the rest of the functional
group. This might be especially true for the browsers, for which we observed distinct responses,
in order to identify whether the results observed represent a unique herbivory response of C.
carolinus or whether they also apply to other browsers more generally.
With this study, we have taken the first step to quantifying herbivory at a species-level
for four key herbivore functional groups on Kiritimati and we examine the influence of herbivore
identity, size, and local and global stressors on the herbivore function. We have not yet attempted
to scale herbivory estimates in order to make spatial or temporal comparisons at the community
level, however we expect that herbivory might differ across a spatial gradient and over time if
site-level density is also taken into account (Ruttenberg et al. 2019). Taken together, our results
support the body of work on coral reef fish that indicate it is not advisable to consider herbivores
as one functional entity, but rather as a guild made up of distinct species performing many
functional roles (Adam et al. 2018). We maintain that our understanding of herbivory is context-
dependent and size- and species-specific quantification is necessary, especially when quantifying
functional roles to inform management strategies that seek to enhance reef resilience.

39 Table 2.1 Number of feeding observations for each herbivore species in each year, classified by family
(Acanthuridae = surgeonfishes; Scaridae = parrotfishes) and functional group (FG). Bolded species are the 13
most commonly observed (n≥ 25 feeding observations) which were retained in the functional group analysis.
Within each functional group, species are listed in descending order by their total number of observations.
FG Family Species 2013 2015 2017 Total Browser Scaridae Calotomus carolinus 15 1 70 86
Excavator Scaridae Chlorurus sordidus 211 75 144 430 C. microrhinos 0 0 1 1
Grazer Acanthuridae
Acanthurus nigricans 173 158 126 457 A. olivaceus 5 32 15 52 A. lineatus 19 8 10 37 A. nigricauda 5 31 1 37 A. achilles 23 3 5 31 A. triostegus 8 10 0 18 A. nigrofuscus 4 1 0 5 A. leucocheilus 1 0 1 2 A. nigroris 1 0 0 1 A. xanthopterus 0 1 0 1
Scraper Scaridae
Scarus frenatus 161 40 117 318 S. rubroviolaceus 66 30 124 220 S. tricolor 68 10 40 118 S. ghobban 34 20 33 87 S. psittacus 11 6 27 44 S. globiceps 10 11 4 25 S. oviceps 1 0 12 13 S. forsteni 1 0 0 1
Total 817 437 730 1984

40 Table 2.2 Feeding observations for the 13 most commonly observed herbivore species (n≥25 observations)
included in our functional group (FG) analysis at each disturbance level over three survey years. Within each
functional group, species are listed in descending order by their total number of observations. FG Family Species Year Very Low Low Medium Very high Total
Browser Scaridae Calotomus carolinus 2013 1 2 9 3 15 2015 0 0 1 0 1 2017 10 4 45 11 70
Excavator Scaridae Chlorurus sordidus 2013 44 68 83 16 211 2015 13 10 46 6 75 2017 59 26 56 3 144
Grazer Acanthuridae
Acanthurus nigricans 2013 6 45 110 12 173 2015 36 15 73 34 158 2017 40 23 53 10 126
A. olivaceus 2013 0 0 2 3 5 2015 0 0 0 32 32 2017 0 0 0 15 15
A. lineatus 2013 10 6 3 0 19 2015 0 4 4 0 8 2017 0 10 0 0 10
A. nigricauda 2013 0 0 4 1 5 2015 0 0 3 28 31 2017 0 0 1 0 1
A. achilles 2013 1 0 11 11 23 2015 0 1 2 0 3 2017 0 0 5 0 5
Scraper Scaridae
Scarus frenatus 2013 22 38 93 8 161 2015 9 2 29 0 40 2017 36 23 58 0 117
S. rubroviolaceus 2013 5 12 30 19 66 2015 1 1 17 11 30 2017 28 29 49 18 124
S. tricolor 2013 4 17 19 28 68 2015 0 0 0 10 10 2017 7 11 7 15 40
S. psittacus 2013 1 0 4 6 11 2015 0 0 0 6 6 2017 2 0 10 15 27
S. ghobban 2013 0 2 19 13 34 2015 0 0 3 17 20 2017 3 0 10 20 33
S. globiceps 2013 5 4 1 0 10 2015 5 0 1 5 11 2017 3 1 0 0 4
Total 351 354 861 376 1942

41
Figure 2.1 Map of twenty-one forereef study sites and villages on Kiritimati (Christmas Island),
Republic of Kiribati. Sites are coloured based on levels of local human disturbance, and villages
(red circles) are scaled to the human population. Inset indicates the island’s location (triangle) in
the equatorial Pacific Ocean.

42
Figure 2.2 Herbivory: (a) bite rate (±SE); (b) grazing impact (±SE) (bite rate × gape area); (c)
selectivity, derived from in situ feeding observations of herbivorous (surgeonfish and parrotfish)
reef fishes, averaged over three years (2013, 2015, 2017) for the 13 most commonly observed
species on Kiritimati. Species are ordered from highest to lowest bite rate, with the species’ text
colour denoting functional group, following colour coding in panel (b). CCA= crustose coralline
algae.

43
Figure 2.3 Effect size estimates and 95% confidence intervals for predictor coefficients: Local
Disturbance (Very high, Medium, Low relative to Very low); Year (2017, 2015 relative to 2013);
Functional Group (Scraper, Excavator, Browser relative to Grazer) from generalized linear
mixed models of overall herbivore: ( ) bite rates, ( ) grazing impact and ( ) selectivity
responses.

44
Figure 2.4 Herbivorous fish functional group mean and 95% confidence intervals of (a, b) bite
rates and (c, d) grazing impacts to (a, c) heat stress and (b, d) local human disturbance.

45
Figure 2.5 Mean and 95% confidence intervals of estimated herbivore selectivity for turf
substrates: (a) averaged across all observed species for each disturbance level; (b) by functional
group for each disturbance level.

46
Chapter 3 – Herbivore assemblage grazing impact is robust to a significant coral bleaching event 3.1 Abstract The prevalence of marine heatwaves and their implications for ecosystem functioning has
renewed interest in understanding the response of ecological functions to global ecosystem
disturbance. The 2015–2016 El Niño elevated ocean temperatures over a prolonged period
causing mass coral bleaching worldwide. Here, we aimed to assess the ecosystem role of
herbivorous coral reef fishes [surgeonfish (family Acanthuridae) and parrotfish (family
Scaridae)] in terms of turf algae removal, to understand how the grazing function of this
assemblage is affected by chronic local disturbance and a global pulse heat stress event. To
determine grazing function, we quantified a metric for average species impact, measured in bites
per year, by integrating species’ and size-specific estimates of herbivore grazing, derived from
fish bite rate observations, with underwater visual census (UVC) data of species’ abundances at
sites spanning a gradient of chronic local disturbance (from very low to very high) on Kiritimati
(Christmas Island; central equatorial Pacific). Both data types were recorded prior to (2013) and
after (2017 and 2018) the El Niño heat stress event. Multivariate redundancy analysis,
constrained by the levels of local disturbance and a factor for ‘Before’ or ‘After’ the El Niño,
showed that herbivore species exerted similar impacts at sites around the island, despite being
subject to varying levels of local disturbance. Species’ impacts at sites exposed to very high
human disturbance, however, were more distinct and driven by few species. Further, we summed
average species’ impacts at each site by functional group and utilized generalized linear
modelling to determine the influence of herbivore identity, local disturbance and global heat
stress on assemblage-level grazing impact. Herbivore assemblage grazing impact was distinct
among the different functional groups and increased after the El Niño, implying that the grazing

47
function of the assemblage was not compromised by a global heat stress event. Our results
suggest that the ecosystem role of herbivorous fish, in terms of their grazing function, is fairly
robust to disturbance, which is an encouraging prospect for future recovery given anticipated
increase in anthropogenic disturbance to coral reef ecosystems.
3.2 Introduction
Marine heatwaves and severe disturbance events are becoming more prevalent, with
significant consequences for ecological structure and functioning of marine ecosystems (Smale
et al. 2019). Given worldwide decline in coral reef cover (Bruno and Selig 2007), shifts in coral
reef assemblages (Hughes et al. 2018b), and the increasing occurrence of severe coral bleaching
events (Hughes et al. 2018a), there is continued interest in understanding the response of these
ecosystems to large-scale disturbance. There is also growing recognition that we need to better
understand the response of certain ecological functions to ecosystem disturbance and how it
might modulate the capacity of certain organisms to deliver ecosystem services (Bellwood et al.
2019b). This becomes especially pertinent if the ultimate goal is management of reef functions
for conferring resilience to devastating disturbance events (Bellwood et al. 2004; Bellwood et al.
2019a; Williams et al. 2019).
The management of coral reef herbivores is one approach proposed for conferring reef
resilience and recovery from severe disturbance events. This is often achieved through the
establishment of Marine Protected Areas (MPAs) and designating areas as off-limits to fishing or
extraction (e.g. Edgar et al. 2014). The idea behind establishing MPAs for achieving reef
resilience (a.k.a the ‘managed resilience hypothesis’) is that it acts through a cascading pathway
from grazing herbivores to the benthic coral community (e.g. see Bruno et al. 2019). In essence,
the absence of fishing benefits the large herbivorous fish, which can then consume the algae, to

48
open up space and facilitate new coral recruitment, eventually enabling re-establishment and
growth of adult coral colonies. Some go further to suggest the restocking of herbivore
populations as a mechanism of algal control (Abelson et al. 2016). While some studies have
demonstrated the benefit of herbivores on coral recruitment and cover (Mumby et al. 2006;
Steneck et al. 2014; Suchley and Alvarez-Filip 2017; Steneck et al. 2018), others believe that
establishing MPAs does not necessarily result in improved coral resilience or protection of the
ecosystem against environmental stressors (Hilborn 2015; Bruno et al. 2019). Regardless, these
management approaches indicate the influence of herbivores for driving coral reef ecosystem
dynamics.
In order to understand the role herbivores play in mediating reef dynamics, it is necessary
to quantify their functional impact, and a lot of effort has gone into understanding ecosystem
functions of herbivorous fish (reviewed by Bonaldo et al. 2014; Puk et al. 2016). In this chapter,
we define ‘herbivore function’ in terms of their feeding impact, and we consider the overall
impact of a species to be the result of its per-capita effects as well as its density in the
community.
Three main feeding functions attributed to parrotfish herbivores are scraping (i.e.
removing algal turfs from hard substrates), browsing (i.e. targeting larger, fleshy macroalgal
fronds) and excavating (i.e. taking deeper bites of coral substrates, encompassing another key
parrotfish function of bioerosion) (Green and Bellwood 2009). These functional roles are
distributed between genera within the parrotfish family, for example, Scarus species function as
scrapers (Adam et al. 2018), while browsing is mainly carried out by Sparisoma species in the
Caribbean and Calotomus species in the Indo-Pacific (Bonaldo et al. 2014). Larger species in the
Chlorurus genus function as excavators (e.g. Bellwood 1995), but some of the larger species in

49
other genera (e.g. Sparisoma viride) are also attributed with this function (Bruggemann et al.
1994a, 1994b). One species, the humphead parrotfish (Bolbometopon muricatum), is a
particularly large and influential excavator when present in some locations, but can be largely
absent from others due to overfishing (Bellwood et al. 2003). Herbivorous surgeonfish (family
Acanthuridae) are considered complementary to parrotfish in reef ecosystems because they also
carry out important grazing functions (i.e. removing algal turfs: Marshell and Mumby 2015).
One challenge in determining the role of herbivores as drivers of reef resilience is how to
scale individual herbivore feeding responses to an assemblage-level estimate of ecosystem
function. Such a step is necessary to make conclusions about how their capacity to deliver the
ecosystem service of algal control may be altered by significant disturbances. Biomass of
functional groups is often used as a proxy for function when investigating fish assemblage
response to disturbance (e.g. reviewed by Pratchett et al. 2014; Graham et al. 2015). This allows
the use of fish survey data to determine how fish abundance changes with a significant
disturbance event and is usually based on the assumption that presence in surveys equates to
function. This has been found to be a fair assumption in some cases of remote fish surveys which
indicated that herbivore presence in a video was usually associated with an observation of the
fish feeding (Fox and Bellwood 2008; Streit et al. 2019). However, some caution using biomass
alone to quantify ecosystem processes as species that are responsible for a particular ecosystem
function may be missed by conventional survey methods (Ford et al. 2016). As an example,
some species not usually counted by fish surveys, have been captured on video as the sole
species carrying out a particular function in certain reef habitats (e.g. rabbitfishes in Fox and
Bellwood 2008; Ford et al. 2016; Naso sp in Plass-Johnson et al. 2015).

50
In light of this, approaches to quantify ecological functioning in response to disturbances
do not typically rely solely on changes in fish biomass. One such method is to take a ‘functional
diversity’ approach to examine changes in functional assemblage structure concurrent with
changes in taxonomic structure (e.g. Villéger et al. 2008; Villéger et al. 2010; Mouillot et al.
2013; Mouillot et al. 2014; Boersma et al. 2016; Bierwagen et al. 2018). Results of this approach
indicate that change in taxonomic structure is distinct from the variation in functional structure of
the assemblage and suggest there are diverse responses by fish functional groups to significant
disturbance events (Bierwagen et al. 2018; Richardson et al. 2018; Stuart-Smith et al. 2018;
McClure et al. 2019). In particular, coral bleaching disturbances will impact fish assemblages by
driving a loss of species that carry out specialized functions as the assemblage shifts to be
dominated by more generalist species (Richardson et al. 2018; Stuart-Smith et al. 2018; McClure
et al. 2019). The consequent loss of certain functions can further degrade the overall health of the
ecosystem (Pratchett et al. 2011). Importantly, functional diversity studies indicate that even
highly diverse systems, which seem to exhibit high redundancy for some ecological functions,
are still vulnerable to species loss and loss of function (Mouillot et al. 2014). One issue with the
functional diversity approach, however, is that it still mainly relies on the change in relative
species abundance when discussing changes in functional structure and does not directly
examine responses in behaviour.
Other approaches to quantify herbivore function do account for feeding behaviours, the
most common is to take a direct approach by observing individual foraging behaviour and then
multiplying it by species’ densities from fish surveys (e.g. Fox and Bellwood 2007; Hoey et al.
2016; Ruttenberg et al. 2019; Robinson et al. 2019a). The body of work that defines key
functional roles of herbivores has largely focused on a few key species. A lot of the early work

51
on herbivore functional roles references studies of the stoplight parrotfish, Sparisoma viride, and
some foundational papers that defined certain biological relationships between fish body size and
food intake (Bruggemann et al. 1994a, 1994b; van Rooij et al. 1998). For example, when
defining the functional role of the herbivore guild, some use the estimates of one species and
scale up to a guild-wide estimate assuming the relationships are conserved phylogenetically (e.g.
Paddack et al. 2006). But, studies have also shown that the ecological impact of herbivores is
significantly different between species and even between fish of different sizes or life phases
(Mumby 2006; Fox and Bellwood 2007; Bonaldo and Bellwood 2008). Most agree that
herbivore identity is key in defining ecological impacts, as different species can be dominant
drivers of impacts in different reef habitats (Ruttenberg et al. 2019). Fish size is also important as
it relates to gape size (Dunic and Baum 2017) and thus larger fish tend to have larger bites and
greater impacts on the benthic substrate (Mumby 2006). Some studies take size into account by
standardizing bite rates by fish biomass (e.g. Bellwood et al. 2006) and others include bite
volumes taken from bite scar measurements, usually gleaned from the literature (Bellwood et al.
2003). Since some fish, like surgeonfish, do not leave noticeable bite scars, this could preclude
the inclusion of bite size in a quantification of herbivore impact. But there is still a case for
taking a species and size-specific approach when calculating an estimate of ecosystem function
for the herbivore assemblage.
Quantifying the functional roles of herbivores at an assemblage-level thus requires some
estimate of (i) species-specific bite rates, to indicate feeding behaviour, (ii) gape sizes, to
represent size-specific per-capita impacts, and (iii) abundance or density, to estimate overall
species impact. Rather than quantifying responses to disturbance, most studies that have
quantified fish functional roles using this approach focussed on biological comparisons amongst

52
species (e.g. Bellwood and Choat 1990; Choat and Clements 1993; Polunin et al. 1995; Alwany
et al. 2009; Hoey and Bellwood 2009; Ong and Holland 2010; Streit et al. 2015; Tebbett et al.
2017a; Adam et al. 2018), or habitats (Fox and Bellwood 2007; Hoey and Bellwood 2008,
Cvitanovic and Bellwood 2009; Rasher et al. 2013; Hamilton et al. 2014; Longo et al. 2015;
Marshell and Mumby 2015; Ferguson et al. 2017; Kelly et al. 2017). From these studies, we have
come to understand that different functional groups, species within a functional group, and even
individuals of different sizes within species exhibit varied feeding behaviours, with different
consequences for the functional roles they carry out. The composition of species at particular
sites across a spatial gradient can also determine ecosystem function in a given habitat, as some
have shown certain functions such as bioerosion or macroalgal browsing to be carried out by one
species alone (e.g. Alwany et al. 2009; Hoey et al. 2009; Lefèvre and Bellwood 2011). Others
consider the drivers of assemblage-level herbivory, indicating the influence of biomass and
species diversity on herbivore assemblage function, but also highlighting the role that benthic
processes such as turf height or substrate availability can have on the grazing function (Lefcheck
et al. 2019; Robinson et al. 2019a). Due to a paucity of studies that examine the behavioural
responses of herbivorous fish to ecosystem-wide disturbance (Pratchett et al. 2018), we have yet
to gain a comprehensive understanding of how key herbivore feeding functions are altered over
time by significant disturbance events, especially events of extreme thermal stress which are now
a predominant threat to coral reef ecosystem health.
In this study, we examine the ecosystem function of herbivores within the context of
local and global (i.e. heat stress) disturbance. We integrate visual census surveys of coral reef
fish assemblages of Kiritimati (Christmas Island, Republic of Kiribati; 01°52’N 157°24’W) with
size- and species-specific estimates of grazing impact to quantify the per-capita impacts of

53
surgeonfish and parrotfish herbivores in terms of their turf removal function (hereby referred to
as ‘average species impact’). We use these per-capita impacts to examine spatiotemporal
variation in herbivore function across a gradient of local human disturbance and over time.
Further, we use our quantification of the per-capita grazing impact function (i.e. average species
impact) to examine how the summed impacts of the herbivore assemblage varies i) across
functional groups, ii) along a local gradient of human disturbance and iii) between years that
span a significant coral bleaching and mortality event, driven by the 2015–2016 El Niño thermal
stress event. We hypothesize that we will detect spatiotemporal variation in per-capita grazing
impacts as a result of species occupying different densities in different sites across a spatial
gradient. Further, we hypothesize the summed impacts to be significantly variable between
functional groups, due to differences in per-capita species impacts combined with varied
densities. Finally, we expect the overall herbivore assemblage function will be influenced by
anthropogenic disturbances.
3.3 Methods 3.3.1 Study site
We surveyed the herbivorous fish assemblage [surgeonfish (family Acanthuridae) and
parrotfish (family Scaridae)] of Kiritimati (Christmas Island, Republic of Kiribati; 01°52’N
157°24’W) at 23 shallow forereef sites (10–12 m depth) over a six year period that included time
points before (2013) and after (2017 and 2018) the 2015–2016 El Niño global heat stress event
that caused mass coral mortality. Kiritimati is the world’s largest coral atoll by land mass,
located within the Pacific Ocean’s Northern Line Islands. The island’s 6,500 inhabitants (Kiribati
National Statistics Office 2016) aggregate on its northwestern side creating a spatial gradient of
local human disturbance on the surrounding reefs. Survey sites have been assigned to one of five

54
human disturbance levels (very low, low, medium, high, very high), by combining spatial data
on fishing intensity (Watson et al. 2016) and human population density (Claar et al. in revision;
Magel et al. 2019; Magel et al. in revision) (Fig. 3.1).
3.3.2 Data collection Herbivore behavioural observations
Feeding observations were recorded for surgeonfish and parrotfish species as these are
the most common herbivorous fish families on Kiritimati. At each site, a trained scientific diver
located a ‘focal’ herbivorous fish and followed it at a distance of at least two metres so as not to
disturb feeding behaviour. Divers recorded the species, life phase (Juvenile [J], Intermediate [IP]
or Terminal Phase [TP] of parrotfish), size estimate (total length), and the number of bites taken
out of each major food substrate type over a timed interval that ranged from two to six minutes
(mean 4.03 min ± 0.02 SE). Observations were discontinued if the fish showed a marked
response to the diver’s presence. Food substrates were categorized as turf algae, encrusting
coralline algae (CCA), coral, or macroalgae identified to genus (i.e. Halimeda, Caulerpa,
Dictyosphaeria, Galaxaura, Lobophora and Mesopora). Herbivores were categorized into four
functional groups: grazers, scrapers, excavators, and browsers (Yeager et al. 2017).
Herbivore surveys
Standard underwater visual census (UVC) surveys were used to quantify the abundance
of herbivores in the fish community on Kiritimati. The UVC surveys were conducted using
standard belt transect methods following Sandin et al. (2008) to generate site-level estimates of
herbivore density (Table C1). At each site, a pair of scientific divers swimming in tandem along
the belt transect recorded fish size (total length), abundance and species identification. Three 25
m transects, each separated by 10 m were laid along a 10–12 m isobath. For each transect, fishes
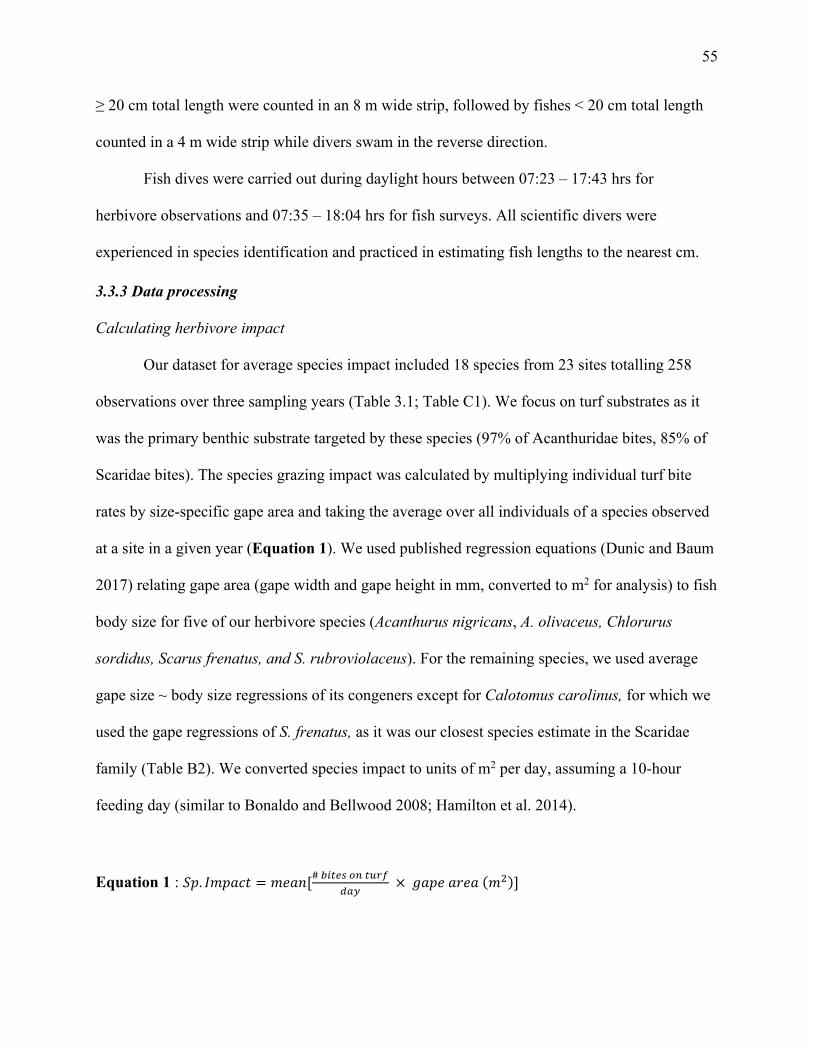
55
≥ 20 cm total length were counted in an 8 m wide strip, followed by fishes < 20 cm total length
counted in a 4 m wide strip while divers swam in the reverse direction.
Fish dives were carried out during daylight hours between 07:23 – 17:43 hrs for
herbivore observations and 07:35 – 18:04 hrs for fish surveys. All scientific divers were
experienced in species identification and practiced in estimating fish lengths to the nearest cm.
3.3.3 Data processing Calculating herbivore impact
Our dataset for average species impact included 18 species from 23 sites totalling 258
observations over three sampling years (Table 3.1; Table C1). We focus on turf substrates as it
was the primary benthic substrate targeted by these species (97% of Acanthuridae bites, 85% of
Scaridae bites). The species grazing impact was calculated by multiplying individual turf bite
rates by size-specific gape area and taking the average over all individuals of a species observed
at a site in a given year (Equation 1). We used published regression equations (Dunic and Baum
2017) relating gape area (gape width and gape height in mm, converted to m2 for analysis) to fish
body size for five of our herbivore species (Acanthurus nigricans, A. olivaceus, Chlorurus
sordidus, Scarus frenatus, and S. rubroviolaceus). For the remaining species, we used average
gape size ~ body size regressions of its congeners except for Calotomus carolinus, for which we
used the gape regressions of S. frenatus, as it was our closest species estimate in the Scaridae
family (Table B2). We converted species impact to units of m2 per day, assuming a 10-hour
feeding day (similar to Bonaldo and Bellwood 2008; Hamilton et al. 2014).
Equation 1 : 89. ;79<=> = 7?<@[#C*DEFG.DH+IJKL
× M<9?<'?<(7()]

56
We calculated the per-capita average species impact by multiplying the average species
grazing impact (i.e. Sp. Impact from Equation 1) by the average species density per site in a
given year (Equation 2). Site and year specific mean densities per m2 were calculated by
standardizing the species count per site per year by area surveyed and averaging observer
replicates for each species. A yearly impact was found by multiplying the estimate by 365.
Equation 2: $Q?'<M?89?=4?R;79<=> = 89. ;79<=> SC*DEF∙UV
JKLW × X?<@89.Y?@R4>Z S#I*F[
UV W ×\]^JKLF
_LEK+
We ended up with a metric of the per-capita average species impact in bites per year. To
account for errors in our estimate, we estimated the standard deviation and variance of each
measurement mean in the calculation (e.g. average species grazing impact, average site-level
density; similar to Ruttenberg et al. 2019). Since the per-capita average species impact was a
result of a multiplication of two estimated measurements, we calculated the compound error
associated with this estimate as follows (similar to Bellwood 1995; Hoey and Bellwood 2008;
Hoey et al. 2016):
`''a' = |$Q?'<M?89?=4?R;79<=>`R>47<>?| ∙ cde89.;79<=>89.;79<=>
f(
+de89. Y?@R4>Z89. Y?@R4>Z
f(
With the uncertainty in the species grazing impact and species density estimates (e)
represented as the standard deviation of the means.
3.3.4 Data visualization
To visualize the ecosystem function of herbivory, we present the community impact
values (i.e. a matrix of site-year combinations by average species’ impacts) with a constrained

57
redundancy analysis (RDA). It is essentially an extension of a principle components analysis
(PCA) that explicitly models response variables as a function of explanatory variables, which is
appropriate for relating multiple species with multiple explanatory variables (Zuur et al. 2007).
Mathematically, performing an RDA extends multiple linear regression by allowing for the
regression of multiple response variables on multiple explanatory variables and then subjects the
generated matrix of fitted response values from those regressions to PCA (Legendre and
Legendre 2012). Generally, it is used to extract and summarise the variation in a set of response
variables (in our case average species impact values) that might be explained by a set of
explanatory (or constraining) variables (Buttigieg and Ramette 2014).
First, we use the multivariate RDA analysis to visualize how the per-capita average
species’ impacts vary across sites that span our local disturbance gradient and over a time span
associated with the 2015–2016 El Niño heat stress event. This constrained ordination allows us
to visualize which species are associated with different levels of our constraints. It also affords us
the ability to determine how much of the variation in herbivore impact values is explained by our
constraining variables. Then, we summed the per-capita average species’ impacts at each site by
functional group and applied a univariate approach to model assemblage-level grazing impact as
a function of herbivore identity (functional group), local disturbance and the El Niño factor for
the global heat stress event to determine their influence on the overall grazing impact function.
3.3.5 Data analysis Multivariate analysis
Our multivariate assessment consisted of fitting a constrained ordination model using the
rda function in the vegan package (Oksanen et al. 2017) with standardized average species’
impacts as the response, constrained by local human disturbance and a factor identifying the

58
timing of the El Niño heat stress disturbance [Before (2013) and After (2017, 2018)]. Prior to
analysis and plotting, we used the decostand function in the vegan package (Oksanen et al. 2017)
to standardize average species impact values by scaling to zero mean and unit variance. We
chose to standardize our response since it was not raw count data and such a step is an acceptable
alternative for performing data transformations (Legendre and Legendre 2012). We present the
redundancy statistic from the output of our multivariate RDA model which is analogous to the R2
of multiple regression (Legendre and Legendre 2012). To assess the significance of our overall
RDA model and of our constraining explanatory variables on average species’ impacts, we
conducted anova-like permutation tests with 9999 permutations using the anova.cca function in
vegan (Oksanen et al. 2017). We also conducted a variance partitioning analysis to determine the
amount of variation in the community that was explained by each of our constraining variables,
using varpart from the vegan package (Oksanen et al. 2017).
Univariate analysis
To assess whether the herbivore assemblage-level grazing impact varies by functional
group, across a gradient of local disturbance, or over time following a significant global heat
stress event, we modelled average species impact summed by functional group at each site in
each year as a response with a gamma distributed (link = “log”) generalized linear mixed model
using glmer (Bates et al. 2015). We included predictors for herbivore functional group (grazer,
scraper, excavator, and browser), local disturbance level (very low, low, medium, high and very
high), and a factor for the timing of the El Niño heat stress (Before or After) as fixed effects with
site as a random effect. We accounted for the error associated with the estimates of grazing
impact by including the compound error term as a weight in our model. Specifying analysis
weights acknowledges that these are ‘known’ values that vary from observation to observation,

59
and by including the weight term in our model, the parameter estimates are divided by these
values for each observation (Bates et al. 2015). We conducted likelihood-ratio tests (LRT) to
determine the significance of our fixed factor predictors on the herbivore assemblage-level
grazing impact. If there was a significant effect detected, we conducted post-hoc pairwise Tukey
tests to compare levels. The p-values were adjusted for multiple comparisons using the single-
step method employed by the glht function in the multcomp package (Hothorn et al. 2008).
Analyses were conducted in R version 3.3.3 (R Core Team 2017).
3.4 Results 3.4.1 Multivariate analysis The RDA produces an ordination plot to help visually summarise patterns of variation in
our per-capita average species impact response which can be explained by our disturbance
explanatory variables. The distances between the observations (site and year combinations) can
be interpreted as an approximation of their distance in multivariate space, such that points that
ordinate closer together are expected to have similar variable (per-capita average species impact)
values (Zuur et al. 2007). The RDA of the community described a significant solution for
herbivore species’ impacts (pseudo-F = 1.58 df = 5, p < 0.05), as determined by permutation test
on the overall significance of the canonical relationship. Our constraining variables for local
human disturbance and the El Niño heat stress, together, explained ~17% of the variation in the
standardized herbivore community impact, however once adjusted for sample size and the
number of explanatory variables, it accounted for ~6% (Table C2). Local human disturbance
accounted for 13.7% (Adjusted redundancy statistic = 5%) of the variation in the community,
while the El Niño accounted for 3.7% of that variation (Adjusted redundancy statistic = 1.5%),
however our variance partitioning analysis and permutation tests suggest these constraining
60
variables were not a significant to explain the variation on their own (Table C2). The first two
canonical axes (RDA1 and RDA2) accounted for 12% of the total variance of the ordination
(Table C3) and 69% of the constrained variance (Table C4).
The local disturbance gradient is contributing to the variation in the first RDA axis and
the timing associated with the El Niño is contributing to the second (Fig. 3.2). The average
scores for sites at very high disturbance levels were higher than other disturbance levels, and the
centroid score for this level separated out from others along RDA1 (Fig. 3.2a; Fig. 3.3a). The
variation created across disturbance levels is due, in part, to the association of Acanthurus
olivaceus and Scarus tricolor with very high disturbance sites (Fig. 3.2b). The average scores for
sites after the El Niño were higher than scores for sites before, and the centroid scores for this
factor separated out along RDA2 (Fig. 3.2a; Fig. 3.3b). Acanthurus nigrofuscus, A. nigricauda,
and S. rubroviolaceus grouped together and were associated with the centroid score for ‘Before’.
Similarly, S. forsteni, S. globiceps, S. psittacus, and A. leucocheilus showed similar impacts
associated with the centroid score for ‘After’ the El Niño. Notably, the species score for
Calotomus carolinus did not ordinate closely to other species (Fig. 3.2b).
3.4.2 Univariate analysis
We found that assemblage-level grazing impact varied significantly amongst functional
groups (LRT = 561.72, df = 3, p <0.001; Fig. 3.4; Table C5). Scrapers had the highest impact,
followed by grazers then excavators, and browsers had the lowest grazing impact (Fig. 3.5a;
Table C5). Although grazing impact tended to be higher at sites with very high local disturbance,
the high variability in estimates at these sites, meant that this difference was not statistically
significant (LRT = 3.67, df = 4, p = 0.45; Fig. 3.5c). The model indicated a significantly higher

61
grazing impact of herbivores after the El Niño (LRT= 70.30, df = 1, p < 0.001; Fig. 3.5b; Table
C5).
3.5 Discussion
Our multivariate assessment revealed limited variation in average species’ impacts with
respect to disturbance. A greater proportion of the variation across sites was explained by the
local human disturbance gradient than the time period associated with an extreme thermal stress
event and global coral bleaching disturbance, however these factors alone were not strong
explanatory variables for the variation. When we summed herbivore species’ impacts at each site
by functional group, we found functional groups exhibited significantly variable grazing impacts,
which were similar across the local disturbance gradient, but increased following the global heat
stress event.
Per-capita effects
Anthropogenic differences
Over our spatial gradient of local human disturbance, most sites appeared together in the
ordination, but we did observe greater species’ impacts at very high disturbance levels, driven
mainly by Acanthurus olivaceus and Scarus tricolor. This is in line with our hypothesis that per-
capita species impacts across a spatiotemporal gradient will be driven by different species
occupying different densities in different sites This separation of herbivore impacts at very high
disturbance is also in accordance with other studies that have documented spatial differences in
herbivore ecological processes (e.g. Longo et al. 2014; Ruttenberg et al. 2019). It was surprising
to find, however, that herbivore impacts were higher where human disturbance was also highest.
One might expect that herbivores would fare better where proximity to human populations and
fishing pressure were reduced such that herbivory would be higher in areas of low human

62
presence (Robinson et al. 2019a), but we found the opposite. We did find, however, that there
were a greater number of species contributing per-capita impact values at the lower disturbance
levels. What this suggest is that two species, A. olivaceus and S. tricolor, were able to maintain
high levels of impact, despite being in highly disturbed areas, such that the herbivory function
was being disproportionately carried out by a few locally abundant species where disturbance
was very high. In less disturbed sites, the herbivory function was spread between a greater
number of species. Other studies of herbivore functional roles also tend to find that functions are
driven by different species compositions in different areas (e.g. Rasher et al. 2013; Longo et al.
2015; Carlson et al. 2017). Some also document disproportionate feeding pressure to fish
biomass for some acanthurid species (Longo et al. 2015), similar to what we saw for the
surgeonfish A. olivaceus. Acanthurus olivaceus appears to exhibit distinct feeding behaviours
compared to other species (Kelly et al. 2016) and in our case, it seems to be an important
herbivore at very highly disturbed sites. Our results highlight the importance of species identity
and diversity of the herbivore assemblage in examining function (similar to Nash et al. 2016a;
Topor et al. 2019).
Species differences
Our constrained redundancy analysis also revealed that herbivore functional groups did
not separate out in multivariate space, but rather we observed species from different functional
groups that appeared more closely clustered, and sometimes further away from other species in
the same functional group. This is seen, for example, with two species classified as grazers, A.
nigricauda and A. nigrofuscus, which grouped with a scraper Scarus rubroviolaceus. One
exception was Calotomus carolinus, our browser, whose species score did not appear in close
proximity to many of the others. This last finding is similar to the results of a multivariate

63
analysis of herbivore functional roles in Hawaii, which looked at clustering of herbivores by bite
rates, and found that C. carolinus and other browsing Naso species clustered separately from
grazing and scraping species (Kelly et al. 2016). It should be noted that in our analysis of
herbivore grazing function, we only quantified herbivore impacts on turf substrates and did not
quantify other functional roles such as macroalgal browsing or coral bioerosion, which are
known to be important functions carried out by herbivorous fish (e.g. McCauley et al. 2014;
Streit et al. 2015; Adam et al. 2018; Ruttenberg et al. 2019). Our multivariate assessment
suggests that in terms of removing turf algae, most of the herbivore species on Kiritimati perform
this function to a similar extent, except for C. carolinus, which is likely focussed more on
browsing larger macroalgae than grazing turf (Bonaldo et al. 2014). Indeed, surgeonfish and
parrotfish are thought to be complementary in their algal grazing function (Kelly et al. 2016),
and our results suggest there is species and even functional group overlap in the Kiritimati
herbivore assemblage with respect to their average species’ impacts.
Assemblage-level effects
Species differences
When we summed the average species’ impacts at each site, we found that herbivore
functional groups were significantly distinct in terms of their overall grazing impacts. This likely
occurred, as hypothesized, because we have a different number of herbivore species
representative of each functional group and thus different densities. Indeed, impacts are higher
for the scrapers and grazers compared to excavators and browsers, which each only have one
species representative. Despite this disparity, however, differences in grazing impact were least
pronounced between grazer and excavator functional groups. This finding could highlight the
importance that one species, the excavator Chlorurus sordidus in this case, can have on

64
herbivore grazing function, as it appears to be functionally similar to the multi-species grazer
functional group. Another study has previously shown the impact that one species can have on
herbivore function, with the bioerosion function being dictated by the presence of the humphead
parrotfish (Bolbometopon muricatum); this function was virtually absent in sites where B.
muricatum was absent due to high fishing pressure (Bellwood et al. 2003). Because of the
significant distinction in grazing impact that we found between functional groups, our results
corroborate with the body of work on herbivory that suggests taking a functional group approach
when quantifying ecological processes (e.g. Adam et al. 2015, 2018; Robinson et al. 2019a).
Anthropogenic differences
We found no significant effect of the human disturbance gradient on assemblage-level
grazing impact. This suggests to us that the herbivore function, when assessed at an assemblage-
level, is robust to local disturbance driven by human pressure. It seems that different densities of
species feeding in different sites sum to a similar impact.
We did detect, however, a significant influence of the El Niño disturbance on herbivore
assemblage grazing impact. Studies examining the numerical response of herbivores to
disturbance generally recognize a benefit to herbivores, especially from bleaching disturbances,
by documenting increased herbivore abundance and biomass in years following a significant
coral bleaching event (e.g. Adam et al. 2011; Gilmour et al. 2013; Han et al. 2016; Holbrook et
al. 2016). When taken as a proxy for function, the increased biomass suggests an increased
ability to carry out the herbivory function, which might lead to enhancing reef resilience from
such disturbance events (Holbrook et al. 2016). Our direct quantification of the herbivore grazing
function reveals that assemblage-level herbivory also increased after a severe thermal stress-
induced coral bleaching event, which suggests that herbivores are able to continue to carry out

65
their critical function, despite the ecosystem undergoing significant disturbance. Also, we have
not yet documented a complete regime shift to an ecosystem state dominated by macroalgae (as
per Knowlton 2004) at our sites, which might imply that the increase in herbivore grazing might
have contributed to limiting algal growth. As time goes on, however, and as the reef structural
complexity responds to increased disturbances (Magel et al. 2019), we may see a shift in the
delivery of key reef functions. Indeed, other functions, like bioerosion for example, may take on
disproportionately important roles in influencing reef dynamics, especially if the reef continues
to be degraded by climate change stressors (Arias-Godínez et al. 2019).
It should be noted that while we found that our constrained ordination was a significant
solution for the variation in species’ impacts in the herbivore assemblage, local disturbance and
El Niño heat stress did not contribute to the majority of the variation. There was still 80% of the
variation unaccounted for, which could be driven by other unassessed factors, such as reef
characteristics (e.g. level of sedimentation: Bellwood and Fulton 2008; Tebbett et al. 2017b),
algal productivity (e.g. Fox and Bellwood 2007), resource availability (e.g. Carlson et al. 2017),
competition between herbivores or with other coral reef fish (e.g. Davis et al. 2017), or other
physical and environmental factors like wave exposure (e.g. Bejarano et al. 2017).
In summary, we took a species and size-specific approach to quantify the turf removal
function (average species impact) of the herbivore assemblage of Kiritimati. We highlight that a
diverse group of herbivores is necessary to maintain this function across the island, which has
important implications for herbivore management. That said, we also found that this key grazing
function is fairly robust to disturbance, which is encouraging given projected increases in marine
heatwaves (Smale et al. 2019), severe coral bleaching events and diminishing return times for
ecosystems to recover from such disturbances (Hughes et al. 2018a).

66
Table 3.1 Number of instances that species had herbivore feeding observations and density
estimates from the same site in each year to calculate a metric for average species impact.
Species are classified by functional group (FG) and arranged within each group in descending
order by the total number of estimates.
FG Family Species 2013 2017 2018 Total Browser Scaridae Calotomus carolinus 2 9 9 20 Excavator Scaridae Chlorurus sordidus 15 13 11 39
Grazer Acanthuridae
Acanthurus nigricans 15 13 12 40 A. olivaceus 2 2 2 6 A. lineatus 2 1 2 5 A. nigricauda 3 1 1 5 A. achilles 4 0 0 4 A. nigrofuscus 2 0 0 2 A. triostegus 2 0 0 2 A. leucocheilus 0 1 0 1
Scraper Scaridae
Scarus frenatus 16 11 9 36 S. rubroviolaceus 12 14 9 35 S. tricolor 11 8 3 22 S. psittacus 3 5 11 19 S. ghobban 5 4 2 11 S. oviceps 0 4 1 5 S. globiceps 1 0 3 4 S. forsteni 0 0 2 2
Total 95 86 77 258

67
Figure 3.1 Map of twenty-three forereef study sites and villages on Kiritimati (Christmas
Island), Republic of Kiribati. Sites are coloured based on levels of local human disturbance, and
villages (red circles) are scaled to the human population. Inset indicates the island’s location
(triangle) in the equatorial Pacific Ocean.

68
Figure 3.2 Redundancy analysis of the herbivore community impact constrained by local human disturbance and global heat stress. (a) Triplot
displaying site scores (open squares) and text labels to indicate centroid scores (open circles) of the constraining variable factor levels. (b) Biplot for
the species (open circles) and site scores (open squares). The R2, R2 adj and the p-value for the significance of the overall fit of the constrained
ordination are displayed in the top right-hand corner of panel (b). Axis labels include the cumulative proportion of constrained variance.

69
Figure 3.3 Redundancy analysis of the herbivore community impact constrained by local human disturbance and heat stress. (a) Biplot displaying
site scores coloured by the human disturbance levels. (b) Biplot displaying site scores coloured by time period associated with the El Niño. Axis
labels include the cumulative proportion of constrained variance.

70
Figure 3.4 Effect size estimates and 95% confidence intervals for fixed predictor coefficients:
Local disturbance (Very high, High, Medium, Low relative to Very low); El Niño (After relative
to Before); Functional group (Browser, Excavator, Scraper relative to Grazer) from generalized
linear mixed model of assemblage-level grazing impact.

71
Figure 3.5 Boxplot of model predictions of grazing impacts at each level of the fixed effect predictors
included in our generalized linear model of assemblage-level grazing impact: (a) model predictions of
grazing impact by functional group, (b) time period associated with the global El Niño heat stress
disturbance, and (c) local disturbance level. Asterisk indicates significant (by Tukey test) differences
between levels of the fixed predictors. Horizontal lines indicate the median, the upper and lower limits
of boxes indicate the interquartile range. Outliers are removed from panel (a) (3 Grazer, 3 Scraper, 2
Excavator, 1 Browser) and panel (b) (4 Before, 3 After) to enable a better view of patterns.

72
Chapter 4 – Conclusion
If unabated, anthropogenic climate change will continue to subject coral reefs to severe
episodes of thermal stress (Smale et al. 2019), leaving less time in between events to allow full
recovery of these ecosystems (Hughes et al. 2018a). Episodes of mass coral bleaching have
become more frequent, with some regions experiencing back to back years with significant
bleaching episodes (Hughes et al. 2017). A few decades ago, when episodes of global mass coral
bleaching were still relatively rare, coral reef ecologists began to recognize the potential that
herbivorous fish could have as drivers of reef recovery (Bellwood et al. 2004). Following this,
many studies began investigating the effects of coral bleaching on reef assemblages, with
particular focus on how the herbivores responded (e.g. Graham et al. 2007; Bellwood et al. 2012;
Gilmour et al. 2013). These studies made use of data that had been collected from quantitative
surveys of fish abundance and used herbivore biomass as a proxy for their ecological function
(Graham et al. 2015). Dividing the assemblage into functional groups allowed for general
conclusions about how these groups and by extension how certain ecological functions would be
impacted by severe disturbance (Cheal et al. 2010; Bellwood et al. 2012; Glynn et al. 2014;
Mangubhai et al. 2014). While this body of work made use of quantitative data collected before
and after significant disturbances, in order to investigate changes in fish functional structure, it
lacked the finer resolution to investigate how individual feeding activity changed. While some
argue that presence in a fish survey might be reason enough to assume occurrence of fish feeding
(Streit et al. 2019), it overlooks the influence that individual behaviour has in determining
function.
Other studies have looked at a finer spatial scale to quantify fish function, and herbivory
in particular. Using behavioural feeding observations as the basis for quantifying function, these

73
studies tended to make species or spatial comparisons (Bellwood et al. 2003, 2006; Fox and
Bellwood 2007; Alwany et al. 2009; Hoey et al. 2016a), but lacked the temporal resolution to be
able to compare function across a coral bleaching event (but see Keith et al. 2018). Even fewer
studies investigated the interplay between local anthropogenic disturbance and global heat stress,
especially in how it influenced herbivore function. So, despite the important ecological role
herbivores play in ecosystem dynamics, and the influence they might have as a mechanism for
driving coral reef recovery, the consequences of disturbance on their ability to carry out their
ecological function was still not well understood.
Given increased occurrence of climate change-mediated disturbances, coral reef
researchers are building datasets to include behavioural data from before and after significant
coral bleaching episodes to be able to investigate questions about how disturbance events
influence behaviour and by extension how certain functions are affected (e.g. Keith et al. 2018;
Zambre and Arthur 2018). It is this approach that I have taken in trying to untangle the effects
that local and global scale disturbance can have on the herbivorous fish assemblage by utilizing
behavioural and quantitative herbivore data collected from coral reefs around Kiritimati
(Republic of Kiribati) from time points visited before and after the reef had suffered from
extreme thermal stress and a severe coral bleaching episode induced by the 2015–2016 El Niño
pulse heat stress.
In Chapter 2, I employed functional group and species-specific approaches to investigate
how herbivory metrics (bite rates, grazing impact, substrate selectivity) vary with herbivore
identity, individual size, and life phase, and if herbivory is influenced by local human
disturbance or by heat stress. This approach allowed me to investigate ecologically relevant
variation in herbivory metrics, especially as it pertained to differences amongst functional

74
groups, and how individual size influences our interpretation of function. I found that size does
modulate our understanding of herbivory, for example, a high bite rate does not necessarily
equate to a high grazing impact. In particular, there were opposite responses amongst grazer and
scraper functional group bite rates in relation to fish size: scrapers slowed their bite rates at larger
sizes while grazers increased rates with increasing fish size. Despite this difference with bite
rates, we noted that individual grazing impacts increased with fish size for all functional groups.
Herbivore functional groups exhibited varied bite rates, but differences between herbivores were
not as pronounced if accounting for size when considering grazing impacts. Grazers, scrapers
and excavators did not exhibit significant differences in grazing impact. This suggests that
despite differences in body size between different herbivore functional groups, there is some
complementarity in their grazing impact. Notably, our browser was more distinct, suggesting
limited functional redundancy for the browsing function. We did not detect differences in bite
rates or grazing impacts across our gradient of local human disturbance, but we did document a
significant increase when heat stress was high on Kiritimati. These returned to normal after heat
stress had subsided, signifying a short-term response in species-specific herbivory to a global
heat stress event. Selectivity, on the other hand, showed the opposite response, with no
significant change over time detected, but exhibited variation across the local human disturbance
gradient. Taken together, these results provide insight into how species-specific herbivory
responds to disturbance and highlight the opposing effects that local and global stressors can
exert on ecosystem functions.
In Chapter 3, I scaled up our measure of grazing impact to investigate spatiotemporal
patterns of the herbivore assemblage-level impact on turf substrates. Since overall herbivore
impact is influenced by fish behaviour, but also by the abundance of fish performing those
75
behaviours, I match our estimate of species-specific grazing impact with estimates of site-
averaged species density. I found that the variation in herbivore impacts constrained by human
disturbance and the timing of the El Niño was significant, but these factors together only
explained 17% of the variation in community herbivory. Sites subject to very high disturbance
were distinguished from the others by having only a few locally abundant feeding herbivores,
while the other disturbance levels had a larger number of species contributing to herbivore
species impact. When we summed the impact at each site by herbivore functional group, we
found that functional groups did exhibit significantly different grazing impacts, and these were
higher after the El Niño pulse heat stress event but did not vary across the local disturbance
gradient. It would seem as though the assemblage-level grazing function is fairly robust to
disturbance, which is encouraging, given the anticipated increase in anthropogenic disturbances.
A key goal for management is to conserve the proper functioning and promote the
delivery of ecological services provided by the coral reef (Ladd et al. 2018; Bellwood et al.
2019a; Williams et al. 2019). In a broad sense, the state of the reef is driven by a dynamic
balance between pairs of ecological processes such as calcium carbonate production and
bioerosion, primary production and herbivory, secondary production and predation, and nutrient
uptake and release (Brandl et al. 2019). Having an adequate definition of ecosystem functioning
is a top priority for reef managers, but characterizing reef functions and the role of biodiversity
in influencing ecological processes has not been previously approached in a systematic and
quantitative way (Bellwood et al. 2019b; Brandl et al. 2019). With this thesis, I attempted to
understand the role of herbivore functional group diversity in shaping the species-specific and
overall herbivore grazing function, while accounting for local and global stressors on the
community. I demonstrated that a diverse herbivore assemblage is necessary for carrying out

76
herbivory, but the overall function is fairly robust to disturbance, which is reassuring for the fate
of this ecological process in an ever-changing world. However, the theory that herbivores are
necessary drivers of reef recovery is coming into question now, because of the overriding impact
from climate change-driven stressors on coral reefs (Bruno et al. 2019). Since the effects of
climate change are extensive, it seems that the consequences of global change might obscure the
finer scale influences of other important reef-shaping processes.
Given that episodes of extreme heat stress and coral bleaching are projected to become
more frequent (Hughes et al. 2018a), predicting the consequences of repeated heat stress on the
physiological heat tolerance of coral reef herbivores, is something that is not yet well understood.
The positive relationship between temperature and metabolism is pretty well established
(Gillooly et al. 2001; Brown et al. 2004, 2012), but what remains to be seen is how the elevated
temperatures from climate-induced heat stress may influence the metabolic ecology of species in
the long-term (Wilson et al. 2010a). There is some suggestion that warming climates will have a
deleterious effect on the performance of individuals leading to metabolic meltdown, especially if
heightened metabolic demand at higher temperatures is not met with increased availability of
food resources (Huey and Kingsolver 2019). What needs to be investigated now, is if or how
climate change might modify physiological responses of reef organisms in such a way that the
dynamics established in interspecies relationships (such as the interaction between corals, algae
and herbivores) will shift as a result (e.g. Matis et al. 2018; Bellwood et al. 2019b). For example,
even if herbivory could be maintained, a recovery to full coral cover may never manifest, if the
physiological tolerance of corals cannot sustain elevated temperatures caused by climate change
(e.g. Eakin et al. 2019), or if conditions shift to favour algal growth such that macroalgae take

77
the competitive edge over corals (Brown et al. 2019) and their rampant growth overwhelms any
suppression herbivores might be able to provide (Holbrook et al. 2016).
Additionally, the effects of heat stress, coral bleaching and ocean acidification are
increasing the incidence of coral disease and erosion of the reef structure, which has further
negative impacts for corals that then extends to the broader community through loss of habitat
structure (Eakin et al. 2019). Thus, protecting herbivore populations might be one strategy to
allow coral reefs a better chance at recovery from significant disturbance (Williams et al. 2019),
but perhaps the approach that might offer a better guarantee in terms of recovery outcome and
return of these ecosystems to their former glory, is to limit the emission of fossil fuels into the
atmosphere and target the root cause of the degradation by addressing global climate change
(Skirving et al. 2019).

78
References Abelson A, Obolski U, Regoniel P, Hadany L (2016) Restocking herbivorous fish populations as
a social-ecological restoration tool in coral reefs. Front Mar Sci 3:138 Adam TC, Burkepile DE, Ruttenberg BI, Paddack MJ (2015) Herbivory and the resilience of
Caribbean coral reefs: Knowledge gaps and implications for management. Mar Ecol Prog Ser 520:1–20
Adam TC, Duran A, Fuchs CE, Roycroft MV, Rojas MC, Ruttenberg BI, Burkepile DE (2018) Comparative analysis of foraging behavior and bite mechanics reveals complex functional
diversity among Caribbean parrotfishes. Mar Ecol Prog Ser 597:207–220 Adam TC, Schmitt RJ, Holbrook SJ, Brooks AJ, Edmunds PJ, Carpenter RC, Bernardi G (2011)
Herbivory, connectivity, and ecosystem resilience: Response of a coral reef to a large-scale perturbation. PLoS One 6:e23717
Afeworki Y, Zekeria ZA, Videler JJ, Bruggemann JH (2013) Food intake by the parrotfish Scarus ferrugineus varies seasonally and is determined by temperature, size and
territoriality. Mar Ecol Prog Ser 489:213–224 Alwany MA, Thaler E, Stachowitsch M (2009) Parrotfish bioerosion on Egyptian Red Sea reefs.
J Exp Mar Bio Ecol 371:170–176 Arias-Godínez G, Jiménez C, Gamboa C, Cortés J, Espinoza M, Alvarado JJ (2019) Spatial and
temporal changes in reef fish assemblages on disturbed coral reefs, north Pacific coast of
Costa Rica. Mar Ecol 40:e12532 Barneche DR, Kulbicki M, Floeter SR, Friedlander AM, Maina J, Allen AP (2014) Scaling
metabolism from individuals to reef-fish communities at broad spatial scales. Ecol Lett 17:1067–1076
Bates D, Mächler M, Bolker BM, Walker SC (2015) Fitting linear mixed-effects models using lme4. J Stat Softw 67:1–48
Bejarano S, Jouffray J-B, Chollett I, Allen R, Roff G, Marshell A, Steneck R, Ferse SC, Mumby PJ (2017) The shape of success in a turbulent world: wave exposure filtering of coral reef
herbivory. Funct Ecol 31:1312–1324 Bellwood DR (1995) Direct estimate of bioerosion by two parrotfish species, Chlorurus gibbus
and C. sordidus, on the Great Barrier Reef, Australia. Mar Biol 121:419–429 Bellwood DR (2003) Origins and escalation of herbivory in fishes: a functional perspective.
Paleobiology 29:71–83 Bellwood DR, Baird AH, Depczynski M, González-Cabello A, Hoey AS, Lefèvre CD, Tanner
JK (2012) Coral recovery may not herald the return of fishes on damaged coral reefs. Oecologia 170:567–573
Bellwood DR, Choat JH (1990) A functional analysis of grazing in parrotfishes (family Scaridae): the ecological implications. Environ Biol Fishes 28:189–214
Bellwood DR, Fulton CJ (2008) Sediment-mediated suppression of herbivory on coral reefs: Decreasing resilience to rising sea-levels and climate change? Limnol Oceanogr 53:2695–
2701 Bellwood DR, Hoey AS, Choat JH (2003) Limited functional redundancy in high diversity
systems: Resilience and ecosystem function on coral reefs. Ecol Lett 6:281–285 Bellwood DR, Hughes TP, Folke C, Nyström M (2004) Confronting the coral reef crisis. Nature
429:827–833 Bellwood DR, Hughes TP, Hoey AS (2006) Sleeping functional group drives coral-reef
recovery. Curr Biol 16:2434–2439

79
Bellwood DR, Pratchett MS, Morrison TH, Gurney GG, Hughes TP, Álvarez-Romero JG, Day JC, Grantham R, Grech A, Hoey AS, Jones GP, Pandolfi JM, Tebbett SB, Techera E,
Weeks R, Cumming GS (2019a) Coral reef conservation in the Anthropocene: Confronting spatial mismatches and prioritizing functions. Biol Conserv 236:604–615
Bellwood DR, Streit RP, Brandl SJ, Tebbett SB (2019b) The meaning of the term ‘function’ in ecology: A coral reef perspective. Funct Ecol 33:948–961
Bierwagen SL, Emslie MJ, Heupel MR, Chin A, Simpfendorfer CA (2018) Reef-scale variability in fish and coral assemblages on the central Great Barrier Reef. Mar Biol 165:144
Boersma KS, Dee LE, Miller SJ, Bogan MT, Lytle DA, Gitelman AI (2016) Linking multidimensional functional diversity to quantitative methods: a graphical hypothesis-
evaluation framework. Ecology 97:583–593 Bonaldo RM, Bellwood DR (2008) Size-dependent variation in the functional role of the
parrotfish Scarus rivulatus on the Great Barrier Reef, Australia. Mar Ecol Prog Ser 360:237–244
Bonaldo RM, Hoey AS, Bellwood DR (2014) The ecosystem roles of parrotfishes on tropical reefs. In: Hughes R.N., Hughes D.J., Smith I.P. (eds) Oceanography and Marine Biology:
An Annual Review. CRC Press, Boca Raton, pp 81–132 Bonaldo RM, Krajewski JP, Sazima C, Sazima I (2006) Foraging activity and resource use by
three parrotfish species at Fernando de Noronha Archipelago, tropical West Atlantic. Mar Biol 149:423–433
Brandl SJ, Bellwood DR (2014) Individual-based analyses reveal limited functional overlap in a coral reef fish community. J Anim Ecol 83:661–670
Brandl SJ, Rasher DB, Côté IM, Casey JM, Darling ES, Lefcheck JS, Duffy JE (2019) Coral reef ecosystem functioning: eight core processes and the role of biodiversity. Front Ecol Environ
Brown JH, Gillooly JF, Allen AP, Savage VM, West GB (2004) Toward a metabolic theory of ecology. Ecology 85:1771–1789
Brown JH, Sibly RM (2012) The metabolic theory of ecology and its central equation. In: Sibly R.M., Brown J.H., Kodric-Brown A. (eds) Metabolic ecology: a scaling approach. John
Wiley & Sons, Ltd, Chisester, West Sussex, pp 21–33 Brown JH, Sibly RM, Kodric-Brown A (2012) Introduction: Metabolism as the basis for a
theoretical unification of ecology. In: Sibly R.M., Brown J.H., Kodric-Brown A. (eds) Metabolic ecology: a scaling approach. John Wiley & Sons, Ltd, Chisester, West Sussex, pp
1–9 Brown KT, Bender-Champ D, Kenyon TM, Rémond C, Hoegh-Guldberg O, Dove S (2019)
Temporal effects of ocean warming and acidification on coral–algal competition. Coral Reefs 38:297–309
Bruggemann JH, Begeman J, Bosma EM, Verburg P, Breeman AM (1994a) Foraging by the stoplight parrotfish Sparisoma viride. II. Intake and assimilation of food, protein and
energy. Mar Ecol Prog Ser 106:57–71 Bruggemann JH, Van Oppen MJH, Breeman AM (1994b) Foraging by the stoplight parrotfish
Sparisoma viride. I. Food selection in different, socially determined habitats. Mar Ecol Prog Ser 106:41–55
Bruno JF, Carr LA, O’Connor MI (2015) Exploring the role of temperature in the ocean through metabolic scaling. Ecology 96:3126–3140

80
Bruno JF, Côté IM, Toth LT (2019) Climate change, coral loss, and the curious case of the parrotfish paradigm: Why don’t marine protected areas improve reef resilience? Ann Rev
Mar Sci 11:307–334 Bruno JF, Selig ER (2007) Regional decline of coral cover in the Indo-Pacific: Timing, extent,
and subregional comparisons. PLoS One 2:e2711 Burkepile DE, Adam TC, Roycroft M, Ladd MC, Munsterman KS, Ruttenberg BI (2019)
Species-specific patterns in corallivory and spongivory among Caribbean parrotfishes. Coral Reefs 38:417–423
Burkepile DE, Hay ME (2008) Herbivore species richness and feeding complementarity affect community structure and function on a coral reef. Proc Natl Acad Sci U S A 105:16201–
1620 Burkepile DE, Hay ME (2010) Impact of herbivore identity on algal succession and coral growth
on a Caribbean reef. PLoS One 5:e8963 Burkepile DE, Hay ME (2011) Feeding complementarity versus redundancy among herbivorous
fishes on a Caribbean reef. Coral Reefs 30:351–362 Buttigieg PL, Ramette A (2014) A guide to statistical analysis in microbial ecology: A
community-focused, living review of multivariate data analyses. FEMS Microbiol Ecol 90:543–550
Carlson PM, Davis K, Warner RR, Caselle JE (2017) Fine-scale spatial patterns of parrotfish herbivory are shaped by resource availability. Mar Ecol Prog Ser 577:165–176
Carr LA, Bruno JF (2013) Warming increases the top-down effects and metabolism of a subtidal herbivore. PeerJ 1:e109
Cheal AJ, MacNeil MA, Cripps E, Emslie MJ, Jonker M, Schaffelke B, Sweatman H (2010) Coral-macroalgal phase shifts or reef resilience: Links with diversity and functional roles of
herbivorous fishes on the Great Barrier Reef. Coral Reefs 29:1005–1015 Chesson J (1983) The estimation and analysis of preference and its relatioship to foraging
models. Ecology 64:1297–1304 Choat JH (1991) The biology of herbivorous fishes on coral reefs. In: Sale P.F. (eds) The
ecology of fishes on coral reefs. Academic Press Inc., San Diego, California, pp 120–155 Choat JH, Clements KD (1993) Daily feeding rates in herbivorous labroid fishes. Mar Biol
117:205–211 Chong-Seng KM, Mannering TD, Pratchett MS, Bellwood DR, Graham NAJ (2012) The
influence of coral reef benthic condition on associated fish assemblages. PLoS One 7:e42167
Chong-Seng KM, Nash KL, Bellwood DR, Graham NAJ (2014) Macroalgal herbivory on recovering versus degrading coral reefs. Coral Reefs 33:409–419
Claar DC, Baum JK (2019) Timing matters: survey timing during extended heat stress can influence perceptions of coral susceptibility to bleaching. Coral Reefs 38:559–565
Claar DC, Cobb KM, Baum JK (2019) In situ and remotely sensed temperature comparisons on a Central Pacific atoll. Coral Reefs 1–9. doi: 10.1007/s00338-019-01850-4
Claar DC, McDevitt-Irwin JM, Garren M, Vega Thurber R, Gates RD, Baum JK (in revision) Concordant shifts in the diversity and structure of Symbiodiniaceae and bacterial
communities subjected to chronic anthropogenic disturbance. Mol Ecol Claar DC, Szostek L, McDevitt-Irwin JM, Schanze JJ, Baum JK (2018) Global patterns and
impacts of El Niño events on coral reefs: A meta-analysis. PLoS One 13:e0190957

81
Clements KD, German DP, Piché J, Tribollet A, Choat JH (2016) Integrating ecological roles and trophic diversification on coral reefs: multiple lines of evidence identify parrotfishes as
microphages. Biol J Linn Soc 120:729–751 Coker DJ, Wilson SK, Pratchett MS (2014) Importance of live coral habitat for reef fishes. Rev
Fish Biol Fish 24:89–126 Cvitanovic C, Bellwood DR (2009) Local variation in herbivore feeding activity on an inshore
reef of the Great Barrier Reef. Coral Reefs 28:127–133 Davis K, Carlson PM, Bradley D, Warner RR, Caselle JE (2017) Predation risk influences
feeding rates but competition structures space use for a common Pacific parrotfish. Oecologia 184:139–149
Done TJ (1992) Phase shifts in coral reef communities and their ecological significance. Hydrobiologia 247:121–132
Dunic JC, Baum JK (2017) Size structuring and allometric scaling relationships in coral reef fishes. J Anim Ecol 86:577–589
Eakin CM, Sweatman HPA, Brainard RE (2019) The 2014–2017 global-scale coral bleaching event: insights and impacts. Coral Reefs 38:539–545
Edgar GJ, Stuart-Smith RD, Willis TJ, Kininmonth S, Baker SC, Banks S, Barrett NS, Becerro MA, Bernard ATF, Berkhout J, Buxton CD, Campbell SJ, Cooper AT, Davey M, Edgar SC,
Försterra G, Galván DE, Irigoyen AJ, Kushner DJ, Moura R, Parnell PE, Shears NT, Soler G, Strain EMA, Thomson RJ (2014) Global conservation outcomes depend on marine
protected areas with five key features. Nature 506:216–220 Edwards CB, Friedlander AM, Green AG, Hardt MJ, Sala E, Sweatman HP, Williams ID,
Zgliczynski B, Sandin SA, Smith JE (2014) Global assessment of the status of coral reef herbivorous fishes: Evidence for fishing effects. Proc R Soc B Biol Sci 281:20131835
Eggertsen M, Chacin DH, Åkerlund C, Halling C, Berkström C (2019) Contrasting distribution and foraging patterns of herbivorous and detritivorous fishes across multiple habitats in a
tropical seascape. Mar Biol 166:51 Eurich JG, Shomaker SM, McCormick MI, Jones GP (2018) Experimental evaluation of the
effect of a territorial damselfish on foraging behaviour of roving herbivores on coral reefs. J Exp Mar Bio Ecol 506:155–162
Ferguson AM, Harvey ES, Knott NA (2017) Herbivore abundance, grazing rates and feeding pathways on Australian temperate reefs inside and outside marine reserves: How are things
on the west coast? J Exp Mar Bio Ecol 493:49–56 Fisher R, O’Leary RA, Low-Choy S, Mengersen K, Knowlton N, Brainard RE, Caley MJ (2015)
Species richness on coral reefs and the pursuit of convergent global estimates. Curr Biol 25:500–505
Floeter SR, Behrens MD, Ferreira CEL, Paddack MJ, Horn MH (2005) Geographical gradients of marine herbivorous fishes: Patterns and processes. Mar Biol 147:1435–1447
Fong P, Smith TB, Muthukrishnan R (2016) Algal dynamics: Alternate stable states of reefs in the Eastern Tropical Pacific. In: Glynn P.W., Manzello D.P., Enochs I.C. (eds) Coral reefs
of the Eastern Tropical Pacific: Persistence and loss in a dynamic environment. Springer, Dodrecht, pp 339–367
Ford AK, Bejarano S, Marshell A, Mumby PJ (2016) Linking the biology and ecology of key herbivorous unicornfish to fisheries management in the Pacific. Aquat Conserv Mar Freshw
Ecosyst 26:790–805

82
Fournier DA, Skaug HJ, Ancheta J, Ianelli J, Magnusson A, Maunder MN, Nielsen A, Sibert J (2012) AD Model Builder: Using automatic differentiation for statistical inference of highly
parameterized complex nonlinear models. Optim Methods Softw 27:233–249 Fox RJ, Bellwood DR (2007) Quantifying herbivory across a coral reef depth gradient. Mar Ecol
Prog Ser 339:49–59 Fox RJ, Bellwood DR (2008) Direct versus indirect methods of quantifying herbivore grazing
impact on a coral reef. Mar Biol 154:325–334 Garpe KC, Yahya SAS, Lindahl U, Öhman MC (2006) Long-term effects of the 1998 coral
bleaching event on reef fish assemblages. Mar Ecol Prog Ser 315:237–247 Gillooly JF, Brown JH, West GB, Savage VM, Charnov EL (2001) Effects of size and
temperature on metabolic rate. Science 293:2248–2251 Gilmour JP, Smith LD, Heyward AJ, Baird AH, Pratchett MS (2013) Recovery of an isolated
coral reef system following severe disturbance. Science 340:69–71 Glynn PW, Enochs IC, Afflerbach JA, Brandtneris VW, Serafy JE (2014) Eastern Pacific reef
fish responses to coral recovery following El Niño disturbances. Mar Ecol Prog Ser 495:233–247
Goatley CHR, Bellwood DR (2010) Biologically mediated sediment fluxes on coral reefs: Sediment removal and off-reef transportation by the surgeonfish Ctenochaetus striatus. Mar
Ecol Prog Ser 415:237–245 Graham NAJ, Jennings S, MacNeil MA, Mouillot D, Wilson SK (2015) Predicting climate-
driven regime shifts versus rebound potential in coral reefs. Nature 518:94–97 Graham NAJ, Wilson SK, Jennings S, Polunin NVC, Robinson J, Bijoux JP, Daw TM (2007)
Lag effects in the impacts of mass coral bleaching on coral reef fish, fisheries, and ecosystems. Conserv Biol 21:1291–1300
Green AL, Bellwood DR (2009) Monitoring functional groups of herbivorous reef fishes as indicators of coral reef resilience: A practical guide for coral reef managers in the Asia
Pacific Region. Halford A, Cheal AJ, Ryan D, Williams DMB (2004) Resilience to large-scale disturbance in
coral and fish assemblages on the great barrier reef. Ecology 85:1892–1905 Hamilton SL, Smith JE, Price NN, Sandin SA (2014) Quantifying patterns of fish herbivory on
Palmyra Atoll (USA), an uninhabited predator-dominated central Pacific coral reef. Mar Ecol Prog Ser 501:141–155
Han X, Adam TC, Schmitt RJ, Brooks AJ, Holbrook SJ (2016) Response of herbivore functional groups to sequential perturbations in Moorea, French Polynesia. Coral Reefs 35:999–1009
Heenan A, Hoey AS, Williams GJ, Williams ID (2016) Natural bounds on herbivorous coral reef fishes. Proc R Soc B Biol Sci 283:20161716
Hilborn R (2015) Marine protected areas miss the boat. Science 350:1326 Hoegh-Guldberg O (1999) Climate change, coral bleaching and the future of the world’s coral
reefs. Mar Freshw Res 50:839 Hoegh-Guldberg O, Poloczanska ES, Skirving W, Dove S (2017) Coral reef ecosystems under
climate change and ocean acidification. Front Mar Sci 4:158 Hoey AS, Bellwood DR (2008) Cross-shelf variation in the role of parrotfishes on the Great
Barrier Reef. Coral Reefs 27:37–47 Hoey AS, Bellwood DR (2009) Limited functional redundancy in a high diversity system: single
species dominates key ecological process on coral reefs. Ecosystems 12:1316–1328

83
Hoey AS, Brandl SJ, Bellwood DR (2013) Diet and cross-shelf distribution of rabbitfishes (f. Siganidae) on the northern Great Barrier Reef: Implications for ecosystem function. Coral
Reefs 32:973–984 Hoey AS, Feary DA, Burt JA, Vaughan G, Pratchett MS, Berumen ML (2016a) Regional
variation in the structure and function of parrotfishes on Arabian reefs. Mar Pollut Bull 105:524–531
Hoey AS, Howells E, Johansen JL, Hobbs J-PA, Messmer V, McCowan D, Wilson SK, Pratchett MS (2016b) Recent advances in understanding the effects of climate change on coral reefs.
Diversity 8:12 Holbrook SJ, Schmitt RJ, Adam TC, Brooks AJ (2016) Coral reef resilience, tipping points and
the strength of herbivory. Sci Rep 6:35817 Hothorn T, Bretz F, Westfall P (2008) Simultaneous inference in general parametric models.
Biom J 50:346–63 Huey RB, Kingsolver JG (2019) Climate warming, resource availability, and the metabolic
meltdown of ectotherms. Am Nat Hughes TP (1994) Catastrophes, phase shifts, and large-scale degradation of a Caribbean coral
reef. Science 265:1547–1551 Hughes TP, Anderson KD, Connolly SR, Heron SF, Kerry JT, Lough JM, Baird AH, Baum JK,
Berumen ML, Bridge TC, Claar DC, Eakin CM, Gilmour JP, Graham NAJ, Harrison H, Hobbs J-PA, Hoey AS, Hoogenboom M, Lowe RJ, McCulloch MT, Pandolfi JM, Pratchett
M, Schoepf V, Torda G, Wilson SK (2018a) Spatial and temporal patterns of mass bleaching of corals in the Anthropocene. Science 359:80–83
Hughes TP, Barnes ML, Bellwood DR, Cinner JE, Cumming GS, Jackson JBC, Kleypas J, Van De Leemput IA, Lough JM, Morrison TH, Palumbi SR, Van Nes EH, Scheffer M (2017a)
Coral reefs in the Anthropocene. Nature 546:82–90 Hughes TP, Graham NAJ, Jackson JBC, Mumby PJ, Steneck RS (2010) Rising to the challenge
of sustaining coral reef resilience. Trends Ecol Evol 25:633–642 Hughes TP, Kerry JT, Álvarez-Noriega M, Álvarez-Romero JG, Anderson KD, Baird AH,
Babcock RC, Beger M, Bellwood DR, Berkelmans R, Bridge TC, Butler IR, Byrne M, Cantin NE, Comeau S, Connolly SR, Cumming GS, Dalton SJ, Diaz-Pulido G, Eakin CM,
Figueira WF, Gilmour JP, Harrison HB, Heron SF, Hoey AS, Hobbs JPA, Hoogenboom MO, Kennedy EV, Kuo CY, Lough JM, Lowe RJ, Liu G, McCulloch MT, Malcolm HA,
McWilliam MJ, Pandolfi JM, Pears RJ, Pratchett MS, Schoepf V, Simpson T, Skirving WJ, Sommer B, Torda G, Wachenfeld DR, Willis BL, Wilson SK (2017b) Global warming and
recurrent mass bleaching of corals. Nature 543:373–377 Hughes TP, Kerry JT, Baird AH, Connolly SR, Chase TJ, Dietzel A, Hill T, Hoey AS,
Hoogenboom MO, Jacobson M, Kerswell A, Madin JS, Mieog A, Paley AS, Pratchett MS, Torda G, Woods RM (2019) Global warming impairs stock–recruitment dynamics of corals.
Nature 568:387–390 Hughes TP, Kerry JT, Baird AH, Connolly SR, Dietzel A, Eakin CM, Heron SF, Hoey AS,
Hoogenboom MO, Liu G, McWilliam MJ, Pears RJ, Pratchett MS, Skirving WJ, Stella JS, Torda G (2018b) Global warming transforms coral reef assemblages. Nature 556:492–496
Hughes TP, Rodrigues MJ, Bellwood DR, Ceccarelli D, Hoegh-Guldberg O, McCook L, Moltschaniwskyj N, Pratchett MS, Steneck RS, Willis B (2007) Phase shifts, herbivory, and
the resilience of coral reefs to climate change. Curr Biol 17:360–365

84
Keith SA, Baird AH, Hobbs J-PA, Woolsey ES, Hoey AS, Fadli N, Sanders NJ (2018) Synchronous behavioural shifts in reef fishes linked to mass coral bleaching. Nat Clim
Chang 8:986–991 Kelly ELA, Eynaud Y, Clements SM, Gleason M, Sparks RT, Williams ID, Smith JE (2016)
Investigating functional redundancy versus complementarity in Hawaiian herbivorous coral reef fishes. Oecologia 182:1151–1163
Kelly ELA, Eynaud Y, Williams ID, Sparks RT, Dailer ML, Sandin SA, Smith JE (2017) A budget of algal production and consumption by herbivorous fish in an herbivore fisheries
management area, Maui, Hawaii. Ecosphere 8:e01899 Kiribati National Statistics Office (2016) 2015 Population and Housing Census Volume 1.
Kiribati Ministry of Finance, Bairiki, Tarawa, Kiribati. Knowlton N (2004) Multiple “stable” states and the conservation of marine ecosystems. Prog
Oceanogr 60:387–396 Kuempel CD, Altieri AH (2017) The emergent role of small-bodied herbivores in pre-empting
phase shifts on degraded coral reefs. Sci Rep 7:39670 Kumagai NH, Molinos JG, Yamano H, Takao S, Fujii M, Yamanaka Y (2018) Ocean currents
and herbivory drive macroalgae-to-coral community shift under climate warming. Proc Natl Acad Sci USA 115:8990–8995
Ladd MC, Miller MW, Hunt JH, Sharp WC, Burkepile DE (2018) Harnessing ecological processes to facilitate coral restoration. Front Ecol Environ 16:239–247
Ledlie MH, Graham NAJ, Bythell JC, Wilson SK, Jennings S, Polunin NVC, Hardcastle J (2007) Phase shifts and the role of herbivory in the resilience of coral reefs. Coral Reefs 26:641–
653 Lefcheck JS, Innes-Gold AA, Brandl SJ, Steneck RS, Torres RE, Rasher DB (2019) Tropical
fish diversity enhances coral reef functioning across multiple scales. Sci Adv 5:eaav6420 Lefèvre CD, Bellwood DR (2011) Temporal variation in coral reef ecosystem processes:
Herbivory of macroalgae by fishes. Mar Ecol Prog Ser 422:239–251 Legendre P, Legendre L (2012) Numerical Ecology. Elsevier, Oxford
Lokrantz J, Nyström M, Thyresson M, Johansson C (2008) The non-linear relationship between body size and function in parrotfishes. Coral Reefs 27:967–974
Longo GO, Ferreira CEL, Floeter SR (2014) Herbivory drives large-scale spatial variation in reef fish trophic interactions. Ecol Evol 4:4553–4566
Longo GO, Morais RA, Martins CDL, Mendes TC, Aued AW, Cândido D V., de Oliveira JC, Nunes LT, Fontoura L, Sissini MN, Teschima MM, Silva MB, Ramlov F, Gouvea LP,
Ferreira CEL, Segal B, Horta PA, Floeter SR (2015) Between-habitat variation of benthic cover, reef fish assemblage and feeding pressure on the benthos at the only atoll in South
Atlantic: Rocas Atoll, NE Brazil. PLoS One 10:e0127176 Magel JMT, Burns JHR, Gates RD, Baum JK (2019) Effects of bleaching-associated mass coral
mortality on reef structural complexity across a gradient of local disturbance. Sci Rep 9:2512
Magel JMT, Dimoff SA, Baum JK (in revision) Pulse heat stress events foreshadow long-term climate change impacts on coral reef fish communities. Ecol Appl
Magnusson A, Skaug HJ, Nielsen A, Berg CW, Kristensen K, Maechler M, van Bentham KJ, Bolker BM, Brooks ME (2017) glmmTMB: Generalized linear mixed models using
template model builder. R package version 0.1.3. https://github.com/glmmTMB

85
Maire E, Grenouillet G, Brosse S, Villéger S (2015) How many dimensions are needed to accurately assess functional diversity? A pragmatic approach for assessing the quality of
functional spaces. Glob Ecol Biogeogr 24:728–740 Maire E, Villéger S, Graham NAJ, Hoey AS, Cinner J, Ferse SCA, Aliaume C, Booth DJ, Feary
DA, Kulbicki M, Sandin SA, Vigliola L, Mouillot D (2018) Community-wide scan identifies fish species associated with coral reef services across the Indo-Pacific. Proc R Soc
B Biol Sci 285:20181167 Mangubhai S, Strauch AM, Obura DO, Stone G, Rotjan RD (2014) Short-term changes of fish
assemblages observed in the near-pristine reefs of the Phoenix Islands. Rev Fish Biol Fish 24:505–518
Mantyka CS, Bellwood DR (2007) Macroalgal grazing selectivity among herbivorous coral reef fishes. Mar Ecol Prog Ser 352:177–185
Marshell A, Mumby PJ (2015) The role of surgeonfish (Acanthuridae) in maintaining algal turf biomass on coral reefs. J Exp Mar Bio Ecol 473:152–160
Matis PA, Donelson JM, Bush S, Fox RJ, Booth DJ (2018) Temperature influences habitat preference of coral reef fishes: Will generalists become more specialised in a warming
ocean? Glob Chang Biol 24:3168–3169 McCauley DJ, Young HS, Guevara R, Williams GJ, Power EA, Dunbar RB, Bird DW, Durham
WH, Fiorenza M (2014) Positive and negative effects of a threatened parrotfish on reef ecosystems. Conserv Biol 28:1312–1321
McClure E, Richardson L, Graba-Landry A, Loffler Z, Russ G, Hoey AS (2019) Cross-shelf differences in the response of herbivorous fish assemblages to severe environmental
disturbances. Diversity 11:23 Moberg F, Folke C (1999) Ecological goods and services of coral reef ecosystems. Ecol Econ
29:215–233 Mora C, Graham NAJ, Nyström M (2016) Ecological limitations to the resilience of coral reefs.
Coral Reefs 35:1271–1280 Mouillot D, Graham NAJ, Villéger S, Mason NWH, Bellwood DR (2013) A functional approach
reveals community responses to disturbances. Trends Ecol Evol 28:167–177 Mouillot D, Villeger S, Parravicini V, Kulbicki M, Arias-Gonzalez JE, Bender M, Chabanet P,
Floeter SR, Friedlander A, Vigliola L, Bellwood DR (2014) Functional over-redundancy and high functional vulnerability in global fish faunas on tropical reefs. Proc Natl Acad Sci
111:13757–13762 Mumby PJ (2006) The impact of exploiting grazers (Scaridae) on the dynamics of Caribbean
coral reefs. Ecol Appl 16:747–769 Mumby PJ (2017) Embracing a world of subtlety and nuance on coral reefs. Coral Reefs
36:1003–1011 Mumby PJ, Dahlgren CP, Harborne AR, Kappel CV, Micheli F, Brumbaugh DR, Holmes KE,
Mendes JM, Broad K, Sanchirico JN, Buch K, Box S, Stoffle RW, Gill AB (2006) Fishing, trophic cascades, and the process of grazing on coral reefs. Science 311:98–101
Mumby PJ, Harborne AR (2010) Marine reserves enhance the recovery of corals on Caribbean reefs. PLoS One 5:e8657
Munday PL, Jones GP, Pratchett MS, Williams AJ (2008a) Climate change and the future for coral reef fishes. Fish Fish 9:261–285

86
Munday PL, Kingsford MJ, O’Callaghan M, Donelson JM (2008b) Elevated temperature restricts growth potential of the coral reef fish Acanthochromis polyacanthus. Coral Reefs
27:927–931 Nash KL, Abesamis RA, Graham NAJ, McClure EC, Moland E (2016a) Drivers of herbivory on
coral reefs: Species, Habitat and management effects. Mar Ecol Prog Ser 554:129–140 Nash KL, Graham NAJ, Jennings S, Wilson SK, Bellwood DR (2016b) Herbivore cross-scale
redundancy supports response diversity and promotes coral reef resilience. J Appl Ecol 53:646–655
Oksanen J, Blanchet FG, Friendly M, Kindt R, Legendre P, McGlinn D, Minchin PR, O’Hara RB, Simpson GL, Solymos P, Stevens MHM, Szoecs E, Wagner H (2017) vegan:
Community Ecology Package. R package version 2.4-5. https://cran.r-project.org/package=vegan
Ong L, Holland KN (2010) Bioerosion of coral reefs by two Hawaiian parrotfishes: species, size differences and fishery implications. Mar Biol 157:1313–1323
Osborne K, Thompson AA, Cheal AJ, Emslie MJ, Johns KA, Jonker MJ, Logan M, Miller IR, Sweatman HPA (2017) Delayed coral recovery in a warming ocean. Glob Chang Biol
23:3869–3881 Paddack MJ, Cowen RK, Sponaugle S (2006) Grazing pressure of herbivorous coral reef fishes
on low coral-cover reefs. Coral Reefs 25:461–472 Plass-Johnson JG, Ferse SCA, Jompa J, Wild C, Teichberg M (2015) Fish herbivory as key
ecological function in a heavily degraded coral reef system. Limnol Oceanogr 60:1382–1391
Polunin NVC, Harmelin-Vivien M, Galzin R (1995) Contrasts in algal food processing among
five herbivorous coral-reef fishes. J Fish Biol 47:455–465 Pratchett MS, Hoey AS, Wilson SK (2014) Reef degradation and the loss of critical ecosystem
goods and services provided by coral reef fishes. Curr Opin Environ Sustain 7:37–43 Pratchett MS, Hoey AS, Wilson SK, Messmer V, Graham NAJ (2011) Changes in biodiversity
and functioning of reef fish assemblages following coral bleaching and coral loss. Diversity 3:424–452
Pratchett MS, Munday PL, Wilson SK, Graham NAJ, Cinner JE, Bellwood DR, Jones GP, Polunin NVC, McClanahan TR (2008) Effects of climate-induced coral bleaching on coral
reef fishes - ecological and economic consequences. In: Gibson R., Atkinson R., Gordon J. (eds) Oceanography and Marine Biology: An Annual Review, 46. pp 251–296
Pratchett MS, Thompson CA, Hoey AS, Cowman PF, Wilson SK (2018) Effects of coral bleaching and coral loss on the structure and function of reef fish assemblages. In: van
Oppen M.J.H., Lough J.M. (eds) Coral Bleaching: Patterns, Processes, Causes and Consequences. Springer International Publishing, Cham, pp 265–293
Puk LD, Ferse SCA, Wild C (2016) Patterns and trends in coral reef macroalgae browsing: a review of browsing herbivorous fishes of the Indo-Pacific. Rev Fish Biol Fish 26:53–70
Quataert E, Storlazzi C, van Rooijen A, Cheriton O, van Dongeren A (2015) The influence of coral reefs and climate change on wave-driven flooding of tropical coastlines. Geophys Res
Lett 42:6407–6415 R Core Team (2017) R: A language and environment for statistical computing. R Foundation for
Statistical Computing, Vienna, Austria. https://www.R-project.org Rasher DB, Hoey AS, Hay ME (2013) Consumer diversity interacts with prey defenses to drive
ecosystem function. Ecology 94:1347–1358

87
Richardson LE, Graham NAJ, Pratchett MS, Eurich JG, Hoey AS (2018) Mass coral bleaching causes biotic homogenization of reef fish assemblages. Glob Chang Biol 24:3117–3129
Robinson JPW, McDevitt-Irwin JM, Dajka J, Hadj-Hammou J, Howlett S, Graba-Landry A, Hoey AS, Nash KL, Wilson SK, Graham NA (2019a) Habitat and fishing control grazing potential on coral reefs. Funct Ecol 1365-2435.13457
Robinson JPW, Wilson SK, Jennings S, Graham NAJ (2019b) Thermal stress induces persistently altered coral reef fish assemblages. Glob Chang Biol 25:2739–2750
van Rooij JM, Videler JJ, Bruggemann JH (1998) High biomass and production but low energy transfer effciency of Caribbean parrotfish: implications for trophic models of coral reefs. J
Fish Biol 53:154–178 Ruppert JLW, Vigliola L, Kulbicki M, Labrosse P, Fortin M-J, Meekan MG (2018) Human
activities as a driver of spatial variation in the trophic structure of fish communities on Pacific coral reefs. Glob Chang Biol 24:e67–e79
Ruttenberg BI, Adam TC, Duran A, Burkepile DE (2019) Identity of coral reef herbivores drives variation in ecological processes over multiple spatial scales. Ecol Appl 29:e01893
Sandin SA, Smith JE, DeMartini EE, Dinsdale EA, Donner SD, Friedlander AM, Konotchick T, Malay M, Maragos JE, Obura D, Pantos O, Paulay G, Richie M, Rohwer F, Schroeder RE,
Walsh S, Jackson JBC, Knowlton N, Sala E (2008) Baselines and degradation of coral reefs in the Northern Line Islands. PLoS One 3:e1548
Skaug H, Fournier D, Bolker B, Magnusson A, Nielsen A (2016) Generalized linear mixed models using “AD Model Builder.” R package version 0.8.3.3
Skirving WJ, Heron SF, Marsh BL, Liu G, De La Cour JL, Geiger EF, Eakin CM (2019) The relentless march of mass coral bleaching: a global perspective of changing heat stress. Coral
Reefs 38:547–557 Smale DA, Wernberg T, Oliver ECJ, Thomsen M, Harvey BP, Straub SC, Burrows MT,
Alexander L V., Benthuysen JA, Donat MG, Feng M, Hobday AJ, Holbrook NJ, Perkins-Kirkpatrick SE, Scannell HA, Sen Gupta A, Payne BL, Moore PJ (2019) Marine heatwaves threaten global biodiversity and the provision of ecosystem services. Nat Clim Chang
9:306–312 Smith JE, Hunter CL, Smith CM (2010) The effects of top-down versus bottom-up control on
benthic coral reef community structure. Oecologia 163:497–507 Smith TB (2008) Temperature effects on herbivory for an Indo-Pacific parrotfish in Panamá:
Implications for coral-algal competition. Coral Reefs 27:397–405 Smithson M, Verkuilen J (2006) A better lemon squeezer? Maximum-likelihood regression with
beta-distributed dependent variables. Psychol Methods 11:54–71 Steneck RS (1983) Quantifying herbivory on coral reefs: just scratching the surface and still
biting off more than we can chew. 103–111 Steneck RS, Arnold SN, Mumby PJ (2014) Experiment mimics fishing on parrotfish: insights on
coral reef recovery and alternative attractors. Mar Ecol Prog Ser 506:115–127 Steneck RS, Mumby PJ, MacDonald C, Rasher DB, Stoyle G (2018) Attenuating effects of
ecosystem management on coral reefs. Sci Adv 4:eaao5493 Streit RP, Cumming GS, Bellwood DR (2019) Patchy delivery of functions undermines
functional redundancy in a high diversity system. Funct Ecol 33:1144–1155 Streit RP, Hoey AS, Bellwood DR (2015) Feeding characteristics reveal functional distinctions
among browsing herbivorous fishes on coral reefs. Coral Reefs 34:1037–1047

88
Stuart-Smith RD, Brown CJ, Ceccarelli DM, Edgar GJ (2018) Ecosystem restructuring along the Great Barrier Reef following mass coral bleaching. Nature 560:92–96
Suchley A, Alvarez-Filip L (2017) Herbivory facilitates growth of a key reef-building Caribbean coral. Ecol Evol 7:11246–11256
Tebbett SB, Goatley CHR, Bellwood DR (2017a) Clarifying functional roles: algal removal by the surgeonfishes Ctenochaetus striatus and Acanthurus nigrofuscus. Coral Reefs 36:803–
813 Tebbett SB, Goatley CHR, Bellwood DR (2017b) The effects of algal turf sediments and organic
loads on feeding by coral reef surgeonfishes. PLoS One 12:e0169479 Topor ZM, Rasher DB, Duffy JE, Brandl SJ (2019) Marine protected areas enhance coral reef
functioning by promoting fish biodiversity. Conserv Lett 12:e12638 Villéger S, Mason NWH, Mouillot D (2008) New multidimensional functional diversity indices
for a multifaceted framework in functional ecology. Ecology 89:2290–2301 Villéger S, Miranda JR, Hernández DF, Mouillot D (2010) Contrasting changes in taxonomic vs.
functional diversity of tropical fish communities after habitat degradation. Ecol Appl 20:1512–1522
Walsh SM (2011) Ecosystem-scale effects of nutrients and fishing on coral reefs. J Mar Biol 2011:1–13
Watson MS, Claar DC, Baum JK (2016) Subsistence in isolation: Fishing dependence and perceptions of change on Kiritimati, the world’s largest atoll. Ocean Coast Manag 123:1–8
Williams ID, Kindinger TL, Couch CS, Walsh WJ, Minton D, Oliver TA (2019) Can herbivore management increase the persistence of Indo-Pacific coral reefs? Front Mar Sci 6:557
Williams ID, Polunin NVC, Hendrick VJ (2001) Limits to grazing by herbivorous fishes and the impact of low coral cover on macroalgal abundance on a coral reef in Belize. Mar Ecol Prog
Ser 222:187–196 Wilson SK, Adjeroud M, Bellwood DR, Berumen ML, Booth D, Bozec Y-M, Chabanet P, Cheal
A, Cinner J, Depczynski M, Feary DA, Gagliano M, Graham NAJ, Halford AR, Halpern BS, Harborne AR, Hoey AS, Holbrook SJ, Jones GP, Kulbiki M, Letourneur Y, De Loma
TL, McClanahan T, McCormick MI, Meekan MG, Mumby PJ, Munday PL, Ohman MC, Pratchett MS, Riegl B, Sano M, Schmitt RJ, Syms C (2010a) Crucial knowledge gaps in
current understanding of climate change impacts on coral reef fishes. J Exp Biol 213:894–900
Wilson SK, Fisher R, Pratchett MS, Graham NAJ, Dulvy NK, Turner RA, Cakacaka A, Polunin NVC (2010b) Habitat degradation and fishing effects on the size structure of coral reef fish
communities. Ecol Appl 20:442–451 Yeager LA, Deith MCM, Mcpherson JM, Williams ID, Baum JK (2017) Scale dependence of
environmental controls on the functional diversity of coral reef fish communities. Glob Ecol Biogeogr 26:1177–1189
Zambre AM, Arthur R (2018) Foraging plasticity in obligate corallivorous Melon butterflyfish across three recently bleached reefs. Ethology 124:302–310
Zuur AF, Ieno EN, Smith GM (2007) Principal component analysis and redundancy analysis. In: Gail M., Krickeberg K., Sarnet J., Tsiatis A., Wong W. (eds) Analysing Ecological Data.
Springer New York, pp 193–224

89 Appendices Appendix A - Literature review of coral reef fish herbivory Appendix A1 Herbivore responses to disturbance. Studies investigating the impacts of disturbance events on the herbivore fish community. Studies are grouped by responses measured and arranged chronologically by year published then alphabetically within a year. COT is for the Crown-of-Thorns seastar; CPUE is catch per unit effort; GBR is the Great Barrier Reef. Response Authors/Year Disturbance Fish studied Response detected
Abundance/ Density/ Biomass
Responses
Halford et al. 2004 *Natural* disturbance (likely a storm)
Acanthuridae, Chaetodontidae, Labridae, Pomacentridae, Scaridae
11/19 Families declined in abundance after impact. Acanthuridae not affected, Scaridae more affected.
Garpe et al. 2006 Coral bleaching (1998 El Niño)
Whole fish assemblage – including roving herbivores (Acanthuridae, Scaridae)
Roving herbivores increased initially following bleaching – then declined with coral erosion.
Graham et al. 2007 Coral bleaching (1998 El Niño)
Fish functional groups: herbivores, corallivores, planktivores, piscivores, mixed diet feeders
Small herbivores declined; larger size classes increased.
Ledlie et al. 2007 Coral bleaching (1998 El Niño)
Chlorurus sordidus and C. strogylocephalus (bioeroders), Scarus niger and S. rubroviolaceus (scrapers), Acanthurus triostegus and A. leucosternon (grazers)
No consistent trend (either increase or decrease) in abundance or biomass of herbivores. Smaller individuals were more affected.
Pratchett et al. 2008 Mass coral bleaching (Review)
Fish assemblage 45/116 fish species exhibited a change (ranging from extinction to increase). Roving herbivores exhibit increases in abundance.
Cheal et al. 2010 Coral bleaching and cyclone disturbance
Herbivore assemblage: scrapers, grazers, detritivores, browsers
Diversity/abundance lower at reefs in macroalgal transition phase. Parrotfish show no relationship to macroalgal cover.
Adam et al. 2011 COT outbreak Herbivorous fish and urchins Herbivorous fish doubled in density, tripled in total biomass. Assemblage became increasingly dominated by parrotfish (accounting for ~50% of biomass).
Bellwood et al. 2012 Coral bleaching (1998 El Niño)
Cryptobenthic fish Assemblage shifted after bleaching – relative abundance of functional groups changed.
Gilmour et al. 2013 Coral bleaching (1998 El Niño)
Herbivorous fish assemblage Increase in herbivore density detected several years after bleaching.
Glynn et al. 2014 Coral bleaching (1983 & 1998 El Niño)
Fish assemblage Reef fish density remained stable – herbivores had no pattern with increasing coral cover.
Mangubhai et al. 2014
Coral bleaching (2002–2003 El Niño)
Fish assemblage Average Acanthuridae and Scaridae abundance did not change across sites between pre- and post-bleaching years.

90 Appendix A1 Herbivore responses to disturbance (cont’d) Response Authors/Year Disturbance Fish studied Response detected Han et al. 2016 Pulse perturbations:
COT outbreak and then cyclone
Herbivore assemblage: browsers, detritivores, excavators, farmers, grazer/detritivores, scrapers
Island-wide biomass of scrapers and excavators increased three-fold. Assemblage shifted to increased representation of scrapers/excavators.
Holbrook et al. 2016 COT outbreak then cyclone
Acanthuridae and Scaridae Herbivorous fish biomass on fore-reef more than doubled island-wide.
Nash et al. 2016b Coral bleaching (1998 El Niño)
Fish assemblage Small fish more negatively affected by bleaching – increase in larger individuals.
Hoey et al. 2016b Climate-driven coral loss (Review)
Fish assemblage Increase in herbivore biomass generally documented with decline of coral cover (but they note it is variable).
Ruppert et al. 2018 Human activities – compare top-down effects to bottom-up (i.e. humans altering benthic community)
Fish assemblage Human activities directly impact top-level carnivores, but herbivores and lower level carnivores are more impacted by the habitat changes that humans cause (i.e. indirect impact of humans).
Steneck et al. 2018 Fishing (comparing islands with fishing bans to those where fishing is unconstrained)
Vagile species of fish assemblage considered. Surgeonfish, parrotfish and urchin (D. antillarum) herbivores quantified.
No-take reserves had higher biomass for predatory and herbivorous fish – less variation explained by fishing pressure variable for surgeonfish compared to groupers or snappers. Turf canopy height was lower in reserves and there was a weak negative impact of turf canopy height and macroalgal cover on juvenile coral density, but a positive effect of parrotfish biomass on juvenile coral density.
Diversity/ Abundance/
CPUE
Arias-Godínez et al. 2019
Habitat degradation (i.e. decline in coral cover)
Fish assemblage Found evidence of an assemblage change due to a change in structural complexity of the benthic community (i.e. decline in coral cover and increase in Caulerpa algae): decline in fish diversity (Shannon-diversity index), abundance and CPUE. Fish community was more homogenous in degraded habitats (in the time period after degradation). Noted a reduction in functional redundancy with bioerosion becoming ‘favoured’ over other functional roles (predation).
Abundance/ Biomass/
Functional metrics
Stuart-Smith et al. 2018
Coral bleaching (2015–2016 El Niño)
Fish assemblage Abundance and biomass of scraping herbivores declined on Northern GBR reefs, while excavators increased. Herbivore biomass increased on southern reefs where functional richness also increased. Excavators were more abundant on southern reefs in Coral Sea.
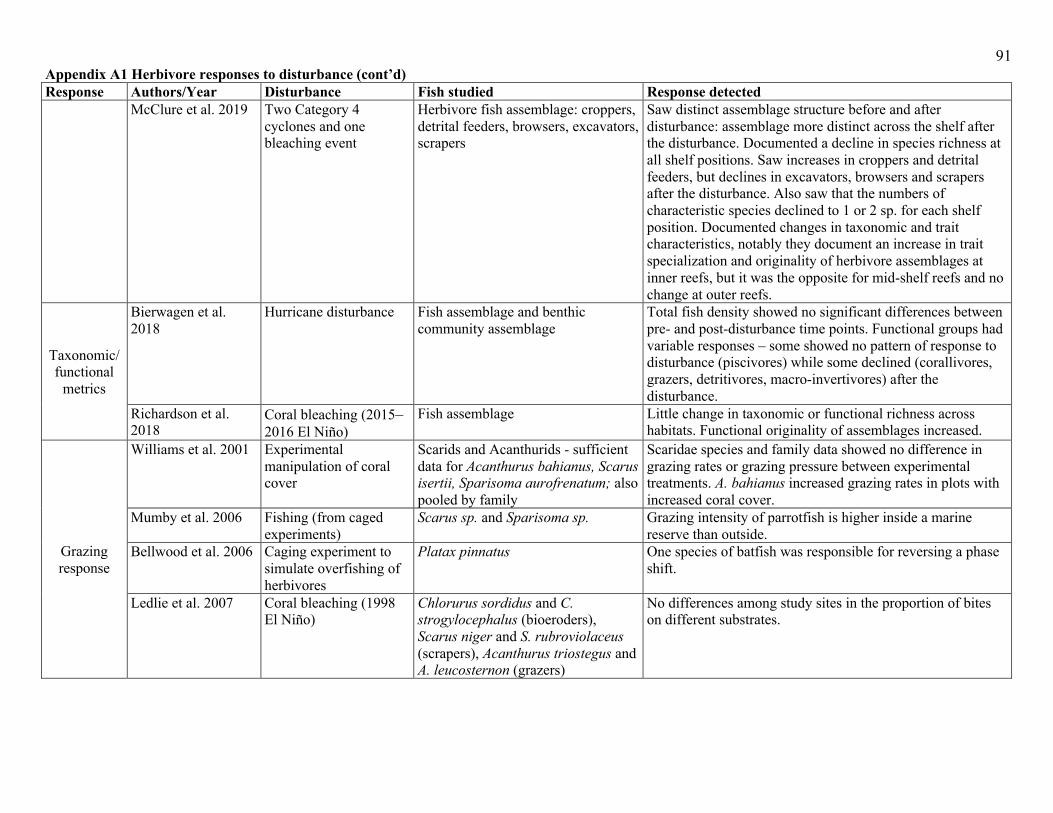
91 Appendix A1 Herbivore responses to disturbance (cont’d) Response Authors/Year Disturbance Fish studied Response detected
McClure et al. 2019 Two Category 4 cyclones and one bleaching event
Herbivore fish assemblage: croppers, detrital feeders, browsers, excavators, scrapers
Saw distinct assemblage structure before and after disturbance: assemblage more distinct across the shelf after the disturbance. Documented a decline in species richness at all shelf positions. Saw increases in croppers and detrital feeders, but declines in excavators, browsers and scrapers after the disturbance. Also saw that the numbers of characteristic species declined to 1 or 2 sp. for each shelf position. Documented changes in taxonomic and trait characteristics, notably they document an increase in trait specialization and originality of herbivore assemblages at inner reefs, but it was the opposite for mid-shelf reefs and no change at outer reefs.
Taxonomic/ functional
metrics
Bierwagen et al. 2018
Hurricane disturbance Fish assemblage and benthic community assemblage
Total fish density showed no significant differences between pre- and post-disturbance time points. Functional groups had variable responses – some showed no pattern of response to disturbance (piscivores) while some declined (corallivores, grazers, detritivores, macro-invertivores) after the disturbance.
Richardson et al. 2018
Coral bleaching (2015–2016 El Niño)
Fish assemblage Little change in taxonomic or functional richness across habitats. Functional originality of assemblages increased.
Grazing response
Williams et al. 2001 Experimental manipulation of coral cover
Scarids and Acanthurids - sufficient data for Acanthurus bahianus, Scarus isertii, Sparisoma aurofrenatum; also pooled by family
Scaridae species and family data showed no difference in grazing rates or grazing pressure between experimental treatments. A. bahianus increased grazing rates in plots with increased coral cover.
Mumby et al. 2006 Fishing (from caged experiments)
Scarus sp. and Sparisoma sp. Grazing intensity of parrotfish is higher inside a marine reserve than outside.
Bellwood et al. 2006 Caging experiment to simulate overfishing of herbivores
Platax pinnatus One species of batfish was responsible for reversing a phase shift.
Ledlie et al. 2007 Coral bleaching (1998 El Niño)
Chlorurus sordidus and C. strogylocephalus (bioeroders), Scarus niger and S. rubroviolaceus (scrapers), Acanthurus triostegus and A. leucosternon (grazers)
No differences among study sites in the proportion of bites on different substrates.

92 Appendix A1 Herbivore responses to disturbance (cont’d) Response Authors/Year Disturbance Fish studied Response detected
Bellwood and Fulton 2008
Sediment loading of environment
Acanthuridae, Pomacentridae, Kyphosidae, Labridae, Siganidae
Herbivore feeding rates increased (~3.8x) with removal of sediment, and that resulted in a decline in algal turf height. There were more fish observed feeding in sediment removal plots (20 vs. 12 sp.). Sediment can affect herbivore feeding behaviour.
Chong-Seng et al. 2014
Coral bleaching (1998 El Niño) and comparing herbivory on coral-dominated vs. algal-dominated reefs
Herbivore assemblage Assemblage of fishes feeding on macroalgal assays in coral dominated versus algal-dominated reefs differed. S. puelloides fed on algae in coral-dominated reef areas while N. elegans accounted for the majority of bites on macroalgal-dominated reefs.
Plass-Johnson et al. 2015
Localized impacts (coastal development, eutrophication, fishing etc.)
Herbivores feeding on algal assays (identified by video) at different sites along a gradient of human disturbance.
The function of herbivory is influenced by localized disturbance. On reefs that are heavily impacted, herbivory is maintained by a few key species (Siganus sp.) versus reefs further offshore (less impacted) which have more species feeding on and more bites taken from algae (i.e. Naso sp. and B. muricatum feed more than Siganus sp.).
Holbrook et al. 2016 Caged treatments (to mimic fishing or disturbance) to estimate relationship between herbivory and macroalgae.
Scaridae, Acanthuridae Found a non-linear relationship between herbivory and macroalgae. Low levels of herbivory were able to suppress macroalgal growth. Found no relationship at landscape level between herbivore biomass and cover of macroalgae.
Bejarano et al. 2017 Wave exposure Parrotfish, surgeonfish and rabbitfish Different functional groups had different feeding performances predicted from their different functional traits and responses to wave exposure – this disturbance can act as an environmental filter on feeding behaviour.

93 Appendix A2 Herbivore functional structure. Studies that investigate spatial or temporal variation in herbivore assemblage functional structure and ecological roles. Studies are in chronological order and organized alphabetically within a year. LM is linear model; GLM is generalized linear model. Authors/ Year
Location Approach to quantifying herbivore assemblage
Data presented Aim of study Findings
Hoey and Bellwood 2008
Lizard Island, Great Barrier Reef
Quantify herbivore community functional roles
Metrics calculated for functional roles that represent grazing, coral predation, sediment reworking and bioerosion – products of feeding rates, bite sizes and fish densities
Characterize the community of parrotfishes between inner, mid and outer reef, testing the hypothesis that fish communities vary along a spatial gradient.
Variation in functional roles show a cross-shelf pattern. Inner shelf reefs had high density, low biomass of parrotfish, but high grazing and sediment reworking. Outer shelf had high biomass but low density and high coral predation and erosion.
Villéger et al. 2008*
- Trait-based approach to quantify functional diversity indices of community.
1) Functional richness; 2) Functional evenness; 3) Functional divergence
To provide the reader with a practical framework for calculating and analyzing the three presented indices of functional diversity.
Need a matrix of values for selected functional traits for species (generally these are standardized continuous variables) that you convert to a distance matrix. Also need a matrix of relative abundance of the species in the community. Indices are designed to be independent of species richness to allow for comparison of communities with different species richness without bias. Suggests multivariate techniques for visualization and ANOVA-like tests for testing differences in the indices.
Villéger et al. 2010
Terminos Lagoon, Gulf of Mexico
Trait-based approach to quantify functional diversity of tropical fish community.
1) Functional richness; 2) Functional evenness; 3) Functional divergence; 4) Functional specialization
To contrast how tropical fish populations compare at two different time points (sampled 18 years apart) with an environmental shift documented (decline in habitat quality/habitat degradation).
Species richness increased between the two periods and biomass declined, causing a modification in community structure, but it did not necessarily translate to a similar change in functional composition. Functional richness increased and evenness was high overall, but saw different responses in different habitat zones. A decline in functional divergence was observed, despite increased richness and seemed to be explained by a decline in functional specialization (generalist species replaced the specialized species).

94 Appendix A2 Herbivore functional structure (cont’d) Authors/ Year
Location Approach to quantifying herbivore assemblage
Data presented Aim of study Findings
Mouillot et al. 2013+
- Trait-based approach to assess community change following disturbance.
Quantitative complementary indices to describe functional community structure: Functional identity, Functional richness, Functional evenness, Functional divergence, Functional dispersion, Functional entropy, Functional specialization, Functional originality.
Review paper that aims to 1) explain theoretical expectations of 3 types of disturbance on functional structure of community; 2) compare expected trends of taxonomic vs. trait-based indices of community structure along disturbance gradients; 3) review quantitative tools to assess changes in community structure after disturbance and methods to test them.
Need to characterize the functional strategy of each species with relevant combination of functional traits, present it in multidimensional space along axes that represent raw functional traits or synthetic traits (e.g. PCA). Also need to describe the distribution of species in the community and abundances of those species. Statistical tests include assessing differences in values compared to null model, estimating diversity components across space or time and using null models to assess significance of dissimilarity values along disturbance gradients.
Brandl & Bellwood 2014
Great Barrier Reef
Trait-based approach using bites, substrate bitten, extent of penetration into substrate of the Acanthuridae, Labridae and Siganidae families of herbivores.
Quantify the functional niche volume and overlap.
Compare niche volumes based on feeding microhabitats.
Functional niche volumes varied – high degree of complementarity among herbivorous fishes was found with no two species having >50% overlap.
Mouillot et al. 2014+
- Trait-based approach to quantify functional diversity of tropical fish assemblages.
Identified functional entities (FE) based on unique combinations of 6 categorical functional traits. Assessed level of 1) Functional diversity; 2) Functional redundancy; 3) Functional vulnerability
Global study to investigate how species are distributed among functional groups and to what extent there is functional redundancy and vulnerability in fish faunas of tropical reefs.
The more species rich fauna had more species packed in functional space (higher functional redundancy). Coined the term “functional over redundancy” to describe overrepresentation of some FEs in terms of species richness. Results highlight that even in high diversity systems, the high probability of functional redundancy does not protect against species loss because species pack disproportionately into a few FEs instead of spreading evenly. They also note a bias in vulnerability distribution, with larger-bodied more vulnerable than smaller-bodied fishes.

95 Appendix A2 Herbivore functional structure (cont’d) Authors/ Year
Location Approach to quantifying herbivore assemblage
Data presented Aim of study Findings
Steneck et al. 2014
Glover’s Reef, Carrie Bow Cay - Belize Barrier Reef
Attempt to scale up herbivory to ecosystem effect.
Grazing rates, size and density of bite marks, algal abundance, coral recruitment, total grazing intensity (using bite rates and census data). Grazing intensity of reefs with depleted herbivores was the total multiplied by the bite rate in caged treatments / control treatments for all size classes and scaled to longer term (6 months).
Experimental study to look at the effect of parrotfish deterrents around coral settlement tiles to see how parrotfish influence algal cover and phase shifts and what effect that might have on coral recruitment.
Deterring the parrotfish from feeding on the tiles can cause microphase-shifts in algal abundance. Found that total parrotfish grazing intensity declined by 52% in treatments where they deterred parrotfish. Thus, evidence of indirect control from herbivory (algal control) on coral recruitment.
Maire et al. 2015*
- Trait-based approach to quantify the functional space and functional diversity pattern of an assemblage.
1) Functional richness; 2) Functional entropy
Simulation study to determine how changing species richness, number of traits and type of traits used to describe assemblages can affect the identity and quality of functional space and how that in turn affects the functional diversity pattern seen in local assemblages.
Simulations showed that the type of representation (dendrogram vs. multidimensional space) and the types of traits selected to describe species are the main determinants of the quality of functional spaces. The quality of functional space decreased with increasing species richness, while number of traits only marginally influenced the quality. Categorical traits decrease the quality of the functional space. The quality of functional space for regional species pools affects assessment of functional diversity in local assemblages and can bias estimations of ecological processes that structured these assemblages.
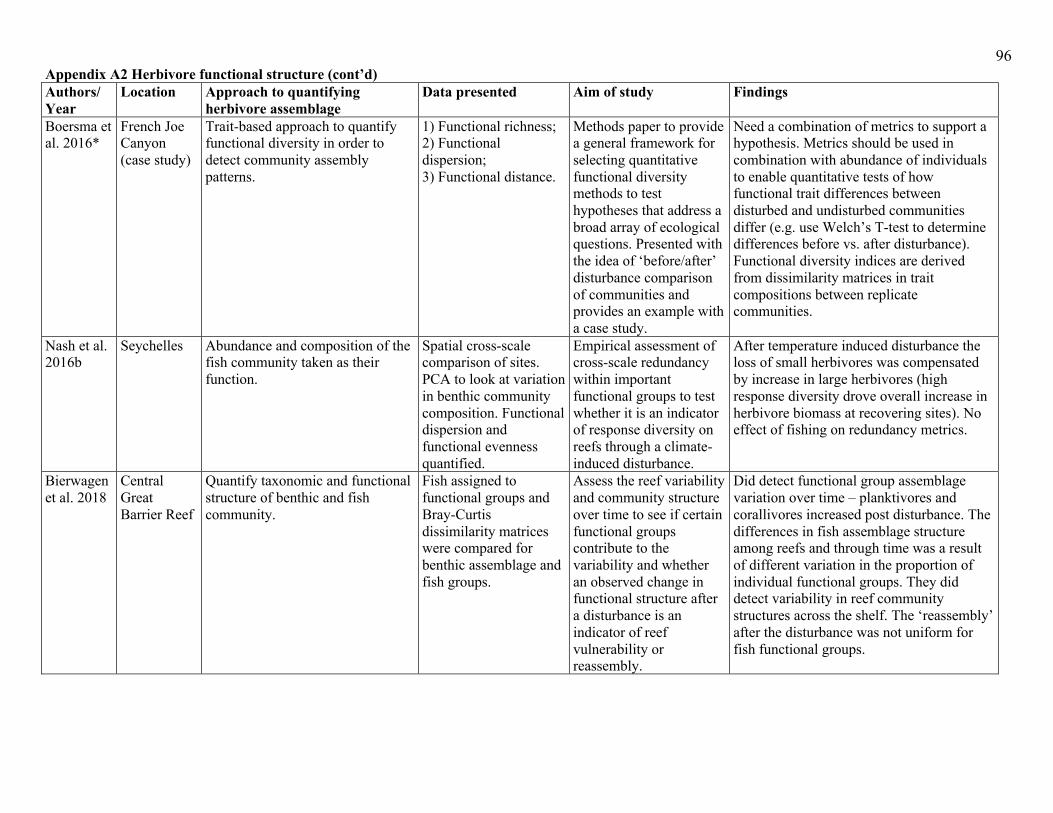
96 Appendix A2 Herbivore functional structure (cont’d) Authors/ Year
Location Approach to quantifying herbivore assemblage
Data presented Aim of study Findings
Boersma et al. 2016*
French Joe Canyon (case study)
Trait-based approach to quantify functional diversity in order to detect community assembly patterns.
1) Functional richness; 2) Functional dispersion; 3) Functional distance.
Methods paper to provide a general framework for selecting quantitative functional diversity methods to test hypotheses that address a broad array of ecological questions. Presented with the idea of ‘before/after’ disturbance comparison of communities and provides an example with a case study.
Need a combination of metrics to support a hypothesis. Metrics should be used in combination with abundance of individuals to enable quantitative tests of how functional trait differences between disturbed and undisturbed communities differ (e.g. use Welch’s T-test to determine differences before vs. after disturbance). Functional diversity indices are derived from dissimilarity matrices in trait compositions between replicate communities.
Nash et al. 2016b
Seychelles Abundance and composition of the fish community taken as their function.
Spatial cross-scale comparison of sites. PCA to look at variation in benthic community composition. Functional dispersion and functional evenness quantified.
Empirical assessment of cross-scale redundancy within important functional groups to test whether it is an indicator of response diversity on reefs through a climate-induced disturbance.
After temperature induced disturbance the loss of small herbivores was compensated by increase in large herbivores (high response diversity drove overall increase in herbivore biomass at recovering sites). No effect of fishing on redundancy metrics.
Bierwagen et al. 2018
Central Great Barrier Reef
Quantify taxonomic and functional structure of benthic and fish community.
Fish assigned to functional groups and Bray-Curtis dissimilarity matrices were compared for benthic assemblage and fish groups.
Assess the reef variability and community structure over time to see if certain functional groups contribute to the variability and whether an observed change in functional structure after a disturbance is an indicator of reef vulnerability or reassembly.
Did detect functional group assemblage variation over time – planktivores and corallivores increased post disturbance. The differences in fish assemblage structure among reefs and through time was a result of different variation in the proportion of individual functional groups. They did detect variability in reef community structures across the shelf. The ‘reassembly’ after the disturbance was not uniform for fish functional groups.

97 Appendix A2 Herbivore functional structure (cont’d) Authors/ Year
Location Approach to quantifying herbivore assemblage
Data presented Aim of study Findings
Maire et al. 2018
1894 Indo-Pacific reefs
Quantify taxonomic and trait-based functional assemblage of coral reefs
Taxonomic: size, abundance, biomass, coral cover. Traits: size, mobility, period of activity, schooling, vertical position in water column, diet. Calculated Functional richness
Take a ‘community-wide scan’ of entire fish community to detect potential links of the community with ecosystem function and services at a large scale.
Individual key species, but also the accumulation of key species, was linked to high levels of ecosystem services. Herbivorous fish were identified as key species for predicting fish biomass and live coral cover of the reef. The community-wide scan approach identifies the key species that are linked to the delivery of key services. In their case the fish biomass and live coral cover were proxies of coral reef services because they support food security, shoreline protection and recreational value.
Richardson et al. 2018
Lizard Island, Great Barrier Reef
Trait-based approach to quantify functional diversity of fish community.
1) Functional richness; 2) Functional dispersion; 3) Functional originality – assessed variation in structure of fish assemblages using community-weighted means of assemblages before, during and after bleaching with linear mixed effect models.
To assess the susceptibility of different species configurations to coral bleaching. Trait-based approach to compare taxonomic and functional structure of reef assemblages among coral reef habitats at three time points.
Documented changes in taxonomic and functional characteristics in response to bleaching event, but the nature of the changes varied among habitats. Evidence of response diversity in corals and reef fishes. They document an increase in similarity in taxonomic and functional diversity of fish assemblages across distinct habitat types (i.e. evidence of biotic homogenization). Functional richness was largely unchanged, but functional originality increased – may be indication of a loss of functional redundancy. After bleaching they documented a significant directional shift towards small-bodied, habitat generalist, algae-farming species.

98 Appendix A2 Herbivore functional structure (cont’d) Authors/ Year
Location Approach to quantifying herbivore assemblage
Data presented Aim of study Findings
Stuart-Smith et al. 2018
Great Barrier Reef and western Coral Sea
Quantify taxonomic and functional structure of fish community.
1) Benthic cover; 2) Abundance/biomass of coral reef fish; 3) Functional richness of community
Regional-wide approach to investigating the changes that occurred following the 2016 El Niño event, studying 186 reefs in the Great Barrier Reef region and western Coral Sea.
Documented declines in coral cover for most reefs that experienced warm temperatures; noted increase in herbivore abundance on some reefs, but not consistently on all reefs that experienced bleaching. Structure of reef communities in the southern part of the range became more similar to those in the north. Functional richness increased on southern reefs where biomass of herbivores (fish and urchins) increased.
McClure et al. 2019
Turtle Island Group, Northern Great Barrier Reef
Quantify taxonomic and functional composition of herbivorous fish assemblage.
Taxonomic: species richness, abundance, biomass, etc. Traits: diet, maximum body size, social grouping, position in water column, mobility between reefs and time of activity. Calculated 3 complementary indices of trait diversity: 1) Trait richness; 2) Trait specialization; 3) Trait originality
Examine the cross-shelf variation in herbivore fish assemblages and whether there is a differential response to a disturbance event.
Assemblage structure was distinct among shelf positions both before and after a disturbance event. The assemblage became more distinct among shelf positions after a disturbance, but more variable within a shelf such that the disturbance increased cross-shelf differences in the assemblage in multivariate space. They detected changes in taxonomic and trait characteristics in response to disturbance, but the nature of the changes varied with the metric and shelf position. Trait richness and taxonomic diversity declined with disturbance. Trait originality and specialization did not vary with shelf position. On inner reefs they increased, whereas specialization declined on mid-shelf reefs and there was no change in either on outer reefs.

99 Appendix A2 Herbivore functional structure (cont’d) Authors/ Year
Location Approach to quantifying herbivore assemblage
Data presented Aim of study Findings
Ruttenberg et al. 2019
Florida Keys, Caribbean
Quantify ecological processes of parrotfish herbivores.
1) Algal consumption; 2) Areal grazing; 3) Bioerosion
Explore how the species identity of herbivorous parrotfish controls ecological processes among habitats and across multiple spatial scales
Found significant differences in parrotfish assemblages and the important ecological processes they perform among habitats and over multiple spatial scales. Ecological processes were driven by species density, but biomass was less important for predicting ecological processes, thus community composition is more important for estimating herbivory.
Streit et al. 2019
Lizard Island, Great Barrier Reef
Map spatial extent of feeding for each herbivore functional group at each site (using kernel densities).
1) Maximum utilized area; 2) Core usage area; 3) Feedable area
To measure the overlap of feeding functional groups in order to determine the spatial complementarity and spatial redundancy. LMs to assess whether sizes of areas, movement extent, core feeding areas etc. differed with functional group or amongst sites. GLMs to assess measures of feeding overlap and to compare to null hypotheses of 1) random feeding 2) feeding when present 3) stable area sizes.
Fish feeding occurred 51% of time and fish movement occurred 67% of time, thus fish presence is a fairly reasonable proxy for fish feeding across temporal scales. Documented poor spatial overlap of core feeding areas when functional groups feed next to each other, indicating that the delivery of ecosystem functions is patchy across the reef. Thus, even with a diverse assemblage, the comprehensive delivery of function is effectively reduced since they feed in small, non-overlapping, high intensity feeding areas.
*Indicates studies that describe the methodology rather than apply the approach to a certain location. +Indicates global scale or review studies that are not associated with one particular study site/location.

100 Appendix A3 Herbivores grazing rate quantification and studies. Studies that use feeding observations or bite rates to investigate herbivory, arranged chronologically by year and alphabetically within a year. EAM is for epiphytic algal matrix; GBR is Great Barrier Reef; IP and TP are Intermediate and Terminal Phase of parrotfish. Authors/ Year
Location Metrics measured Herbivore(s) studied Goal of quantifying herbivory
Findings
Bellwood and Choat 1990
GBR Feeding rate, feeding foray, bite rate, bite speed
Scarus frenatus, S. sordidus
Morphological and behavioural comparison of feeding between two parrotfish functional groups (scrapers and excavators).
Scrapers have less powerful, but take more numerous bites per minute in intensive feeding bouts; excavators have more powerful, but take fewer, larger bites and have slower feeding rates.
Choat and Clements 1993
GBR Number and size of feeding forays, bite speed, bite form, bite location
Scarine parrotfishes (S. frenatus, S. schlegeli, S. sordidus)
Measure morphological feeding metrics as a basis for comparison about different parrotfish functional groups.
Most scarids feed on EAM. Excavators have lower (but variable) bite rates; take fewer bites per foray compared to the rapid feeding rate of scrapers.
Bruggemann et al. 1994a
Caribbean Food intake per bite, foraging effort, daily algal intake
Sparisoma viride Quantitative description of food intake and energy assimilation of this parrotfish species.
Feeding rates affected by time of day, fish size, life phase and substrate type. Higher rates mid-day then it drops off. Feeding is inversely related to fork length. IP have highest rates. Food intake per bite is affected by substrate.
Bruggemann et al. 1994b
Caribbean Foray size (# of successive bites in a foray), size of feeding scar
Sparisoma viride Quantitative description of foraging by this parrotfish species.
Foray size is an indication of food preference – longer forays are taken on substrates that enable higher yields per bite. Size of scars are linearly related to fish length.
Bellwood 1995
GBR Bite rates, bite location, defecation location, bite area/volume
Chlorurus gibbus, C. sordidus
Provide basic information about the temporal feeding patterns; to compare species erosion rates and seasonal effects.
First study to provide quantitative estimate of bioerosion by parrotfishes. Found variation in bioerosion even within excavating functional group. Bites were concentrated on convex surfaces. Found little seasonal variation.
Polunin et al. 1995
Moorea Bite rates, defecation rates, gut fullness
Acanthurus nigrofuscus Ctenochaetus striatus, Scarus sordidus, Stegastes nigricans, Zebrasoma scopas
Compare foraging and food processing patterns among 5 of the most common herbivorous species on this reef.
Bite rates peaked in the afternoon, with most species showing a steady increase during the day. Differences in bite rates best explained by species factor. Ranked the species based on variables assessed: Z. scopas, St. nigricans had lowest rank, followed by C. striatus, S. sordidus and then A. nigrofuscus.

101 Appendix A3 Herbivore grazing rate quantification and studies (cont’d) Authors/ Year
Location Metrics measured Herbivore(s) studied Goal of quantifying herbivory
Findings
Williams et al. 2001
Belize Abundance, grazing pressure (bites/min/plot) × abundance, benthic cover and algal abundance
Acanthurids and scarids Experimental study to test alternative hypothesis to why there is increased algal abundance even in absence of eutrophication, overfishing, mass mortality of sea urchins: rise may be a side effect of loss of coral cover and overwhelming of herbivory.
No variation in scarid grazing rates and pressure among treatments, but did see variation in acanthurids (assumed in response to improved grazing conditions). Increasing coral cover had a proportional effect on decline in macroalgal cover which suggests support for an upper threshold of substratum that can be controlled by grazing of herbivorous fish.
Bellwood et al. 2003
GBR/Indo-Pacific
Bite rates, bite scar volumes, fish abundance, and selectivity
Chlorurus sp., Scarus sp. and Bolbometopon muricatum
Calculate bioerosion (carbonate removal) of important bioeroders. Use densities to determine how human activities influence this ecosystem process across a biogeographical region (44 sites in the Indo-Pacific).
On low-no impact reefs (GBR) bioerosion is carried out by two species only (C. microrhinos and B. muricatum). Bioerosion was almost completely absent from sites where human impact is higher. There is a tight correlation between human impact and bioerosion regardless of geographical location.
Bellwood et al. 2006
GBR Number and bite location, bite rate standardized by biomass, algal area, volume mass, fish densities
Roving herbivore assemblage
Experimental study to determine how herbivore exclusion affects herbivory.
One species of batfish, Platax pinnatus, is solely responsible for reversing a phase shift. It was previously thought to be an invertebrate feeder.
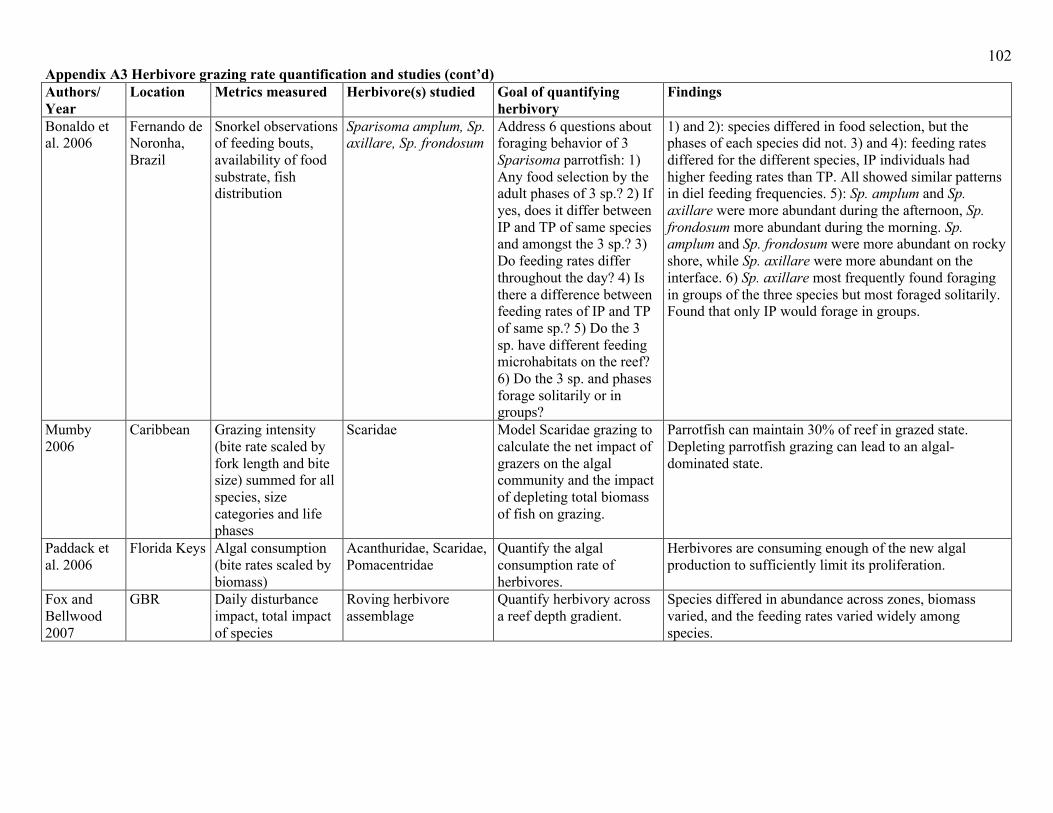
102 Appendix A3 Herbivore grazing rate quantification and studies (cont’d) Authors/ Year
Location Metrics measured Herbivore(s) studied Goal of quantifying herbivory
Findings
Bonaldo et al. 2006
Fernando de Noronha, Brazil
Snorkel observations of feeding bouts, availability of food substrate, fish distribution
Sparisoma amplum, Sp. axillare, Sp. frondosum
Address 6 questions about foraging behavior of 3 Sparisoma parrotfish: 1) Any food selection by the adult phases of 3 sp.? 2) If yes, does it differ between IP and TP of same species and amongst the 3 sp.? 3) Do feeding rates differ throughout the day? 4) Is there a difference between feeding rates of IP and TP of same sp.? 5) Do the 3 sp. have different feeding microhabitats on the reef? 6) Do the 3 sp. and phases forage solitarily or in groups?
1) and 2): species differed in food selection, but the phases of each species did not. 3) and 4): feeding rates differed for the different species, IP individuals had higher feeding rates than TP. All showed similar patterns in diel feeding frequencies. 5): Sp. amplum and Sp. axillare were more abundant during the afternoon, Sp. frondosum more abundant during the morning. Sp. amplum and Sp. frondosum were more abundant on rocky shore, while Sp. axillare were more abundant on the interface. 6) Sp. axillare most frequently found foraging in groups of the three species but most foraged solitarily. Found that only IP would forage in groups.
Mumby 2006
Caribbean Grazing intensity (bite rate scaled by fork length and bite size) summed for all species, size categories and life phases
Scaridae Model Scaridae grazing to calculate the net impact of grazers on the algal community and the impact of depleting total biomass of fish on grazing.
Parrotfish can maintain 30% of reef in grazed state. Depleting parrotfish grazing can lead to an algal-dominated state.
Paddack et al. 2006
Florida Keys Algal consumption (bite rates scaled by biomass)
Acanthuridae, Scaridae, Pomacentridae
Quantify the algal consumption rate of herbivores.
Herbivores are consuming enough of the new algal production to sufficiently limit its proliferation.
Fox and Bellwood 2007
GBR Daily disturbance impact, total impact of species
Roving herbivore assemblage
Quantify herbivory across a reef depth gradient.
Species differed in abundance across zones, biomass varied, and the feeding rates varied widely among species.

103 Appendix A3 Herbivore grazing rate quantification and studies (cont’d) Authors/ Year
Location Metrics measured Herbivore(s) studied Goal of quantifying herbivory
Findings
Ledlie et al. 2007
GBR Coral structural community, fish abundance, feeding habits, diet composition, electivity
Herbivore assemblage Analyze the change in coral reef community structure and how it changes the fish assemblage (community and feeding habits)
Noted a decline in coral cover, no change in numerical abundance or biomass of grazers, scrapers, bioeroders, but change in size structure observed. Species differed in feeding rates, but sites did not differ. Electivity indices showed most species consumed epilithic algae and avoided other substrata.
Mantyka and Bellwood 2007
GBR Selectivity (total bites on each macroalgal species), first bites, time for macroalgae to be reduced
Chlorurus microrhinos, Hipposcarus longiceps, Pomacanthus sexstriatus, Scarus rivulatus, Siganus canaliculatus, Si. doliatus
Experimental manipulation to examine the feeding selectivity of herbivorous fish in order to make species comparisons.
Siganus sp. (rabbitfish) were highly selective on Sargassum (i.e. limited functional redundancy for these species) and parrotfish were more selective on calcified Halimeda (i.e. feeding complementarity exhibited with rabbitfish). The different selectivity is thought to be due to differences in feeding apparatus. The omnivorous P. sexstriatus were the least selective.
Bellwood and Fulton 2008
GBR Visual surveys of herbivores and detritivores, sediment removal and video analysis of feeding rates, algal turf height
Acanthuridae, Kyphosidae, Labridae, Pomacentridae, Siganidae
Experimentally evaluate the effect of natural sediment loads on rates of herbivory in an intact coral reef ecosystem.
Herbivore feeding rates increased (~3.8x) with removal of sediment, and that resulted in a decline in algal turf height. There were more fish observed feeding in sediment removal plots (20 vs. 12 species). Sediment can affect herbivore feeding behaviour.
Bonaldo and Bellwood 2008
GBR Feeding rates and grazing impact (bites day-1 × bite size / body mass of size class)
Scarus rivulatus Quantify size-dependent variation in species functional role.
No variation in feeding rates of different size classes. Grazing impact, however, did increase with fish size. Size classes showed same pattern in their substratum selection.
Burkepile and Hay 2008
Florida Keys Species abundance, species composition, bite rates
Acanthurus bahianus, Sparisoma aurofrenatum
Test the role of a particular herbivore species (or herbivore diversity) on driving community patterns.
Herbivore richness controls macroalgal community and has a positive effect on coral survivorship and growth. Mixed-species treatments better than single-species. Species richness can play a role in affecting the health of coral reefs through complementary resource use.
Hoey and Bellwood 2008
GBR Bite rates, bite scar dimensions, bite area, feeding day length
Labridae (parrotfish) Quantify functional role of parrotfish and compare along a cross-shelf gradient.
Grazing decreased from inner to outer shelf reefs.

104 Appendix A3 Herbivore grazing rate quantification and studies (cont’d) Authors/ Year
Location Metrics measured Herbivore(s) studied Goal of quantifying herbivory
Findings
Lokrantz et al. 2008
Tanzania Bite rates, bite scar dimensions, fish abundance
Scarus niger, Chlorurus sordidus, and C. strongylocephalus
Examine the relationship between body size and ‘scraping performance’ for three parrotfish species.
Bite rates were not correlated to body size for S. niger, C. strongylocephalus, but were negatively related to body size for C. sordidus. The area scraped over time (incorporating bite rates and bite scars) increased with body size for all three species, with the relationship best described using a power function.
Alwany et al. 2009
Red Sea Abundance, bite rates
Cetoscarus bicolor, Chlorurus gibbus, C. sordidus, Scarus ferrugineus, S. frenatus, S. ghobban, S. niger
Quantify scarid bioerosion on Red Sea reefs through examination of feeding activity and abundance.
Species showed consistent patterns in daily feeding (rates peaked in the afternoon). Two groups emerged for high vs. low bioerosion rates. Chlorurus sordidus and S. ghobban are main contributors to overall erosion rates in Red Sea. No difference in bioerosion rates were detected between sites.
Cvitanovic and Bellwood 2009
GBR Algal assays and video cameras to count herbivore bites
Acanthuridae, Ephippidae, Kyphosidae, Siganidae
Quantify the variation in herbivory within local bays.
No difference in herbivory between bays but found variation within a bay.
Hoey and Bellwood 2009
GBR Mass standardized bite impact and grazing preference index
Acanthuridae, Ephippidae, Kyphosidae, Labridae, Pomacanthidae, Siganidae.
Algal assay and video analysis to quantify herbivore feeding assemblage to make spatial and species comparisons.
A single species – Naso unicornis – was removing Sargassum.
Ong and Holland 2010
Hawaii Bite rates, time of first bite, depth, fraction of bites resulting in scars
Chlorurus perspicillatus, Scarus rubroviolaceus
Quantify bioerosion to compare scraper (S. rubroviolaceus) vs. excavator (C. perpicillatus) species and quantify factors affecting bioerosion rates.
Species showed similar daily feeding patterns, and both selected for crustose algae. Bite volumes and erosion rates did not differ between species but increased with increasing size of species.
Goatley and Bellwood 2010
GBR Feeding rates, bite size, pellets, gut contents
Ctenochaetus striatus Quantify amount and direction of sediment transported by this species to make comparisons between habitats.
Sweeping detritus feeder with feeding rates that did not decline nearing the end of the day, but rather stopped abruptly. It removes about 35% of sediment to deeper waters.

105 Appendix A3 Herbivore grazing rate quantification and studies (cont’d) Authors/ Year
Location Metrics measured Herbivore(s) studied Goal of quantifying herbivory
Findings
Burkepile and Hay 2011
Florida Keys Feeding rates, fish richness, benthic cover
Herbivore assemblage with removal of Acanthurus bahianus, Sparisoma aurofrenatum
Caging experiment to test the notion of complementarity versus redundancy, using feeding rates from videos and fish richness as an indication of function.
They detected complex patterns of feeding complementarity and redundancy – herbivores divided into two broad groups: 1) A. bahianus, S. iseri, S. taeniopterus; and 2) A. coeruleus, Sp. aurofrenatum, Sp. chrysopterum, Sp. viride, and large Scarus sp. were similar.
Lefèvre and Bellwood 2011
GBR Feeding intensity measured monthly using Sargassum assays and remote videos to quantify bite rates and identify the herbivores responsible for removal of macroalgae
Herbivore assemblage from videos with focus on three dominant species: K. vaigiensis, N. unicornis, S. rivulatus
Understand the temporal variability in the nature of algal-herbivore interaction.
Removal rates were significantly higher in the summer months, and ~ 4 times lower in winter months. No apparent temporal trend in distribution and total biomass of herbivorous fishes over the 12 months. The pattern was more than simply a change in feeding activity of a single species, but rather it also incorporated changes in which species were responsible for removal of Sargassum. Forty-three species were recorded, but only 3 played a significant role in removal: K. vaigiensis, N. unicornis, S. rivulatus. In the summer, removal was due to K. vaigiensis and hardly any bites were taken in winter months (although it was present in videos). In winter months, there was an increase in S. rivulatus bites which were largely reduced in summer months. Temporal variability in herbivore functional roles suggests functional redundancy on reefs is less than previously assumed because feeding activities are spatially and temporally constrained.
Afeworki et al. 2013
Red Sea Bite rates (bites/min), defecation rates (defecation/min), and yield per bite (mass ingested bite)
Scarus ferrugineus (3 life phases: IP – 20-25 cm; TP – 30-35 cm; Territorial(T) TP – 30-35)
Determine the factors that impact feeding intensity in order to better predict response of grazers to changing conditions.
Bite rates increased over the day, peaking in the afternoon. IP bite rates increased linearly with seawater temperature while TP bite rates had quadratic relationship with water temperature, maximized at 32 degrees. Yield per bite in IP and TP did not differ with time of year. Total daily bites were highest in IP throughout the year and lowest in TTP. Intake and defecation rates peaked from April to July. The quadratic temperature response of TP suggests large individuals may be close to upper thermal limit implying temperature rises are likely to negatively affect large-bodied parrotfishes.

106 Appendix A3 Herbivore grazing rate quantification and studies (cont’d) Authors/ Year
Location Metrics measured Herbivore(s) studied Goal of quantifying herbivory
Findings
Rasher et al. 2013
Fiji Videos of bites on algal transplants
Herbivore assemblage Compare herbivore diversity and quantify herbivory between no-take marine reserves and adjacent fished areas to assess functional redundancy vs. complementarity of herbivorous fish.
Of the herbivorous fish species, only four (Naso lituratus, N. unicornis, Chlorurus sordidus, Scarus argenteus) were noted feeding on macroalgae (accounted for 97% of algal bites) with little overlap between which algal species were consumed. Found negative relationship between herbivore diversity and macroalgal abundance, suggesting support for the idea that high herbivore diversity is necessary to effectively control algae.
Chong-Seng et al. 2014
Seychelles Mass of algae, number of bites, length of fish, abundance of herbivores
Herbivore assemblage detected in videos
Conduct macroalgal assays on reefs in different conditions to determine whether the herbivore function differs.
Assemblage of fish feeding on assays had distinct nMDS patterns. Different species accounted for the majority of bites depending on whether it was a coral-dominated or algal-dominated reef. Naso sp. were more important on algal-dominated reefs. Different abundance of species also found in the different reef conditions.
Hamilton et al. 2014
Palmyra Bite rates, selectivity, foraging impact
Scaridae and Acanthuridae
Quantify herbivory between two reef habitats.
Higher bite rates in predator exposed reef crest habitats. Acanthuridae and Scaridae had different feeding preferences.
Longo et al. 2014
Brazil Feeding pressure, fish composition, evenness of feeding pressure, fish abundance, and biomass
Roving herbivores and territorial herbivores
Make large-scale comparisons between 3 reefs that span 10-degree latitudinal gradient to determine if feeding pressure varies across spatial scales and to identify the species that perform higher feeding pressure than predicted by abundance.
Noted a decline in feeding pressure from north to south driven by a decline in roving herbivores. Feeding pressure was skewed to a few strong scraping species; composition of species and functional groups performing feeding pressure significantly varied among the studied sites. Feeding pressure was not correlated to abundance of species or functional groups, but it was correlated with biomass. Two functional groups represented higher feeding pressure than predicted by biomass: scrapers at northernmost sites and fine browsers (acanthurid species).
McCauley et al. 2014
Palmyra and Tabueran
Bite rates, amount of material removed annually, resource selection ratios
Bolbometopon muricatum
Examine behaviour and feeding ecology of the largest parrotfish and its effects on coral reef diversity/dynamics.
Average bite rate is 3.3 bites/min. Average adult consumes ~4480 kg of material each year. It shows a preference for pocilloporid corals.

107 Appendix A3 Herbivore grazing rate quantification and studies (cont’d) Authors/ Year
Location Metrics measured Herbivore(s) studied Goal of quantifying herbivory
Findings
Longo et al. 2015
Rocas Atoll Mass-standardized bite impact, algal assays, stomach analysis, selectivity
Fish assemblage and Acanthurus sp. diet analysis
Quantify herbivory between open and closed pools.
Herbivorous fishes (Acanthurus sp.) were dominant in closed pools where non-calcified algal turfs were more dominant that calcareous algae (as in open pools). Bite rates of acanthurids were lower in open pools.
Marshell and Mumby 2015
GBR Grazing intensity, grazing impact from tile deployment and video analysis
Acanthuridae, Siganidae, Scaridae
Quantify grazing across a depth and exposure gradient to investigate the role of grazer/detritivore surgeonfish species in maintaining algal turf biomass on coral reefs.
Grazing intensity was greatest where productivity was highest. No differences in bite rates between depths. Grazing was unrelated to standing EAM crop.
Plass-Johnson et al. 2015
Spermonde Archipelago, Indonesia
Algal transplants, fish abundance, macroalgal removal and feeding rates
Herbivore assemblage Experimental test of herbivory (bioassays of Sargassum) to quantify removal of algae by herbivorous fishes along a gradient of impact. Spatial comparison of herbivory along the onshore-offshore gradient from heavily populated to less populated in order to determine the importance of the function on impacted reefs.
On degraded reefs herbivory is maintained by a few key species. Patterns of algal removal and feeding were variable among sites. Herbivore diversity and biomass increased with distance from shore – only a few species noted feeding at all sites, thus only a few robust in maintaining their function under changing environmental conditions.
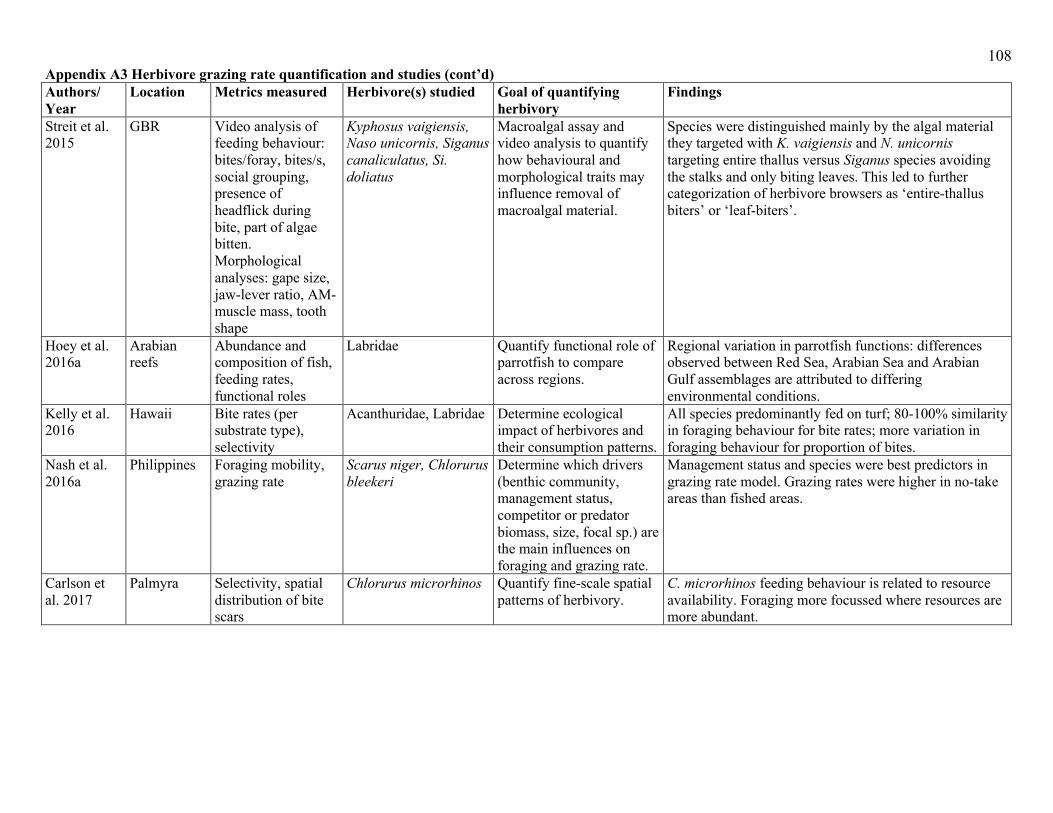
108 Appendix A3 Herbivore grazing rate quantification and studies (cont’d) Authors/ Year
Location Metrics measured Herbivore(s) studied Goal of quantifying herbivory
Findings
Streit et al. 2015
GBR Video analysis of feeding behaviour: bites/foray, bites/s, social grouping, presence of headflick during bite, part of algae bitten. Morphological analyses: gape size, jaw-lever ratio, AM-muscle mass, tooth shape
Kyphosus vaigiensis, Naso unicornis, Siganus canaliculatus, Si. doliatus
Macroalgal assay and video analysis to quantify how behavioural and morphological traits may influence removal of macroalgal material.
Species were distinguished mainly by the algal material they targeted with K. vaigiensis and N. unicornis targeting entire thallus versus Siganus species avoiding the stalks and only biting leaves. This led to further categorization of herbivore browsers as ‘entire-thallus biters’ or ‘leaf-biters’.
Hoey et al. 2016a
Arabian reefs
Abundance and composition of fish, feeding rates, functional roles
Labridae Quantify functional role of parrotfish to compare across regions.
Regional variation in parrotfish functions: differences observed between Red Sea, Arabian Sea and Arabian Gulf assemblages are attributed to differing environmental conditions.
Kelly et al. 2016
Hawaii Bite rates (per substrate type), selectivity
Acanthuridae, Labridae Determine ecological impact of herbivores and their consumption patterns.
All species predominantly fed on turf; 80-100% similarity in foraging behaviour for bite rates; more variation in foraging behaviour for proportion of bites.
Nash et al. 2016a
Philippines Foraging mobility, grazing rate
Scarus niger, Chlorurus bleekeri
Determine which drivers (benthic community, management status, competitor or predator biomass, size, focal sp.) are the main influences on foraging and grazing rate.
Management status and species were best predictors in grazing rate model. Grazing rates were higher in no-take areas than fished areas.
Carlson et al. 2017
Palmyra Selectivity, spatial distribution of bite scars
Chlorurus microrhinos Quantify fine-scale spatial patterns of herbivory.
C. microrhinos feeding behaviour is related to resource availability. Foraging more focussed where resources are more abundant.

109 Appendix A3 Herbivore grazing rate quantification and studies (cont’d) Authors/ Year
Location Metrics measured Herbivore(s) studied Goal of quantifying herbivory
Findings
Davis et al. 2017
Palmyra and Mo’orea
Space use (50 and 90% kernel utilizations), bite rates, fish densities, inter- and intra-specific interactions
Chlorurus spilurus Examine the influence of bottom up (resource abundance and quality), horizontal (competition) and top-down (predation risk) factors on herbivorous foraging behaviours (space use and bite rates)
Feeding rates are influenced by direct interference competition and chronic predation risk, as bite rates were explained by herbivore and piscivore biomass. Space use is primarily related to exploitative competition with surrounding herbivore community, as territory size and core use are best explained by herbivore biomass. Competitive chases occurred between territorial surgeonfishes (A. nigricans, A. lineatus), damselfish and larger TP C. spilurus. Reactions to predators were rare.
Ferguson et al. 2017
West Coast Australia
Fish abundance, videos of bites on algal assays.
Girrellidae, Kyphosidae Quantify abundance, grazing rates, and feeding pathways on reefs inside vs. outside marine reserves.
Marine reserves have no effect on size or abundance of non-targeted herbivores. Rates are consistent across zones and due to site-specific factors rather than effects of protection.
Kelly et al. 2017
Hawaii Bite rates, fish biomass, algal assays for algal growth rate
Grazers, scrapers and browsers
Quantify herbivore consumption to compare with algal production between protected vs. non-protected sites.
Herbivore consumption is lower than algal production, but in the first 5 years of management there is a diminishing margin between them.
Kuempel and Altieri 2017
Panama Benthic % cover, algal assay for algal mass, herbivore exclusion for effect of herbivore presence on algal cover, herbivore rates
Herbivorous fish and urchin assemblage
Experimental manipulation to look at the relationship of algal cover, coral cover and herbivore composition, biomass and presence.
Diminutive species of herbivores (Echinometra viridis urchin and juvenile Scarus iseri) play an important role by exerting sufficient grazing function to pre-empt macroalgal dominance following mass coral mortality. Herbivore presence affected algal biomass, and there was less algae in cages that excluded large, but not small herbivores. Rates of herbivory differed by site, fleshy macroalgae was lower at sites where there was significant herbivore intensity.
Suchley and Alvarez-Filip 2017
Caribbean Bite rates Acanthuridae, Scaridae Herbivore exclusion to quantify the role of herbivory in influencing coral calcification.
Herbivore exclusion had a significant effect on macroalgal cover and coral growth. Herbivory can facilitate coral calcification.
Tebbett et al. 2017a
GBR Video of bites on experimental rocks
Acanthurus nigrofuscus, Ctenochaetus striatus
Clarify functional roles of two herbivores.
C. striatus does not play a functional role in removing algal turfs as the (visually similar) A. nigrofuscus does.

110 Appendix A3 Herbivore grazing rate quantification and studies (cont’d) Authors/ Year
Location Metrics measured Herbivore(s) studied Goal of quantifying herbivory
Findings
Adam et al. 2018
Caribbean Bite rates, food items targeted, foray size
9 species of Scarus and Sparisoma
Comparative analysis of foraging behaviour to determine if parrotfish are one functional group or if species have distinct foraging ecology.
On broad scale, parrotfish genera have different functional roles (Sparisoma vs. Scarus): Sparisoma consume macroalgae and Scarus feed on turf. They target different types of turf assemblages, but also found that even within a genus species exhibit distinct foraging ecology.
Steneck et al. 2018
Caribbean Benthic: abundance of juvenile corals, canopy height of non-encrusting algae, % cover and algal volume, rugosity. Fish: size, density, biomass of important reef species. Quantified grazing pressure from bite rates per species and body size divided by grazeable area (reef complexity index and proportional cover of grazeable substrates).
Scarus iseri, S. taeniopterus, S. vetula, Sparisoma aurofrenatum, Sp. chrysopterum and Sp. viride.
Determine the reserve effects on herbivore grazing pressure, algae and juvenile coral – as a test of the ‘managed resilience hypothesis’ and the cascading effect of management (through fishing restriction) on the base of the ecosystem.
No take reserves had increased herbivore biomass, reduced algal cover and height, and increased abundance of juvenile corals, illustrating the value of managing fish stocks to maintain herbivory. They also noted that loss of coral resulted in algal colonization and reduced the per-area bite rate of local grazers to effectively reduce herbivory (i.e. changes in herbivory are less appreciated if only examining changes in distribution, abundance and biomass).
Eurich et al. 2018
Kimbe Bay, Papua New Guinea
Bite rates (as indication of herbivore foraging pattern), aggressive interactions with damselfish, max N of species in videos, benthic cover
Acanthuridae, Scaridae, Siganidae (roving herbivores); Pomacentrus adelus (territorial damselfish)
Examine the effect of territorial damselfish behaviour and how it influences herbivorous fish foraging activities (through experimental removal of P. adelus)
Damselfish do not exert a strong influence on roving herbivore foraging behaviour. No significant difference in foraging activity for surgeonfish (Acanthuridae), parrotfish (Scaridae) or rabbitfish (Siganidae) between treatments. No difference in herbivore relative abundance following removal of P. adelus.

111 Appendix A3 Herbivore grazing rate quantification and studies (cont’d) Authors/ Year
Location Metrics measured Herbivore(s) studied Goal of quantifying herbivory
Findings
Eggertsen et al. 2019
Mafia Island, Tanzania
Fish and benthic community composition, algal assays to monitor feeding, bite scar dimensions
Acanthuridae, Labridae, Siganidae
Quantify the distribution and foraging patterns of herbivore and detritivore communities across multiple habitats (coral reefs, macroalgal beds and seagrass meadows) and the extent to which patterns are driven by bottom-up processes (to identify habitat variables that are important in structuring reef communities).
The three habitat types had distinct assemblages of species, with different abundances and species compositions. The densities of the functional groups were driven, to a certain extent, by bottom-up processes. Habitat variables that explained fish abundance (such as food resources targeted) differed between habitat types. Fish were observed feeding most in coral reef habitat; scars were higher in number and size in coral reef sites.
Lefcheck et al. 2019
Caribbean Videos of bite rates, visual transects for benthic assessment, turf algal canopy height, density of juvenile corals, urchin density
Herbivore assemblage: Acanthurus bahianus, A. coeruleus, Scarus iseri, S. taeniopterus, S. vetula, Sparisoma aurofrenatum, Sp. chrysopterum, Sp. rubripinne, Sp. viride
1) Evaluate the relationship between herbivore diversity and the process of herbivory. 2) Determine which species contribute to herbivory on the reef. 3) Assess cascading consequences of herbivory and determine whether or not top-down biodiversity effects observed in nature are associated with ecosystem structure.
1) Mass-standardized bite rates (their metric of herbivory) are significantly associated with fish community biomass, alpha diversity and beta diversity, but not coral cover, turf abundance or sea urchin abundance. 2) Four herbivore species independently affect herbivore rates (A. bahianus, A. coeruleus, S. iseri, Sp. aurofrenatum). 3) Turf algal canopy height was negatively correlated with mean grazing rate, which in turn was negatively associated with density of juveniles, thus there is some evidence of a cascading effect of herbivory.

112 Appendix A3 Herbivore grazing rate quantification and studies (cont’d) Authors/ Year
Location Metrics measured Herbivore(s) studied Goal of quantifying herbivory
Findings
Robinson et al. 2019a
72 Indo-Pacific reefs (Seychelles, Maldives, Chagos Archipelago and GBR)
In situ observations of bite rates from Red Sea, Indonesia, and GBR, bite scar dimensions (from following individual biting parrotfish), fish biomass from UVC
Croppers (Acanthuridae and Siganidae); Scrapers (tribe Scarinae)
Integrate feeding observations with biomass data from UVC to calculate the grazing potential of ‘croppers’ and ‘scrapers’ in order to 1) examine how fishing pressure and benthic composition influences grazing rates of these two major feeding groups; 2) examine how grazing rates are controlled by both biomass and size structure of grazing assemblages.
1) Cropper potential grazing function is influenced by benthic, ‘bottom-up’ processes (structural complexity, macroalgal cover, substrate availability for turf); their function is relatively unaffected by fishing. Scraper function on the other hand, is more influenced by fishing (lower where human population and fishing is higher) and less affected by bottom-up processes (except structural complexity is still a significant influence). 2) Fishing and benthic processes influence herbivore functioning through their effect on biomass. For a given level of biomass, assemblages that constitute a majority of smaller-bodied fish have higher grazing rates. Biomass is linked to grazing function, such that protecting fish biomass will help ensure herbivory processes remain intact on degraded coral reefs.
Ruttenberg et al. 2019
Caribbean Bite rates, bite area, bite volume, fish densities
Scarus coelestinus, S. coeruleus, S. guacamaia, S. iseri, S. taeniopterus, S. vetula, Sparisoma aurofrenatum, Sp. chrysopterum, Sp. rubripinne, Sp. viride
Explore how species identity controls ecological processes among habitats and across multiple spatial scales.
Community composition was more important than biomass for estimating herbivory. Ecological processes of herbivory (i.e. macroalgal consumption, areal grazing, scraping, and bioerosion) was driven by species density and identity. Found evidence of ‘zonation’ with different functional groups dominating in different habitats. Biomass was not as important for estimating herbivory.

113
Appendix B - Supplemental tables and figures for Chapter 2
Table B1 Number of herbivore feeding observations made by each
scientific diver in each year, ordered from greatest to least.
Observer 2013 2015 2017 Total
SD - 208 319 527
SC 191 229 - 420
TAP - - 411 411
JKB 215 - - 215
TB 199 - - 199
JLG 151 - - 151
MW 61 - - 61
Total 817 437 730 1984

114
Table B2 Species-specific regression equations used for calculating individual gape heights and gape
widths used in the grazing impact models. Estimated gape area was calculated (to approximate the area of a
circle) as π × ½ gape height × ½ gape width. Species are arranged alphabetically within functional groups
(FG; B=browser, E=excavator, G=grazer, S=scraper).
FG Family Species Gape height Gape width Source B Scaridae Calotomus carolinus 1.4 x – 1.9 1.3 x – 1.8 Regression equations
of S. frenatus
E Scaridae Chlorurus sordidus 1.2 x – 1.4 1.2 x – 1.6 Dunic & Baum (2017)1
G Acanthuridae
Acanthurus achilles, A. leucocheilus, A. lineatus, A. nigricauda, A. nigrofuscus, A. nigroris, A. triostegus, A. xanthopterus
1.35 x – 1.8 1.15 x – 1.6 Average of A. nigricans and A. olivaceus
A. nigricans 1.4 x – 1.9 1.1 x – 1.5 Dunic & Baum (2017)
A. olivaceus 1.3 x – 1.7 1.2 x – 1.7 Dunic & Baum (2017)
S Scaridae Scarus frenatus 1.4 x – 1.9 1.3 x – 1.8 Dunic & Baum (2017)
S. forsteni, S. ghobban, S. globiceps, S. oviceps, S. psittacus, S. tricolor
1.4 x – 1.9 1.25 x – 1.7 Average of S. frenatus and S. rubroviolaceus
S. rubroviolaceus 1.4 x – 1.9 1.2 x – 1.6 Dunic & Baum (2017)
1 Dunic JC, Baum JK (2017) Size structuring and allometric scaling relationships in coral reef fishes. J Anim Ecol 86:577-589.

115
Figure B1 Bite rate by size for (a) all herbivores and (b) the 13 most commonly observed species on
Kiritimati.

116
Figure B2 Grazing impact by size for (a) all herbivores and (b) the 13 most commonly observed
species on Kiritimati.

117 Table B3 Overall mean (± SE) and substrate-specific mean bite rates (bites min-1) for each surgeonfish (family Acanthuridae) and parrotfish (family
Scaridae) species, averaged across sites and years. FG is functional group (B=browser, E=excavator, G=grazer, S=scraper), and N is the number of
observations used to calculate bite rate. Substrates are ordered left to right from most to least bitten on average. The bottom row indicates the mean (±
SE) substrate-specific bite rates averaged across species. FG Species N Overall rate Turf Caulerpa CCA Halimeda Coral Lobophora Galaxaura Mesopora B Calotomus
carolinus 86 6.7 ± 0.49 3.6 ± 0.51 2.36 ± 0.37 0.02 ± 0.02 1.26 ± 0.19 0.04 ± 0.02 0.15 ± 0.1 0 ± 0 0 ± 0
E Chlorurus sordidus
430 13.47 ± 0.3 12.72 ± 0.37
0.2 ± 0.05 1.11 ± 0.12 0.22 ± 0.03 0.21 ± 0.03 0.04 ± 0.04 0 ± 0 0 ± 0
G
Acanthurus nigricauda
37 51.53 ± 4.15 51.56 ± 4.4 0.13 ± 0.12 0 ± 0 0.15 ± 0.13 0.05 ± 0.04 0 ± 0 0 ± 0 0 ± 0
A. olivaceus 52 46.02 ± 3.68 46.95 ± 4.15
0.14 ± 0.14 0 ± 0 0.17 ± 0.12 0.25 ± 0.25 0 ± 0 0 ± 0 0 ± 0
A. achilles 31 30.04 ± 3.57 32.67 ± 4.66
0.1 ± 0.08 0.14 ± 0.1 0.05 ± 0.03 0.04 ± 0.03 0 ± 0 0 ± 0 0 ± 0
A. nigricans 457 28.01 ± 0.78 29.09 ± 0.9 0.06 ± 0.01 0.03 ± 0.01 0.05 ± 0.01 0.05 ± 0.01 0 ± 0 0.02 ± 0.01 0 ± 0
A. lineatus 37 14.43 ± 1.44 16.96 ± 1.99
0.02 ± 0.02 0.01 ± 0.01 0.03 ± 0.02 0.1 ± 0.06 0 ± 0 0 ± 0 0 ± 0
S
Scarus psittacus
44 27.73 ± 2.34 29.43 ± 2.98
1.37 ± 0.51 0 ± 0 0.11 ± 0.05 0 ± 0 0 ± 0 0.01 ± 0.01 0 ± 0
S. tricolor 118 20.25 ± 0.95 19.46 ± 1.17
0.32 ± 0.09 0.16 ± 0.07 0.39 ± 0.09 0.27 ± 0.07 0 ± 0 0 ± 0 0.01 ± 0.01
S. globiceps 25 18.87 ± 3.63 21.02 ± 4.13
0 ± 0 0 ± 0 0 ± 0 0 ± 0 0 ± 0 0 ± 0 0 ± 0
S. frenatus 318 15.24 ± 0.41 15.86 ± 0.53
0.44 ± 0.07 0.47 ± 0.1 0.23 ± 0.03 0.36 ± 0.05 0 ± 0 0 ± 0 0 ± 0
S. ghobban 87 12.7 ± 0.96 11.02 ± 1.01
1.36 ± 0.33 0.02 ± 0.01 0.69 ± 0.23 0.07 ± 0.04 0 ± 0 0 ± 0 0 ± 0
S. rubroviolaceus
220 12.26 ± 0.58 12.31 ± 0.64
0.28 ± 0.06 0.13 ± 0.04 0.26 ± 0.07 0.15 ± 0.03 0.01 ± 0.01 0 ± 0 0 ± 0
Total 1942 Substrate average
19.51 ± 0.39
0.39 ± 0.03 0.36 ± 0.03 0.25 ± 0.02 0.16 ± 0.01 0.02 ± 0.01 0.01 ± 0 0 ± 0
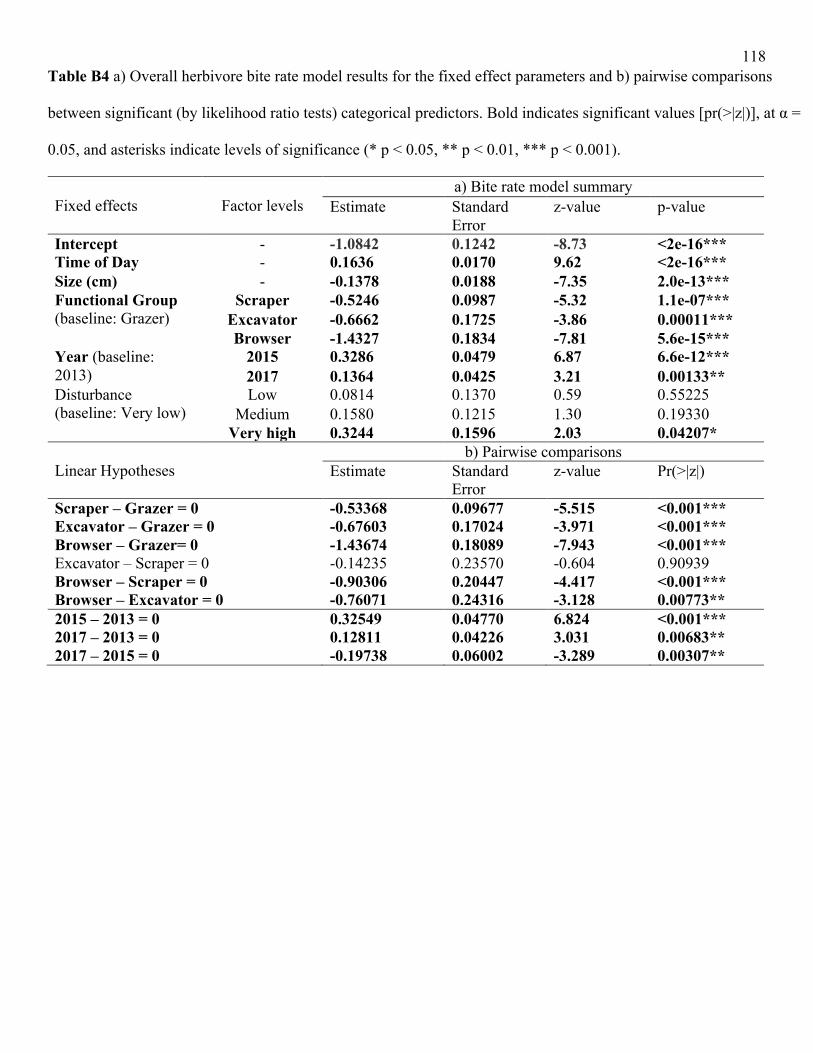
118
Table B4 a) Overall herbivore bite rate model results for the fixed effect parameters and b) pairwise comparisons
between significant (by likelihood ratio tests) categorical predictors. Bold indicates significant values [pr(>|z|)], at α =
0.05, and asterisks indicate levels of significance (* p < 0.05, ** p < 0.01, *** p < 0.001).
Fixed effects Factor levels
a) Bite rate model summary
Estimate Standard Error
z-value p-value
Intercept - -1.0842 0.1242 -8.73 <2e-16*** Time of Day - 0.1636 0.0170 9.62 <2e-16*** Size (cm) - -0.1378 0.0188 -7.35 2.0e-13*** Functional Group (baseline: Grazer)
Scraper -0.5246 0.0987 -5.32 1.1e-07*** Excavator -0.6662 0.1725 -3.86 0.00011*** Browser -1.4327 0.1834 -7.81 5.6e-15***
Year (baseline: 2013)
2015 0.3286 0.0479 6.87 6.6e-12*** 2017 0.1364 0.0425 3.21 0.00133**
Disturbance (baseline: Very low)
Low 0.0814 0.1370 0.59 0.55225
Medium 0.1580 0.1215 1.30 0.19330
Very high 0.3244 0.1596 2.03 0.04207*
Linear Hypotheses
b) Pairwise comparisons Estimate Standard
Error z-value Pr(>|z|)
Scraper – Grazer = 0 -0.53368 0.09677 -5.515 <0.001*** Excavator – Grazer = 0 -0.67603 0.17024 -3.971 <0.001*** Browser – Grazer= 0 -1.43674 0.18089 -7.943 <0.001*** Excavator – Scraper = 0 -0.14235 0.23570 -0.604 0.90939 Browser – Scraper = 0 -0.90306 0.20447 -4.417 <0.001*** Browser – Excavator = 0 -0.76071 0.24316 -3.128 0.00773** 2015 – 2013 = 0 0.32549 0.04770 6.824 <0.001*** 2017 – 2013 = 0 0.12811 0.04226 3.031 0.00683** 2017 – 2015 = 0 -0.19738 0.06002 -3.289 0.00307**
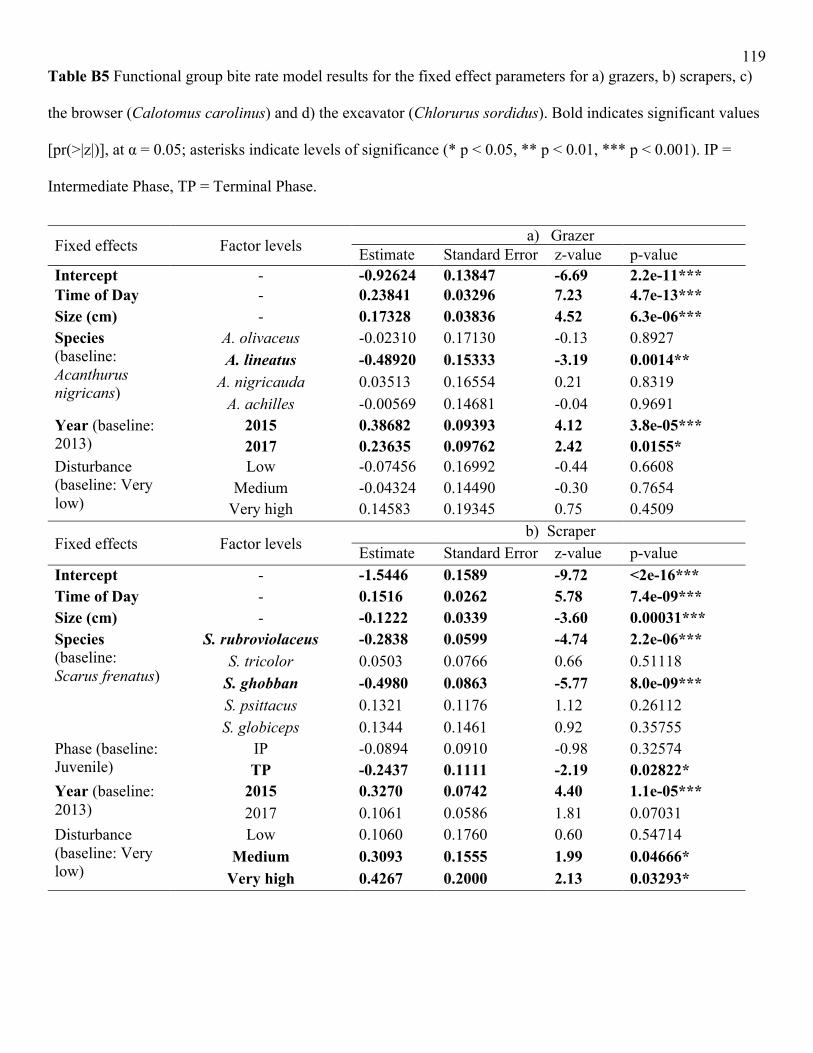
119
Table B5 Functional group bite rate model results for the fixed effect parameters for a) grazers, b) scrapers, c)
the browser (Calotomus carolinus) and d) the excavator (Chlorurus sordidus). Bold indicates significant values
[pr(>|z|)], at α = 0.05; asterisks indicate levels of significance (* p < 0.05, ** p < 0.01, *** p < 0.001). IP =
Intermediate Phase, TP = Terminal Phase.
Fixed effects Factor levels a) Grazer
Estimate Standard Error z-value p-value
Intercept - -0.92624 0.13847 -6.69 2.2e-11*** Time of Day - 0.23841 0.03296 7.23 4.7e-13*** Size (cm) - 0.17328 0.03836 4.52 6.3e-06*** Species (baseline: Acanthurus nigricans)
A. olivaceus -0.02310 0.17130 -0.13 0.8927 A. lineatus -0.48920 0.15333 -3.19 0.0014**
A. nigricauda 0.03513 0.16554 0.21 0.8319 A. achilles -0.00569 0.14681 -0.04 0.9691
Year (baseline: 2013)
2015 0.38682 0.09393 4.12 3.8e-05*** 2017 0.23635 0.09762 2.42 0.0155*
Disturbance (baseline: Very low)
Low -0.07456 0.16992 -0.44 0.6608
Medium -0.04324 0.14490 -0.30 0.7654
Very high 0.14583 0.19345 0.75 0.4509
Fixed effects Factor levels b) Scraper
Estimate Standard Error z-value p-value
Intercept - -1.5446 0.1589 -9.72 <2e-16***
Time of Day - 0.1516 0.0262 5.78 7.4e-09***
Size (cm) - -0.1222 0.0339 -3.60 0.00031***
Species (baseline: Scarus frenatus)
S. rubroviolaceus -0.2838 0.0599 -4.74 2.2e-06***
S. tricolor 0.0503 0.0766 0.66 0.51118
S. ghobban -0.4980 0.0863 -5.77 8.0e-09***
S. psittacus 0.1321 0.1176 1.12 0.26112
S. globiceps 0.1344 0.1461 0.92 0.35755
Phase (baseline: Juvenile)
IP -0.0894 0.0910 -0.98 0.32574
TP -0.2437 0.1111 -2.19 0.02822*
Year (baseline: 2013)
2015 0.3270 0.0742 4.40 1.1e-05***
2017 0.1061 0.0586 1.81 0.07031
Disturbance (baseline: Very low)
Low 0.1060 0.1760 0.60 0.54714
Medium 0.3093 0.1555 1.99 0.04666*
Very high 0.4267 0.2000 2.13 0.03293*

120
Table B5 (cont’d)
Fixed effects Factor levels c) Browser
Estimate Standard Error z-value p-value
Intercept - -2.7134 0.4322 -6.28 3.4e-10*** Time of Day - 0.0679 0.0891 0.76 0.45 Size (cm) - -0.1988 0.1648 -1.21 0.23 Phase (baseline: Juvenile)
IP 0.2570 0.3510 0.73 0.46
TP 0.0284 0.4592 0.06 0.95 Year (baseline: 2013)
2015 0.3826 0.7813 0.49 0.62 2017 0.2516 0.2417 1.04 0.30
Disturbance (baseline: Very low)
Low -0.1215 0.4123 -0.29 0.77
Medium 0.2292 0.2608 0.88 0.38
Very high 0.0617 0.3156 0.20 0.85
Fixed effects Factor levels d) Excavator
Estimate Standard Error z-value p-value
Intercept - -1.49802 0.14877 -10.07 <2e-16*** Time of Day - 0.12472 0.02589 4.82 1.5e-06*** Size (cm) - -0.03693 0.03783 -0.98 0.329 Phase (baseline: Juvenile)
IP 0.03309 0.12225 0.27 0.787
TP -0.19034 0.15137 -1.26 0.209 Year (baseline: 2013)
2015 0.14703 0.07314 2.01 0.044* 2017 -0.03152 0.06177 -0.51 0.610
Disturbance (baseline: Very low)
Low 0.04618 0.10103 0.46 0.648
Medium -0.00498 0.08804 -0.06 0.955
Very high 0.26046 0.14885 1.75 0.080

121
Table B6 Results of pairwise comparisons between significant (by likelihood ratio tests) categorical predictors
for the a) grazer, and b) scraper bite rate models. Bolded values indicate significant pairwise differences
[pr(>|z|)], at α = 0.05 and asterisks indicate levels of significance (* p < 0.05, ** p < 0.01, *** p < 0.001).
Linear Hypotheses
a) Grazer
Estimate Standard Error z-value Pr(>|z|)
A. olivaceus – A. nigricans = 0 -0.023098
0.171300 -0.135 0.9999
A. lineatus – A. nigricans = 0 -0.489199 0.153330 -3.190 0.0113* A. nigricauda – A. nigricans = 0 0.035131 0.165540 0.212 0.9995
A. achilles – A. nigricans = 0 -0.005694 0.146810 -0.039 1.0000
A. lineatus – A. olivaceus = 0 -0.466101 0.242856 -1.919 0.2856
A. nigricauda – A. olivaceus = 0 0.058229 0.189336 -0.308 0.9978
A. achilles – A. olivaceus = 0 0.017404 0.209908 0.083 1.0000
A. nigricauda – A. lineatus = 0 0.524330 0.234489 2.236 0.1521
A. achilles – A. lineatus = 0 0.483505 0.212334 2.277 0.1396
A. achilles – A. nigricauda = 0 -0.040825 0.205439 -0.199 0.9996
2015 – 2013 = 0 0.38682 0.09393 4.118 <0.001*** 2017 – 2013 = 0 0.23635 0.09762 2.421 0.0398* 2017 – 2015 = 0 -0.15047 0.12085 -1.245 0.4211
Linear Hypotheses b) Scraper
Estimate Standard Error z-value Pr(>|z|)
S. rubroviolaceus – S. frenatus = 0 -0.283782 0.059904 -4.737 <0.001***
S. tricolor – S. frenatus = 0 0.050303 0.076565 0.657 0.98376
S. ghobban – S. frenatus = 0 -0.497958 0.086315 -5.769 <0.001***
S. psittacus – S. frenatus = 0 0.132119 0.117570 1.124 0.85317
S. globiceps – S. frenatus = 0 0.134445 0.146130 0.920 0.93157
S. tricolor – S. rubroviolaceus = 0 0.334085 0.097502 3.426 0.00697**
S. ghobban – S. rubroviolaceus = 0 -0.214177 0.104923 -2.041 0.28908
S. psittacus – S. rubroviolaceus = 0 0.415901 0.132797 3.132 0.01872*
S. globiceps – S. rubroviolaceus = 0 0.418227 0.159630 2.620 0.08083
S. ghobban – S. tricolor = 0 -0.548261 0.097552 -5.620 <0.001***
S. psittacus – S. tricolor = 0 0.081816 0.117003 0.699 0.97857
S. globiceps – S. tricolor = 0 0.084143 0.157500 0.534 0.99369
S. psittacus – S. ghobban = 0 0.630078 0.109441 5.757 <0.001***
S. globiceps – S. ghobban = 0 0.632404 0.161968 3.904 0.00120** S. globiceps – S. psittacus= 0 0.002326 0.179772 0.013 1.00000 2015 – 2013 = 0 0.32701 0.07424 4.405 <0.001***
2017 – 2013 = 0 0.10611 0.05862 1.810 0.1532 2017 – 2015 = 0 -0.22091 0.09866 -2.239 0.0589

122
Table B7 Results of likelihood ratio tests for our categorical predictors included in models (without size) of
herbivore bite rates overall and each functional group (FG). Bolded values indicate significant pairwise
differences [pr(>|z|)], at α = 0.05 and asterisks indicate levels of significance (* p < 0.05, ** p < 0.01, *** p <
0.001).
Response Model Predictor DF Deviance Pr(>Chi) Significant pairwise
Bite Rates
Overall
FG 3 27 5.89e-06 *** Grazer > All FG; Browser < Scraper
Year 2 40.2 1.87e-09 *** 2015 > 2013; 2017 > 2013
Disturbance 3 4.6 0.2035
Grazer
Species 4 8.26 0.08251
Year 2 14.66 0.0006556 *** 2015 > 2013; 2017 > 2013
Disturbance 3 1.64 0.6504
Scraper
Species 5 84.88 <2.2e-16 *** S. ghobban and S. rubroviolaceus < all other species except each other
Phase 3 41.38 5.43e-09 *** IP and TP > J
Year 2 16.92 0.002118 *** 2015 > 2013
Disturbance 3 6.06 0.1087
Browser
Phase 3 4.658 0.1986
Year 2 1.454 0.4834
Disturbance 3 2.144 0.5431
Excavator
Phase 3 32.36 4.39e-07 *** Pairwise differences are not significant
Year 2 5.8 0.05502
Disturbance 3 4.16 0.2447
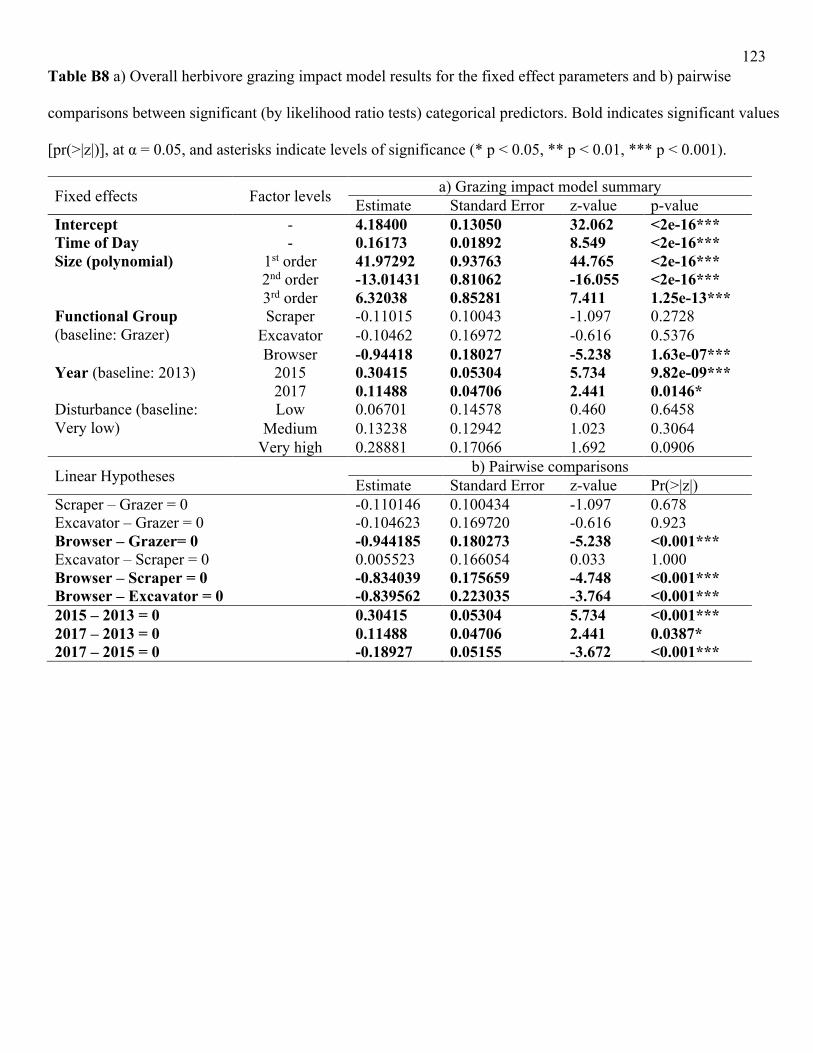
123
Table B8 a) Overall herbivore grazing impact model results for the fixed effect parameters and b) pairwise
comparisons between significant (by likelihood ratio tests) categorical predictors. Bold indicates significant values
[pr(>|z|)], at α = 0.05, and asterisks indicate levels of significance (* p < 0.05, ** p < 0.01, *** p < 0.001).
Fixed effects Factor levels a) Grazing impact model summary
Estimate Standard Error z-value p-value
Intercept - 4.18400 0.13050 32.062 <2e-16*** Time of Day - 0.16173 0.01892 8.549 <2e-16*** Size (polynomial) 1st order 41.97292 0.93763 44.765 <2e-16*** 2nd order -13.01431 0.81062 -16.055 <2e-16*** 3rd order 6.32038 0.85281 7.411 1.25e-13*** Functional Group (baseline: Grazer)
Scraper -0.11015 0.10043 -1.097 0.2728
Excavator -0.10462 0.16972 -0.616 0.5376
Browser -0.94418 0.18027 -5.238 1.63e-07*** Year (baseline: 2013) 2015 0.30415 0.05304 5.734 9.82e-09*** 2017 0.11488 0.04706 2.441 0.0146* Disturbance (baseline: Very low)
Low 0.06701 0.14578 0.460 0.6458
Medium 0.13238 0.12942 1.023 0.3064
Very high 0.28881 0.17066 1.692 0.0906
Linear Hypotheses b) Pairwise comparisons
Estimate Standard Error z-value Pr(>|z|)
Scraper – Grazer = 0 -0.110146 0.100434 -1.097 0.678 Excavator – Grazer = 0 -0.104623 0.169720 -0.616 0.923 Browser – Grazer= 0 -0.944185 0.180273 -5.238 <0.001*** Excavator – Scraper = 0 0.005523 0.166054 0.033 1.000 Browser – Scraper = 0 -0.834039 0.175659 -4.748 <0.001*** Browser – Excavator = 0 -0.839562 0.223035 -3.764 <0.001***
2015 – 2013 = 0 0.30415 0.05304 5.734 <0.001*** 2017 – 2013 = 0 0.11488 0.04706 2.441 0.0387* 2017 – 2015 = 0 -0.18927 0.05155 -3.672 <0.001***

124
Table B9 Functional group grazing impact model results for the fixed effect parameters for a) grazers, b)
scrapers, c) the browser (Calotomus carolinus) and d) the excavator (Chlorurus sordidus). Bold indicates
significant values [pr(>|z|)], at α = 0.05, and asterisks indicate levels of significance (* p < 0.05, ** p < 0.01,
*** p < 0.001). IP = Intermediate Phase, TP = Terminal Phase.
Fixed effects Factor levels
a) Grazer
Estimate Standard Error
z-value p-value
Intercept - 3.79023 0.15423 24.575 <2e-16*** Time of Day - 0.24154 0.03387 7.132 9.86e-13*** Size (polynomial) 1st order 18.55216 0.90118 20.587 <2e-16***
2nd order -5.38991 0.71612 -7.527 5.21e-14*** 3rd order 1.61757 0.73938 2.188 0.02869*
Species (baseline: Acanthurus nigricans)
A. olivaceus -0.41977 0.18081 -2.322 0.02026* A. lineatus -0.47195 0.15616 -3.022 0.00251**
A. nigricauda -0.37590 0.17632 -2.132 0.03302* A. achilles -0.01802 0.15086 -0.119 0.90492
Year (baseline: 2013)
2015 0.40804 0.09615 4.244 2.20e-05*** 2017 0.24545 0.10100 2.430 0.01510*
Disturbance (baseline: Very low)
Low -0.02643 0.19700 -0.134 0.89329 Medium -0.03026 0.16792 -0.180 0.85701
Very high 0.14772 0.22698 0.651 0.51516
Fixed effects Factor levels b) Scraper
Estimate Standard Error
z-value p-value
Intercept - 4.366460 0.207812 21.012 <2e-16*** Time of Day - 0.153536 0.031990 4.800 1.59e-06*** Size (polynomial) 1st order 29.375688 1.293925 22.703 <2e-16***
2nd order -8.946772 1.143116 -7.827 5.01e-15*** 3rd order 3.400508 1.046242 3.250 0.001153**
Species (baseline: Scarus frenatus)
S. rubroviolaceus -0.033643 0.074667 -0.451 0.652297 S. tricolor 0.359164 0.094859 3.786 0.000153***
S. ghobban -0.279081 0.106077 -2.631 0.008515** S. psittacus 0.366352 0.148070 2.474 0.013354* S. globiceps 0.421706 0.181649 2.322 0.020258*
Phase (baseline: Juvenile)
IP 0.003844 0.164540 0.023 0.981360 TP -0.141404 0.175791 -0.804 0.421175
Year (baseline: 2013)
2015 0.320663 0.091468 3.506 0.000455***
2017 0.087469 0.071922 1.216 0.223921 Disturbance (baseline: Very low)
Low 0.074529 0.190975 0.390 0.696349 Medium 0.290247 0.168562 1.722 0.085087
Very high 0.403161 0.216509 1.862 0.062589

125
Table B9 (cont’d)
Fixed effects Factor levels c) Browser
Estimate Standard Error
z-value p-value
Intercept - 2.60856 0.63018 4.139 3.48e-05*** Time of Day - 0.06907 0.10232 0.675 0.4996 Size (polynomial) 1st order 9.48035 2.02144 4.690 2.73e-06***
2nd order -2.40896 1.27471 -1.890 0.0588
3rd order 0.57436 0.84436 0.680 0.4964 Phase (baseline: Juvenile)
IP 0.27208 0.57061 0.477 0.6335 TP 0.02712 0.64462 0.042 0.9664
Year (baseline: 2013)
2015 0.37899 0.85750 0.442 0.6585
2017 0.23979 0.26769 0.896 0.3704 Disturbance (baseline: Very low)
Low -0.12477 0.46141 -0.270 0.7868
Medium 0.22623 0.30291 0.747 0.4552
Very high 0.06435 0.36378 0.177 0.8596
Fixed effects Factor levels d) Excavator
Estimate Standard Error
z-value p-value
Intercept - 4.26241 0.18437 23.119 <2e-16*** Time of Day - 0.12535 0.02940 4.263 2.01e-05*** Size (polynomial) 1st order 16.50263 0.90895 18.156 <2e-16***
2nd order -3.11313 0.61023 -5.102 3.37e-07***
3rd order 1.12024 0.64246 1.744 0.0812 Phase (baseline: Juvenile)
IP 0.13091 0.15891 0.824 0.4101
TP -0.08970 0.18143 -0.494 0.6210 Year (baseline: 2013)
2015 0.15744 0.08568 1.838 0.0661
2017 -0.03032 0.07156 -0.424 0.6717 Disturbance (baseline: Very low)
Low 0.04098 0.12896 0.318 0.7507 Medium -0.01209 0.11305 -0.107 0.9148
Very high 0.26618 0.18576 1.433 0.1519

126
Table B10 Results of pairwise comparisons between significant (by likelihood ratio tests) categorical predictors
for the a) grazer, and b) scraper grazing impact models. Bolded values indicate a significant pairwise difference
[pr(>|z|)], at α = 0.05 and asterisks indicate levels of significance (* p < 0.05, ** p < 0.01, *** p < 0.001).
Linear Hypotheses a) Grazer
Estimate Standard Error z-value Pr(>|z|) A. olivaceus – A. nigricans = 0 -0.41977 0.18081 -2.322 0.1304
A. lineatus – A. nigricans = 0 -0.47195 0.15616 -3.022 0.0198* A. nigricauda – A. nigricans = 0 -0.37590 0.17632 -2.132 0.1963
A. achilles – A. nigricans = 0 -0.01802 0.15086 -0.119 1.0000
A. lineatus – A. olivaceus = 0 -0.05219 0.22895 -0.228 0.9994
A. nigricauda – A. olivaceus = 0 0.04387 0.16111 0.272 0.9987
A. achilles – A. olivaceus = 0 0.40175 0.20220 1.987 0.2599
A. nigricauda – A. lineatus = 0 0.09606 0.22395 0.429 0.9924
A. achilles – A. lineatus = 0 0.45393 0.19761 2.297 0.1379
A. achilles – A. nigricauda = 0 0.35788 0.20182 1.773 0.3744
2015 – 2013 = 0 0.40804 0.09615 4.244 <1e-04*** 2017 – 2013 = 0 0.24545 0.10100 2.430 0.0396* 2017 – 2015 = 0 -0.16259 0.08368 -1.943 0.1258
Linear Hypotheses
b) Scraper
Estimate Standard Error z-value Pr(>|z|)
S. rubroviolaceus – S. frenatus = 0 -0.033643 0.074667 -0.451 0.99735
S. tricolor – S. frenatus = 0 0.359164 0.094859 3.786 0.00179**
S. ghobban – S. frenatus = 0 -0.279081 0.106077 -2.631 0.08044
S. psittacus – S. frenatus = 0 0.366352 0.148070 2.474 0.11873
S. globiceps – S. frenatus = 0 0.421706 0.181649 2.322 0.16877
S. tricolor – S. rubroviolaceus = 0 0.392807 0.103126 3.809 0.00162**
S. ghobban – S. rubroviolaceus = 0 -0.245438 0.105208 -2.333 0.16453
S. psittacus – S. rubroviolaceus = 0 0.399995 0.152108 2.630 0.08073
S. globiceps – S. rubroviolaceus = 0 0.455349 0.191457 2.378 0.14876
S. ghobban – S. tricolor = 0 -0.638245 0.118921 -5.367 <0.001***
S. psittacus – S. tricolor = 0 0.007188 0.148438 0.048 1.00000
S. globiceps – S. tricolor = 0 0.062542 0.188741 0.331 0.99940
S. psittacus – S. ghobban = 0 0.645433 0.163293 3.953 0.00103**
S. globiceps – S. ghobban = 0 0.700787 0.198513 3.530 0.00501** S. globiceps – S. psittacus= 0 0.055354 0.214655 0.258 0.99982 2015 – 2013 = 0 0.32066 0.09147 3.506 0.00134**
2017 – 2013 = 0 0.08747 0.07192 1.216 0.44061 2017 – 2015 = 0 -0.23319 0.09283 -2.512 0.03144*

127
Table B11 Results of likelihood ratio tests for our categorical predictors included in models (without size) of
herbivore grazing impact overall and each functional group. Bolded values indicate significant pairwise
differences [pr(>|z|)], at α = 0.05 and asterisks indicate levels of significance (* p < 0.05, ** p < 0.01, *** p <
0.001).
Response Model Predictor DF Deviance Pr(>Chi) Significant pairwise
Grazing Impact
Overall
FG 3 15.85 0.001218 ** Scraper > Grazer and Browser
Year 2 46.68 1.63e-11 *** 2015 > 2013; 2015 > 2017
Disturbance 3 0.586 0.8996
Grazer
Species 4 18.57 0.0009554 *** A. nigricauda > A. nigricans
Year 2 5.251 0.0724
Disturbance 3 2.434 0.4874
Scraper
Species 5 35.54 1.17e-06 ***
S. psittacus < all other species except S. globiceps; S. rubroviolaceus > S. psittacus and S. globiceps
Phase 3 235.9 <2.2e-16 *** TP > IP > J
Year 2 26.74 1.56e-06 *** 2015 > 2013; 2015 > 2017
Disturbance 3 1.621 0.6548
Browser
Phase 3 51.56 3.73e-11 *** IP and TP > J
Year 2 0.056 0.9725
Disturbance 3 4.264 2.34e-01
Excavator
Phase 3 164.8 <2.2e-16 *** TP > IP > J
Year 2 15.67 3.96e-04 *** 2015 > 2013; 2015 > 2017
Disturbance 3 1.222 0.7476

128 Table B12 Average (± SE) substrate-specific selectivity (Manly’s α) observed for surgeonfish (family Acanthuridae) and parrotfish (family Scaridae)
species from three years of recorded feeding observations and benthic cover. FG is the functional group; N is the number of observations used to average
selectivity values. Substrates are ordered left to right by preference.
FG Species Year N Turf Macroalgae CCA Coral Grazer
Acanthurus achilles
2013 21 0.972 ± 0.01 0.022 ± 0.01 0.006 ± 0 0 ± 0 2015 3 1 ± 0 0 ± 0 0 ± 0 0 ± 0
Acanthurus lineatus
2013 19 0.984 ± 0.01 0.014 ± 0.01 0.001 ± 0 0.001 ± 0 2015 7 1 ± 0 0 ± 0 0 ± 0 0 ± 0
Acanthurus nigricans
2013 147 0.977 ± 0.01 0.018 ± 0.01 0.002 ± 0 0.002 ± 0 2015 132 0.971 ± 0.01 0.014 ± 0.01 0.014 ± 0.01 0 ± 0 2017 86 0.956 ± 0.02 0.043 ± 0.02 0.002 ± 0 0 ± 0
Acanthurus nigricauda
2013 5 0.799 ± 0.2 0.201 ± 0.2 0 ± 0 0 ± 0 2015 27 0.992 ± 0.01 0.007 ± 0.01 0 ± 0 0.001 ± 0
Acanthurus olivaceus
2013 4 0.84 ± 0.16 0.14 ± 0.14 0 ± 0 0.02 ± 0.02 2015 28 0.933 ± 0.03 0.067 ± 0.03 0 ± 0 0 ± 0 2017 11 1 ± 0 0 ± 0 0 ± 0 0 ± 0
Scraper
Scarus frenatus
2013 146 0.874 ± 0.02 0.079 ± 0.01 0.035 ± 0.01 0.013 ± 0 2015 38 0.852 ± 0.04 0.008 ± 0.01 0.103 ± 0.04 0.038 ± 0.01 2017 90 0.897 ± 0.02 0.044 ± 0.01 0.036 ± 0.01 0.022 ± 0.01
Scarus ghobban
2013 28 0.774 ± 0.05 0.222 ± 0.05 0.002 ± 0 0.002 ± 0 2015 16 0.936 ± 0.04 0.034 ± 0.03 0.011 ± 0.01 0.019 ± 0.01 2017 31 0.837 ± 0.05 0.163 ± 0.05 0 ± 0 0 ± 0
Scarus globiceps
2013 7 1 ± 0 0 ± 0 0 ± 0 0 ± 0 2015 8 1 ± 0 0 ± 0 0 ± 0 0 ± 0
Scarus psittacus
2013 10 0.951 ± 0.04 0.049 ± 0.04 0 ± 0 0 ± 0 2015 4 1 ± 0 0 ± 0 0 ± 0 0 ± 0 2017 23 0.868 ± 0.05 0.132 ± 0.05 0 ± 0 0 ± 0
Scarus rubroviolaceus
2013 61 0.955 ± 0.01 0.032 ± 0.01 0.01 ± 0.01 0.003 ± 0 2015 30 0.859 ± 0.05 0.024 ± 0.02 0.076 ± 0.04 0.041 ± 0.02 2017 89 0.878 ± 0.02 0.066 ± 0.02 0.015 ± 0.01 0.041 ± 0.02
Scarus tricolor
2013 62 0.85 ± 0.03 0.129 ± 0.03 0.01 ± 0.01 0.011 ± 0 2015 10 0.916 ± 0.08 0 ± 0 0 ± 0 0.084 ± 0.08 2017 32 0.868 ± 0.04 0.088 ± 0.03 0.024 ± 0.02 0.021 ± 0.01
Excavator
Chlorurus sordidus
2013 191 0.861 ± 0.02 0.036 ± 0.01 0.098 ± 0.01 0.006 ± 0 2015 72 0.707 ± 0.04 0.027 ± 0.02 0.254 ± 0.04 0.011 ± 0 2017 109 0.824 ± 0.03 0.062 ± 0.01 0.094 ± 0.02 0.021 ± 0.01
Browser
Calotomus carolinus
2013 13 0.42 ± 0.12 0.58 ± 0.12 0 ± 0 0 ± 0 2015 1 0.522 ± 0 0 ± 0 0.345 ± 0 0.133 ± 0 2017 52 0.478 ± 0.06 0.495 ± 0.06 0 ± 0 0.027 ± 0.02
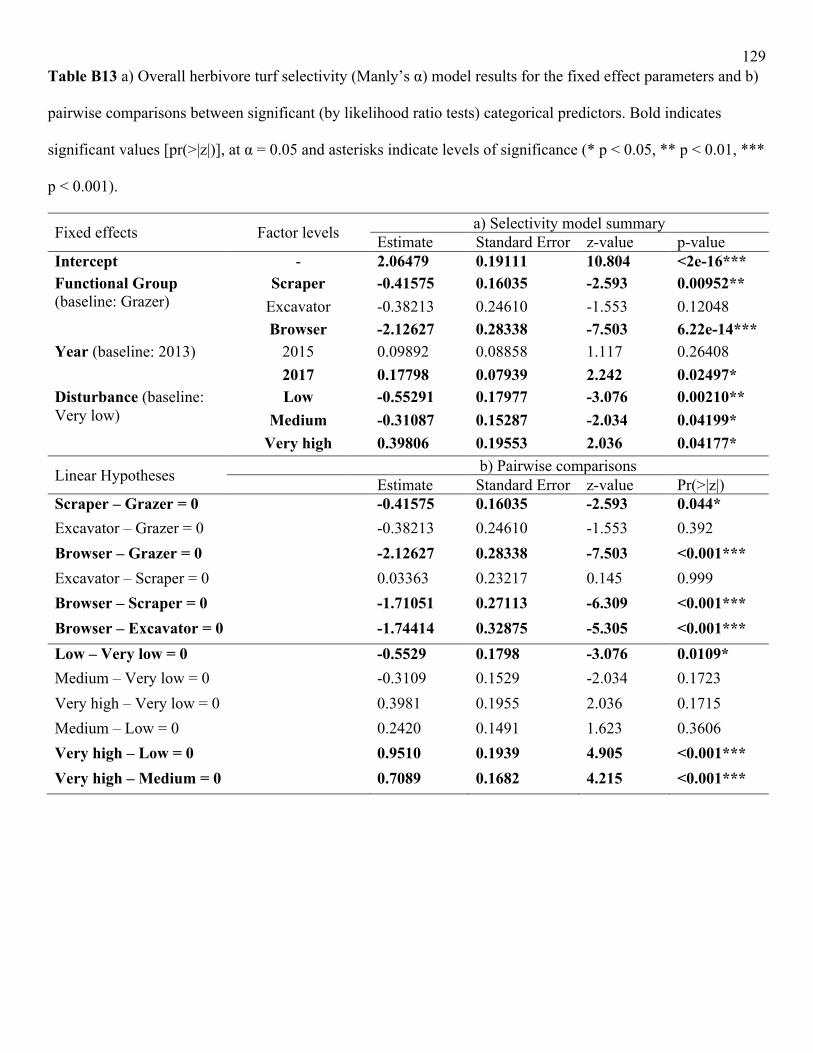
129 Table B13 a) Overall herbivore turf selectivity (Manly’s α) model results for the fixed effect parameters and b)
pairwise comparisons between significant (by likelihood ratio tests) categorical predictors. Bold indicates
significant values [pr(>|z|)], at α = 0.05 and asterisks indicate levels of significance (* p < 0.05, ** p < 0.01, ***
p < 0.001).
Fixed effects Factor levels a) Selectivity model summary Estimate Standard Error z-value p-value
Intercept - 2.06479 0.19111 10.804 <2e-16*** Functional Group (baseline: Grazer)
Scraper -0.41575 0.16035 -2.593 0.00952**
Excavator -0.38213 0.24610 -1.553 0.12048 Browser -2.12627 0.28338 -7.503 6.22e-14***
Year (baseline: 2013) 2015 0.09892 0.08858 1.117 0.26408 2017 0.17798 0.07939 2.242 0.02497*
Disturbance (baseline: Very low)
Low -0.55291 0.17977 -3.076 0.00210**
Medium -0.31087 0.15287 -2.034 0.04199*
Very high 0.39806 0.19553 2.036 0.04177*
Linear Hypotheses b) Pairwise comparisons Estimate Standard Error z-value Pr(>|z|)
Scraper – Grazer = 0 -0.41575 0.16035 -2.593 0.044*
Excavator – Grazer = 0 -0.38213 0.24610 -1.553 0.392
Browser – Grazer = 0 -2.12627 0.28338 -7.503 <0.001***
Excavator – Scraper = 0 0.03363 0.23217 0.145 0.999
Browser – Scraper = 0 -1.71051 0.27113 -6.309 <0.001***
Browser – Excavator = 0 -1.74414 0.32875 -5.305 <0.001***
Low – Very low = 0 -0.5529 0.1798 -3.076 0.0109*
Medium – Very low = 0 -0.3109 0.1529 -2.034 0.1723
Very high – Very low = 0 0.3981 0.1955 2.036 0.1715
Medium – Low = 0 0.2420 0.1491 1.623 0.3606
Very high – Low = 0 0.9510 0.1939 4.905 <0.001***
Very high – Medium = 0 0.7089 0.1682 4.215 <0.001***

130 Table B14 Functional group selectivity model results for the fixed effect parameters for a) grazers, b) scrapers,
c) the browser (Calotomus carolinus) and d) the excavator (Chlorurus sordidus). Bold indicates significant
values [pr(>|z|)], at α = 0.05, and asterisks indicate levels of significance (* p < 0.05, ** p < 0.01, *** p <
0.001). IP = Intermediate Phase, TP = Terminal Phase.
Fixed effects Factor levels a) Grazer Estimate Standard Error z-value p-value
Intercept - 2.22318 0.18355 12.112 <2e-16*** Species (baseline: Acanthurus nigricans)
A. olivaceus -0.09092 0.21884 -0.415 0.6778 A. lineatus -0.05033 0.23221 -0.217 0.8284
A. nigricauda -0.13376 0.23250 -0.575 0.5651 A. achilles 0.01767 0.24104 0.073 0.9416
Year (baseline: 2013)
2015 0.23419 0.12211 1.918 0.0551 2017 0.15670 0.14579 1.075 0.2824
Disturbance (baseline: Very low)
Low -0.13220 0.18782 -0.704 0.4815 Medium -0.13206 0.15326 -0.862 0.3889
Very high 0.03012 0.19422 0.155 0.8767
Fixed effects Factor levels b) Scraper Estimate Standard Error z-value p-value
Intercept - 2.46192 0.25695 9.581 <2e-16*** Species (baseline: Scarus frenatus)
S. rubroviolaceus 0.07689 0.11368 0.676 0.498833 S. tricolor -0.26250 0.15009 -1.749 0.080307
S. ghobban -0.54019 0.17181 -3.144 0.001666** S. psittacus -0.39998 0.21669 -1.846 0.064912 S. globiceps 0.79100 0.30472 2.596 0.009436**
Phase (baseline: Juvenile)
IP -0.33116 0.16596 -1.995 0.046002* TP -0.28789 0.17118 -1.682 0.092603
Year (baseline: 2013)
2015 0.04284 0.13574 0.316 0.752285 2017 0.16872 0.11019 1.531 0.125725
Disturbance (baseline: Very low)
Low -0.86475 0.25991 -3.327 0.000877*** Medium -0.62104 0.21228 -2.926 0.003439**
Very high 0.52522 0.25845 2.032 0.042131*
Fixed effects Factor levels c) Browser Estimate Standard Error z-value p-value
Intercept - 2.0138 0.8657 2.326 0.02000* Phase (baseline: Juvenile)
IP -0.9535 0.4793 -1.990 0.04665* TP -1.1081 0.5062 -2.189 0.02857*
Year (baseline: 2013)
2015 1.1285 1.5885 0.710 0.47744 2017 0.0614 0.4863 0.126 0.89953
Disturbance (baseline: Very low)
Low -2.0753 0.9808 -2.116 0.03435* Medium -2.0015 0.6345 -3.155 0.00161** Very high 0.1426 0.6750 0.211 0.83266

131 Table B14 (cont’d)
Fixed effects Factor levels d) Excavator Estimate Standard Error z-value p-value
Intercept - 0.96160 0.36108 2.663 0.00774** Phase (baseline: Juvenile)
IP 0.53686 0.31994 1.678 0.09334 TP 0.86680 0.32155 2.696 0.00702**
Year (baseline: 2013)
2015 -0.42488 0.18596 -2.285 0.02233* 2017 0.08809 0.15986 0.551 0.58160
Disturbance (baseline: Very low)
Low -0.62357 0.27342 -2.281 0.02257* Medium 0.11439 0.22712 0.504 0.61449
Very high 0.61689 0.35516 1.737 0.08240
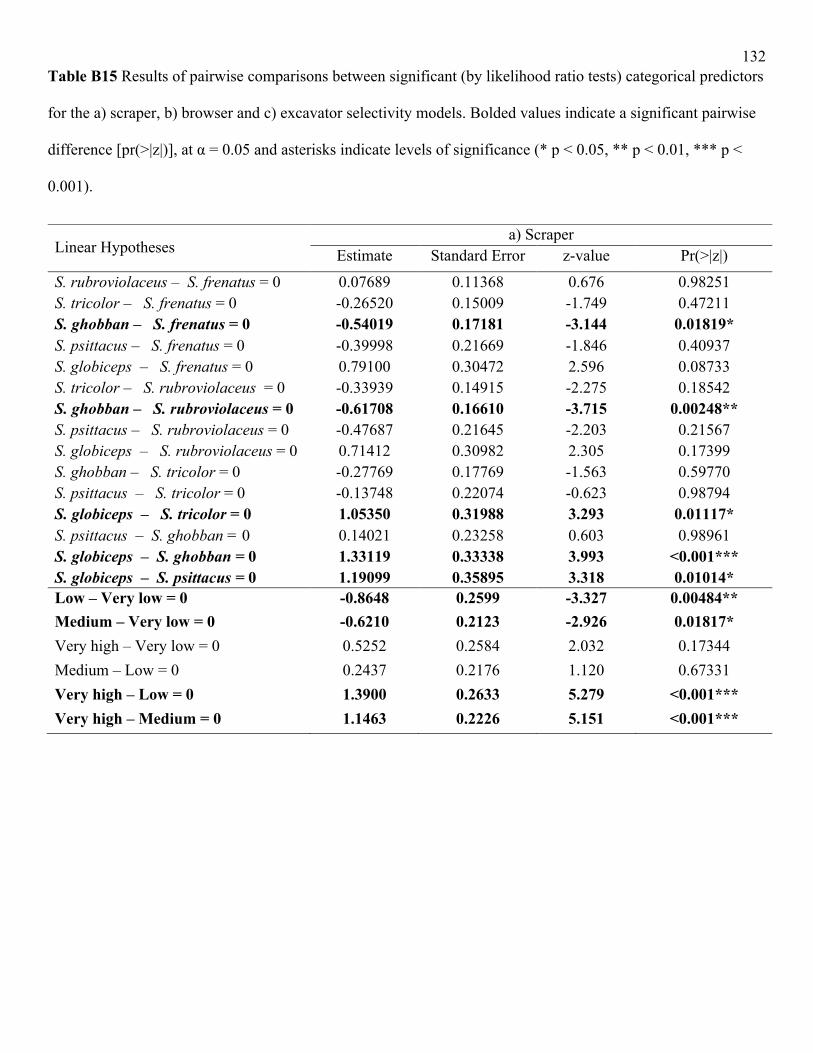
132 Table B15 Results of pairwise comparisons between significant (by likelihood ratio tests) categorical predictors
for the a) scraper, b) browser and c) excavator selectivity models. Bolded values indicate a significant pairwise
difference [pr(>|z|)], at α = 0.05 and asterisks indicate levels of significance (* p < 0.05, ** p < 0.01, *** p <
0.001).
Linear Hypotheses a) Scraper
Estimate Standard Error z-value Pr(>|z|) S. rubroviolaceus – S. frenatus = 0 0.07689 0.11368 0.676 0.98251 S. tricolor – S. frenatus = 0 -0.26520 0.15009 -1.749 0.47211 S. ghobban – S. frenatus = 0 -0.54019 0.17181 -3.144 0.01819* S. psittacus – S. frenatus = 0 -0.39998 0.21669 -1.846 0.40937 S. globiceps – S. frenatus = 0 0.79100 0.30472 2.596 0.08733 S. tricolor – S. rubroviolaceus = 0 -0.33939 0.14915 -2.275 0.18542 S. ghobban – S. rubroviolaceus = 0 -0.61708 0.16610 -3.715 0.00248** S. psittacus – S. rubroviolaceus = 0 -0.47687 0.21645 -2.203 0.21567 S. globiceps – S. rubroviolaceus = 0 0.71412 0.30982 2.305 0.17399 S. ghobban – S. tricolor = 0 -0.27769 0.17769 -1.563 0.59770 S. psittacus – S. tricolor = 0 -0.13748 0.22074 -0.623 0.98794 S. globiceps – S. tricolor = 0 1.05350 0.31988 3.293 0.01117* S. psittacus – S. ghobban = 0 0.14021 0.23258 0.603 0.98961 S. globiceps – S. ghobban = 0 1.33119 0.33338 3.993 <0.001*** S. globiceps – S. psittacus = 0 1.19099 0.35895 3.318 0.01014* Low – Very low = 0 -0.8648 0.2599 -3.327 0.00484**
Medium – Very low = 0 -0.6210 0.2123 -2.926 0.01817*
Very high – Very low = 0 0.5252 0.2584 2.032 0.17344 Medium – Low = 0 0.2437 0.2176 1.120 0.67331 Very high – Low = 0 1.3900 0.2633 5.279 <0.001*** Very high – Medium = 0 1.1463 0.2226 5.151 <0.001***

133
Table B15 (cont’d)
Linear Hypotheses b) Browser Estimate Standard Error z-value Pr(>|z|)
Low – Very low = 0 -2.07529 0.98078 -2.116 0.1387
Medium – Very low = 0 -2.00155 0.63447 -3.155 0.0081**
Very high – Very low = 0 0.14261 0.67497 0.211 0.9964 Medium – Low = 0 0.07374 0.79057 0.093 0.9997 Very high – Low = 0 2.21791 0.85322 2.599 0.0424*
Very high – Medium = 0 2.14417 0.47894 4.477 <0.001***
Linear Hypotheses c) Excavator Estimate Standard Error z-value Pr(>|z|)
IP– J = 0 0.5369 0.3199 1.678 0.3031 TP – J = 0 0.8668 0.3215 2.696 0.0294* TP – IP = 0 0.3299 0.1292 2.554 0.0438*
2015 – 2013 = 0 -0.42488 0.18596 -2.285 0.0575 2017 – 2013 = 0 0.08809 0.15986 0.551 0.8453 2017 – 2015 = 0 0.51297 0.19095 2.686 0.0199*
Low – Very low = 0 -0.6236 0.2734 -2.281 0.09822 Medium – Very low = 0 0.1144 0.2271 0.504 0.95668 Very high – Very low = 0 0.6169 0.3552 1.737 0.29552 Medium – Low = 0 0.7380 0.2340 3.153 0.00849** Very high – Low = 0 1.2405 0.3696 3.356 0.00387** Very high – Medium = 0 0.5025 0.3389 1.483 0.43794

134
Appendix C - Supplemental tables for Chapter 3
Table C1 Number of site-averaged density estimates from underwater visual
census surveys of herbivore species for which we had feeding observations.
Number in brackets indicates instances at each site that had matching species’
feeding observations and density estimates in each year in order to calculate a
metric for average species impact. See the list of species in Table 3.1.
Site 2013 2017 2018 Total VL1 6(5) 10(5) 5(4) 21(14) VL2 5(3) 9(6) 8(0) 22(9) VL3 0 10(6) 13(9) 23(15) VL4 0 10(6) 7(5) 17(11) VL11 0 6(3) 0 6(3) L1 6(5) 12(6) 9(7) 27(18) L2 0 3(3) 8(7) 11(10) L3 10(6) 8 0 18(6) L5 5(5) 10 0 15(5) M1 10(4) 11(7) 9(7) 30(18) M2 11(7) 12(7) 13(9) 36(23) M3 7(7) 12(6) 8(7) 27(20) M4 9(8) 9 0 18(8) M5 7(6) 13(10) 7(5) 27(21) M6 5(4) 6 0 11(4) M9 0 8(4) 0 8(4) M10 10(5) 8 0 18(5) M11 6(4) 9 0 15(4) H1 0 11(4) 10 21(4) H2 9(5) 10 0 19(5) VH1 10(6) 8(3) 2(2) 20(11) VH2 9(8) 8(5) 11(9) 28(22) VH3 12(7) 10(5) 8(6) 30(18) Total 137(95) 213(86) 118(77) 468(258)
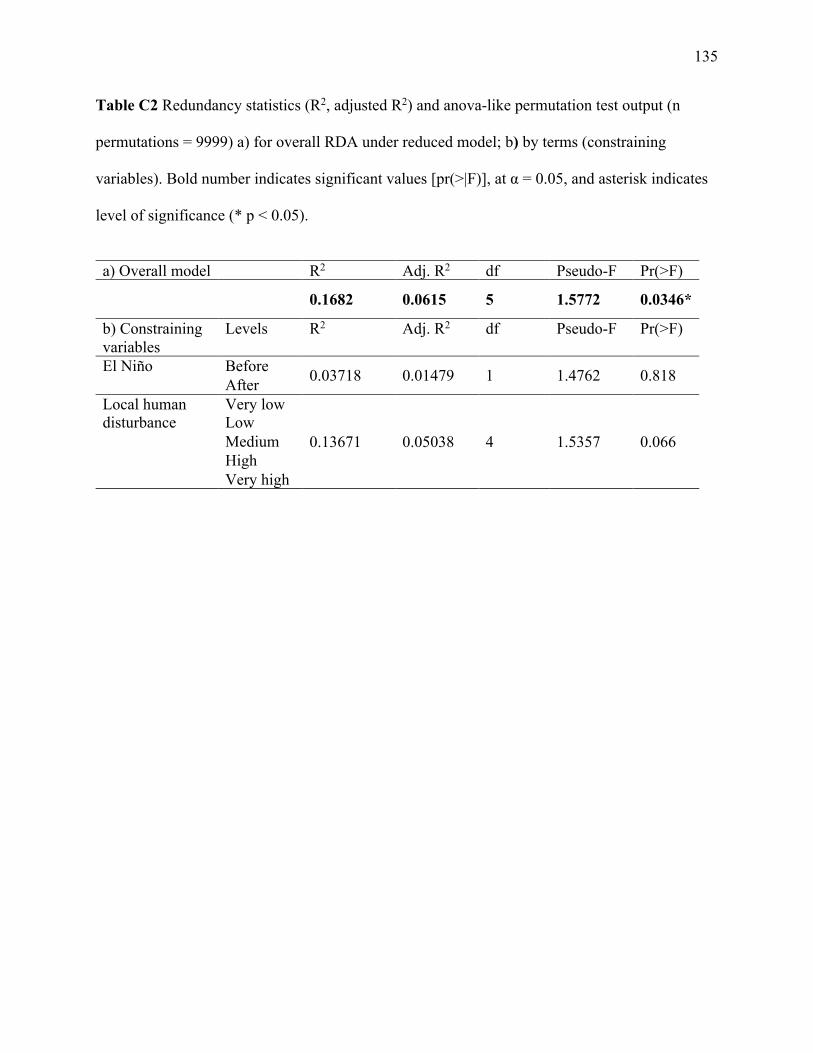
135
Table C2 Redundancy statistics (R2, adjusted R2) and anova-like permutation test output (n
permutations = 9999) a) for overall RDA under reduced model; b) by terms (constraining
variables). Bold number indicates significant values [pr(>|F)], at α = 0.05, and asterisk indicates
level of significance (* p < 0.05).
a) Overall model R2 Adj. R2 df Pseudo-F Pr(>F)
0.1682 0.0615 5 1.5772 0.0346*
b) Constraining variables
Levels R2 Adj. R2 df Pseudo-F Pr(>F)
El Niño Before 0.03718 0.01479 1 1.4762 0.818 After Local human disturbance
Very low
0.13671 0.05038 4 1.5357 0.066 Low Medium High Very high

136 Table C3 Eigenvalues for the constrained (RDA1–5) and unconstrained (PC1–18) axes and their contribution to the variance in the RDA model of herbivore
community impact.
RDA1 RDA2 RDA3 RDA4 RDA5 PC1 PC2 PC3 PC4 PC5 PC6 PC7 PC8 PC9 PC10 PC11 PC12 PC13 PC14 PC15 PC16 PC17 PC18
Eigenvalue 1.37 0.74 0.65 0.17 0.10 2.98 2.43 1.91 1.76 1.14 1.00 0.77 0.68 0.58 0.50 0.42 0.28 0.16 0.11 0.10 0.07 0.05 0.02
Proportion Explained 0.08 0.04 0.03 0.01 0.01 0.17 0.13 0.11 0.10 0.06 0.05 0.04 0.04 0.03 0.03 0.02 0.02 0.01 0.01 0.01 0.00 0.00 0.00
Cumulative Proportion 0.08 0.12 0.15 0.16 0.17 0.34 0.47 0.58 0.68 0.74 0.79 0.83 0.87 0.90 0.93 0.95 0.97 0.98 0.99 0.99 1.00 1.00 1.00

137
Table C4 Accumulated constrained eigenvalues and the importance of each canonical axis
component to the constrained variation in herbivore community impact.
RDA1 RDA2 RDA3 RDA4 RDA5 Eigenvalue 1.367 0.739 0.651 0.171 0.099 Proportion Explained 0.452 0.244 0.215 0.057 0.033
Cumulative Proportion 0.452 0.696 0.911 0.967 1.000
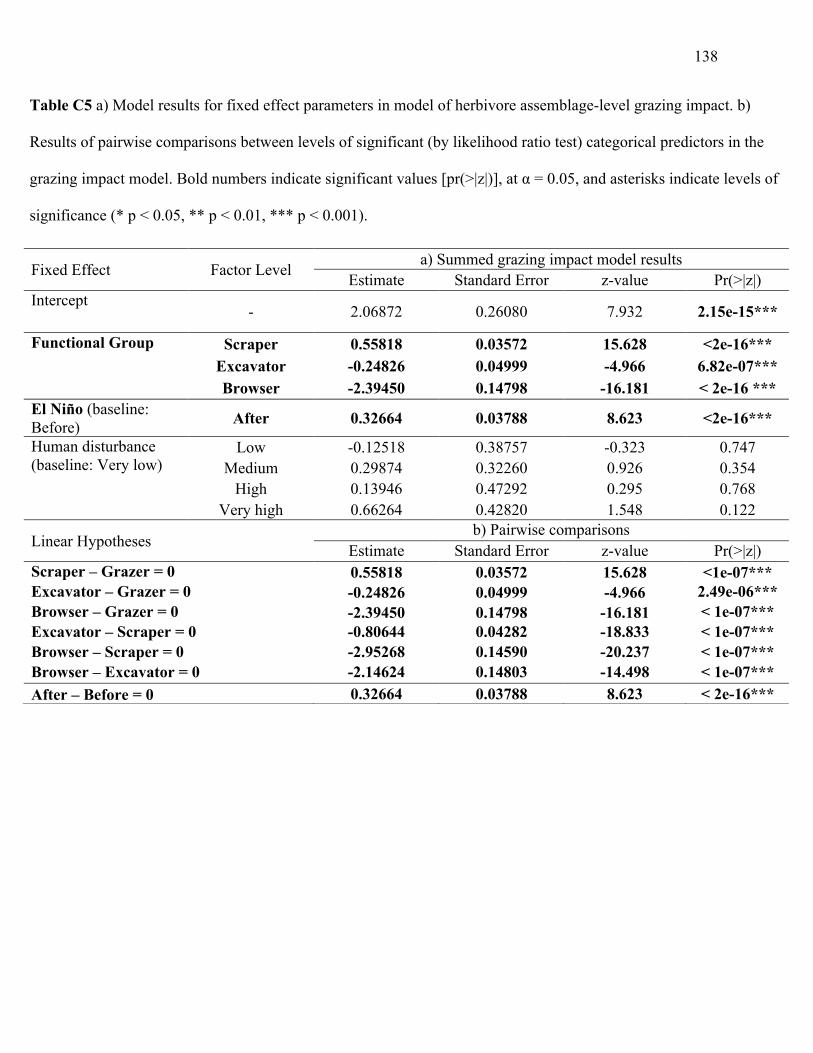
138
Table C5 a) Model results for fixed effect parameters in model of herbivore assemblage-level grazing impact. b)
Results of pairwise comparisons between levels of significant (by likelihood ratio test) categorical predictors in the
grazing impact model. Bold numbers indicate significant values [pr(>|z|)], at α = 0.05, and asterisks indicate levels of
significance (* p < 0.05, ** p < 0.01, *** p < 0.001).
Fixed Effect Factor Level a) Summed grazing impact model results Estimate Standard Error z-value Pr(>|z|)
Intercept - 2.06872 0.26080 7.932 2.15e-15***
Functional Group Scraper 0.55818 0.03572 15.628 <2e-16*** Excavator -0.24826 0.04999 -4.966 6.82e-07*** Browser -2.39450 0.14798 -16.181 < 2e-16 *** El Niño (baseline: Before) After 0.32664 0.03788 8.623 <2e-16***
Human disturbance (baseline: Very low)
Low -0.12518 0.38757 -0.323 0.747 Medium 0.29874 0.32260 0.926 0.354
High 0.13946 0.47292 0.295 0.768 Very high 0.66264 0.42820 1.548 0.122
Linear Hypotheses b) Pairwise comparisons
Estimate Standard Error z-value Pr(>|z|) Scraper – Grazer = 0 0.55818 0.03572 15.628 <1e-07*** Excavator – Grazer = 0 -0.24826 0.04999 -4.966 2.49e-06*** Browser – Grazer = 0 -2.39450 0.14798 -16.181 < 1e-07*** Excavator – Scraper = 0 -0.80644 0.04282 -18.833 < 1e-07*** Browser – Scraper = 0 -2.95268 0.14590 -20.237 < 1e-07*** Browser – Excavator = 0 -2.14624 0.14803 -14.498 < 1e-07*** After – Before = 0 0.32664 0.03788 8.623 < 2e-16***