Embed Size (px)
Citation preview

HeRAMSBi-Annual ReportJanuary - June 2020
Public Hospitalsin the Syrian Arab Republic

World Health Organization Health Resources and Services Availability Monitoring System Syrian Arab Republic
HeRAMSBi-Annual ReportJanuary - June 2020
Public Hospitals in the Syrian Arab Republic

This is to acknowledge that the data provided in this report is a product of joint collaboration between the World Health Organization, Ministry of Health, and Ministry of Higher Education in the Syrian Arab Republic. The report covers the months of January to June 2020.
© World Health Organization 2020Some rights reserved. This work is available under the Creative Commons Attribution-NonCommercial-ShareAlike 3.0 IGO licence (CC BY-NC-SA 3.0 IGO; https://creativecommons.org/licenses/by-nc-sa/3.0/igo).
Under the terms of this licence, you may copy, redistribute and adapt the work for non-commercial purposes, provided the work is appropriately cited. In any use of this work, there should be no suggestion that WHO endorses any specific organization, products or services. The use of the WHO logo is not permitted. If you adapt the work, then you must license your work under the same or equivalent Creative Commons licence. If you create a translation of this work, you should add the following disclaimer along with the suggested citation: “This translation was not created by the World Health Organization (WHO). WHO is not responsible for the content or accuracy of this translation. The original English edition shall be the binding and authentic edition”.
Any mediation relating to disputes arising under the licence shall be conducted in accordance with the mediation rules of the World Intellectual Property Organization.
Suggested citation. [Title]. Cairo: WHO Regional Office for the Eastern Mediterranean; 2020. Licence: CC BYNC-SA 3.0 IGO.
Sales, rights and licensing. To purchase WHO publications, see http://apps.who.int/bookorders. To submit requests for commercial use and queries on rights and licensing, see http://www.who.int/about/licensing.
Third-party materials. If you wish to reuse material from this work that is attributed to a third party, such as tables, figures or images, it is your responsibility to determine whether permission is needed for that reuse and to obtain permission from the copyright holder. The risk of claims resulting from infringement of any third-partyowned component in the work rests solely with the user.
General disclaimers. The designations employed and the presentation of the material in this publication do not imply the expression of any opinion whatsoever on the part of the World Health Organization concerning the legal status of any country, territory, city or area or of its authorities, or concerning the delimitation of its frontiers or boundaries. Dotted lines on maps represent approximate border lines for which there may not yet be full agreement.
The mention of specific companies or of certain manufacturers’ products does not imply that they are endorsed or recommended by the World Health Organization in preference to others of a similar nature that are not mentioned. Errors and omissions excepted, the names of proprietary products are distinguished by initial capital letters.
All reasonable precautions have been taken by the World Health Organization to verify the information contained in this publication. However, the published material is being distributed without warranty of any kind, either expressed or implied. The responsibility for the interpretation and use of the material lies with the reader. In no event shall the World Health Organization be liable for damages arising from its use.
Contents
Introduction
Executive summary
1. Completeness of hospitals reporting 2. Functionality and accessibility of the public hospitals 2.1 Functionality status of the public hospitals
2.2 Density of the public hospitals
2.3 Accessibility to public hospitals
3. Accessibility to public hospitals
4. Infrastructure patterns of the public hospitals 4.1 Level of damage of the hospitals’ buildings
4.2 Analysis of the inpatient capacity
4.3 Water sources and functionality status
4.4 Availability of electricity generators
5. Availability of health human resources 5.1 Availability of medical staff by category and affiliation
5.2 Availability of medical doctors by affiliation (MoH vs. MoHE hospitals)
5.3 Availability of medical doctors by gender (MoH vs. MoHE hospitals)
6. Availability and utilization of the health services 6.1 General clinical services
6.2 Surgical and trauma care
6.3 Maternal health services
6.4 Child health
6.5 Nutrition
6.6 Communicable diseases services
6.7 NCDs (non-communicable diseases)
6.8 Rehabilitation services
6.9 Mental health
7. Availability of medical equipment
8. Availability of medicines & medical supplies
9. Conclusions and recommendations
1
1
3
44
7
8
8
1010
14
15
17
1821
23
25
2729
31
38
41
42
43
44
47
48
49
51
52

Abbreviations
CEmOC Comprehensive Emergency Obstetric Care
CS Caesarean Sections
DoH Directorate of Health
ESKD End Stage Kidney Disease
HeRAMS Health Resources & Services Availability Monitoring System
HIS Health Information System
HRP Humanitarian Response Plan
ICT Information and Communication Technology
ICU/ CCU Intensive Care Unit / Critical Care Unit
IDPs Internally Displaced People
MoH Ministry of Health
MoHE Ministry of Higher Education
NCDs Non-communicable Diseases
OCHA United Nations Office for the Coordination of Humanitarian Affairs
WHO World Health Organization

HeRAMS | Bi-Annual Report | January - June 2020Public Hospitals1
HeRAMS is a global health information management tool (for mapping, collection, collation and analysis of information on health resources and services) that aims to provide timely, relevant and reliable information for decision-making. It is used to guide interventions at the primary and secondary care levels, measure gaps and improve resource planning, ensure that actions are evidence-based, and enhance the coordination and accountability of WHO and other health sector partners.
HeRAMS in Syria is a World Health Organization (WHO) project that aims at strengthening the collection and analysis of information on the availability of health resources and services in Syria at health facility level. A team of national health staff from all governorates was formulated for HeRAMS reporting, and different data collection mechanisms were introduced to address the shortage of timely and relevant information. The main HeRAMS tool for collecting data is a questionnaire that assesses the functionality status, accessibility, health infrastructure, human resources, availability of health services, equipment and medicines at primary and secondary care level.
Regular assessment to monitor the impact of the crisis on the health facilities functionality, accessibility, condition status, availability of resources and services, has been conducted using HeRAMS (Health Resources & services Availability Monitoring System) tool. The report provides descriptive and trend analysis for the situation of public hospitals in all 14 governorates of Syria [including Ministry of Health (MoH) and Ministry of Higher Education (MoHE) hospitals (a total of 113 hospitals)].
Despite the challenging security situation and protracted crisis, in addition to the wide disruption of the Health System, implementation of HeRAMS has been successfully institutionalized and strengthened in public health facilities since 2014.
Completeness of hospitals’ reporting remained 100%, where all 113 public hospitals: 100 (MoH) hospitals and 13 (MoHE) hospitals reported to HeRAMS by end of June 2020.
Functionality status of the public hospitalsBy the end of June 2020, and out of the 113 assessed public hospitals [MoH & MoHE], 50% (56) were reported fully functioning, 26% (30) hospitals were reported partially functioning (i.e., shortage of staff, equipment, medicines or damage of the building in some cases), while 24% (27) were reported non-functioning.
Accessibility status of the public hospitalsBy the end of June 2020, 79% (89) hospitals were reported accessible, 8% (9) hard-to-access, and 13% (15) were inaccessible.
Introduction
Executive summary

HeRAMS | Bi-Annual Report | January - June 2020Public Hospitals2
Infrastructure of the public hospitalsBy the end of June 2020, 43% (49) hospitals were reported damaged [10% fully damaged and 33% partially damaged], while 57% (64) of public hospitals were reported intact.
Analysis on inpatient capacity in functional hospitals has shown shortage of beds at varying degrees, across all governorates.
Assessing the availability of water sources at functional public hospitals indicated that 37.2% (32) are using main pipelines, 9.3% (8) are mainly using wells, 51.2% (44) are using both (main pipeline and well), while 2.3% (2) are using other sources of water.
Electricity power is widely disrupted nationwide and majority of public hospitals are dependent on generators’ power. According to HeRAMS assessment 31% (27) of functional public hospitals across Syria are in need for electrical generators, mainly reported from 11 governorates: Damascus, Rural Damascus, Aleppo, Lattakia , Homs, Hama, Al-Hasakeh, Deir-ez-Zor, Dar’a, As-Sweida, and Quneitra.
Human resources for health The general practitioner (0.2%) and emergency physician (0.3%) were the lowest proportion of health staff in public hospitals, followed by dentists (0.6%), pharmacists (0.7%), midwives (4.7%), laboratory (5.1%), specialists (12.6%), resident doctors (23.5%), and nurses (52.4%).
Trend analysis of available number of medical doctors, nurses, and midwives during 2020 has shown slight increase. In functional public hospitals the number of medical doctors [general practitioner, specialists, emergency doctors, resident doctors, dentists] has slightly increased by 1% in June 2020 compared to January 2020, similarly the number of nurses has slightly increased by 1%, while the number of midwives has slightly decreased by 2%.
Analysis of proportions of medical doctors [general practitioner, specialists, emergency doctors, resident doctors, dentists] working at MoHE hospitals versus MoH hospitals has shown that 26% of medical doctors work in MoHE, while 74% are in MoH hospitals.
Analysis of availability of medical doctors by gender has shown that lowest proportion of female to male medical doctors is in Ar-Raqqa governorate (17%).
Availability and utilization of health services As a result of disrupted healthcare delivery and non-functionality of the hospitals, limited provision of health services was observed across governorates, even within functional hospitals. Detailed analysis on services’ availability and utilization throughout 2020 by category (i.e., General Clinical Services, Surgical and Trauma care, Child Health, Nutrition, Maternal & Newborn Health, Communicable Diseases, Non-communicable Diseases, and Mental Health) is provided at governorate level.
HeRAMS | Bi-Annual Report | January - June 2020Public Hospitals3
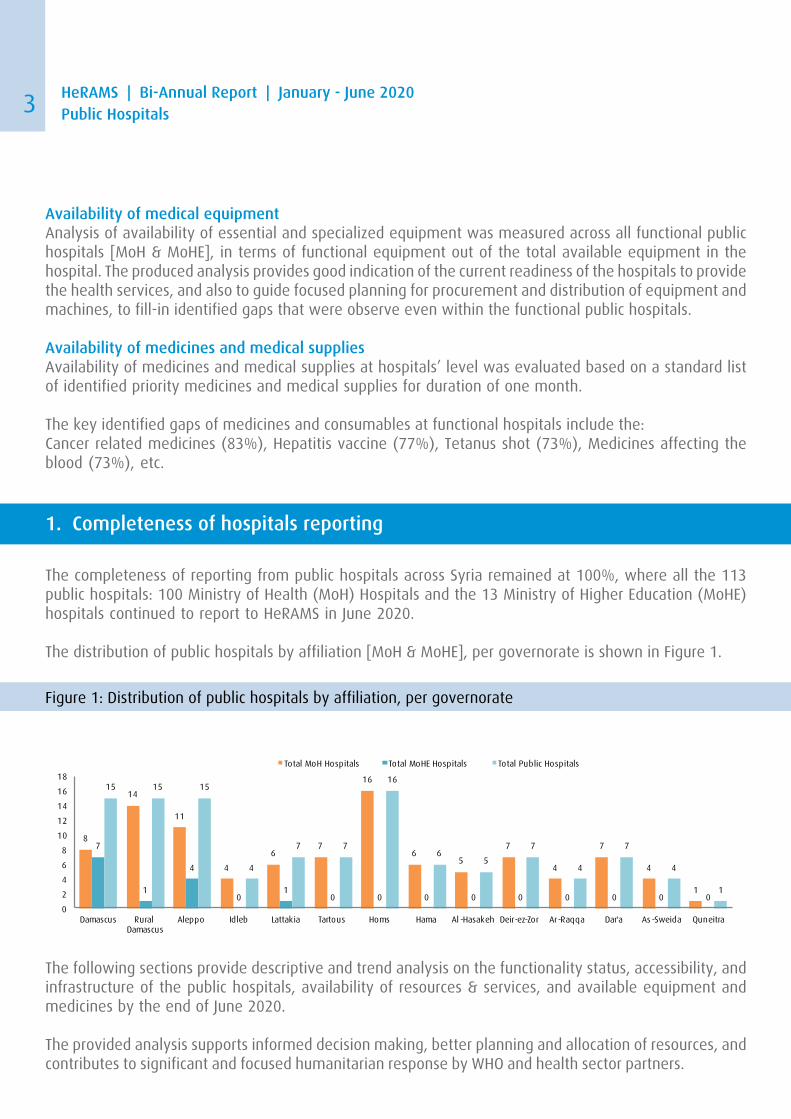
The completeness of reporting from public hospitals across Syria remained at 100%, where all the 113 public hospitals: 100 Ministry of Health (MoH) Hospitals and the 13 Ministry of Higher Education (MoHE) hospitals continued to report to HeRAMS in June 2020.
The distribution of public hospitals by affiliation [MoH & MoHE], per governorate is shown in Figure 1.
The following sections provide descriptive and trend analysis on the functionality status, accessibility, and infrastructure of the public hospitals, availability of resources & services, and available equipment and medicines by the end of June 2020.
The provided analysis supports informed decision making, better planning and allocation of resources, and contributes to significant and focused humanitarian response by WHO and health sector partners.
Figure 1: Distribution of public hospitals by affiliation, per governorate
1. Completeness of hospitals reporting
8
14
11
4
67
16
65
7
4
7
4
1
7
1
4
01
0 0 0 0 0 0 0 0 0
15 15 15
4
7 7
16
65
7
4
7
4
1
0
2
4
6
8
10
12
14
16
18
Damascus Rural Damascus
Aleppo Idleb Lattakia Tartous Homs Hama Al -Hasakeh Deir-ez-Zor Ar-Raqqa Dar'a As -Sweida Quneitra
Total MoH Hospitals Total MoHE Hospitals Total Public Hospitals
Availability of medical equipment Analysis of availability of essential and specialized equipment was measured across all functional public hospitals [MoH & MoHE], in terms of functional equipment out of the total available equipment in the hospital. The produced analysis provides good indication of the current readiness of the hospitals to provide the health services, and also to guide focused planning for procurement and distribution of equipment and machines, to fill-in identified gaps that were observe even within the functional public hospitals.
Availability of medicines and medical supplies Availability of medicines and medical supplies at hospitals’ level was evaluated based on a standard list of identified priority medicines and medical supplies for duration of one month.
The key identified gaps of medicines and consumables at functional hospitals include the:Cancer related medicines (83%), Hepatitis vaccine (77%), Tetanus shot (73%), Medicines affecting the blood (73%), etc.
HeRAMS | Bi-Annual Report | January - June 2020Public Hospitals4
The following sub-sections provide analysis on the functionality and accessibility status of the public hospitals at governorate level.
2.1 Functionality status of the public hospitals
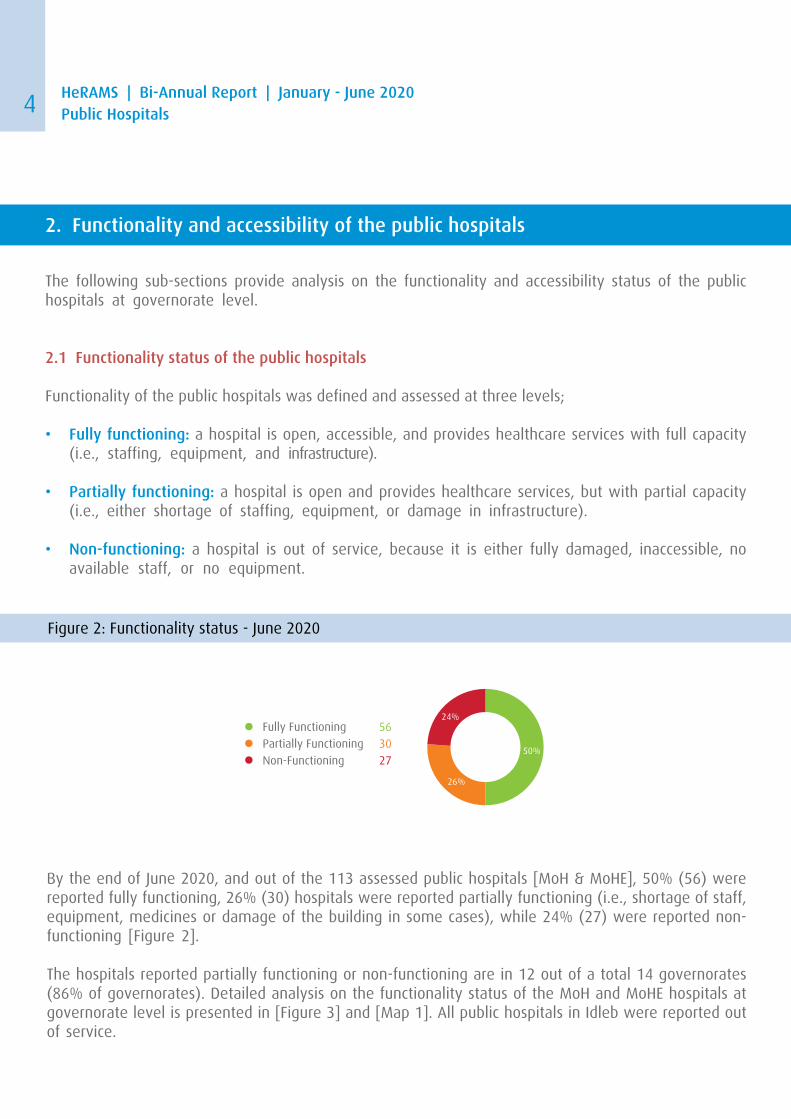
Functionality of the public hospitals was defined and assessed at three levels;
• Fully functioning: a hospital is open, accessible, and provides healthcare services with full capacity (i.e., staffing, equipment, and infrastructure).
• Partially functioning: a hospital is open and provides healthcare services, but with partial capacity (i.e., either shortage of staffing, equipment, or damage in infrastructure).
• Non-functioning: a hospital is out of service, because it is either fully damaged, inaccessible, no
available staff, or no equipment.
Figure 2: Functionality status - June 2020
2. Functionality and accessibility of the public hospitals
Fully Functioning
Partially Functioning
Non-Functioning
56
30
2750%
26%
24%
By the end of June 2020, and out of the 113 assessed public hospitals [MoH & MoHE], 50% (56) were reported fully functioning, 26% (30) hospitals were reported partially functioning (i.e., shortage of staff,equipment, medicines or damage of the building in some cases), while 24% (27) were reported non-functioning [Figure 2].
The hospitals reported partially functioning or non-functioning are in 12 out of a total 14 governorates (86% of governorates). Detailed analysis on the functionality status of the MoH and MoHE hospitals at governorate level is presented in [Figure 3] and [Map 1]. All public hospitals in Idleb were reported out of service.

HeRAMS | Bi-Annual Report | January - June 2020Public Hospitals5
Figure 3: Number and percentage of the public hospitals by functionality status, per governorate, June 2020
0
0
0
1
1
5
7
8
3
12
5
6
7
1
0
3
3
5
3
5
4
2
1
3
0
1
0
0
4
4
1
1
1
6
4
5
0
0
1
0
0
0
0% 10% 20% 30% 40% 50% 60% 70% 80% 90% 100%
Idleb
Deir -ez-Zor
Ar -Raqqa
Dar'a
Al -Hasakeh
Homs
Aleppo
Rural Damascus
As-Sweida
Damascus
Hama
Lattakia
Tartous
Quneitra
Fully Functioning Partially Functioning Non-functioning
Map 1: Distribution and functionality status of public hospitals, June 2020

HeRAMS | Bi-Annual Report | January - June 2020Public Hospitals6
56 56 55 55 55 56
29 29 30 30 30 30
28 28 28 28 28 27
0
10
20
30
40
50
60
Jan 2020 Feb 2020 Mar 2020 Apr 2020 May 2020 Jun 2020
Fully Functioning Partially Functioning Non-functioning
Figure 4: Trend analysis of functionality status of public hospitals, January to June 2020
Slight variation of functionality status of public hospitals has been observed during 2020 [Figure 4].

HeRAMS | Bi-Annual Report | January - June 2020Public Hospitals7
2.2 Density of the public hospitals
Hospitals density reflects the total number of hospitals relative to population size (based on OCHA HRP
2020), which helps measure physical access to outpatient health care services. Comparing with Sphere
standards for hospitals (250,000), five governorates (Aleppo, Rural Damascus, Hama, Al-Hasakeh, and
Deir-ez-Zor) are over the standard density reference; due to high number of population against the
available functioning public hospitals [Figure 5] and Map 3.
Map 3: Density of the public hospitals per governorate, June 2020
Figure 5: Density of the public hospitals per governorate, June 2020
360,162
312,772
266,997 257,766 253,181231,989
173,801 170,498146,332 132,361 121,948
105,122 94,851
238,203
-
50,000
100,000
150,000
200,000
250,000
300,000
350,000
400,000
Aleppo Rural Damascus
Hama Al -Hasakeh Deir-ez-Zor Ar-Raqqa Lattakia Dar'a Homs Tartous Damascus Quneitra As -Sweida Syria
Sphere standards for hospitals (250,000)

HeRAMS | Bi-Annual Report | January - June 2020Public Hospitals8
Figure 6: Accessibility status - June 2020
Yes
Hard to access
No
89
9
15
79%
8%
13%
2.3 Special cases
The following public hospitals have been considered as non-functioning, but are providing health services by non-MoH staff with no information available, where data is being collected by cross-border partners:
1. “Idleb National Hospital” in Idleb: partially damaged, providing health services by non-MoH staff since 2015.
2. “Ibn Seina Hospital” in Idleb: partially damaged, providing health services by non-MoH staff since 2015.
Accessibility to public hospitals is defined at three levels:
• Accessible: a hospital is easily accessible for patients and health staff.
• Hard-to-reach: a hospital is hardly reached, due to security situation or long distance.
• Inaccessible: a hospital is not accessible because of the security situation, or a hospital is accessible only to a small fraction of the population, or military people (inaccessible to civilians).
By the end of June 2020, 79% (89) hospitals were reported accessible, 8% (9) hard-to-access, and 13% (15) were inaccessible [Figure 6]. Distribution of public hospitals by accessibility status is presented in Map 4 , while more details are provided at governorate’s level in Figure 7.
3. Accessibility to public hospitals

HeRAMS | Bi-Annual Report | January - June 2020Public Hospitals9
Figure 7: Accessibilty status of the public hospitals per governorate, June 2020
09
45
312413
1377741
02
11
031
01
00000
44
11
100
31
00000
0% 10% 20% 30% 40% 50% 60% 70% 80% 90% 100%
IdlebAleppoHamaDar'a
Ar -RaqqaDamascus
Al -HasakehHoms
Rural DamascusLattakiaTartous
Deir -ez-ZorAs-Sweida
Quneitra
Yes Hard to access No
Map 4: Accessibility to public hospitals [MoH & MoHE], June 2020
Trend analysis on accessibility to public hospitals [MoH & MoHE] from January to June 2020, is presented
in Figure 8.

HeRAMS | Bi-Annual Report | January - June 2020Public Hospitals10
Figure 8: Trend analysis of accessibility to public hospitals, January to June 2020
89 89 88 87 88 89
9 9 10 11 10 9
15 15 15 15 15 15
0
20
40
60
80
100
Jan 2020 Feb 2020 Mar 2020 Apr 2020 May 2020 Jun 2020
Yes Hard to access No
Figure 9: level of damage - June 2020
4. Infrastructure patterns of the public hospitals
Fully damaged
Partially damaged
Not damaged
11
38
6457% 33%
10%
The following sub-sections provide analysis on the infrastructure patterns of the public hospitals, in terms of building condition, inpatient capacity, water sources, availability of ambulances, and electricity generators, all summarized at governorate level.
4.1 Level of damage of the hospitals’ buildings
The level of damage to hospital buildings was measured at three levels: • Fully damaged: either, all the building is destroyed, about 75% or more of the building is destroyed,
or damage of the essential services’ buildings. • Partially damaged: where part of the building is damaged. • Intact: where there is no damage in the building. Analysis of the level of damage provides good indication on the potential costs for reconstruction.
By the end of June 2020, 43% (49) hospitals were reported damaged [10% fully damaged and 33% partially damaged], while 57% (64) of public hospitals were reported intact [Figure 9]. Distribution of public hospitals by level of damage is presented in Map 5, while more details are provided at governorate’s level in Figure 10.

HeRAMS | Bi-Annual Report | January - June 2020Public Hospitals11
Map 5: Level of Damage of the Hospitals’ buildings, by governorate [MoH & MoHE], June 2020
It is essential to cross-analyze the infrastructural damage of the public hospitals in relation to the functionality status (i.e. provision of services). Some hospitals have resiliently continued to provide services regardless of the level of damage of the building and by optimizing intact parts of the building or in a few cases operating from other neighboring facilities. The national figures translate as follows:
Out of the 38 partially damaged hospitals, 16 hospitals were reported partially functioning and 18 out of service (non-functioning), while 4 hospitals (Ebn Khaldoun Psychiatric hospital in Aleppo, As-Salameyeh National hospital in Hama, As-Suqailbeyeh National hospital in Hama, and Al-Bairouni hospital in Rural Damascus) were reported to be fully functioning providing all services with full staffing capacity.
Out of the 11 fully damaged hospitals, 7 were reported non-functioning while 4 hospitals have opted for innovative ways to continue providing health services to populations in need through partially functioning from other nearby temporary locations and provide health services with limited staff capacity and resources. More details of the 4 hospitals are available in the HeRAMS database.
Then again, hospitals with intact buildings (64 hospitals) does not directly reflect full functionality, only 52 of the 64 intact hospitals are fully functioning, while 10 are partially functioning, and two hospitals are not functioning, due to limited access of patients and health staff to the facilities resulting from the dire security situation as well as critical shortage of supplies.

HeRAMS | Bi-Annual Report | January - June 2020Public Hospitals12
11 11 11 11 11 11
38 38 38 38 38 38
64 64 64 64 64 64
0
20
40
60
80
Jan 2020 Feb 2020 Mar 2020 Apr 2020 May 2020 Jun 2020
Fully damaged Partially damaged Not damaged
0
1
0
5
1
1
2
1
0
0
0
0
0
0
4
5
6
3
7
2
6
1
1
1
2
0
0
0
0
1
1
7
7
3
8
3
3
6
13
7
4
1
0% 10% 20% 30% 40% 50% 60% 70% 80% 90% 100%
Idleb
Deir -ez-Zor
Dar'a
Aleppo
Rural Damascus
Hama
Homs
Al -Hasakeh
Ar -Raqqa
Lattakia
Damascus
Tartous
As-Sweida
Quneitra
Fully damaged Partially damaged Not damaged
Figure 10: Number and percentage of the public hospitals by level of damage, per governorate, June 2020
Figure 11: Trend analysis of public hospitals’ level of damage, January to June 2020
Trend analysis on condition of the public hospitals (level of damage of the building) from January to June 2020 is presented in Figure 11.
The tables below list the hospitals, which reported fully damaged (buildings), in addition to the list of hospitals that are operating from different location (s) given that the original building is fully damaged or partially damaged.

HeRAMS | Bi-Annual Report | January - June 2020Public Hospitals13
Table 1: The list of hospitals with reported fully damaged buildings
Table 2: Special cases of hospitals which reported fully damaged (buildings), and operating partially from other locations
Table 3: Special cases of hospitals which reported partially damaged (buildings), and operating partially (limited provided health services) from other locations
AffiliationDistrictProvinceHospital Name#
MoHDuma Rural DamascusRural Damascus specialized hospital – Duma 1
MoHThe fourthAleppoZahi Azraq general hospital2
MoHE'zazAleppoE'zaz national hospital3
MoHThirdAleppoOphthalmology hospital4
MoHThirdAleppoChildren hospital5
MoHAl-QusayrHomsAl-Qusayr general hospital6
MoHAl-QuabuHomsTaldaw hospital7
MoHMuhardehHamaHelfaya hospital8
MoHAl-HasakehAl-HasakehChildren hospital9
MoHAl-MayadinDeir-ez-ZorModern Medicine hospital10
MoHEThe fourthAleppoAl-Kindi university hospital11
New locationAffiliationConditionTypeDistrictProvinceHospital name#
Ar-Razi hospitalMoHFully damagedGeneralThe fourthAleppoZahi Azraq general hospital1
Ar-Razi hospital + Al-Bassel Heart Institute
MoHFully damagedSpecializedThirdAleppoOphthalmology hospital2
Ar-Razi hospital + Maternity hospital
MoHFully damagedSpecializedThirdAleppoChildren hospital3
New medical center in Al-hasakah
MoHFully damagedSpecializedAl-HasakehAl-HasakehChildren hospital4
New locationAffiliationConditionTypeDistrictProvinceHospital name#
Qara Municipal MoHPartially damaged
GeneralAl-NabakRural Damascus
Al-Bassel-Qara hospital1
Al-Assad hospitalMoHPartially damaged
SpecializedDeir-ez-ZorDeir-ez-ZorChildren and Obstetrics hospital2
Al-Assad hospitalMoHPartially damaged
SpecializedDeir-ez-ZorDeir-ez-ZorAl-Furat hospital3
The information above could guide focused rehabilitation activities for hospitals’ infrastructure, which could improve functionality status of hospitals to reach fully functional level, especially for partially functional hospitals that need small scale of rehabilitation.

HeRAMS | Bi-Annual Report | January - June 2020Public Hospitals14
Figure 12: Comparison of inpatient capacity (original vs. available) in functional hospitals per governorate, June 2020
Figure 13: Percentage of available number of beds in functional hospital versus the original inpatient capacity, June 2020
2,840
2,203 2,096 1,958
1,186 1,160810 792 720 670 558 410
200
3,246
1,698 1,557 1,631
1,111 998
317
767588 535
232 231 133
DamascusRural Damascus Aleppo Lattakia Tartous Dar'a Deir -ez-Zor Hama Ar -Raqqa Homs As-Sweida Al -Hasakeh Quneitra
Original No. of Beds Available No. of Beds
114%
97% 94%86% 83% 82% 80% 77% 74%
67%56%
42% 39%
84%
Damascus Homs Tartous Hama Rural Damascus
As -Sweida Al -Hasakeh Lattakia Aleppo Quneitra Ar-Raqqa Deir-ez-Zor Dar'a Overall
% of available beds /Total original beds
4.2 Analysis of the inpatient capacity
The inpatient capacity has been analyzed in terms of the total number of beds available in functional hospitals by end of 2020 compared to the original number of beds in these hospitals pre-crisis or the maximum inpatient capacity) [Figure 12].
Reduced inpatient capacity (shortage of beds) was observed in all governorates at varying degrees. This may be correlated to the upsurge in usage of beds in functional hospitals, as direct implication of the crisis on the overstretched public health sector. The number 114% in Damascus illustrates that some hospitals have expanded their operational capacity to meet the increase needs of provision health services. Figure 13 illustrates the proportion of available beds in functional hospitals versus the original inpatient capacity at governorate levels.

HeRAMS | Bi-Annual Report | January - June 2020Public Hospitals15
Figure 15: Main sources of water, June 2020
Figure 14: number of hospital beds (including ICU)/10,000 Population in public hospitals, June 2020
Main Pipeline, 32, 37%
Main Pipeline
and Well, 44,
51%
Well, 8, 9%
Other, 2, 3%
4.3 Water sources and functionality status
Availability of water sources at public hospitals was assessed using a standard checklist of main types of water sources (i.e., main pipeline, well, or both (main pipeline and well)).
By the end of June 2020 and out of 86 functional public hospitals, 37% (32) are using main pipelines, 9% (8) are mainly using wells, 51% (44) are using both (main pipeline and well), while 3% (2) are using other sources of water [Figure 15].
The lowest percentage (39%) of available beds in functional hospital versus original inpatient capacity is observed in Dar’a governorate, mainly reported from Jassem hospital, Nawa hospital, and the national hospital.
The follow figure shows the number of hospital beds (including ICU)/10,000 Population, given that the benchmark is greater than 10 health staff per 10,000 population (Inter-Agency Standing Committee (IASC) Standards).
The national levels in addition to eight governorates (Hama, Rural Damascus, Al-Hasakeh, Aleppo, Homs, Deir-ez-Zor, Dar’a, and Ar-Raqqa) are below benchmark in [Figure 14].
18
15
14
1312
7
5 5 5
43 3 3
6
0
2
4
6
8
10
12
14
16
18
20
Damascus As -Sweida Lattakia Quneitra Tartous Hama Homs Rural Damascus Al -Hasakeh Aleppo Ar-Raqqa Dar'a Deir-ez-Zor Grand Total
Number of hospital beds (including ICU)/10,000 Population
Inter-Agency Standing Committee (IASC) Standards: 10 hospital beds

HeRAMS | Bi-Annual Report | January - June 2020Public Hospitals16
Figure 17: Functionality status of the water sources at functional public hospitals, June 2020
14
11
8
7
7
7
5
5
3
2
2
1
1
0
2
3
0
0
0
1
0
1
2
3
0
0% 10% 20% 30% 40% 50% 60% 70% 80% 90% 100%
Damascus
Aleppo
Homs
Rural Damascus
Lattakia
Tartous
Hama
Dar'a
Deir -ez-Zor
Ar -Raqqa
As -Sweida
Al -Hasakeh
Quneitra
Fully Functioning Partially Functioning
Functionality status of the water sources was measured at three levels; fully functional, partially functional, and not functional. Figure 17, provides details on functionality status of water sources at functional hospitals, (86/113) per governorate.
Figure 16: Distribution of water sources/ types at functional public hospitals, per governorate, June 2020
0
0
0
0
1
2
2
3
3
4
5
5
7
9
5
4
0
2
1
1
12
1
5
2
2
0
0
0
0
1
3
0
0
0
0
1
0
3
0
2
0
0
0
0
0
0
0
0
0
0
0
0
0% 10% 20% 30% 40% 50% 60% 70% 80% 90% 100%
Aleppo
Hama
Al -Hasakeh
Quneitra
Dar'a
Deir -ez-Zor
Ar -Raqqa
Damascus
As -Sweida
Rural Damascus
Tartous
Homs
Lattakia
Main Pipeline Main Pipeline and Well Well Other
Detailed analysis on distribution of water sources at functional public hospitals is presented at governorate level on [Figure 16].

HeRAMS | Bi-Annual Report | January - June 2020Public Hospitals17
4.4 Availability of electricity generators
Availability of electricity generators continued to be highly demanded with the current situation, where electricity power is widely disrupted and majority of public hospitals are dependent on generators’ power. Availability of electrical generators at functional hospitals was measured by assessing the functional out of the total existing generators in the hospital.
Figure 18: Hours of availability of electricity (from all sources) on average during the day in functional hospitals, June 2020
24.0
22.2
24.0 24.0 24.0 24.0 24.0 24.0 24.0 24.0
22.3
24.0 24.0
23.7
21.0
21.5
22.0
22.5
23.0
23.5
24.0
24.5
Damascus Rural Damascus Aleppo Lattakia Tartous Homs Hama Al -Hasakeh Deir -ez-Zor Ar -Raqqa Dar'a As-Sweida Quneitra Syria
Figure 19: Percent of hospitals in need for generators out of total functional hospitals, June 2020
100%
64%
50% 50%
40% 40%
33% 33%
20% 20%14%
0% 0%
31%
0%
10%
20%
30%
40%
50%
60%
70%
80%
90%
100%
Quneitra Aleppo Al -Hasakeh As-Sweida Rural Damascus
Hama Deir-ez-Zor Dar'a Damascus Homs Lattakia Tartous Ar -Raqqa Total
The percent of hospitals in need for electricity generators out of the total functional hospital is summarized at governorate level [Figure 19].
31% (27) of functional public hospitals across Syria are in need for electrical generators, mainly reported from 11 governorates: Damascus, Rural Damascus, Aleppo, Lattakia, Homs, Hama, Al-Hasakeh, Deir-ez-Zor, Dar’a, As-Sweida, and Quneitra.

HeRAMS | Bi-Annual Report | January - June 2020Public Hospitals18
5. Availability of health human resources
Availability and trend of health human resources were analyzed across all public hospitals [MoH & MoHE] considering the following scopes:
• Comparative and trend analysis of medical staff by category (i.e., doctors, nurses, midwives)
• Trend analysis of availability of medical doctors by affiliation; MoH vs. MoHE hospitals
• Trend analysis of availability of medical doctors by gender, per governorate
The proportion between different categories of health staff, among the total functional (fully and partially) MoH and MoHE hospitals (86/113), by the end of June 2020, is as follows: The general practitioner (0.2%) and emergency physician (0.3%) were the lowest proportion of health staff in public hospitals, followed by dentists (0.6%), pharmacists (0.7%), midwives (4.7%), laboratory (5.1%), specialists (12.6%), resident doctors (23.5%), and nurses (52.4%); [Figure 20].
Figure 20: Proportion of health staff in hospitals, June 2020
General Practitioner 0.2%
Specialist12.6%
Emergency Physician 0.3%
Resident Doctor 23.5%
Dentist 0.6%
Nurses52.4%
Laboratory5.1%
Midwives4.7%
Pharmacists 0.7%

HeRAMS | Bi-Annual Report | January - June 2020Public Hospitals19
Table 4: Availability of human resources of functioning public hospitals, per governorate, June 2020
Oth
ers
Tec
hnic
ians
Uni
vers
ity*
Pha
rmac
ists
Mid
wiv
es
Labo
rato
ry
Nur
ses
Den
tist
Res
iden
t Do
ctor
Em
erge
ncy
Phys
icia
n
Oth
er
Spec
ialis
ts
Neu
rolo
gica
l su
rger
y
Gen
eral
su
rger
y
Ort
hope
dic
su
rger
y
Gen
eral
Pr
actit
ione
r
Gove
rnor
ate
2,9531,324551791513933,720422,676158052053450Damascus
89045713116891381,276456642255312412Rural Damascus
1,054332208159014995131,2725430539303Aleppo
Idleb
1,145501250322431522,571411,20818500850414Lattakia
1,605925246281212382,40932562204201060384Tartous
43772370142341581,6329189162385373113Homs
806736130132391511,5313662112351946304Hama
16114624237402902740623746Al-Hasakeh
296262100109835587330380221Deir-ez-Zor
12111321128152450024622278Ar-Raqqa
23315024548354060730401571Dar'a
58730680494561,0061122211821373As-Sweida
2267011316101093964371320Quneitra
10,5145,9431,7672221,4991,61816,7041807,492983,3107136826859Grand Total
* Health workers in the hospitals who hold university degrees (engineer, law, trade and economics .......)

HeRAMS | Bi-Annual Report | January - June 2020Public Hospitals20
The availability and level of medical staffing (by category and gender) in public hospitals a, as is summarized at governorate’s level in Map 6. The categories of staff included in the map are: general practitioner, specialists, emergency doctors, resident doctors, dentists.
Map 6: Availability of medical doctors in functional public hospitals, by end of Jun2020, per governorate

HeRAMS | Bi-Annual Report | January - June 2020Public Hospitals21
5.1 Availability of medical staff by category and affiliation
The availability medical staff in functional public hospitals is analyzed by category [i.e., medical doctors1, nurses, and midwives] and affiliation [MoH vs. MoHE hospitals], as follow:
i. Trend analysis of medical doctors [a total of general practitioner, specialists, emergency doctors, resident doctors, dentists]:
The number of medical doctors in public hospital has slightly increased by 1% in June 2020 (11,846 compared to January 2020 (11,702).
Figure [21] shows the trend analysis of reported medical doctors during 2018 and 2019, in functional public hospitals.
10,37110,185
10,319 10,327 10,317
10,799
11,19611,319 11,286
11,090 11,194
11,484
11,702 11,63611,370 11,355
11,53711,846
9,000
9,500
10,000
10,500
11,000
11,500
12,000
Jan Feb Mar Apr May Jun Jul Aug Sep Oct Nov Dec
2019 2020
Figure 21: Trend analysis of number of doctors (a total of general practitioner, specialists, emergency physicians, resident doctors, and dentists) in public hospitals during 2019 and 2020
ii. Trend analysis of nurses:
The number of nurses in public hospital has slightly increased by 1% in June 2020 (16,704), compared to January 2020 (16,484).
Figure [22] shows trend analysis for the reported number of nurses during 2019 and 2020.

HeRAMS | Bi-Annual Report | January - June 2020Public Hospitals22
Figure 22: Trend analysis of number of nurses in public hospitals during 2019 and 2020
16,16016,389
16,323
16,243
16,509
16,767
16,880
16,72616,643
16,899
16,769
16,618
16,48416,547
16,443
16,247
16,350
16,704
16,000
16,100
16,200
16,300
16,400
16,500
16,600
16,700
16,800
16,900
17,000
Jan Feb Mar Apr May Jun Jul Aug Sep Oct Nov Dec
2019 2020
Figure 23: Trend analysis of number of midwives in public hospitals during 2019 and 2020
1,478
1,5081,515
1,490
1,5371,545 1,542 1,544
1,510
1,519
1,540 1,541
1,534 1,536 1,537
1,522 1,523
1,499
1,460
1,470
1,480
1,490
1,500
1,510
1,520
1,530
1,540
1,550
Jan Feb Mar Apr May Jun Jul Aug Sep Oct Nov Dec
2019 2020
iii. Trend analysis of midwives:
The number of midwives in public hospital has slightly decreased by 2% in June 2020 (1,499), compared to January 2020 (1,534).
Figure [23] shows trend analysis for the reported number of midwives during 2019 and 2020.

HeRAMS | Bi-Annual Report | January - June 2020Public Hospitals23
Figure 24: Proportions and numbers of key staff work in MoH vs. MoHE hospitals, June 2020
583,223
95
5,224151 12,728 1,308 1,291
1 3
2,26829 3,976 310 208
0%10%20%30%40%50%60%70%80%90%
100%
General Practitioner
Specialist Emergency Physician
Resident Doctor
Dentist Nurses Laboratory Midwives
MoHE
MoH
However, MoHE hospitals are located in four governorates (Damascus, Rural Damascus, Aleppo, and Lattakia), they serve the whole country. A comparison between the total available medical-related staff in MoH vs. MoHE hospitals is shown in [Figure 25].
5.2 Availability of medical doctors by affiliation (MoH vs. MoHE hospitals)
Analysis of proportions of medical doctors [general practitioner, specialists, emergency physician, resident doctors, dentists] working at MoHE hospitals versus MoH hospitals in June 2020 has shown that 26% (3,095) of medical doctors (general practitioner, specialists, emergency physician, resident doctors, dentists) work in MoHE, while 74% (8,751) are in MoH hospitals.
2% out of total general practitioner (59) work in public hospitals are in MoHE hospitals; 20% out of total specialists (4,017) work in public hospitals are in MoHE hospitals; 3% out of total emergency physician (98) work in public hospitals are in MoHE hospitals; 30% out of total resident doctors (7,492) are in MoHE hospitals; 16% out of total dentist (180) work in public hospitals are in MoHE hospitals and 23% out of total the nurses & midwives (18,203) are in MoHE hospitals. Details on proportions and numbers of key staff work in MoH vs. MoHE hospitals, by end of June 2020, are presented in [Figure 24].

HeRAMS | Bi-Annual Report | January - June 2020Public Hospitals24
Figure 26: Number of nurses and midwives per doctor in public hospitals, June 2020
8.0
4.1
3.6 3.53.1
2.2 2.1
1.6 1.6 1.51.1
0.90.6
1.5
0.0
1.0
2.0
3.0
4.0
5.0
6.0
7.0
8.0
9.0
Deir-ez-Zor As -Sweida Dar'a Homs Ar-Raqqa Tartous Al -Hasakeh Hama Rural Damascus Lattakia Damascus Quneitra Aleppo Grand Total
Number of nurses and midwives per doctor
MoH benchmark (2)
The follow figure shows the number of nurses and midwives per doctor, given that the benchmark is at least 2 nurses and midwives for each doctor (MoH, 2011).
The national levels in addition to six governorates (Hama, Rural Damascus, Lattakia, Damascus, Quneitra, and Aleppo) are below or equal benchmark in [Figure 26].
The follow figure shows the number of health staff (doctors, nurses and midwives) per 10,000 population, given that the benchmark is greater than 22 health staff per 10,000 population (Inter-Agency Standing Committee (IASC) Standards).
The national levels in addition to eight governorates (Hama, Homs, Deir-ez-Zor, Rural Damascus, Aleppo, Dar’a, Al-Hasakeh, and Ar-Raqqa) are below or equal benchmark in [Figure 27].
Figure 25: Comparison of the medical staff of MoH vs. MoHE hospitals, June 2020
0 11
3 4 0 1 0 0
52
8
22
7
27
0 49
2
39
5
58 2
34
10
7
15
4 5 15
0 0 0 3
1,7
70
49
2
52
8 66
4 90
6
74
74
4
54
4
23
2 3 33
19
2 0 8
1,4
78
95
4
58
9
1,5
21
2,2
42
32
2
36
2
1,0
50
54 89
59 16
3
97
0 31 80
0
500
1,000
1,500
2,000
2,500
Damascus Rural Damascus Aleppo Lattakia Damascus Rural Damascus Aleppo Lattakia
MoH MoHE
General Practitioner Specialist Emergency Physician Resident Doctor Dentist Nurses Midwives Pharmacists

HeRAMS | Bi-Annual Report | January - June 2020Public Hospitals25
Figure 27: number of health staff (doctors, nurses and midwives) per 10,000 population in public hospitals, June 2020
Figure 28: Proportion of Doctors (a total of Specialists, Emergency Physicians, Resident Doctors, Dentists), by gender, per governorate, June 2020
2263 520 987 1090 713 325 677 9856
72
76176
83
1393 351 800 780 433 213 432 6027
15
5192
63
0%
10%
20%
30%
40%
50%
60%
70%
80%
90%
100%
Damascus Rural Damascus
Aleppo Lattakia Tartous Homs Hama Al -Hasakeh Deir-ez-Zor Ar-Raqqa Dar'a As -Sweida Quneitra
Male Female
5.3 Availability of medical doctors by gender (MoH vs. MoHE hospitals)
By analyzing the proportion of male to female doctors (a total of: general practitioner, specialists, emergency physician, resident doctors, dentists), lowest proportions are seen in Ar-Raqqa governorate (24%). [Figure 28].
20.0
12.415.4
7.1
13.9
8.33.7
1.1 2.8 4.51.2 1.3 1.5
5.8
20.3
26.0 21.1
26.510.4
11.5
11.2
7.3 4.1 2.4
4.0 3.5 2.8
8.2
0.81.3
2.0
2.5
1.5
1.8
1.6
1.40.3 0.2
0.5 0.4 0.4
0.7
0.0
5.0
10.0
15.0
20.0
25.0
30.0
35.0
40.0
45.0
Damascus Tartous Lattakia As -Sweida Quneitra Hama Homs Deir-ez-Zor Rural Damascus Aleppo Dar'a Ar-Raqqa Al -Hasakeh Grand Total
Health Staff /10,000 Population
Doctors Nurses Midwives
Inter-Agency Standing Committee (IASC) Standards: health staff > 22

HeRAMS | Bi-Annual Report | January - June 2020Public Hospitals26
Figure 29: Percentage of functioning public hospitals without medical staff (gaps), June 2020
65.1
65.1
61.6
30.2
16.3
1.2
.0
0 10 20 30 40 50 60 70 80 90 100
Practitioner
Dentist
Emergency Physician
Midwives
Resident Doctor
Specialist Doctor
Nurses

HeRAMS | Bi-Annual Report | January - June 2020Public Hospitals27
Figure 30: Availability of health services in the functional public hospitals, June 2020
30%
32%
56%
60%
60%
63%
65%
65%
72%
73%
74%
76%
77%
78%
79%
82%
86%
86%
87%
89%
93%
93%
94%
94%
94%
Cancer treatment services
Management of severe acute malnutrition with complications
Rehabilitation services
Medical evacuation
Acute psychiatric inpatient unit
Comprehensive abortion care
Waste management
Management of children diseases
(CEmOC) Comprehensive emergency obstetric care
Treatment of diabetic complications
Communicable diseases services
Burn patient management
Trauma services
Emergency surgery
End Stage Kidney Disease (ESKD) treatment
Cardiovascular services
ICU services
Blood bank service
Management of diabetes
Hypertension services
Elective surgery
Sanitation availability
Emergency services
Imaging service
Safe water availability
**Detailed information on availability of services per governorate is available in the HeRAMS database.
The workload and utilization of the health services were analyzed in terms of the total estimated serviced people in all functional public hospitals during January and June 2020 per governorate [Figure 31]. In 2020, the total estimated caseload in functional public hospitals is 2,945,140.
6. Availability and utilization of the health services
The availability of core healthcare services is monitored through HeRAMS at hospital’s level, considering a standard list of health services (including: General Clinical Services, Surgical and Trauma care, Child Health, Nutrition, Maternal & Newborn Health, Communicable Diseases, Non-communicable Diseases, and Mental Health).
Analysis of availability of health services has been conducted across all functional public hospitals [MoH & MoHE]: (86/113). As a result of disrupted healthcare delivery and non-functionality of hospitals, limited provision of health services was observed across governorates, even within functional hospitals [Figure 30].

HeRAMS | Bi-Annual Report | January - June 2020Public Hospitals28
Figure 31: Estimated caseload of functional public hospitals (outpatient consultations and emergency cases), January to June 2020
556,560
387,398348,336
318,361 308,840
248,940207,227
133,531 118,639 117,858 116,429
55,01028,011
0
100,000
200,000
300,000
400,000
500,000
600,000
Damascus Lattakia Homs Aleppo Tartous Hama Rural Damascus
Ar-Raqqa Dar'a Al -Hasakeh As -Sweida Deir-ez-Zor Quneitra
621,035 639,985 666,941623,091
571,808615,054
718,432
616,927651,993 656,810
592,783 591,390 610,267 613,503
501,222
277,122
358,035
584,991
200,000
300,000
400,000
500,000
600,000
700,000
800,000
Jan 2019 Feb 2019 Mar 2019
Apr 2019 May 2019
Jun 2019 Jul 2019 Aug 2019
Sep 2019 Oct 2019 Nov 2019
Dec 2019
Jan 2020 Feb 2020 Mar 2020
Apr 2020 May 2020
Jun 2020
Estimated caseload
Figure 32: Trend analysis of estimated caseload in public hospitals, January 2019 to June 2020
Most of healthcare services had a remarkable drop in April 2020; due to lockdown as part of COVID-19 response and then got back to previous level.
The proportion of workload of functional hospitals per governorate is provided on Figure 31.
Detailed analysis on utilization of the core health services is provided on the following sub-sections, including:
1. General Clinical Services (Outpatient, Inpatient, Laboratory, Blood bank services, Imaging services)2. Surgical and Trauma care 3. Maternal health services [normal deliveries, caesarean sections, and CEmOC]4. Nutrition 5. Child Health6. Communicable diseases7. Non-communicable diseases8. Mental Health

HeRAMS | Bi-Annual Report | January - June 2020Public Hospitals29
Damascus19%
Lattakia13%
Homs12%
Aleppo11%
Tartous10%
Hama8%
Rural Damascus7%
Ar-Raqqa5%
Dar'a4%
Al -Hasakeh4%
As-Sweida4%
Deir -ez-Zor2%
Quneitra1%
Figure 33: Proportions of workload during 2020, per governorate
Figure 34: The number of Outpatient and Inpatient in public hospitals, June 2020
78,486
40,463 37,13433,087 29,800
23,97819,566
15,4819,720
6,239 4,504 3,383 2,811
11,6096,704 4,713 5,912 7,596 9,202 10,456
1,978 1,9655,295 3,016 2,362 786
0
10,000
20,000
30,000
40,000
50,000
60,000
70,000
80,000
90,000
Damascus Lattakia Homs Aleppo Tartous Hama Rural Damascus
Ar-Raqqa Deir-ez-Zor As -Sweida Dar'a Al -Hasakeh Quneitra
Outpatient services Inpatients services
6.1 General clinical services
The following sections provide analysis on the utilization of health services in functional public hospitals at governorate level.
i. Outpatient and inpatient
The number of outpatients to inpatients was assessed at a hospital level, and the total numbers reported in December 2019 were summarized and analyzed at governorate level [Figure 34].

HeRAMS | Bi-Annual Report | January - June 2020Public Hospitals30
Figure 35: Trend analysis of outpatient and Inpatient in public hospitals, January 2019 to June 2020
299,928332,437 339,352
319,570
269,881302,713
385,016
283,295
335,992 337,732297,979 295,934 307,513 307,667
242,832
92,187134,399
304,652
75,695 74,028 76,116 75,215 71,857 77,734 88,560 77,537 80,129 76,002 67,685 70,628 71,466 69,988 62,710 45,788 49,43071,594
0
50,000
100,000
150,000
200,000
250,000
300,000
350,000
400,000
450,000
Jan 2019 Feb 2019 Mar 2019 Apr 2019 May 2019 Jun 2019 Jul 2019 Aug 2019 Sep 2019 Oct 2019 Nov 2019 Dec 2019 Jan 2020 Feb 2020 Mar 2020 Apr 2020 May 2020 Jun 2020
Outpatient services Inpatients services
Trend analysis of total reported numbers of outpatient and Inpatient from functional public hospitals [MoH & MoHE], for six months (January to June 2020), is presented in [Figure 35]. In 2020, the total reported outpatients are 1,389,250 while the inpatients are 370,976.
Figure 36: The number of patients received services in laboratories, blood bank, and imaging services in public hospitals, June 2020
548,259
136,567
197,091
287,473
236,273
87,843
214,824
17,446
30,182
14,678
32,133
72,391
12,098
5,228
939
1,477
2,546
1,108
937
3,120
524
240
257
278
493
141
45,457
12,769
33,914
24,849
29,053
16,623
25,650
8,639
4,348
3,417
9,633
9,189
2,793
0
100,000
200,000
300,000
400,000
500,000
600,000
Damascus Rural Damascus
Aleppo Lattakia Tartous Homs Hama Al -Hasakeh Deir-ez-Zor Ar-Raqqa Dar'a As -Sweida Quneitra
Laboratory services Blood bank service Imaging service
ii. Laboratories, blood bank, and imaging services
The number of patients received services in hospitals’ laboratories, blood bank, and imaging departments was assessed at a hospital level, and the total number of cases from January to June 2020 analyzed at governorate level [Figure 36].
Trend analysis of number of patients received services in hospitals’ blood banks and imaging departments, from January to June 2020, is presented in [Figure 37]. In 2020, the total reported patients received services in blood banks are 93,948 [of note: the total number of blood bags and products in 2020 are 169,116], while patients received imaging services are 1,192,563 [of note: the total performed service (X-Ray, MRI, and CT Scan pictures) in 2020 are 1,495,680].

HeRAMS | Bi-Annual Report | January - June 2020Public Hospitals31
Figure 37: Trend analysis of number of patients received services in blood banks and imaging services in public hospitals, January 2019 to June 2020
17,603 17,076 17,614 17,669 17,467 18,970 18,023 18,896 17,128 15,954 15,935 16,549 17,673 18,099 15,209 12,246 13,43317,288
31,154 32,386 32,412 33,898 34,467 33,163 34,606 31,828 31,363 30,902 28,550 31,118 31,973 32,458 29,941 22,196 23,918 28,630
238,820 238,596 252,011233,370 218,780 221,219
257,383233,577
254,295 262,962235,441
303,905
230,587 247,115
201,362
127,510159,655
226,334
0
50,000
100,000
150,000
200,000
250,000
300,000
350,000
Jan 2019 Feb 2019 Mar 2019 Apr 2019 May 2019
Jun 2019 Jul 2019 Aug 2019
Sep 2019 Oct 2019 Nov 2019
Dec 2019 Jan 2020 Feb 2020 Mar 2020 Apr 2020 May 2020
Jun 2020
Blood bank service Blood bags and products Imaging service
1,846,3211,872,7401,976,1871,924,265
1,714,390
1,878,963
2,112,496
1,869,0671,990,5161,931,187
1,837,2131,937,965
1,873,8311,839,575
1,570,613
1,057,7161,209,226
1,887,258
1,000,000
1,200,000
1,400,000
1,600,000
1,800,000
2,000,000
2,200,000
Jan 2019 Feb 2019 Mar 2019 Apr 2019 May 2019
Jun 2019 Jul 2019 Aug 2019 Sep 2019 Oct 2019 Nov 2019 Dec 2019 Jan 2020 Feb 2020 Mar 2020 Apr 2020 May 2020
Jun 2020
Laboratory services
6.2 Surgical and trauma care
The surgical and trauma care services is assessed at hospitals’ level. Descriptive analysis is conducted at governorate’s level for the number of reported emergency cases, and surgeries (elective and emergency).
iii. Emergency cases reported in emergency departments
Figure 38 presents the total number of cases in emergency departments, reported during December 2019 from functional public hospitals at governorate level.
Figure 38: The number of reported cases in emergency department in public hospitals, June 2020
44,705
37,048
31,194 29,814 28,37424,972
17,967 16,352 15,852 15,84712,935
3,052 1,940
05,000
10,00015,00020,00025,00030,00035,00040,00045,00050,000
Damascus Lattakia Tartous Aleppo Homs Hama Dar'a As -Sweida Al -Hasakeh Rural Damascus
Ar-Raqqa Quneitra Deir-ez-Zor

HeRAMS | Bi-Annual Report | January - June 2020Public Hospitals32
Figure 39: Trend analysis of number of reported cases in emergency department in public hospitals, January 2019 to June 2020
320,368306,689
326,739
302,873 301,476312,053
332,815 333,126315,282 318,284
294,167 294,678301,901 305,107
257,725
184,790
223,296
280,052
180,000
200,000
220,000
240,000
260,000
280,000
300,000
320,000
340,000
360,000
Jan 2019
Feb 2019
Mar 2019
Apr 2019
May 2019
Jun 2019
Jul 2019
Aug 2019
Sep 2019
Oct 2019
Nov 2019
Dec 2019
Jan 2020
Feb 2020
Mar 2020
Apr 2020
May 2020
Jun 2020
Emergency services
Trend analysis of total number of cases in emergency departments in functional public hospitals [MoH & MoHE], from January to June 2020, is presented in [Figure 39]. In 2020, the total number of cases in emergency departments are 1,552,871.
iv. Emergency and elective surgeries
The number of emergency surgeries to elective surgeries was assessed at a hospital level, and total numbers were summarized and analyzed at governorate level [Figure 40].
During June 2020, the highest workload of elective surgeries is reported from Al-Assad university hospital in Damascus (1,126), followed by Tishreen university hospital in Lattakia (810), Damascus MoH Hospital (Al-Mojtahid (791), Hama national hospital (719), Dermatology and Venereology university hospital in Damascus (716), Al-Mouwasat university hospital (690) in Damascus, Ar-Razi MoH hospital in Aleppo (640), Children university hospital in Damascus (622), and Al-Bassel Heart Institute in Damascus (510).
While the highest workload of emergency surgeries is reported from Al-Bassel hospital in Tartous (2,002), followed by National hospital in Lattakia (892), National hospital in Ar-Raqqa (442), Zaid Ash-Shariti hospital in As-Sweida (440), Al-Mouwasat MoHE hospital (359), Hama national hospital (310), Tishreen university hospital in Lattakia (281), Aleppo university hospital (251), Damascus MoH Hospital (Al-Mojtahid (220)).

HeRAMS | Bi-Annual Report | January - June 2020Public Hospitals33
Figure 40: The number of emergency surgeries vs. elective surgeries in public hospitals, June 2020
5,516
1,867 1,7351,344 1,343
1,106757 591 501 499 275 144 65
844535
1,341795
111
2,356
166458
156481
131 109 160
1,000
2,000
3,000
4,000
5,000
6,000
Damascus Aleppo Lattakia Hama Homs Tartous Rural Damascus
Ar-Raqqa Dar'a As -Sweida Al -Hasakeh Quneitra Deir-ez-Zor
Elective surgery Emergency surgery
By analyzing the percent of total emergency surgeries to elective surgeries during June 2020, the highest percent across different governorates is reported in Tartous, As-Sweida, Ar-Raqqa, and Lattakia governorates.
Across all reported functional public hospitals, 32% of surgeries are emergency while 68% are elective [Figure 41].
Trend analysis of total number of elective and emergency surgeries reported in functional public hospitals [MoH & MoHE], from January to June 2020 is presented in Figure 42. In 2020, the total reported emergency surgeries are 42,459 while the elective surgeries are 67,588.
8% 13% 18% 20% 22% 24%32% 37% 43% 44% 44% 49%
68%
32%
92% 87% 82% 80% 78% 76%68% 63% 57% 56% 56% 51%
32%
68%
0%
10%
20%
30%
40%
50%
60%
70%
80%
90%
100%
Homs Damascus Rural Damascus
Deir-ez-Zor Aleppo Dar'a Al -Hasakeh Hama Quneitra Lattakia Ar-Raqqa As -Sweida Tartous Total
% Emergency surgery % Elective surgery
Figure 41: Percentage of total emergency surgeries to elective surgeries in public hospitals per governorate, June 2020
HeRAMS | Bi-Annual Report | January - June 2020Public Hospitals34
6,546 6,601 7,243 7,016 7,958 7,870 7,911 8,124 8,048 7,690 7,307 7,546 7,382 7,683 7,6805,499
6,716 7,499
15,094 15,46116,791 16,609
14,483 14,574
20,535
15,554
19,216 18,830
15,652 15,941 15,050 14,560
11,977
4,2775,981
15,743
0
5,000
10,000
15,000
20,000
25,000
Jan 2019
Feb 2019
Mar 2019
Apr 2019
May 2019
Jun 2019
Jul 2019
Aug 2019
Sep 2019
Oct 2019
Nov 2019
Dec 2019
Jan 2020
Feb 2020
Mar 2020
Apr 2020
May 2020
Jun 2020
Emergency surgery Elective surgery
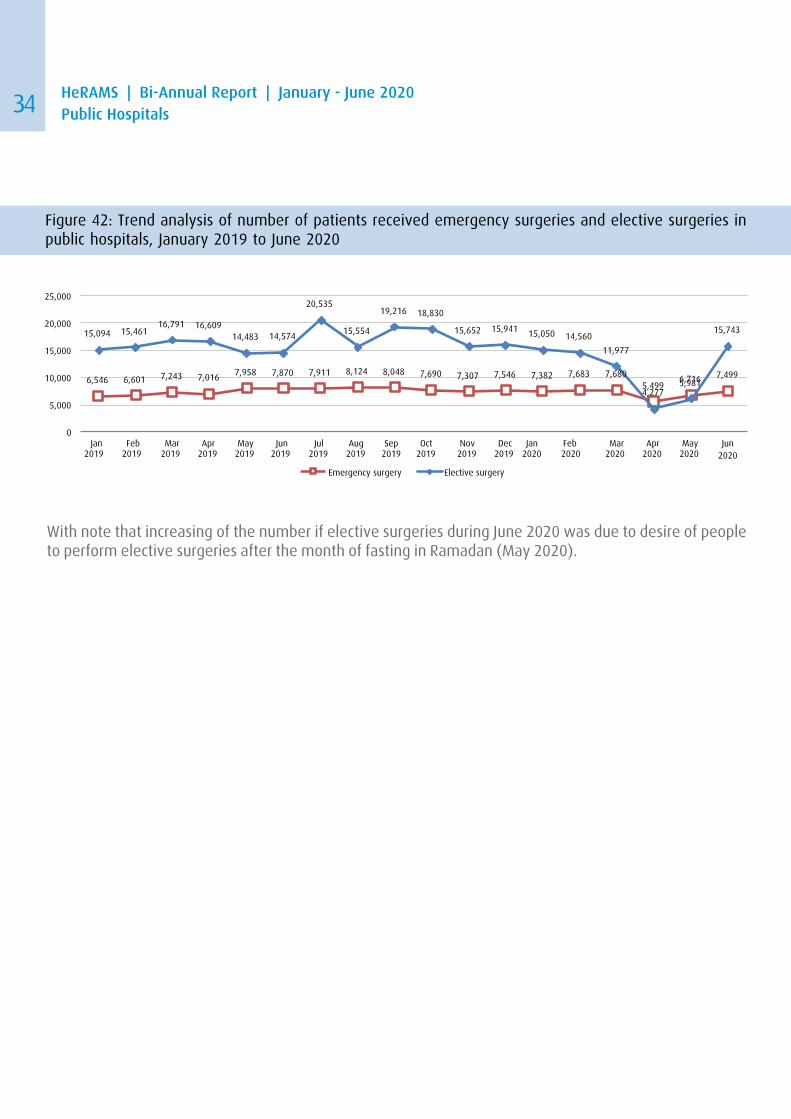
Figure 42: Trend analysis of number of patients received emergency surgeries and elective surgeries in public hospitals, January 2019 to June 2020
With note that increasing of the number if elective surgeries during June 2020 was due to desire of people to perform elective surgeries after the month of fasting in Ramadan (May 2020).
HeRAMS | Bi-Annual Report | January - June 2020Public Hospitals35
Figure 43: The number of patients received ICU services in public hospitals, June 2020
Figure 44: Trend analysis of number of patients received ICU services in public hospitals, January 2019 to June 2020
1,304
944
724 704
515416
323 314197 147 142
75 67
0
200
400
600
800
1,000
1,200
1,400
Damascus Hama Aleppo Lattakia Homs As -Sweida Ar-Raqqa Tartous Dar'a Rural Damascus
Quneitra Deir-ez-Zor Al -Hasakeh
6,569
5,9006,253
5,839 5,875 5,9806,372
5,773 5,9816,224
5,908 5,9706,214 6,203
5,328
3,672
4,635
5,872
3,0003,5004,0004,5005,0005,5006,0006,5007,000
Jan 2019
Feb 2019
Mar 2019
Apr 2019
May 2019
Jun 2019
Jul 2019
Aug 2019
Sep 2019
Oct 2019
Nov 2019
Dec 2019
Jan 2020
Feb 2020
Mar 2020
Apr 2020
May 2020
Jun 2020
ICU services
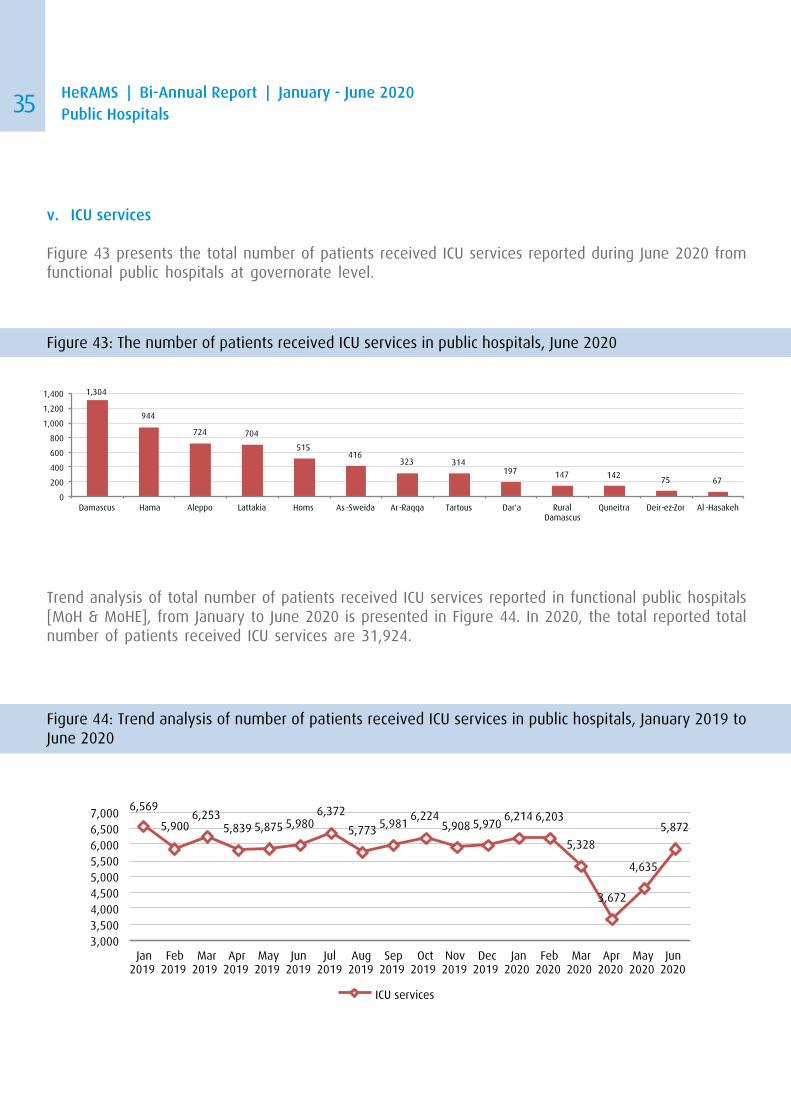
v. ICU services
Figure 43 presents the total number of patients received ICU services reported during June 2020 from functional public hospitals at governorate level.
Trend analysis of total number of patients received ICU services reported in functional public hospitals [MoH & MoHE], from January to June 2020 is presented in Figure 44. In 2020, the total reported total number of patients received ICU services are 31,924.

HeRAMS | Bi-Annual Report | January - June 2020Public Hospitals36
Figure 45: The number of patients received trauma services in public hospitals, June 2020
2,552
2,147
465 458300 241 156 121 60 57 36 21 21
0
500
1,000
1,500
2,000
2,500
3,000
Hama Damascus Aleppo Homs Dar'a Lattakia Ar-Raqqa Rural Damascus
Tartous As -Sweida Al -Hasakeh Deir-ez-Zor Quneitra
vi. Trauma services
Figure 45 presents the total number of patients received Orthopaedic/trauma ward for advanced orthopaedic care reported during June 2020 from functional public hospitals at governorate level.
Trend analysis of total number of patients received trauma services reported in functional public hospitals [MoH & MoHE], from January to June 2020 is presented in Figure 46. In 2020, the total reported total number of patients received trauma services are 34,481.
Figure 46: Trend analysis of number of patients received trauma services in public hospitals, January 2019 to June 2020
6,031 6,098
7,322 7,1396,776
7,115
8,452
7,521
8,9698,187
7,746
6,122 6,1836,609
6,003
3,850
5,201
6,635
3,500
4,500
5,500
6,500
7,500
8,500
9,500
Jan 2019
Feb 2019
Mar 2019
Apr 2019
May 2019
Jun 2019
Jul 2019
Aug 2019
Sep 2019
Oct 2019
Nov 2019
Dec 2019
Jan 2020
Feb 2020
Mar 2020
Apr 2020
May 2020
Jun 2020
Trauma services

HeRAMS | Bi-Annual Report | January - June 2020Public Hospitals37
Figure 48: Trend analysis of number of patients received burn patient management in public hospitals, January 2019 to June 2020
1,3141,403
1,240
1,076 1,131
1,380
1,1441,223 1,201 1,248
851
1,0601,163
1,310
1,026
833964
1,568
500
700
900
1,100
1,300
1,500
1,700
Jan 2019
Feb 2019
Mar 2019
Apr 2019
May 2019
Jun 2019
Jul 2019
Aug 2019
Sep 2019
Oct 2019
Nov 2019
Dec 2019
Jan 2020
Feb 2020
Mar 2020
Apr 2020
May 2020
Jun 2020
Burn patient management
Figure 47: The number of patients received burn patient management in public hospitals, June 2020
629
353
186113 87
53 40 34 28 25 10 7 3
0
100
200
300
400
500
600
700
Ar-Raqqa Tartous Homs Dar'a Damascus Al -Hasakeh Aleppo Lattakia Hama Deir-ez-Zor Quneitra As -Sweida Rural Damascus
vii. Burn patient management
Figure 47 presents the total number of patients received burn patient management reported during June 2020 from functional public hospitals at governorate level.
Trend analysis of total number of patients received burn patient management reported in functional public hospitals [MoH & MoHE], from January to June 2020 is presented in Figure 48. In 2020, the total reported total number of patients received burn patient management are 6,864.
HeRAMS | Bi-Annual Report | January - June 2020Public Hospitals38
Figure 49: Number of functioning hospitals providing CEmONC services/ 500,000 Population, June 2020
4.8
4.0
2.92.7
2.4
2.1
1.5 1.5 1.4
1.1
0.70.5
0.3
1.2
0.0
0.5
1.0
1.5
2.0
2.5
3.0
3.5
4.0
4.5
5.0
Quneitra As -Sweida Dar'a Tartous Homs Lattakia Hama Al -Hasakeh Ar-Raqqa Rural Damascus Deir-ez-Zor Damascus Aleppo Grand Total
Number of functioing hospitals providing CEmONC Services/ 500,000 Population
Inter-Agency Standing Committee (IASC) Standards: 1 hospital
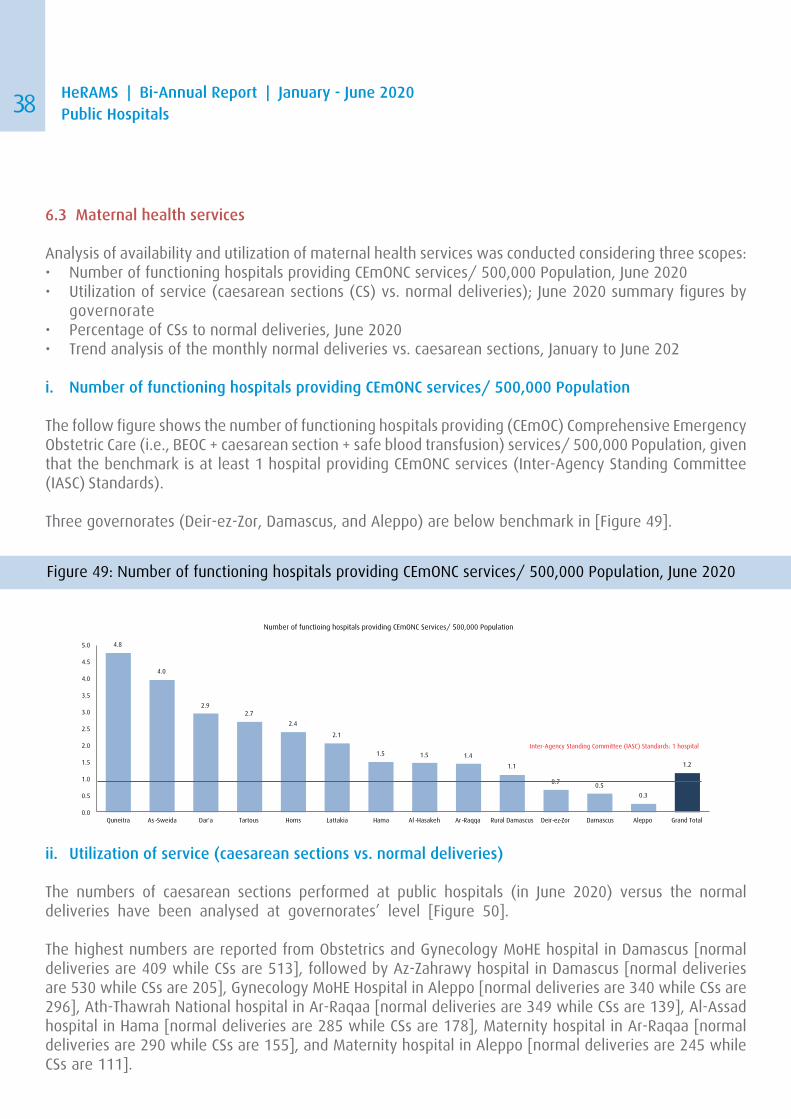
6.3 Maternal health services
Analysis of availability and utilization of maternal health services was conducted considering three scopes:• Number of functioning hospitals providing CEmONC services/ 500,000 Population, June 2020• Utilization of service (caesarean sections (CS) vs. normal deliveries); June 2020 summary figures by
governorate• Percentage of CSs to normal deliveries, June 2020• Trend analysis of the monthly normal deliveries vs. caesarean sections, January to June 202
i. Number of functioning hospitals providing CEmONC services/ 500,000 Population
The follow figure shows the number of functioning hospitals providing (CEmOC) Comprehensive Emergency Obstetric Care (i.e., BEOC + caesarean section + safe blood transfusion) services/ 500,000 Population, given that the benchmark is at least 1 hospital providing CEmONC services (Inter-Agency Standing Committee (IASC) Standards).
Three governorates (Deir-ez-Zor, Damascus, and Aleppo) are below benchmark in [Figure 49].
ii. Utilization of service (caesarean sections vs. normal deliveries)
The numbers of caesarean sections performed at public hospitals (in June 2020) versus the normal deliveries have been analysed at governorates’ level [Figure 50].
The highest numbers are reported from Obstetrics and Gynecology MoHE hospital in Damascus [normal deliveries are 409 while CSs are 513], followed by Az-Zahrawy hospital in Damascus [normal deliveries are 530 while CSs are 205], Gynecology MoHE Hospital in Aleppo [normal deliveries are 340 while CSs are 296], Ath-Thawrah National hospital in Ar-Raqaa [normal deliveries are 349 while CSs are 139], Al-Assad hospital in Hama [normal deliveries are 285 while CSs are 178], Maternity hospital in Ar-Raqaa [normal deliveries are 290 while CSs are 155], and Maternity hospital in Aleppo [normal deliveries are 245 while CSs are 111].

HeRAMS | Bi-Annual Report | January - June 2020Public Hospitals39
Figure 51: Percentage of caesarean sections to normal deliveries in public hospitals, June 2020
35% 35%46% 48% 48% 52% 55% 57% 59% 62% 65% 68% 68%
54%
65% 65%54% 52% 52% 48% 45% 43% 41% 38% 35% 32% 32%
46%
0%
10%
20%
30%
40%
50%
60%
70%
80%
90%
100%
Tartous Lattakia Homs Hama Deir -ez-Zor Rural Damascus
As-Sweida Damascus Aleppo Quneitra Al -Hasakeh Dar'a Ar-Raqqa Total
CSs % Normal deliveries %
939
639585
465 437
314253 251 220 196
158 141 130
718
294
407
508
207
295
138
290
408
162
296
15480
0
100
200
300
400
500
600
700
800
900
1,000
Damascus Ar-Raqqa Aleppo Hama Dar'a Rural Damascus
Al -Hasakeh Homs Lattakia As-Sweida Tartous Deir -ez-Zor Quneitra
Normal deliveries CSs
Figure 50: The No. of normal deliveries and caesarean sections (CSs) performed at public hospitals, June 2020
iii. Percentage of CS to normal deliveries
The highest figures of caesarian sections in June 2020 are reported in Deir-ez-Zor (154 CSs compared to 141 normal deliveries), Lattakia (408 CSs compared to 220 normal deliveries), Homs (290 CSs compared to 251 normal deliveries), Hama (508 CSs compared to 465 normal deliveries), and Tartous (296 CSs compared to 158 normal deliveries).
Across all reported functional hospitals in June 2020, 46% (3,957) of deliveries are CSs while 54% (4,728) are normal deliveries. Details on percent of CSs to normal deliveries per governorate in June 2020, is provided in [Figure 51].
HeRAMS | Bi-Annual Report | January - June 2020Public Hospitals40
530
314245
110
409340
110
205
295
111
336
513
296
72
0
100
200
300
400
500
600
Damascus Rural Damascus Aleppo Lattakia Damascus Rural Damascus Aleppo Lattakia
MoH Hospitals MoHE Hospitals
Normal_deliveries CSs
7,027
6,372 6,5526,227
5,824 5,819 6,0116,429
5,8915,368
4,8815,303 5,225
4,9234,507
4,1314,499
4,7285,187
4,6614,995
4,608 4,483 4,4714,742
4,458 4,430 4,3293,981
4,247 4,1793,720
4,0133,564 3,506
3,957
3,0003,5004,0004,5005,0005,5006,0006,5007,0007,500
Normal deliveries CSs
Jan 2019
Feb 2019
Mar 2019
Apr 2019
May 2019
Jun 2019
Jul 2019
Aug 2019
Sep 2019
Oct 2019
Nov 2019
Dec 2019
Jan 2020
Feb 2020
Mar 2020
Apr 2020
May 2020
Jun 2020
Figure 52: Trend analysis of the monthly numbers of normal deliveries vs. caesarean sections in public hospitals, January 2019 to June 2020
Figure 53: Comparison of MoH & MoHE hospitals workload of normal deliveries vs, CSs, June 2020
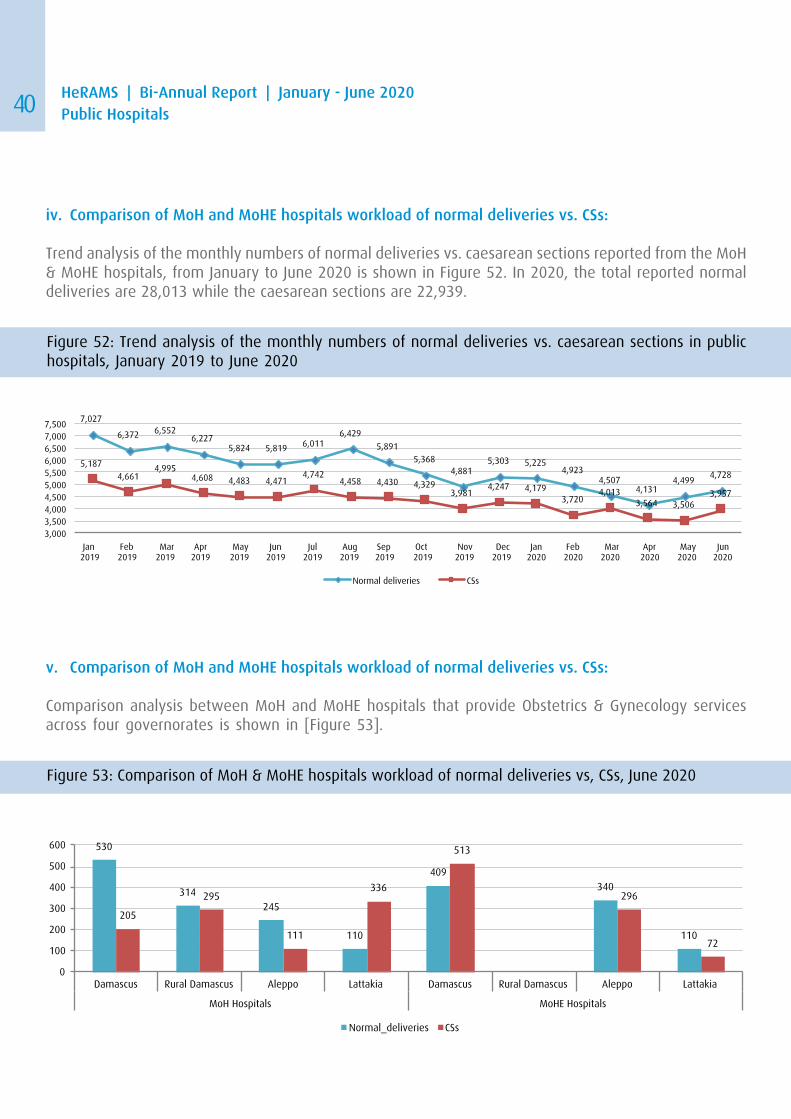
iv. Comparison of MoH and MoHE hospitals workload of normal deliveries vs. CSs:
Trend analysis of the monthly numbers of normal deliveries vs. caesarean sections reported from the MoH & MoHE hospitals, from January to June 2020 is shown in Figure 52. In 2020, the total reported normal deliveries are 28,013 while the caesarean sections are 22,939.
v. Comparison of MoH and MoHE hospitals workload of normal deliveries vs. CSs:
Comparison analysis between MoH and MoHE hospitals that provide Obstetrics & Gynecology services across four governorates is shown in [Figure 53].

HeRAMS | Bi-Annual Report | January - June 2020Public Hospitals41
626 600
265
160
69 58 28 12 7 5 20
100
200
300
400
500
600
700
Hama Rural Damascus
Damascus Homs Aleppo Lattakia As -Sweida Tartous Quneitra Dar'a Al -Hasakeh Deir-ez-Zor Ar-Raqqa
3,8083,536 3,521
3,206 3,149
3,595 3,514
3,176 3,246
2,8132,652
3,257 3,1973,326
2,627
1,667
2,163
1,832
1,500
2,000
2,500
3,000
3,500
4,000
Jan 2019
Feb 2019
Mar 2019
Apr 2019
May 2019
Jun 2019
Jul 2019
Aug 2019
Sep 2019
Oct 2019
Nov 2019
Dec 2019
Jan 2020
Feb 2020
Mar 2020
Apr 2020
May 2020
Jun 2020
Management of children diseases
Figure 54: Number of children with severe diseases in public hospitals, June 2020
Figure 55: Trend analysis of reported cases of severe children diseases in public hospitals, January 2019 to June 2020
6.4 Child health
Management of severe children diseases (such as acute respiratory diseases, Meningitis, blood diseases cancer, etc…) are assessed at hospitals level. Figure 54 shows the distribution of total reported cases of management of children classified with severe or very severe diseases (parenteral fluids and drugs, oxygen) by governorate.
The high reported figures in Hama, Rural Damascus, Damascus, Homs, and Aleppo are due to the high numbers of IDPs, and also availability of MoHE referral hospitals for children in some of these areas.
Trend analysis of reported cases of severe children diseases from January to June 2020, is presented in [Figure 55]. In 2020, the total reported cases of severe children diseases are 14,812.

HeRAMS | Bi-Annual Report | January - June 2020Public Hospitals42
38
30
2018
1210
7 7 7 63 2 1
0
5
10
15
20
25
30
35
40
Deir-ez-Zor Aleppo Lattakia Hama Dar'a Al -Hasakeh Damascus Ar-Raqqa As -Sweida Homs Tartous Rural Damascus
Quneitra
7383
69
93 96
123135
86 92 9587 88 86
67 71 77
104
161
0
20
40
60
80
100
120
140
160
180
Jan 2019
Feb 2019
Mar 2019
Apr 2019
May 2019
Jun 2019
Jul 2019
Aug 2019
Sep 2019
Oct 2019
Nov 2019
Dec 2019
Jan 2020
Feb 2020
Mar 2020
Apr 2020
May 2020
Jun 2020
Management of severe acute malnutrition with complications
Figure 56: The number of children with severe acute malnutrition with complications in public hospitals, June 2020
Figure 57: Trend analysis of number of children with severe acute malnutrition with complications in public hospitals, January 2019 to June 2020
6.5 Nutrition
Monitoring of cases in stabilization centre for the management of severe acute malnutrition with medical complications, with availability of ready-to-use therapeutic foods and dedicated trained team of doctors, nurses, and nurse aids, 24/7 is systematically conducted at public hospitals level; Figure 56 demonstrates the number of cases reported in June 2020, at governorate level.
The high reported figures in Deir-ez-Zor , Aleppo , Lattakia, Hama, and Dar’a, due to the high numbers of IDPs.
Trend analysis of reported cases of severe acute malnutrition from January to June 2020, is presented in [Figure 57]. In 2020, the total reported children with severe acute malnutrition are 566.
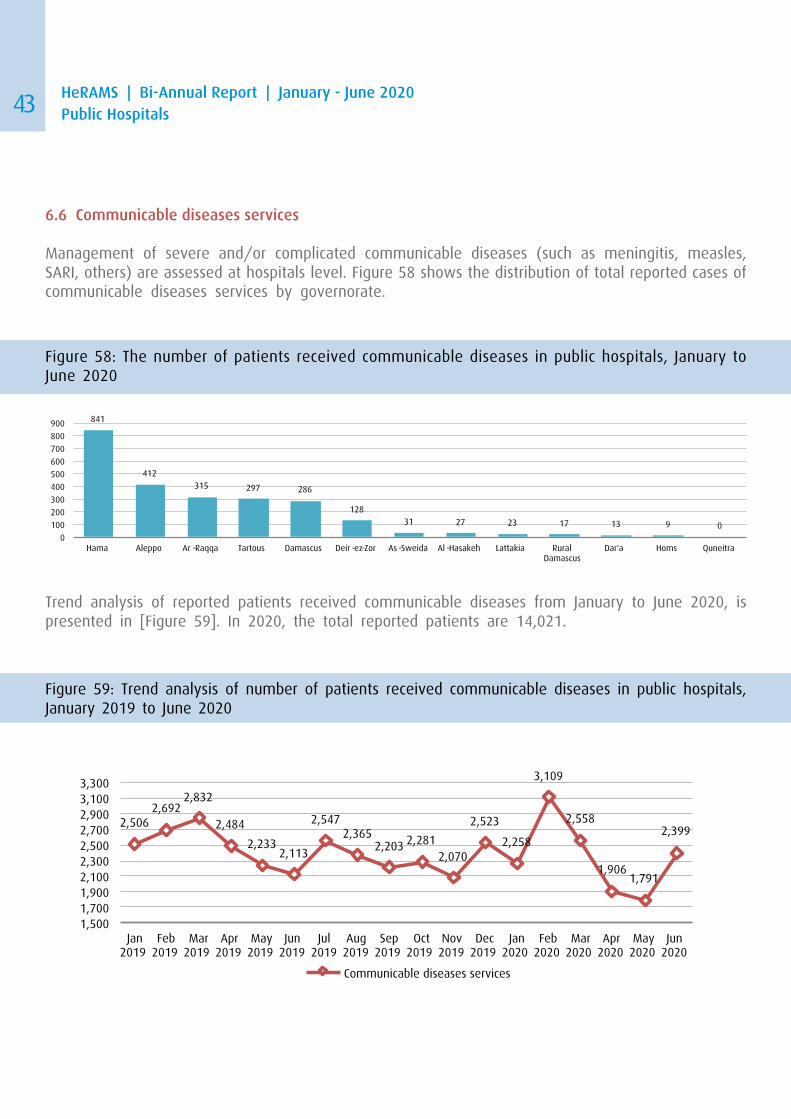
HeRAMS | Bi-Annual Report | January - June 2020Public Hospitals43
841
412315 297 286
12831 27 23 17 13 9 0
0
100
200
300
400
500
600
700
800
900
Hama Aleppo Ar -Raqqa Tartous Damascus Deir -ez-Zor As -Sweida Al -Hasakeh Lattakia Rural Damascus
Dar'a Homs Quneitra
2,5062,692
2,832
2,484
2,2332,113
2,5472,365
2,203 2,2812,070
2,523
2,258
3,109
2,558
1,9061,791
2,399
1,5001,7001,9002,1002,3002,5002,7002,9003,1003,300
Jan 2019
Feb 2019
Mar 2019
Apr 2019
May 2019
Jun 2019
Jul 2019
Aug 2019
Sep 2019
Oct 2019
Nov 2019
Dec 2019
Jan 2020
Feb 2020
Mar 2020
Apr 2020
May 2020
Jun 2020
Communicable diseases services
Figure 59: Trend analysis of number of patients received communicable diseases in public hospitals, January 2019 to June 2020
Figure 58: The number of patients received communicable diseases in public hospitals, January to June 2020
6.6 Communicable diseases services
Management of severe and/or complicated communicable diseases (such as meningitis, measles, SARI, others) are assessed at hospitals level. Figure 58 shows the distribution of total reported cases of communicable diseases services by governorate.
Trend analysis of reported patients received communicable diseases from January to June 2020, is presented in [Figure 59]. In 2020, the total reported patients are 14,021.

HeRAMS | Bi-Annual Report | January - June 2020Public Hospitals44
467
312
482
1,37
4
472
1,17
4
52 16 358
280 31
2
87 80634
60 354
193
142
192
53 4 0 96 8 15 0630
459
937
2,37
7
486
1,26
0
69 523
89 374
523
343
91
1,94
1
102 2,34
1
3,26
7
519
824
1,09
5
39 33 80 104
477
781,13
6
160
655
690
391
219
449
215
75 334
108
117
30
2,67
3
21,0
76
674
311
415
479
943
0 0 0 0 398
0
2,11
6
75 330
776
471
0 1,51
1
8 100
0 304
321
0
0
5,000
10,000
15,000
20,000
25,000
Damascus Rural Damascus
Aleppo Lattakia Tartous Homs Hama Al -Hasakeh Deir-ez-Zor Ar-Raqqa Dar'a As -Sweida Quneitra
Management of diabetes Treatment of diabetic complications Hypertension Cardiovascular services End Stage Kidney Disease (ESKD) treatment Cancer Rehabilitation services
Figure 60: The number of NCDs’ consultations in public hospitals, June 2020
6.7 NCDs (non-communicable diseases)
NCDs were assessed through HeRAMS by checking the availability and utilization of services at hospitals level. The majority of high reported figures of NCDs (Diabetes, Treatment of diabetic complications, Hypertension, Cardiovascular, Kidney, and Cancer diseases) are from Damascus hospitals.
Among all NCDs during 2020, Cancer patients’ consultations are the highest reported figures, mainly in Damascus, Rural Damascus (has one cancer specialized hospital). It worth mentioning that cancer is treated at secondary and tertiary levels only, while other NCDs (diabetes and hypertension, etc…) usually managed at primary and secondary care levels, unless patients develop complications.
Cardiovascular consultations are the second highest reported figures during 2020, mainly in Lattakia (has one cardiovascular specialized hospital), Damascus (has two cardiovascular specialized hospitals), and Aleppo (has two cardiovascular specialized hospitals, Homa, Hama, and Tartous [Figure 60]

HeRAMS | Bi-Annual Report | January - June 2020Public Hospitals45
5,2955,623 5,685 5,643 5,733 5,641
6,356
5,0915,413
4,888 4,6924,346
4,691 4,8414,203
2,642 2,695
5,466
2,035 2,137 2,153 2,1251,735 1,807 1,789 1,637 1,804 2,025 1,811 1,843 1,804 2,045
1,624
596 758
1,751
0
1,000
2,000
3,000
4,000
5,000
6,000
7,000
Jan2019
Feb2019
Mar 2019
Apr 2019
May 2019
Jun2019
Jul2019
Aug 2019
Sep2019
Oct2019
Nov 2019
Dec 2019
Jan2020
Feb2020
Mar 2020
Apr 2020
May 2020
Jun2020
Management of diabetes Treatment of diabetic complications
7,591
8,543 8,4968,232
7,7777,516
9,146
8,1328,499
7,9837,652
7,9678,333
9,193
7,735
4,818
5,518
8,161
4,5005,0005,5006,0006,5007,0007,5008,0008,5009,0009,500
Hypertension
Jan2019
Feb2019
Mar 2019
Apr 2019
May 2019
Jun2019
Jul2019
Aug 2019
Sep2019
Oct2019
Nov 2019
Dec 2019
Jan2020
Feb2020
Mar 2020
Apr 2020
May 2020
Jun2020
Figure 61: Trend analysis of total monthly number of NCDs’ consultations reported in public hospitals, January 2019 to June 2020
The monthly trend of reported NCDs’ consultations at functional public hospitals from January to June 2020 is shown in [Figure 61].
In 2020, the total reported NCDs’ consultations are as follow:
• Diabetes: 24,538• Diabetic complications: 8,578• Hypertension: 43,758• Cardiovascular: 52,005• ESKD: 25,320 [of note: the total performed ESKD Sessions in 2017: 184,477]• Cancer: 136,550

HeRAMS | Bi-Annual Report | January - June 2020Public Hospitals46
4,190
3,9634,049 4,089
4,1774,041 4,094
4,1824,252
4,120
4,855 4,883
4,226 4,2564,164
4,0064,089
4,579
3,500
3,700
3,900
4,100
4,300
4,500
4,700
4,900
5,100
End Stage Kidney Disease (ESKD) treatment
Jan2019
Feb2019
Mar 2019
Apr 2019
May 2019
Jun2019
Jul2019
Aug 2019
Sep2019
Oct2019
Nov 2019
Dec 2019
Jan2020
Feb2020
Mar 2020
Apr 2020
May 2020
Jun2020
18,07217,487
18,47219,132
15,022
17,356
21,242
17,227
22,62523,695
20,16021,033
24,452
22,50321,411
22,240
18,975
26,969
14,000
16,000
18,000
20,000
22,000
24,000
26,000
28,000
Cancer
Jan2019
Feb2019
Mar 2019
Apr 2019
May 2019
Jun2019
Jul2019
Aug 2019
Sep2019
Oct2019
Nov 2019
Dec 2019
Jan2020
Feb2020
Mar 2020
Apr 2020
May 2020
Jun2020
11,66712,211 12,178
11,304
9,8229,288
11,436
9,052
11,55112,032
10,51511,214 11,133
11,605
9,168
3,840
5,359
10,900
3,6004,6005,6006,6007,6008,6009,600
10,60011,60012,60013,600
Cardiovascular services
Jan2019
Feb2019
Mar 2019
Apr 2019
May 2019
Jun2019
Jul2019
Aug 2019
Sep2019
Oct2019
Nov 2019
Dec 2019
Jan2020
Feb2020
Mar 2020
Apr 2020
May 2020
Jun2020

HeRAMS | Bi-Annual Report | January - June 2020Public Hospitals47
Figure 62: The number of rehabilitation services in public hospitals, June 2020
2,116
1,511
776
471330 321 304
100 75 8 0 0 00
500
1,000
1,500
2,000
2,500
Damascus Hama Lattakia Tartous Aleppo As -Sweida Dar'a Deir-ez-Zor Rural Damascus
Al -Hasakeh Homs Ar-Raqqa Quneitra
6.8 Rehabilitation services
Rehabilitation services and assistive device provision, including post-operative rehabilitation for trauma-related injuries are assessed at hospitals level. Figure 62 shows the distribution of total reported cases of rehabilitation services by governorate.
Trend analysis of reported patients received rehabilitation services from January to June 2020, is presented in [Figure 63]. In 2020, the total reported patients are 30,344.
7,6458,620
7,9807,076 6,864 7,192
9,226
6,336
9,7779,166
7,3656,799
7,4098,183
5,032
1,772 1,936
6,012
0
2,000
4,000
6,000
8,000
10,000
12,000
Rehabilitation services
Jan2019
Feb2019
Mar 2019
Apr 2019
May 2019
Jun2019
Jul2019
Aug 2019
Sep2019
Oct2019
Nov 2019
Dec 2019
Jan2020
Feb2020
Mar 2020
Apr 2020
May 2020
Jun2020
Figure 63: Trend analysis of number of rehabilitation services in public hospitals, January 2019 to June 2020

HeRAMS | Bi-Annual Report | January - June 2020Public Hospitals48
Figure 64: The number of psychiatric inpatients in public hospitals, June 2020
Figure 65: Trend analysis of number of psychiatric inpatient cases in public hospitals, January 2019 to June 2020
378
286
460 0 0 0 0 0 0 0 0 0
0
100
200
300
400
Rural Damascus
Aleppo Damascus Lattakia Tartous Homs Hama Al -Hasakeh Deir -ez-Zor Ar -Raqqa Dar'a As -Sweida Quneitra
Psychiatric inpatient
782803
816
780
735756 761 750
710697
675 675 664647
680
627 631
710
600
650
700
750
800
850
Jan 2019
Feb 2019
Mar 2019
Apr 2019
May 2019
Jun 2019
Jul 2019
Aug 2019
Sep 2019
Oct 2019
Nov 2019
Dec 2019
Jan 2020
Feb 2020
Mar 2020
Apr 2020
May 2020
Jun 2020
Psychiatric inpatient
6.9 Mental health
Inpatient care for management of mental disorders by specialized health-care providers are assessed at hospitals level. Figure 64 shows the distribution of total reported cases of Psychiatric inpatient by governorate.
The key figures of Psychiatric inpatient during June 2020 are reported from Rural Damascus (Ibn-Sina Psychiatric MoH hospital (366 cases), followed by Aleppo (Ibn-Khaldoun MoH hospital (286 cases).
Trend analysis of monthly reported number of psychiatric inpatients in public hospitals [MoH & MoHE] from January to December 2018 is shown in [Figure 65]. In 2020, the total reported psychiatric inpatients cases are 3,959.

HeRAMS | Bi-Annual Report | January - June 2020Public Hospitals49
The availability of different types of essential and specialized equipment and supplies was assessed at hospital level, based on a standard checklist2.
In its ninth year of crisis, Syria’s hospitals (have a remarkable improvements) are still suffering from shortages and/or malfunction of medical devices/ equipment to provide secondary care services. In insecure governorates, medical devices are either destroyed, burned, or malfunctioned, while in safe areas the medical devices are overburdened by increased numbers of people (actual numbers of people in the area, in addition to IDPs and patients /injured people from surrounding areas).
Maintenance of malfunctioned devices remains a concern, due to non-availability of spare parts, accredited agent to provide maintenance support, or difficulty of accessibility in many cases.
Analysis of availability of essential and specialized equipment was measured across all functional public hospitals [MoH & MoHE] (86/113), in terms of functional equipment out of the total available equipment in the hospital. The produced analysis provides good indication of the current readiness of the hospitals to provide the health services, and also to guide focused planning for procurement of equipment and machines, to fill-in identified gaps.
Gaps on essential and specialized equipment and machines were observed, even within the functional public hospitals. Further details are provided on [Figure 66] and [Figure 67].
7. Availability of medical equipment
73%
84%
84%
85%
85%
85%
86%
88%
88%
88%
90%
93%
93%
93%
94%
94%
96%
97%
Autoclave
Dry_Sterilizer
Weighing Scale for infants
Ambu bag (Paediatric and Adult)
Fetoscope
Pulse Oximeter
Oxygen Station
Weighing Scale for adults
Operating_tables
Delivery_table
Suction machine
Vaginal examination set
Length Measurement Device
Oxygen cylinders
Weighing Scale for children
Height Measurement Device
Minor Surgical sets
Nebulizer
Figure 66: Percentage of functional essential equipment/ total available equipment in functional public hospitals, June 2020
2 A more detailed list of essential equipment is available upon request.
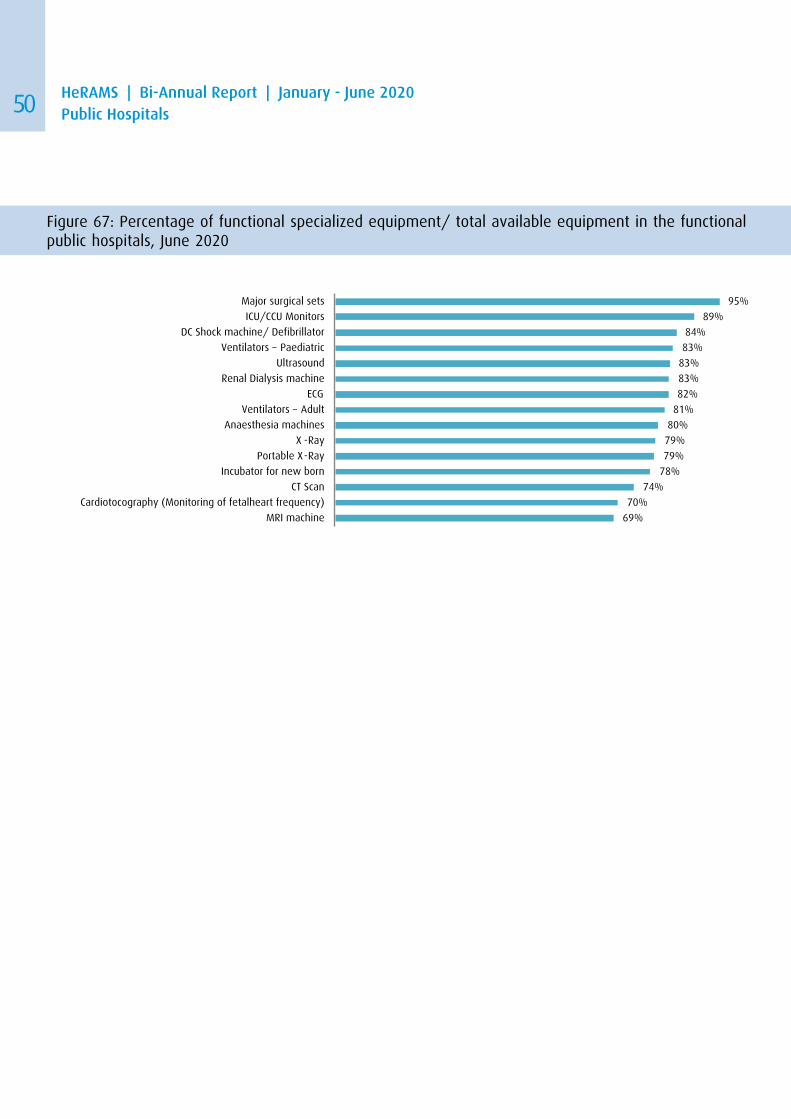
HeRAMS | Bi-Annual Report | January - June 2020Public Hospitals50
Figure 67: Percentage of functional specialized equipment/ total available equipment in the functional public hospitals, June 2020
69%
70%
74%
78%
79%
79%
80%
81%
82%
83%
83%
83%
84%
89%
95%
MRI machine
Cardiotocography (Monitoring of fetalheart frequency)
CT Scan
Incubator for new born
Portable X-Ray
X -Ray
Anaesthesia machines
Ventilators – Adult
ECG
Renal Dialysis machine
Ultrasound
Ventilators – Paediatric
DC Shock machine/ Defibrillator
ICU/CCU Monitors
Major surgical sets
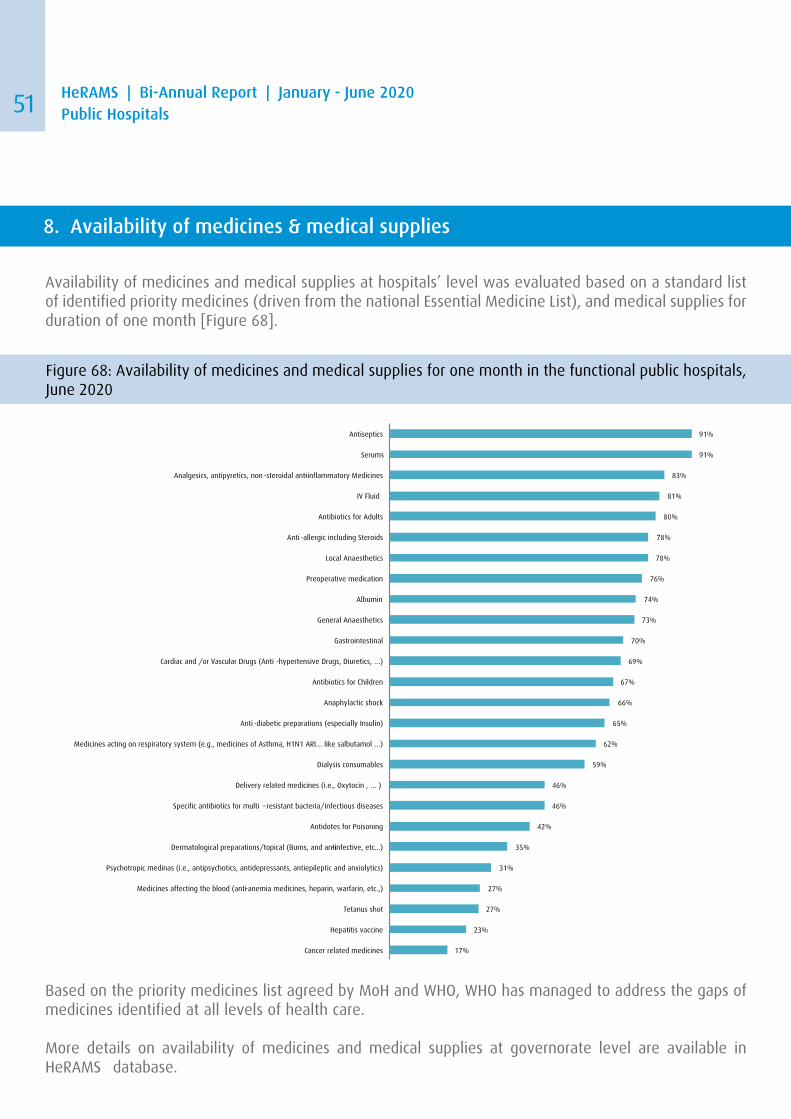
HeRAMS | Bi-Annual Report | January - June 2020Public Hospitals51
Based on the priority medicines list agreed by MoH and WHO, WHO has managed to address the gaps of medicines identified at all levels of health care.
More details on availability of medicines and medical supplies at governorate level are available in HeRAMS database.
17%
23%
27%
27%
31%
35%
42%
46%
46%
59%
62%
65%
66%
67%
69%
70%
73%
74%
76%
78%
78%
80%
81%
83%
91%
91%
Cancer related medicines
Hepatitis vaccine
Tetanus shot
Medicines affecting the blood (anti-anemia medicines, heparin, warfarin, etc.,)
Psychotropic medinas (i.e., antipsychotics, antidepressants, antiepileptic and anxiolytics)
Dermatological preparations/topical (Burns, and anti-infective, etc...)
Antidotes for Poisoning
Specific antibiotics for multi –resistant bacteria/infectious diseases
Delivery related medicines (i.e., Oxytocin , … )
Dialysis consumables
Medicines acting on respiratory system (e.g., medicines of Asthma, H1N1 ARI… like salbutamol …)
Anti -diabetic preparations (especially Insulin)
Anaphylactic shock
Antibiotics for Children
Cardiac and /or Vascular Drugs (Anti -hypertensive Drugs, Diuretics, …)
Gastrointestinal
General Anaesthetics
Albumin
Preoperative medication
Local Anaesthetics
Anti -allergic including Steroids
Antibiotics for Adults
IV Fluid
Analgesics, antipyretics, non -steroidal anti-inflammatory Medicines
Serums
Antiseptics
Figure 68: Availability of medicines and medical supplies for one month in the functional public hospitals, June 2020
Availability of medicines and medical supplies at hospitals’ level was evaluated based on a standard list of identified priority medicines (driven from the national Essential Medicine List), and medical supplies for duration of one month [Figure 68].
8. Availability of medicines & medical supplies

HeRAMS | Bi-Annual Report | January - June 2020Public Hospitals52
Slight variation of functionality status of public hospitals was observed throughout 2020. For example, 27 hospitals were reportedly out-of-service in June 2020 compared to 28 in January of the same year. Similarly, access to the public hospitals has no changes throughout 2020 with 15 hospitals reportedly non-accessible during 2020. Functionality status of hospitals was highly affected by the dire security situation and limited access by health staff and patients as well as critical shortages of supplies.
Levels of damages of the hospitals’ buildings directly affected the functionality status and provision of health services; however, some hospitals have resiliently continued to provide services regardless of levels of damage to the building and by utilizing intact parts of the building or operating from other neighboring facilities in a few cases. Rehabilitation of the damaged hospitals’ infrastructure, in addition to provision of supplies and medical equipment will significantly improve functionality of hospitals, readiness and provision of essential health services at secondary care level.
Slight improvement of the available number of medical staff (doctors, and nurses) with slight decreasing of the available number of midwives throughout 2020 was observed. However, increased capacity building activities and training courses of the national health staff will help in improving technical capacity of healthcare providers and filling gaps in certain areas.
Limited functionality and accessibility to public hospitals in addition to large displacement of people have greatly overburdened the few functional public hospitals’ resources. Increasing provision of specialized medical machines, as well as medicines and supplies especially for NCDs (such as cancer treatment, as observed the highest consultations among other NCDs) provides an affordable alternative compared to the high cost of healthcare in the private sector.
Furthermore, the crisis aggravated the inequalities among regions, leaving many people deprived of the minimum level of health services. HeRAMS can help in directing the interventions of different players to the most vulnerable groups and those with the greatest needs, and in assessing the efficiency of interventions.
Conducting a qualitative survey on provision of health services from the populations’ point of view and another survey on COVID-19 impact, using HeRAMS data as a baseline, will help in concretely measuring the impact of the crisis and COVID-19 on public health sector in terms of responsiveness of hospitals and quality of provided services.
9. Conclusions and recommendations