Embed Size (px)
Citation preview
Eur. J. Biochem. 25 (1972) 420-430
Hepatic Microsomal Ethanol Oxidation Hydrogen Peroxide Formation and the Role of Catalase
Ronald G . THURMAN, Heinz Georg LEY, and Roland SCHOLZ Institut fur Physiologische Chemie und Physikalische Biochemie der Universitiit Munchen
(Received October 12, 1971)
Microsomes from rat liver form hydrogen peroxide in the presence of an NADPH-generating system in proportion to protein concentrations as determined by three independent methods : ferrithiocyanate, cytochrome c peroxidase, and scopoletin fluorescence. Maximal rates observed were about 15 pmol H,O,/g microsomal protein per minute. The oxygen concentration for half-maximal rates was 50 pM. It is suggested that NADPH-dependent hydrogen peroxide formation in microsomes is mainly due to NADPH oxidase; however, partial inhibition by carbon monoxide suggests that about one third arises from the autoxidation of cytochrome P-450.
Similarities exist between microsomal acetaldehyde production from ethanol (i.e. the microsomal ethanol-oxidizing system of Lieber and DeCarli [4]) and hydrogen peroxide formation : viz. requirement for NADPH and oxygen, identical oxygen concentrations for half- maximal rates, and sensitivity to carbon monoxide. Microsomal acetaldehyde production in the presence of either an NADPH- or an H,O,-generating system exhibits identical characteristics as follows: (a) ethanol concentration for half-maximal rates (i.e. 12 mM); (b) dependency of maximal rates on rates of hydrogen peroxide formation; (c) competitive inhibition by peroxidatic substrates for catalase, e.g. formate (half-maximal effect: 150 mM); (d) inhibition by catalase inhibitors, e.g. azide (half-maximal effect : 50 pM), with identical azide insensitive rates ; (e) diminished acetaldehyde production in microsomes from rats pretreated with amino- triazole or pyrazole with identical residual rates. Moreover, NADPH-dependent acetaldehyde production is suppressed in the presence of an active H,O,-utilizing system.
Thus, it is concluded that the NADPH-dependent microsomal ethanol-oxidizing system of Lieber and DeCarli [4] is due to a hydrogen peroxide formation from NADPH and a subsequent peroxidation of ethanol by contaminating catalase. The data indicate that the existence of a unique system in addition to the peroxidatic reaction of catalase as postulated recently [4] is highly doubtful.
It is generally conceded that the major pathway for the oxidation of ethanol to acetaldehyde in mammalian liver is catalyzed by alcohol dehydro- genase. For example, approximately 80°/, of the total ethanol utilization by the perfused rat liver can be suppressed by inhibitors of the mitochondria1 respiratory chain [l]. This terminal oxidation of reducing equivalents in the respiratory chain is responsible for regeneration of NADf obligatory for the alcohol dehydrogenase reaction. Thus, a t least 80 of hepatic ethanol oxidation involves this pri- mary pathway. However, the mechanism by which the remaining ZOO/ , of ethanol is oxidized is
Enzymes. Alcohol dehydrogenase or alcohol : NAD oxidoreductase (EC 1.1.1.1); catalase or hydrogen-peroxide : hydrogen-peroxide oxidoreductase (EC 1.11.1.6) ; NADPH oxidase or reduced-NADP : (acceptor) oxidoreductase (EC 1.6.99.1) ; cytochrome c peroxidase or ferrocytochrome c : hydrogen-peroxide oxidoreductase (EC 1.11.1.5) ; horse radish peroxidase or donor : hydrogen-peroxide oxido- reductase (EC 1.11.1.7).
controversial. Two possible pathways have been proposed. First, ethanol is a well known peroxidatic substrate for catalase [Z], provided that hydrogen peroxide is present. Second, the microsomal fraction of liver is capable of converting ethanol into acet- aldehyde in the presence of NADPH and oxygen [3,4], a process which is partially inhibited by carbon monoxide [4,5]. This requirement for NADPH and oxygen and the sensitivity to carbon monoxide are characteristic for microsomal mixed-function oxida- tion systems. Furthermore, chronic ethanol feeding to rats caused a proliferation of the endoplasmic reticulum of liver [6] similar to that produced by many drugs [7,8]. Based on these observations, Lieber and DeCarli postulated a unique microsomal ethanol-oxidizing system [4].
On the other hand, the microsomal fraction contains contaminating catalase as well as NADPH oxidase [ Q ] . The latter is capable of generating hydrogen peroxide from NADPH and oxygen [lo].
Vo1.25, No.3, 1972 R. G. THURMAN, H. G. LEY, and R. SCHOLZ 42 1
It is on this theoretical basis that the existence of the ethanol-oxidizing system of Lieber and DeCarli has been questioned [5,11]. For example, amino- triazole, an inhibitor of the biosynthesis of catalase [ 121, diminished the production of acetaldehyde from ethanol in the presence of an NADPH-generat- ing system and led to the suggestion that ethanol oxidation is due to a coupled reaction involving NADPH oxidase and catalase [5,11].
The present communication describes a formation of hydrogen peroxide from NADPH and oxygen in isolated microsomes of rat liver. The requirement for NADPH and oxygen applies to both microsomal ethanol oxidation and hydrogen peroxide formation. Furthermore, the rate a t which hydrogen peroxide is formed and the activity of contaminating catalase are sufficient to account for microsomal acetaldehyde production from ethanol in the presence of NADPH. Therefore, it is not necessary to postulate a unique system for ethanol oxidation in microsomes, in addi- tion to a peroxidatic reaction by catalase.
It was reported that acetaldehyde production from ethanol was slower and less sensitive to catalase inhibitors with an NADPH- than with an H,O,- generating system [4]. This apparent dissociation of peroxidatic from NADPH-dependent oxidation of ethanol has been considered as an argument for the existence of the system of Lieber and DeCarli. However, it will be demonstrated in this paper that microsomal ethanol oxidation is limited by the rate of hydrogen peroxide formation. This rate is higher in the presence of an active H,O,-generating system than in the presence of an NADPH-generating sys- tem. Moreover, the percentage inhibition of acetal- dehyde production by catalase inhibitors is also dependent on the rate of hydrogen peroxide for- mation. Thus, different rates of acetaldehyde pro- duction and different sensitivities to catalase in- hibitors under the two experimental conditions are not necessarily evidence for a unique microsomal ethanol oxidizing system. We conclude, therefore, that hepatic ethanol oxidation is due to the alcohol dehydrogenase and catalase pathways and that the existence of an additional microsomal system is highly doubtful.
MATERIALS AND METHODS
Animals Male albino rats of the Wistar strain (Dr. Thomae,
Biberach), 180-220g, receiving a chow diet (Al- tromin) and water ad libitum were employed in these studies. In some instances, animals were pretreated 24 h before sacrifice with pyrazole (Fluka) (4 mmol/ kg, intraperitoneally or by gastric tube) or amino- triazole (Fluka, Buchs, Switzerland) (8 mmol/kg, intraperitoneally) .
Preparation of Microsomes Livers were homogenized in 4 volumes of cold
sucrose-ethylenediaminetetraacetate medium (250 and 1 mM, respectively) with a teflon homogenizer. The once-washed microsomal fraction of the homo- genate was prepared according to the procedure of Hildebrandt, Remmer and Estabrook [13]. Micro- soma1 protein was determined with the biuret method [14].
Microsomal Ethanol Oxidation Acetaldehyde production from ethanol by the
microsomal fraction was measured similarly to the procedure described by Lieber and DeCarli [4]. The reaction mixture (total volume 2.0 ml) contained 80 mM potassium phosphate buffer, pH 7.4, 20 mM nicotinamide, 10 mM magnesium chloride, and an appropriate NADPH- or H,O,-generating system. The concentrations of ethanol or inhibitors are in- dicated in the figure legends. Incubations were per- formed in capped 25 ml Erlenmeyer flasks with center wells in a shaking water bath at 37 "C. Reactions were initiated by the addition of microsomes (2 to 4 mg of microsomal protein per ml of reaction mix- ture) and were terminated after 5, 10 or 15 min by the addition of trichloroacetic acid (final concentra- tion 0.6 M). Linearity of acetaldehyde production was observed up to incubation times of 40min. The center wells contained 1.0 ml of 15 mM semi- carbazide in 160mM phosphate buffer, pH 7.0, as an aldehyde-trapping agent. After an overnight dif- fusion period, the semicarbazone was measured a t 224 nm according to Gupta and Robinson [15] and compared to acetaldehyde standards. Incubations were performed in duplicate or triplicate.
NADPH- and H,O,-Generating Systems NADPH was generated by the reaction of iso-
citrate dehydrogenase. I n standard experiments, the reaction mixture contained 0.4 mM NADPf, 30 mM D,L-isocitrate, and 200 mU/ml isocitrate de- hydrogenase. Since commercially available NADP+ contains acetone [40], it was twice lyophilized to lower the blank values. H,O, was generated with a system consisting of 1.5 mM hypoxanthine and xanthine oxidase. Under standard conditions, an activity of 10 mU/ml was employed. With high ac- tivities of xanthine oxidase the capacity for saturat- ing the reaction mixture with oxygen became critical. Therefore, oxygen concentrations were checked with a platinum electrode.
Microsomal Hydrogen Peroxide Formation The NADPH-dependent formation of hydrogen
peroxide was measured either with a modification of the ferrithiocyanate method [16], or spectrophoto-
422 Hydrogen Peroxide and Acetaldehyde Formation by Liver Microsomes Eur. J. Biochem.
metrically by the formation of cytochromec per- oxidase complex I1 [17,18], or fluorometrically by the decrease of scopoletin fluorescence in the presence of horse radish peroxidase [19].
Ferrithiocyanate. Microsomes were incubated as described above except that sodium azide (5mM) was present. Reactions were initiated by the ad- dition of NADPH or an NADPH-generating system and were terminated by adding trichloroacetic acid. After removal of precipitated protein by centrifu- gation, 0.2 ml of 10 mM ferrous ammonium sulfate, and subsequently, 0.1 ml of 2.5 M potassium thio- cyanate were added to a 1.0 ml aliquot of the supernatant. The absorption of the red ferrithiocy- anate complex formed in the presence of peroxides was measured at 480 nm in a Zeiss spectrophotometer and was compared to H202 standards.
Cytochrome c Peroxiduse. Hydrogen peroxide forms a complex with cytochrome c peroxidase with an absorption maximum a t 419 nm [17]. Microsomes were incubated a t 21 "C with 2 pM cytochrome c peroxidase in the reaction mixture. Following the addition of NADPH or an NADPH-generating sys- tem, the formation of the peroxide complex was measured a t 407-419nm employing an Aminco- Chance double beam spectrophotometer. H,02 con- centrations were calculated using a molar absorp- tion coefficient of 5 x lo4 [18]. Control experiments showed that no changes in absorption were due to NADPH.
Scopoletin (7-hydroxy-6-methoxy-coumarin) emits a blue fluorescence when excited with light of 366 nm. In the presence of H202, it is oxidized by horse radish peroxidase yielding a non-fluorescent product [19]. Microsomal suspensions were incubated a t 21 "C or 37 "C in a capped glass cuvette with a magnetic stirrer. Scopoletin (1 pM) was added and the decrease in fluorescence intensity after subsequent addition of NADPH or an NADPH-generating system in- dicated the rate of H20, formation. Although fluo- rescence is excited and emitted a t similar wavelengths with scopoletin and reduced pyridine nucleotides, the fluorescence change following the addition of an NADPH-generating system in the absence of sco- poletin was negligible under these conditions.
Different Concentrations of Oxygen and Carbon Monoxide
Under our standard conditions, the gas phase of capped incubation vessels was air. I n experiments where different concentrations of oxygen or carbon monoxide were employed, the vessels were gassed for 15 min with mixtures of pure gasses mixed with a special device [20]. The accuracy of the gas mixing was approximately & 501,.
Chemicals All enzymes and coenzymes used in this study
were purchased from Boehringer Mannheim GmbH (Mannheim, Germany). All chemicals were reagent grade purchased from Merck (Darmstadt) unless otherwise specified.
RESULTS Hydrogen Peroxide Pormt ion
from NADPH by Liver Microsomes I n these studies, hydrogen peroxide formation
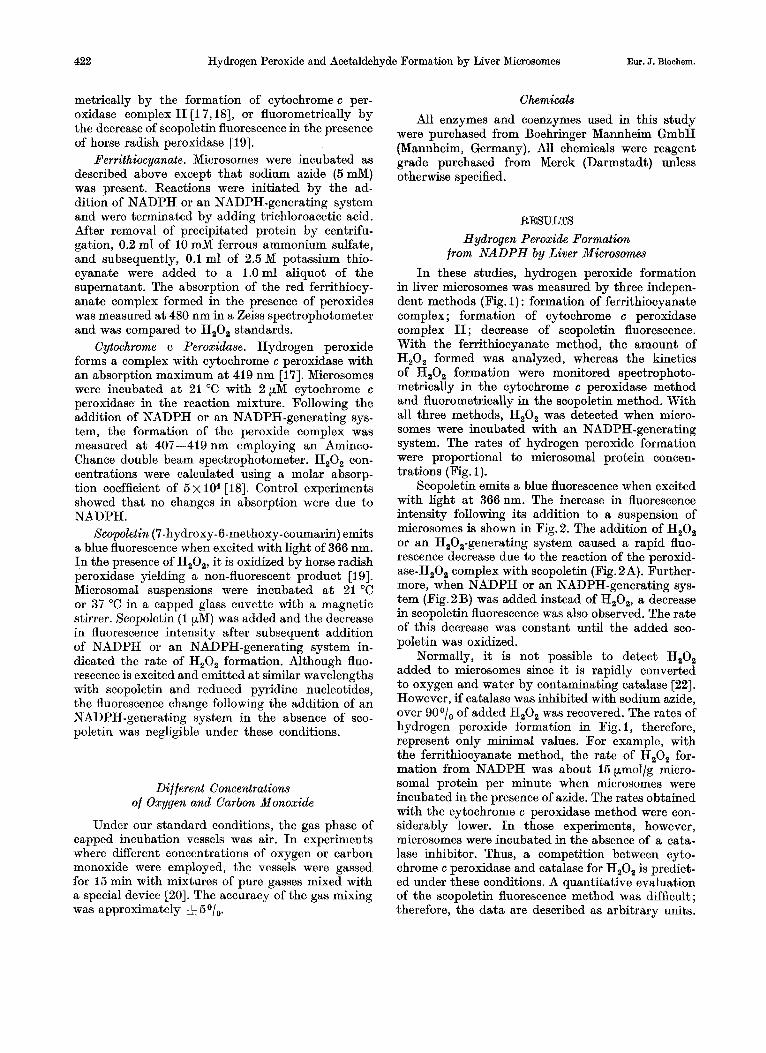
in liver microsomes was measured by three indepen- dent methods (Fig. 1) : formation of ferrithiocyanate complex; formation of cytochrome c peroxidase complex I1 ; decrease of scopoletin fluorescence. With the ferrithiocyanate method, the amount of H202 formed was analyzed, whereas the kinetics of H202 formation were monitored spectrophoto- metrically in the cytochrome c peroxidase method and fluorometrically in the scopoletin method. With all three methods, H202 was detected when micro- somes were incubated with an NADPH-generating system. The rates of hydrogen peroxide formation were proportional to microsomal protein concen- trations (Fig. 1).
Scopoletin emits a blue fluorescence when excited with light a t 366nm. The increase in fluorescence intensity following its addition to a suspension of microsomes ia shown in Fig.2. The addition of H202 or an H202-generating system caused a rapid fluo- rescence decrease due to the reaction of the peroxid- ase-H202 complex with scopoletin (Fig. 2A). Further- more, when NADPH or an NADPH-generating sys- tem (Fig.2B) was added instead of H202, a decrease in scopoletin fluorescence was also observed. The rate of this decrease was constant until the added sco- poletin was oxidized.
Normally, it is not possible to detect H20, added to microsomes since it is rapidly converted to oxygen and water by contaminating catalase [22]. However, if catalase was inhibited with sodium azide, over goo/, of added H202 was recovered. The rates of hydrogen peroxide formation in Fig. 1) therefore, represent only minimal values. For example, with the ferrithiocyanate method, the rate of H202 for- mation from NADPH was about 15 p.mol/g micro- soma1 protein per minute when microsomes were incubated in the presence of azide. The rates obtained with the cytochrome c peroxidase method were con- siderably lower. I n those experiments, however, microsomes were incubated in the absence of a cata- lase inhibitor. Thus, a competition between cyto- chrome c peroxidase and catalase for H,02 is predict- ed under these conditions. A quantitative evaluation of the scopoletin fluorescence method was difficult; therefore, the data are described as arbitrary units.
Vo1.25, N0.3, 1972 R. G. T-MAN, H. G. LEY, and R. SCHOLZ 423
U
3 !20LL 0 0 2 L
Microsornal protein (mg)
Fig. 1. Dependance of hydrogen peroxide formation from NADPH on microsomal protein concentrations. Rates of H,O, forma- tion were measured a t different concentrations of microsomal protein by (A) ferrithiocyanate method, (B) cytochrome c peroxidase method or (C) decrease in scopoletin fluorescence. Temperatures were 37 "C in (A) and 21 "C in (B) and (C).
Sodium azide (5 mM) was present in (A) but not in (B) or (C). For details see Methods
A B
I NADPH
I Scopoletin
Fig.2. Effect of H,O, and NADPH on swpoletin fluorescence. Scopoletin (1 pM) was added to a microsomal suspension incubated in 80 mM potassium phosphate buffer, pH 7.4, containing 20 mM nicotinamide, 10 mM MgCl,, and horse radish peroxidase (5 U/ml). The intensity of the fluorescence excited a t 366 nm was recorded at 450 nm. The addition of H,O,
(0.1 mM) (A) or NADPH (1 mM) (B) is denoted by arrows
The rates of hydrogen peroxide formation were higher when microsomes were incubated with NADPH than with NADH. I n the absence ofreduced pyridine nucleotides, H,O, was not detected. Fur- thermore, rates of hydrogen peroxide formation were maximal a t oxygen concentrations greater than 200 pM (Fig. 3). The concentration for half-maximal rates was about 50 pM oxygen indicating a very low affinity of the acceptor for oxygen compared to cyto- chrome P-450 or cytochrome oxidase [23-251.
Hydrogen peroxide formation from NADPH can be partially inhibited by carbon monoxide (Table 1). The inhibition increased with increasing CO : 0, ratios. Maximal inhibition ( i . e . 350/,,) was observed with a ratio of 9, whereas no effect was detectable
with CO:O, ratios less than 1. These data show that about one third of microsomal hydrogen per- oxide formation from NADPH depends upon a car- bon-monoxide-sensitive component and suggests the involvement of cytochrome P-450.
ACETALDEHYDE PRODUCTION IN PRESENCE OF NADPH
Maximal Rates and Concentrations for Half - Maximal Rates
Following the addition of ethanol, isolated liver microsomes produce acetaldehyde in the presence of an NADPH- or H,O,-generating system [4,5] (Fig.4, Table 2). Under these experimental condi-
424 Hydrogen Peroxide and Acetaldehyde Formation by Liver Microsomes Eur. J. Biochem.
' O 1
io r
m c .c
m
U 0
I I I 0 100 200 300
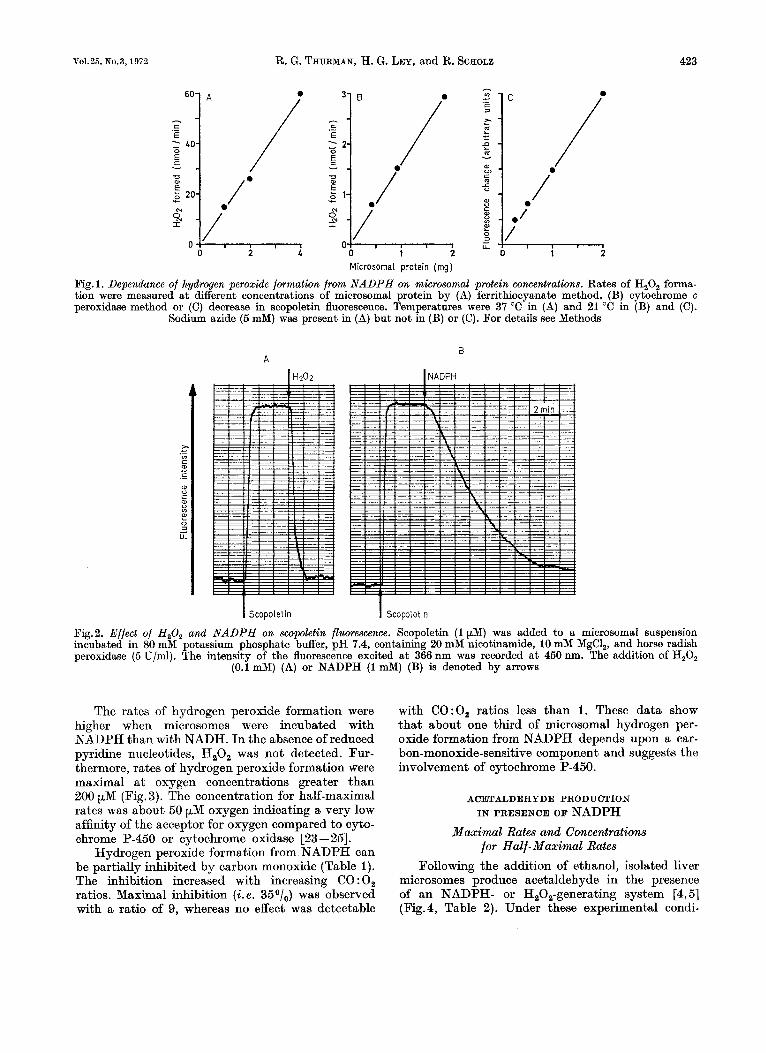
[Oxygen] (PW Fig. 3. Relationship between oxygen concentrations and rates of NADPH-dependent hydrogen peroxide and acetaldehyde production from ethanol. (0) Rates of H,O, formation (arbitrary units) determined by the scopoletin fluorescence method. Variable oxygen concentrations were obtained by mixing 0,- and N,-saturated buffers in different proportions. The cuvette (2.0ml volume) was capped and the reaction was initiated by the injection of 0.1 ml of NADPH-generat- ing system. The decrease in scopoletin fluorescence was recorded as in E'ig.2. Results are means of duplicate deter- minations from a typical experiment. ( 0 ) Acetaldehyde production from ethanol (pmol per g microsomal protein and minute) measured according to Lieber et al. [4]. The capped vessels contained the reaction mixture plus an NADPH- generating system and were gassed for 15 min with different gas mixtures prior to the injection of microsomes. Results are means of 13 to 19 determinations from 6 micro-
somal preparations; vertical bars represent S.E.M.
Table 1. Effect of curbon monoxide on NADPH-dependent microsomal hydrogen peroxide formation
Rat liver microsomes (2-4 mg protein/ml) were incubated a t 37 O C in 80 mM potassium phosphate buffer, pH 7.4, containing 10 mM MgCl,, 20 mM nicotinamide, horse radish peroxidase (5 U/ml), and 1 pM scopoletin in a total volume of 2.0 ml saturated with the gas mixtures denoted. Reactions were initiated by the addition of an NADPH-generating system (NADP+, isocitrate, isocitrate dehydrogenase), and the decrease in scopoletin fluorescence was monitored as shown in Fig.2. Control: 0, denoted; balance N,; 4 to 10 determinations in each group. Data obtained in the presence of carbon monoxide are expressed as a percentage of control values. Results are means 5 S.D. with the number of determinations in parentheses; data obtained
with 3 different microsomal preparations
"0 "lo "0
60 40 0.7 105-118 (2) 40 60 1.5 8ija & 9 (10)
10 90 9.0 64a 5 9 (4) 20 80 4.0 73a 5 10 (10)
Statistically significantly different from control ( p < 0.01).
0 50 1w 150 200
Fig. 4. Relationship between ethanol concentrations and microsomal acetaldehyde production. Reaction mixtures containing different ethanol concentrations and either an NADP- (0) or an H,O,- ( 0 ) generating system were incubated a t 37 "C in the presence (----) or absence (-) of sodium azide (0.1 mM). Reactions were initiated by the addition of microsomes and, after 10 or 15 min, were terminated by adding trichloracetic acid. Acetaldehyde was trapped as the semicarbazone and determined according to [15]. Means of duplicate determinations from one micro-
somal preparation
[Ethanol](rnM)
Table 2. Inhibition of microsomal acetaldehyde product& from ethanol by sodium azide
Rat liver microsomes were incubated with 50 mM ethanol and either an H,O,- or an NADPH-generating system (see Methods). The activities of either xanthine oxidase (H,O,) or isocitrate dehydrogenase (NADPH) in the reaction mixture are indicated. Results are mean f S.E.M. ( n = 5 ) or mean of duplicate determinations from a single microsomal preparation, and are expressed as pmol acet-
aldehyde/g microsomal protein per minute
Generating system Acetaldehyde produced with Inhibition 100 H,O, NADPH control
mU/ml - 3
5 - 10 - 20 - 50 -
200 - 400 -
pmol x g-' x min-1 "0
3.4 1.6 53 5.7 f 0.2 2.2 f 0.1 61
13.0 f 0.7 2.6 f 0.3 80 17.2 5 0.3 2.2 f 0.2 87 25.3 3.4 87 6.1 f 0.2 2.5 f 0.1 59 6.1 2.7 56
tions, the rates of acetaldehyde production were about two times higher with an H,O,- than with an NADPH-generating system (16 and 8 pmol/g micro- somal protein per minute, respectively; Fig. 4). It is possible to increase the rate by increasing the activity of the H,O,-generating system, but not by enhancing the activity of the NADPH-generating system. The highest rates observed in these studies
Vo1.25, No.3, 1972 R. G. THURMAN, H. G. LEY, and R. SCHOLZ 425
l/[ Ethanol] (rnM-')
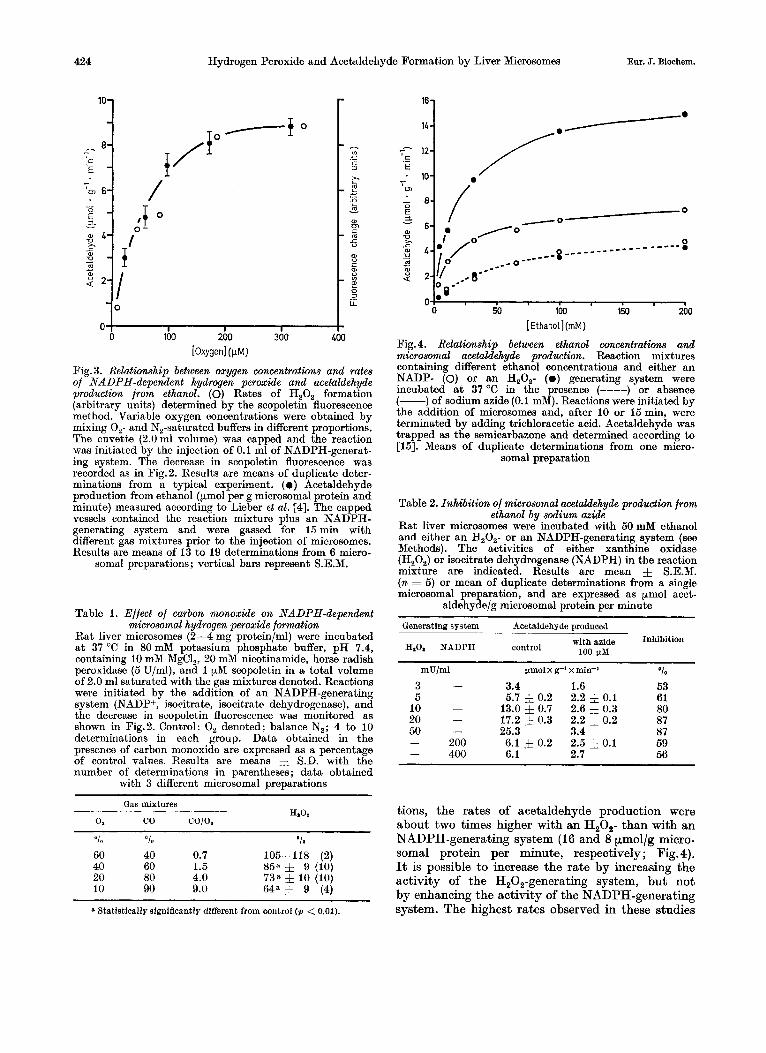
Fig. 5. Double-reciprocal plot of ethanol concentrations and rates of acetaldehyde production i n the presence of either NADPH- or H,O,-generating systems. Data from experiment presented in Fig. 4; NADPH (0) ; H,O, ( 0 ) ; v is expressed in pmol acetaldehyde produced per g microsomal protein
and per minute
were 25 p,mol/g per minute with 50 mU/ml of xan- thine oxidase (Table 2). However, the dependency on the ethanol concentration was identical with both systems. In a double-reciprocal plot, the rates ob- tained with ethanol concentrations above 10 mM exhibited a linear relationship (Fig. 5). The average concentration for half-maximal rate was 12 mM ethanol ; the values varied from preparation to prep- aration in a range from 7 to 18 mM ethanol. However, they were identical with any given microsomal preparation.
The oxygen concentration for half-maximal acetaldehyde production in the presence of NADPH was about 50 pM (Fig.3). It is noteworthy that this value is identical to the oxygen concentration ob- served for half-maximal hydrogen peroxide formation from NADPH (Fig.3) and is almost two orders of magnitude greater than that reported for cytochrome P-450 and cytochrome oxidase [23--251.
Inhibition by Azide Azide reacts with the catalase-H202 complex
to form an inactive compound [26]. In the presence of both an NADPH- or an H202-generating system, azide inhibited the production of acetaldehyde from ethanol in microsomes [4,5] (Fig.4 and 6). Half- maximal inhibition was observed with azide concen- trations of less than 50 pM (Fig.6). A portion of the acetaldehyde production, however, could not be inhibited by azide and was identical with both gener- ating systems in any given preparation (Fig.4 and 6). Azide was also unable to inhibit the peroxi-
O ! I I 1 0 0.1 0.2 0.3 0.4 a5
[Azide] (rnM)
Fig.6. Effect of azide concentrations on H,O,- and NADPH- dependent acetaldehyde production from ethanol. Microsomes or microsomes supplemented with purified bovine liver catalase (4000 U/ml) were incubated with 50 mM ethanol in the presence of an NADPH- or H,O,-generating system. 0, Microsomes with NADPH-generating system ; 0, micro- somes with H,O,-generating system; n, catalase supple- mented microsomes with NADPH-generating system; ., catalase supplemented microsomes with H,O,-generating
system
datic function of purified bovine liver catalase com- pletely when incubated together with ethanol and an H,O,-generating system. The azide-insensitive acetaldehyde production varied somewhat from microsomal preparation to preparation and is prob- ably dependent upon the amount of contaminating catalase, since it was enhanced by catalase addition (Fig. 6).
On the other hand, the ezide-insensitive acetal- dehyde production was independent of the rate of hydrogen peroxide formation (Table 2). Increasing the activity of the H20,-generating system by one order of magnitude in the absence of azide caused a 5-fold increase in the rate of acetaldehyde produc- tion, whereas in the presence of azide identical rates were found. When these data were expressed on a percentage basis, an array of different inhi- bitions from 50 to 900/, were obtained. The percent- age inhibition in the presence of an NADPH-gener- ating system was 6001, and was clearly within the range observed with different rates of hydrogen peroxide formation.
Competition with Peroxidutic Substrates for Catalase Formic acid is a typical peroxidatic substrate
for catalase [27]. I n its presence, microsomal acetal-
Em. J. Biochcm. 426 Hydrogen Peroxide and Acetaldehyde Formation by Liver Microsomes
[ Formate] (mM) 5 1
300
0 20 LO 60 80 1w [Ethanol](mM)
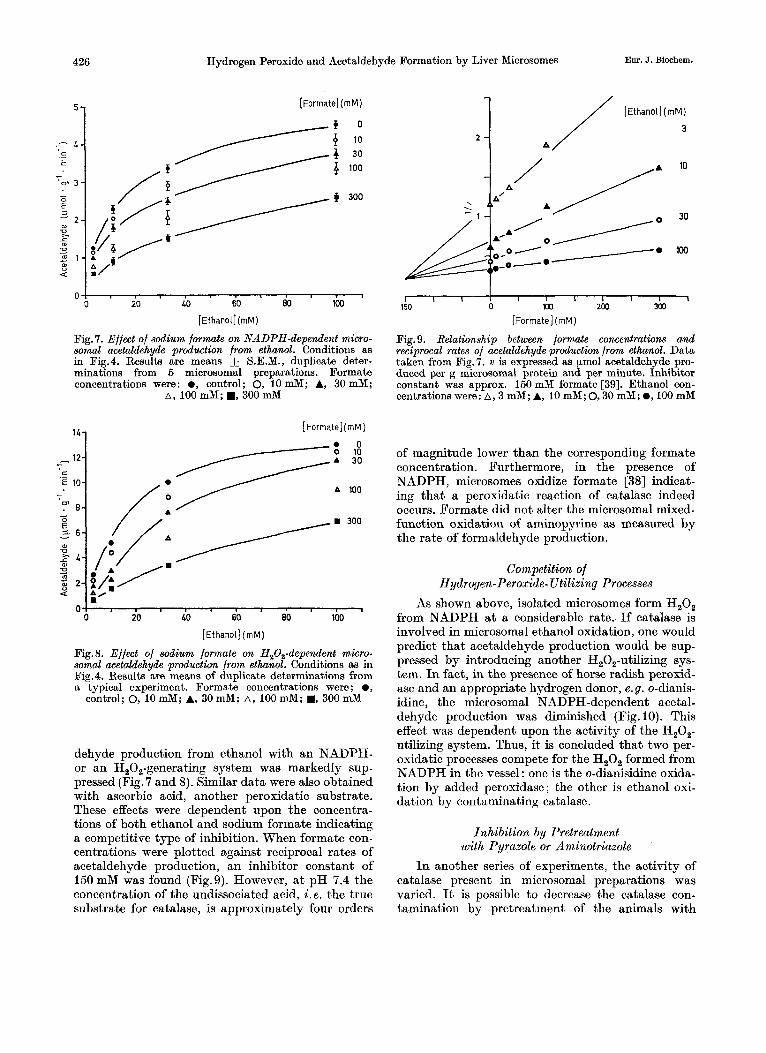
Fig. 7. Effect of sodium formate on NADPH-dependent rnicro- somal acetaldehyde production from ethanol. Conditions as in Fig.4. Results are means & S.E.M., duplicate deter- minations from 5 microsomal preparations. Formate concentrations were: 0, control; 0, 10mM; A, 30mM;
A , 100 mM; W, 300 mM
1 4 1 [ F o r m a t e ] ( m M )
I - '0 10 0
/-----A 30
o ! I I I I s 1 I I 1 I 1
-
0 20 40 60 80 100
[Ethanol] (mM)
Fig. 8. Effect of sodium formate on H,O,-dependent micro- somal acetaldehyde production from ethanol. Conditions as in Fig.4. RRsults are means of duplicate determinations from a typical experiment. Formate concentrations were ; 0 ,
control; 0, 10 mM; A, 30 mM; A, 100 mM; a, 300 mM
dehyde production from ethanol with an NADPH- or an H,O,-generating system was markedly sup- pressed (Fig. 7 and 8). Similar data were also obtained with ascorbic acid, another peroxidatic substrate. These effects were dependent upon the concentra- tions of both ethanol and sodium formate indicating a competitive type of inhibition. When formate con- centrations were plotted against reciprocal rates of acetaldehyde production, an inhibitor constant of 150 mM was found (Fig.9). However, a t pH 7.4 the concentration of the undissociated acid, i .e . the true substrate for catalase, is approximately four orders
I I I I I I I I i I I 1
[ F o r r n a t e ] ( m M )
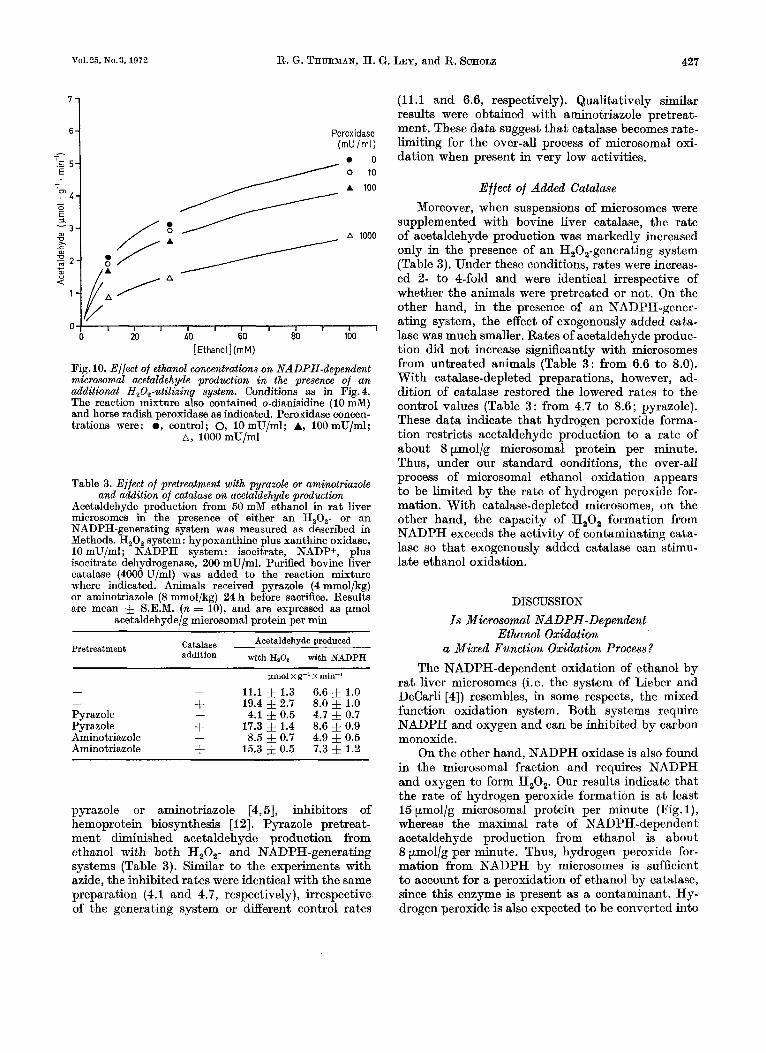
Fig. 9. Relationship between formate Concentrations and reciprocal rates of acetaldehyde production from ethnol. Data taken from Fig.7. v is expressed as pmol acetaldehyde pro- duced per g microsomal protein and per minute. Inhibitor constant was approx. 150 mM formate [39]. Ethanol con- centrations were: A, 3 mM; A, 10 mM; 0 ,30 mM; ., 100 mM
150 0 xK1 2M) 3M)
of magnitude lower than the corresponding formate concentration. Furthermore, in the presence of NADPH, microsomes oxidize formate [38] indicat- ing that a peroxidatic reaction of catalase indeed occurs. Formate did not alter the microsomal mixed- function oxidation of aminopyrine as measured by the rate of formaldehyde production.
Competition of Hydrogen- Peroxide- Utilizing Processes
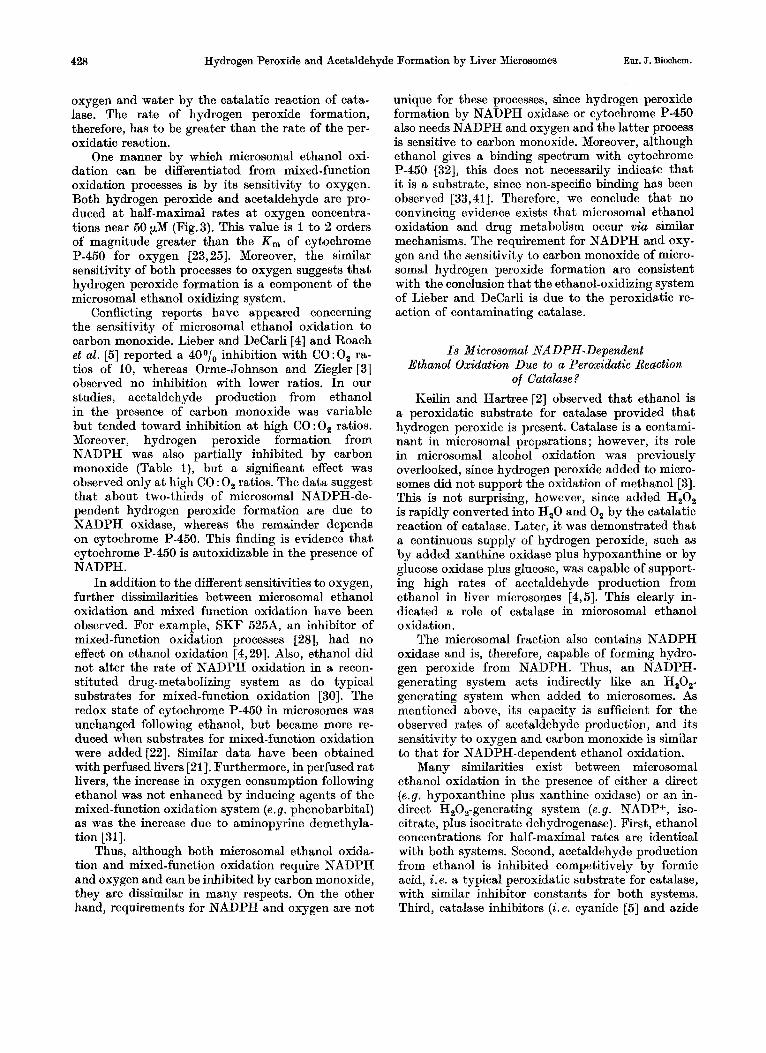
As shown above, isolated microsomes form H,O, from NADPH a t a considerable rate. If catalase is involved in microsomal ethanol oxidation, one would predict that acetaldehyde production would be sup- pressed by introducing another H,O,-utilizing sys- tem. I n fact, in the presence of horse radish peroxid- ase and an appropriate hydrogen donor, e.g. o-dianis- idine, the microsomal NADPH-dependent acetal- dehyde production was diminished (Fig. 10). This effect was dependent upon the activity of the H,O,- utilizing system. Thus, it is concluded that two per- oxidatic processes compete for the H,O, formed from NADPH in the vessel : one is the o-dianisidine oxida- tion by added peroxidase; the other is ethanol oxi- dation by contaminating catalase.
Inhibition by Pretreatment with Pyrazole or Aminotriazole
I n another series of experiments, the activity of catalase present in microsomal preparations was varied. It is possible to decrease the catalase con- tamination by pretreatment of the animals with
Vol.25, No.3, 1972 R. G. THURMAN, H. G. LEY, and R. SCHOLZ 427
'1
A
a
Peroxidase (mUIml)
0
A
h
0 10
100
1000
I I 1 1 I I I I I I I 0 20 LO 60 80 100
[Ethanol] (mM)
Fig. 10. Effect of e thnol concentrations on NADPH-dependent microsomal acetaldehyde production in the presence of a n additional H,O,-utilizinq system. Conditions as in Fig. 4. The reaction mixture also contained o-dianisidine (10 mM) and horse radish peroxidase as indicated. Peroxidase concen- trations were: 0, control; 0, 10mU/ml; A, 100mU/ml;
A, 1000 mU/ml
Table 3. Effect of pretreatment with pyrazole or aminotriazole and addition of cutuluse on acetaldehyde production
Acetaldehyde production from 50 mM ethanol in rat liver microsomes in the presence of either an H,O,- or an NADPH-generating system was measured as described in Methods. H,O, system: hypoxanthine plus xanthine oxidase, 10 mU/ml; NADPH system: isocitrate, NADPf, plus isocitrate dehydrogenase, 200 mU/ml. Purified bovine liver catalase (4000 U/ml) was added to the reaction mixture where indicated. Animals received pyrazole (4 mmol/kg) or aminotriazole (8 mmol/kg) 24 h before sacri6ce. Results are mean 9 S.E.M. (n = lo), and are expressed as pmol
acetaldehyde/g microsomal protein per min
Pretreatment Acetaldehyde produced Catalase
addition with H,O, with NADPH
pmol x g-' x min-' - - 11.1 f 1.3 6.6 f 1.0 - + 19.4 f 2.7 8.0 f 1.0 Pyrazole - 4.1 f 0.5 4.7 f 0.7 Pyrazole + 17.3 f 1.4 8.6 9 0.9 Aminotriazole - 8.5 f 0.7 4.9 f 0.5 Aminotriazole + 15.3 f 0.5 7.3 f 1.2
pyrazole or aminotriazole [4,5], inhibitors of hemoprotein biosynthesis [ 121. Pyrazole pretreat- ment diminished acetaldehyde production from ethanol with both H202- and NADPH-generating systems (Table 3). Similar to the experiments with azide, the inhibited rates were identical with the same preparation (4.1 and 4.7, respectively), irrespective of the generating system or Merent control rates
(1 1.1 and 6.6, respectively). Qualitatively similar results were obtained with aminotriazole pretreat- ment. These data suggest that catalase becomes rate- limiting for the over-all process of microsomal oxi- dation when present in very low activities.
Effect of Added Catalase Moreover, when suspensions of microsomes were
supplemented with bovine liver catalase, the rate of acetaldehyde production was markedly increased only in the presence of an H202-generating system (Table 3). Under these conditions, rates were increas- ed 2- to 4-fold and were identical irrespective of whether the animals were pretreated or not. On the other hand, in the presence of an NADPH-gener- ating system, the effect of exogenously added cata- lase was much smaller. Rates of acetaldehyde produc- tion did not increase significantly with microsomes from untreated animals (Table 3: from 6.6 to 8.0). With catalase-depleted preparations, however, ad- dition of catalase restored the lowered rates to the control values (Table 3 : from 4.7 to 8.6; pyrazole). These data indicate that hydrogen peroxide forma- tion restricts acetaldehyde production to a rate of about 8 p.mol/g microsomal protein per minute. Thus, under our standard conditions, the over-all process of microsomal ethanol oxidation appears to be limited by the rate of hydrogen peroxide for- mation. With catalase-depleted microsomes, on the other hand, the capacity of H202 formation from NADPH exceeds the activity of contaminating cata- lase so that exogenously added catalase can stimu- late ethanol oxidation.
DISCUSSION
Is Microsomal NADPH-Dependent Ethanol Oxidation
a Mixed Function Oxidation Process? The NADPH-dependent oxidation of ethanol by
rat liver microsomes (i.e. the system of Lieber and DeCarli [4]) resembles, in some respects, the mixed function oxidation system. Both systems require NADPH and oxygen and can be inhibited by carbon monoxide.
On the other hand, NADPH oxidase is also found in the microsomal fraction and requires NADPH and oxygen to form H202. Our results indicate that the rate of hydrogen peroxide formation is a t least 15 p.mol/g microsomal protein per minute (Fig. I), whereas the maximal rate of NADPH-dependent acetaldehyde production from ethanol is about 8 pmol/g per minute. Thus, hydrogen peroxide for- mation from NADPH by microsomes is sufficient to account for a peroxidation of ethanol by catalase, since this enzyme is present as a contaminant. Hy- drogen peroxide is also expected to be converted into
Hydrogen Peroxide and Acetaldehyde Formation by Liver Microsomes Eur. J. Biochem. 428
oxygen and water by the catalatic reaction of cata- lase. The rate of hydrogen peroxide formation, therefore, has to be greater than the rate of the per- oxidatic reaction.
One manner by which microsomal ethanol oxi- dation can be differentiated from mixed-function oxidation processes is by its sensitivity to oxygen. Both hydrogen peroxide and acetaldehyde are pro- duced at half-maximal rates a t oxygen concentra- tions near 50 pM (Fig.3). This value is 1 to 2 orders of magnitude greater than the K , of cytochrome P-450 for oxygen [23,25]. Moreover, the similar sensitivity of both processes to oxygen suggests that hydrogen peroxide formation is a component of the microsomal ethanol oxidizing system.
Conflicting reports have appeared concerning the sensitivity of microsomal ethanol oxidation to carbon monoxide. Lieber and DeCarli [4] and Roach et al. [5] reported a 40°/, inhibition with CO:O, ra- tios of 10, whereas Orme-Johnson and Ziegler [3] observed no inhibition with lower ratios. In our studies, acetaldehyde production from ethanol in the presence of carbon monoxide was variable but tended toward inhibition a t high CO:O, ratios. Moreover, hydrogen peroxide formation from NADPH was also partially inhibited by carbon monoxide (Table I), but a significant effect was observed only a t high CO : 0, ratios. The data suggest that about two-thirds of microsomal NADPH-de- pendent hydrogen peroxide formation are due to NADPH oxidase, whereas the remainder depends on cytochrome P-450. This finding is evidence that cytochrome P-450 is autoxidizable in the presence of NADPH.
In addition to the different sensitivities to oxygen, further dissimilarities between microsomal ethanol oxidation and mixed function oxidation have been observed. For example, SKF 5258, an inhibitor of mixed-function oxidation processes [28], had no effect on ethanol oxidation [4,29]. Also, ethanol did not alter the rate of NADPH oxidation in a recon- stituted drug-metabolizing system as do typical substrates for mixed-function oxidation [30]. The redox state of cytochrome P-450 in microsomes was unchanged following ethanol, but became more re- duced when substrates for mixed-function oxidation were added [22]. Similar data have been obtained with perfused livers [21]. Furthermore, in perfused rat livers, the increase in oxygen consumption following ethanol was not enhanced by inducing agents of the mixed-function oxidation system (e. g . phenobarbital) as was the increase due to aminopyrine demethyla- tion [31].
Thus, although both microsomal ethanol oxida- tion and mixed-function oxidation require NADPH and oxygen and can be inhibited by carbon monoxide, they are dissimilar in many respects. On the other hand, requirements for NADPH and oxygen are not
unique for these processes, since hydrogen peroxide formation by NADPH oxidase or cytochrome P-450 also needs NADPH and oxygen and the latter process is sensitive to carbon monoxide. Moreover, although ethanol gives a binding spectrum with cytochrome P-450 [32], this does not necessarily indicate that it is a substrate, since non-specific binding has been observed [33,41]. Therefore, we conclude that no convincing evidence exists that microsomal ethanol oxidation and drug metabolism occur via similar mechanisms. The requirement for NADPH and oxy- gen and the sensitivity to carbon monoxide of micro- soma1 hydrogen peroxide formation are consistent with the conclusion that the ethanol-oxidizing system of Lieber and DeCarli is due to the peroxidatic re- action of contaminating catalase.
Is Microsomal NADPH-Dependent Ethanol Oxidation Due to a Peroxidatic Reaction
of Catalase? Keilin and Hartree [a] observed that ethanol is
a peroxidatic substrate for catalase provided that hydrogen peroxide is present. Catalase is a contami- nant in microsomal preparations ; however, its role in microsomal alcohol oxidation was previously overlooked, since hydrogen peroxide added to micro- somes did not support the oxidation of methanol [3]. This is not surprising, however, since added H,O, is rapidly converted into H,O and 0, by the catalatic reaction of catalase. Later, it was demonstrated that a continuous supply of hydrogen peroxide, such as by added xanthine oxidase plus hypoxanthine or by glucose oxidase plus glucose, was capable of support- ing high rates of acetaldehyde production from ethanol in liver microsomes [4,5]. This clearly in- dicated a role of catalase in microsomal ethanol oxidation.
The microsomal fraction also contains NADPH oxidase and is, therefore, capable of forming hydro- gen peroxide from NADPH. Thus, an NADPH- generating system acts indirectly like an H,O,- generating system when added to microsomes. As mentioned above, its capacity is sufficient for the observed rates of acetaldehyde production, and its sensitivity to oxygen and carbon monoxide is similar to that for NADPH-dependent ethanol oxidation.
Many similarities exist between microsomal ethanol oxidation in the presence of either a direct ( e . g . hypoxanthine plus xanthine oxidase) or an in- direct H,O,-generating system ( e . g . NADPf, iso- citrate, plus isocitrate dehydrogenase). First, ethanol concentrations for half-maximal rates are identical with both systems. Second, acetaldehyde production from ethanol is inhibited competitively by formic acid, i. e. a typical peroxidatic substrate for catalase, with similar inhibitor constants for both systems. Third, catalase inhibitors ( i . e . cyanide [5] and azide
Vo1.25, “0.3, 1972 R. G. THURMAN, H. G. LEY, and R. SCHOLZ 429
[4], Fig.4, Table 2; pyrazole or aminotriazole pre- treatment [4,5], Table 3) diminish the activity of ethanol oxidation with both generating systems. Moreover, the role of catalase is also supported by the selectivity towards alcohols. Microsomes oxidize methanol and ethanol in the presence of NADPH, but not alcohols with longer aliphatic chains [3]. It is known that catalase reacts peroxidatically only with methanol and ethanol [34].
Thus, there is no doubt that a large portion, if not all, of microsomal NADPH-dependent ethanol oxidation is due to catalase. However, despite these similarities one could argue that a small portion may be metabolized by mechanisms other than peroxi- dation, if conditions exist where microsomal ethanol oxidation reacts differently in the presence of either NADPH- or H,O,-generating systems. Lieber et al. [4] reported that catalase inhibitors diminished microsomal ethanol oxidation to a greater degree when an H,O,- than when an NADPH-generating system was present. This would be an argument in favor of the existence of the microsomal ethanol- oxidizing system in addition to the peroxidatic pro- cess. However, our present data obtained under a wide variety of experimental conditions (i. e. different concentrations of ethanol and inhibitors, variable activities of the generating systems, etc.) showed that rates of acetaldehyde production from ethanol depend upon the rate of hydrogen peroxide formation but are identical when catalase is limiting. Therefore, the array of percentage inhibition, e.g. by azide, with dif- ferent activities of xanthine oxidase varied from 50 to 9O0/, and was 6001, with an NADPH-generating system which, in actuality, is only a slow H,O,- generating system (Table 2). Thus, it is obvious that one cannot attribute significance to differences in percentage inhibition between NADPH- and H,O,- generating systems. We conclude, therefore, that there is no sound basis upon which to postulate that a unique microsomal ethanol oxidizing system exists. The NADPH-dependent ethanol oxidation studied by us and in other laboratories [3--51 appears to be totally due to the peroxidatic reaction of catalase.
Physiological Significance of a Peroxidatic Reaction in Ethanol Metabolism
One should keep in mind that microsomal NADPH-dependent oxidation of ethanol to acetal- dehyde is an artificial system which may have no physiological significance. I n the intact liver cell, rates of NADPH generation and utilization, rates of hydrogen peroxide formation, the relationship between peroxidatic and catalatic function of cata- lase, etc., may not favor a process which is possible in microsomal suspensions. However, in experiments with perfused rat liver, 2001, of total ethanol utiliza- 28 Eur. J. Biochem., Vol. 25
tion can be attributed to another pathway in ad- dition to the NAD+-dependent alcohol dehydrogen- ase reaction [l]. This portion of ethanol utilization occurs a t rates between 10 and 15 pmol/g liver per hour. The rates of NADPH-dependent ethanol oxi- dation in liver microsomes are of the same order of magnitude ( i . e . 30 pmol/g liver per hour, assuming 70mg of microsomal protein per gram of liver). Moreover, Gordon [35] observed that ethanol utili- zation was stimulated a t high oxygen tensions. This could be a result of increased hydrogen peroxide formation and, subsequently, enhanced peroxidation of ethanol, since oxygen concentrations required for half-maximal peroxide formation are relatively high (Fig.3). It was also reported that chronic ethanol feeding increased both the rate of microsomal ethanol oxidation and ethanol blood clearance i n vivo [4]. These observations are not incompatible with a peroxidatic conversion of ethanol by catalase, since it has also been observed that chronic ethanol feed- ing stimulates NADPH oxidase activity [36,37], and, therefore, could increase the rate a t which hy- drogen peroxide is formed.
This work was supported by a grant from Deutsche Forschungsgemeinschaft, Xonderforschungsbereich 51 “Medi- zinkche Biochemie und Nolekularbiologie”. Funds to pur- chase the fluorometer were provided from NATO Scientific Research Council. Laboratory animals were a kind gift of Dr Thomae & Co., Biberach. Stipends were received from Alexander-von-Humboldt-Stiftung (RGT) and Deutsche Por- schungsgemeinschaft (HGL). We thank Erika Miiller, Ursula Schwabe, Ilga Wohlrab and Albert Schallweg for expert technical assistance. We also thank Dr Charles S. Lieber for fruitful discussions, helpful criticism and advice throughout this work. Finally, we thank Dr Britton Chance for his support; the experiments with cytochrome c per- oxidase were performed in his laboratory.
REFERENCES 1. Zimmer, P., and Scholz, R., unpublished observation. 2. Keilin, D., and Hartree, E. B’., Biochem. J . 39 (1945)
293. 3. Orme-Johnson, W. H., and Ziegler, D. M., Bwchem.
Bwphys. Res. Commun. 21 (1965) 78. 4. Lieber, C. S., and DeCarli, L. M., J . Biol. Chem. 245
(1970) 2505. 5. Roach, M. K., Reese, W. N., and Creaven, P . J., Bio-
chem. Biophys. Res. Commun. 36 (1969) 596. 6. Rubin, E., Hutterer, F., and Lieber, C. S., Science
(Washington), 159 (1968) 1469. 7. Remmer, H., and Merker, H. J., Ann. N . Y . A d . Sci.
123 (1965) 79. 8. Conney, A. H., Pharnzacol. Rev. 19 (1967) 317. 9. Gilette, J. R., Brodie, €3. B., and LaDu, B. N., J .
Pharmcol. Exp. Ther. 119 (1957) 532. 10. Warburg, O., and Christian, W., Biochem. 2. 266 (1933)
en- J I I .
11. Isselbacher, K. J., and Carter, E. A., Biochem. Biophys.
12. Tschudv. D, P.. and Collins, A., Science (Washington), Res. Commun. 39 (1970) 530.
. . 126 (i957) 168.
13. Hildebrandt, A., Remmer, H., and Estabrook, R. W., Bwchem. Biophys. Res. Commun. 30 (1968) 607.
430 R. G. THURMAN et al.: Hydrogen Peroxide and Acetaldehyde Formation by Liver Microsomes Eur. J. Biochem.
14. Gornall, A. G., Bardawill, C. J., and David, M. M., J .
15. Gupta, N. K., and Robinson, W. G., Biochim. Biophys.
16. Kreamer, M., personal communication. 17. Yonetani, T., and Ray, G. S., J . Biol. Chem. 240
18. Boveris, A., Oshino, N., and Chance, B., unpublished
19. Andreae, W. A., Nature (London), 175 (1955) 859. 20. Sies, H., and Brauser, B., Eur. J . Biochem. 15 (1970)
21. Hassinen, I., personal communication. 22. Thurman, R. G., unpublished observation. 23. Staudinger, Hj., and Zubrzycki, Z., Hoppe-Seyler’s 2.
Physiol. Chem. 340 (1965) 191. 24. Chance, B., Schoener, B., and Schindler, F., in Oxygen
in the Animal Organism (edited by I?. Dickens and E. Neil), IUB Symposium Series, Vol. 31, MacMillan, New York 1964, p. 367.
25. Brauser, B., Sies, H., and Biicher, Th., FEBS Lett. 2
Biol. Chem. 177 (1949) 751.
Acta, 118 (1966) 431.
(1965) 4503.
observation.
531.
(1969) 167.
161 (1946) 131. 26. Lemberg, R., and Foulkes, E. C., Nature (London),
27. Chance, B., and Herbert, D., Biochem. J . 46 (1950) 402.
28. Axelrod. J.. Reichenthal. J.. and Brodie, B. B.. J . Phar- macol: Exp. Ther. 112‘(1954).
20. Tephlv, T. R., Tinelli, F., and Watkins, W. D., Science rwkkhington), 166 (1969) 627.
observation.
30. Coon, M., personal communication. 31. Ley, H. G., Thurman, R. G., and Scholz, R., unpublished
32. Rubin, E., Gang, H., and Lieber, C. S., Biochem. Bio- phys. Res. Commun. 42 (1971) 1.
33. Narasimhulu, S., Cooper, D. Y., and Rosenthal, O., Life Sci. 4 (1965) 2101.
34. Chance, B., in The Enzymes (edited by K. Myrblick and J. B. Summer), Academic Press, New York 1951, Vol. 11, part 1, p. 428.
35. Gordon, E. R., Nature (London), 209 (1966) 5027. 36. Lieber, C. S., in Metabolic Changes Induced by Ethanol
(edited by G. A. Martini and Ch. Bode), Springer- Verlae. Berlin. Heidelbere. New York 1970. D. 85.
37. Lieber, e. S., and DeCarli, L’: M., Science ( Washgton), 170 (1970) 78.
38. Lieber; C. S:, personal communication. 39. Dixon, M., Biochem. J . 55 (1953) 170. 40. Biochemica Catalogue, Boehringer Mannheim GmbH
41. Imai, Y., and Sato, R., J . Biochem. 62 (1967) 239. (Mannheim, Germany).
R. G. Thurman’s present address: Johnson Research Foundation, University of Pennsylvania Philadelphia, Pennsylvania 19104, U.S.A.
H. G. Ley’s present address : Medizinische Universitltsklinik BRD-4000 Dusseldorf 1, WitzelstraBe 111 German Federal Republic
R. Scholz Institut fur Physiologische Chemie und Physikalische Biochemie der Universitlt BRD-8000 Munchen 2, GoethestraBe 33 German Federal Republic


![Catalase - Saylor · PDF fileCatalase is used in the food industry for removing hydrogen peroxide from milk prior to cheese production.[128] Another use is in food wrappers where it](https://img.pdfslide.us/doc/110x75/5abca5c47f8b9a441d8e5428/catalase-saylor-is-used-in-the-food-industry-for-removing-hydrogen-peroxide-from.jpg)