Embed Size (px)
Citation preview
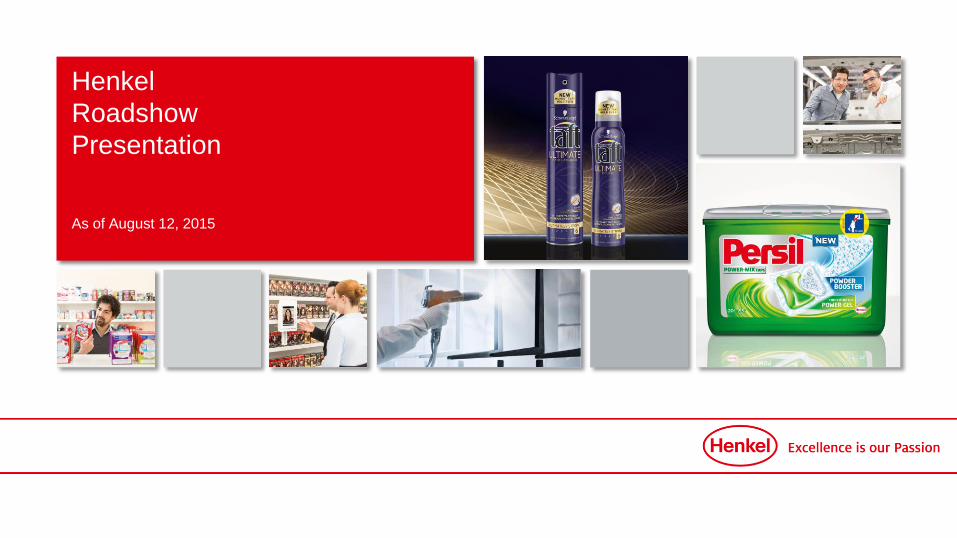
Henkel
Roadshow
Presentation
As of August 12, 2015
2
Disclaimer
As of August 12, 2015 Henkel Roadshow Presentation
This information contains forward-looking statements which are based on current
estimates and assumptions made by the corporate management of Henkel AG & Co.
KGaA. Statements with respect to the future are characterized by the use of words such
as “expect”, “intend”, “plan”, “anticipate”, “believe”, “estimate”, and similar terms. Such
statements are not to be understood as in any way guaranteeing that those expectations
will turn out to be accurate. Future performance and results actually achieved by Henkel
AG & Co. KGaA and its affiliated companies depend on a number of risks and
uncertainties and may therefore differ materially from the forward-looking statements.
Many of these factors are outside Henkel's control and cannot be accurately estimated in
advance, such as the future economic environment and the actions of competitors and
others involved in the marketplace. Henkel neither plans nor undertakes to update any
forward-looking statements.
3
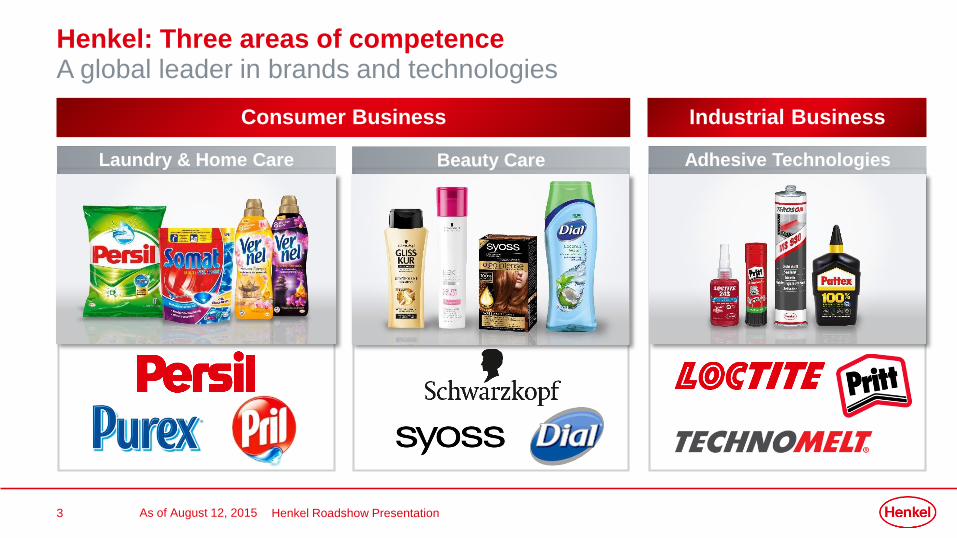
Consumer Business
Laundry & Home Care Beauty Care Adhesive Technologies
Industrial Business
Henkel: Three areas of competenceA global leader in brands and technologies
As of August 12, 2015 Henkel Roadshow Presentation
4
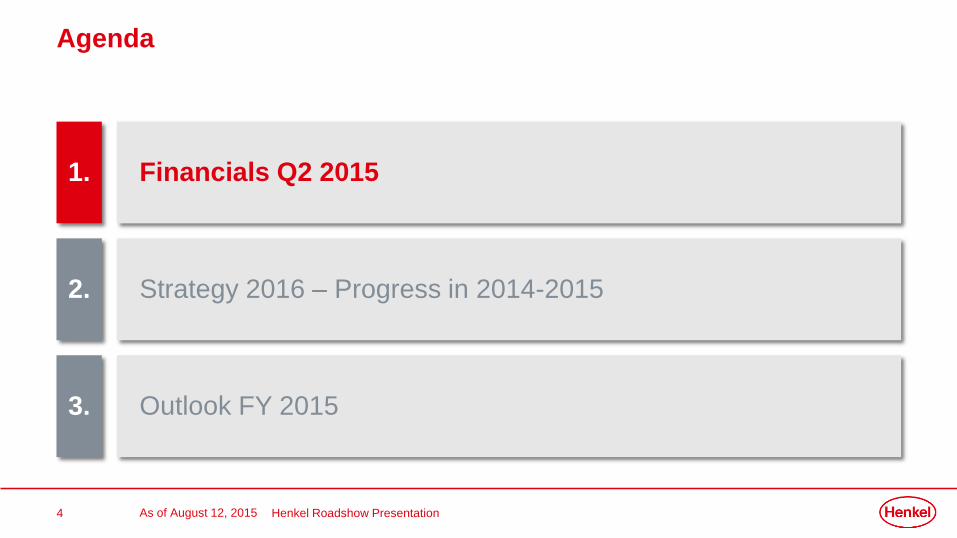
Agenda
As of August 12, 2015 Henkel Roadshow Presentation
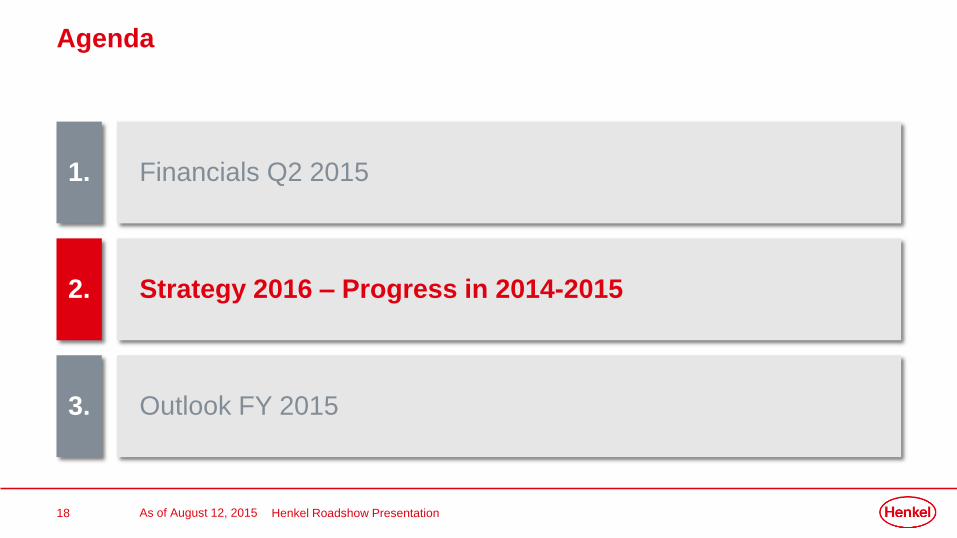
1.
3.
Financials Q2 2015
Strategy 2016 – Progress in 2014-2015
Outlook FY 2015
2.
5
Q2 2015: Solid performance in a challenging environment
As of August 12, 2015 Henkel Roadshow Presentation
OSG
+2.4%
Adj. EPS growth
+11.2%
NWC in % of sales
6.6%
Net financial pos.
€ -634m
Adj. EBIT margin
16.4%
OSG in EM
+5.1%
6
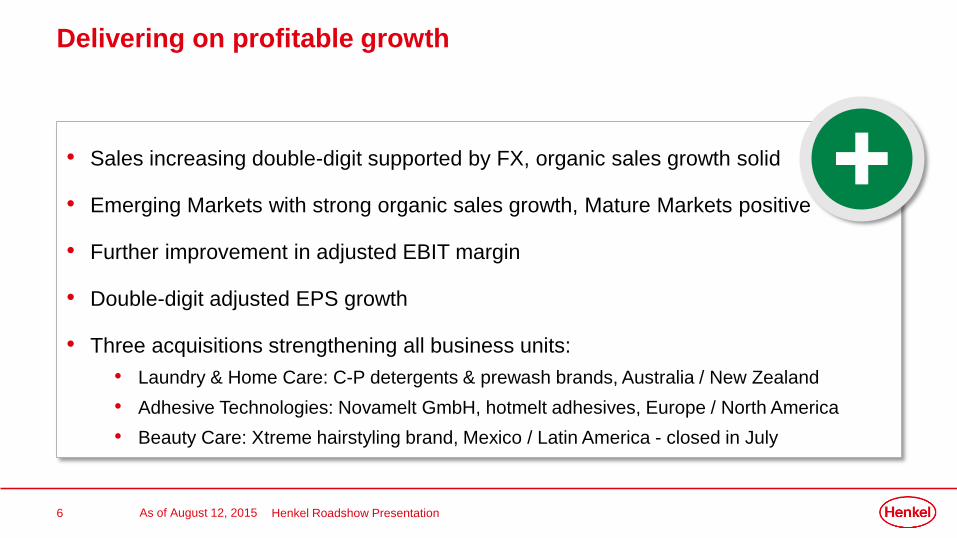
Delivering on profitable growth
As of August 12, 2015 Henkel Roadshow Presentation
• Sales increasing double-digit supported by FX, organic sales growth solid
• Emerging Markets with strong organic sales growth, Mature Markets positive
• Further improvement in adjusted EBIT margin
• Double-digit adjusted EPS growth
• Three acquisitions strengthening all business units:
• Laundry & Home Care: C-P detergents & prewash brands, Australia / New Zealand
• Adhesive Technologies: Novamelt GmbH, hotmelt adhesives, Europe / North America
• Beauty Care: Xtreme hairstyling brand, Mexico / Latin America - closed in July
7
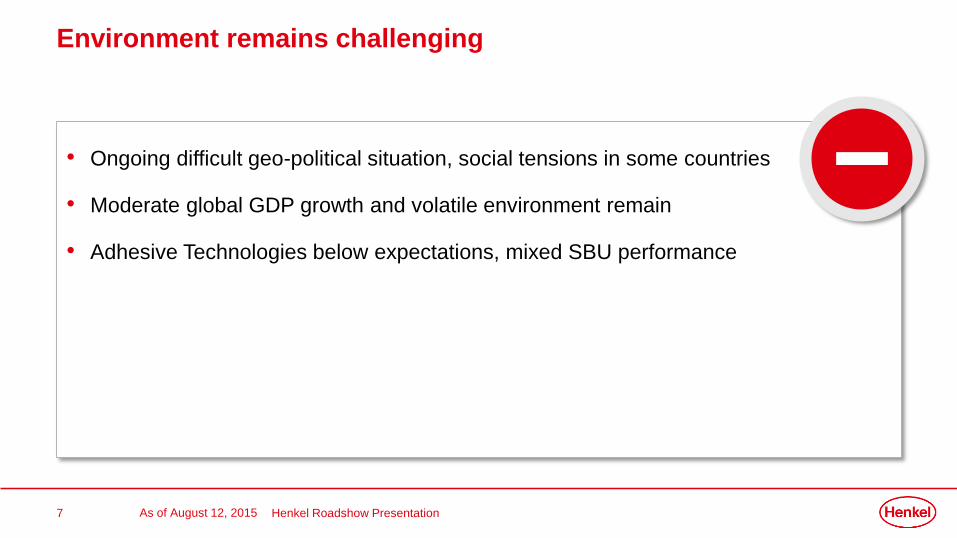
Environment remains challenging
As of August 12, 2015 Henkel Roadshow Presentation
• Ongoing difficult geo-political situation, social tensions in some countries
• Moderate global GDP growth and volatile environment remain
• Adhesive Technologies below expectations, mixed SBU performance
8
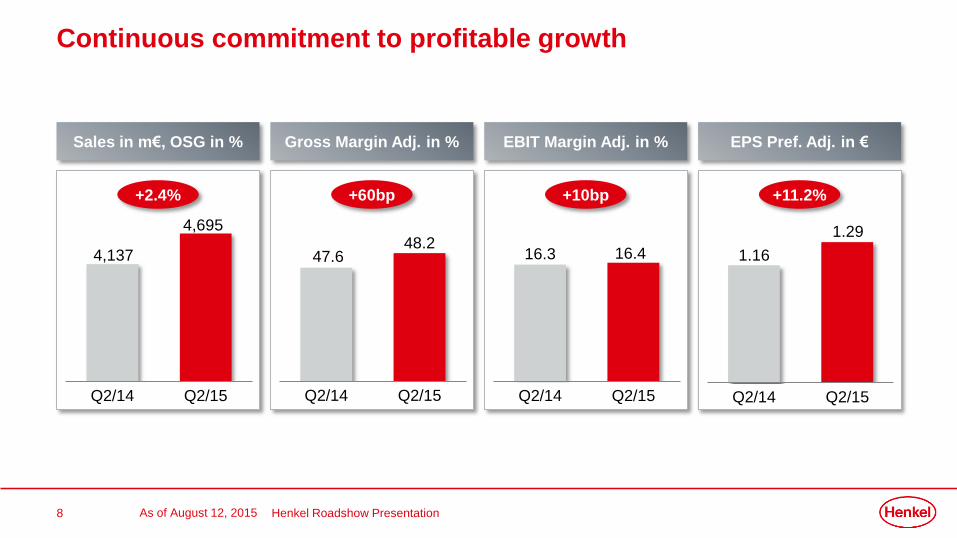
Continuous commitment to profitable growth
As of August 12, 2015 Henkel Roadshow Presentation
Sales in m€, OSG in % Gross Margin Adj. in % EBIT Margin Adj. in % EPS Pref. Adj. in €
Q2/14 Q2/15
4,137
4,695
Q2/14 Q2/15
47.648.2
Q2/14 Q2/15
16.3 16.4
Q2/14 Q2/15
1.16
1.29
+2.4% +60bp +10bp +11.2%
9
6.06.6
Q2/14 Q2/15
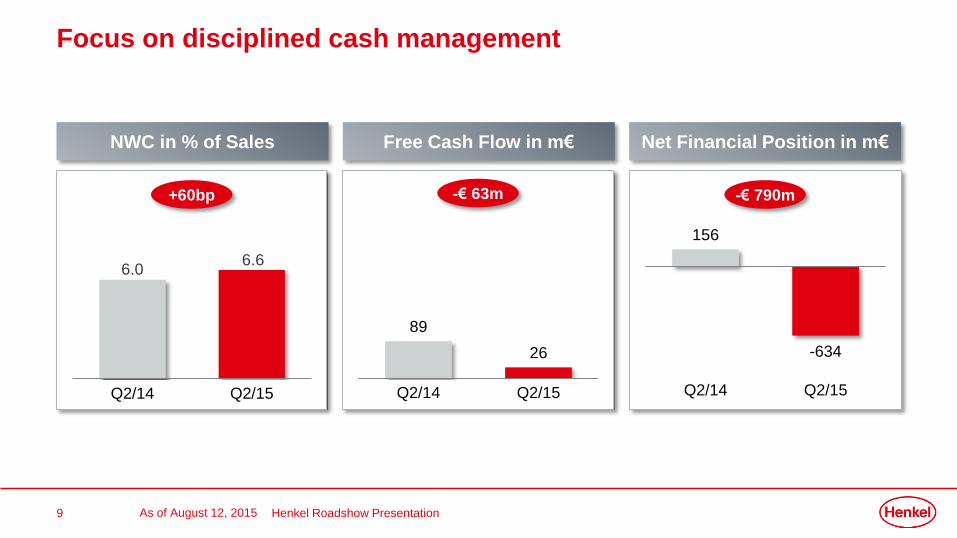
Focus on disciplined cash management
As of August 12, 2015 Henkel Roadshow Presentation
NWC in % of Sales
+60bp
Free Cash Flow in m€ Net Financial Position in m€
89
26
Q2/14 Q2/15
-€ 63m -€ 790m
156
-634
Q2/14 Q2/15
10
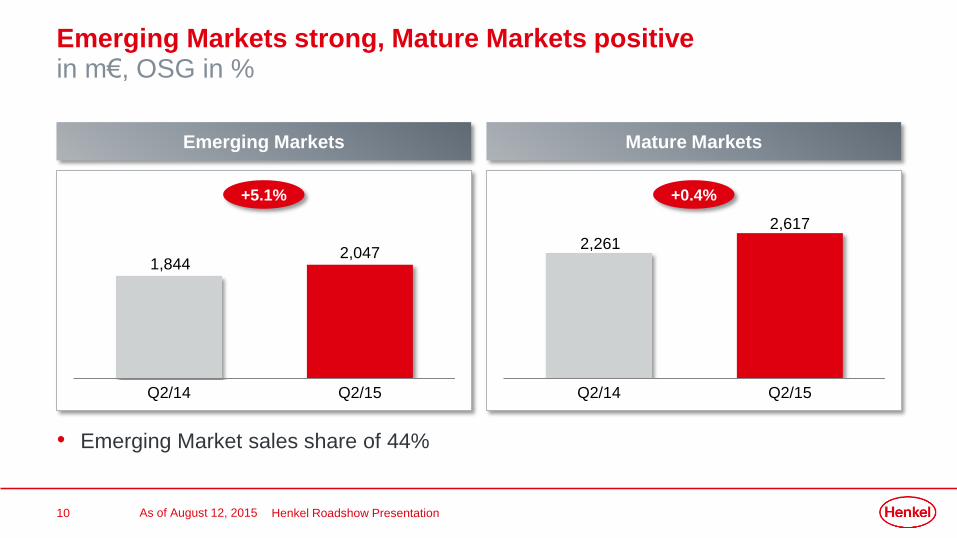
Emerging Markets strong, Mature Markets positivein m€, OSG in %
As of August 12, 2015 Henkel Roadshow Presentation
Emerging Markets Mature Markets
• Emerging Market sales share of 44%
+5.1%
1,8442,047
Q2/14 Q2/15
+0.4%
2,261
2,617
Q2/14 Q2/15
11
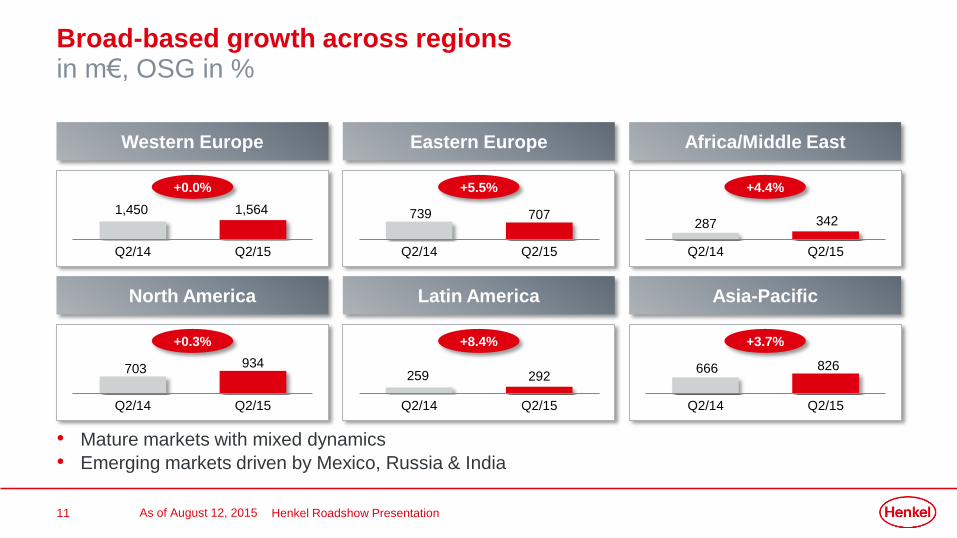
Broad-based growth across regionsin m€, OSG in %
As of August 12, 2015 Henkel Roadshow Presentation
• Mature markets with mixed dynamics
• Emerging markets driven by Mexico, Russia & India
Western Europe Eastern Europe
739 707
Q2/14 Q2/15
+5.5%
Africa/Middle East
287 342
Q2/14 Q2/15
+4.4%
North America
703 934
Q2/14 Q2/15
+0.3%
Latin America
259 292
Q2/14 Q2/15
+8.4%
Asia-Pacific
666 826
Q2/14 Q2/15
+3.7%
1,450 1,564
Q2/14 Q2/15
+0.0%
12
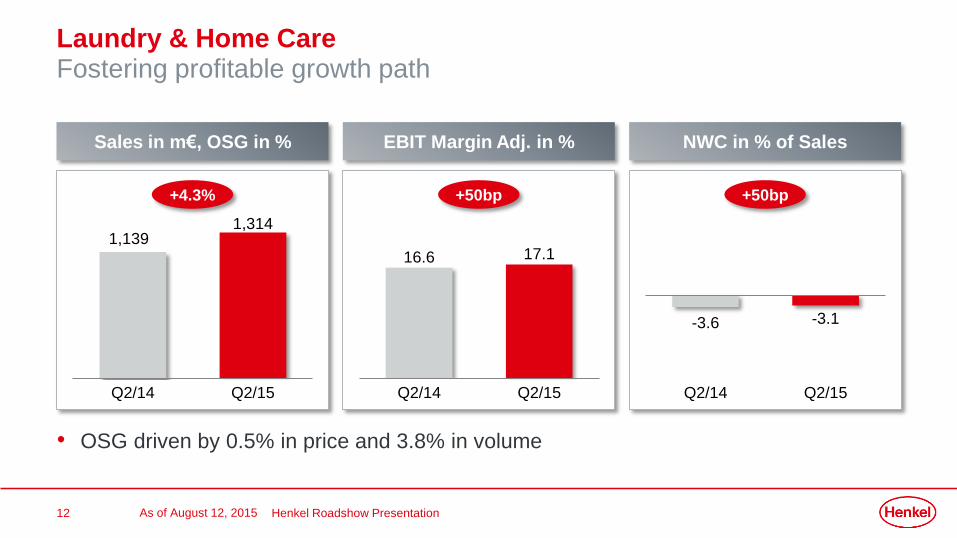
Laundry & Home CareFostering profitable growth path
As of August 12, 2015 Henkel Roadshow Presentation
Sales in m€, OSG in %
+4.3%
EBIT Margin Adj. in % NWC in % of Sales
1,1391,314
Q2/14 Q2/15
+50bp
16.6 17.1
Q2/14 Q2/15
+50bp
-3.6 -3.1
Q2/14 Q2/15
• OSG driven by 0.5% in price and 3.8% in volume
13
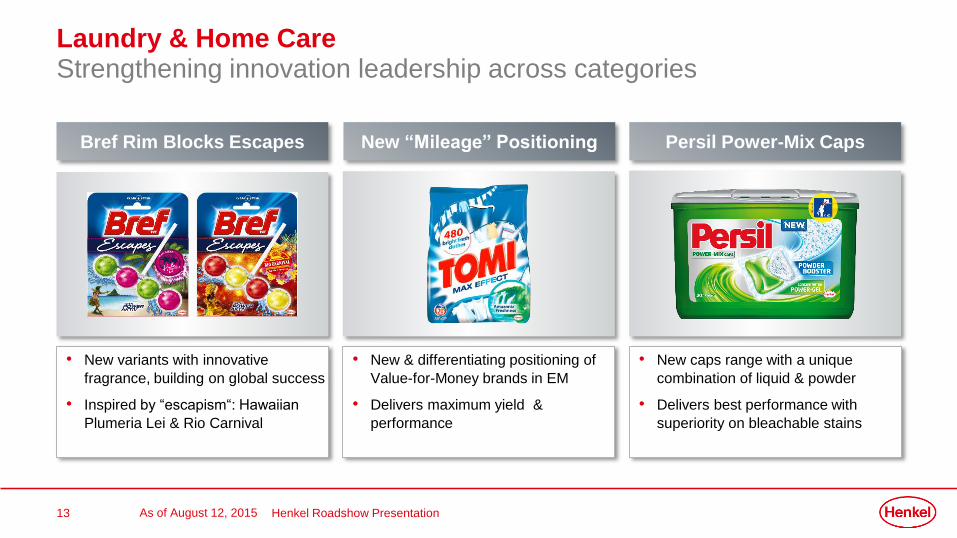
Laundry & Home CareStrengthening innovation leadership across categories
• New variants with innovative
fragrance, building on global success
• Inspired by “escapism“: Hawaiian
Plumeria Lei & Rio Carnival
• New & differentiating positioning of
Value-for-Money brands in EM
• Delivers maximum yield &
performance
• New caps range with a unique
combination of liquid & powder
• Delivers best performance with
superiority on bleachable stains
As of August 12, 2015 Henkel Roadshow Presentation
New “Mileage” Positioning Persil Power-Mix CapsBref Rim Blocks Escapes
14
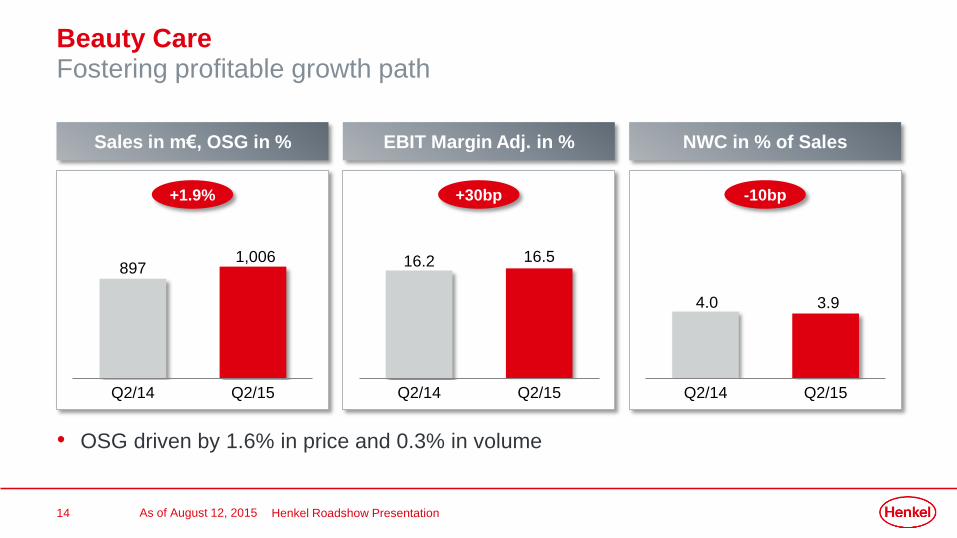
Beauty CareFostering profitable growth path
As of August 12, 2015 Henkel Roadshow Presentation
Sales in m€, OSG in %
+1.9%
EBIT Margin Adj. in % NWC in % of Sales
8971,006
Q2/14 Q2/15
+30bp
16.2 16.5
Q2/14 Q2/15
-10bp
• OSG driven by 1.6% in price and 0.3% in volume
4.0 3.9
Q2/14 Q2/15
15
Beauty CareStrengthening innovation leadership across categories
Henkel Roadshow Presentation
• 1st 48h reliable protection & all-day
freshness activation from Fa
• Unique formula continuously
releasing fragrance
• 1st Taft range with hold level 6
for the strongest Taft-hold ever
• Formula with liquid crystal-gloss-
effect for luxuriously shiny hair
• 1st Oil-Repair Range from Gliss Kur
with precious Beauty-Oils & Keratin
• For healthy looking, shiny hair &
up to 90% less split-ends*
As of August 12, 2015
1 System usage Shampoo & Conditioner
Fa Fresh & Dry Taft UltimateGliss Kur Oil Nutritive
16
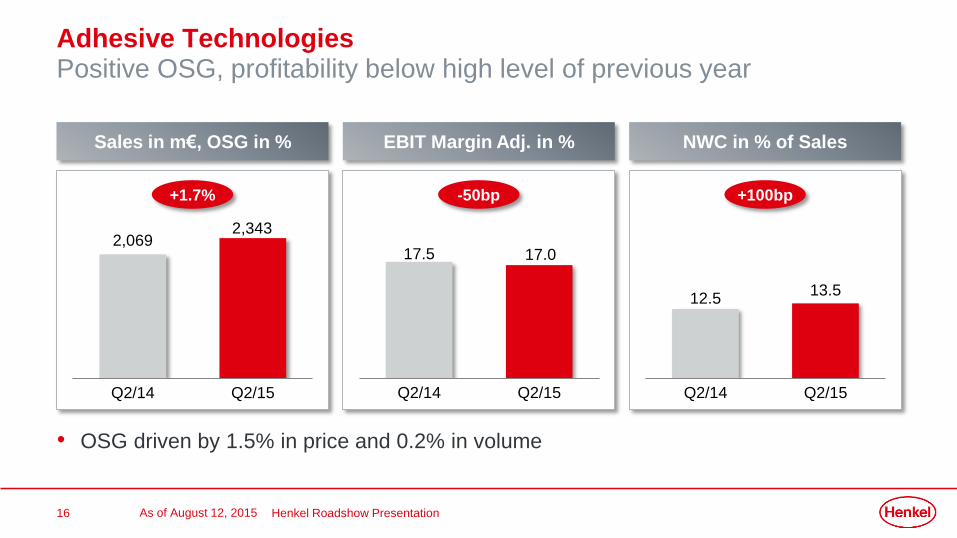
Adhesive TechnologiesPositive OSG, profitability below high level of previous year
As of August 12, 2015 Henkel Roadshow Presentation
Sales in m€, OSG in %
+1.7%
EBIT Margin Adj. in % NWC in % of Sales
2,069
Q2/14 Q2/15
-50bp
17.5 17.0
Q2/14 Q2/15
+100bp
• OSG driven by 1.5% in price and 0.2% in volume
12.513.5
Q2/14 Q2/15
2,343
17
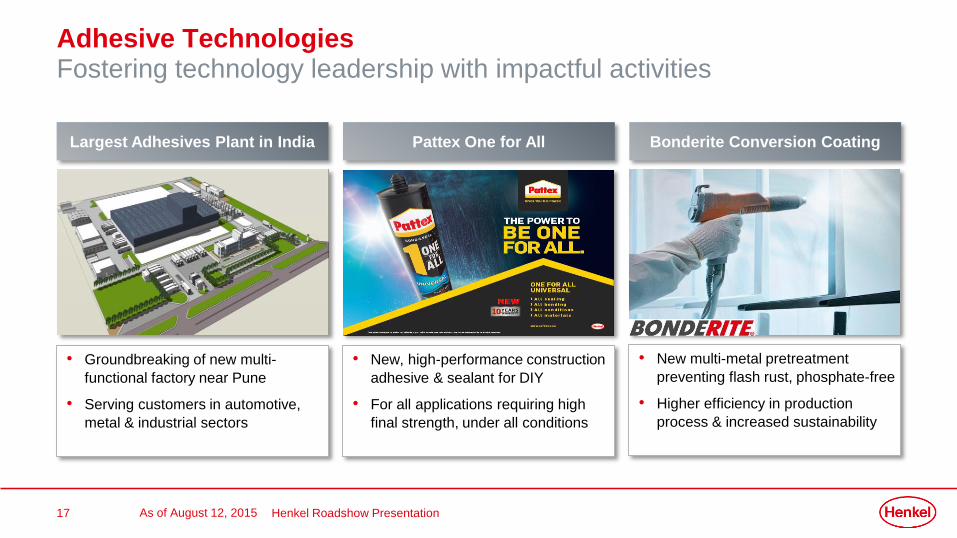
Adhesive TechnologiesFostering technology leadership with impactful activities
• New multi-metal pretreatment
preventing flash rust, phosphate-free
• Higher efficiency in production
process & increased sustainability
• Groundbreaking of new multi-
functional factory near Pune
• Serving customers in automotive,
metal & industrial sectors
Henkel Roadshow Presentation
• New, high-performance construction
adhesive & sealant for DIY
• For all applications requiring high
final strength, under all conditions
As of August 12, 2015
Pattex One for All Bonderite Conversion CoatingLargest Adhesives Plant in India
18
Agenda
As of August 12, 2015 Henkel Roadshow Presentation
1.
3.
Financials Q2 2015
Strategy 2016 – Progress in 2014-2015
Outlook FY 2015
2.
19
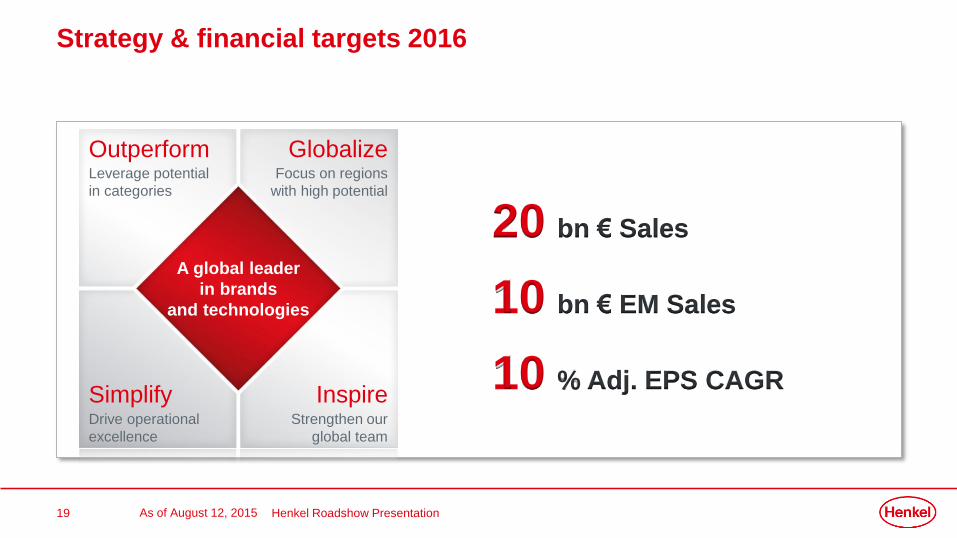
Strategy & financial targets 2016
Henkel Roadshow Presentation
Outperform Globalize
Simplify Inspire
A global leader
in brands
and technologies
Leverage potential
in categories
Focus on regions
with high potential
Drive operational
excellence
Strengthen our
global team
20 bn € Sales
10 bn € EM Sales
10 % Adj. EPS CAGR
As of August 12, 2015
20
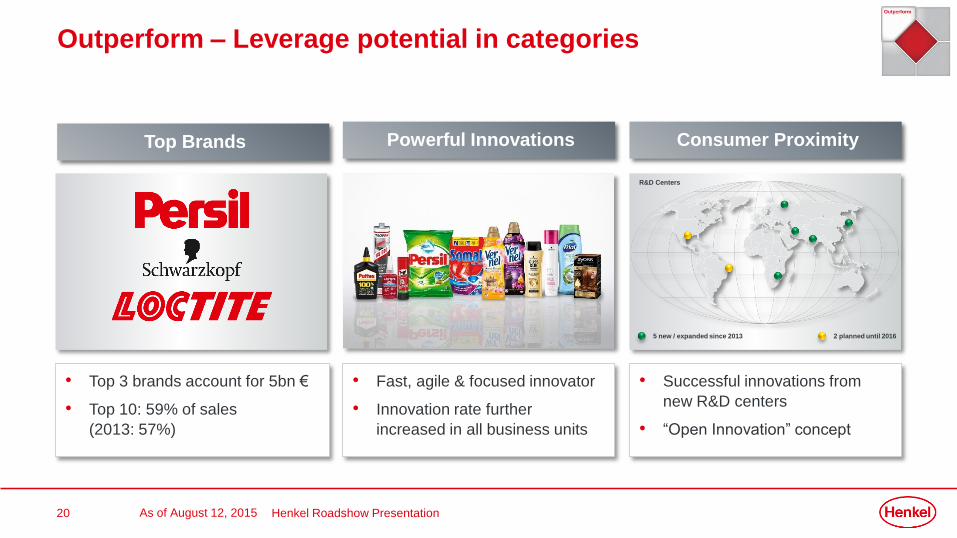
Outperform – Leverage potential in categories
• Successful innovations from
new R&D centers
• “Open Innovation” concept
• Top 3 brands account for 5bn €
• Top 10: 59% of sales
(2013: 57%)
Top Brands Powerful Innovations Consumer Proximity
• Fast, agile & focused innovator
• Innovation rate further
increased in all business units
Henkel Roadshow Presentation
5 new / expanded since 2013 2 planned until 2016
R&D Centers
As of August 12, 2015
21
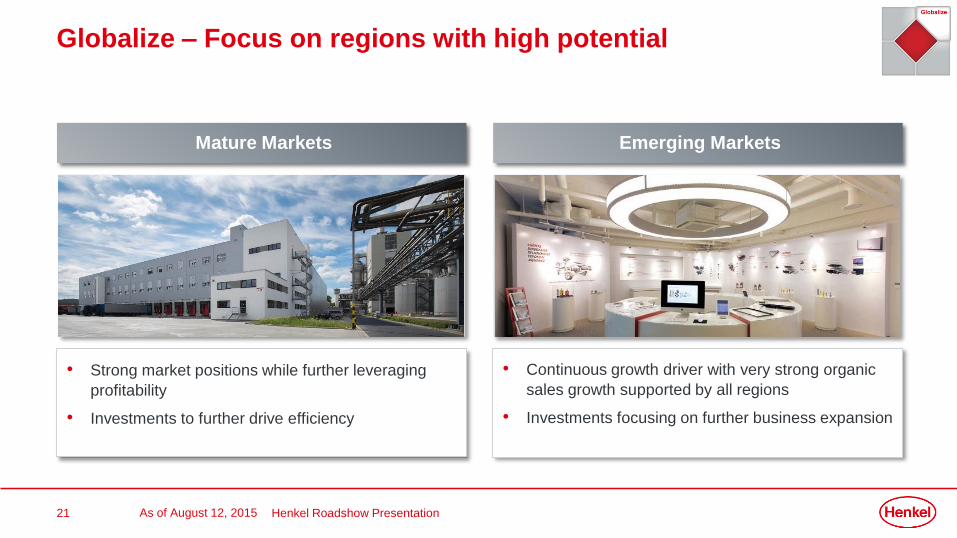
Globalize – Focus on regions with high potential
• Strong market positions while further leveraging
profitability
• Investments to further drive efficiency
• Continuous growth driver with very strong organic
sales growth supported by all regions
• Investments focusing on further business expansion
Mature Markets Emerging Markets
Henkel Roadshow PresentationAs of August 12, 2015
22
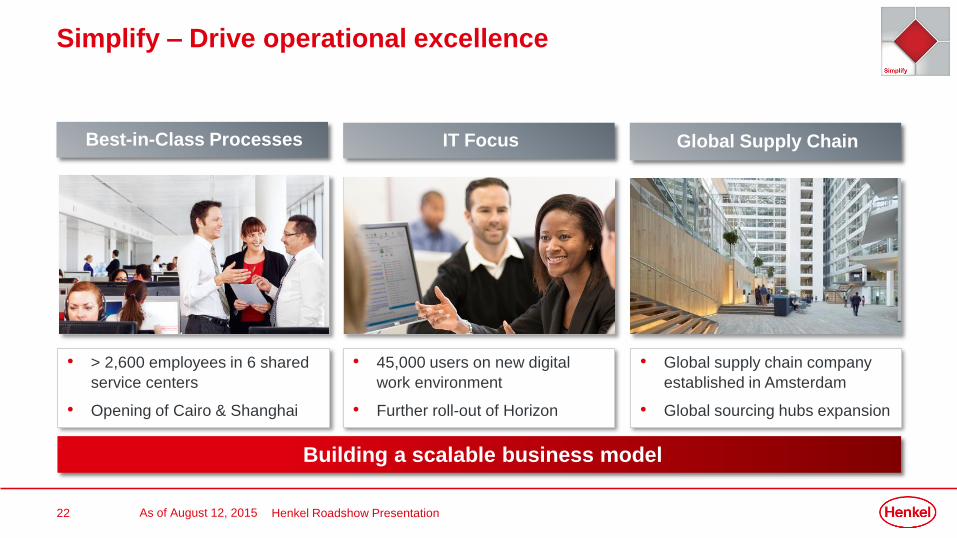
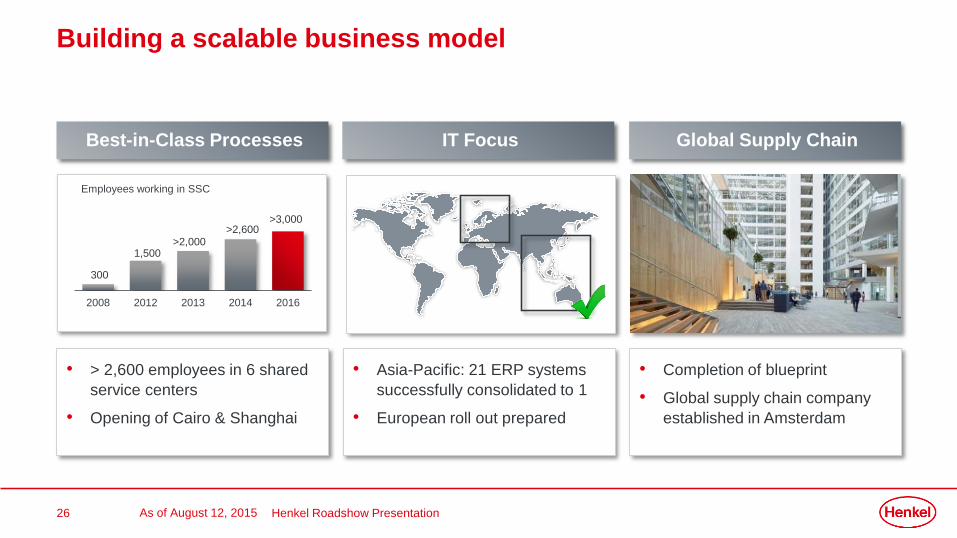
Simplify – Drive operational excellence
• 45,000 users on new digital
work environment
• Further roll-out of Horizon
• > 2,600 employees in 6 shared
service centers
• Opening of Cairo & Shanghai
IT Focus
• Global supply chain company
established in Amsterdam
• Global sourcing hubs expansion
Global Supply ChainBest-in-Class Processes
Henkel Roadshow Presentation
Building a scalable business model
As of August 12, 2015
23
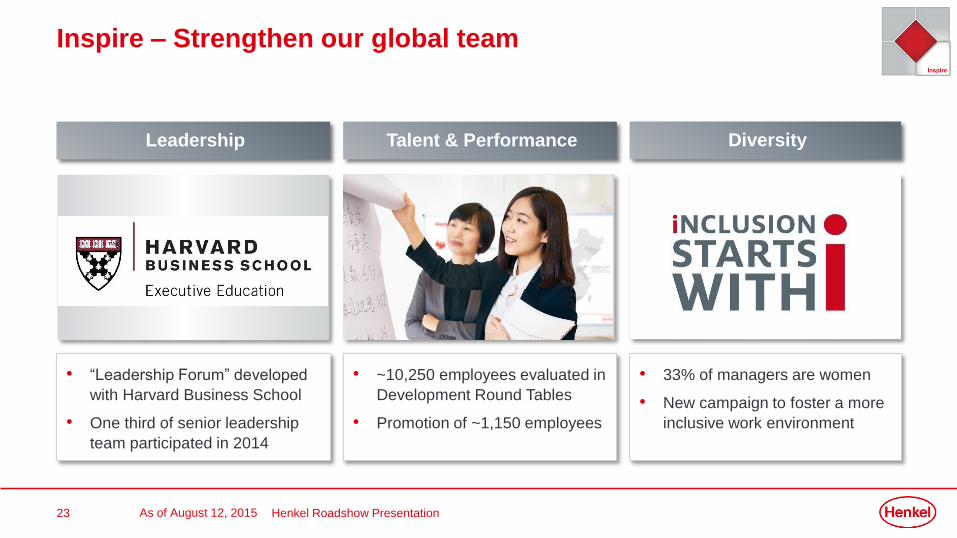
Inspire – Strengthen our global team
DiversityTalent & Performance
• ~10,250 employees evaluated in
Development Round Tables
• Promotion of ~1,150 employees
• “Leadership Forum” developed
with Harvard Business School
• One third of senior leadership
team participated in 2014
• 33% of managers are women
• New campaign to foster a more
inclusive work environment
Leadership
Henkel Roadshow PresentationAs of August 12, 2015
24
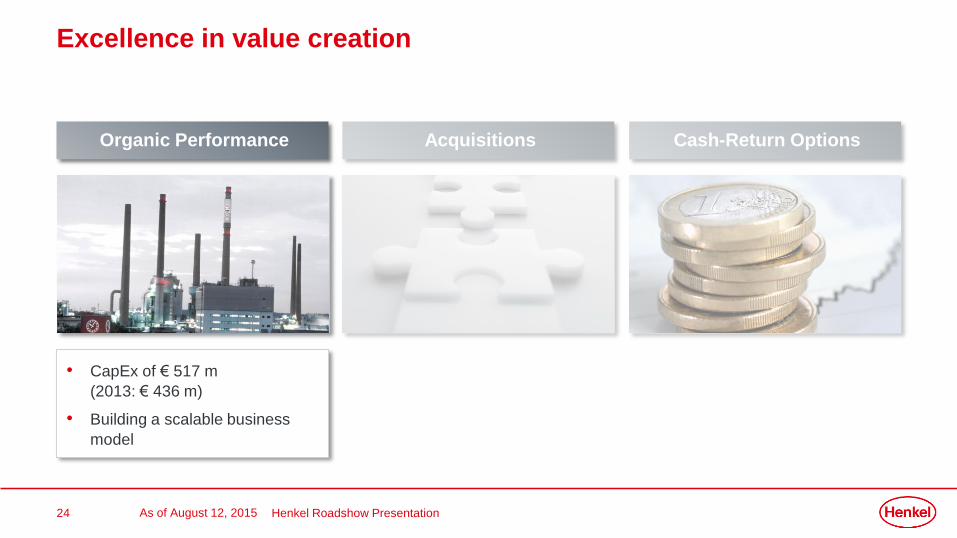
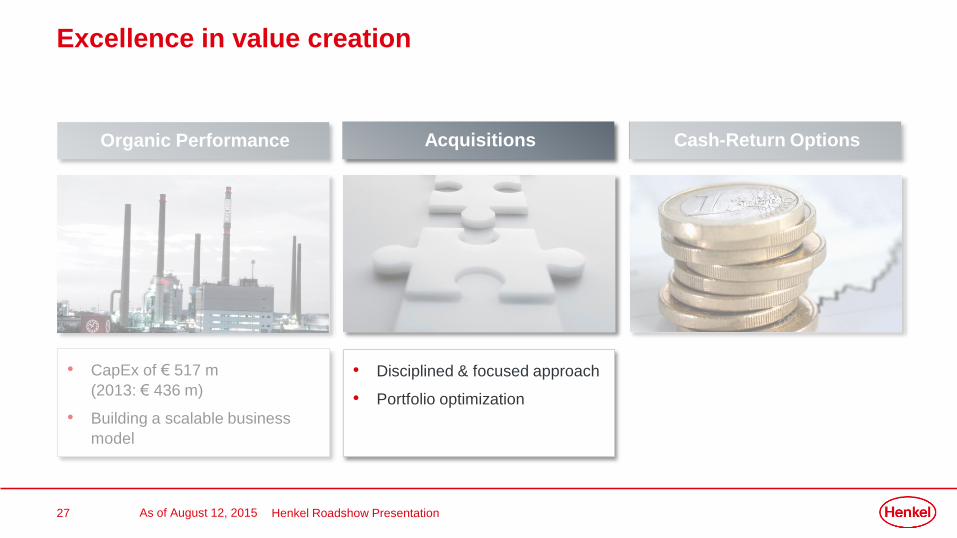
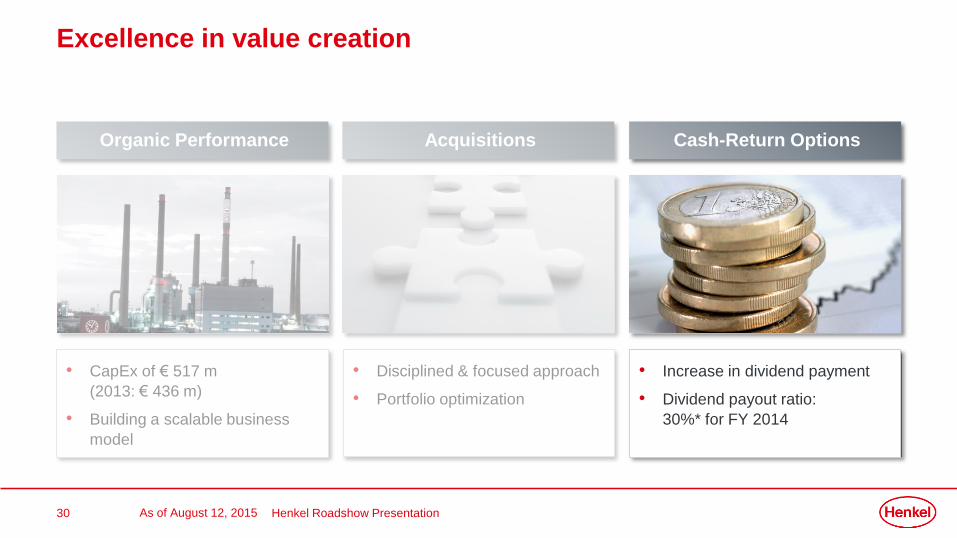
Excellence in value creation
Organic Performance Acquisitions Cash-Return Options
• CapEx of € 517 m
(2013: € 436 m)
• Building a scalable business
model
Henkel Roadshow PresentationAs of August 12, 2015
25
2013 2014
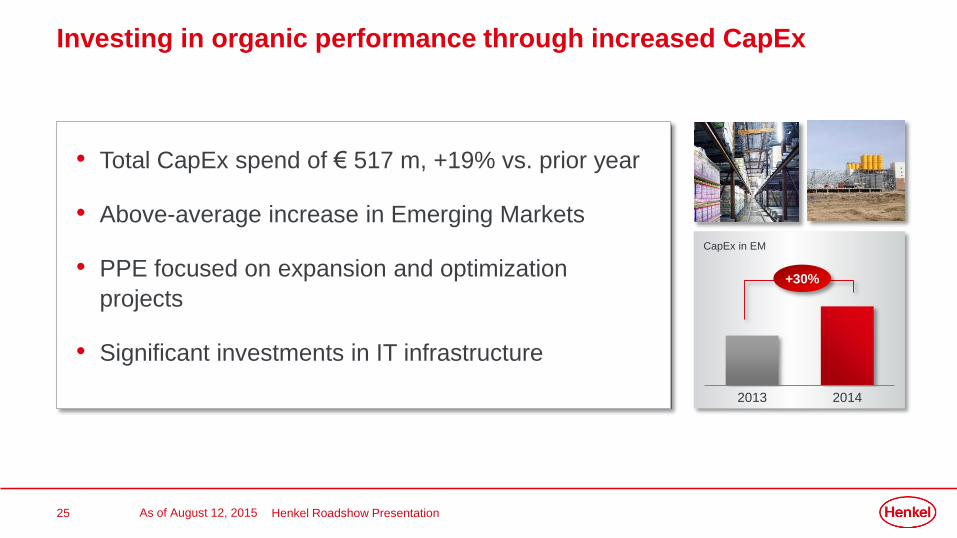
Investing in organic performance through increased CapEx
Henkel Roadshow Presentation
• Total CapEx spend of € 517 m, +19% vs. prior year
• Above-average increase in Emerging Markets
• PPE focused on expansion and optimization
projects
• Significant investments in IT infrastructure
CapEx in EM
+30%
As of August 12, 2015
26
Best-in-Class Processes IT Focus Global Supply Chain
• > 2,600 employees in 6 shared
service centers
• Opening of Cairo & Shanghai
Henkel Roadshow Presentation
• Asia-Pacific: 21 ERP systems
successfully consolidated to 1
• European roll out prepared
• Completion of blueprint
• Global supply chain company
established in Amsterdam
Building a scalable business model
2008 2012 2013 2014 2016
300
1,500>2,000
>2,600>3,000
Employees working in SSC
As of August 12, 2015
27
Organic Performance Cash-Return Options
• CapEx of € 517 m
(2013: € 436 m)
• Building a scalable business
model
Excellence in value creation
• Disciplined & focused approach
• Portfolio optimization
Acquisitions
Henkel Roadshow PresentationAs of August 12, 2015
28
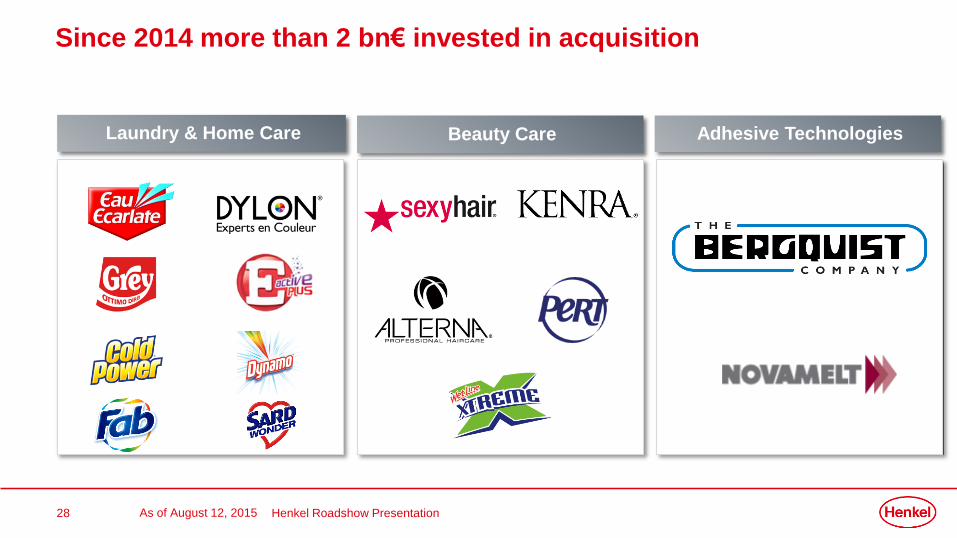
Since 2014 more than 2 bn€ invested in acquisition
Beauty CareLaundry & Home Care Adhesive Technologies
As of August 12, 2015 Henkel Roadshow Presentation
29
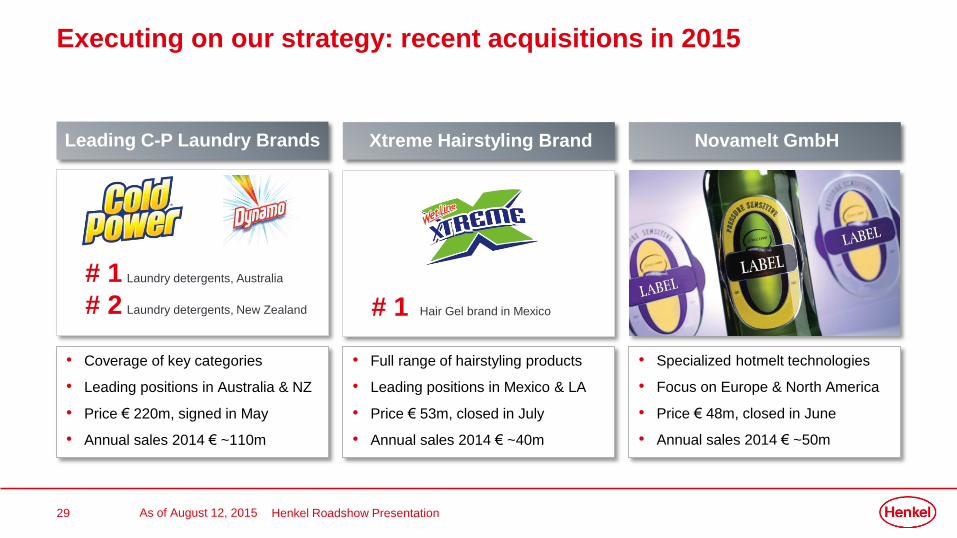
Executing on our strategy: recent acquisitions in 2015
Henkel Roadshow Presentation
Xtreme Hairstyling BrandLeading C-P Laundry Brands
• Full range of hairstyling products
• Leading positions in Mexico & LA
• Price € 53m, closed in July
• Annual sales 2014 € ~40m
• Coverage of key categories
• Leading positions in Australia & NZ
• Price € 220m, signed in May
• Annual sales 2014 € ~110m
# 1 Hair Gel brand in Mexico
# 1
# 2
Laundry detergents, Australia
Laundry detergents, New Zealand
As of August 12, 2015
Novamelt GmbH
• Specialized hotmelt technologies
• Focus on Europe & North America
• Price € 48m, closed in June
• Annual sales 2014 € ~50m
30
• Disciplined & focused approach
• Portfolio optimization
Excellence in value creation
• Increase in dividend payment
• Dividend payout ratio:
30%* for FY 2014
Organic Performance Cash-Return Options
• CapEx of € 517 m
(2013: € 436 m)
• Building a scalable business
model
Acquisitions
Henkel Roadshow PresentationAs of August 12, 2015
31 Henkel Roadshow Presentation
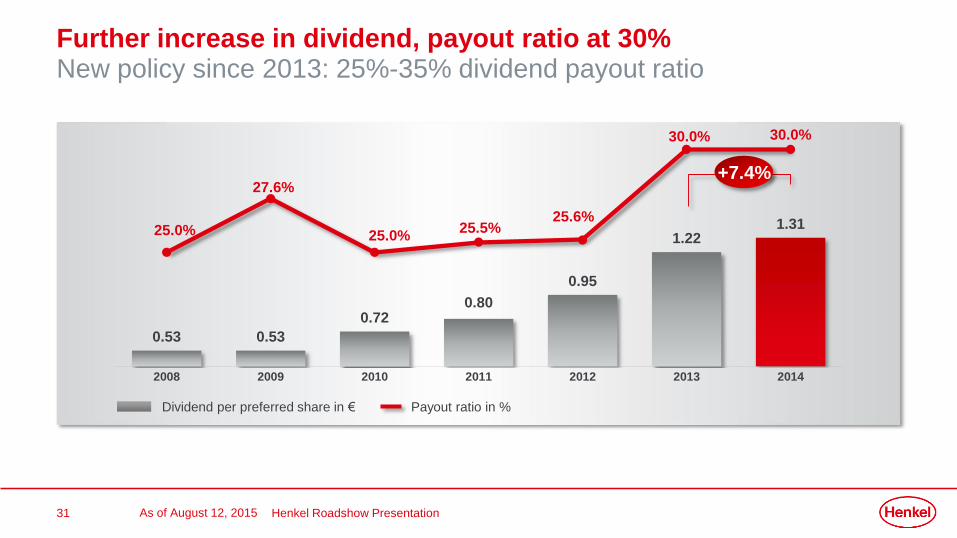
0.53 0.53
0.720.80
0.95
1.221.31
2008 2009 2010 2011 2012 2013 2014
Further increase in dividend, payout ratio at 30%New policy since 2013: 25%-35% dividend payout ratio
+7.4%
Payout ratio in %Dividend per preferred share in €
25.0%
27.6%
25.0%25.5%
25.6%
30.0% 30.0%
As of August 12, 2015
32
Summary: Strategic framework
A global leader in brands and technologies
Customers People Financials Sustainability FamilyValues
Vision
Targets 20 bn €
SALES
10 bn €
EM SALES
10 %
EPS CAGR
Strategy Outperform Simplify InspireGlobalize
Vision
Values
Strategy
Targets
Henkel Roadshow PresentationAs of August 12, 2015
33
Agenda
As of August 12, 2015 Henkel Roadshow Presentation
1.
3.
Financials Q2 2015
Strategy 2016 – Progress in 2014-2015
Outlook FY 2015
2.
34
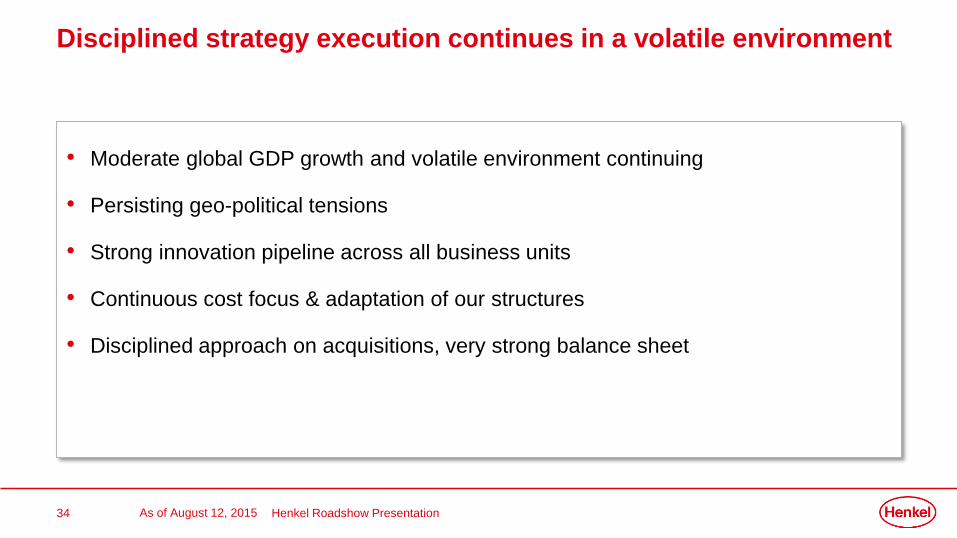
Disciplined strategy execution continues in a volatile environment
As of August 12, 2015 Henkel Roadshow Presentation
• Moderate global GDP growth and volatile environment continuing
• Persisting geo-political tensions
• Strong innovation pipeline across all business units
• Continuous cost focus & adaptation of our structures
• Disciplined approach on acquisitions, very strong balance sheet
35
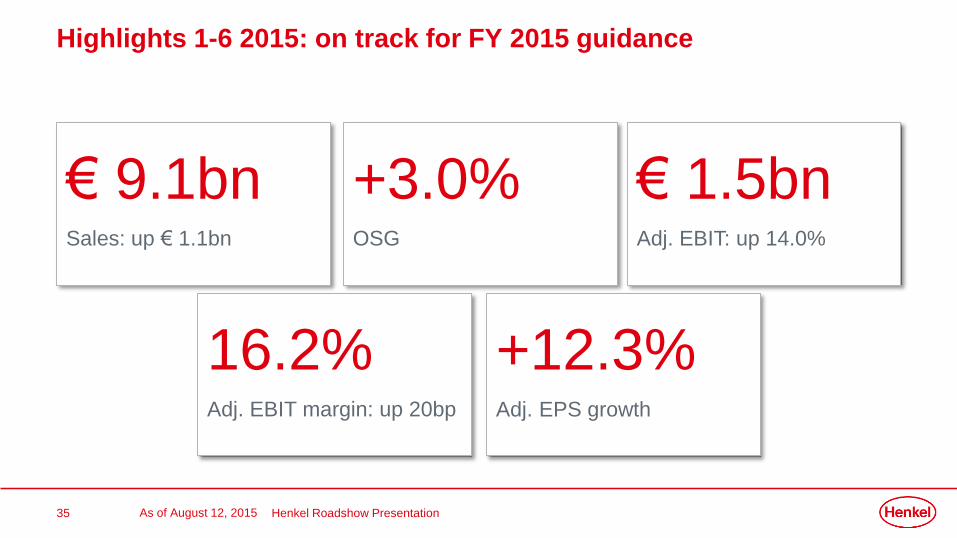
Highlights 1-6 2015: on track for FY 2015 guidance
As of August 12, 2015 Henkel Roadshow Presentation
+12.3%Adj. EPS growth
€ 9.1bnSales: up € 1.1bn
16.2%Adj. EBIT margin: up 20bp
€ 1.5bnAdj. EBIT: up 14.0%
+3.0%OSG
36
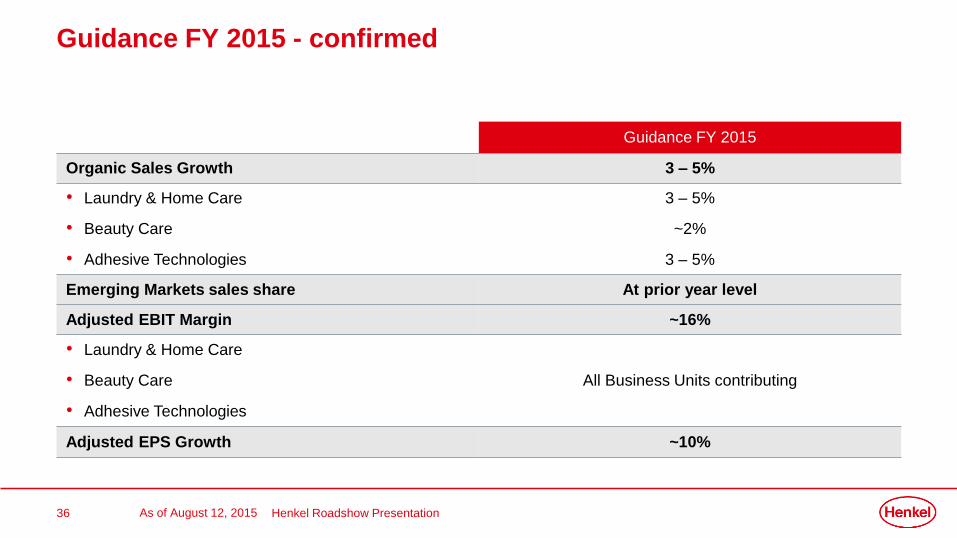
Guidance FY 2015 - confirmed
As of August 12, 2015 Henkel Roadshow Presentation
Guidance FY 2015
Organic Sales Growth 3 – 5%
• Laundry & Home Care
• Beauty Care
• Adhesive Technologies
3 – 5%
~2%
3 – 5%
Emerging Markets sales share At prior year level
Adjusted EBIT Margin ~16%
• Laundry & Home Care
• Beauty Care
• Adhesive Technologies
All Business Units contributing
Adjusted EPS Growth ~10%
37
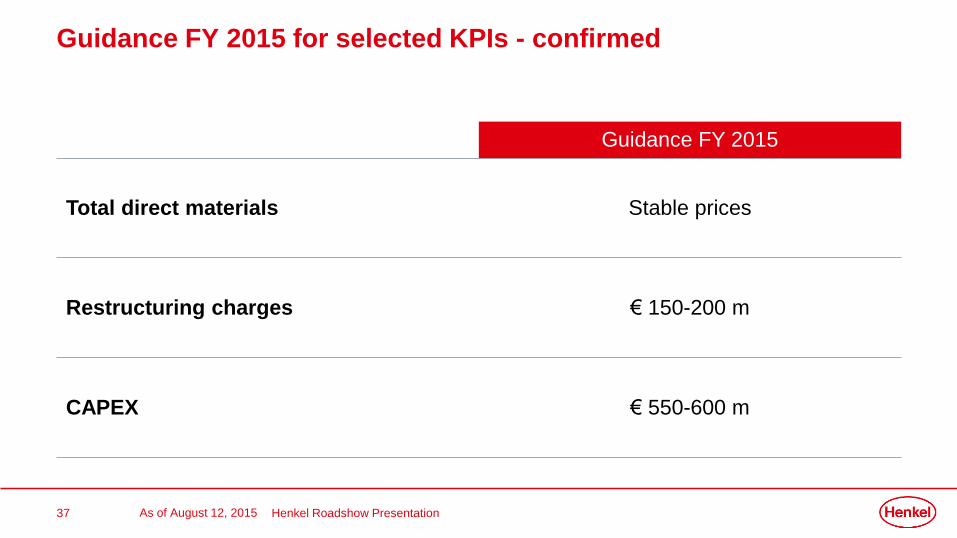
Guidance FY 2015 for selected KPIs - confirmed
As of August 12, 2015 Henkel Roadshow Presentation
Guidance FY 2015
Total direct materials Stable prices
Restructuring charges € 150-200 m
CAPEX € 550-600 m
38
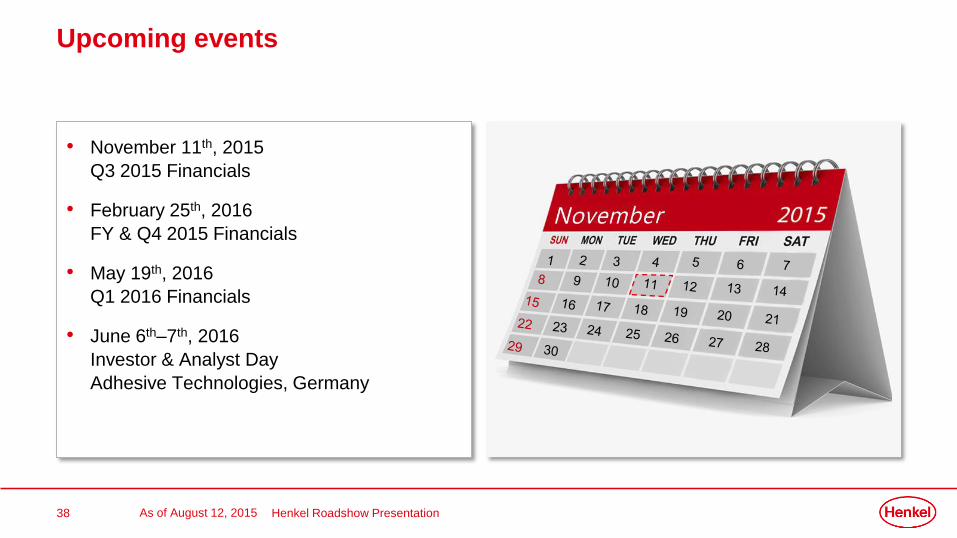
Upcoming events
As of August 12, 2015 Henkel Roadshow Presentation
• November 11th, 2015
Q3 2015 Financials
• February 25th, 2016
FY & Q4 2015 Financials
• May 19th, 2016
Q1 2016 Financials
• June 6th–7th, 2016
Investor & Analyst Day
Adhesive Technologies, Germany
Additional information on
Financials 1-6 2015
40
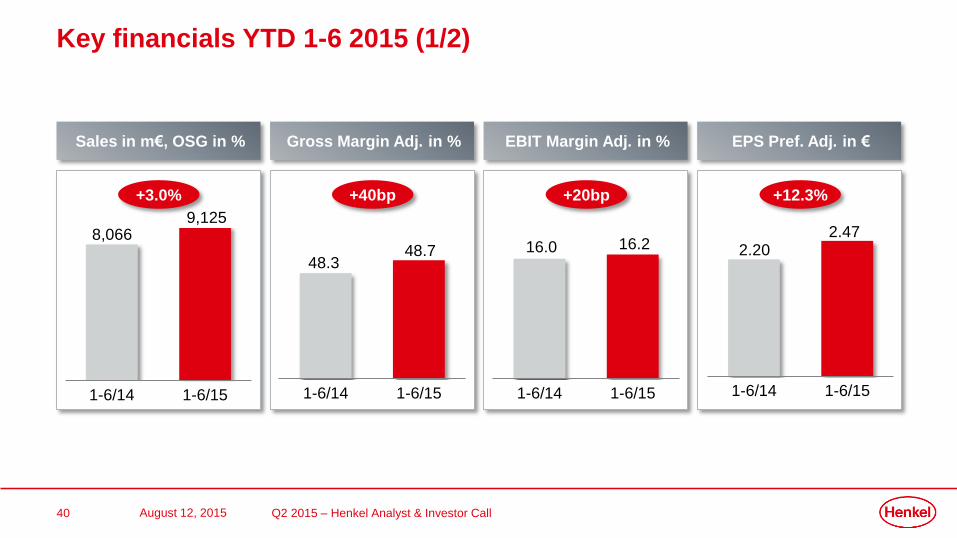
Key financials YTD 1-6 2015 (1/2)
Q2 2015 – Henkel Analyst & Investor Call
EPS Pref. Adj. in €EBIT Margin Adj. in %Gross Margin Adj. in %Sales in m€, OSG in %
+3.0%
1-6/14 1-6/15
8,0669,125
+40bp +20bp +12.3%
1-6/14 1-6/15
48.748.3
1-6/14 1-6/15
16.0 16.2
1-6/14 1-6/15
2.472.20
August 12, 2015
41
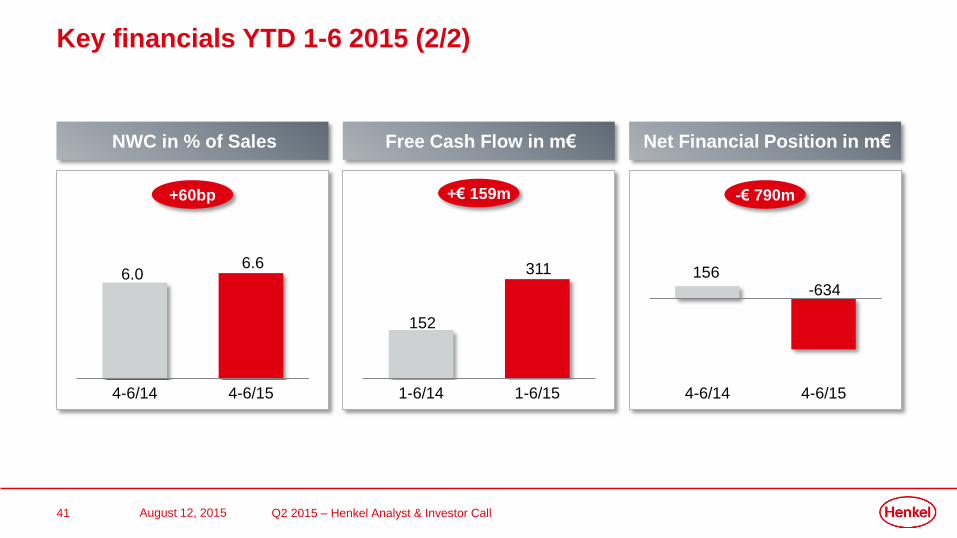
Key financials YTD 1-6 2015 (2/2)
Q2 2015 – Henkel Analyst & Investor Call
NWC in % of Sales Free Cash Flow in m€ Net Financial Position in m€
1-6/14 1-6/15
152
311
4-6/14 4-6/15
156-634
-€ 790m+60bp
4-6/14 4-6/15
6.66.0
August 12, 2015
+€ 159m
42
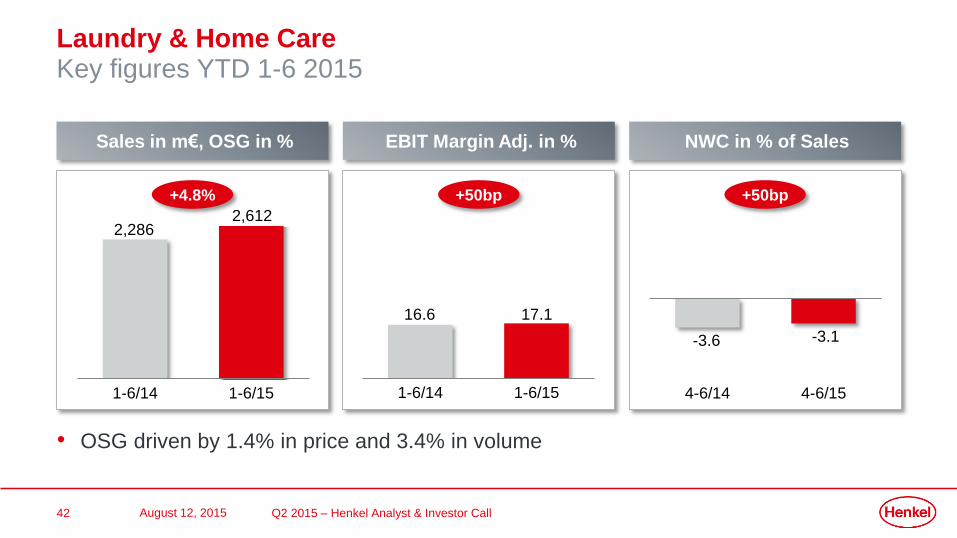
Laundry & Home CareKey figures YTD 1-6 2015
Q2 2015 – Henkel Analyst & Investor Call
Sales in m€, OSG in % EBIT Margin Adj. in % NWC in % of Sales
1-6/14 1-6/15
2,6122,286
4-6/14 4-6/15
-3.6 -3.1
1-6/14 1-6/15
17.116.6
• OSG driven by 1.4% in price and 3.4% in volume
+50bp +50bp+4.8%
August 12, 2015
43
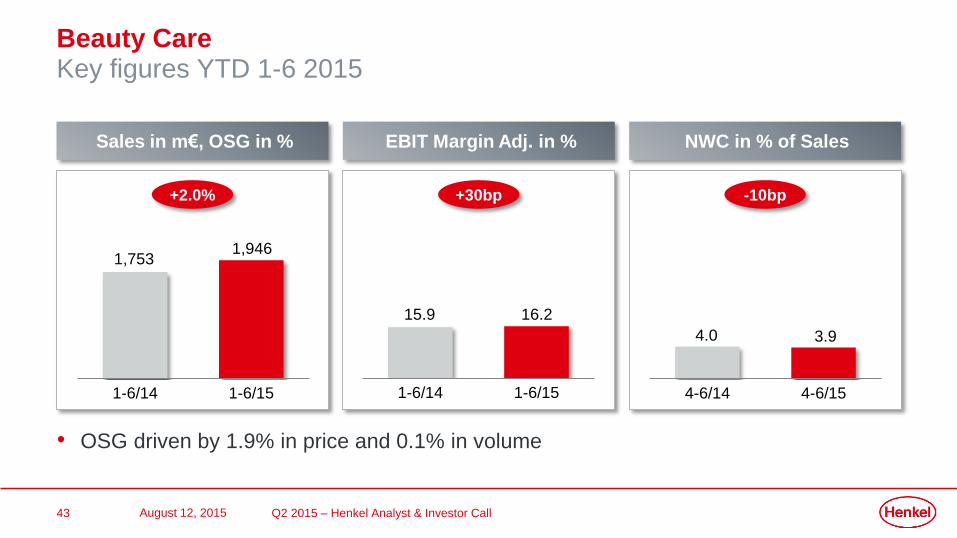
Beauty CareKey figures YTD 1-6 2015
Q2 2015 – Henkel Analyst & Investor Call
• OSG driven by 1.9% in price and 0.1% in volume
August 12, 2015
Sales in m€, OSG in % EBIT Margin Adj. in % NWC in % of Sales
1-6/14 1-6/15
1,9461,753
4-6/14 4-6/15
4.0 3.9
1-6/14 1-6/15
16.215.9
+30bp -10bp+2.0%
44
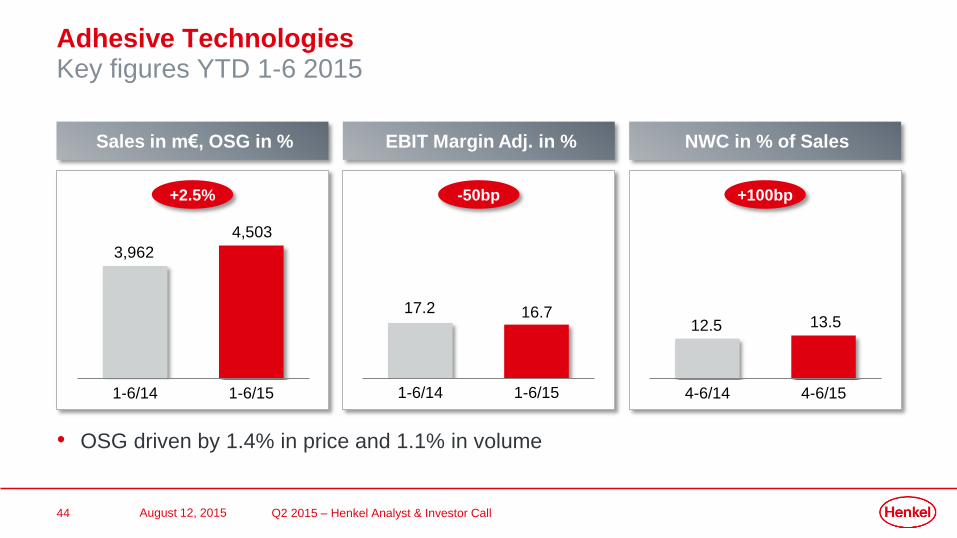
+2.5% -50bp +100bp
Adhesive TechnologiesKey figures YTD 1-6 2015
Q2 2015 – Henkel Analyst & Investor Call
• OSG driven by 1.4% in price and 1.1% in volume
Sales in m€, OSG in % EBIT Margin Adj. in % NWC in % of Sales
August 12, 2015
1-6/14 1-6/15
4,503
3,962
4-6/14 4-6/15
12.5 13.5
1-6/14 1-6/15
16.717.2
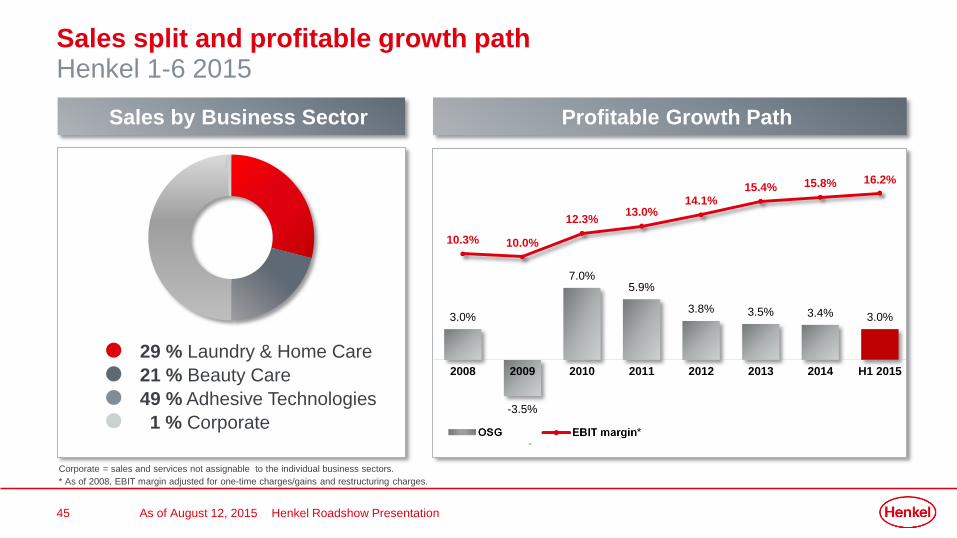
45
3.0%
-3.5%
7.0%5.9%
3.8% 3.5% 3.4% 3.0%
10.3% 10.0%
12.3%13.0%
14.1%15.4% 15.8% 16.2%
2008 2009 2010 2011 2012 2013 2014 H1 2015
Sales by Business Sector Profitable Growth Path
Sales split and profitable growth pathHenkel 1-6 2015
* As of 2008, EBIT margin adjusted for one-time charges/gains and restructuring charges.
Corporate = sales and services not assignable to the individual business sectors.
1 % Corporate
49 % Adhesive Technologies
21 % Beauty Care
29 % Laundry & Home Care
Henkel Roadshow PresentationAs of August 12, 2015
46
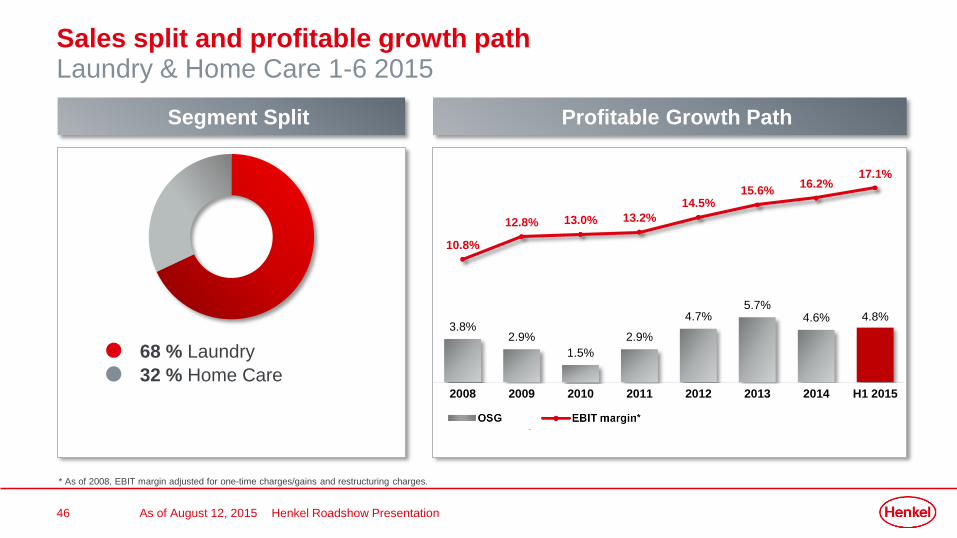
Profitable Growth PathSegment Split
Sales split and profitable growth pathLaundry & Home Care 1-6 2015
32 % Home Care
68 % Laundry
* As of 2008, EBIT margin adjusted for one-time charges/gains and restructuring charges.
3.8%2.9%
1.5%
2.9%
4.7%5.7%
4.6% 4.8%
10.8%
12.8% 13.0% 13.2%
14.5%15.6%
16.2%17.1%
2008 2009 2010 2011 2012 2013 2014 H1 2015
Henkel Roadshow PresentationAs of August 12, 2015
47
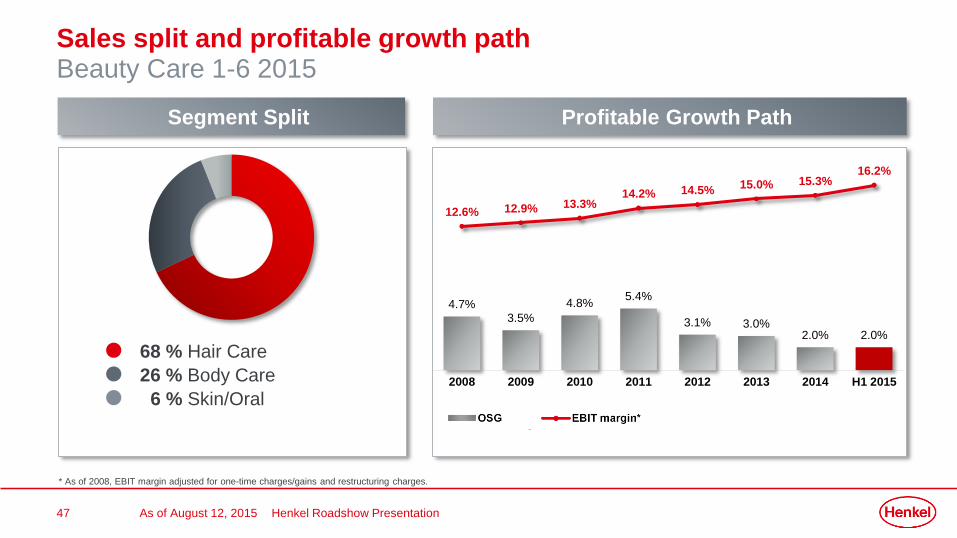
4.7%3.5%
4.8%5.4%
3.1% 3.0%2.0% 2.0%
12.6% 12.9% 13.3%14.2% 14.5%
15.0% 15.3%16.2%
2008 2009 2010 2011 2012 2013 2014 H1 2015
Segment Split
Sales split and profitable growth pathBeauty Care 1-6 2015
6 % Skin/Oral
26 % Body Care
68 % Hair Care
Profitable Growth Path
* As of 2008, EBIT margin adjusted for one-time charges/gains and restructuring charges.
Henkel Roadshow PresentationAs of August 12, 2015
48
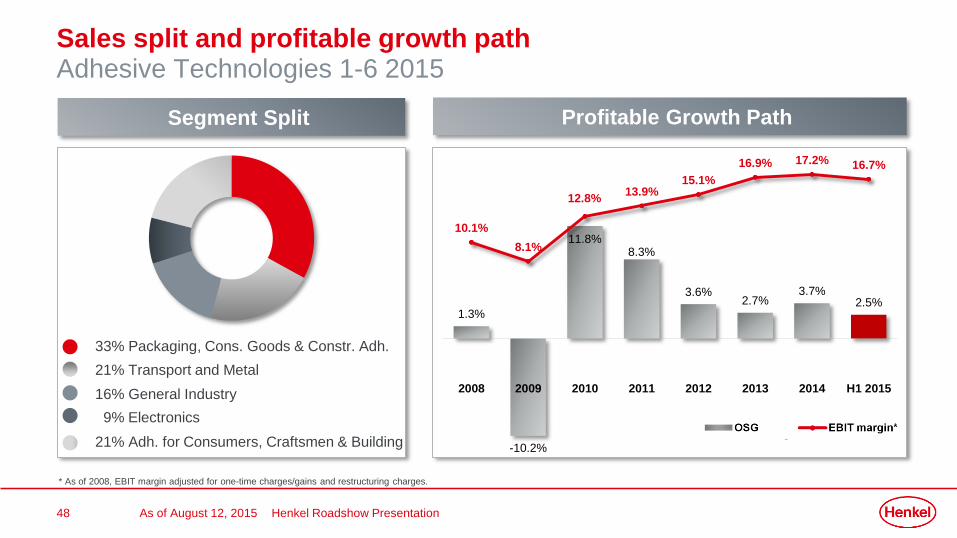
Profitable Growth Path
Sales split and profitable growth pathAdhesive Technologies 1-6 2015
* As of 2008, EBIT margin adjusted for one-time charges/gains and restructuring charges.
1.3%
-10.2%
11.8%8.3%
3.6%2.7%
3.7%2.5%
10.1%
8.1%
12.8%13.9%
15.1%
16.9% 17.2% 16.7%
2008 2009 2010 2011 2012 2013 2014 H1 2015
Segment Split
9% Electronics
21% Adh. for Consumers, Craftsmen & Building
21% Transport and Metal
33% Packaging, Cons. Goods & Constr. Adh.
16% General Industry
Henkel Roadshow PresentationAs of August 12, 2015