Embed Size (px)
Citation preview
Henkel
Roadshow
Q3 2014
November,
2014
2
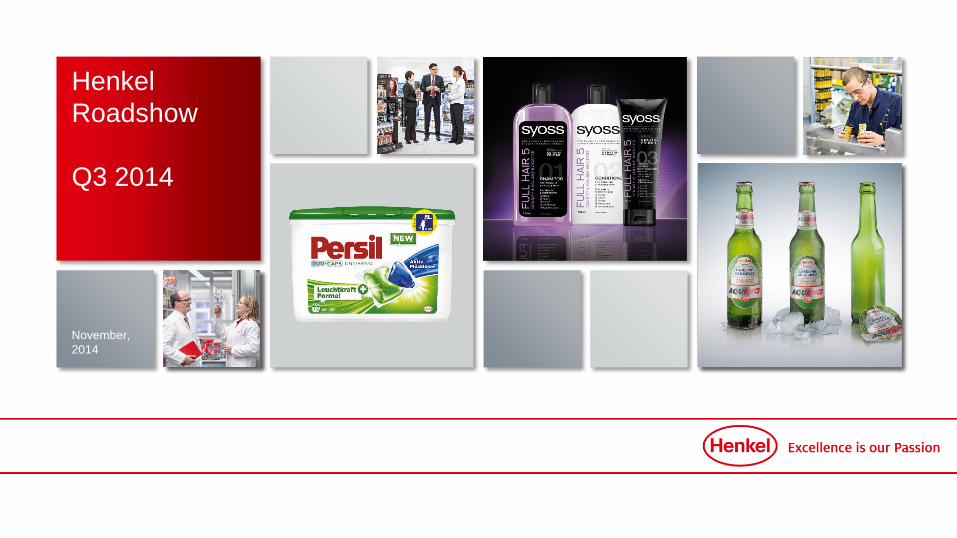
Disclaimer
This information contains forward-looking statements which are based on current
estimates and assumptions made by the corporate management of Henkel AG & Co.
KGaA. Statements with respect to the future are characterized by the use of words such
as “expect”, “intend”, “plan”, “anticipate”, “believe”, “estimate”, and similar terms. Such
statements are not to be understood as in any way guaranteeing that those expectations
will turn out to be accurate. Future performance and results actually achieved by Henkel
AG & Co. KGaA and its affiliated companies depend on a number of risks and
uncertainties and may therefore differ materially from the forward-looking statements.
Many of these factors are outside Henkel's control and cannot be accurately estimated in
advance, such as the future economic environment and the actions of competitors and
others involved in the marketplace. Henkel neither plans nor undertakes to update any
forward-looking statements.
Henkel Roadshow November 2014
3
Consumer Business
Laundry & Home Care Beauty Care Adhesive Technologies
Industrial Business
Henkel: Three areas of competenceA global leader in brands and technologies
Henkel Roadshow November 2014
4
Agenda
Executing on Strategy 2016 2
Financials Q3 2014 & Outlook FY 20141
Henkel Roadshow November 2014
5
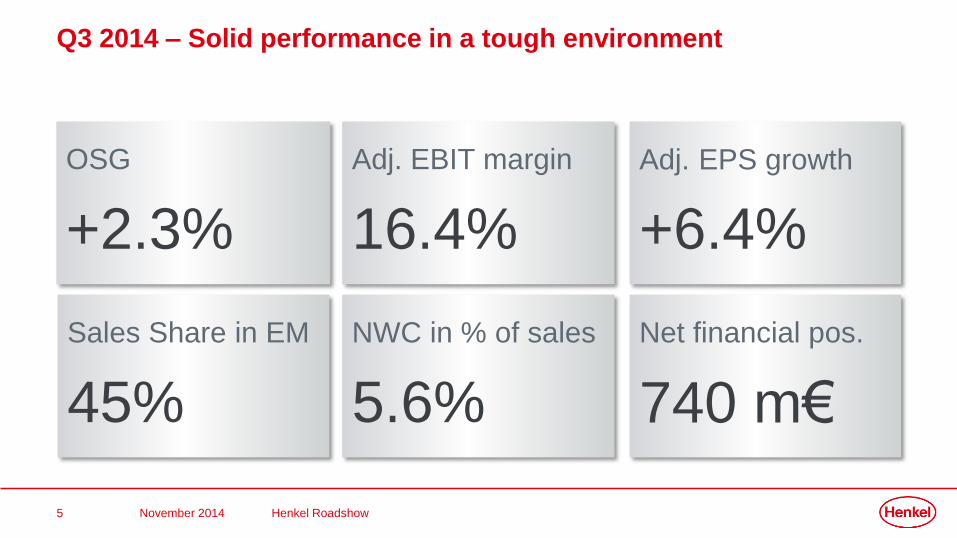
Q3 2014 – Solid performance in a tough environment
OSG
+2.3%
Adj. EPS growth
+6.4%
NWC in % of sales
5.6%
Net financial pos.
740 m€
Adj. EBIT margin
16.4%
Sales Share in EM
45%
Henkel Roadshow November 2014
6
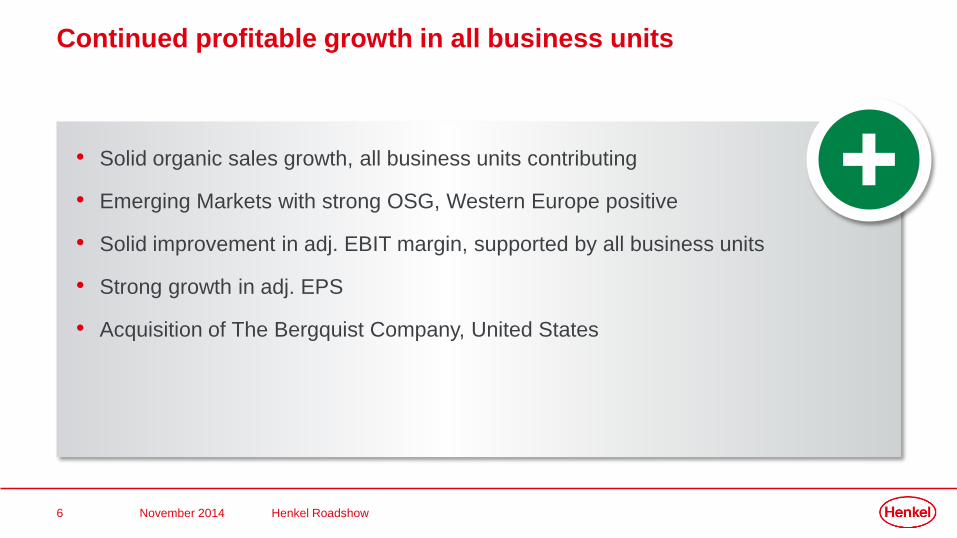
• Solid organic sales growth, all business units contributing
• Emerging Markets with strong OSG, Western Europe positive
• Solid improvement in adj. EBIT margin, supported by all business units
• Strong growth in adj. EPS
• Acquisition of The Bergquist Company, United States
Continued profitable growth in all business units
Henkel Roadshow November 2014
7
Persistently tough environment
• Continued headwind from FX, though at lower intensity
• European economies impacted by Russian/Ukrainian crisis
• Ongoing tensions in Middle East
• Intensified promotional & pricing pressure in HPC, sluggish consumer environment
in Mature Markets
• Negative organic sales growth in HPC North America, Adhesives slightly positive
Henkel Roadshow November 2014
8
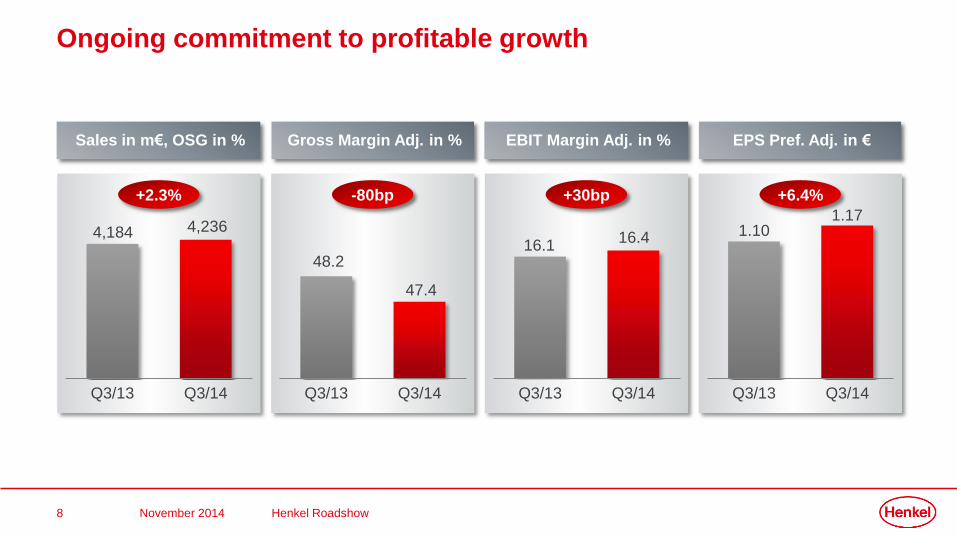
EPS Pref. Adj. in €EBIT Margin Adj. in %Gross Margin Adj. in %Sales in m€, OSG in %
Ongoing commitment to profitable growth
+2.3%
Q3/13 Q3/14
4,184 4,236
-80bp +30bp +6.4%
Q3/13 Q3/14
48.2
47.4
Q3/13 Q3/14
16.116.4
Q3/13 Q3/14
1.101.17
Henkel Roadshow November 2014
9
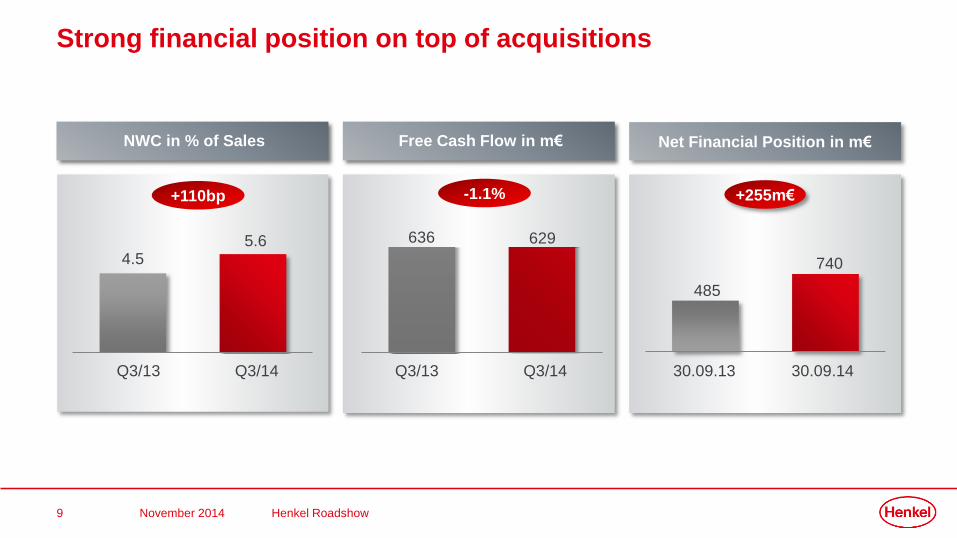
Strong financial position on top of acquisitions
Net Financial Position in m€
+255m€
NWC in % of Sales
+110bp
4.55.6
Q3/13 Q3/14
Free Cash Flow in m€
-1.1%
636 629
Q3/13 Q3/14 30.09.13 30.09.14
485
740
Henkel Roadshow November 2014
10
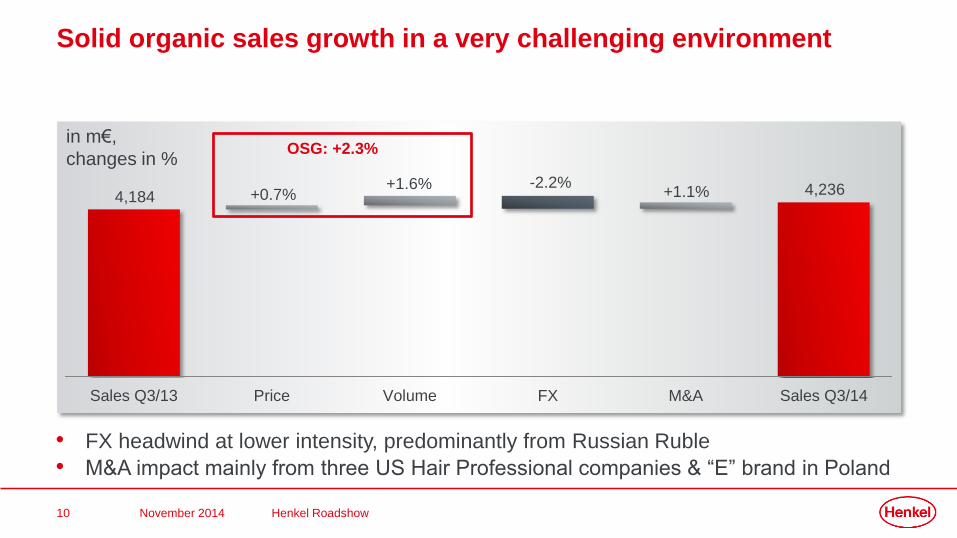
Solid organic sales growth in a very challenging environment
• FX headwind at lower intensity, predominantly from Russian Ruble
• M&A impact mainly from three US Hair Professional companies & “E” brand in Poland
in m€,
changes in %
Sales Q3/13 Price Volume FX M&A Sales Q3/14
+0.7%+1.6% -2.2%
+1.1%4,184 4,236
OSG: +2.3%
Henkel Roadshow November 2014
11
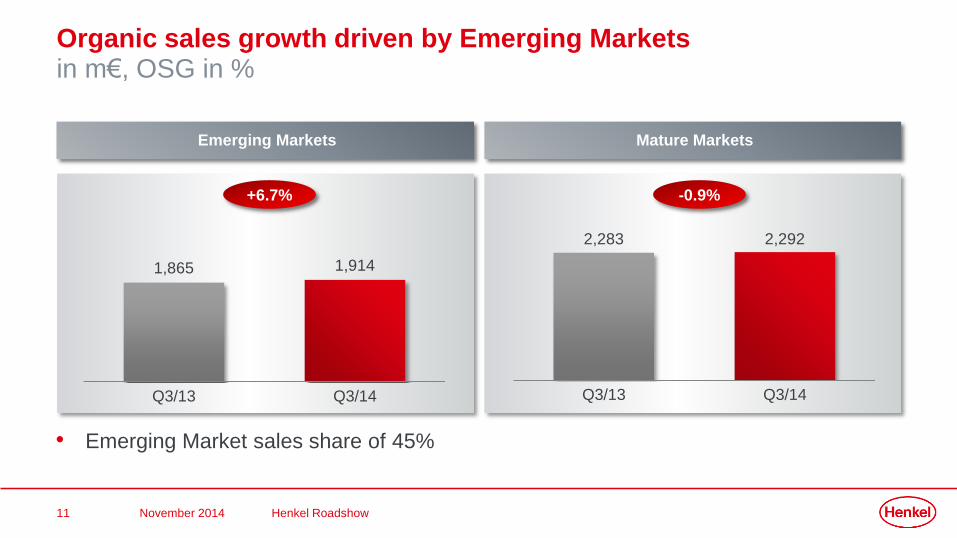
Organic sales growth driven by Emerging Marketsin m€, OSG in %
Emerging Markets Mature Markets
+6.7% -0.9%
1,865 1,914
Q3/13 Q3/14
2,283 2,292
Q3/13 Q3/14
• Emerging Market sales share of 45%
Henkel Roadshow November 2014
12
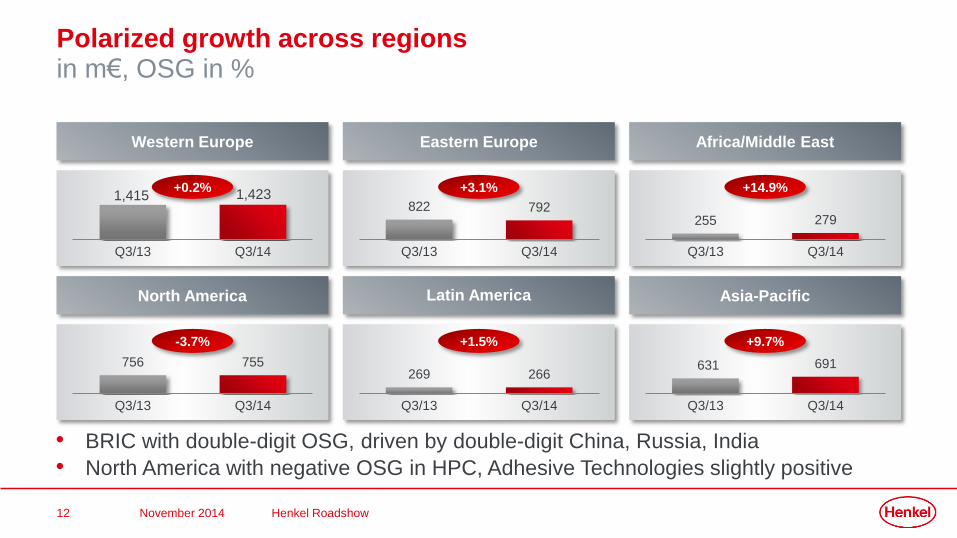
Polarized growth across regionsin m€, OSG in %
• BRIC with double-digit OSG, driven by double-digit China, Russia, India
• North America with negative OSG in HPC, Adhesive Technologies slightly positive
Western Europe
Q3/13 Q3/14
+0.2%
Eastern Europe
822 792
Q3/13 Q3/14
+3.1%
Africa/Middle East
255 279
Q3/13 Q3/14
+14.9%
North America
756 755
Q3/13 Q3/14
-3.7%
Latin America
269 266
Q3/13 Q3/14
+1.5%
Asia-Pacific
631 691
Q3/13 Q3/14
+9.7%
1,415 1,423
Henkel Roadshow November 2014
13
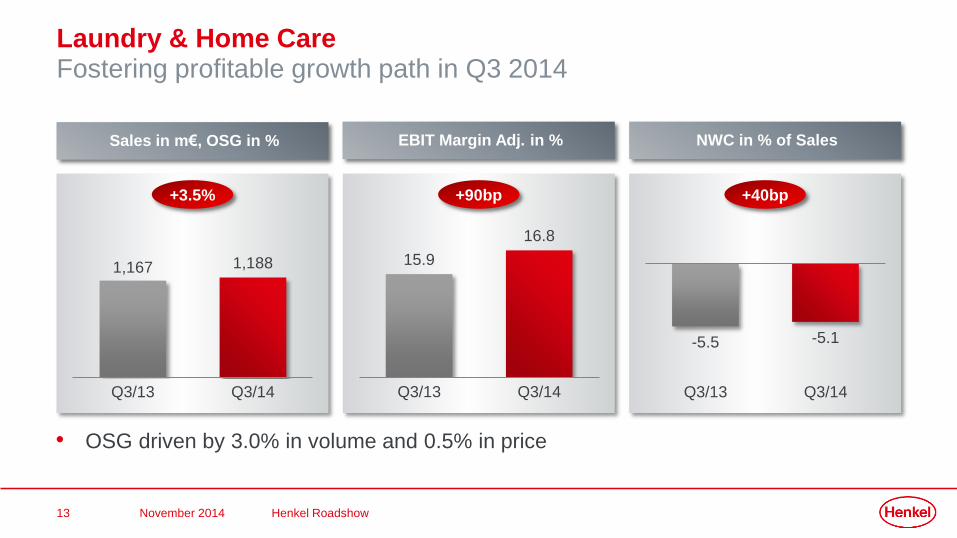
Laundry & Home CareFostering profitable growth path in Q3 2014
Sales in m€, OSG in % EBIT Margin Adj. in % NWC in % of Sales
+3.5% +90bp +40bp
1,167 1,188
Q3/13 Q3/14
15.9
16.8
Q3/13 Q3/14
• OSG driven by 3.0% in volume and 0.5% in price
-5.5 -5.1
Q3/13 Q3/14
Henkel Roadshow November 2014
14
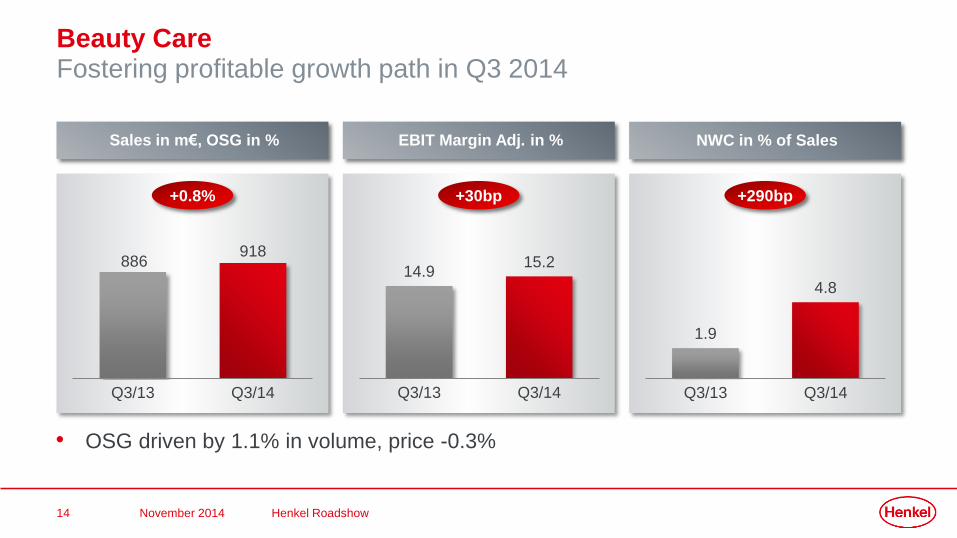
Beauty CareFostering profitable growth path in Q3 2014
Sales in m€, OSG in % EBIT Margin Adj. in % NWC in % of Sales
+0.8% +30bp +290bp
886918
Q3/13 Q3/14
14.915.2
Q3/13 Q3/14
1.9
4.8
Q3/13 Q3/14
• OSG driven by 1.1% in volume, price -0.3%
Henkel Roadshow November 2014
15
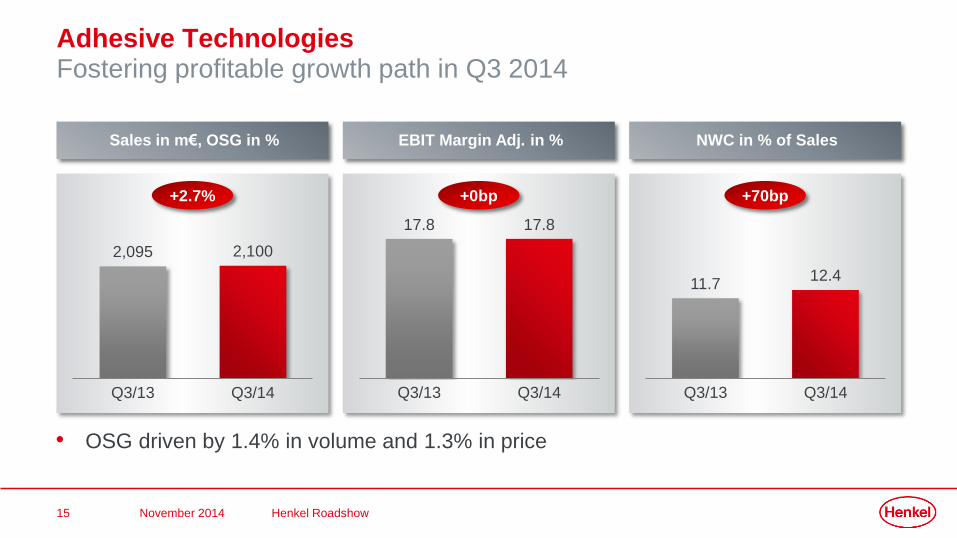
Adhesive TechnologiesFostering profitable growth path in Q3 2014
Sales in m€, OSG in % EBIT Margin Adj. in % NWC in % of Sales
+2.7% +0bp +70bp
2,095 2,100
Q3/13 Q3/14
17.8 17.8
Q3/13 Q3/14
11.712.4
Q3/13 Q3/14
• OSG driven by 1.4% in volume and 1.3% in price
Henkel Roadshow November 2014
16
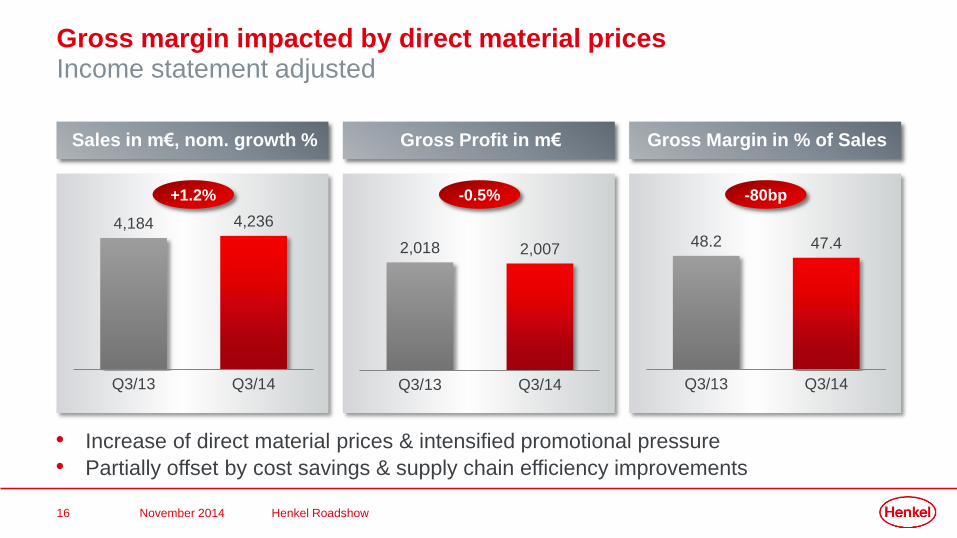
Gross margin impacted by direct material prices Income statement adjusted
Sales in m€, nom. growth % Gross Profit in m€ Gross Margin in % of Sales
+1.2% -0.5% -80bp
4,184 4,236
Q3/13 Q3/14
2,018 2,007
Q3/13 Q3/14
48.2 47.4
Q3/13 Q3/14
• Increase of direct material prices & intensified promotional pressure
• Partially offset by cost savings & supply chain efficiency improvements
Henkel Roadshow November 2014
17
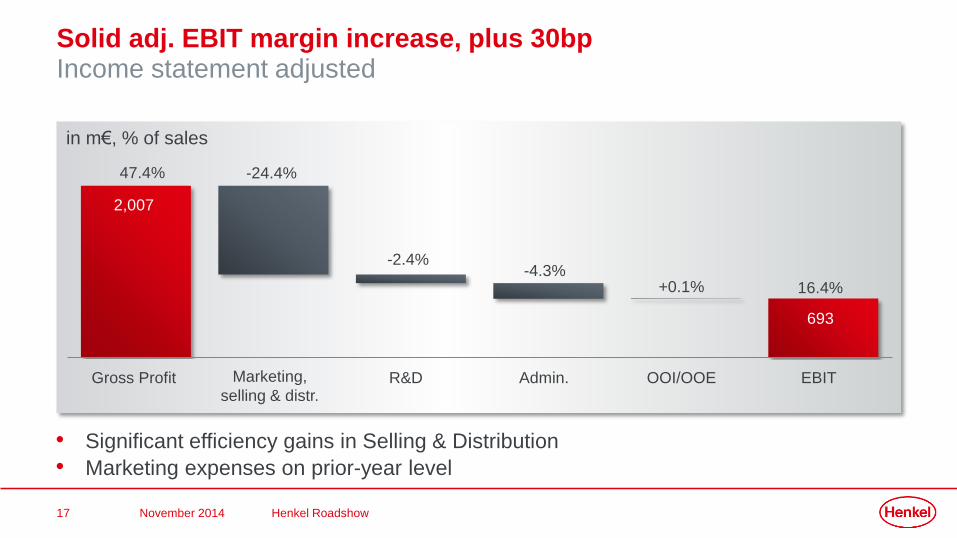
Solid adj. EBIT margin increase, plus 30bpIncome statement adjusted
• Significant efficiency gains in Selling & Distribution
• Marketing expenses on prior-year level
in m€, % of sales
Gross Profit Marketing,
selling & distr. R&D Admin. OOI/OOE EBIT
47.4% -24.4%
-2.4%-4.3%
+0.1% 16.4%
2,007
693
Henkel Roadshow November 2014
18
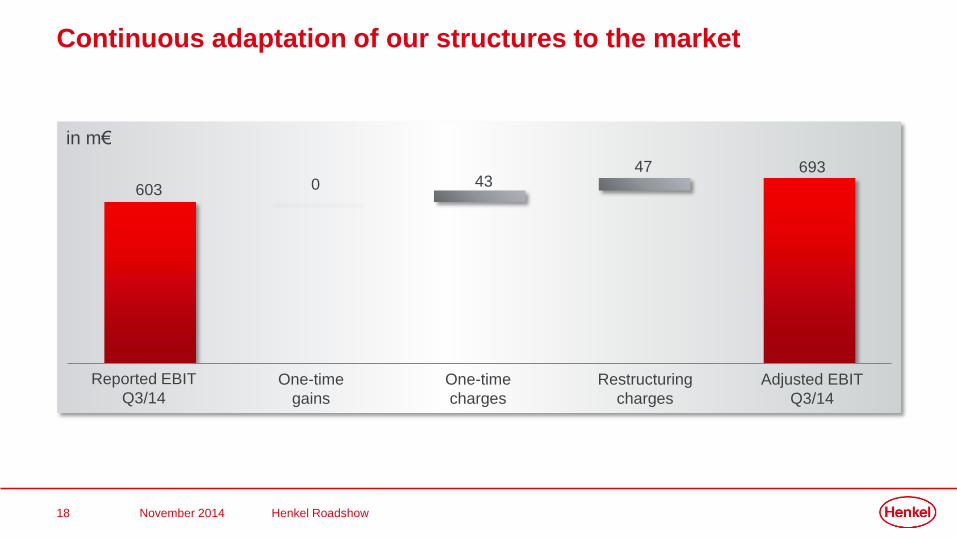
Continuous adaptation of our structures to the market
in m€
603
6930 43
47
Reported EBIT
Q3/14One-time
gains
One-time
charges
Restructuring
charges
Adjusted EBIT
Q3/14
Henkel Roadshow November 2014
19
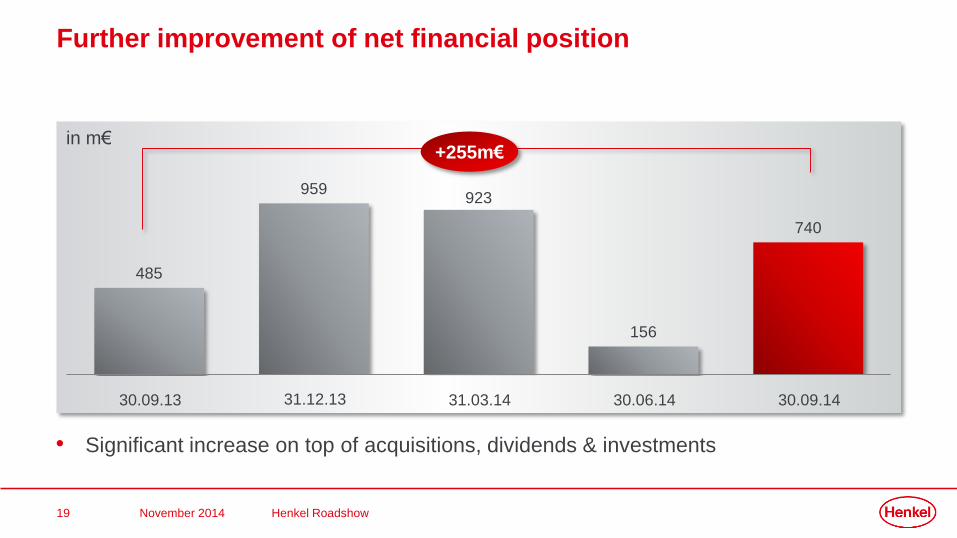
Further improvement of net financial position
• Significant increase on top of acquisitions, dividends & investments
in m€
485
959923
156
740
+255m€
30.09.13 30.09.1431.12.13 31.03.14 30.06.14
Henkel Roadshow November 2014
20
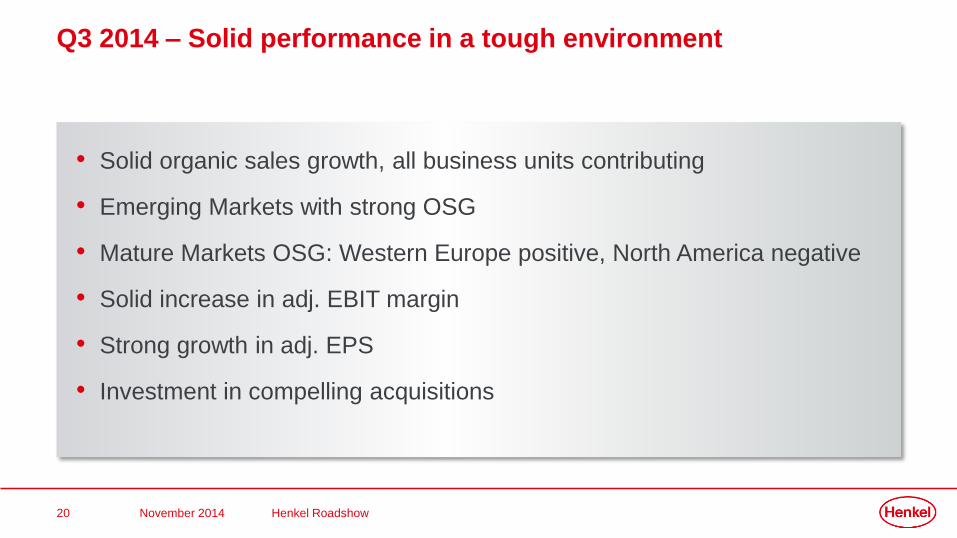
Q3 2014 – Solid performance in a tough environment
• Solid organic sales growth, all business units contributing
• Emerging Markets with strong OSG
• Mature Markets OSG: Western Europe positive, North America negative
• Solid increase in adj. EBIT margin
• Strong growth in adj. EPS
• Investment in compelling acquisitions
Henkel Roadshow November 2014
21
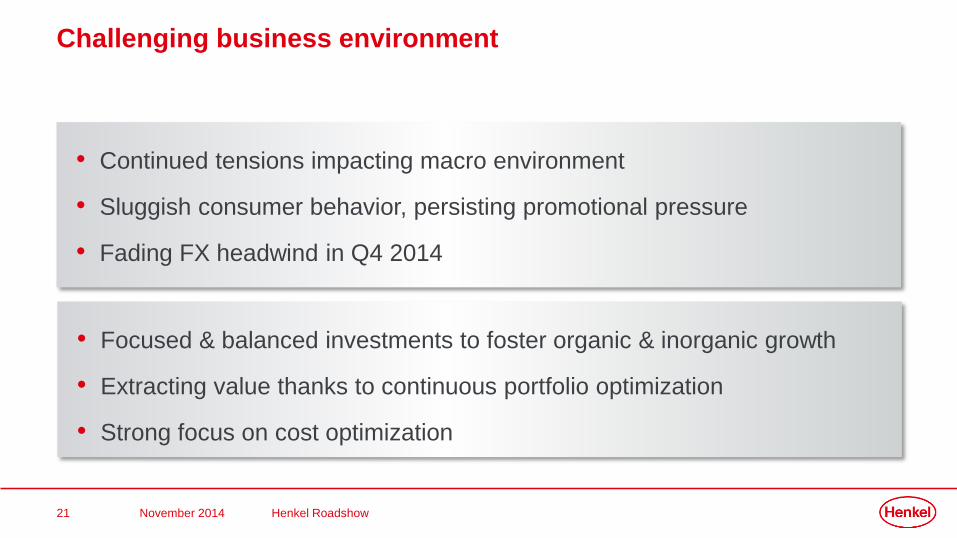
• Continued tensions impacting macro environment
• Sluggish consumer behavior, persisting promotional pressure
• Fading FX headwind in Q4 2014
Challenging business environment
• Focused & balanced investments to foster organic & inorganic growth
• Extracting value thanks to continuous portfolio optimization
• Strong focus on cost optimization
Henkel Roadshow November 2014
22
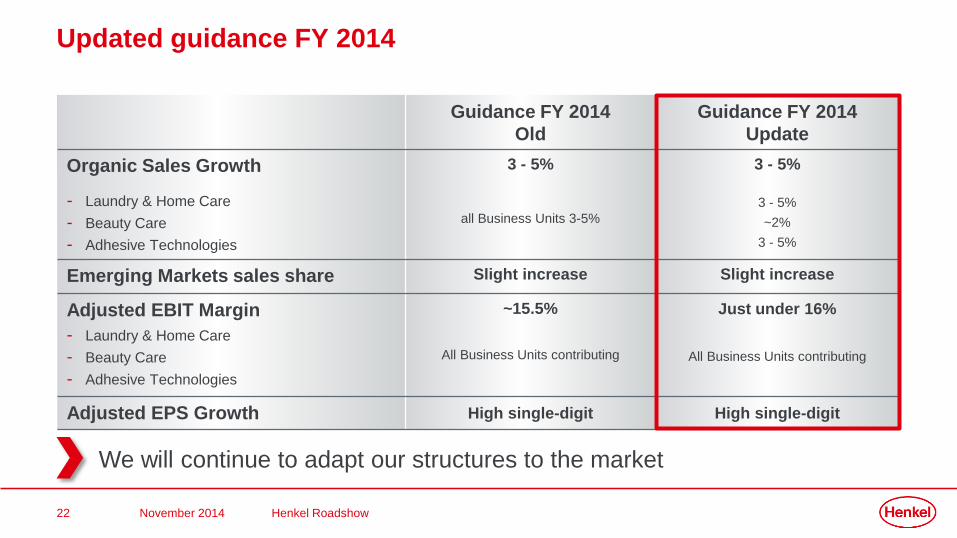
Guidance FY 2014
Old
Guidance FY 2014
Update
Organic Sales Growth
- Laundry & Home Care
- Beauty Care
- Adhesive Technologies
3 - 5%
all Business Units 3-5%
3 - 5%
3 - 5%
~2%
3 - 5%
Emerging Markets sales share Slight increase Slight increase
Adjusted EBIT Margin
- Laundry & Home Care
- Beauty Care
- Adhesive Technologies
~15.5%
All Business Units contributing
Just under 16%
All Business Units contributing
Adjusted EPS Growth High single-digit High single-digit
Updated guidance FY 2014
We will continue to adapt our structures to the market
Henkel Roadshow November 2014
23
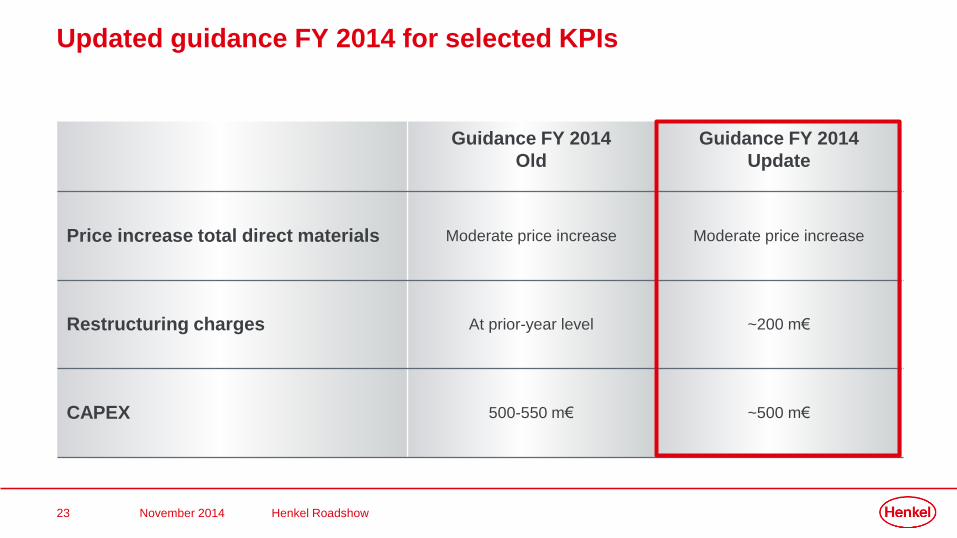
Updated guidance FY 2014 for selected KPIs
Guidance FY 2014
Old
Guidance FY 2014
Update
Price increase total direct materials Moderate price increase Moderate price increase
Restructuring charges At prior-year level ~200 m€
CAPEX 500-550 m€ ~500 m€
Henkel Roadshow November 2014
24
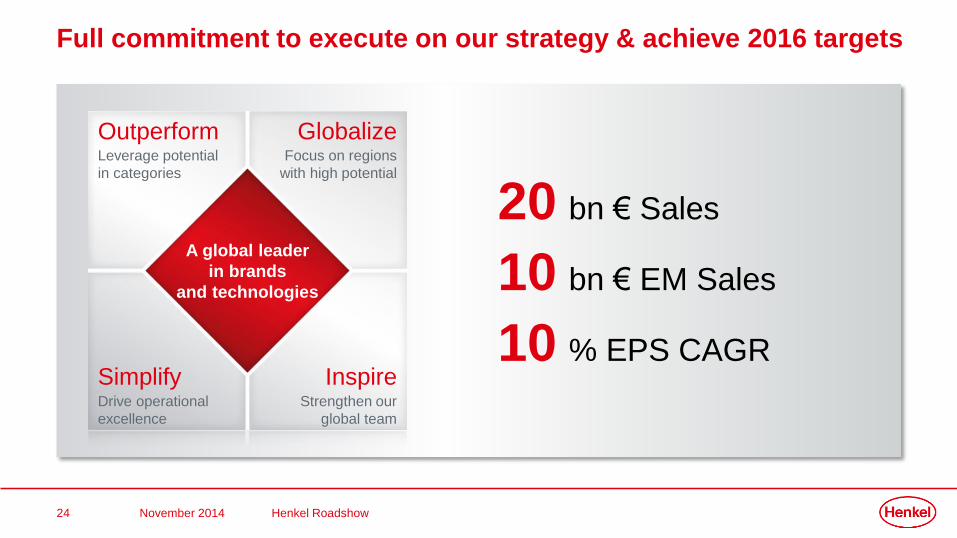
Full commitment to execute on our strategy & achieve 2016 targets
Outperform Globalize
Simplify Inspire
A global leader
in brands
and technologies
Leverage potential
in categories
Focus on regions
with high potential
Drive operational
excellence
Strengthen our
global team
20 bn € Sales
10 bn € EM Sales
10 % EPS CAGR
Henkel Roadshow November 2014
25
Agenda
Executing on Strategy 2016 2
Financials Q2 2014 & Outlook FY 20141
Henkel Roadshow November 2014
26
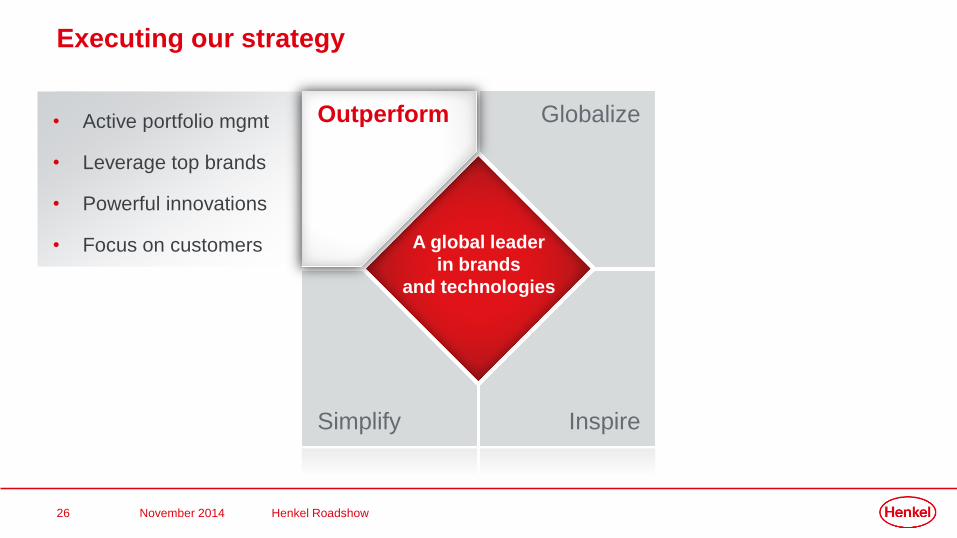
• Active portfolio mgmt
• Leverage top brands
• Powerful innovations
• Focus on customers
Globalize
Simplify Inspire
OutperformOutperform
Executing our strategy
A global leader
in brands
and technologies
Henkel Roadshow November 2014
27
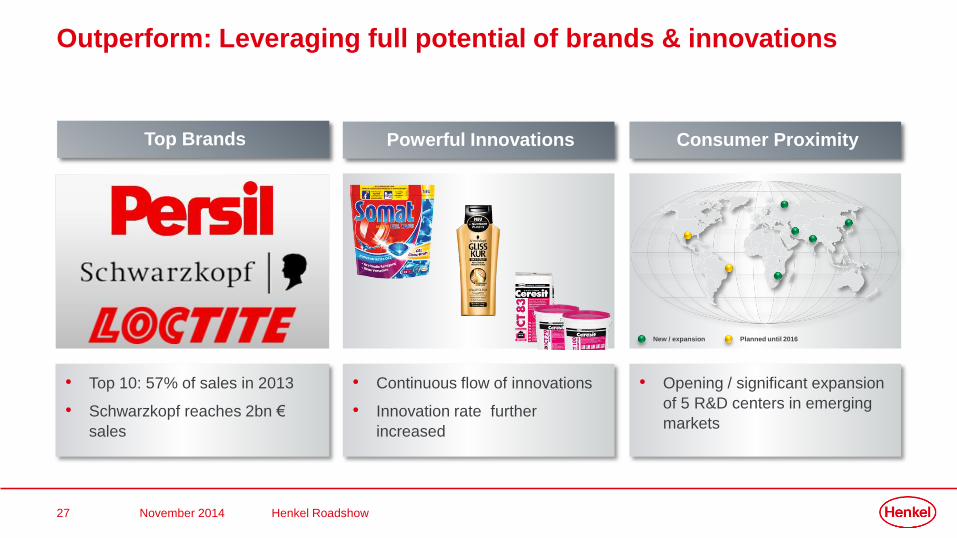
Outperform: Leveraging full potential of brands & innovations
• Opening / significant expansion
of 5 R&D centers in emerging
markets
• Top 10: 57% of sales in 2013
• Schwarzkopf reaches 2bn €
sales
Top Brands Powerful Innovations Consumer Proximity
• Continuous flow of innovations
• Innovation rate further
increased
New / expansion Planned until 2016
Henkel Roadshow November 2014
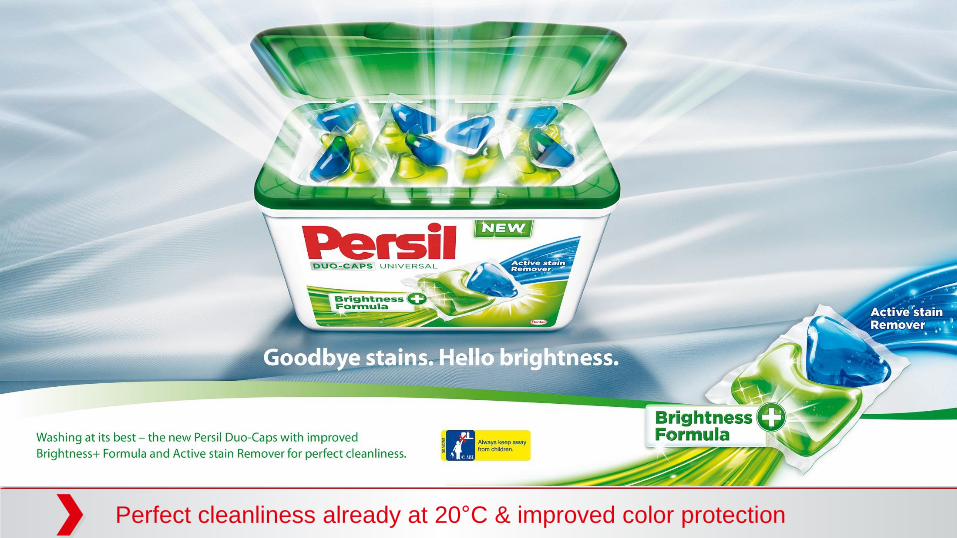
28 Q3 2014 – Henkel Analyst & Investor CallPerfect cleanliness already at 20°C & improved color protection

29 Q3 2014 – Henkel Analyst & Investor CallBoosts density, volume & strength & stimulates roots
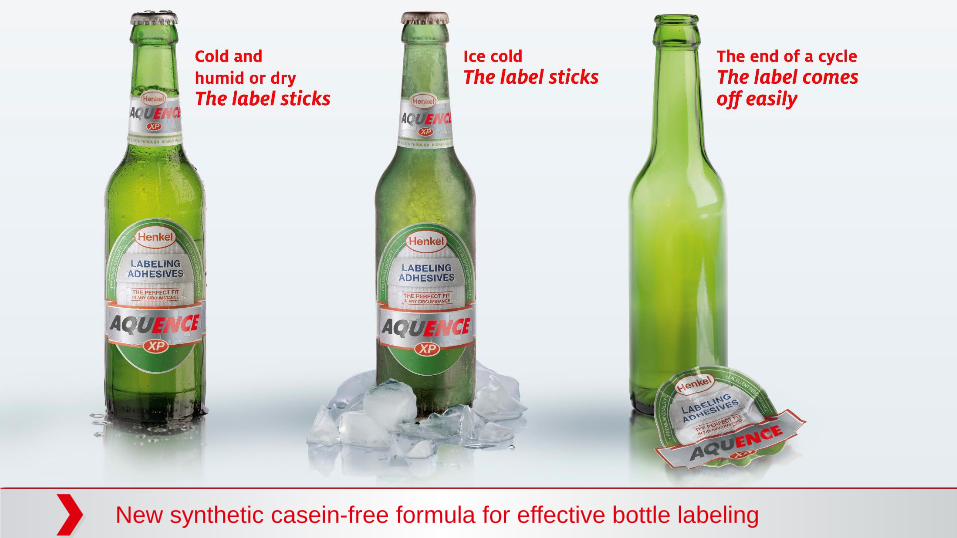
30 Q3 2014 – Henkel Analyst & Investor CallNew synthetic casein-free formula for effective bottle labeling
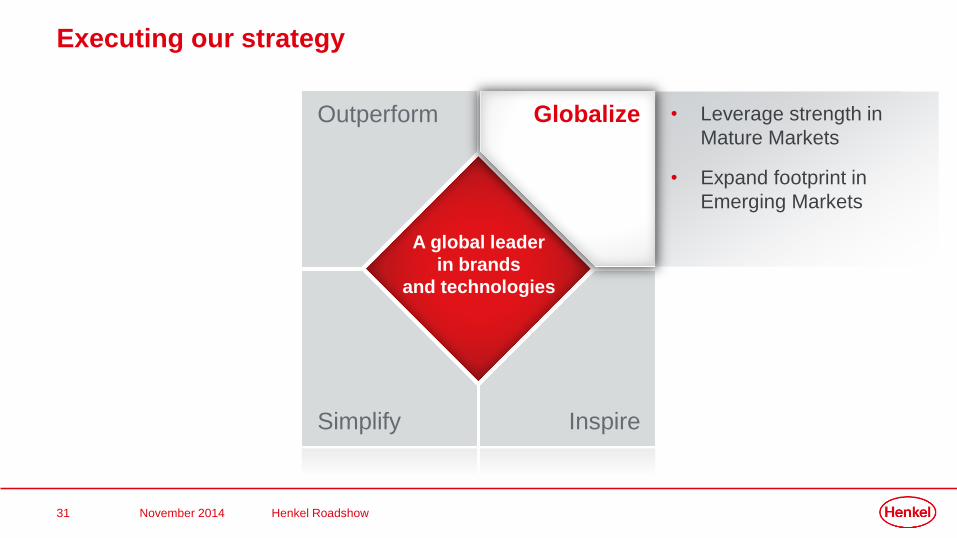
31
• Leverage strength in
Mature Markets
• Expand footprint in
Emerging Markets
Globalize
Simplify Inspire
Outperform
A global leader
in brands
and technologies
Executing our strategy
Globalize
Henkel Roadshow November 2014
32
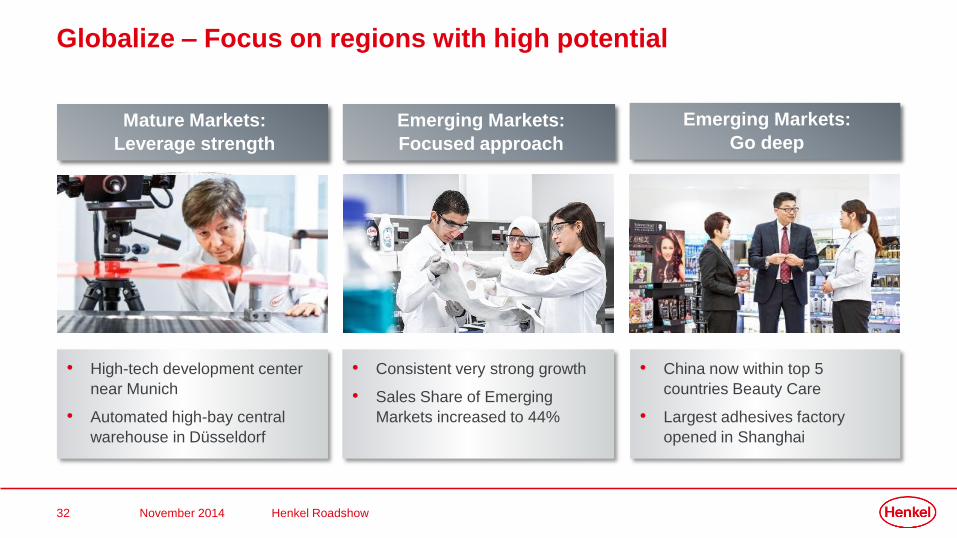
Globalize – Focus on regions with high potential
• High-tech development center
near Munich
• Automated high-bay central
warehouse in Düsseldorf
• Consistent very strong growth
• Sales Share of Emerging
Markets increased to 44%
Mature Markets:
Leverage strength
Emerging Markets:
Focused approach
• China now within top 5
countries Beauty Care
• Largest adhesives factory
opened in Shanghai
Emerging Markets:
Go deep
Henkel Roadshow November 2014
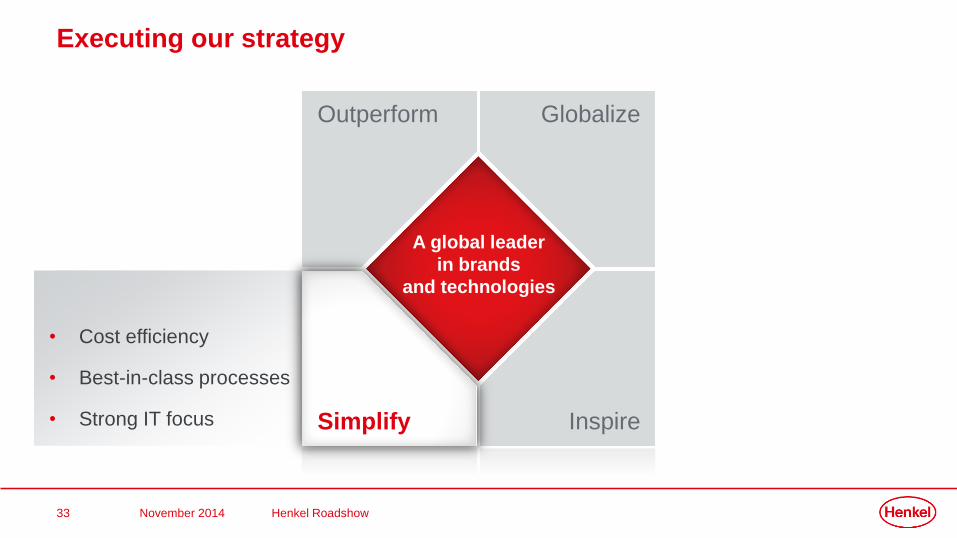
33
• Cost efficiency
• Best-in-class processes
• Strong IT focus
Globalize
Simplify Inspire
Outperform
A global leader
in brands
and technologies
Executing our strategy
Simplify
Henkel Roadshow November 2014
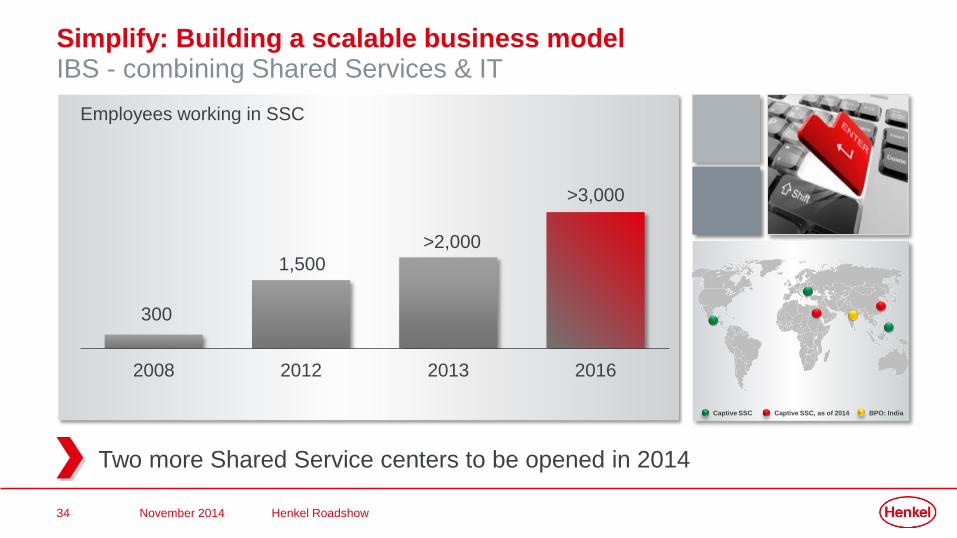
34
Simplify: Building a scalable business modelIBS - combining Shared Services & IT
2008 2012 2013 2016
1,500
>3,000
>2,000
Two more Shared Service centers to be opened in 2014
Employees working in SSC
300
Captive SSC Captive SSC, as of 2014 BPO: India
Henkel Roadshow November 2014
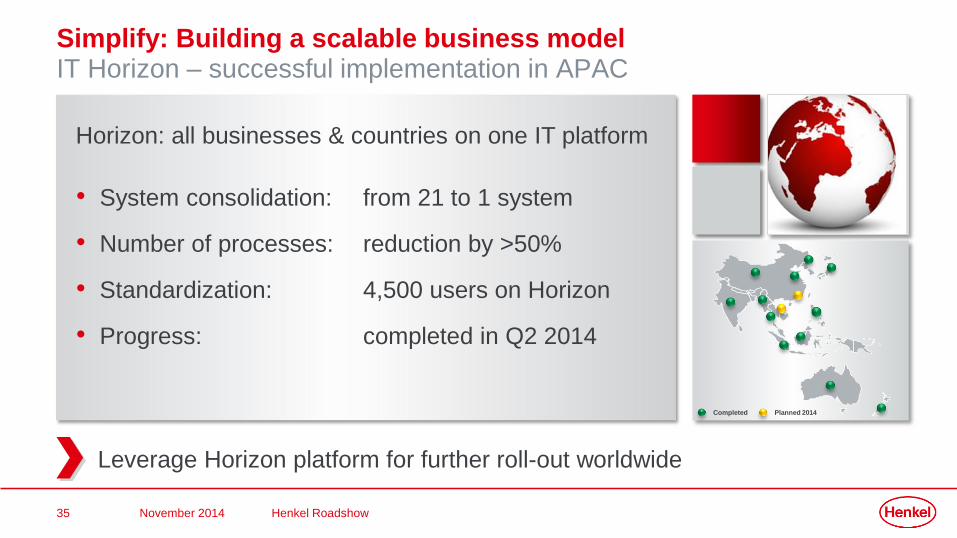
35
Horizon: all businesses & countries on one IT platform
• System consolidation: from 21 to 1 system
• Number of processes: reduction by >50%
• Standardization: 4,500 users on Horizon
• Progress: completed in Q2 2014
Simplify: Building a scalable business modelIT Horizon – successful implementation in APAC
Leverage Horizon platform for further roll-out worldwide
Completed Planned 2014
Henkel Roadshow November 2014
36
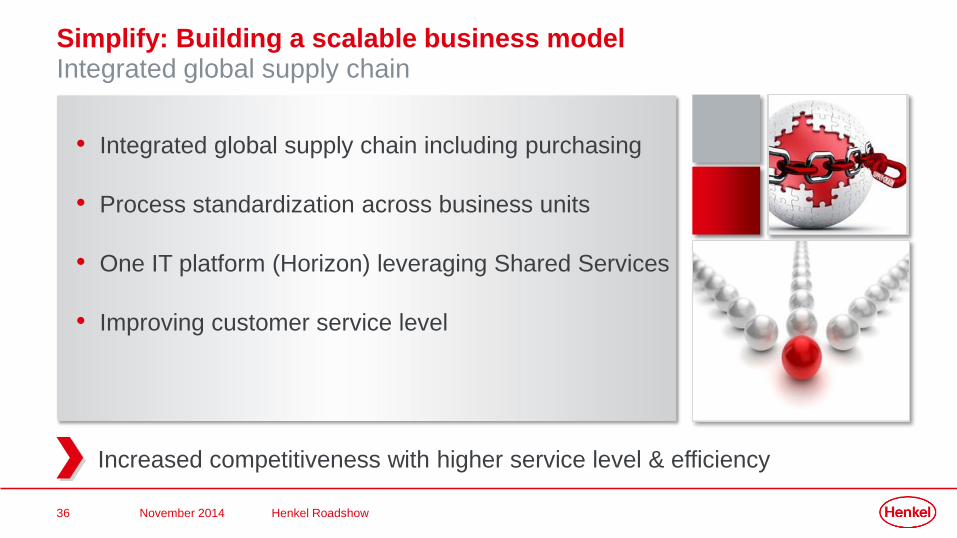
• Integrated global supply chain including purchasing
• Process standardization across business units
• One IT platform (Horizon) leveraging Shared Services
• Improving customer service level
Simplify: Building a scalable business modelIntegrated global supply chain
Increased competitiveness with higher service level & efficiency
Henkel Roadshow November 2014
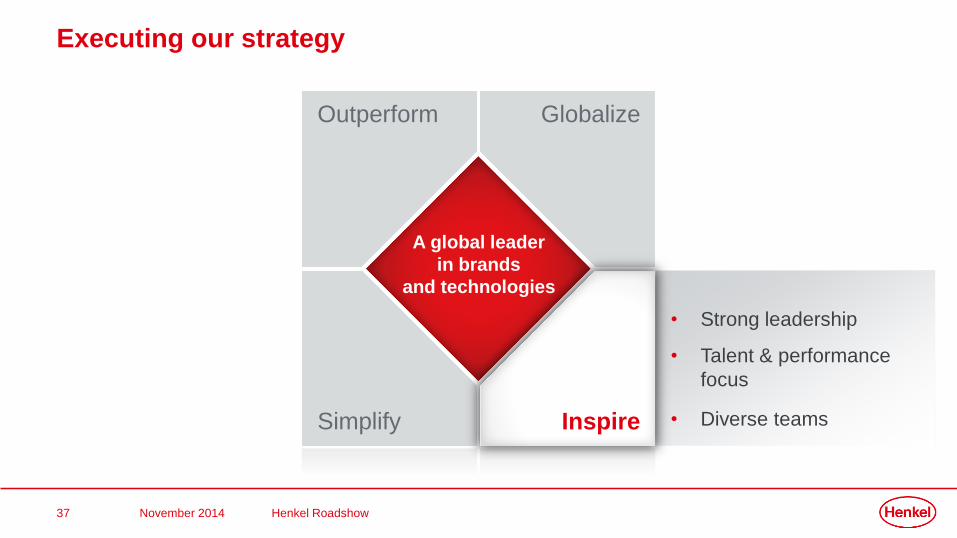
37
• Strong leadership
• Talent & performance
focus
• Diverse teams
Globalize
Simplify Inspire
Outperform
A global leader
in brands
and technologies
Executing our strategy
Inspire
Henkel Roadshow November 2014
38
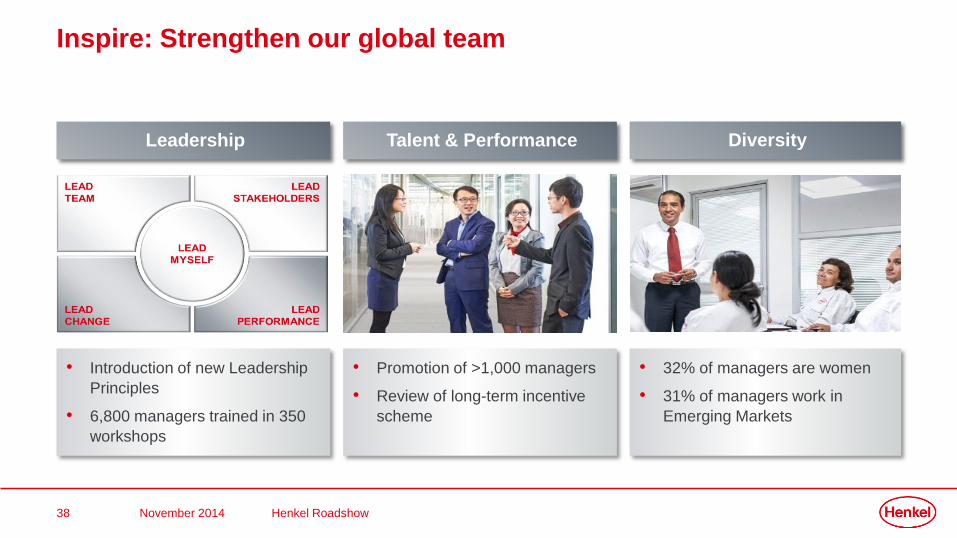
Inspire: Strengthen our global team
DiversityTalent & Performance
• Promotion of >1,000 managers
• Review of long-term incentive
scheme
• Introduction of new Leadership
Principles
• 6,800 managers trained in 350
workshops
• 32% of managers are women
• 31% of managers work in
Emerging Markets
Leadership
Henkel Roadshow November 2014
39
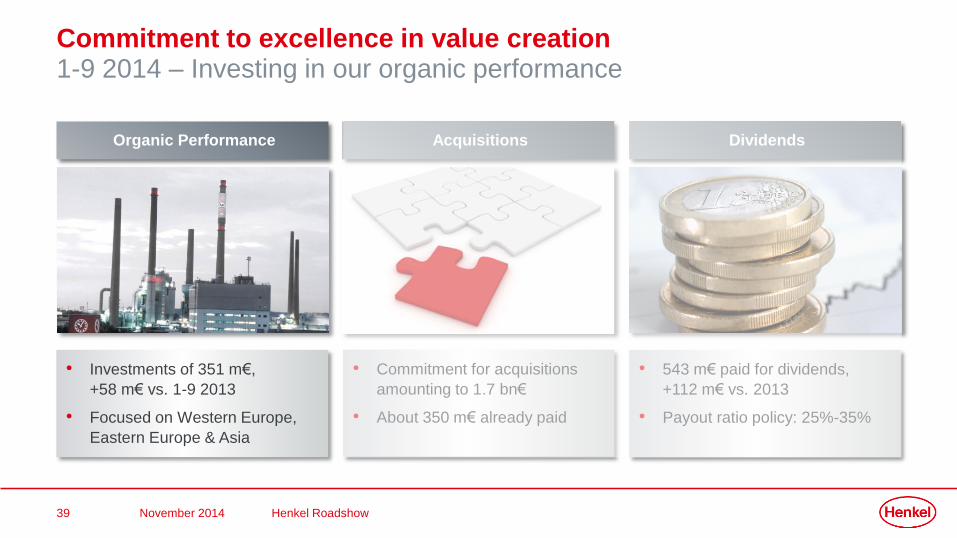
• Commitment for acquisitions
amounting to 1.7 bn€
• About 350 m€ already paid
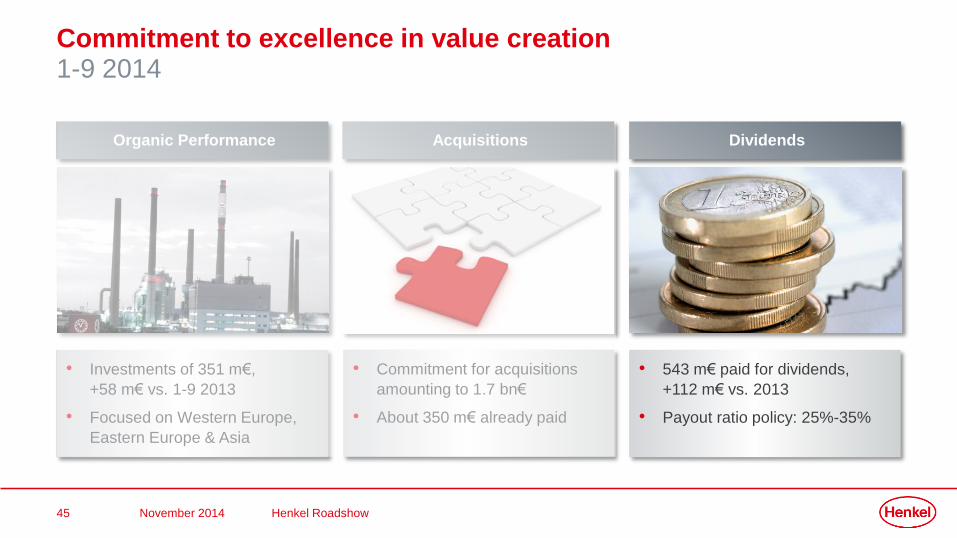
Commitment to excellence in value creation1-9 2014 – Investing in our organic performance
• 543 m€ paid for dividends,
+112 m€ vs. 2013
• Payout ratio policy: 25%-35%
Organic Performance Dividends
• Investments of 351 m€,
+58 m€ vs. 1-9 2013
• Focused on Western Europe,
Eastern Europe & Asia
Acquisitions
Henkel Roadshow November 2014
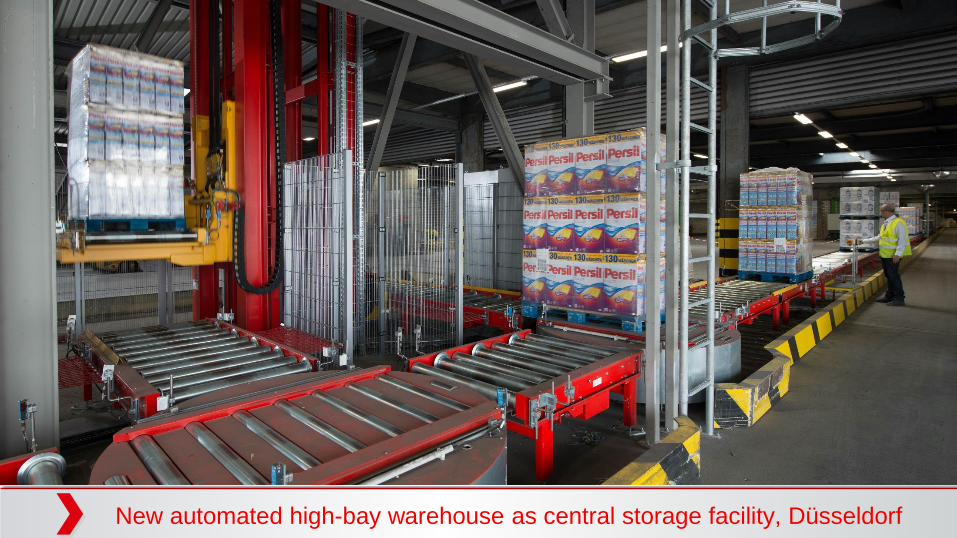
40 New automated high-bay warehouse as central storage facility, Düsseldorf
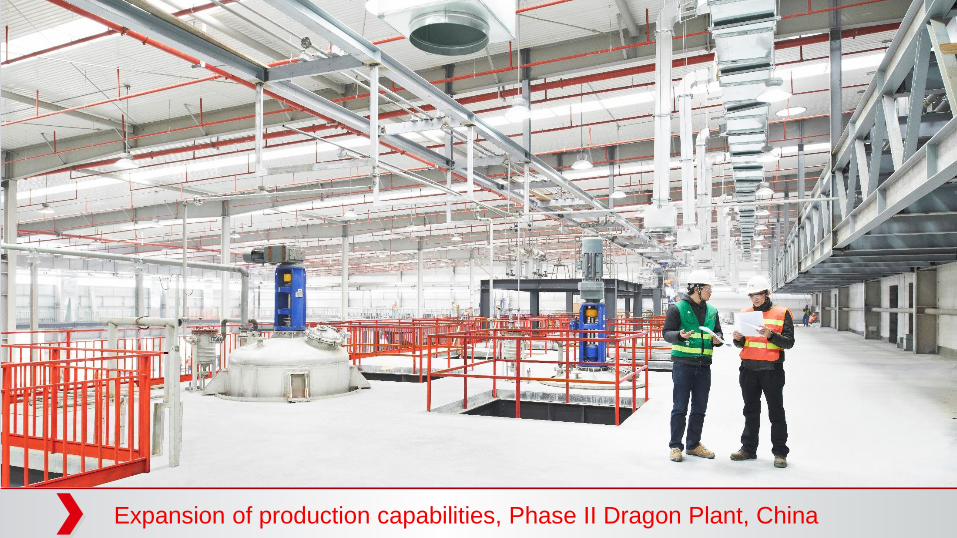
41 Expansion of production capabilities, Phase II Dragon Plant, China
42
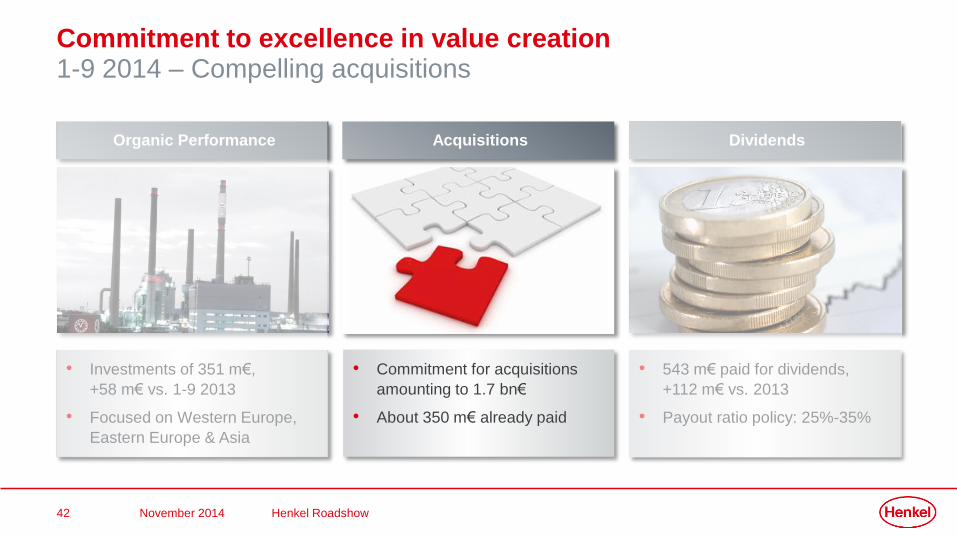
• Commitment for acquisitions
amounting to 1.7 bn€
• About 350 m€ already paid
• 543 m€ paid for dividends,
+112 m€ vs. 2013
• Payout ratio policy: 25%-35%
Organic Performance Dividends
• Investments of 351 m€,
+58 m€ vs. 1-9 2013
• Focused on Western Europe,
Eastern Europe & Asia
Acquisitions
Henkel Roadshow November 2014
Commitment to excellence in value creation1-9 2014 – Compelling acquisitions
43
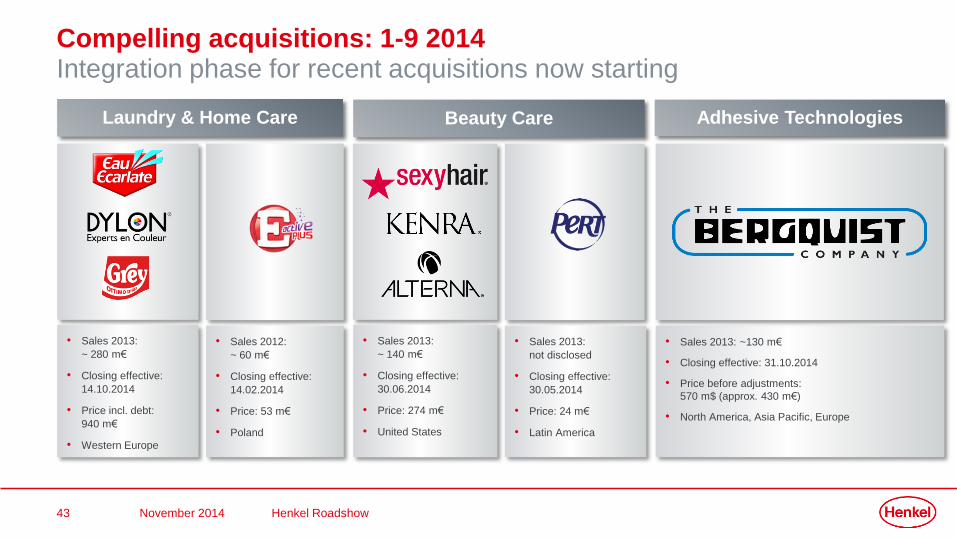
Compelling acquisitions: 1-9 2014Integration phase for recent acquisitions now starting
Henkel Roadshow November 2014
Beauty Care
• Sales 2013:
~ 140 m€
• Closing effective:
30.06.2014
• Price: 274 m€
• United States
• Sales 2013:
not disclosed
• Closing effective:
30.05.2014
• Price: 24 m€
• Latin America
• Sales 2013:
~ 280 m€
• Closing effective:
14.10.2014
• Price incl. debt:
940 m€
• Western Europe
Laundry & Home Care
• Sales 2013: ~130 m€
• Closing effective: 31.10.2014
• Price before adjustments:
570 m$ (approx. 430 m€)
• North America, Asia Pacific, Europe
Adhesive Technologies
• Sales 2012:
~ 60 m€
• Closing effective:
14.02.2014
• Price: 53 m€
• Poland
44
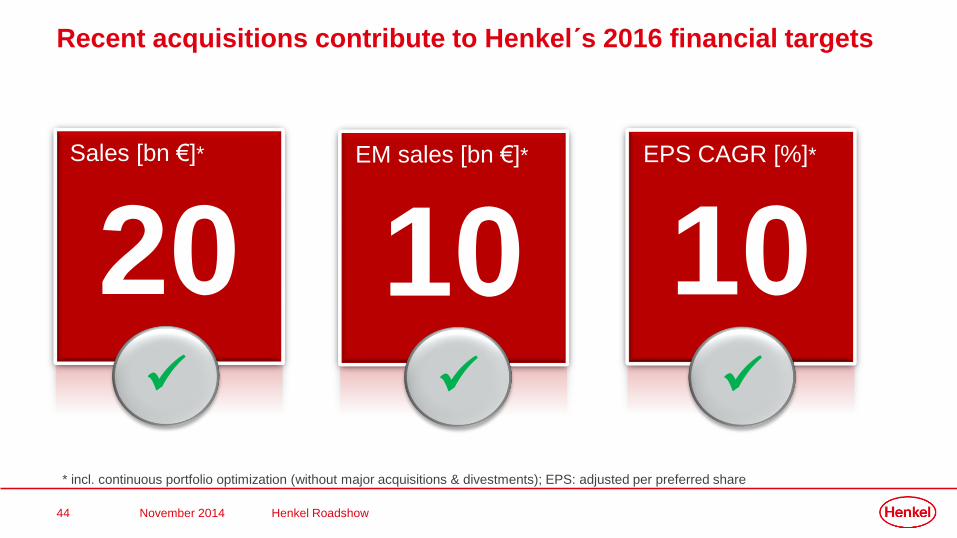
Recent acquisitions contribute to Henkel´s 2016 financial targets
20 Sales [bn €]*
10EM sales [bn €]*
10EPS CAGR [%]*
* incl. continuous portfolio optimization (without major acquisitions & divestments); EPS: adjusted per preferred share
Henkel Roadshow November 2014
45
• Commitment for acquisitions
amounting to 1.7 bn€
• About 350 m€ already paid
• 543 m€ paid for dividends,
+112 m€ vs. 2013
• Payout ratio policy: 25%-35%
Organic Performance Dividends
• Investments of 351 m€,
+58 m€ vs. 1-9 2013
• Focused on Western Europe,
Eastern Europe & Asia
Acquisitions
Henkel Roadshow November 2014
Commitment to excellence in value creation1-9 2014
46
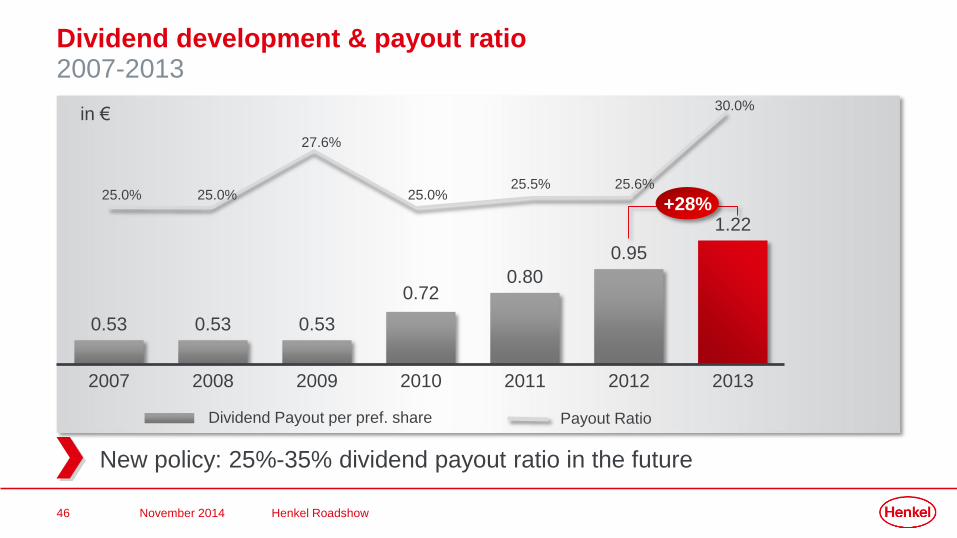
Dividend development & payout ratio2007-2013
0.53 0.53 0.53
0.720.80
0.95
1.22
2007 2008 2009 2010 2011 2012 2013
+28%
in €
25.0% 25.0%
27.6%
25.0%25.5% 25.6%
30.0%
Payout RatioDividend Payout per pref. share
New policy: 25%-35% dividend payout ratio in the future
Henkel Roadshow November 2014
47
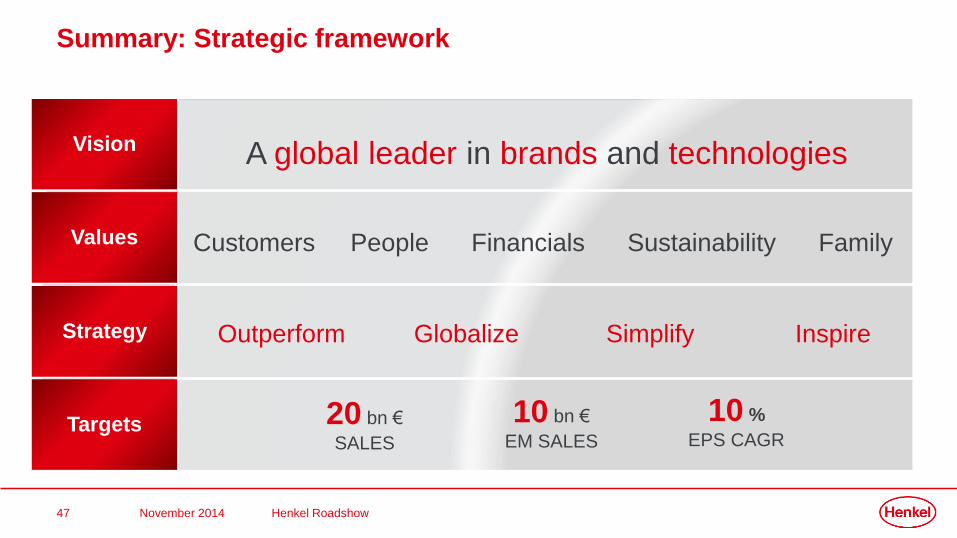
Summary: Strategic framework
A global leader in brands and technologies
Customers People Financials Sustainability FamilyValues
Vision
Targets 20 bn €
SALES
10 bn €
EM SALES
10 %
EPS CAGR
Strategy Outperform Simplify InspireGlobalize
Vision
Values
Strategy
Targets
Henkel Roadshow November 2014
Thank You!
49
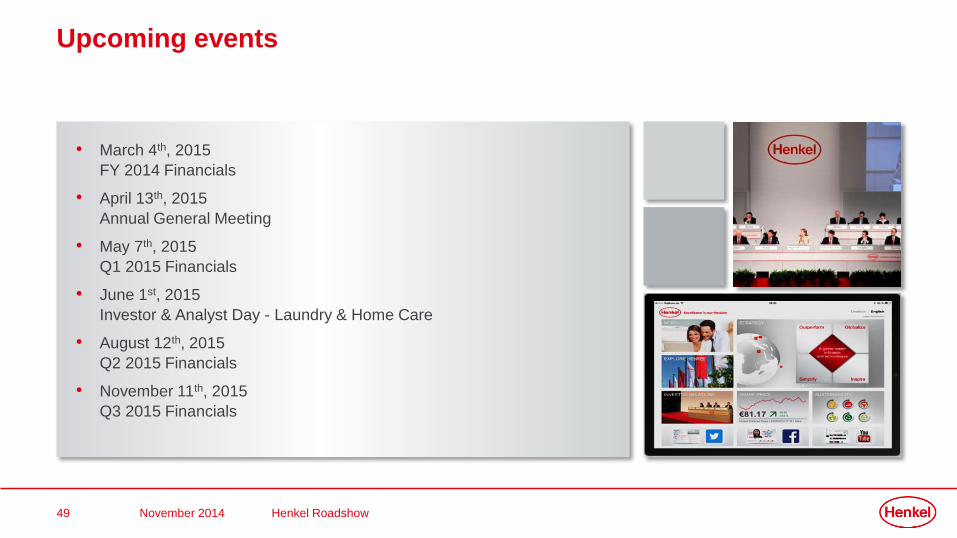
Upcoming events
• March 4th, 2015
FY 2014 Financials
• April 13th, 2015
Annual General Meeting
• May 7th, 2015
Q1 2015 Financials
• June 1st, 2015
Investor & Analyst Day - Laundry & Home Care
• August 12th, 2015
Q2 2015 Financials
• November 11th, 2015
Q3 2015 Financials
Henkel Roadshow November 2014
50
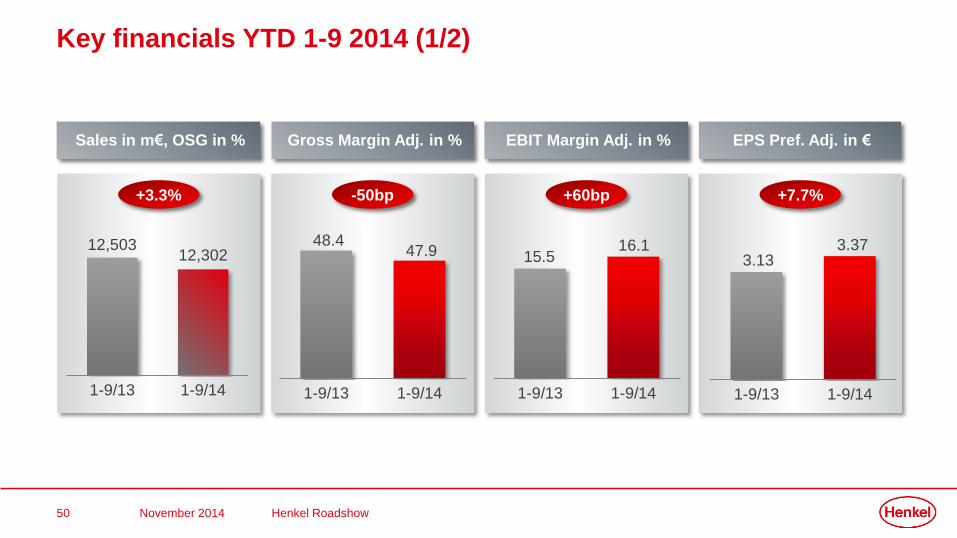
+3.3% -50bp +60bp +6.4%
1-9/13 1-9/14 1-9/13 1-9/14
12,50312,302
1-9/13 1-9/14
EPS Pref. Adj. in €EBIT Margin Adj. in %Gross Margin Adj. in %Sales in m€, OSG in %
48.447.9 15.5
16.1
1-9/13 1-9/14
3.133.37
Key financials YTD 1-9 2014 (1/2)
+7.7%
Henkel Roadshow November 2014
51
1-9/13 1-9/14
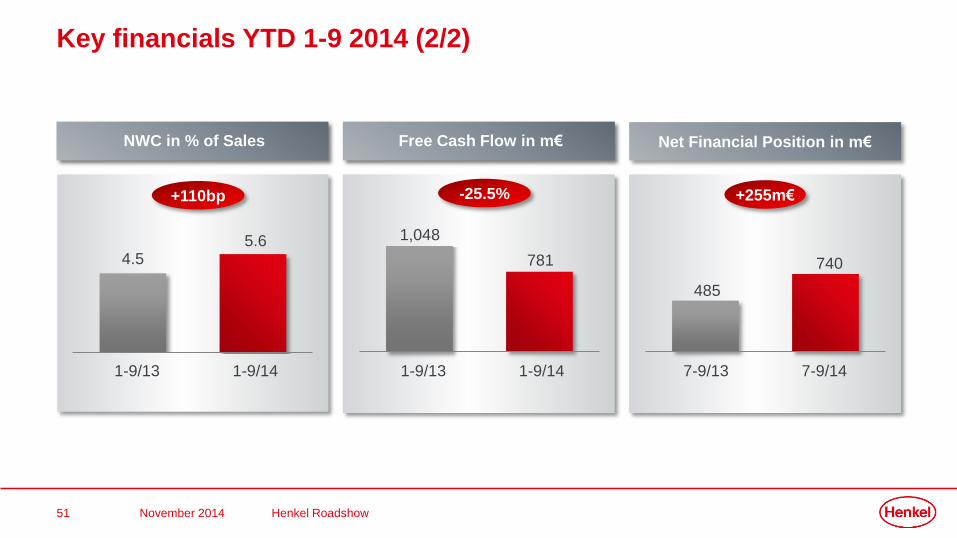
Key financials YTD 1-9 2014 (2/2)
Net Financial Position in m€
+255m€
NWC in % of Sales
+110bp
4.55.6
1-9/13 1-9/14
Free Cash Flow in m€
-25.5%
7-9/13 7-9/14
485
740
1,048
781
Henkel Roadshow November 2014
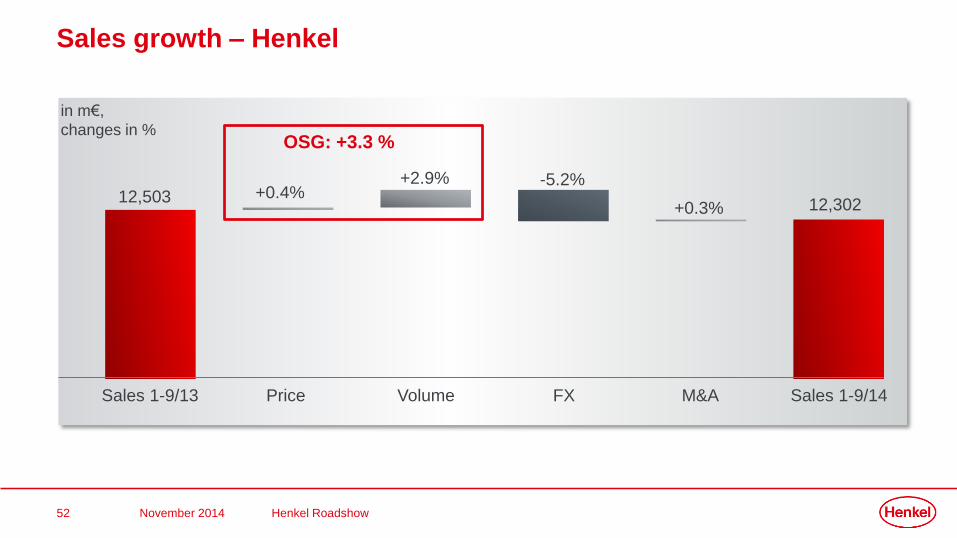
52
+0.4%+2.9% -5.2%
+0.3%12,503 12,302
Sales growth – Henkel
in m€,
changes in %OSG: +3.3 %
Sales 1-9/13 Price Volume FX M&A Sales 1-9/14
Henkel Roadshow November 2014
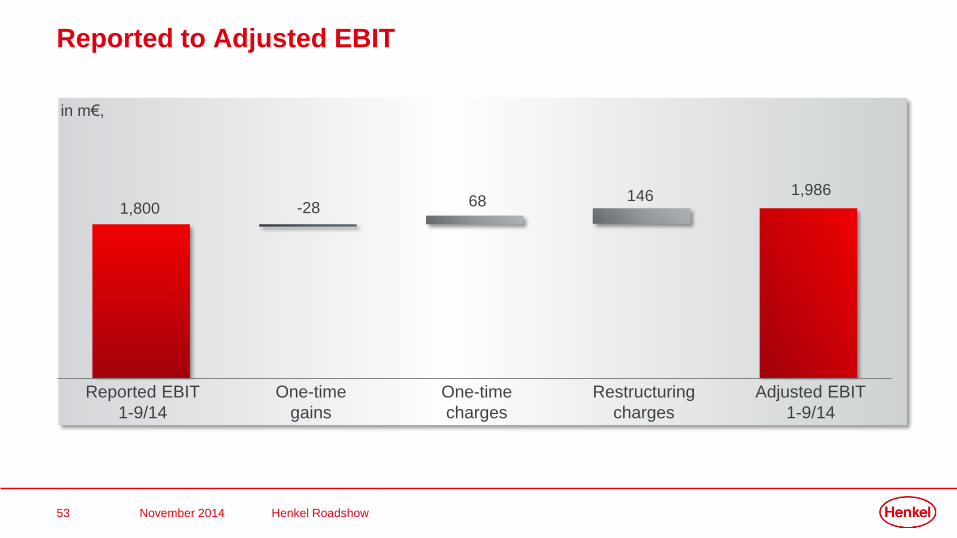
53
in m€,
1,8001,986
-28 68 146
Reported to Adjusted EBIT
Reported EBIT
1-9/14
One-time
gains
One-time
charges
Restructuring
charges
Adjusted EBIT
1-9/14
Henkel Roadshow November 2014
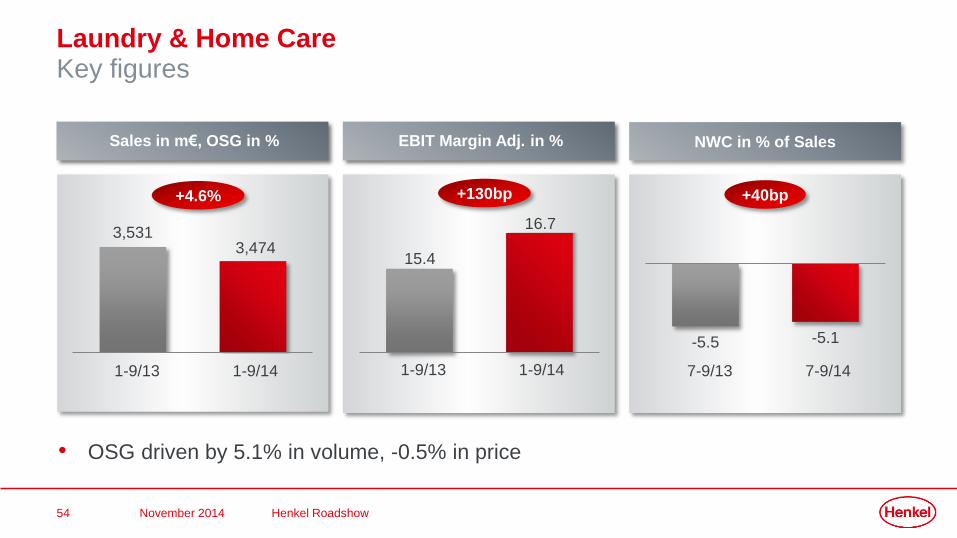
54
1-9/13 1-9/14
Laundry & Home CareKey figures
NWC in % of Sales
+40bp
Sales in m€, OSG in %
+4.6%
3,5313,474
1-9/13 1-9/14
EBIT Margin Adj. in %
+130bp
15.4
16.7
-5.5 -5.1
7-9/13 7-9/14
• OSG driven by 5.1% in volume, -0.5% in price
Henkel Roadshow November 2014
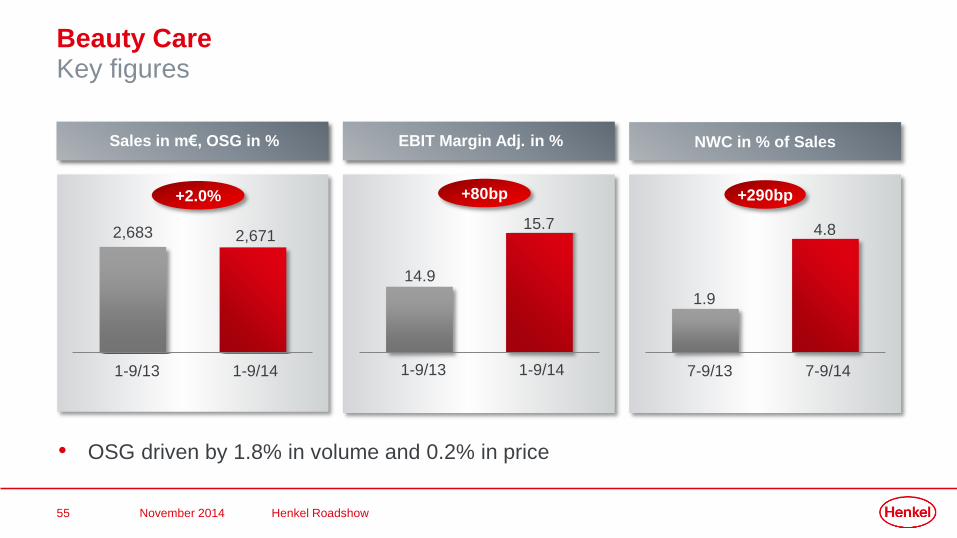
55
Beauty CareKey figures
1-9/13 1-9/14
NWC in % of Sales
+290bp
Sales in m€, OSG in %
2,683 2,671
1-9/13 1-9/14
EBIT Margin Adj. in %
+80bp
15.7
7-9/13 7-9/14
• OSG driven by 1.8% in volume and 0.2% in price
+2.0%
1.9
4.8
14.9
Henkel Roadshow November 2014
56
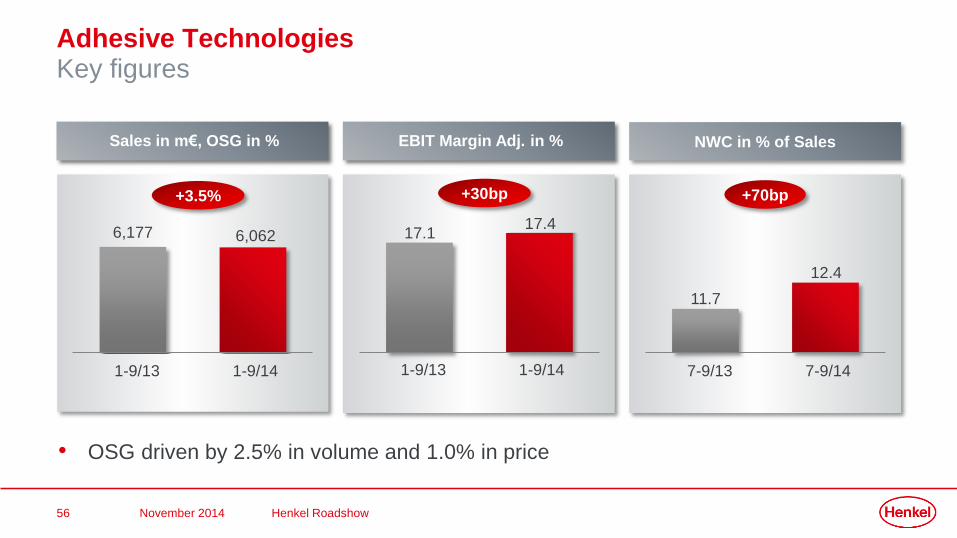
Adhesive TechnologiesKey figures
1-9/13 1-9/14
NWC in % of SalesSales in m€, OSG in %
6,177 6,062
1-9/13 1-9/14
EBIT Margin Adj. in %
+30bp
17.4
7-9/13 7-9/14
• OSG driven by 2.5% in volume and 1.0% in price
+3.5%
11.7
12.4
17.1
+70bp
Henkel Roadshow November 2014
57
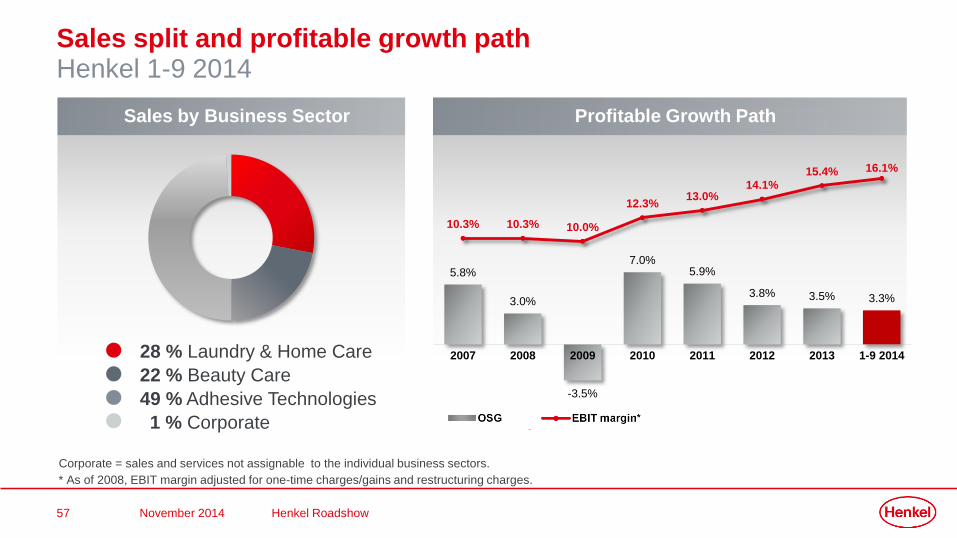
5.8%
3.0%
-3.5%
7.0%5.9%
3.8% 3.5% 3.3%
10.3% 10.3% 10.0%
12.3%13.0%
14.1%15.4% 16.1%
2007 2008 2009 2010 2011 2012 2013 1-9 2014
Sales by Business Sector Profitable Growth Path
Sales split and profitable growth pathHenkel 1-9 2014
* As of 2008, EBIT margin adjusted for one-time charges/gains and restructuring charges.
Corporate = sales and services not assignable to the individual business sectors.
1 % Corporate
49 % Adhesive Technologies
22 % Beauty Care
28 % Laundry & Home Care
Henkel Roadshow November 2014
58
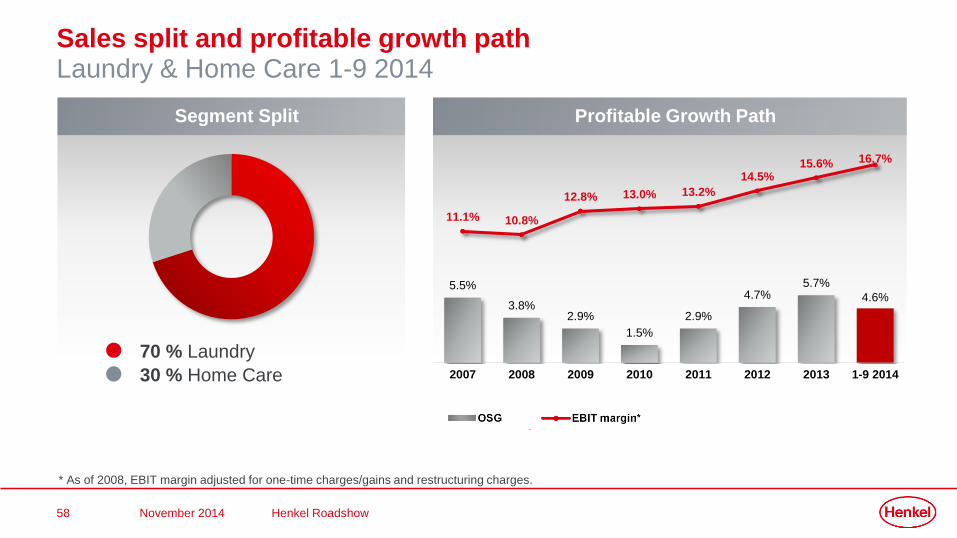
Profitable Growth PathSegment Split
Sales split and profitable growth pathLaundry & Home Care 1-9 2014
30 % Home Care
70 % Laundry
* As of 2008, EBIT margin adjusted for one-time charges/gains and restructuring charges.
5.5%
3.8%2.9%
1.5%
2.9%
4.7%5.7%
4.6%
11.1% 10.8%
12.8% 13.0% 13.2%
14.5%15.6% 16.7%
2007 2008 2009 2010 2011 2012 2013 1-9 2014
Henkel Roadshow November 2014
59
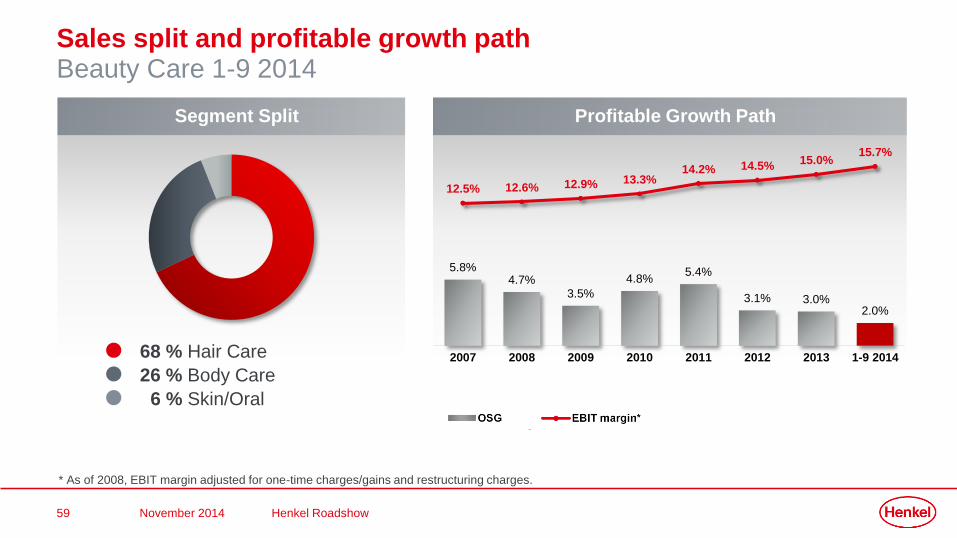
Segment Split
Sales split and profitable growth pathBeauty Care 1-9 2014
5.8%4.7%
3.5%
4.8%5.4%
3.1% 3.0%2.0%
12.5% 12.6% 12.9% 13.3%14.2% 14.5%
15.0%15.7%
2007 2008 2009 2010 2011 2012 2013 1-9 2014
6 % Skin/Oral
26 % Body Care
68 % Hair Care
Profitable Growth Path
* As of 2008, EBIT margin adjusted for one-time charges/gains and restructuring charges.
Henkel Roadshow November 2014
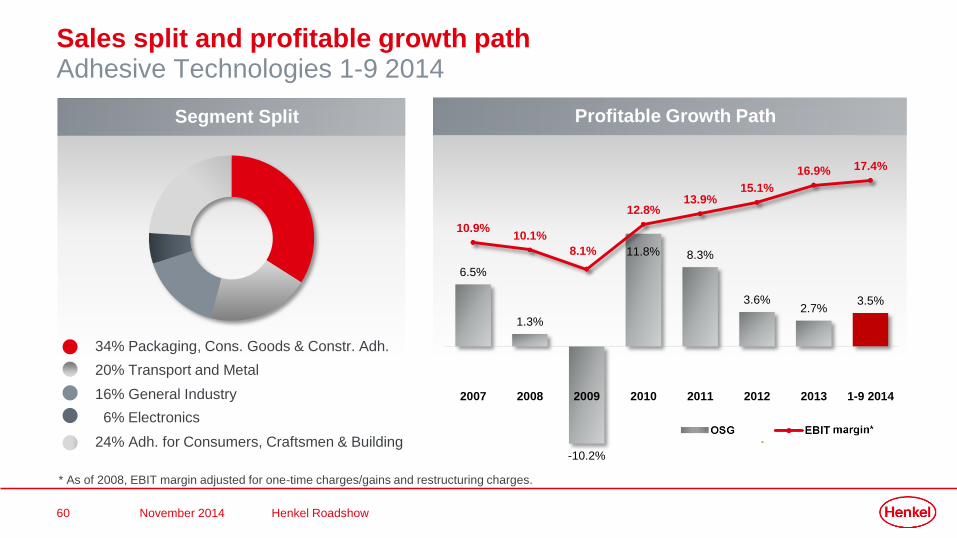
60
Profitable Growth Path
Sales split and profitable growth pathAdhesive Technologies 1-9 2014
* As of 2008, EBIT margin adjusted for one-time charges/gains and restructuring charges.
6.5%
1.3%
-10.2%
11.8% 8.3%
3.6%2.7%
3.5%
10.9%10.1%
8.1%
12.8%13.9%
15.1%
16.9% 17.4%
2007 2008 2009 2010 2011 2012 2013 1-9 2014
Segment Split
6% Electronics
24% Adh. for Consumers, Craftsmen & Building
20% Transport and Metal
34% Packaging, Cons. Goods & Constr. Adh.
16% General Industry
Henkel Roadshow November 2014