Embed Size (px)
Citation preview
Hemodialysis
Adequacy
B. Shaibani MD.PhDZKC 2017
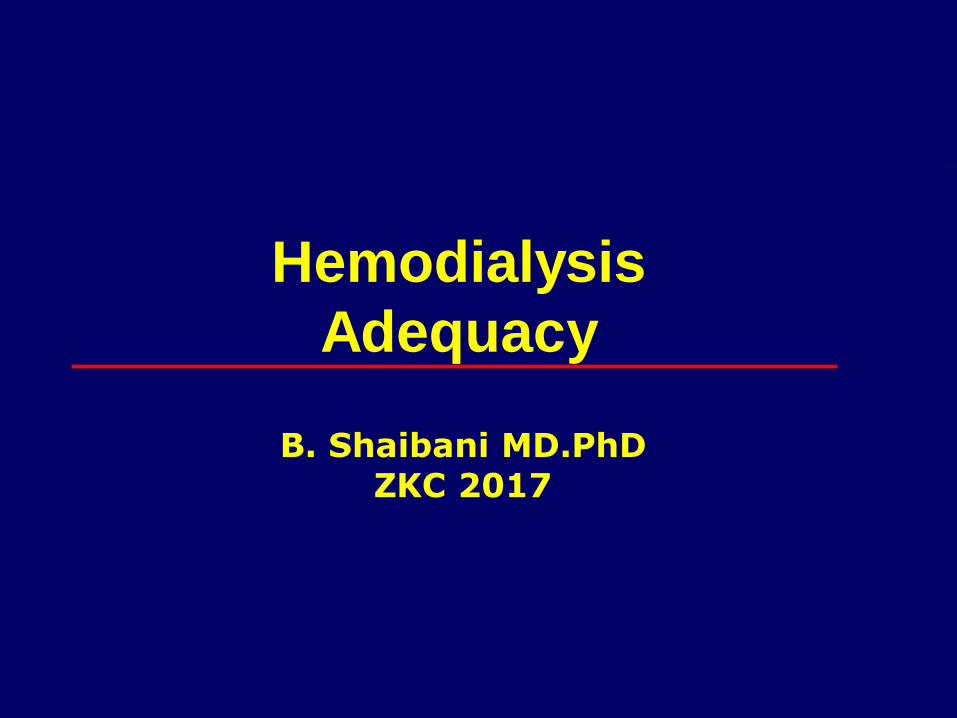
Dialysis up-grade course
✓ Identify adequacy of dialysis and it’s components✓ Learn about optimal dialysis✓ Know dialyzers choosing by knowing which fits
who and which for what ✓ Practice adequacy calculation✓ Understand management of anemia and MBD✓ Understand the importance of nutritional needs✓ Understand the importance of water quality✓ Approach HDF

Hemodialysis adequacy mission
The mission : Optimize survival, improve QoL..
The target : Optimal dialysis
The team : all unit staff
This mission is team work and efforts of everybody

Optimal Dialysis
Anemia
management
Good nutritionBP control
Adequate
solute
removal
Fluid and
electrolytes
hemostasis
BMD
management
Dialysis
adequacy

Hemodialysis
Adequacy
The delivered dose of hemodialysis that will optimize the survival and
well-being of the patient
Hemodialysis
Adequacy
The importance of dialysis adequacy on:
✓ Mortality and survival✓ Tools to measure adequacy✓ Interventions to achieve adequate dialysis
Adequate dialysis in the 1960’s
Defined as the absence of clinical
symptoms and signs of uremia
but
Symptoms and signs may have
other etiology

• Gastrointestinal and nutrition
–Nausea, vomiting, anorexia, dysgeusia, hypoalbuminemia
• Neurological
–Motor neuropathy, restless leg syndrome, burning feet syndrome, insomnia, depression, pruritus, decreased nerve conduction velocity, sleep apnea
Cardiovascular
–hypertension, arrhythmia related to electrolyte disturbances, pericarditis
Hemodialysis disequilibrium
–headaches during or immediately after dialysis
– Intradialytic and postdialytic hypovolemia
– During dialysis: cramps, hypotension, backache, crash.
– After dialysis: dizziness, hangover (thirst, headache, fatigue)
Major symptoms and signs indicating inadequate dialysisIF no other etiology could be determined
Adequate dialysis now
Optimal dialysis is the dialysis
service that result in
improving QoL
decreasing mortality
and morbidity
among dialysis population

Global dialysis population
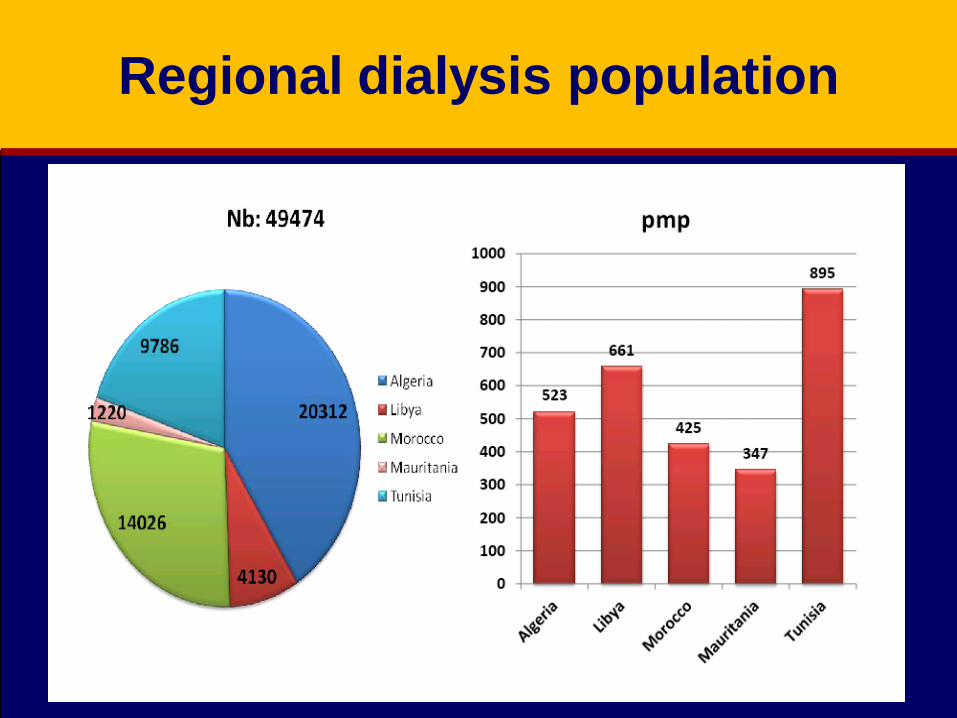
Regional dialysis population
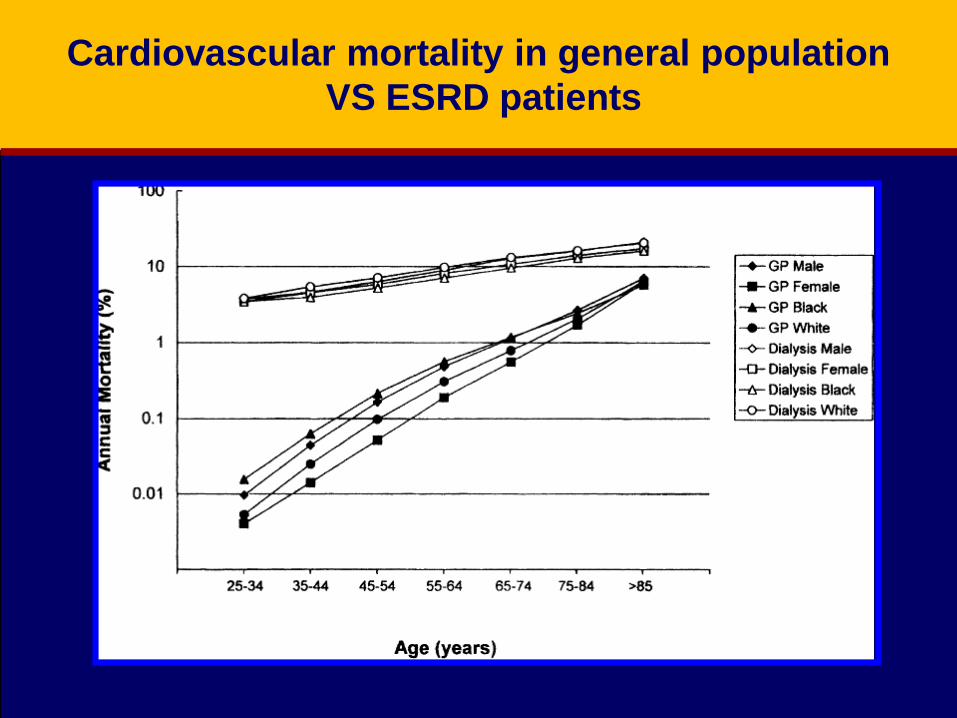
Cardiovascular mortality in general population
VS ESRD patients
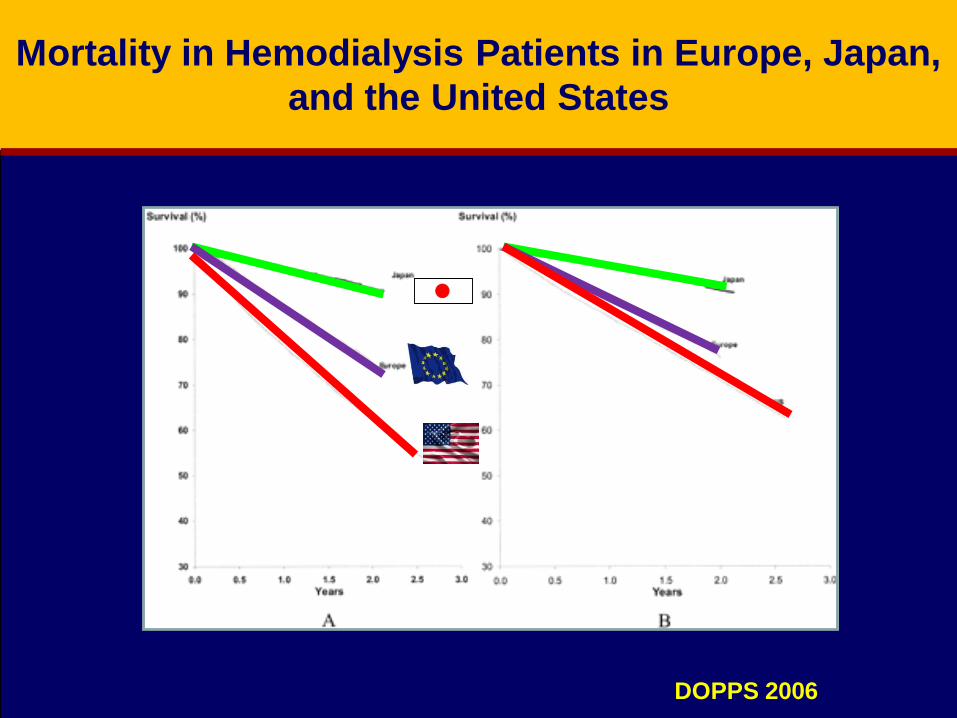
Mortality in Hemodialysis Patients in Europe, Japan,
and the United States
DOPPS 2006

Relative Risk of Death and First Hospitalization by
Quintile Scores for Physical Component Summary
0.8
1.0
1.2
1.4
1.6
1.8
2.0
2.2
<25 26-32 33-38 39-46 >46Ad
jus
ted
re
lati
ve r
isk
Physical component summary score
Death Hospitalizations
1.56 1.46
1.33
1.17
1.93
1.52
1.36
1.14

Tools to improve dialysis adequacy

Adequate dialysis evaluation
Defined as the absence of clinical
symptoms and signs of uremia
but
Symptoms and signs may have
other etiology
So how to evaluate adequacy
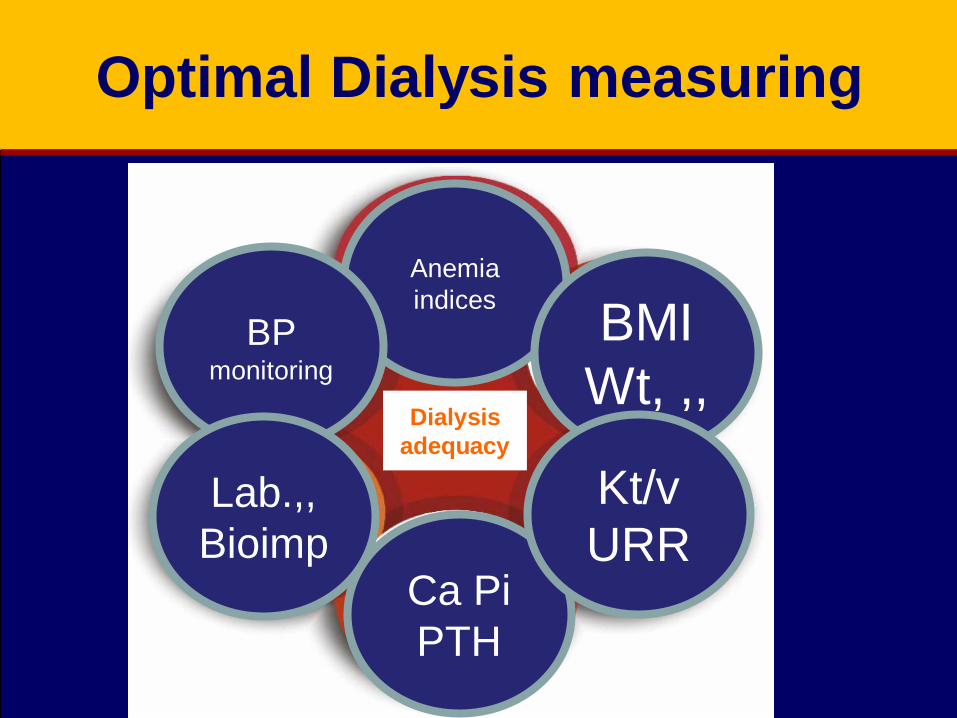
Optimal Dialysis
Anemia
management
Good nutritionBP control
Adequate
solute
removal
Fluid and
electrolytes
hemostasis
BMD
management
Dialysis
adequacy
Ca Pi
PTH
Anemia
indices
BP monitoring
Lab.,,
Bioimp
BMI
Wt, ,,
Kt/v
URR
Optimal Dialysis measuring

Hemodialysis Dose Measurement
• The preferred method is by formal kinetic
urea modeling
K/DOQI 2015 still ok
HD adeq 2015.pdf
But not alone …2018..

KDOQI – hemodialysis adequacy 2015
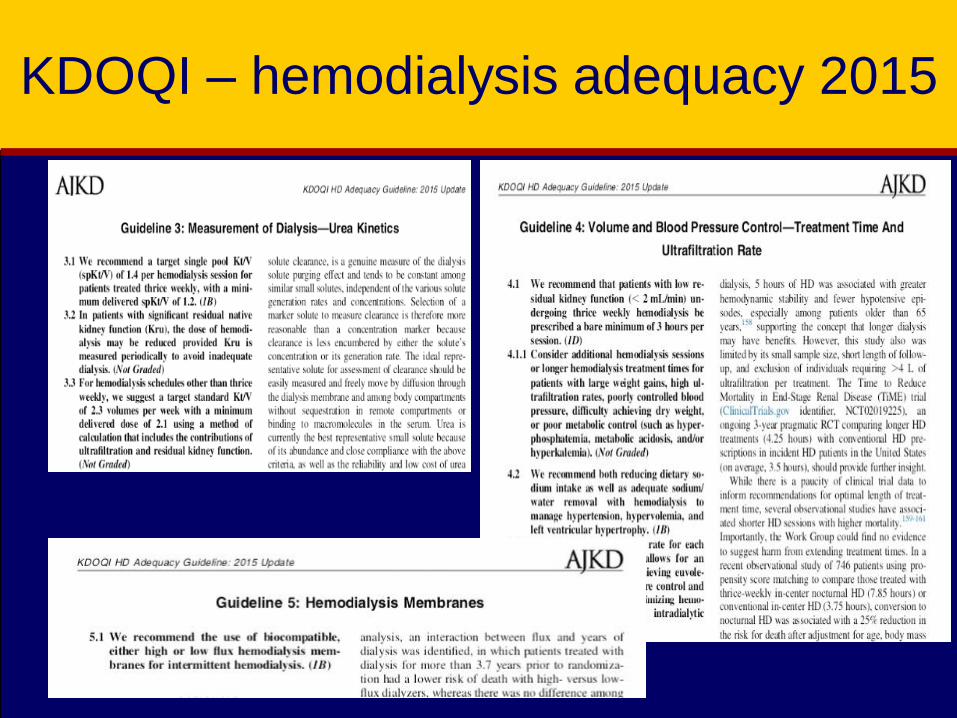
KDOQI – hemodialysis adequacy 2015

Hemodialysis Dose Measurement
▪ Kt/VK= dialyzer urea clearance L/h
t = dialysis session length hr
v = distribution volume of urea L
▪ URR
Measures of dialysis adequacy
• SpKt/V
• eKt/V
• StdKt/V
• URR
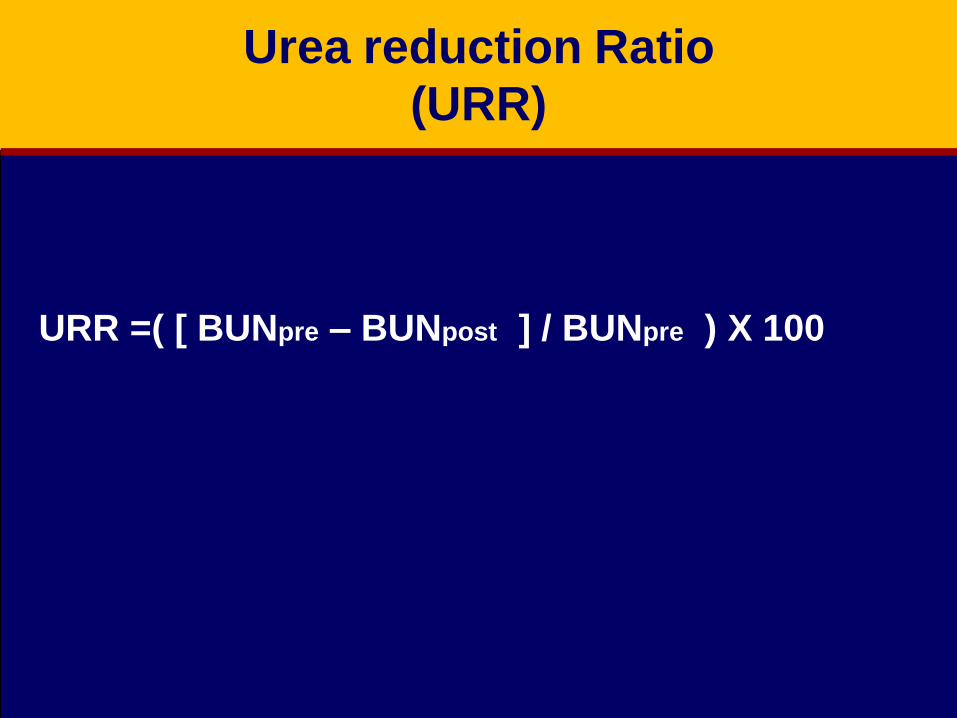
Urea reduction Ratio
(URR)
URR =( [ BUNpre – BUNpost ] / BUNpre ) X 100

Urea Reduction Volume (URR)
▪ Simple
▪ Prediction of mortality
Limitation:
Does not account for the contribution of
UF to dialysis dose
Kt/V=1.1 (UF=0)
Kt/v = 1.35 (UF=10%BW)URR=65
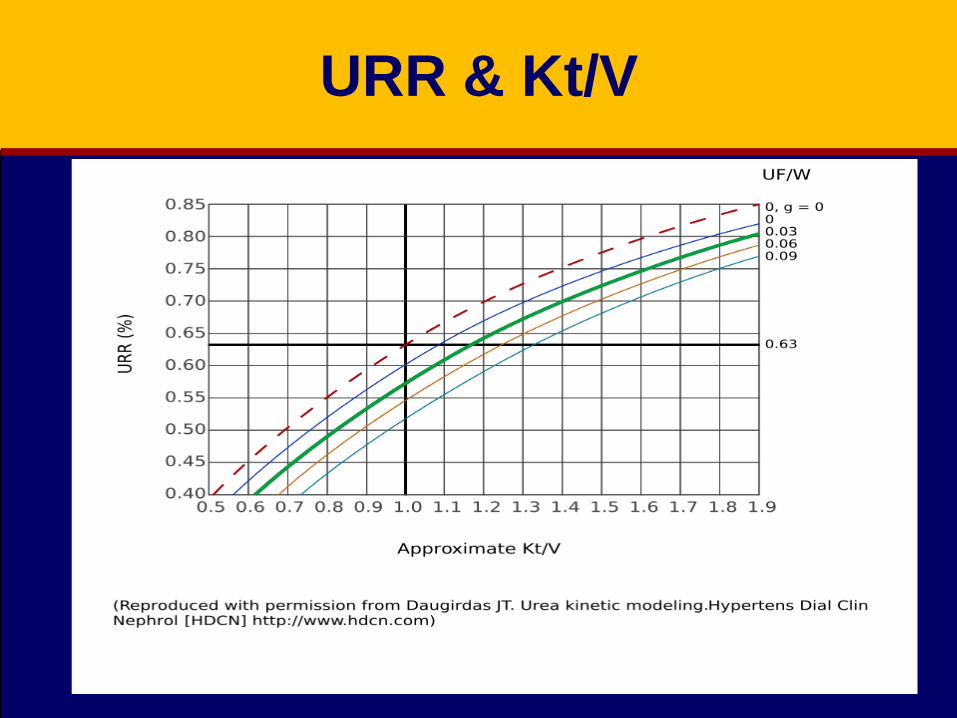
URR & Kt/V

BUN Sampling
▪ Predialysis
▪ Postdialysis
▪ Immediate predialysis
▪ Slow flow/stop pump

Urea Rebound
▪ Organs with low blood flow (skin, bone,
muscles) may serve as reservoir for urea 70%
of TBW is contained in organs that receive only
20% of CO
So: during HD, there is loss of urea from well
perfused areas, this result in ↑ in BUN over
60 minutes post dialysis.
Urea Rebound
▪ For most patient, urea rebound is nearly
complete in 15 minutes after hemodialysis but
for minority, it may require up to 50-60 minutes
▪ The degree of rebound is high in small patient
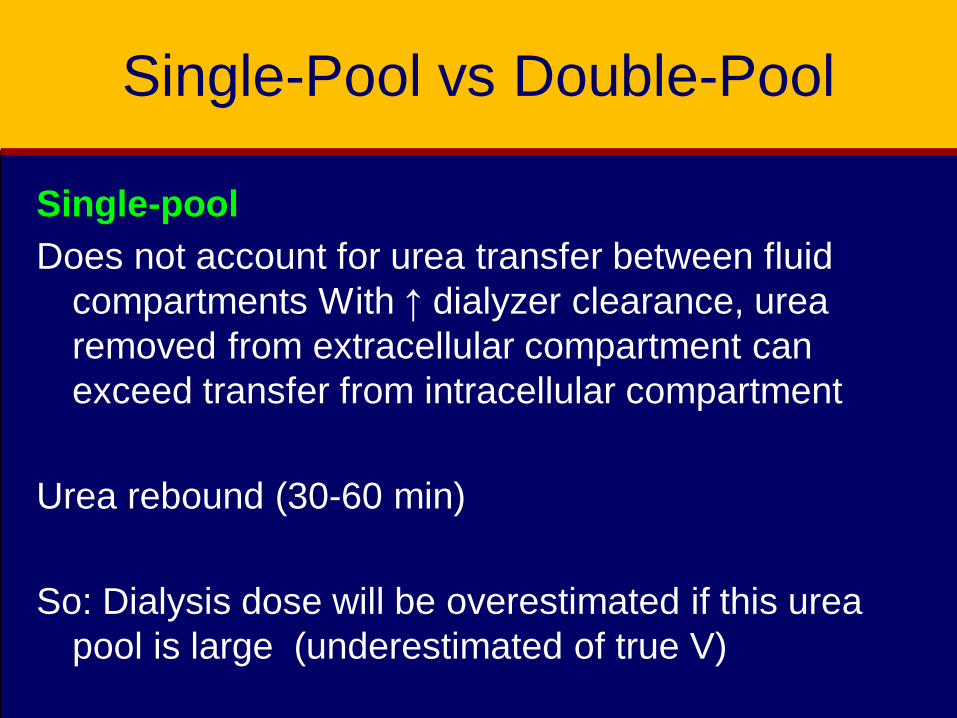
Single-Pool vs Double-Pool
Single-pool
Does not account for urea transfer between fluid
compartments With ↑ dialyzer clearance, urea
removed from extracellular compartment can
exceed transfer from intracellular compartment
Urea rebound (30-60 min)
So: Dialysis dose will be overestimated if this urea
pool is large (underestimated of true V)

Kt/V
Computerized software
Mathematical logarithm
Kt/v = -Ln (R-0.008t)+(4-3.5xR) x UF
W
Ln = natural logarithm
R = postdialysis BUN
predialysis BUN
UF = Ultrafiltration volume in liters
W = Postdialysis weight in kg
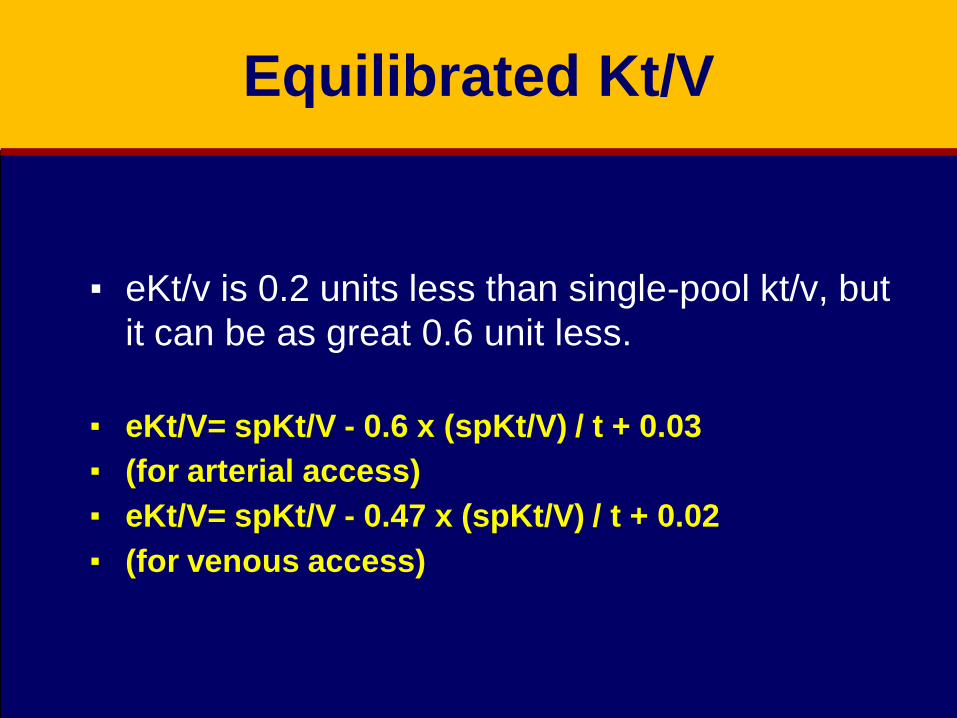
Equilibrated Kt/V
▪ eKt/v is 0.2 units less than single-pool kt/v, but
it can be as great 0.6 unit less.
▪ eKt/V= spKt/V - 0.6 x (spKt/V) / t + 0.03
▪ (for arterial access)
▪ eKt/V= spKt/V - 0.47 x (spKt/V) / t + 0.02
▪ (for venous access)
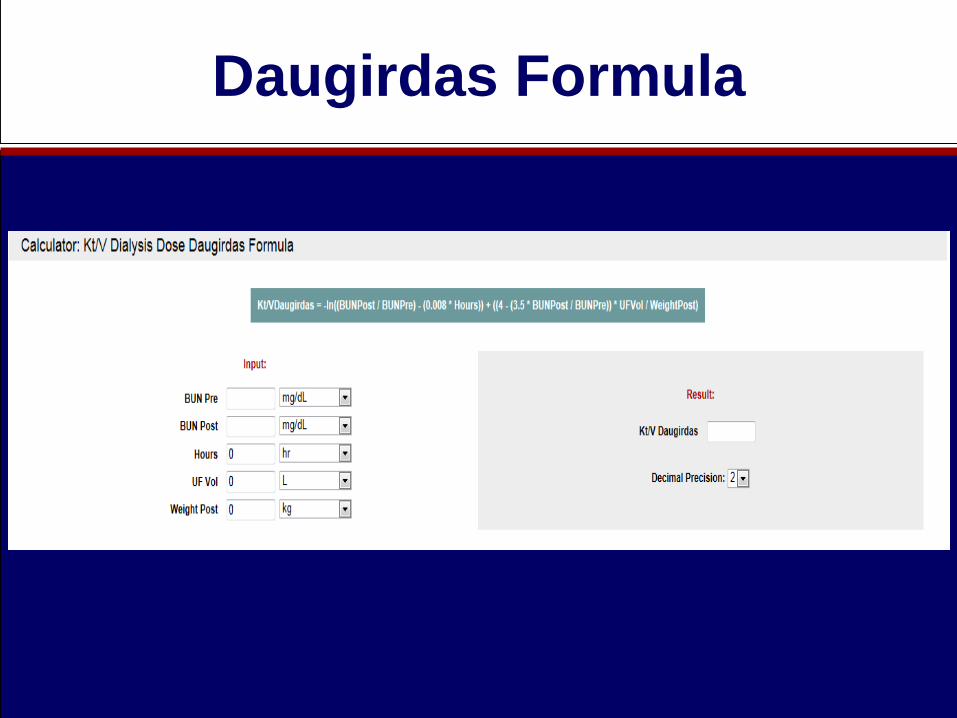
Daugirdas Formula

Prescribed vs. delivered Kt/V
Prescribed Kt/V is a computerized estimation of
what the patients Kt/V would be, based on the
prescription
• Delivered Kt/V is actual results based on
how the patient really dialyzed the day the
kinetic labs were drawn
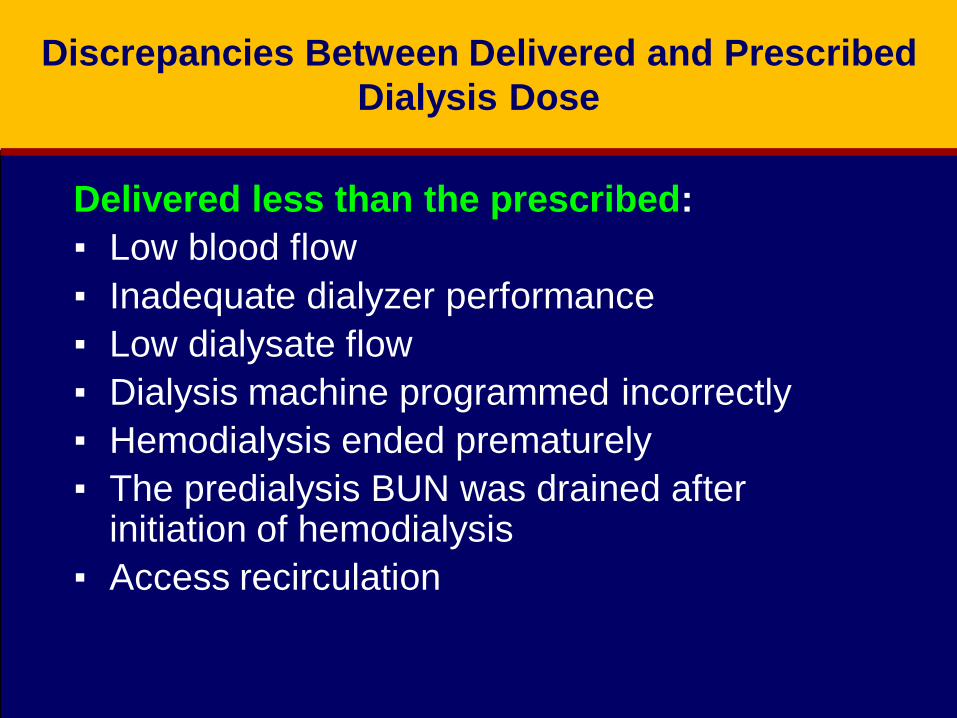
Discrepancies Between Delivered and Prescribed
Dialysis Dose
Delivered less than the prescribed:
▪ Low blood flow
▪ Inadequate dialyzer performance
▪ Low dialysate flow
▪ Dialysis machine programmed incorrectly
▪ Hemodialysis ended prematurely
▪ The predialysis BUN was drained after initiation of hemodialysis
▪ Access recirculation
Discrepancies Between Delivered and Prescribed
Dialysis Dose
▪ Delivered Dose More than the Prescribed:
▪ Postdialysis BUN was drained from venous
bloodline
▪ The post dialysis BUN was diluted with saline
▪ Small (V)
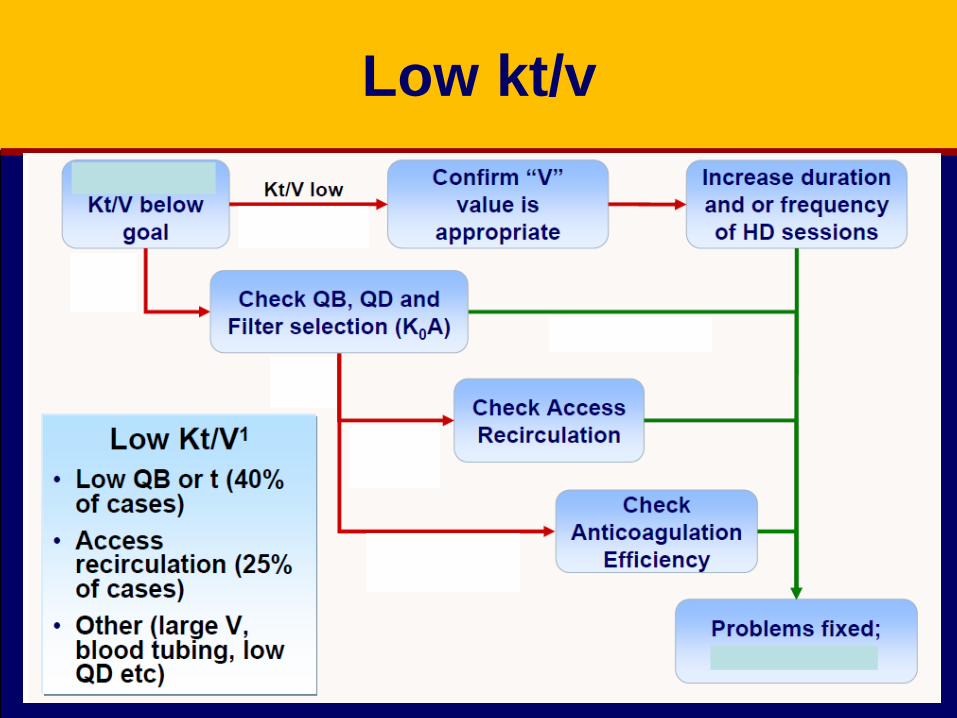
Low kt/v

How to improve clearance
• Blood flow
• Dialysate flow
• Duration
• Frequency
• Dialyzer
0
50
100
150
200
250
300
350
400
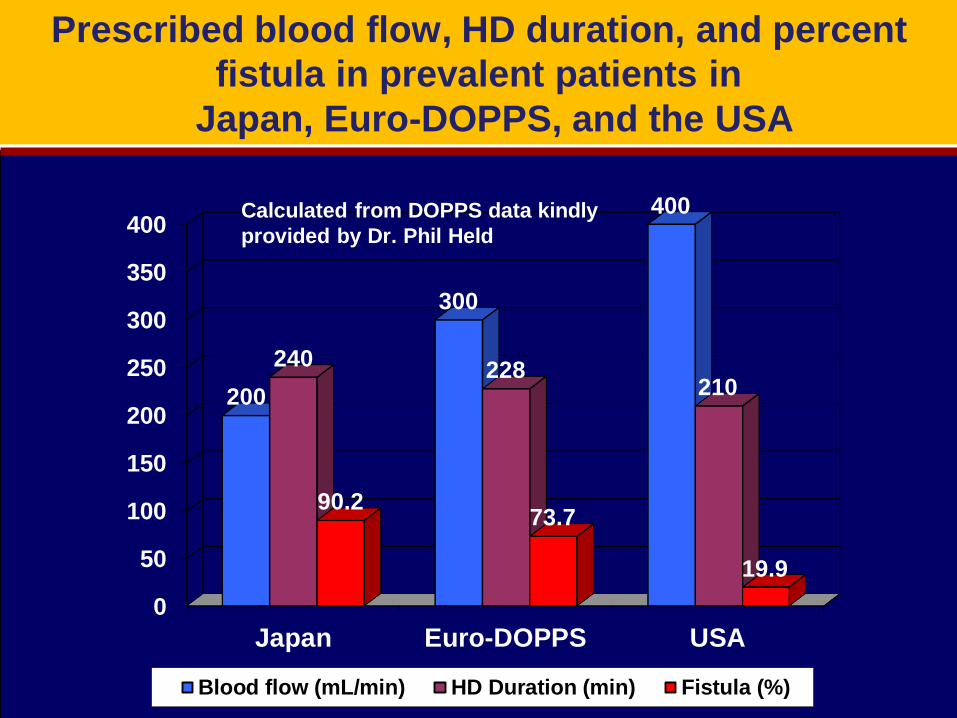
Japan Euro-DOPPS USA
200
300
400
240228
210
90.273.7
19.9
Blood flow (mL/min) HD Duration (min) Fistula (%)
Calculated from DOPPS data kindly
provided by Dr. Phil Held
Prescribed blood flow, HD duration, and percent
fistula in prevalent patients in
Japan, Euro-DOPPS, and the USA
High blood flow rates and A-V fistula problems
Primary A-V wrist fistula providing <300 mL/min
blood flow is sufficient for long dialysis but is in
jeopardy if short dialysis is practiced
May be deemed unusable and other access
created.

A-V fistula survival is markedly higher in Europe
compared to the USA
Do you know why ?
Short dialysis x hi blood flow

High blood flow rates and A-V fistula problems
A-V fistula may be damaged by repeated attempts to
achieve higher blood flows, using tourniquets and
other maneuvers
Hypotensive episodes rapidly reduce fistula blood
flow, predispose to damage of the intima by suction
of the inflow needle with consequent clotting

High blood flow and catheter problems
High blood flow requires a large internal diameter of
the catheter
Large diameter catheter fits the vein too tightly and
predisposes to damage of the vein wall, vein
thrombosis and stenosis

Blood flow and Clearance
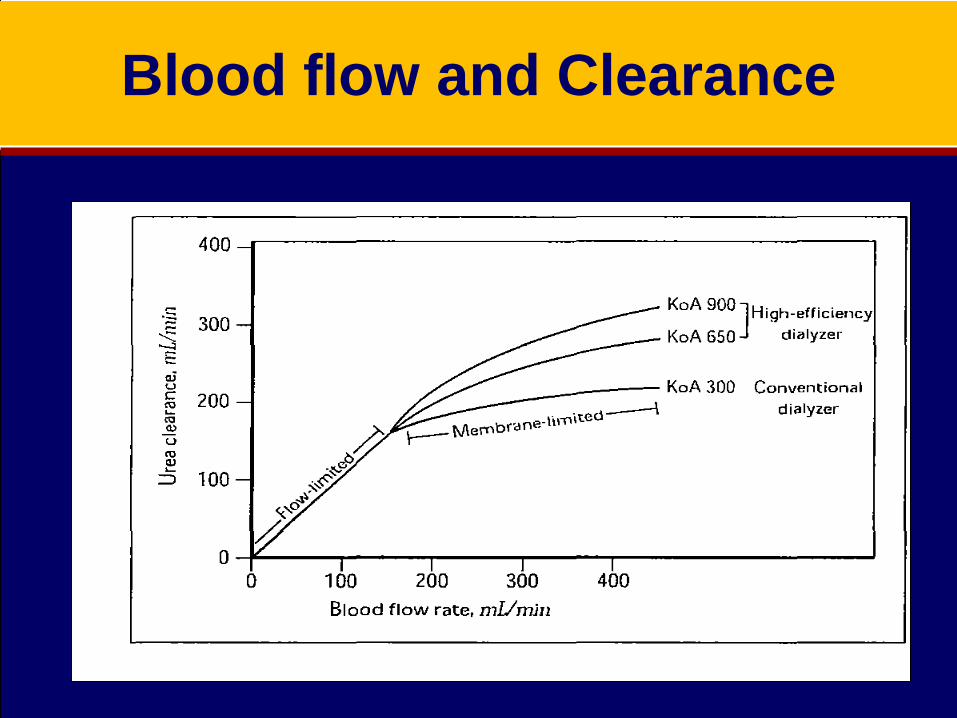
Blood flow and Clearance
How to improve clearance
• Blood flow
• Dialysate flow
• Duration
• Frequency
• Dialyzer

Dialysate flow and clearance

How to improve clearance
• Blood flow
• Dialysate flow
• Duration
• Frequency
• Dialyzer
Dialysis adequacy and death The dialysis dose
Short V long dialysis
The effect on survival
Why Should We Measure Dialysis Dose?
▪ There is a correlation between delivered
dose of hemodialysis and patient morbidity
and mortality
▪ Clinical symptoms are not reliable
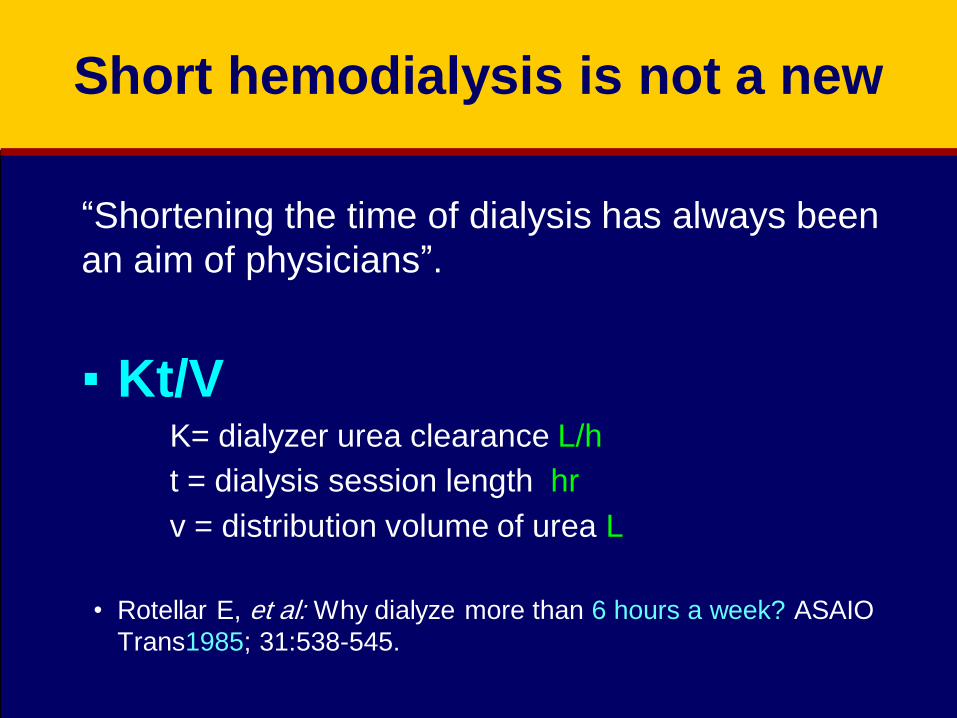
Short hemodialysis is not a new
“Shortening the time of dialysis has always been
an aim of physicians”.
▪ Kt/VK= dialyzer urea clearance L/h
t = dialysis session length hr
v = distribution volume of urea L
• Rotellar E, et al: Why dialyze more than 6 hours a week? ASAIO
Trans1985; 31:538-545.
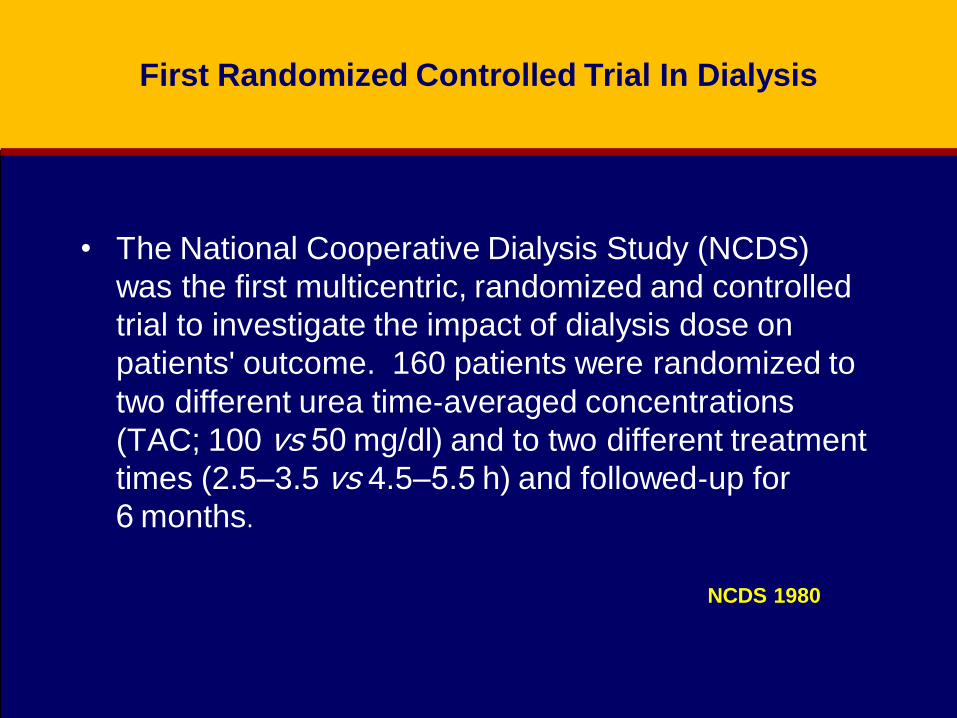
First Randomized Controlled Trial In Dialysis
• The National Cooperative Dialysis Study (NCDS)
was the first multicentric, randomized and controlled
trial to investigate the impact of dialysis dose on
patients' outcome. 160 patients were randomized to
two different urea time‐averaged concentrations
(TAC; 100 vs 50 mg/dl) and to two different treatment
times (2.5–3.5 vs 4.5–5.5 h) and followed‐up for
6 months.
NCDS 1980

First Randomized Controlled Trial In Dialysis
Predialysis urea 38 vs 26 mmol. Dialysis 2.5-35h vs 4.5-5 h
high kt/v and long
dialysis
high kt/v and short
dialysis
low kt/v and long
dialysis
low kt/v and short
dialysis
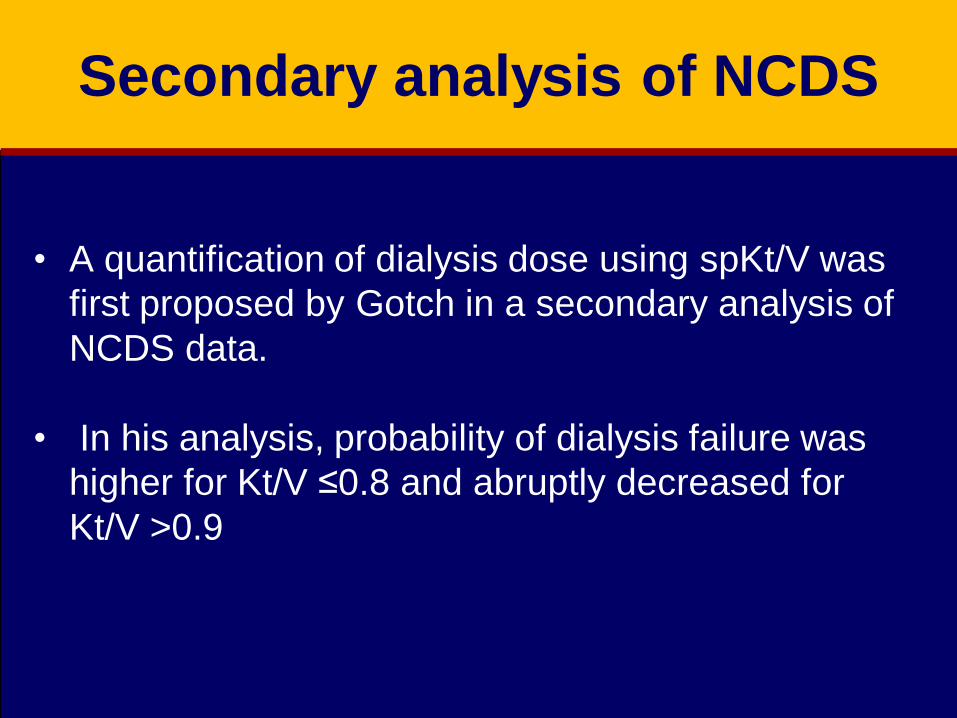
Secondary analysis of NCDS
• A quantification of dialysis dose using spKt/V was
first proposed by Gotch in a secondary analysis of
NCDS data.
• In his analysis, probability of dialysis failure was
higher for Kt/V ≤0.8 and abruptly decreased for
Kt/V >0.9

NCDS Conclusion
• Thus, according to NCDS patient
morbidity and treatment failure are
related to the dialysis dose

Duration of dialysis and mortality in Japan
Analysis of the results in 71,193 patients of Japanese HD Registry showed statistically significant, gradual decrease of mortality with increased dialysis time from 3.5 to 5.5 hours.
Further decrease in mortality with dialysis duration >6 hours, but statistically insignificant because of small number of patients in this time range
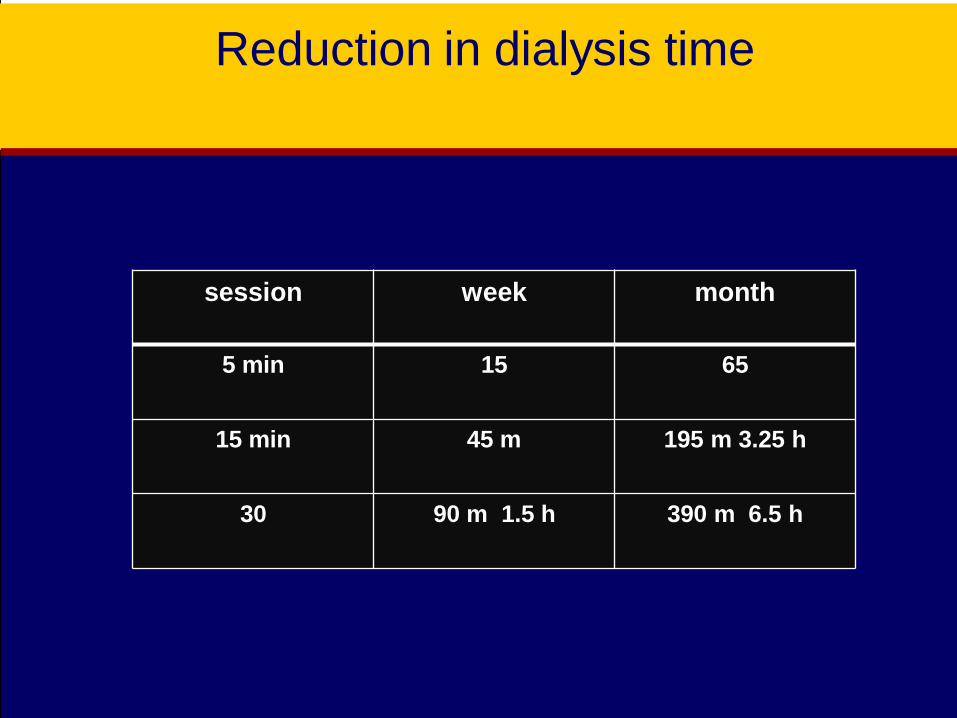
Reduction in dialysis time
session week month
5 min 15 65
15 min 45 m 195 m 3.25 h
30 90 m 1.5 h 390 m 6.5 h
How to improve clearance
• Blood flow
• Dialysate flow
• Duration
• Frequency
• Dialyzer
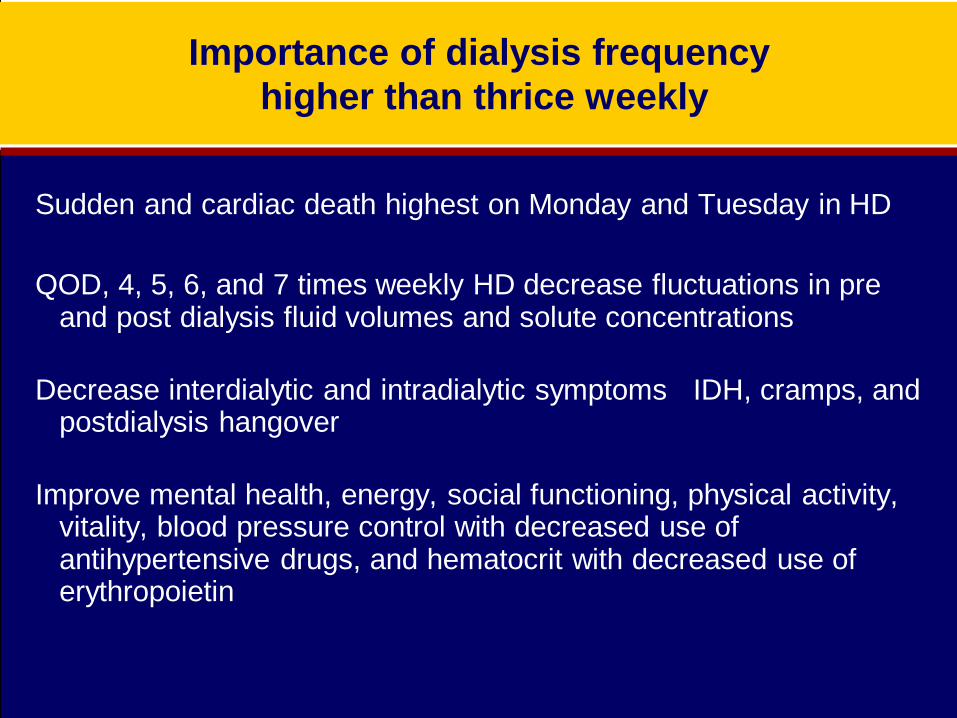
Importance of dialysis frequency
higher than thrice weekly
Sudden and cardiac death highest on Monday and Tuesday in HD
QOD, 4, 5, 6, and 7 times weekly HD decrease fluctuations in pre and post dialysis fluid volumes and solute concentrations
Decrease interdialytic and intradialytic symptoms IDH, cramps, and postdialysis hangover
Improve mental health, energy, social functioning, physical activity, vitality, blood pressure control with decreased use of antihypertensive drugs, and hematocrit with decreased use of erythropoietin

Reasons that patients do better on quotidian HD with the same
overall weekly dialysis duration
Alleviation of hemodialysis “unphysiology”Kjellstrand CM, et al. The "unphysiology" of dialysis: A major cause of dialysis side
effects? Kidney Int 1975; 7: S30-S34.
Less swings in concentrations of all solutes (lower timeaverage deviation)
Urea, creatinine, uric acid, etc.
Maintenance of concentrations within normal limitsPotassium, phosphorus, calcium, pH, bicarbonate
Less swings in hydration/ECVLower interdialytic weight gains
Elimination of hypervolemia/hypovolemia

Co
nc
en
tra
tio
n
Time
Weekly substance concentrations in routine HD
NO NORMAL RANGE OF ECV, K, Bicarb, P, Ca, pH
Weekly fluctuations in routine hemodialysis
Co
nc
en
tra
tio
n
Time
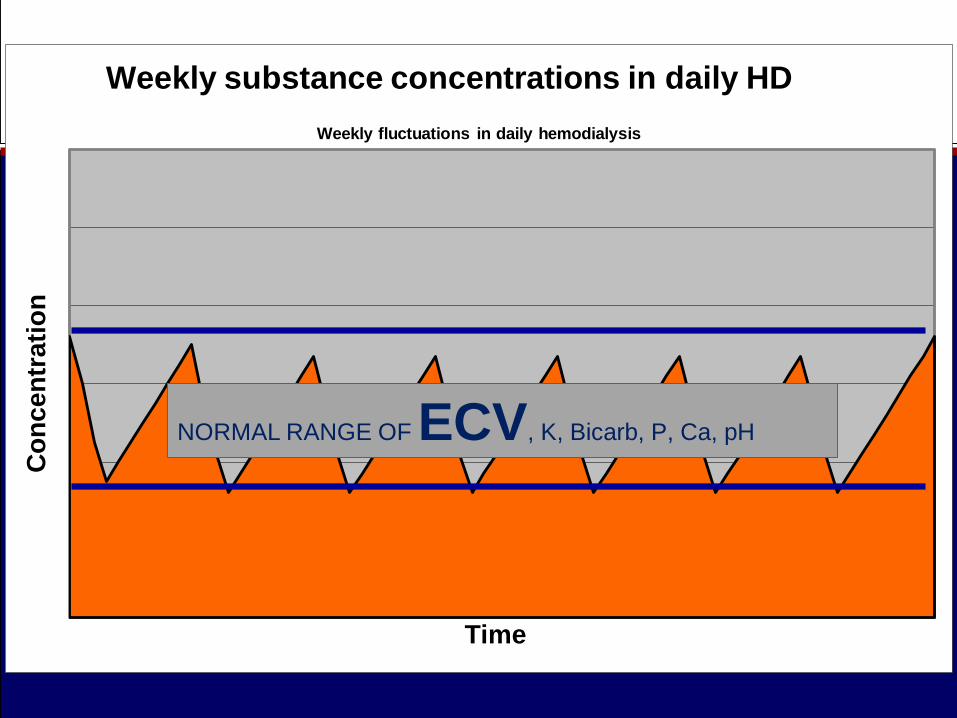
Weekly substance concentrations in daily HD
NORMAL RANGE OF ECV, K, Bicarb, P, Ca, pH
Weekly fluctuations in daily hemodialysis

Intradialytic hypotension (IDH) and duration of dialysis
Intradialytic hypotension (IDH) occurs in 25 to 50% of short, thrice weekly hemodialysis treatments in the United States.
Dialysis hypotension occurs because a large volume of blood water and solutes are removed over a short period, exceeding the plasma refilling rate and reduction of venous capacity
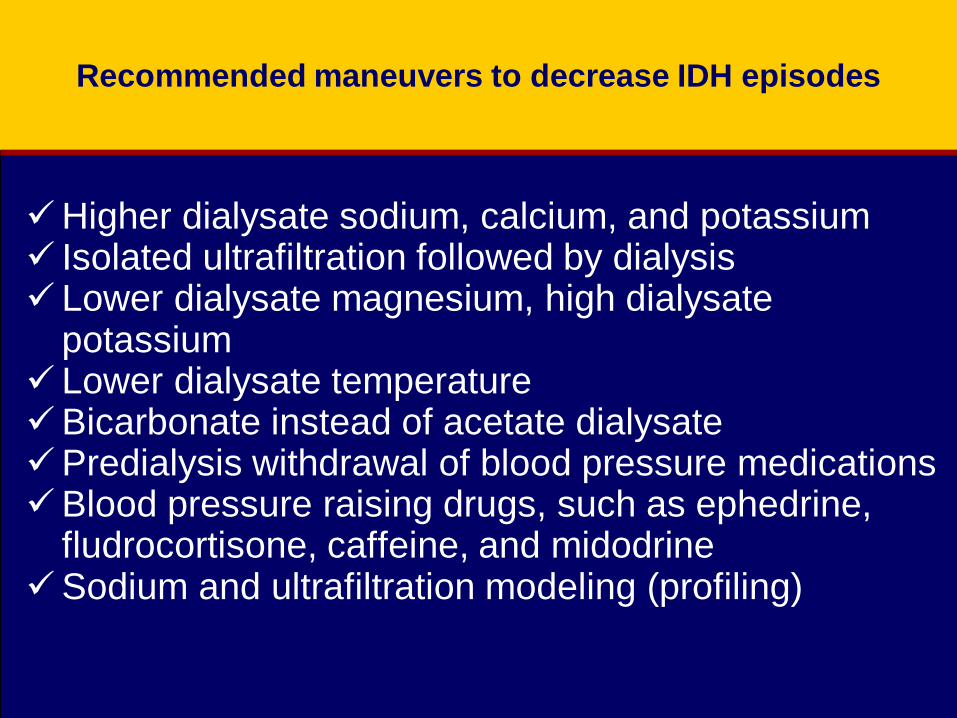
Recommended maneuvers to decrease IDH episodes
✓Higher dialysate sodium, calcium, and potassium✓ Isolated ultrafiltration followed by dialysis✓ Lower dialysate magnesium, high dialysate
potassium✓ Lower dialysate temperature✓Bicarbonate instead of acetate dialysate✓Predialysis withdrawal of blood pressure medications ✓Blood pressure raising drugs, such as ephedrine,
fludrocortisone, caffeine, and midodrine✓Sodium and ultrafiltration modeling (profiling)

Stiller S,. A critical review of sodium profiling for hemodialysis. Semin Dial. 2001;14(5): 337-347.

Sodium retention and hypertension in short dialysis
Exchangeable sodium increases with 14.8 hr/wk compared to 18 hr/wk dialysis, and more patients require antihypertensive drugs.
Problems of hypertension and the side effects of its treatment, both medical and surgical, should be weighed against the social and economic advantages of short dialysis in deciding on the ideal schedule.”

Consequences of positive sodium balance
Chronic fluid volume overload until new equilibrium is
achieved
Decreases IDH rates
Causes volume dependent hypertension
>80% of patients in the USA are on antihypertensive drugs
LVH
Increased cardiovascular mortality

Comorbidities (%) in Euro- DOPPS, Japan, and the USA
Euro-DOPPS Japan USA
Coronary artery disease 28.7 18.7 48.3
Congestive heart failure 24.1 5.6 43.9
Other cardiac problem 36.2 23.9 34.6
Hypertension 72.5 56.1 83.7
Peripheral vascular disease 22.0 10.9 24.3
Cerebrovascular disease 13.2 11.8 16.8
Dyspnea 18.9 2.4 27.5
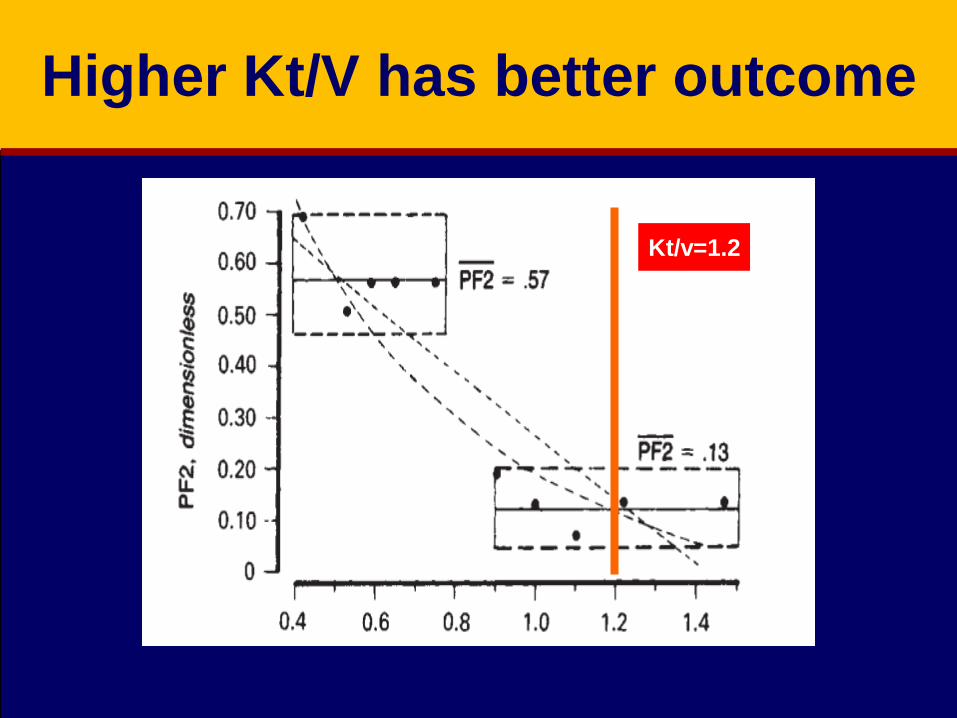
Higher Kt/V has better outcome
Kt/v=1.2
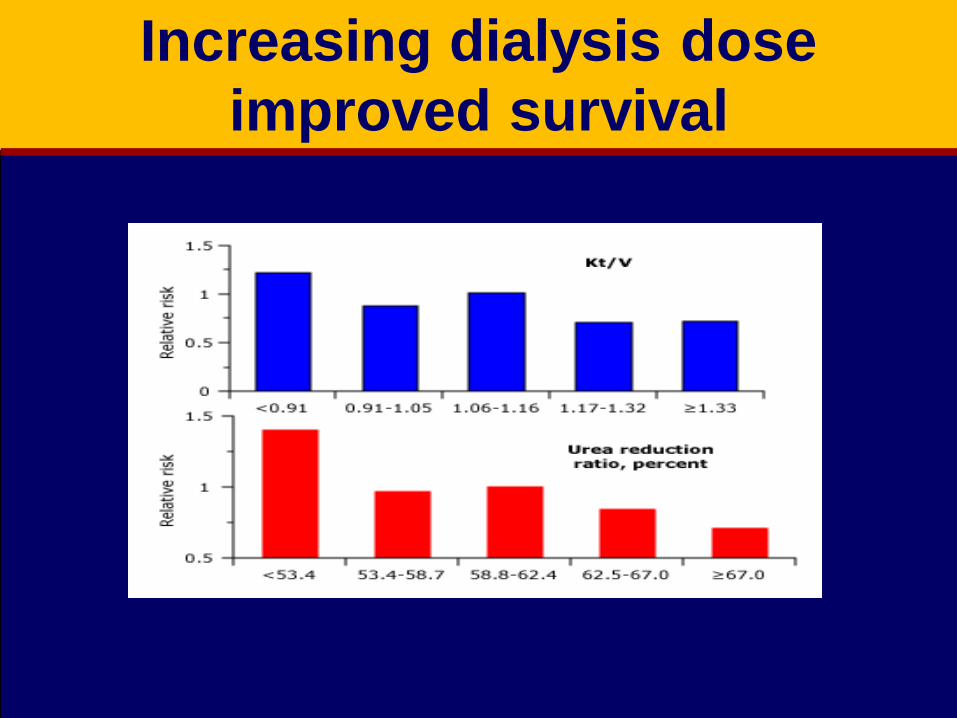
Increasing dialysis dose
improved survival

Conclusion of NCDS
Time of dialysis has little influence on results provided that dialyzer clearance is high
Kt/Vurea should be over 0.95/treatment with three times weekly dialysis
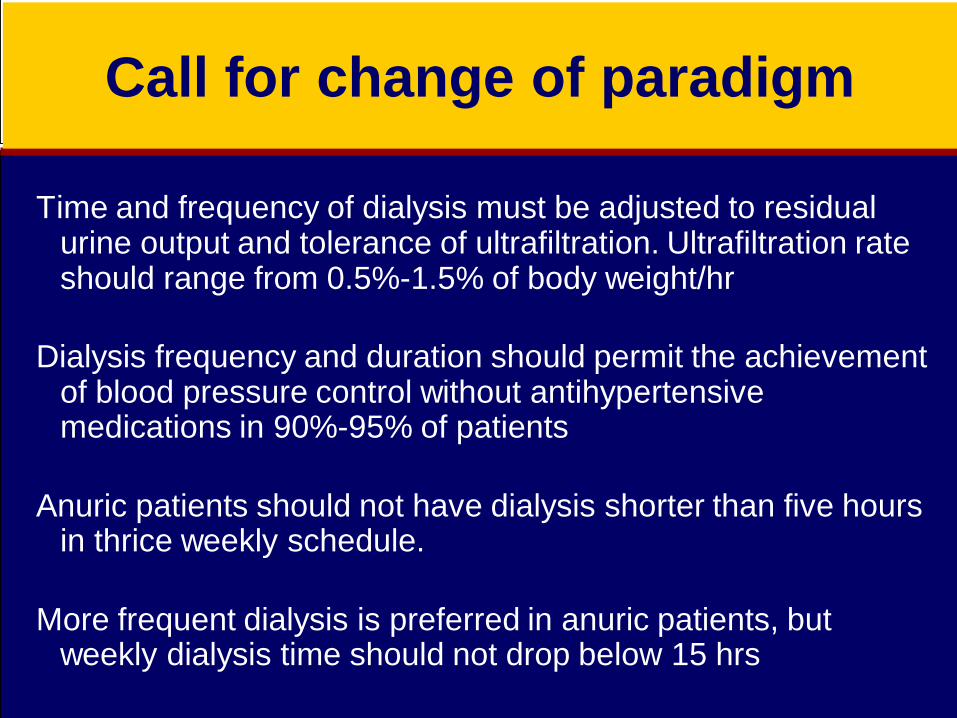
Call for change of paradigm
Time and frequency of dialysis must be adjusted to residual urine output and tolerance of ultrafiltration. Ultrafiltration rate should range from 0.5%-1.5% of body weight/hr
Dialysis frequency and duration should permit the achievement of blood pressure control without antihypertensive medications in 90%-95% of patients
Anuric patients should not have dialysis shorter than five hours in thrice weekly schedule.
More frequent dialysis is preferred in anuric patients, but weekly dialysis time should not drop below 15 hrs

Call for change of paradigm
➢Kt/V , URR should be measured max every 8 wks to 2
months to evaluate dialysis quality
➢URR ≥ 70 Kt/V 1.4 is accepted for aqequacy
➢Blood flow should range from 200 to 300 ml/min
➢Dialysate flow to be 500 ml / min
➢High performance dialyzers should continue to be used
➢Management of comorbid conditions to be planned
➢Quality of life to be routinely assessed

Better survival with long dialysis

How to improve clearance
• Blood flow
• Dialysate flow
• Duration
• Frequency
• Dialyzer
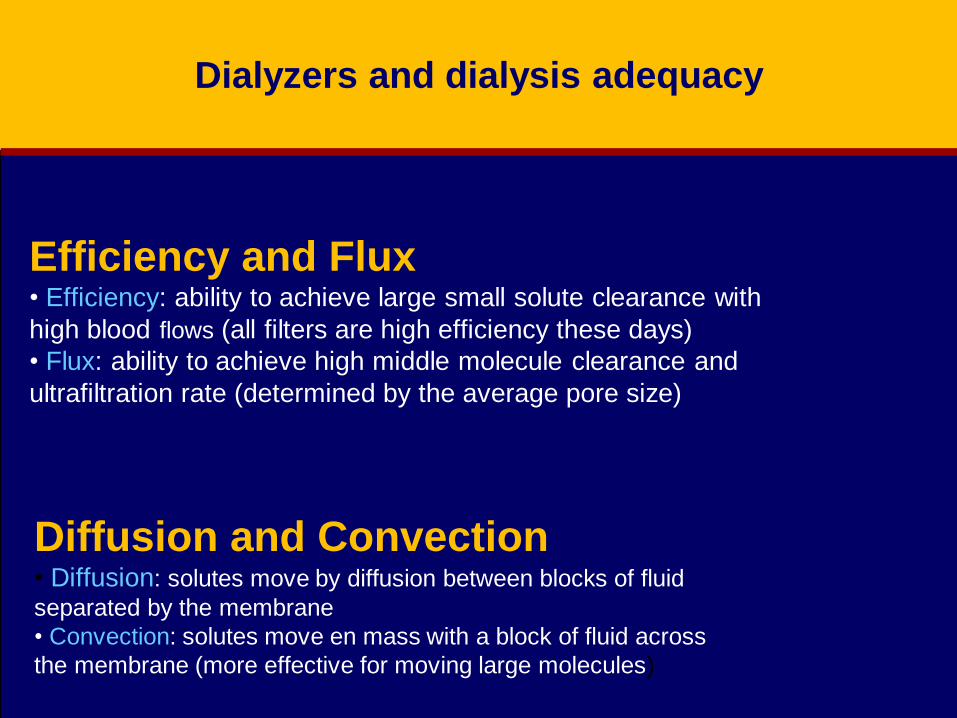
Dialyzers and dialysis adequacy
Efficiency and Flux• Efficiency: ability to achieve large small solute clearance with
high blood flows (all filters are high efficiency these days)
• Flux: ability to achieve high middle molecule clearance and
ultrafiltration rate (determined by the average pore size)
Diffusion and Convection• Diffusion: solutes move by diffusion between blocks of fluid
separated by the membrane
• Convection: solutes move en mass with a block of fluid across
the membrane (more effective for moving large molecules)