Embed Size (px)
Citation preview
Hematopoiesis
- Daily turnover of blood cells (70 kg human) 1,000,000,000,000 total cells
200,000,000,000 red blood cells 70,000,000,000 neutrophils
- Process of generation of mature blood cells
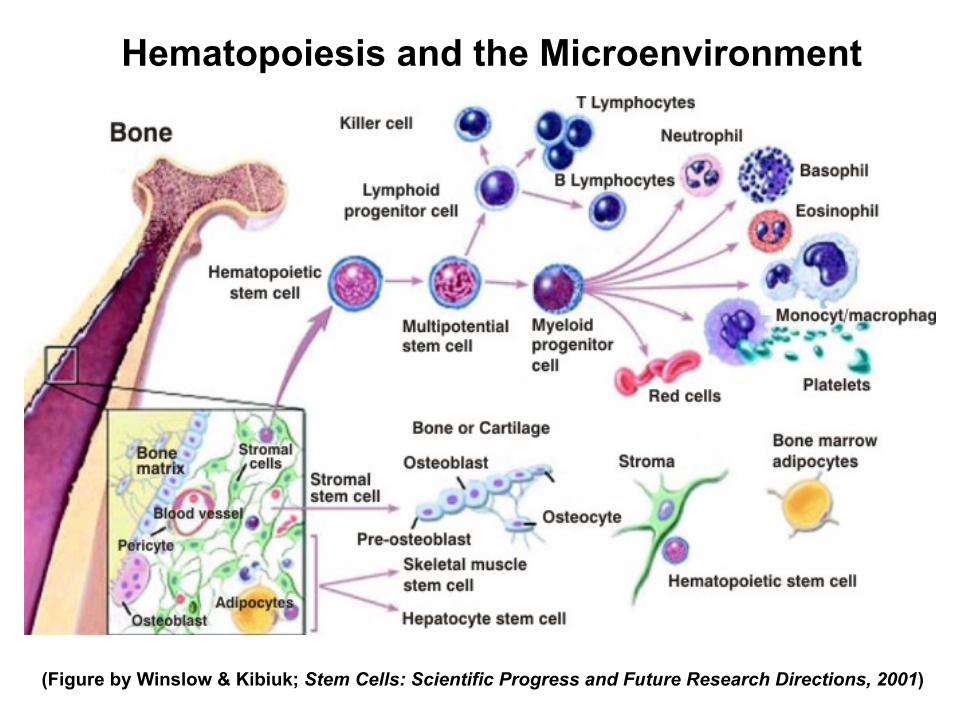
Hematopoiesis and the Microenvironment
(Figure by Winslow & Kibiuk; Stem Cells: Scientific Progress and Future Research Directions, 2001)
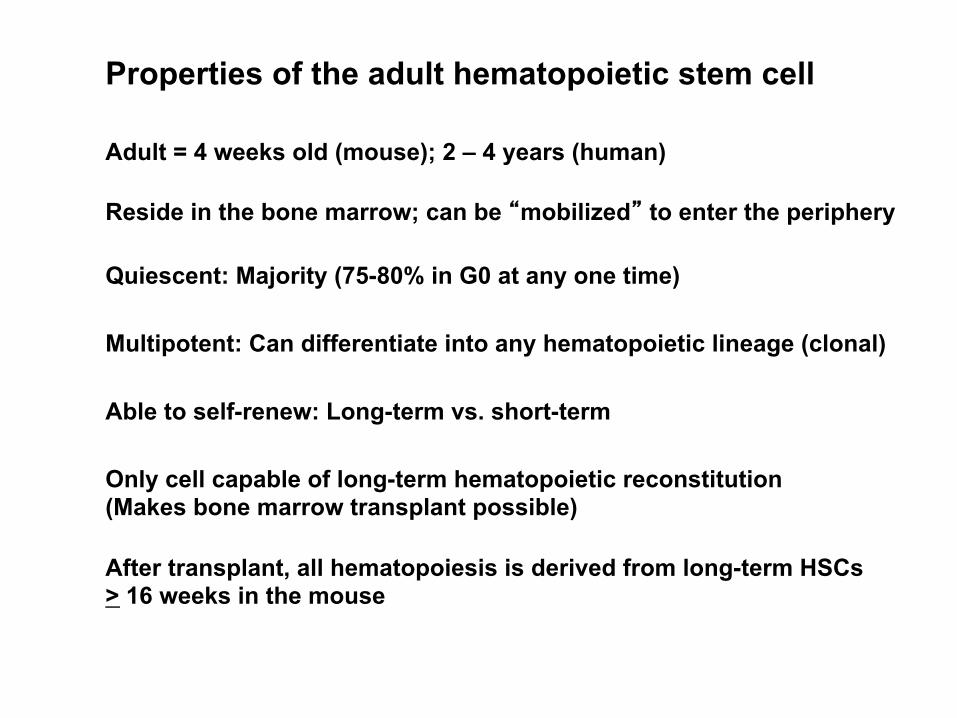
Properties of the adult hematopoietic stem cell
Adult = 4 weeks old (mouse); 2 – 4 years (human)
Quiescent: Majority (75-80% in G0 at any one time)
Multipotent: Can differentiate into any hematopoietic lineage (clonal)
Able to self-renew: Long-term vs. short-term
Only cell capable of long-term hematopoietic reconstitution (Makes bone marrow transplant possible)
After transplant, all hematopoiesis is derived from long-term HSCs > 16 weeks in the mouse
Reside in the bone marrow; can be “mobilized” to enter the periphery
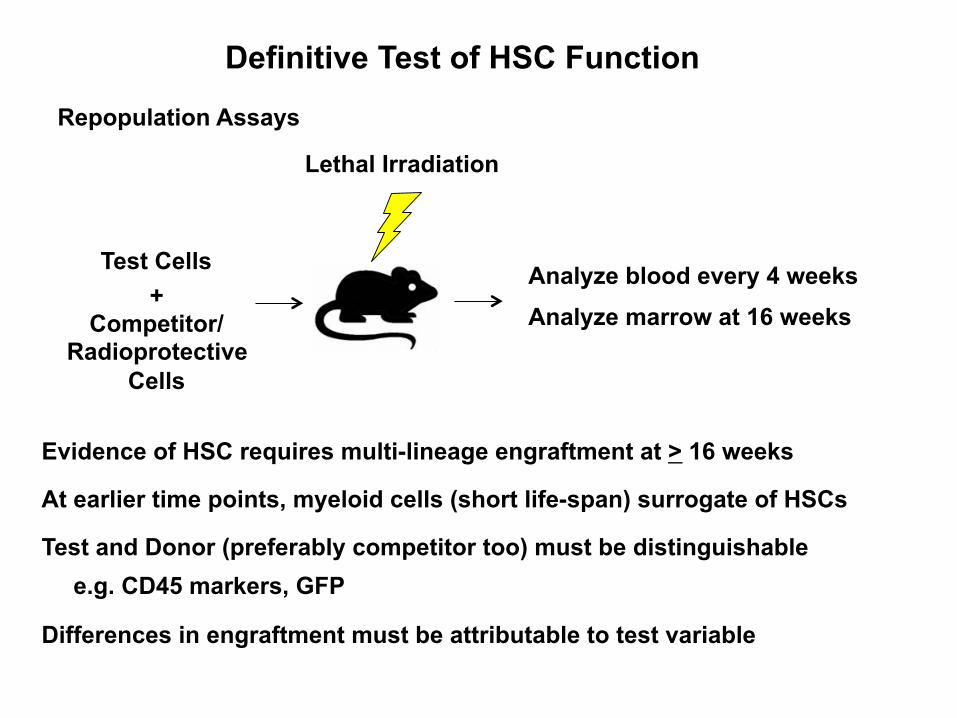
Definitive Test of HSC Function
Repopulation Assays
Test Cells +
Competitor/ Radioprotective
Cells
Test and Donor (preferably competitor too) must be distinguishable e.g. CD45 markers, GFP
Differences in engraftment must be attributable to test variable
Lethal Irradiation
Analyze blood every 4 weeks Analyze marrow at 16 weeks
Evidence of HSC requires multi-lineage engraftment at > 16 weeks
At earlier time points, myeloid cells (short life-span) surrogate of HSCs
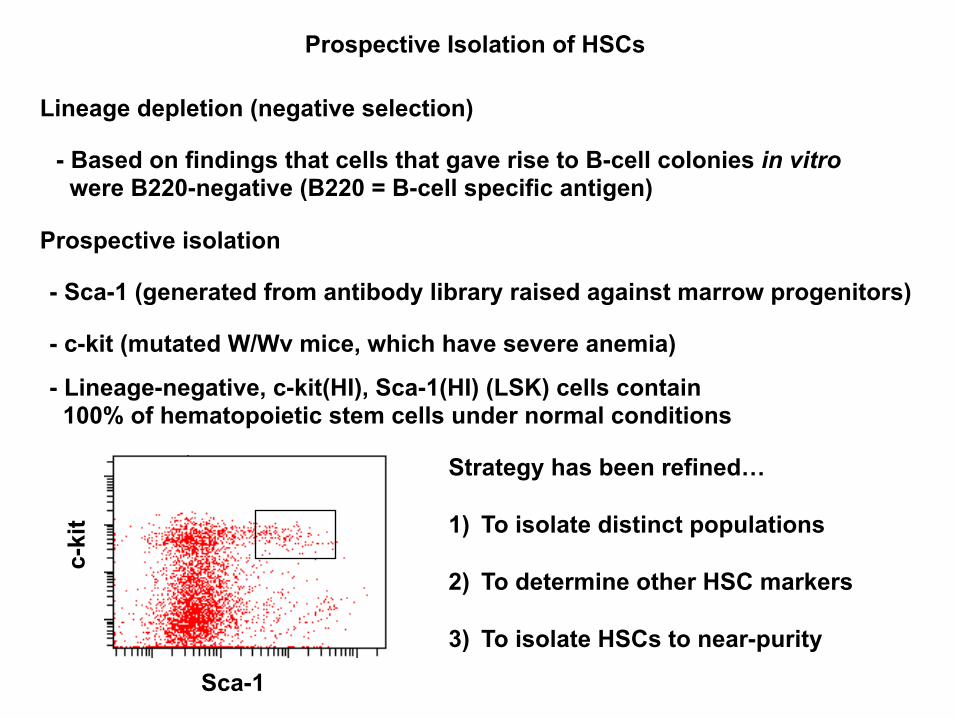
Lineage depletion (negative selection)
- Based on findings that cells that gave rise to B-cell colonies in vitro were B220-negative (B220 = B-cell specific antigen)
Prospective isolation
- Sca-1 (generated from antibody library raised against marrow progenitors)
- c-kit (mutated W/Wv mice, which have severe anemia)
- Lineage-negative, c-kit(HI), Sca-1(HI) (LSK) cells contain 100% of hematopoietic stem cells under normal conditions
c-ki
t
Sca-1
Prospective Isolation of HSCs
Strategy has been refined… 1) To isolate distinct populations
2) To determine other HSC markers
3) To isolate HSCs to near-purity
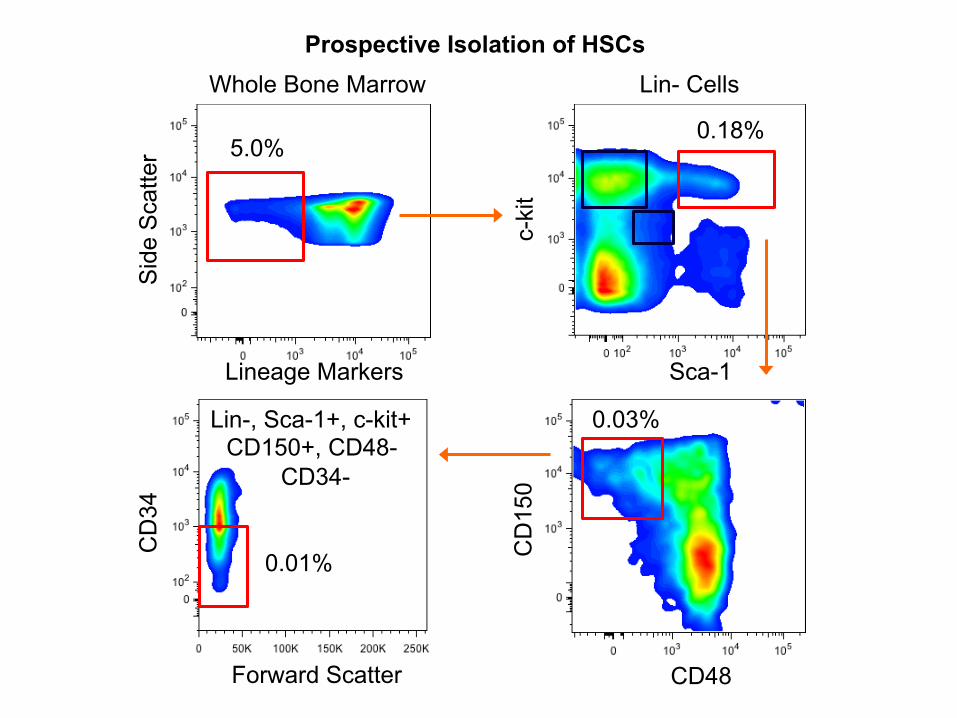
Whole Bone Marrow
Sid
e S
catte
r
Lineage Markers
5.0%
Lin- Cells
c-ki
t
Sca-1
0.18%
CD
150
CD48
0.03%
CD
34
Forward Scatter
Lin-, Sca-1+, c-kit+ CD150+, CD48-
0.01%
CD34-
Prospective Isolation of HSCs
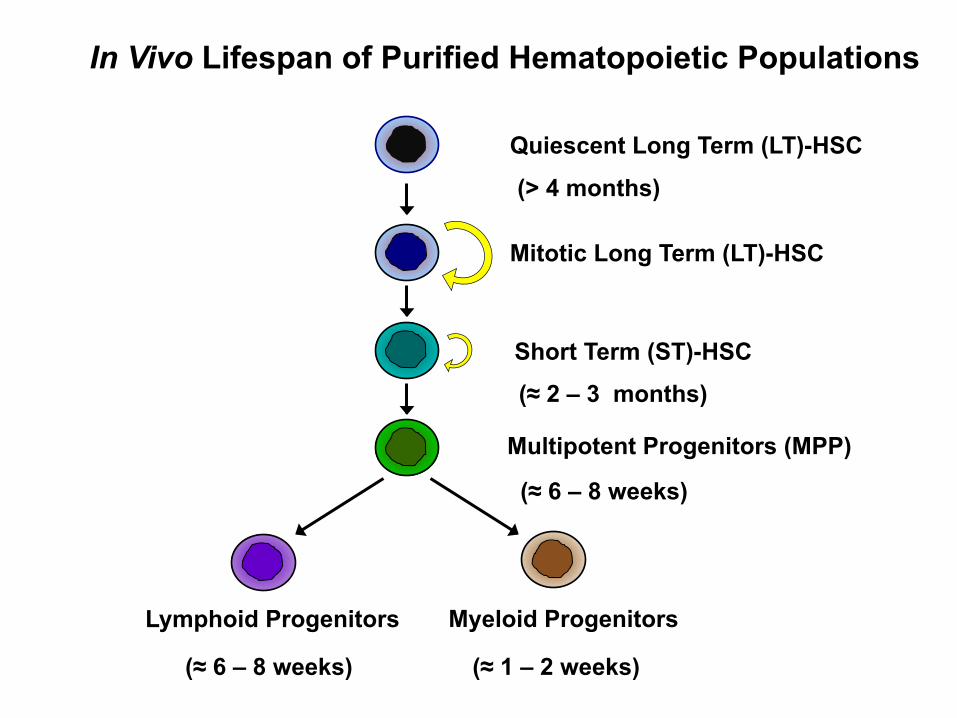
In Vivo Lifespan of Purified Hematopoietic Populations
Multipotent Progenitors (MPP)
Lymphoid Progenitors Myeloid Progenitors
Mitotic Long Term (LT)-HSC
Short Term (ST)-HSC
Quiescent Long Term (LT)-HSC
(> 4 months)
(≈ 2 – 3 months)
(≈ 6 – 8 weeks)
(≈ 6 – 8 weeks) (≈ 1 – 2 weeks)
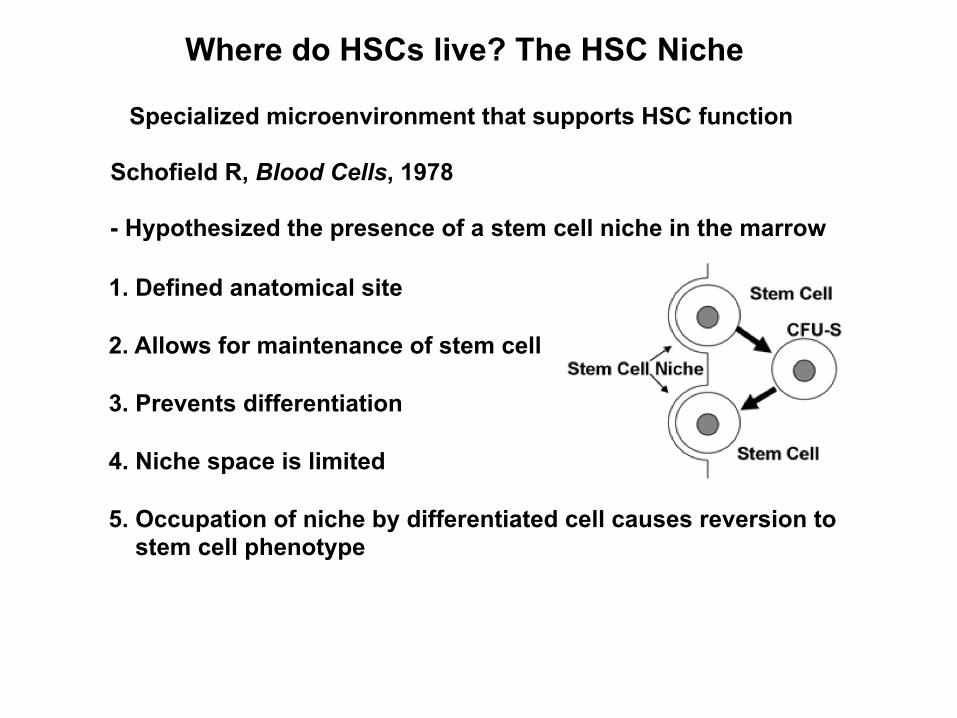
Where do HSCs live? The HSC Niche
Schofield R, Blood Cells, 1978
- Hypothesized the presence of a stem cell niche in the marrow
1. Defined anatomical site
2. Allows for maintenance of stem cell
3. Prevents differentiation
4. Niche space is limited
5. Occupation of niche by differentiated cell causes reversion to stem cell phenotype
Specialized microenvironment that supports HSC function
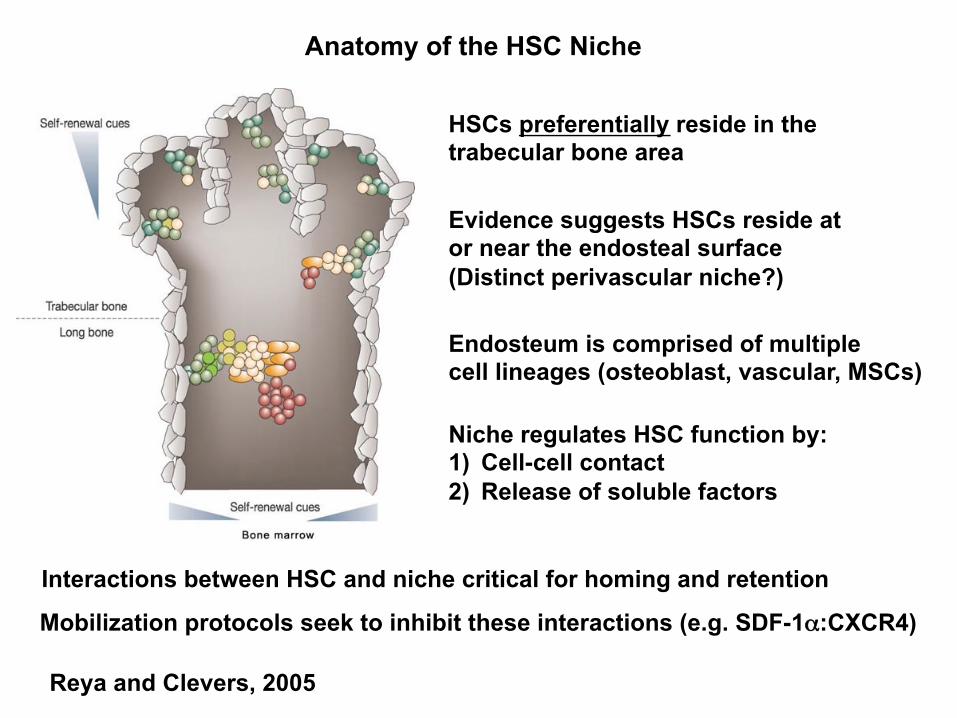
Anatomy of the HSC Niche
HSCs preferentially reside in the trabecular bone area
Evidence suggests HSCs reside at or near the endosteal surface (Distinct perivascular niche?)
Endosteum is comprised of multiple cell lineages (osteoblast, vascular, MSCs)
Niche regulates HSC function by: 1) Cell-cell contact 2) Release of soluble factors
Interactions between HSC and niche critical for homing and retention
Mobilization protocols seek to inhibit these interactions (e.g. SDF-1α:CXCR4)
Reya and Clevers, 2005
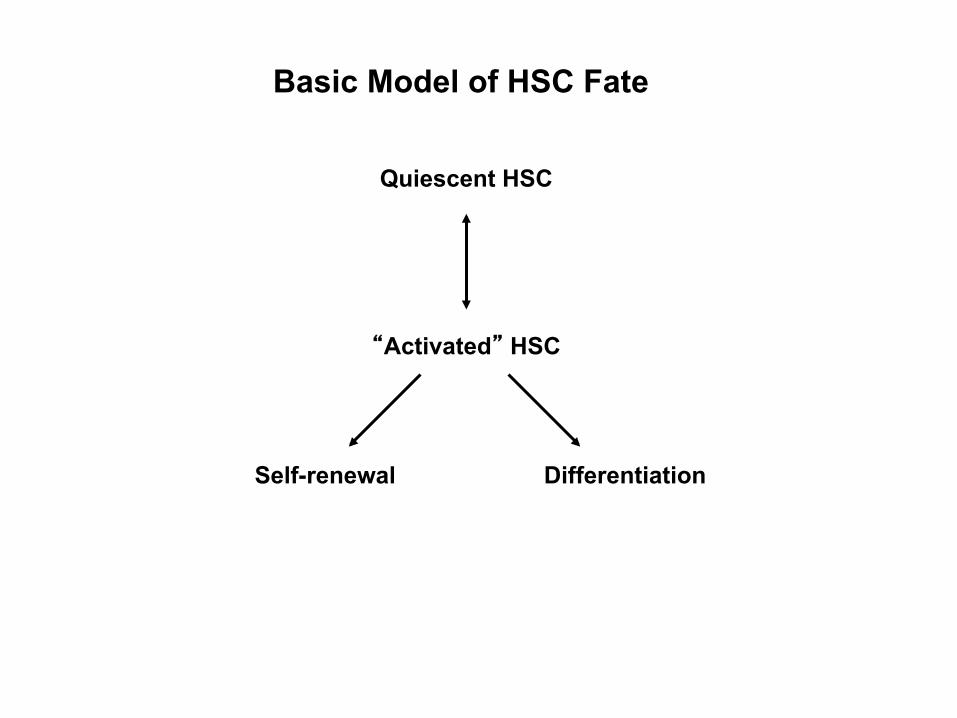
Quiescent HSC
“Activated” HSC
Self-renewal Differentiation
Basic Model of HSC Fate
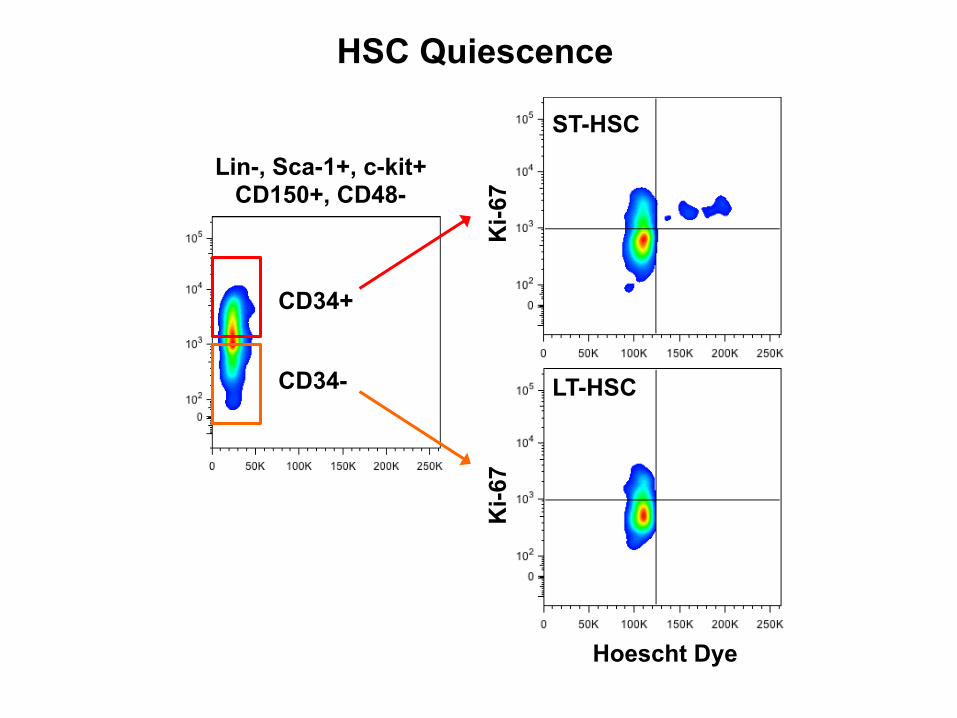
CD34-
Ki-6
7
Hoescht Dye
Ki-6
7
CD34+
Lin-, Sca-1+, c-kit+ CD150+, CD48-
22.6% 5.12%
72.2%
22.1% 0.42%
78.5%
HSC Quiescence
LT-HSC
ST-HSC
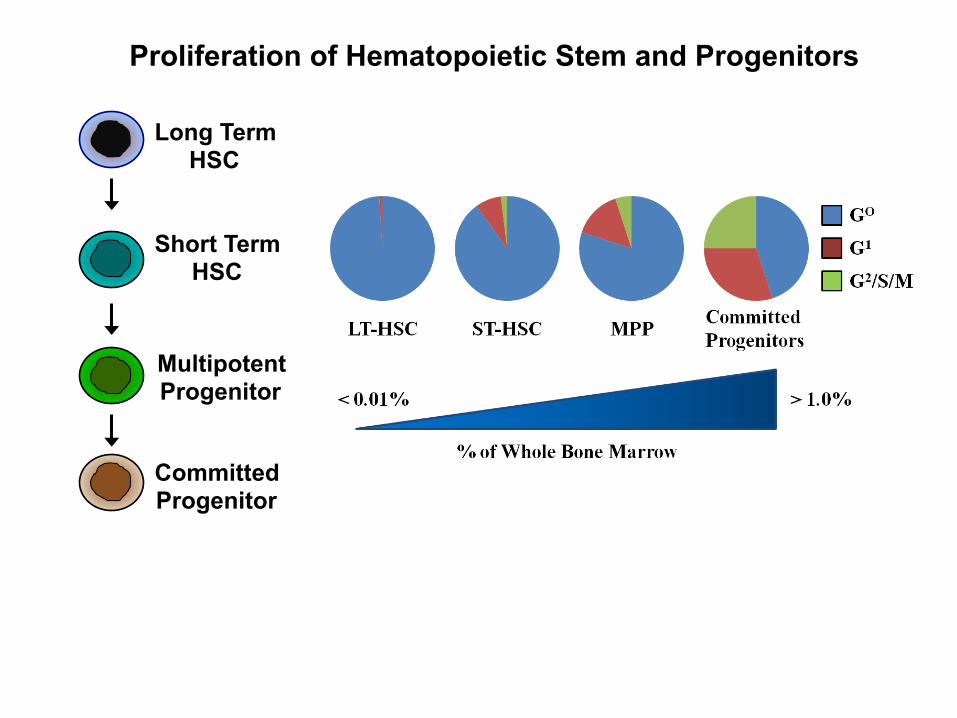
Proliferation of Hematopoietic Stem and Progenitors
Multipotent Progenitor
Short Term HSC
Long Term HSC
Committed Progenitor
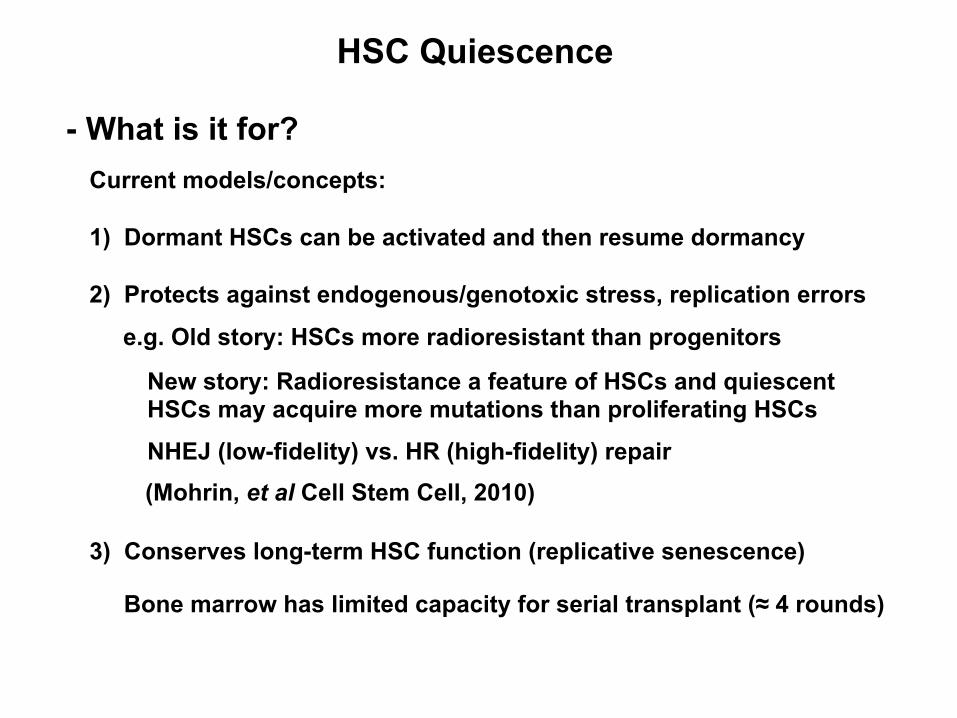
HSC Quiescence
- What is it for? Current models/concepts: 1) Dormant HSCs can be activated and then resume dormancy 2) Protects against endogenous/genotoxic stress, replication errors
e.g. Old story: HSCs more radioresistant than progenitors
NHEJ (low-fidelity) vs. HR (high-fidelity) repair
New story: Radioresistance a feature of HSCs and quiescent HSCs may acquire more mutations than proliferating HSCs
3) Conserves long-term HSC function (replicative senescence)
(Mohrin, et al Cell Stem Cell, 2010)
Bone marrow has limited capacity for serial transplant (≈ 4 rounds)
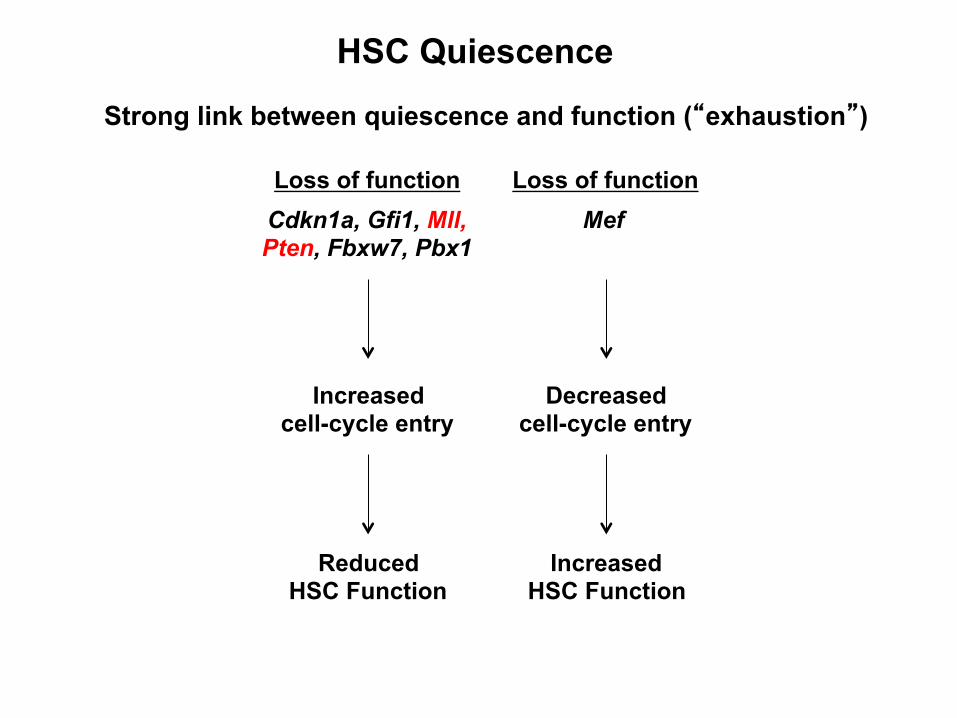
HSC Quiescence
Strong link between quiescence and function (“exhaustion”)
Loss of function Cdkn1a, Gfi1, Mll, Pten, Fbxw7, Pbx1
Increased cell-cycle entry
Reduced HSC Function
Loss of function Mef
Decreased cell-cycle entry
Increased HSC Function
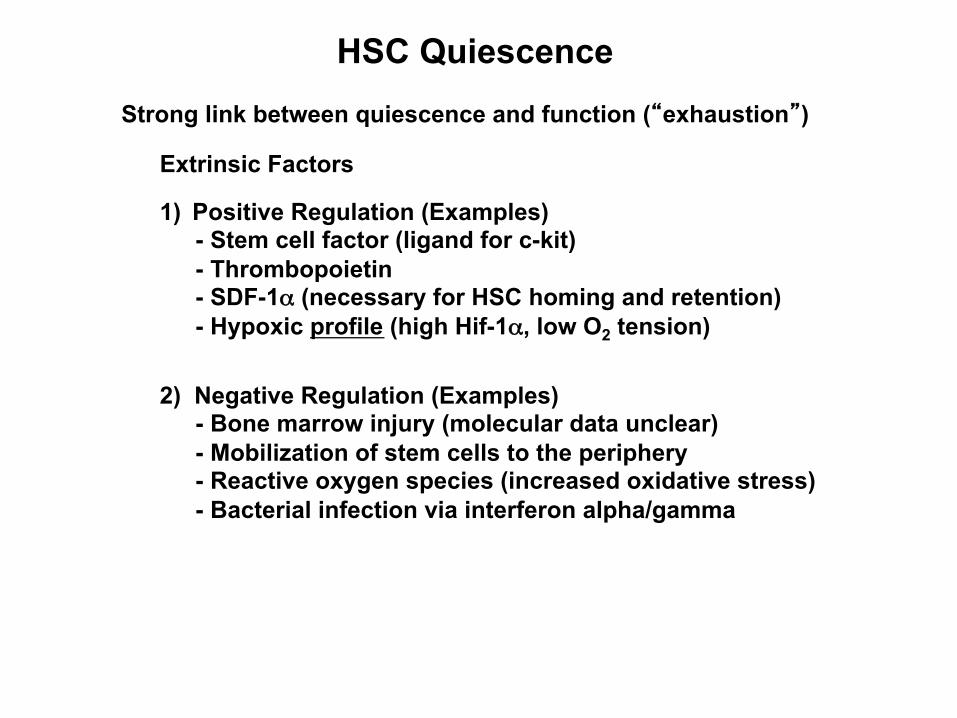
HSC Quiescence
1) Positive Regulation (Examples) - Stem cell factor (ligand for c-kit) - Thrombopoietin - SDF-1α (necessary for HSC homing and retention) - Hypoxic profile (high Hif-1α, low O2 tension)
Extrinsic Factors
2) Negative Regulation (Examples) - Bone marrow injury (molecular data unclear) - Mobilization of stem cells to the periphery - Reactive oxygen species (increased oxidative stress) - Bacterial infection via interferon alpha/gamma
Strong link between quiescence and function (“exhaustion”)
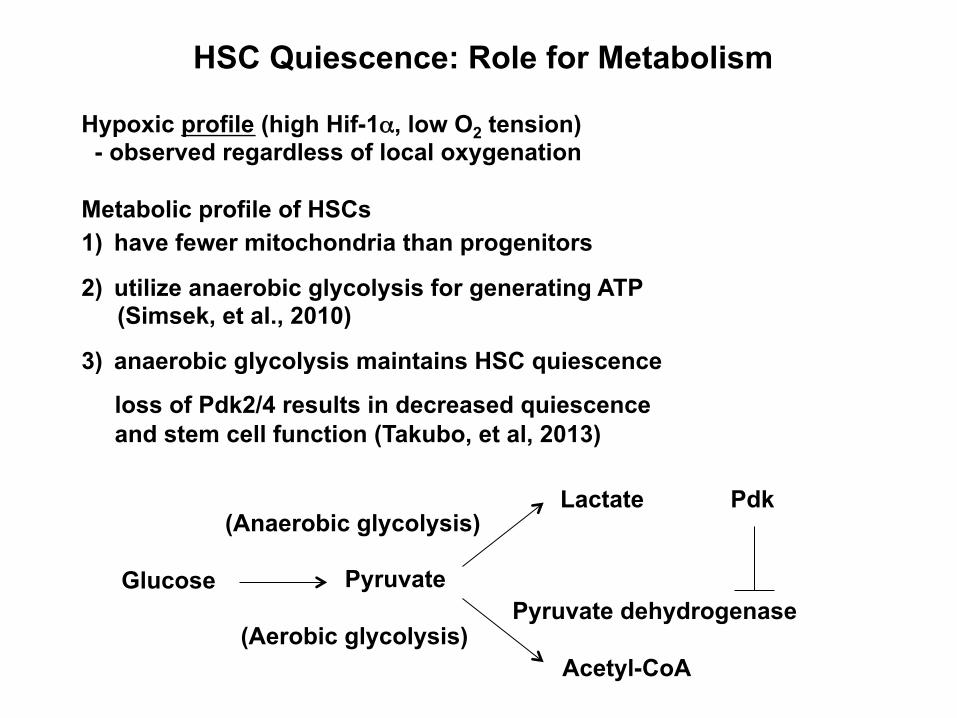
HSC Quiescence: Role for Metabolism
Hypoxic profile (high Hif-1α, low O2 tension) - observed regardless of local oxygenation Metabolic profile of HSCs 1) have fewer mitochondria than progenitors
2) utilize anaerobic glycolysis for generating ATP (Simsek, et al., 2010)
3) anaerobic glycolysis maintains HSC quiescence
loss of Pdk2/4 results in decreased quiescence and stem cell function (Takubo, et al, 2013)
Glucose Pyruvate
Lactate
Acetyl-CoA
(Anaerobic glycolysis)
(Aerobic glycolysis) Pyruvate dehydrogenase
Pdk
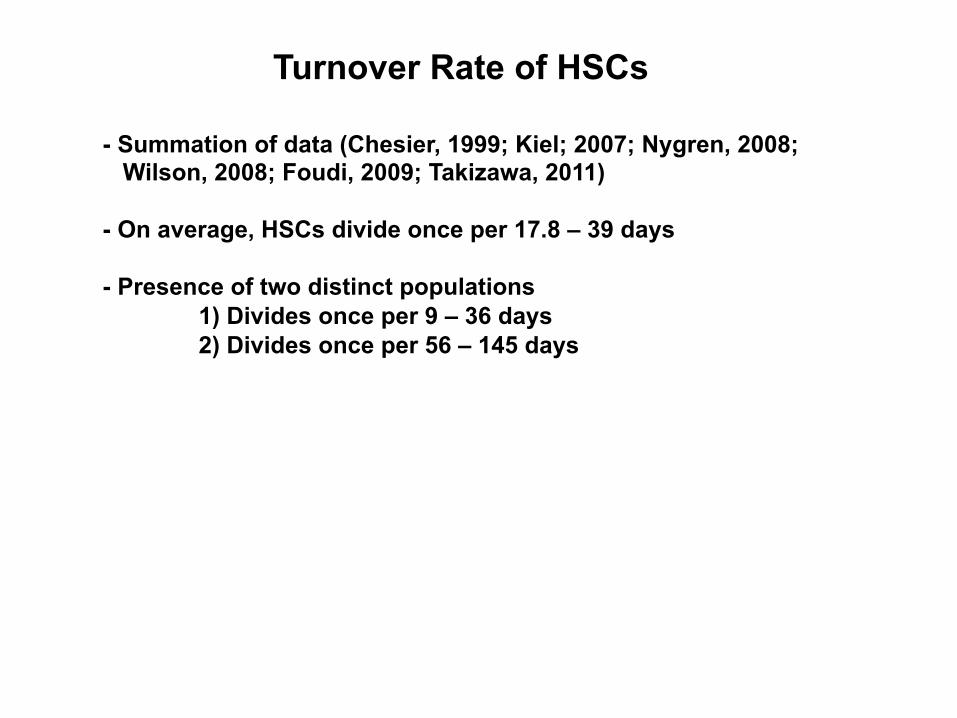
Turnover Rate of HSCs
- Summation of data (Chesier, 1999; Kiel; 2007; Nygren, 2008; Wilson, 2008; Foudi, 2009; Takizawa, 2011) - On average, HSCs divide once per 17.8 – 39 days - Presence of two distinct populations
1) Divides once per 9 – 36 days 2) Divides once per 56 – 145 days
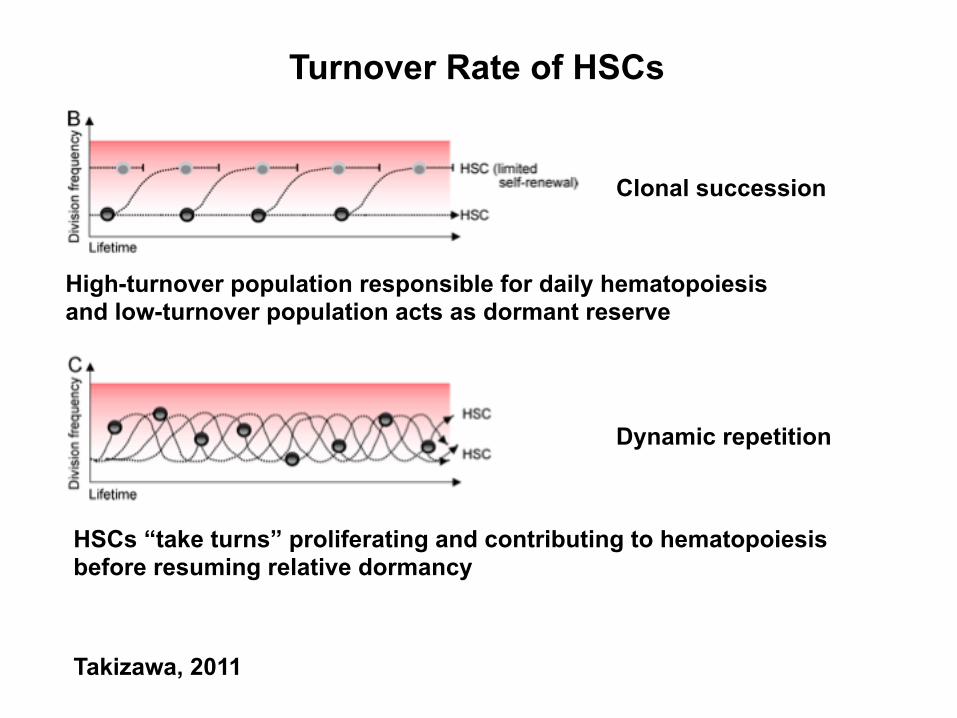
Turnover Rate of HSCs
Takizawa, 2011
Clonal succession
Dynamic repetition
High-turnover population responsible for daily hematopoiesis and low-turnover population acts as dormant reserve
HSCs “take turns” proliferating and contributing to hematopoiesis before resuming relative dormancy
HSC Self-Renewal and Differentiation
How does an HSC decide to self-renew or differentiate?
- Self-Renewal: a process by which a mitotic HSC generates daughter cell(s) that retain the parent stem cell phenotype
Processes active or passive? Instructive or stochastic?
How do HSCs decide their lineage fate?
Zon, 2008
- Self-renewal is an intrinsic process that is influenced by environment
- Switch between self-renewal and differentiation regulated by competition between transcription factors
How does an HSC decide to self-renew or differentiate?
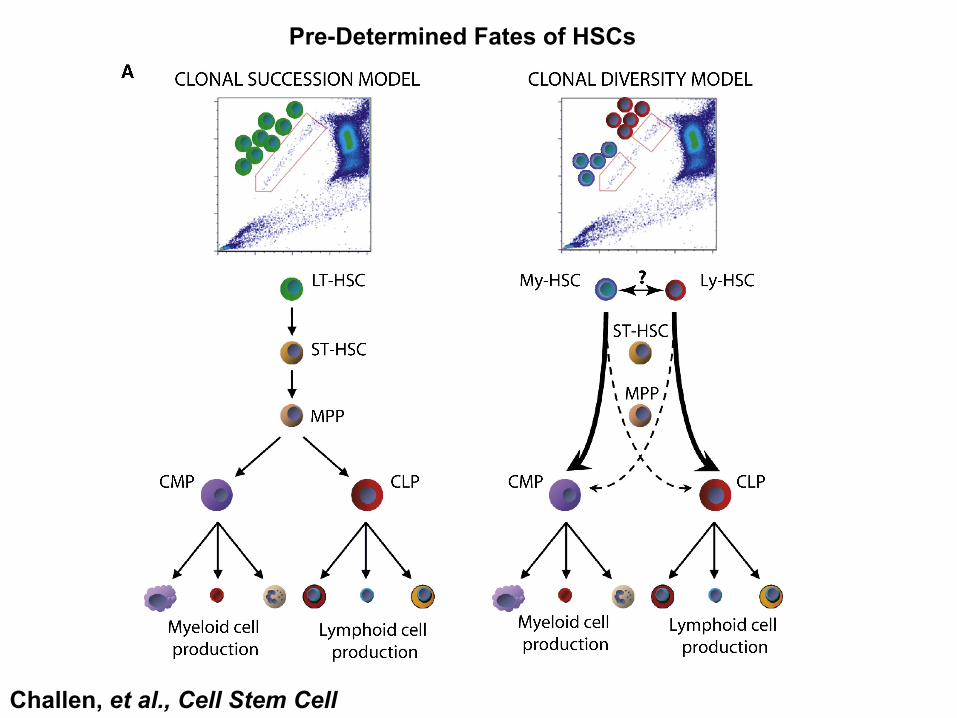
Pre-Determined Fates of HSCs
Challen, et al., Cell Stem Cell
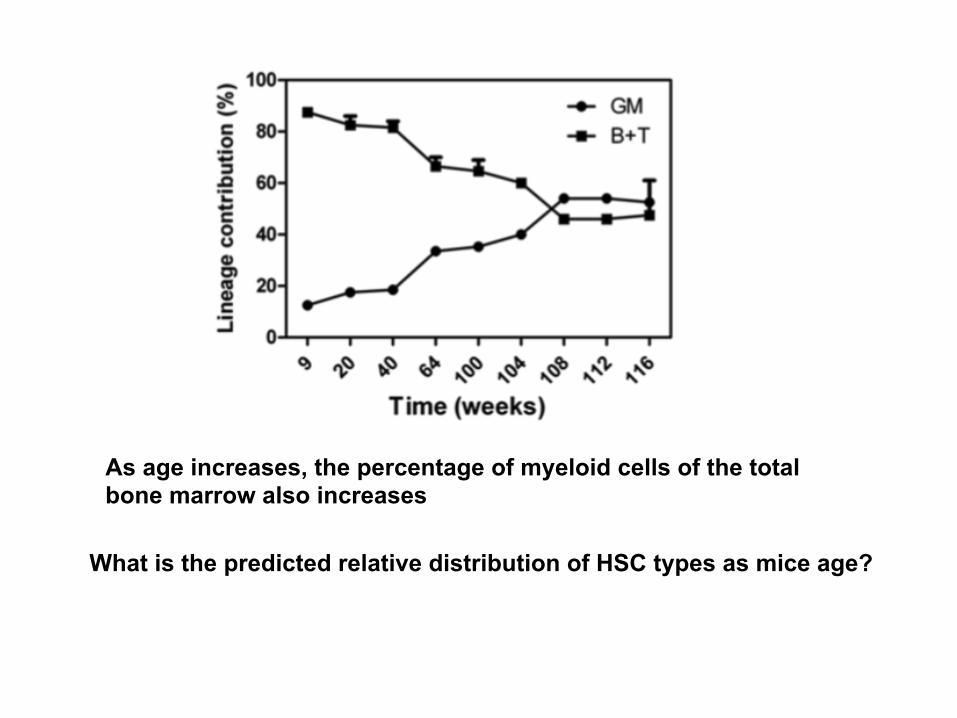
As age increases, the percentage of myeloid cells of the total bone marrow also increases
What is the predicted relative distribution of HSC types as mice age?
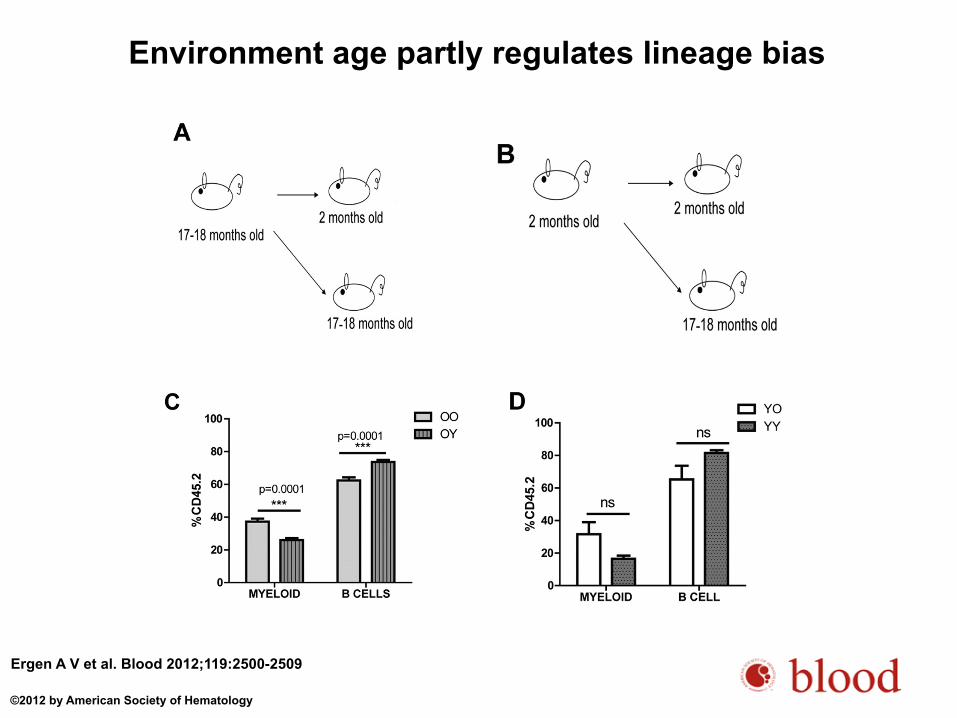
Environment age partly regulates lineage bias
Ergen A V et al. Blood 2012;119:2500-2509
©2012 by American Society of Hematology
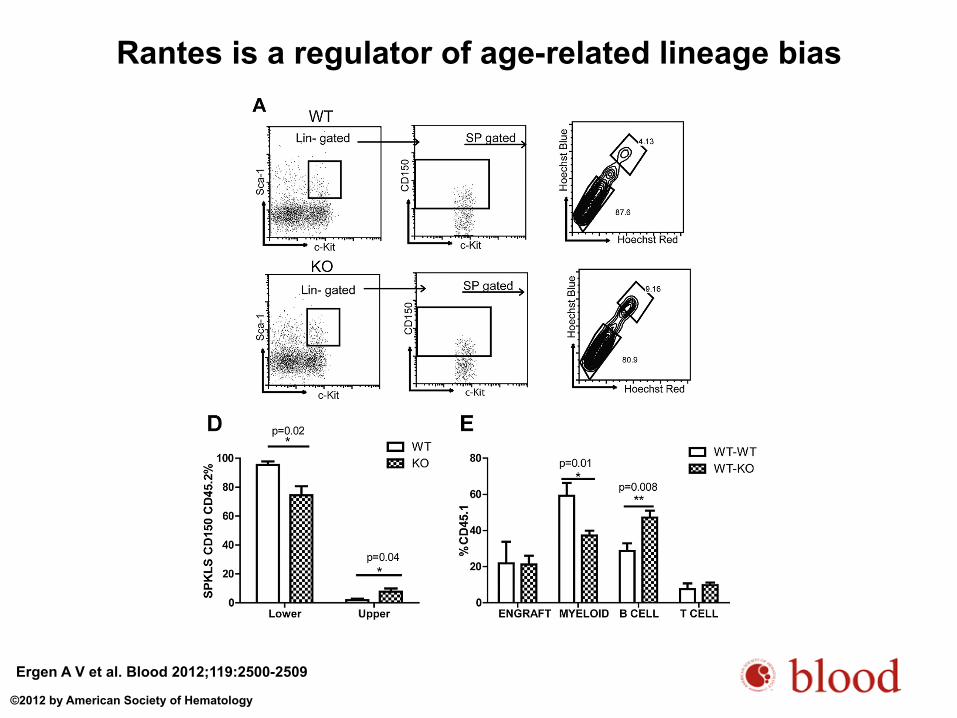
Rantes is a regulator of age-related lineage bias
Ergen A V et al. Blood 2012;119:2500-2509
©2012 by American Society of Hematology
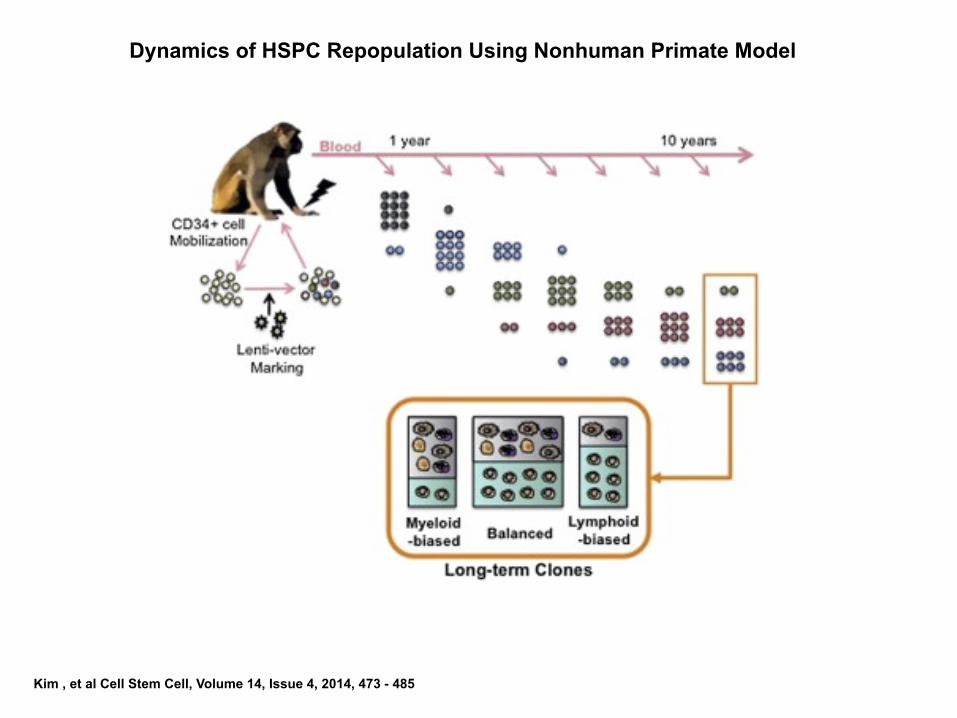
Kim , et al Cell Stem Cell, Volume 14, Issue 4, 2014, 473 - 485
Dynamics of HSPC Repopulation Using Nonhuman Primate Model
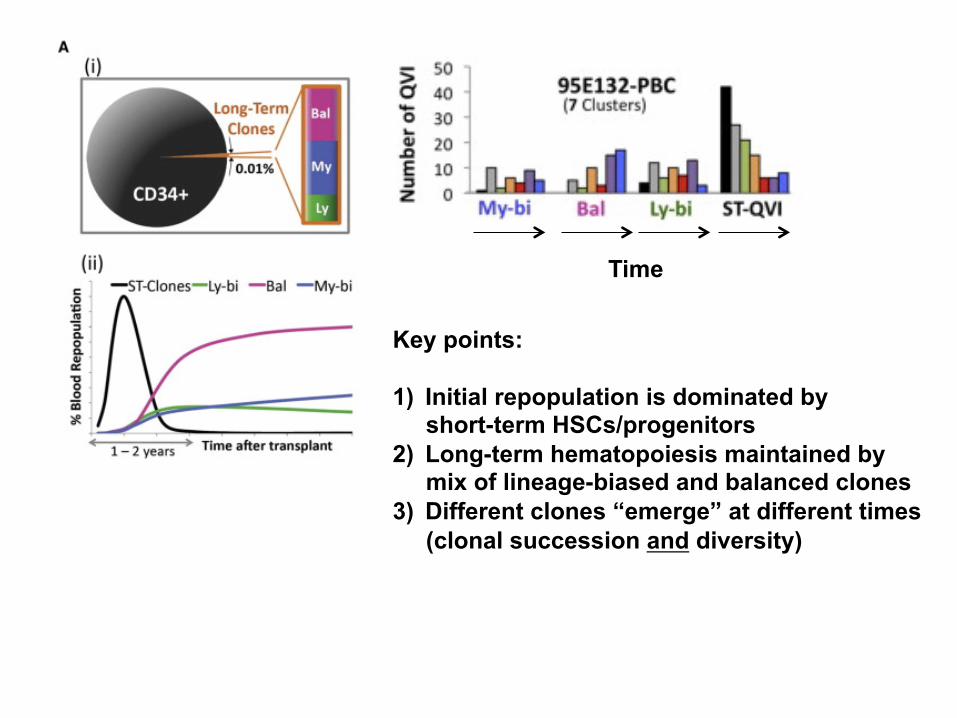
Time
Key points: 1) Initial repopulation is dominated by short-term HSCs/progenitors 2) Long-term hematopoiesis maintained by mix of lineage-biased and balanced clones 3) Different clones “emerge” at different times (clonal succession and diversity)
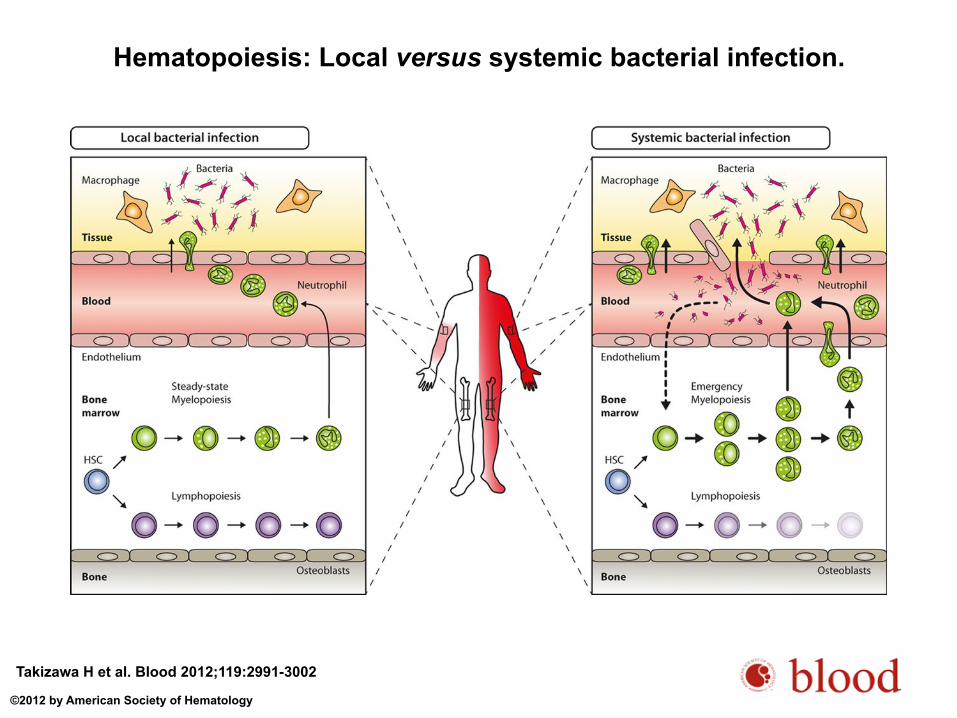
Hematopoiesis: Local versus systemic bacterial infection.
Takizawa H et al. Blood 2012;119:2991-3002
©2012 by American Society of Hematology
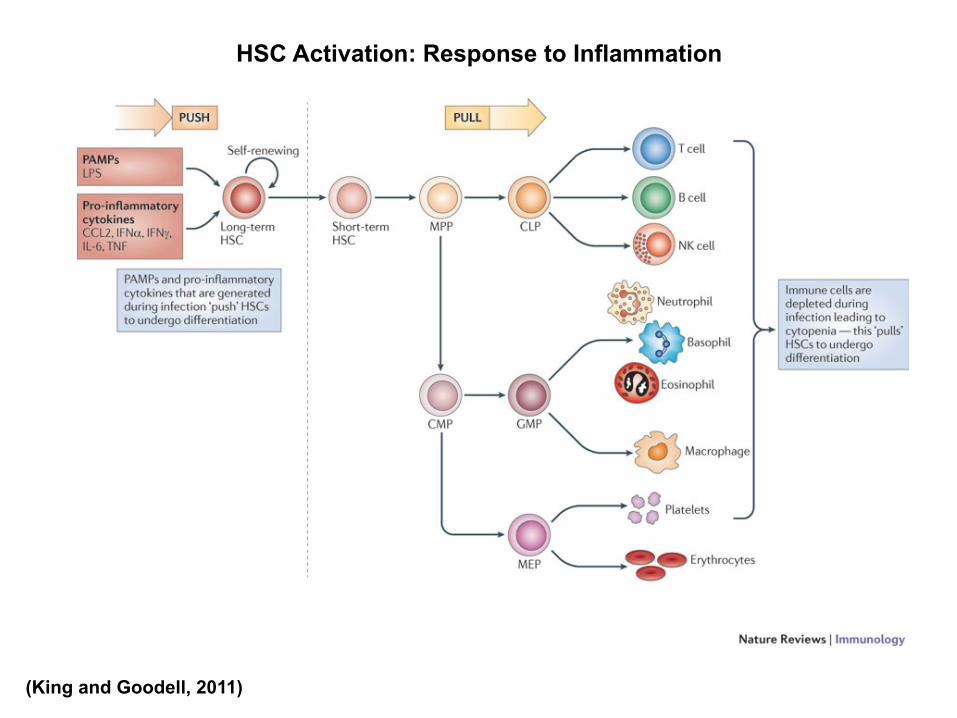
HSC Activation: Response to Inflammation
(King and Goodell, 2011)
MPP
Lymphoid Progenitors
Myeloid Progenitors
Mitotic LT-HSC
Quiescent LT-HSC
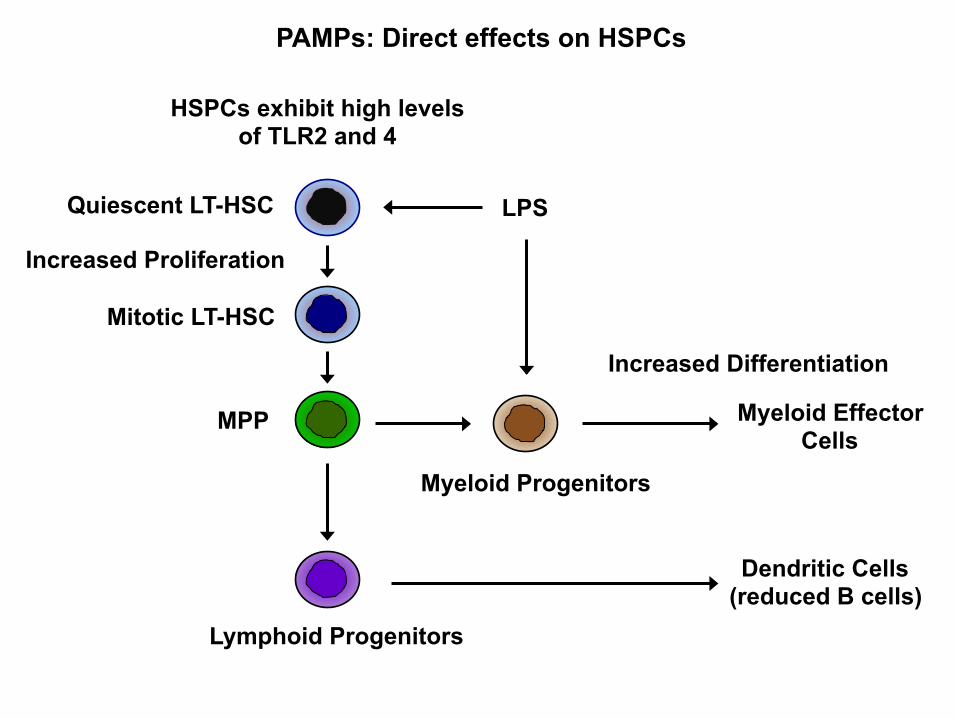
PAMPs: Direct effects on HSPCs
HSPCs exhibit high levels of TLR2 and 4
Myeloid Effector Cells
Dendritic Cells (reduced B cells)
LPS
Increased Proliferation
Increased Differentiation
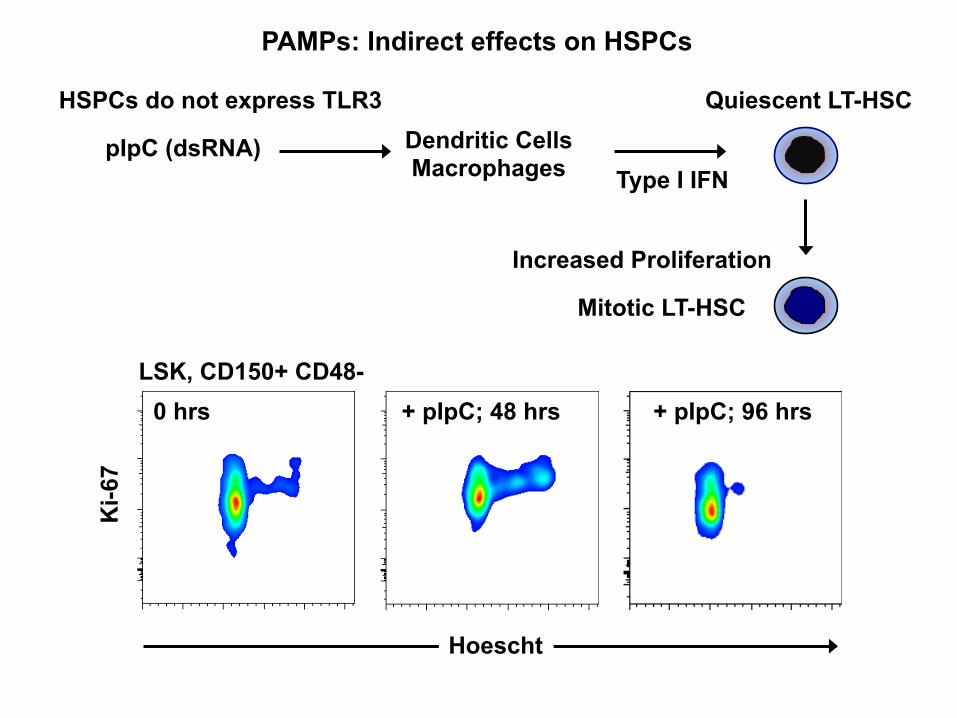
PAMPs: Indirect effects on HSPCs
Mitotic LT-HSC
Quiescent LT-HSC HSPCs do not express TLR3 Dendritic Cells Macrophages
pIpC (dsRNA) Type I IFN
Increased Proliferation
LSK, CD150+ CD48- 0 hrs + pIpC; 48 hrs + pIpC; 96 hrs
Ki-6
7
Hoescht
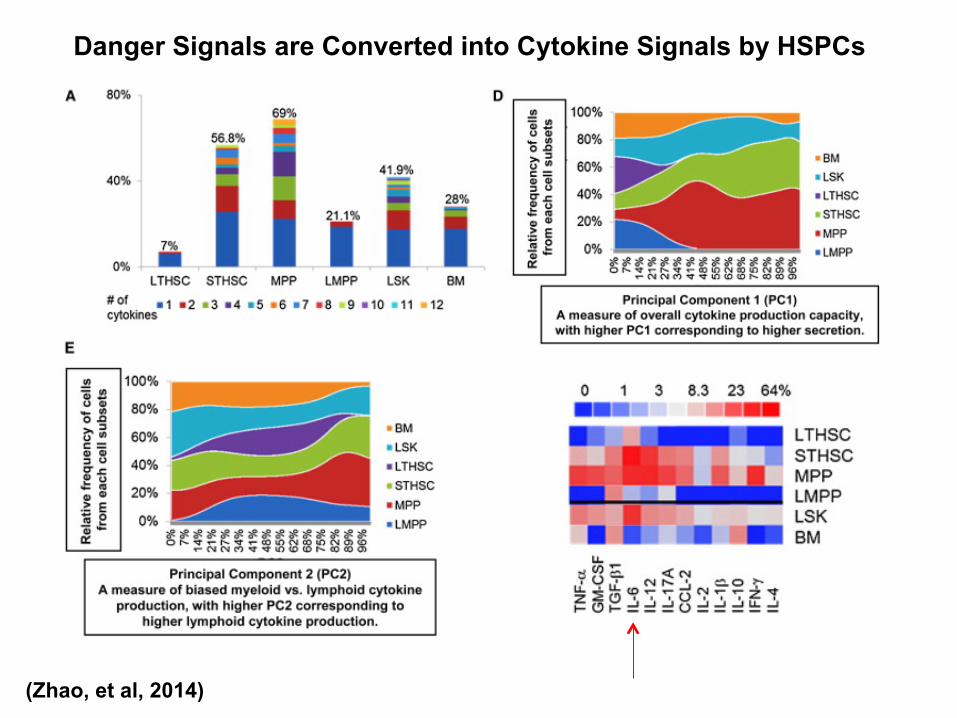
(Zhao, et al, 2014)
Danger Signals are Converted into Cytokine Signals by HSPCs
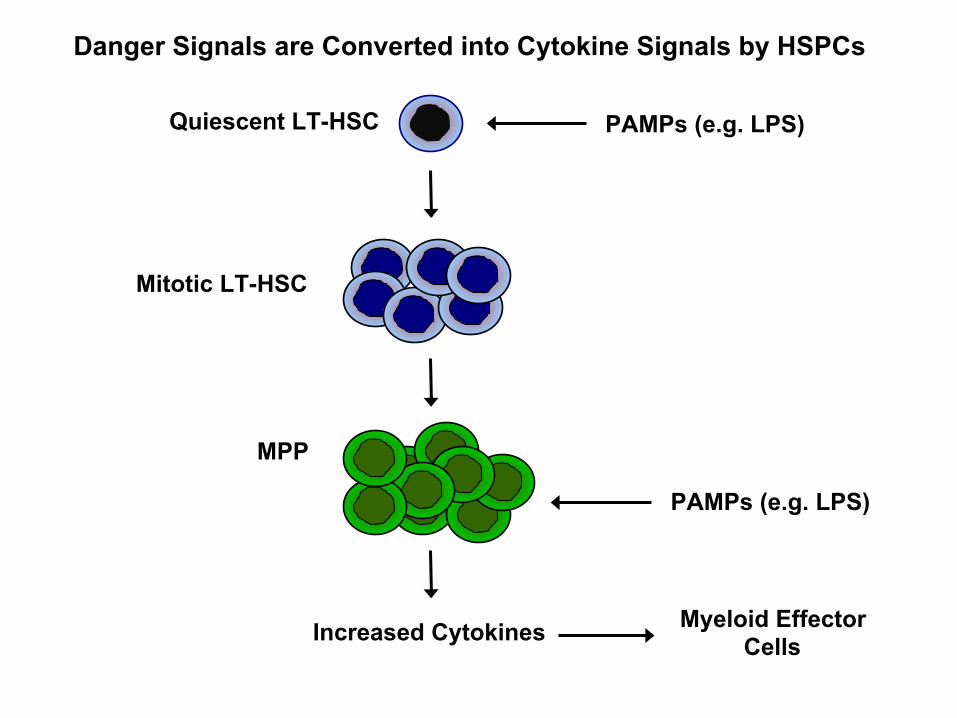
MPP
Increased Cytokines
Mitotic LT-HSC
Quiescent LT-HSC
Myeloid Effector Cells
PAMPs (e.g. LPS)
Danger Signals are Converted into Cytokine Signals by HSPCs
PAMPs (e.g. LPS)