Embed Size (px)
Citation preview
HEMAS HOLDINGS PLC
AN
NU
AL R
EPO
RT
20
16
/20
17
INTERIM REPORT Q1 - 2017/18
ENGAGE. EMPOWER.
WWW.HEMAS.COM WWW.HEMAS.COM
HEMAS HOLDINGS PLC
Hemas House,75, Braybrooke Place,Colombo 02,Sri Lanka
E : [email protected] : (+9411) 4731731F : (+9411) 2332889 (+9411) 4731777
HEM
AS H
OLD
ING
S PLC
EN
GA
GE
. E
MP
OW
ER
.

1
CEO’s Review
Hemas Holdings PLC (HHL) and its subsidiaries achieved a consolidated revenue of Rs.11.4Bn; a year-on-
year (YoY) growth of 14.9%, whilst earnings were stable at Rs.694.2Mn. Our healthcare sector was the
main contributor to growth during the quarter. Operating profit reached Rs.865.7Mn, a de-growth of
4.6%. The key factors that influenced the decline in profitability were subdued consumer spending
resulting from increased inflation and VAT, flooding and landslides in Sri Lanka and exchange rate
depreciation. In addition, headwinds faced in our Bangladesh operation and losses incurred at Leisure,
Travel and Aviation (LTA) segment also impacted our profitability.
Our consumer business recorded a revenue of Rs.4.2Bn for the first three months ending June 30, 2017,
a decline of 1.5% YoY. Operating profits were Rs.526.4M 17.3% YoY de-growth, whilst PAT Rs.425.3Mn, a
fall of 17.1%. Despite the challenging domestic macro environment, our Sri Lanka business reported
steady growth in key personal care categories with market shares being maintained across most major
categories. The decline in revenue and profitability was mainly on account of below par performance in
our Bangladesh operation which was impacted by bad weather conditions during Q1, and the
restructuring of our sales and distribution network. With regard to new markets, we incurred start-up
losses in West Bengal as we commenced operations.
Consolidated healthcare sector revenue for the first three months under review stood at Rs.5.1Bn, a YoY
increase of 18.7% whilst operating profit and PAT grew at 22.4% and 54.3%. Hemas pharmaceutical
distribution operation registered strong revenue growth increasing its market leadership position.
However, managing the impact of price regulation and devaluations in the wake of depreciation of the
rupee was a key operational challenge. As a result, pharmaceutical distribution profitability was negatively
impacted. However, this decline in profitability was mitigated by the strong growth in hospitals. Hospitals
operated at high capacity levels over the quarter in part due to the dengue epidemic.
J. L. Morison posted a revenue of Rs.954.7Mn and PAT of Rs.118.7Mn for the three months ended
June 30, 2017. JLM’s underlying revenue and earnings growth, excluding Agro, which we exited during the
latter part of FY17, was 7.6% and 19.5% respectively. The growth against the previous year was primarily
driven by pharma manufacturing and pharma distribution. The groundbreaking ceremony for JLMs new
manufacturing facility, which will be Sri Lanka’s first EU Good Manufacturing Practices (GMP) compliant
pharmaceutical manufacturing facility, was held in June. Construction will take approximately 24 months.
Our Leisure, Travel and Aviation business recorded a total revenue of Rs.682.1Mn, reflecting a decline of 12.1% YoY for the three months under consideration. During this period, overall arrivals to Sri Lanka witnessed a moderation in growth as a result of the negative publicity and travel warnings due to flooding and landslides in May. Serendib Hotels reported a 2.5% fall in revenue due to decline in average room rates and occupancies across the group. Travel and Aviation segment indicated a growth in revenue of 5.4%. Overall profitability of this segment continued to be below expectations. The fall in segmental profitability during the quarter was compounded by losses at Anantara Peace Haven Tangalle Resort.

2
Hemas Logistics and Maritime recorded revenue growth of 80.8% over last year with revenues of Rs.622.5Mn. This growth has been driven by both our agencies, Evergreen and Far Shipping. During the year, the logistics arm of Hemas showed improved results, mainly driven by the 3PL operations. Construction of our new logistics and container yard facility is ongoing and on track to complete by early FY 2019. Our technology business, N*Able got the year off to a strong start with revenue growth of 405.3% due to
the successful completion of three major projects during the quarter in contrast to its weak start in FY17.
We anticipate a challenging year ahead for our businesses with the recent developments in our macroeconomic context. However, we continue to position ourselves for future growth through investing in new facilities, new personal care categories and new geographies with the aim of achieving strong future growth and higher levels of revenue and profitability.
Steven Enderby
Chief Executive Officer
Colombo 11 August 2017

Hemas Holdings PLC Interim Report 1st Quarter 2017-2018
Consolidated Statement of Profit or LossChange
Rs. '000 30.06.2017 30.06.2016 %
Revenue 11,363,531 9,885,722 14.9
Cost of Sales (7,165,732) (6,123,197) 17.0
Gross Profit 4,197,799 3,762,525 11.6
Other Operating Income 96,512 58,910 63.8
Selling and Distribution Expenses (1,210,311) (1,184,154) 2.2
Administrative Expenses (2,145,823) (1,694,291) 26.7
Share of Results of Joint Ventures & Associates (72,515) (35,272) 105.6
Operating Profit 865,662 907,718 (4.6)
Finance Cost (119,202) (103,791) 14.8
Finance Income 220,185 205,939 6.9
Profit Before Tax 966,645 1,009,866 (4.3)
Income Tax Expenses (289,408) (309,160) (6.4)
Profit for the Period 677,237 700,706 (3.3)
Attributable to:
Equity Holders of the Parent 694,233 696,409 (0.3)
Non-Controlling Interests (16,996) 4,297 (495.5)
677,237 700,706 (3.3)
Earnings Per Share (Rs.) 1.21 1.22
Annualised Earnings Per Share (Rs.) 4.85 4.88
Diluted Earnings Per Share (Rs.) 1.21 1.22
Dividend per share (Rs.) - -
Consolidated Statement of Comprehensive Income
Rs. '000 30.06.2017 30.06.2016
Profit for the period 677,237 700,706
Other Comprehensive Income
Other Comprehensive Income to be reclassified to Profit or Loss in
subsequent periods
Net Gain/(Loss) on Available-for-Sale Financial Assets 118 (3)
Net Movement on Cash Flow Hedges (15,249) 12,092
Exchange Differences on Translation of Foreign Operations 2,336 4,026
Other Comprehensive Income for the Period, Net of Tax (12,795) 16,115
Total Comprehensive Income for the Period, Net of Tax 664,442 716,821
Attributable to:
Equity Holders of the Parent 691,575 706,125
Non-Controlling Interests (27,133) 10,696
664,442 716,821
The above figures are provisional and subject to audit.
3
Three Months Ended
Three Months Ended

Hemas Holdings PLC Interim Report 1st Quarter 2017-2018
Consolidated Statement of Financial Position
As at
Rs. '000 30.06.2017 30.06.2016 31.03.2017
Non-Current Assets
Property, Plant and Equipment 13,572,782 12,713,151 13,525,589
Investment Properties 1,472,928 1,735,780 1,472,928
Leasehold Rights 820,885 114,211 828,405
Intangible Assets 934,214 843,130 954,060
Investment in Joint Ventures 1,035,664 1,259,257 1,102,479
Investment in Associates 1,030 - 1,636
Other Non Current Financial Assets 865,954 778,686 907,207
Deferred Tax Asset 61,032 50,573 57,400
18,764,489 17,494,788 18,849,704
Current Assets
Inventories 6,284,698 5,488,520 6,288,357
Trade and Other Receivables 10,093,438 8,218,110 9,904,009
Tax Recoverable 277,457 105,332 181,104
Other Current Financial Assets 123,348 86,256 103,377
Cash and Short Term Deposits 10,974,772 11,917,589 11,992,000
27,753,713 25,815,807 28,468,847
Total Assets 46,518,202 43,310,595 47,318,551
Equity
Stated Capital 5,798,319 5,722,837 5,741,038
Other Capital and Revenue Reserves 108,781 66,897 104,938
Other Components of Equity 2,155,399 2,032,360 2,158,057
Retained Earnings 17,601,451 14,896,936 16,907,218
Equity attributable to equity holders of the parent 25,663,950 22,719,030 24,911,251
Non-Controlling Interests 3,186,211 2,615,368 3,217,800
Total Equity 28,850,161 25,334,398 28,129,051
Non-Current Liabilities
Interest Bearing Loans and Borrowings 2,174,399 3,112,536 2,044,817
Other Non Current Financial Liabilities 16,023 4,476 10,178
Deferred Tax Liability 505,612 421,184 490,437
Employee Benefit Liability 691,154 583,154 650,125
3,387,188 4,121,350 3,195,557
Current Liabilities
Trade and Other Payables 10,614,163 10,392,653 12,179,714
Income Tax Payable 615,414 576,273 486,263
Interest Bearing Loans and Borrowings 1,660,624 2,108,739 1,954,903
Bank Overdraft 1,390,652 777,182 1,373,063
14,280,853 13,854,847 15,993,943
Total Equity and Liabilities 46,518,202 43,310,595 47,318,551
Net Asset per share - (Rs.) 44.77 39.68 43.51
The above figures are provisional and subject to audit.
These financial statements are in compliance with the requirements of the Companies Act No. 07 of 2007.
Sanjeewa Samaranayake
Chief Financial Officer
Husein Esufally Steven Enderby
Chairman Chief Executive Officer
Colombo
August 11, 2017 4
The Board of Directors is responsible for the preparation and presentation of these financial statements. Signed for and on behalf of the Board by,

Hemas Holdings PLC Interim Report 1st Quarter 2017-2018
Consolidated Statement of Changes in Equity
Total Non Total
Stated Other Retained Controlling Equity
Capital Capital & Revenue Revaluation Exchange Available for Sale Cash Flow Hedge Earnings Interests
Reserves Reserve Reserve Reserve Reserve
Rs. '000
Balance as at 1 April 2016 5,722,837 58,542 1,986,673 24,814 761 10,396 14,187,670 21,991,693 2,661,619 24,653,312
Profit for the Year - - - - - - 696,409 696,409 4,297 700,706
Other Comprehensive Income - - - 4,026 (3) 5,693 - 9,716 6,399 16,115
Total Comprehensive Income - - - 4,026 (3) 5,693 696,409 706,125 10,696 716,821
Share Based Payments - 8,355 - - - - - 8,355 - 8,355
Adjustment in Respect of Changes In Group Holding - - - - - - 12,857 12,857 (56,947) (44,090)
Balance as at 30 June 2016 5,722,837 66,897 1,986,673 28,840 758 16,089 14,896,936 22,719,030 2,615,368 25,334,398
Balance as at 1 April 2017 5,741,038 104,938 1,961,868 49,407 133,184 13,598 16,907,218 24,911,251 3,217,800 28,129,051
Profit for the Year - - - - - - 694,233 694,233 (16,996) 677,237
Other Comprehensive Income - - - 4,705 102 (7,465) - (2,658) (10,137) (12,795)
Total Comprehensive Income - - - 4,705 102 (7,465) 694,233 691,575 (27,133) 664,442
Dividends Paid - - - - - - - - (4,456) (4,456)
Exercise of Share Option 57,281 - - - - - - 57,281 - 57,281
Share Based Payments - 3,843 - - - - - 3,843 - 3,843
Balance as at 30 June 2017 5,798,319 108,781 1,961,868 54,112 133,286 6,133 17,601,451 25,663,950 3,186,211 28,850,161
5
Attibutable to Equity Holders of the parent
Other Component of Equity

Hemas Holdings PLC Interim Report 1st Quarter 2017-2018
Statement of Profit or Loss
CompanyChange
30.06.2017 30.06.2016 %
Rs.'000
Revenue 196,631 188,026 4.6
Cost of Sales - - -
Gross Profit 196,631 188,026 4.6
Other Operating Income 222,328 829 26,718.8
Administrative Expenses (222,484) (181,603) 22.5
Operating Profit 196,475 7,252 2,609.3
Finance Cost (46,245) (45,720) 1.1
Finance Income 136,282 148,562 (8.3)
Profit Before Tax 286,512 110,094 160.2
Income Tax Expenses (13,940) (7,527) 85.2
Profit for the period 272,572 102,567 165.8
Statement of Comprehensive IncomeCompany
Rs. '000 30.06.2017 30.06.2016
Profit for the period 272,572 102,567
Other Comprehensive Income
Net Gain/(Loss) on Available-for-Sale Financial Assets 85 (27)
Other Comprehensive Income for the Period, Net of Tax 85 (27)
Total Comprehensive Income for the Period, Net of Tax 272,657 102,540
The above figures are provisional and subject to audit.
6
Three Months Ended
Three Months Ended
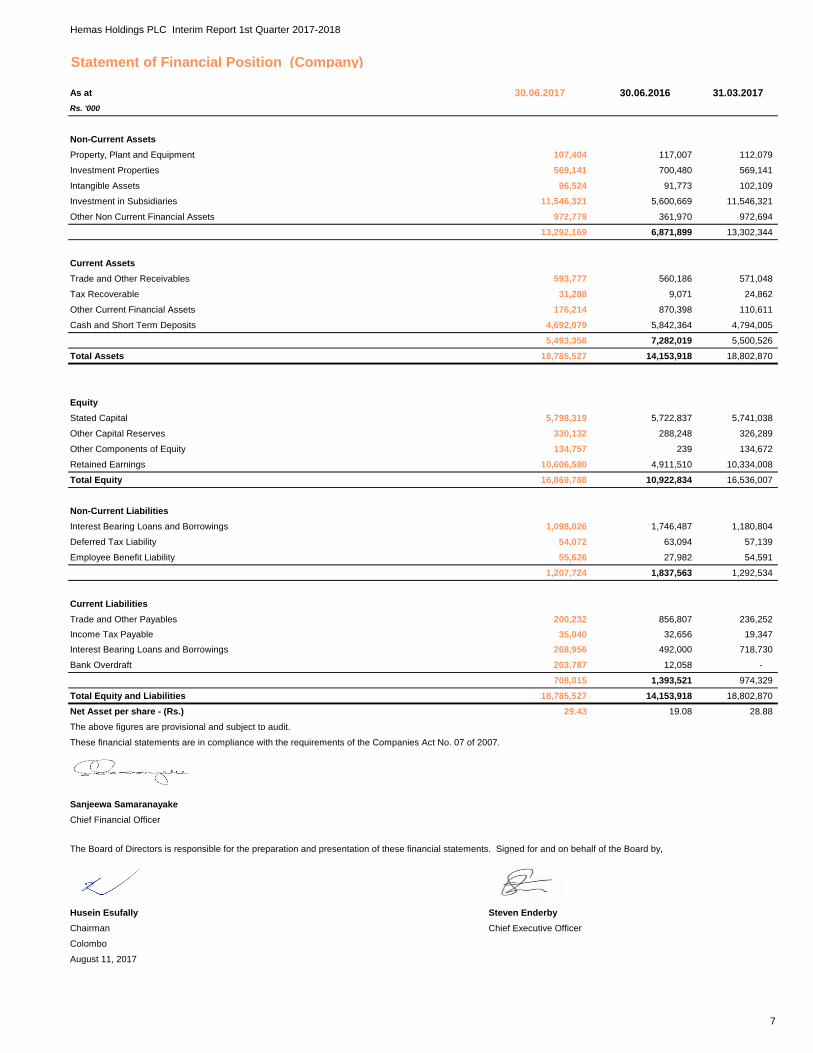
Hemas Holdings PLC Interim Report 1st Quarter 2017-2018
Statement of Financial Position (Company)
As at 30.06.2017 30.06.2016 31.03.2017
Rs. '000
Non-Current Assets
Property, Plant and Equipment 107,404 117,007 112,079
Investment Properties 569,141 700,480 569,141
Intangible Assets 96,524 91,773 102,109
Investment in Subsidiaries 11,546,321 5,600,669 11,546,321
Other Non Current Financial Assets 972,779 361,970 972,694
13,292,169 6,871,899 13,302,344
Current Assets
Trade and Other Receivables 593,777 560,186 571,048
Tax Recoverable 31,288 9,071 24,862
Other Current Financial Assets 176,214 870,398 110,611
Cash and Short Term Deposits 4,692,079 5,842,364 4,794,005
5,493,358 7,282,019 5,500,526
Total Assets 18,785,527 14,153,918 18,802,870
Equity
Stated Capital 5,798,319 5,722,837 5,741,038
Other Capital Reserves 330,132 288,248 326,289
Other Components of Equity 134,757 239 134,672
Retained Earnings 10,606,580 4,911,510 10,334,008
Total Equity 16,869,788 10,922,834 16,536,007
Non-Current Liabilities
Interest Bearing Loans and Borrowings 1,098,026 1,746,487 1,180,804
Deferred Tax Liability 54,072 63,094 57,139
Employee Benefit Liability 55,626 27,982 54,591
1,207,724 1,837,563 1,292,534
Current Liabilities
Trade and Other Payables 200,232 856,807 236,252
Income Tax Payable 35,040 32,656 19,347
Interest Bearing Loans and Borrowings 268,956 492,000 718,730
Bank Overdraft 203,787 12,058 -
708,015 1,393,521 974,329
Total Equity and Liabilities 18,785,527 14,153,918 18,802,870
Net Asset per share - (Rs.) 29.43 19.08 28.88
The above figures are provisional and subject to audit.
These financial statements are in compliance with the requirements of the Companies Act No. 07 of 2007.
Sanjeewa Samaranayake
Chief Financial Officer
Husein Esufally Steven Enderby
Chairman Chief Executive Officer
Colombo
August 11, 2017
7
The Board of Directors is responsible for the preparation and presentation of these financial statements. Signed for and on behalf of the Board by,

Hemas Holdings PLC Interim Report 1st Quarter 2017-2018
Statement of Changes in Equity (Company)
Other
Components Of
Equity
Available for Sale
Reserve
Rs. '000
Balance as at 1 April 2016 5,722,837 279,893 266 4,808,943 10,811,939
Profit for the period - - - 102,567 102,567
Other Comprehensive Income - 8,355 (27) - 8,328
Total Comprehensive Income - 8,355 (27) 102,567 110,895
Balance as at 30 June 2016 5,722,837 288,248 239 4,911,510 10,922,834
Balance as at 1 April 2017 5,741,038 326,289 134,672 10,334,008 16,536,007
Profit for the period - - - 272,572 272,572
Other Comprehensive Income - - 85 - 85
Total Comprehensive Income - - 85 272,572 272,657
Exercise of Share Option 57,281 - - - 57,281
Share Based Payments - 3,843 - - 3,843
Balance as at 30 June 2017 5,798,319 330,132 134,757 10,606,580 16,869,788
The above figures are provisional and subject to audit.
8
Stated Capital Other Capital
Reserves
Retained
EarningsTotal Equity

Hemas Holdings PLC Interim Report 1st Quarter 2017-2018
Statement of Cash Flows
For three months ended 30.06.2017 30.06.2016 30.06.2017 30.06.2016
Rs. '000
Operating Activities
Profit before taxation 966,645 1,009,866 286,512 110,094
Adjustments for,
Depreciation 250,537 214,526 8,047 11,281
Gain on Disposal of Property, Plant and Equipment, Investment Property (696) (304) 28 -
(Gain)/Loss on Sale of Non-Current Investments (5,093) 1,559 - -
Provision for Share based payment expense 12,520 8,355 4,601 1,922
Amortisation/ Impairment of Intangible Assets 21,091 14,204 5,585 5,818
Amortisation of Leasehold Rights 7,521 1,540 - -
Exchange (Gain)/Loss on Foreign Currency Borrowings 8,685 (17,204) - -
Finance Cost 119,202 103,791 46,245 45,720
Finance Income (220,185) (205,939) (136,282) (148,562)
Share of results of Joint Ventures & Associates 72,515 35,272 -
Investment Income - - (220,655) (4)
Movement in Employee Benefit Liability 47,544 20,003 1,035 1,250
Operating Cash Flows before Working Capital Adjustments 1,280,286 1,185,669 (4,884) 27,519
Working Capital Adjustments
(Increase)/Decrease in Inventories 3,660 (256,208) - -
(Increase)/Decrease in Trade and Other Receivables (200,903) (755,784) (15,254) (63,001)
Increase/(Decrease) in Trade and Other Payables (1,609,412) (149,421) 23,450 424,230
Increase/(Decrease) in Other Non Current Financial Liabilities 5,844 229 -
Cash Generated from Operations (520,525) 24,485 3,312 388,748
Finance Cost Paid (119,202) (103,791) (46,245) (45,720)
Finance Income Received 220,185 204,525 136,233 148,509
Income Tax Paid (186,179) (324,624) (66,764) (67,403)
Employee Retirement Benefit Paid (6,518) (6,328) - -
Net Cash Flows From/(Used in) Operating Activities (612,239) (205,733) 26,536 424,134
Investing Activities
Purchase of Property, Plant and Equipment (300,798) (163,796) (3,404) (965)
Investment in Intangible Assets (1,258) (5,043) - -
Disposal /Investment in Financial Assets (1,987) 3,347 445 759
Acquisition/Investment of subsidiaries - - - (1,050,571)
Dividend Received from Joint Ventures & Associates - 25,200 - -
Investment Income Received - - 220,655 4
3,907 376 4 -
Net Cash Flows From/(Used in) Investing Activities (300,136) (139,916) 217,700 (1,050,773)
Financing Activities
Interest Bearing Loans and Borrowings (Net) (173,382) 639,135 (598,553) 608,806
Proceed from exercise of Share Option 48,604 - 48,604 -
Proceeds (to)/from Non-Controlling Interests - (44,090) - -
Net Cash Flows From/(Used in) Financing Activities (124,778) 595,045 (549,949) 608,806
Net Increase/(Decrease) in Cash and Cash Equivalents (1,037,153) 249,396 (305,713) (17,833)
Net Foreign Exchange Difference 2,336 3,878 - -
Cash and Cash Equivalents at the beginning of the Year 10,618,937 10,887,133 4,794,005 5,848,139
Cash and Cash Equivalents at the end of the period 9,584,120 11,140,407 4,488,292 5,830,306
The above figures are provisional and subject to audit.
9
Group Company
Proceeds on Disposal of Property, Plant and Equipment/ Intangible Assets /
Leasehold Property/ Investment Property

Hemas Holdings PLC Interim Report 1st Quarter 2017-2018
Segmental Information
Leisure, Travel & Aviation
For three months ended 30 June 2017 2016 2017 2016 2017 2016 2017 2016 2017 2016 2017 2016
Rs. '000
Revenue
Segmental Revenue - Gross 4,205,394 4,267,555 5,199,659 4,338,727 682,079 775,739 622,516 344,390 1,051,588 488,648 11,761,236 10,215,059
Intra Segmental Revenue (48,286) (50,419) (64,996) (13,623) - - - - (29,983) (28,196) (143,265) (92,238)
Segmental Revenue 4,157,108 4,217,136 5,134,663 4,325,104 682,079 775,739 622,516 344,390 1,021,605 460,452 11,617,971 10,122,821
Inter Segmental Revenue (3,300) - - - - - - - (251,140) (237,099) (254,440) (237,099)
Total Revenue 4,153,808 4,217,136 5,134,663 4,325,104 682,079 775,739 622,516 344,390 770,465 223,353 11,363,531 9,885,722
Segmental Results 526,446 636,866 508,966 415,898 (127,577) 1,335 187,979 50,224 (157,636) (161,333) 938,177 942,990
Finance Cost (1) - (51,870) (56,131) (4,364) 12,320 (6,096) (5,904) (56,871) (54,076) (119,202) (103,791)
Finance Income 31,215 40,526 2,662 1,903 9,636 9,339 5,521 1,460 171,151 152,711 220,185 205,939
Share of Results of Joint Ventures & Associates - - - - (72,515) (66,334) - 31,062 - - (72,515) (35,272)
Profit/(Loss) before Tax 557,660 677,392 459,758 361,670 (194,820) (43,340) 187,404 76,842 (43,356) (62,698) 966,645 1,009,866
Income Tax (132,389) (164,625) (87,732) (120,510) (15,882) (15,447) (31,362) (2,113) (22,043) (6,465) (289,408) (309,160)
Profit / (Loss) for the period 425,271 512,767 372,026 241,160 (210,702) (58,787) 156,042 74,729 (65,399) (69,163) 677,237 700,706
Attributable to:
Equity Holders of the Parent 422,829 509,931 352,447 240,703 (134,660) (48,838) 121,860 64,579 (68,241) (69,966) 694,233 696,409
Non-Controlling Interests 2,442 2,836 19,579 457 (76,042) (9,949) 34,182 10,150 2,842 803 (16,996) 4,297
425,271 512,767 372,026 241,160 (210,702) (58,787) 156,042 74,729 (65,399) (69,163) 677,237 700,706
The above figures are provisional and subject to audit.
10
Consumer Healthcare Logistic & Maritime Others Group

Hemas Holdings PLC Interim Report 1st Quarter 2017-2018
Notes to the Financial Statements
1 Basis of preparation
2
3
4 The current status of the funds raised through the Rights Issue (RI) has been provided in the following table.
Objective as per Circular
Amount
allocated as
per circular in
LKR
Proposed date
of utilisation as
per circular
Amount
allocated from
proceeds in
LKR (A)
% of total
proceeds
Amounts
utilised in LKR
(B)
% of utiliation
against
allocation ( B /
A)
Clarification if not utilised
including where the funds are
invested
Proceeds to be utilized to
fund strategic investment
opportunities in the
Healthcare and FMCG
Sectors.
4.1 Bn 2015/16 4.1 Bn 100% - -
At the Extraordinary General
meeting held on 30 June 2017,
shareholders approved the
extension of utilisation period up to
31 March 2019 and to invest the
funds, pending such utilisation, in
investment grade short term
instruments. Further it is committed
to utilise approximately Rs. 1.45 Bn
in healthcare sector during ensuing
period.
5
6
11
The Board of Directors decided, with the approval in principal of the Colombo Stock Exchange, and authorized by the shareholders at an Extraordinary General Meeting
dated 10th April 2015, to create a Employee Share Option Scheme (ESOS) to offer 13,900,000 ordinary shares being 2.4% of the total number of shares in issue to
Executive Directors and Senior Executives of the company and its subsidiaries whom the Board deems to be eligible to be awarded the shares.
Accordingly, 3,053,750 employee share options were granted to the Executive Directors and Senior Executives of the company and its subsidiaries at the exercise price
of Rs.82/- with a vesting period of one year starting from 27th July 2015 and exercise period of 3 years starting from 27th August 2016, out of which 2,574,423 employee
share options were vested during the year ended 31 March 2017.
Further, 3,008,750 employee share options were granted with the exercise price of Rs.87.50 with a one year vesting period starting from 27 July 2016 and exercise
period of 3 years starting from 27 August 2017.
Events After the Reporting Period
The Board of Directors of the Company has declared a final dividend of Rs. 1.45 per share for the financial year ended 31 March 2017 as required by section 56(2) of the
companies Act No 07 of 2007 , the Board of Directors has confirmed that the Company satisfies the solvency test in accordance with section 57 of the companies Act
No. 07 of 2007, and has obtained a certificate from the Auditors, prior to declaring the final dividend which was paid on 11 July 2017.
There have been no other events subsequent to the reporting date, which require disclosure in the interim financial statements.
There have been no significant changes in the nature of the contingent liabilities which were disclosed in the Audited Financial Statements for the year ended 31 March
2017.
In accordance with the Sri Lanka Accounting Standard (LKAS 10) - Events after the reporting date, the final dividend has not been recognized as a liability in the
financial statements as at 30 June 2017.
The condensed interim financial statements have been prepared in accordance with Sri Lanka Accounting Standard LKAS- 34, Interim Financial Reporting. The
condensed interim financial statements should be read in conjunction with the annual financial statements for the year ended 31 March 2017. Further, provisions of the
Companies Act No. 7 of 2007 have been considered in preparing the interim financial statements.
The ten million, rated (AA-lka, by Fitch Rating Lanka Limited) unsecured redeemable debentures carrying a coupon rate of 11% p.a., payable semi-annually issued on
29th April 2014 are to be matured on 29th April 2019.
The previous years'/periods' figures and phrases have been amended where relevant, for better presentation and to be comparable with those of the current period.

Hemas Holdings PLC Interim Report 1st Quarter 2017-2018
Investor Information2017 2016
Market Value of Shares
Closing Price on 30 June (Rs.) 153.10 86.00
Highest Price during the Period (Rs.) 154.90 95.00
Lowest Price during the Period (Rs.) 108.00 81.00
Market Capitalization on 30 June (Rs. Mn) 87,763 49,239
Ratios
Net Asset Per Share on 30 June (Rs.) 44.77 39.68
Price Earnings Ratio on 30 June (times) 126.32 70.49
Debt security related ratios
Debt/Equity Ratio 18.1% 23.7%
Quick Asset Ratio 1.50 1.48
Interest Cover (times) 9.11 10.73
Interest yield as at date of last trade - -
Yield to maturity of trade done - -
Interest rate of comparable Government security (5 Year Treasury Bond rate ) 11.42% 11.97%
Share Trading
No of transactions during the Period 1,228 905
No of shares traded during the Period 17,587,503 8,324,730
Value of shares traded during the Period (Rs. Mn) 2,472 733
Number of Shares 573,240,152 572,545,133
Debentures 11% fixed - Unsecured redeemable
Closing Price on 30 June (Rs.) - -
Highest Price during the Period (Rs.) - -
Lowest Price during the period (Rs.) - -
There has been no trading in the listed Debentures of the Company during the three months period ended 30 June 2017.
Number of Debentures 10,000,000 10,000,000
12
Three Months Ended

Hemas Holdings PLC Interim Report 1st Quarter 2017-2018
Share Information 30.06.2017 30.06.2016
LIST OF 20 MAJOR SHAREHOLDERS No. of Shares % No. of Shares %
1 A Z Holdings (Pvt) Ltd. 90,762,875 15.83 90,762,875 15.85
2 Saraz Investments (Pvt) Ltd. 86,396,035 15.07 86,396,035 15.09
3 Blueberry Investments (Pvt) Ltd. 85,781,250 14.96 85,781,250 14.98
4 Amagroup (Pvt) Ltd. 85,780,665 14.96 85,780,665 14.98
5 HSBC Intl Nominees Ltd-JPMLU-Franklin Templeton Investment Funds 44,673,822 7.79 55,368,238 9.67
6 HSBC International Nominees Ltd. -JPMCB- Templeton Global Investment Trust-
Templeton Emerging Markets S14,964,257 2.61 14,964,257 2.61
7 Citi Bank New York S/A Norges Bank Account 2 13,529,286 2.36 - -
8HSBC Intl Nom Ltd-SSBT-First State Investments ICVC-Stewart Investors Indian
Subcontinent Fund. 11,962,613 2.09 11,962,613 2.09
9 HSBC Intl Nom Ltd-SSBT-First State Investments ICVC-Stewart Investors Asia
Pacific Sustainability Fund. 9,745,440 1.70 - -
10 HSBC Intl Nom Ltd-JPMCB- Pacific Assets Trust PLC 6,793,862 1.19 4,344,132 0.76
11 6,000,000 1.05 10,000,000 1.75
12 Mr. M.A.H. Esufally 5,946,500 1.04 5,946,500 1.04
13 HSBC Intl. Nominees Ltd. -JPMCB- Scottish ORL SML TR GTI 6018 5,884,769 1.03 8,006,561 1.40
14 Mr. H.N. Esufally 5,586,705 0.97 5,586,705 0.98
15HSBC Intl Nom Ltd-SSBT-First State Investments ICVC-Stewart Investors Global
Emerging Markets SUSTAI.
5,036,288 0.88
- -
16 Mr. I.A.H. Esufally 4,424,000 0.77 4,424,000 0.77
17HSBC Intl. Nom. LTD-State Street Luxembourg c/o SSBT- Alliancebernstein Next 50
Emerging Markets(MASTE)3,949,115 0.69 - -
18 Mellon Bank N.A.-Florida Retirment System 3,341,646 0.58 - -
19 HSBC Intl Nom Ltd-BBH Grandeur Peak Emerging Markets Opportunities Fund 3,255,526 0.57 3,804,326 0.66
20 HSBC International Nominees Ltd-SSBT-Aberdeen Institutional Commingled Funds,
LLC
2,909,000 0.51 - -
30.06.2017 30.06.2017
DIRECTORS' SHAREHOLDING No. of Shares No. of Shares
DIRECTORS' INDIRECT SHAREHOLDING
A Z Holdings (Pvt) Ltd. 90,762,875 90,762,875
Saraz Investments (Pvt) Ltd. 86,396,035 86,396,035
Blueberry Investments (Pvt) Ltd. 85,781,250 85,781,250
Amagroup (Pvt) Ltd. 85,780,665 85,780,665
DIRECTORS' DIRECT SHAREHOLDING
Mr. H.N. Esufally (Chairman) 5,586,705 5,586,705
Mr. A.N. Esufally 2,283,585 2,283,585
Mr. I.A.H. Esufally 4,424,000 4,424,000
Mr. M. A. H. Esufally 5,946,500 5,946,500
Mr. R. Gopalakrishnan - -
Dr S.A.B Ekanayake - -
Mr. D.S. Weerakkody - -
Mr. S.M Enderby (Chief Executive Officer) - -
Mr. W.M.De F. Arsakularatne - -
Mr. A.S. Amaratunga - -
366,961,615 366,961,615
30.06.2017 30.06.2016
PUBLIC HOLDING No. of Shares No. of Shares
Issued Share Capital 573,240,152 572,545,133
Less: Directors' Direct and Indirect Shareholding 366,961,615 366,961,615
Close Family Members 2,750,000 2,750,000
Public Holding 203,528,537 202,833,518
Public Holding as a % of Issued Share Capital 35.50% 35.43%
Total Number of Shareholders 4,187 4,478
Number of persons holdings Shares Excluded when computing Public Holding % 12 12
Number of Shareholders representing the Public Holding 4,175 4,466
13
Pemberton Asian Opportunities Fund

Corporate Information
Legal Form
Quoted Public Company with limited liability listed on the
Colombo Stock Exchange on 15 October 2003.
Date of Incorporation
10 December 1948
Date of Re-Registration
30 May 2007
New Registration Number
PQ 6
Accounting year end
31 March
Registered Office
Hemas House
No. 75, Braybrooke Place, Colombo 2.
Website
www.hemas.com
Auditors
Ernst & Young
Chartered Accountants
No. 201, De Saram Place, Colombo 10.
Directors
Husein Esufally (Chairman)
Steven Enderby (CEO)
Imtiaz Esufally
Murtaza Esufally
Abbas Esufally
Ramabadran Gopalakrishnan
Dr Anura Ekanayake
Dinesh Weerakkody
Malinga Arsakularatne
Amitha Saktha Amaratunga
Jyotindra Manibhai Trivedi (appointed w.e.f 11 August 2017)
Secretaries
Hemas Corporate Services (Pvt) Ltd.
No.75, Braybrooke Place, Colombo 02.
Telephone: 4 731731 (hunting)
Facsimile: 4 731777
Registrars
SSP Corporate Services (Pvt) Ltd.
101, Inner Flower Road, Colombo 03.
Lawyers to the Company
D.L. & F De Saram, Attorneys-at-law
No. 47, Alexandra Place, Colombo 7.
Bankers
Commercial Bank of Ceylon PLC
Deutsche Bank AG
Hong Kong & Shanghai Banking Corp. Ltd.
Hatton National Bank PLC
Standard Chartered Bank
Nations Trust Bank PLC
People's Bank
National Development Bank PLC
Sampath Bank PLC
14